predictive modeling and renewal analytics - … 23-24, 2017 doing it right symposium predictive...
TRANSCRIPT
March 23-24, 2017
Doing It Right
SYMPOSIUM
Predictive Modeling and Renewal Analytics:
Using Predictive Models to Help Determine Customer Rates
Fred ThompsonBlue Cross Blue Shield of Michigan
4th Big Data & Business Analytics Symposium – March 23-24, 2017
2
Background
HISTORY OF FINANCIAL DATA ANALYTICS (FDA)• Every new year brings on new data sources, new business partners, new tools, new structures, new rules,
and more challenges!
- In 2007, FDA began as a small team called Actuarial Analytics (AA) that supported group pricing (data, reports, and analytics)
- Between 2007 and 2011, AA grew to service all of pricing data needs. - In 2014, AA became heavily involved with marketplace pricing for ACA.- In 2016, AA separated from Actuarial and now supports the entire Finance division and renamed FDA
MAJOR RESPONSIBILITIES
• Implements major data initiatives to help resolve difficult business problems from a data / analytics point of view
• Builds single source of truth for all pricing analytics data work and streamline processes• Represents finance in data governance, reporting, and analytical forums• Develops predictive models to help in the renewal adequacy process and other pricing initiatives• Supports the various mandates from health care reform and is heavily involved with marketplace pricing
(lifestyle analytics, estimating risks, and costs)
2
3
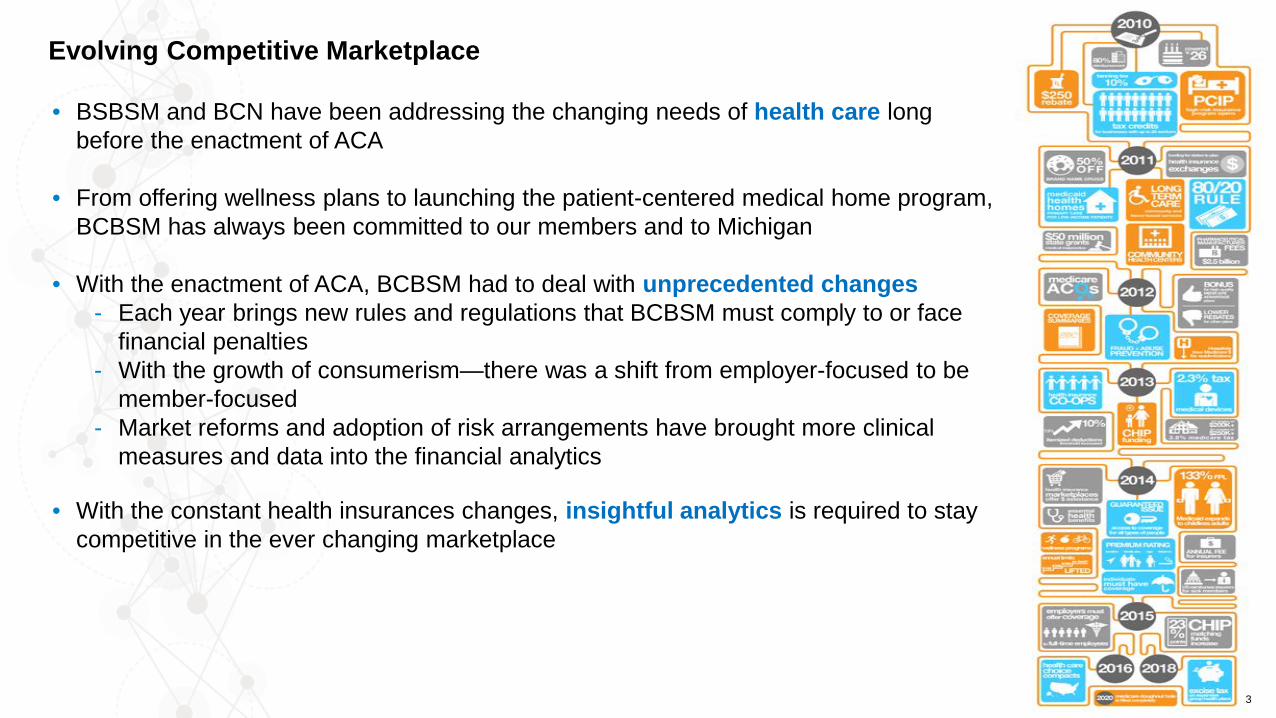
Evolving Competitive Marketplace
• BSBSM and BCN have been addressing the changing needs of health care long before the enactment of ACA
• From offering wellness plans to launching the patient-centered medical home program, BCBSM has always been committed to our members and to Michigan
• With the enactment of ACA, BCBSM had to deal with unprecedented changes- Each year brings new rules and regulations that BCBSM must comply to or face
financial penalties- With the growth of consumerism—there was a shift from employer-focused to be
member-focused- Market reforms and adoption of risk arrangements have brought more clinical
measures and data into the financial analytics
• With the constant health insurances changes, insightful analytics is required to stay competitive in the ever changing marketplace
3
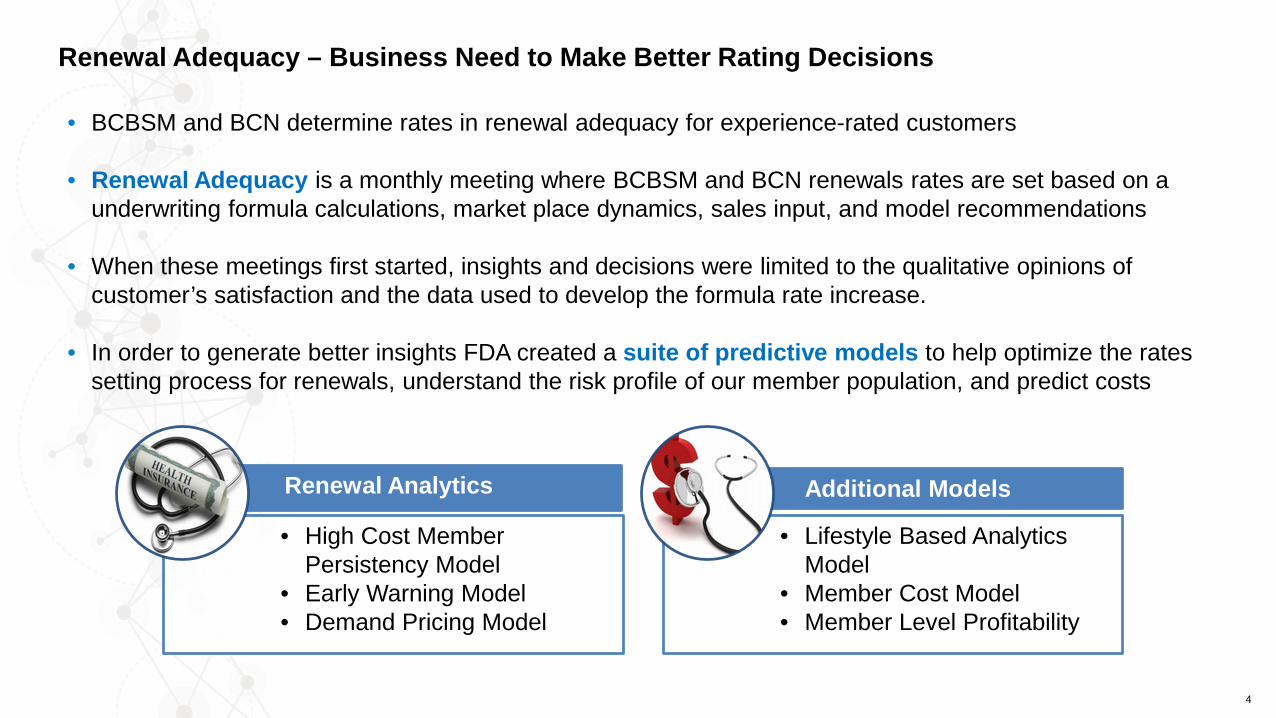
• BCBSM and BCN determine rates in renewal adequacy for experience-rated customers
• Renewal Adequacy is a monthly meeting where BCBSM and BCN renewals rates are set based on a underwriting formula calculations, market place dynamics, sales input, and model recommendations
• When these meetings first started, insights and decisions were limited to the qualitative opinions of customer’s satisfaction and the data used to develop the formula rate increase.
• In order to generate better insights FDA created a suite of predictive models to help optimize the rates setting process for renewals, understand the risk profile of our member population, and predict costs
Renewal Adequacy – Business Need to Make Better Rating Decisions
4
• High Cost Member Persistency Model
• Early Warning Model• Demand Pricing Model
Renewal Analytics
• Lifestyle Based Analytics Model
• Member Cost Model• Member Level Profitability
Additional Models
High Cost Member Persistency Model
5
6
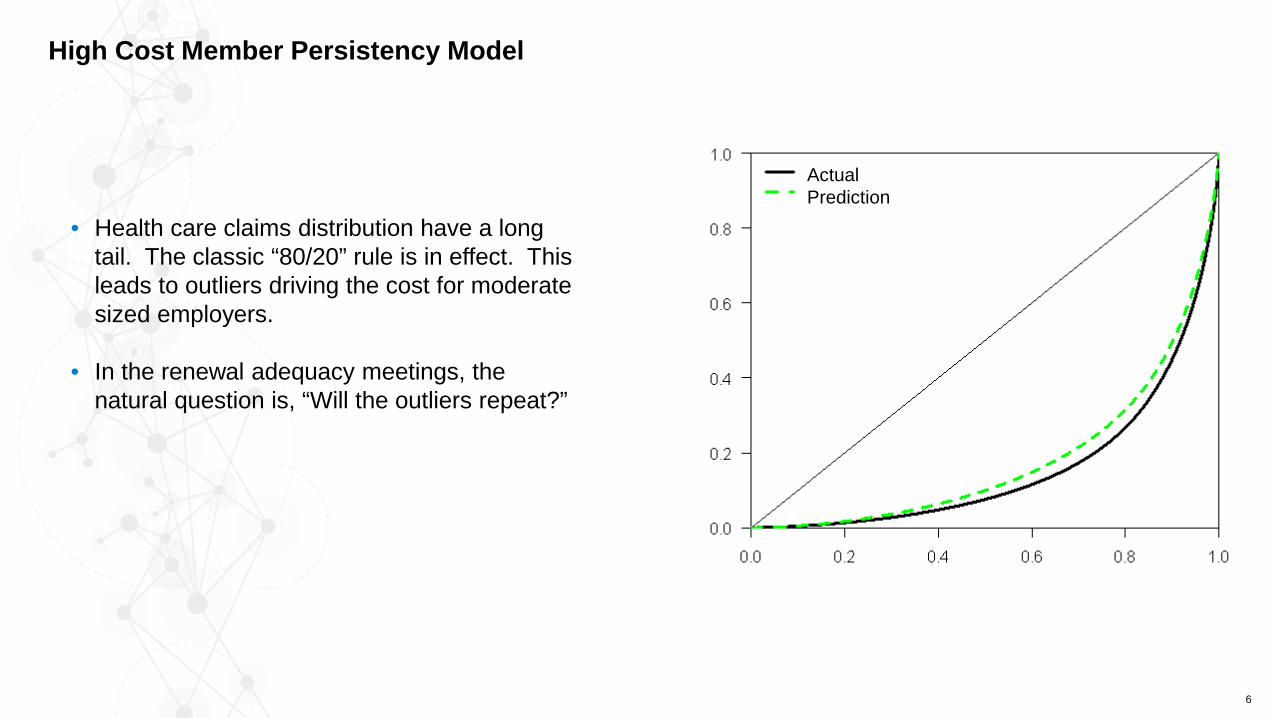
• Health care claims distribution have a long tail. The classic “80/20” rule is in effect. This leads to outliers driving the cost for moderate sized employers.
• In the renewal adequacy meetings, the natural question is, “Will the outliers repeat?”
High Cost Member Persistency Model
ActualPrediction
7
High Cost Member Persistency Model
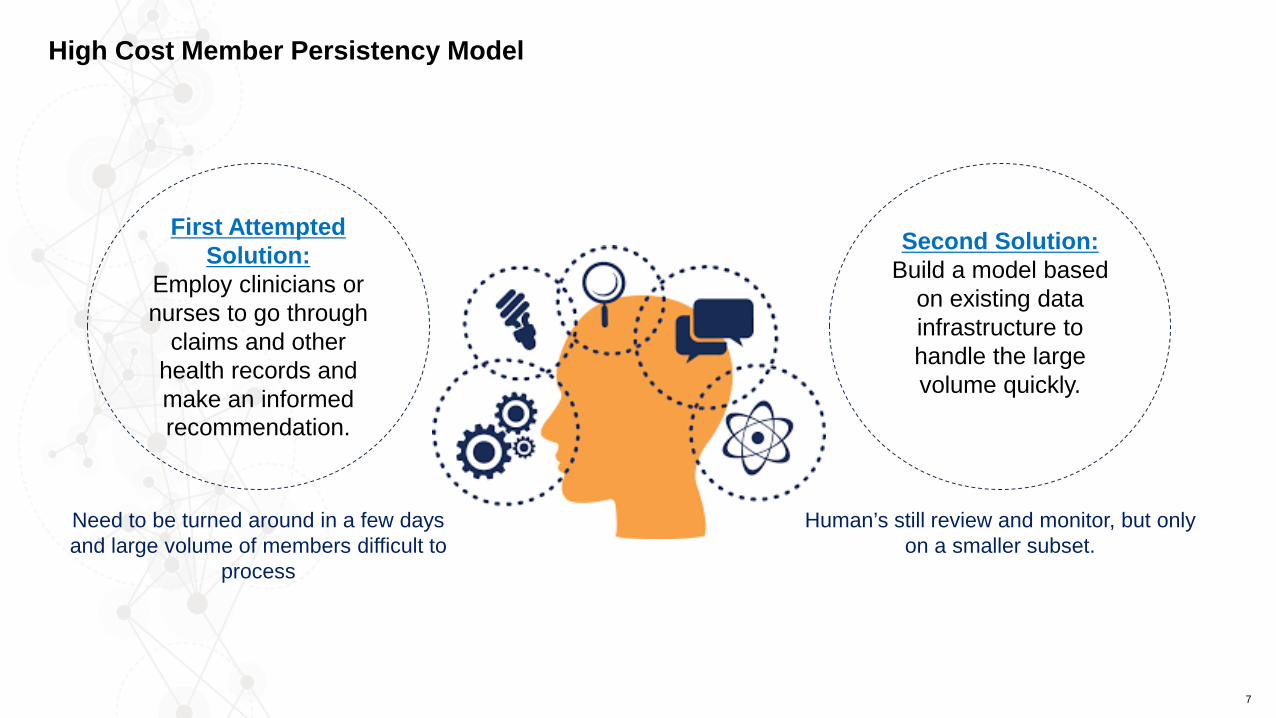
First Attempted Solution:
Employ clinicians or nurses to go through
claims and other health records and make an informed recommendation.
Need to be turned around in a few days and large volume of members difficult to
process
Second Solution: Build a model based
on existing data infrastructure to handle the large volume quickly.
Human’s still review and monitor, but only on a smaller subset.
8
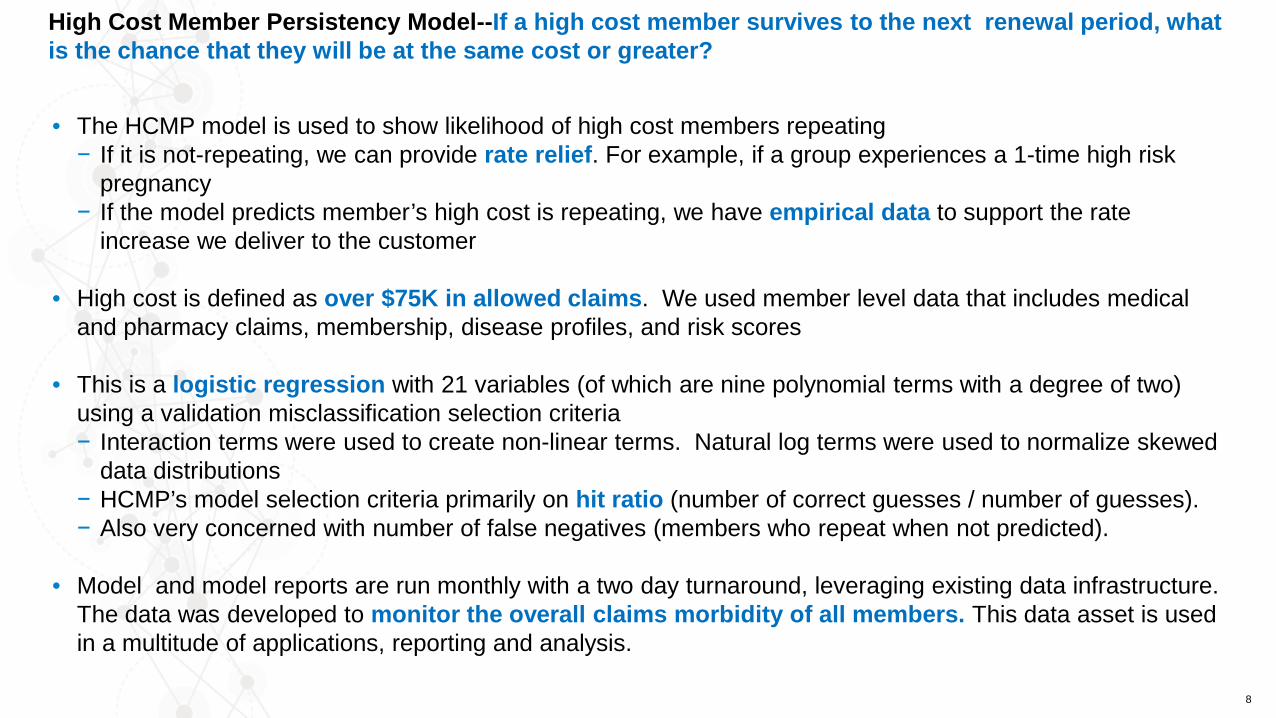
• The HCMP model is used to show likelihood of high cost members repeating− If it is not-repeating, we can provide rate relief. For example, if a group experiences a 1-time high risk
pregnancy− If the model predicts member’s high cost is repeating, we have empirical data to support the rate
increase we deliver to the customer
• High cost is defined as over $75K in allowed claims. We used member level data that includes medical and pharmacy claims, membership, disease profiles, and risk scores
• This is a logistic regression with 21 variables (of which are nine polynomial terms with a degree of two) using a validation misclassification selection criteria− Interaction terms were used to create non-linear terms. Natural log terms were used to normalize skewed
data distributions− HCMP’s model selection criteria primarily on hit ratio (number of correct guesses / number of guesses).− Also very concerned with number of false negatives (members who repeat when not predicted).
• Model and model reports are run monthly with a two day turnaround, leveraging existing data infrastructure. The data was developed to monitor the overall claims morbidity of all members. This data asset is used in a multitude of applications, reporting and analysis.
High Cost Member Persistency Model--If a high cost member survives to the next renewal period, what is the chance that they will be at the same cost or greater?
9
What has the model taught us?
• Young people repeat more often.• Co-morbidity counts: combinations of diseases drive cost.• Members repeat as high cost, not diseases or claims.• Timing. Much of the repeat probability is related to when the current acute event started.
High Cost Member Persistency Model
Early Warning Model
10
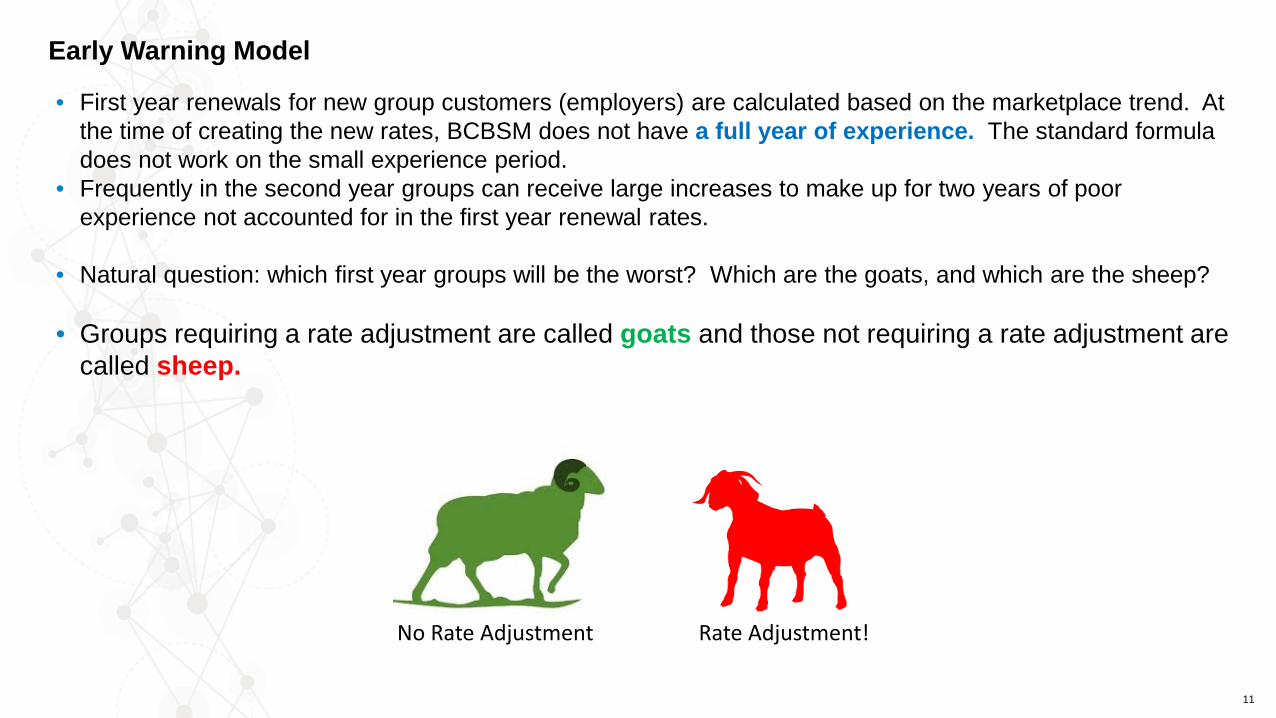
• First year renewals for new group customers (employers) are calculated based on the marketplace trend. At the time of creating the new rates, BCBSM does not have a full year of experience. The standard formula does not work on the small experience period.
• Frequently in the second year groups can receive large increases to make up for two years of poor experience not accounted for in the first year renewal rates.
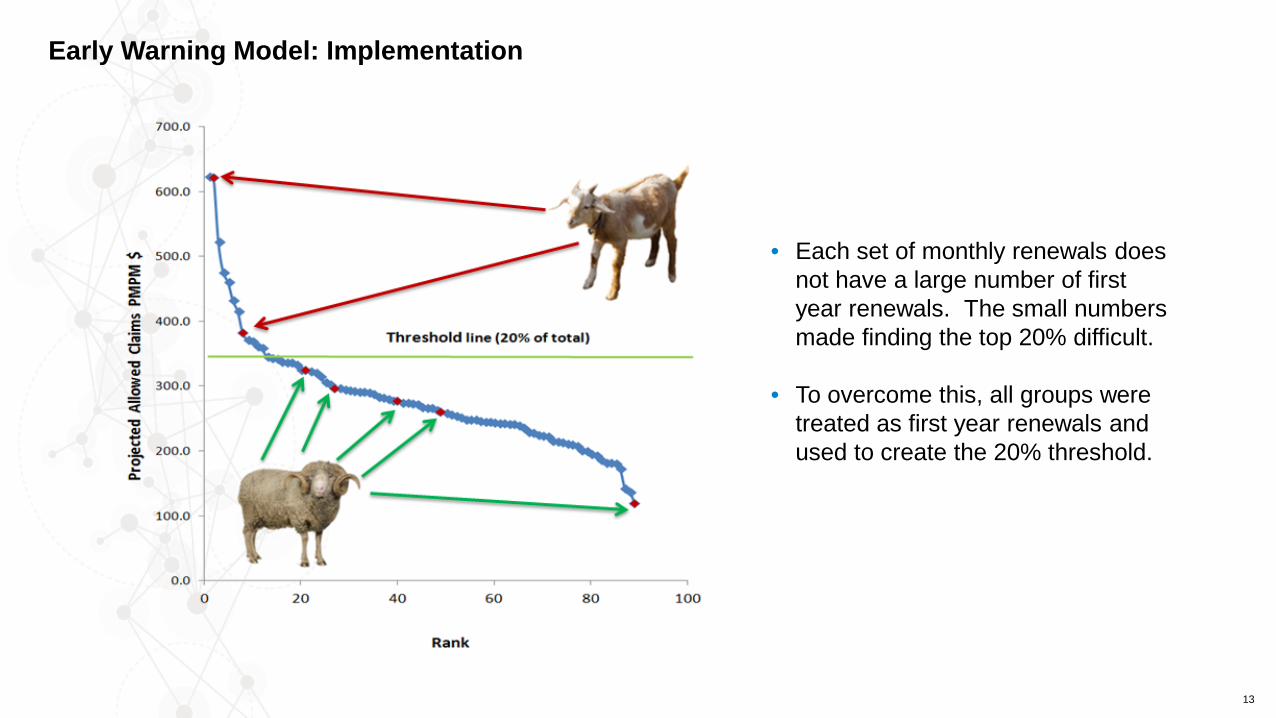
• Natural question: which first year groups will be the worst? Which are the goats, and which are the sheep?
• Groups requiring a rate adjustment are called goats and those not requiring a rate adjustment are called sheep.
11
Early Warning Model
No Rate Adjustment Rate Adjustment!
12
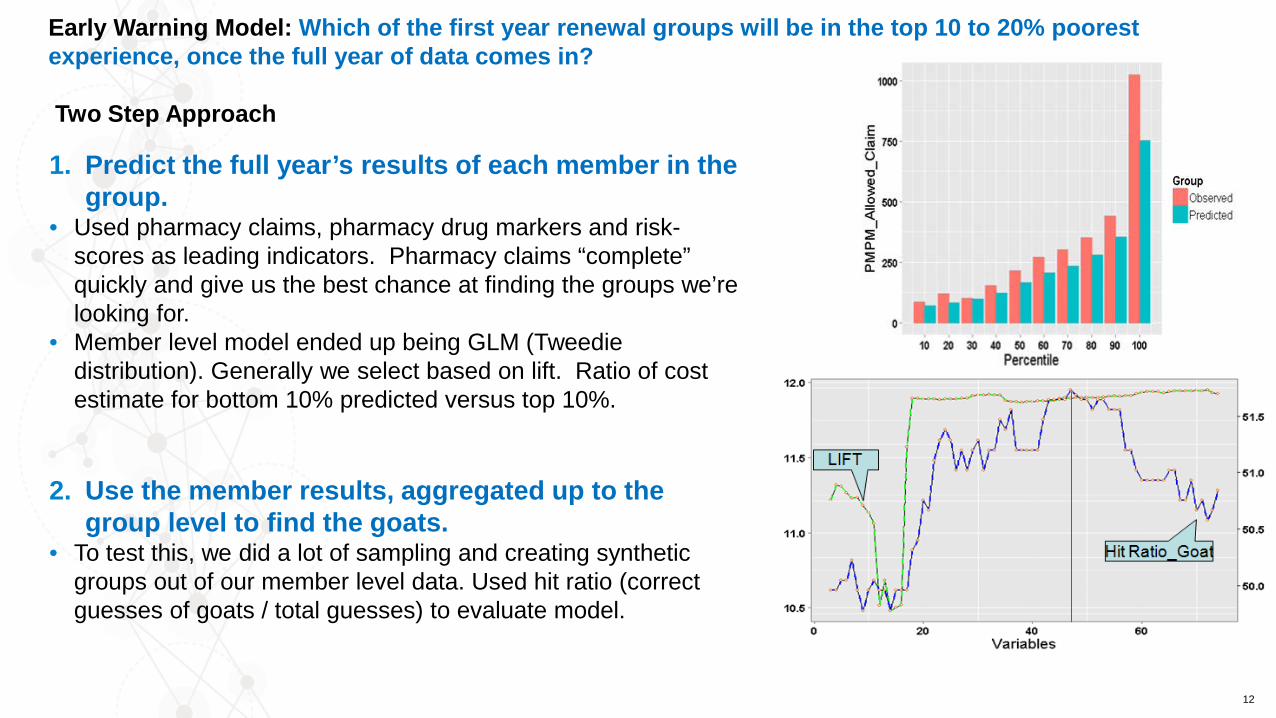
Early Warning Model: Which of the first year renewal groups will be in the top 10 to 20% poorest experience, once the full year of data comes in?
Two Step Approach
1. Predict the full year’s results of each member in the group.
• Used pharmacy claims, pharmacy drug markers and risk-scores as leading indicators. Pharmacy claims “complete” quickly and give us the best chance at finding the groups we’re looking for.
• Member level model ended up being GLM (Tweediedistribution). Generally we select based on lift. Ratio of cost estimate for bottom 10% predicted versus top 10%.
2. Use the member results, aggregated up to the group level to find the goats.
• To test this, we did a lot of sampling and creating synthetic groups out of our member level data. Used hit ratio (correct guesses of goats / total guesses) to evaluate model.
13
Early Warning Model: Implementation
• Each set of monthly renewals does not have a large number of first year renewals. The small numbers made finding the top 20% difficult.
• To overcome this, all groups were treated as first year renewals and used to create the 20% threshold.
Demand Pricing Model
14
15
• Created in 2011, the Demand Pricing Model was created from a combined effort from consultants, sales, actuarial, and underwriting to develop new analytical tools to enhance the renewal adequacy process
• The model was the results of a comprehensive analysis of historical data, which quantified the link between pricing, retention, and profitability. More specifically, it was developed to maximize performance for either margin or enrollment by predicting the optimized rate at renewal based on the dynamics of the pool
• This rate was provided to underwriters during the renewal adequacy meeting to help steer direction for specific accounts during the rate setting process
• There are three main components of the demand pricing model: 1. Likelihood of Lapse Model: predicts probability of customer leaving based on several factors such as
sales assessment, rate increase, tenure, size, etc2. Profitability Model: predicts future margin that is independent of underwriting gain loss to provide the
most transparent view of an account’s future economics3. Optimization Model: this model takes into account the tradeoff between expected margin and expected
enrollment at any given price increase in order to best optimize portfolio-level pricing
Demand Pricing Model
16
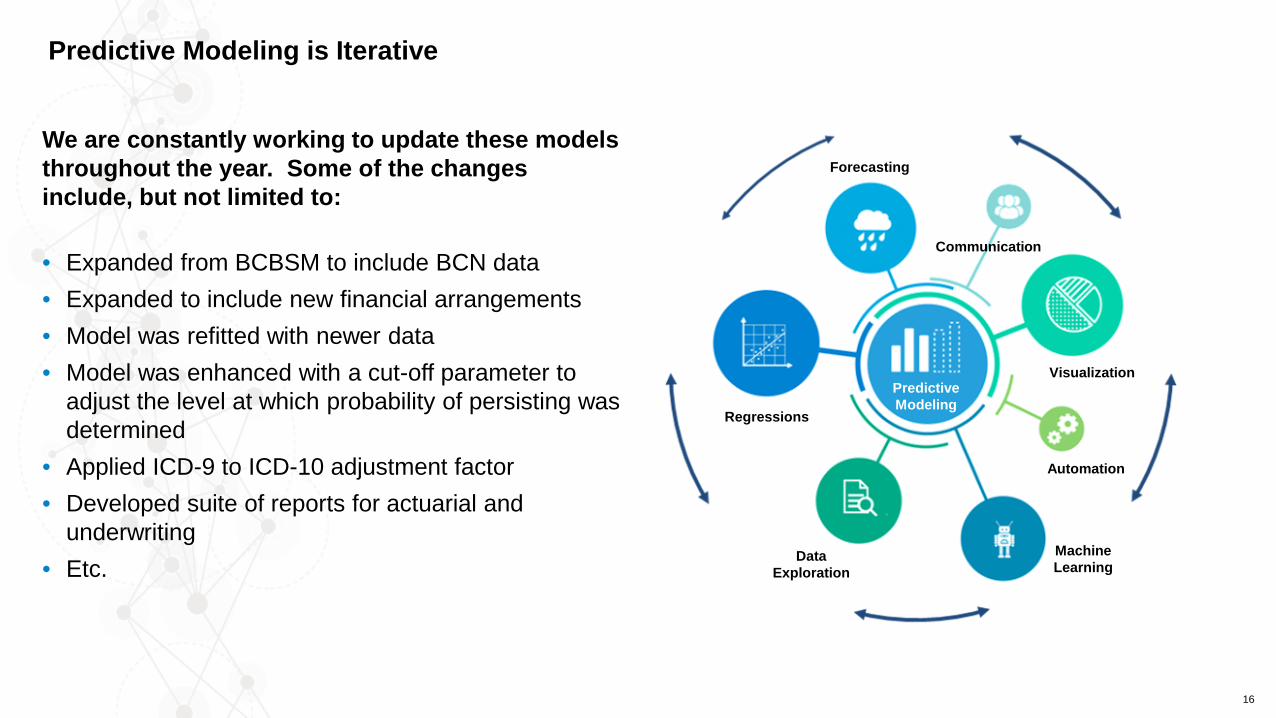
We are constantly working to update these models throughout the year. Some of the changes include, but not limited to:
• Expanded from BCBSM to include BCN data• Expanded to include new financial arrangements • Model was refitted with newer data• Model was enhanced with a cut-off parameter to
adjust the level at which probability of persisting was determined
• Applied ICD-9 to ICD-10 adjustment factor • Developed suite of reports for actuarial and
underwriting• Etc.
Predictive Modeling is Iterative
Visualization
Machine Learning
Data Exploration
Regressions
Forecasting
Communication
Automation
Predictive Modeling