predictive weather files for building energy modelling
TRANSCRIPT

Predictive weather files for building energy modelling User Guide
Zhengen Ren, Zhi Tang, Melissa James
22 June 2021
Australia’s National Science Agency

Predictive weather files for building energy modelling | i
Citation
Ren Z, Tang Z and James M (2021) Predictive weather files for building energy modelling User
Guide. CSIRO, Australia.
Copyright
© Commonwealth Scientific and Industrial Research Organisation 2021. To the extent permitted
by law, all rights are reserved and no part of this publication covered by copyright may be
reproduced or copied in any form or by any means except with the written permission of CSIRO.
Important disclaimer
CSIRO advises that the information contained in this publication comprises general statements
based on scientific research. The reader is advised and needs to be aware that such information
may be incomplete or unable to be used in any specific situation. No reliance or actions must
therefore be made on that information without seeking prior expert professional, scientific and
technical advice. To the extent permitted by law, CSIRO (including its employees and consultants)
excludes all liability to any person for any consequences, including but not limited to all losses,
damages, costs, expenses and any other compensation, arising directly or indirectly from using this
publication (in part or in whole) and any information or material contained in it.
CSIRO is committed to providing web accessible content wherever possible. If you are having
difficulties with accessing this document please contact [email protected].

Predictive weather files for building energy modelling | i
Contents
Acknowledgments ...........................................................................................................................iii
1 Introduction ........................................................................................................................ 1
2 The datasets ........................................................................................................................ 2
2.1 Zip file structure .................................................................................................... 3
2.2 File naming ............................................................................................................ 3
2.3 Locations ................................................................................................................ 3
2.4 EnergyPlus weather file (.epw) format.................................................................. 6
2.5 NatHERS weather file format ................................................................................ 6
3 CSIRO methodology for constructing future weather data ............................................. 12
4 CSIRO methodology for converting weather files in NatHERS format to .epw format .... 15
5 QA and feedback process ................................................................................................. 17
5.1 QA process ........................................................................................................... 17
5.2 Feedback process ................................................................................................ 17
6 Data version control ......................................................................................................... 19
References ………………………………………………………………………………………………………………………..20
ii | CSIRO Australia’s National Science Agency
Figures
Figure 1 Overview of creation of weather files .............................................................................. 1
Figure 2 RCP GHG emission scenarios… .......................................................................................... 2
Figure 3 Sample of .epw format data ............................................................................................. 9
Figure 4 NatHERS weather file structure ...................................................................................... 10
Figure 5 Sample of NatHERS weather file data ............................................................................. 11
Tables
Table 1 Locations ............................................................................................................................ 3
Table 2 EnergyPlus (.epw) weather file format .............................................................................. 7
Table 3 Characteristics of the selected eight Global Climate Models .......................................... 12
Table 4 Origin of weather variables in .epw files .......................................................................... 16
Table 5 Data version control - Predictive weather files in .epw format ....................................... 19
Table 6 Data version control - Predictive weather files in NatHERS format ................................ 19

Predictive weather files for building energy modelling | iii
Acknowledgments
This research is funded by the Australian Government’s Department of Industry, Science, Energy
and Resources.

Predictive weather files for building energy modelling | 1
1 Introduction
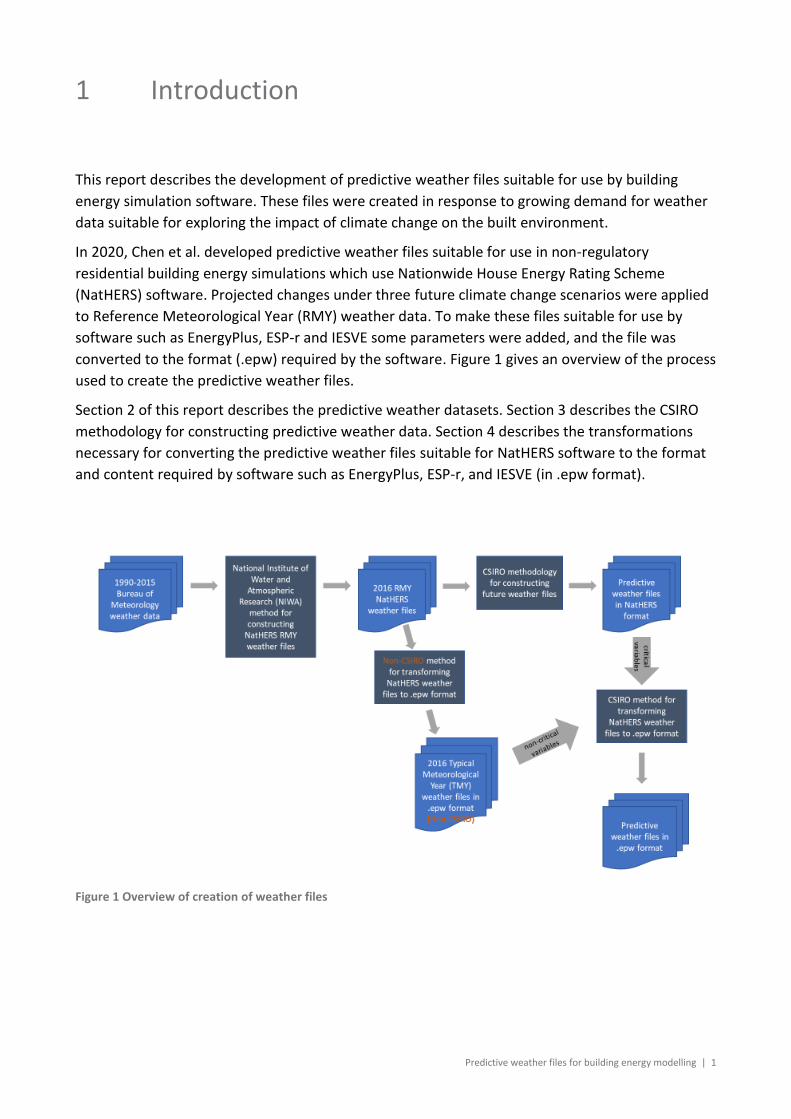
This report describes the development of predictive weather files suitable for use by building
energy simulation software. These files were created in response to growing demand for weather
data suitable for exploring the impact of climate change on the built environment.
In 2020, Chen et al. developed predictive weather files suitable for use in non-regulatory
residential building energy simulations which use Nationwide House Energy Rating Scheme
(NatHERS) software. Projected changes under three future climate change scenarios were applied
to Reference Meteorological Year (RMY) weather data. To make these files suitable for use by
software such as EnergyPlus, ESP-r and IESVE some parameters were added, and the file was
converted to the format (.epw) required by the software. Figure 1 gives an overview of the process
used to create the predictive weather files.
Section 2 of this report describes the predictive weather datasets. Section 3 describes the CSIRO
methodology for constructing predictive weather data. Section 4 describes the transformations
necessary for converting the predictive weather files suitable for NatHERS software to the format
and content required by software such as EnergyPlus, ESP-r, and IESVE (in .epw format).
Figure 1 Overview of creation of weather files
2 | CSIRO Australia’s National Science Agency
2 The datasets
There are 2 predictive weather datasets: ‘Predictive weather files in .epw format’ and ‘Predictive
weather files in NatHERS format’. Each dataset consists of 996 text files in a single zip file. Each
text file contains one year of weather data in hourly intervals.
Each text file contains hourly weather data for one of 83 Australian locations, under one of 3
future climate scenarios (RCP2.6, RCP4.5, or RCP8.5), for one of 4 future years (2030, 2050, 2070,
or 2090).
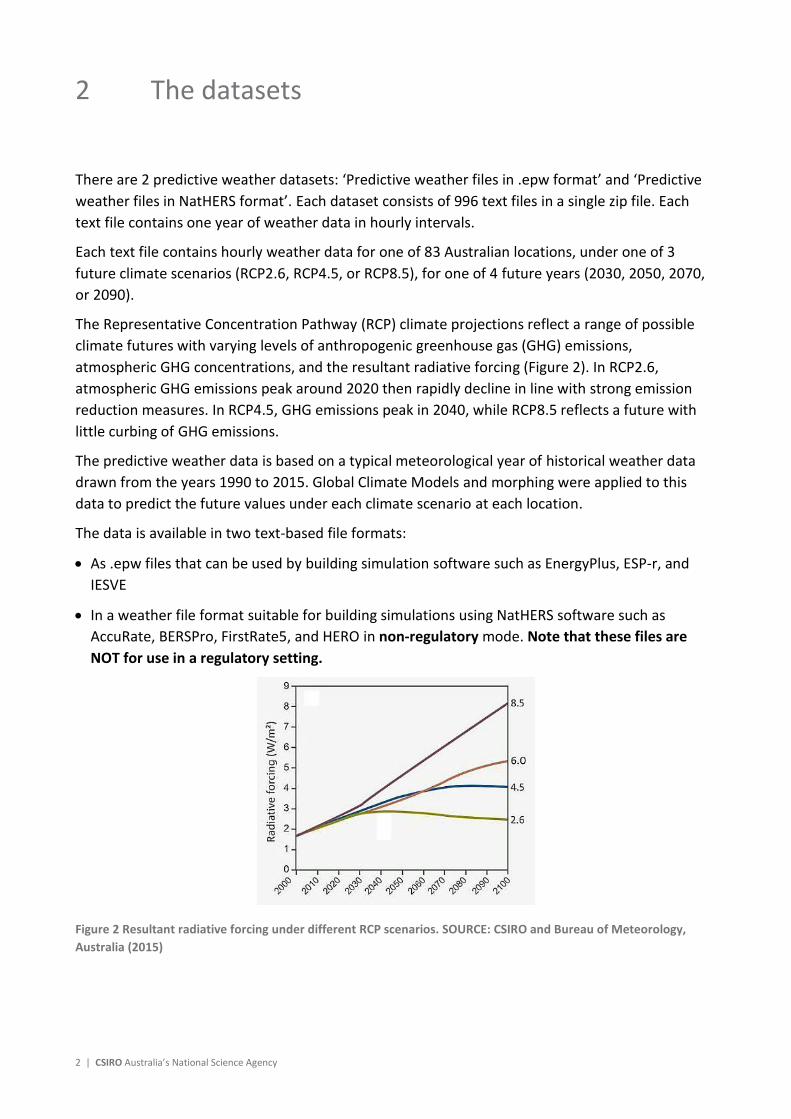
The Representative Concentration Pathway (RCP) climate projections reflect a range of possible
climate futures with varying levels of anthropogenic greenhouse gas (GHG) emissions,
atmospheric GHG concentrations, and the resultant radiative forcing (Figure 2). In RCP2.6,
atmospheric GHG emissions peak around 2020 then rapidly decline in line with strong emission
reduction measures. In RCP4.5, GHG emissions peak in 2040, while RCP8.5 reflects a future with
little curbing of GHG emissions.
The predictive weather data is based on a typical meteorological year of historical weather data
drawn from the years 1990 to 2015. Global Climate Models and morphing were applied to this
data to predict the future values under each climate scenario at each location.
The data is available in two text-based file formats:
• As .epw files that can be used by building simulation software such as EnergyPlus, ESP-r, and
IESVE
• In a weather file format suitable for building simulations using NatHERS software such as
AccuRate, BERSPro, FirstRate5, and HERO in non-regulatory mode. Note that these files are
NOT for use in a regulatory setting.
Figure 2 Resultant radiative forcing under different RCP scenarios. SOURCE: CSIRO and Bureau of Meteorology,
Australia (2015)
Predictive weather files for building energy modelling | 3
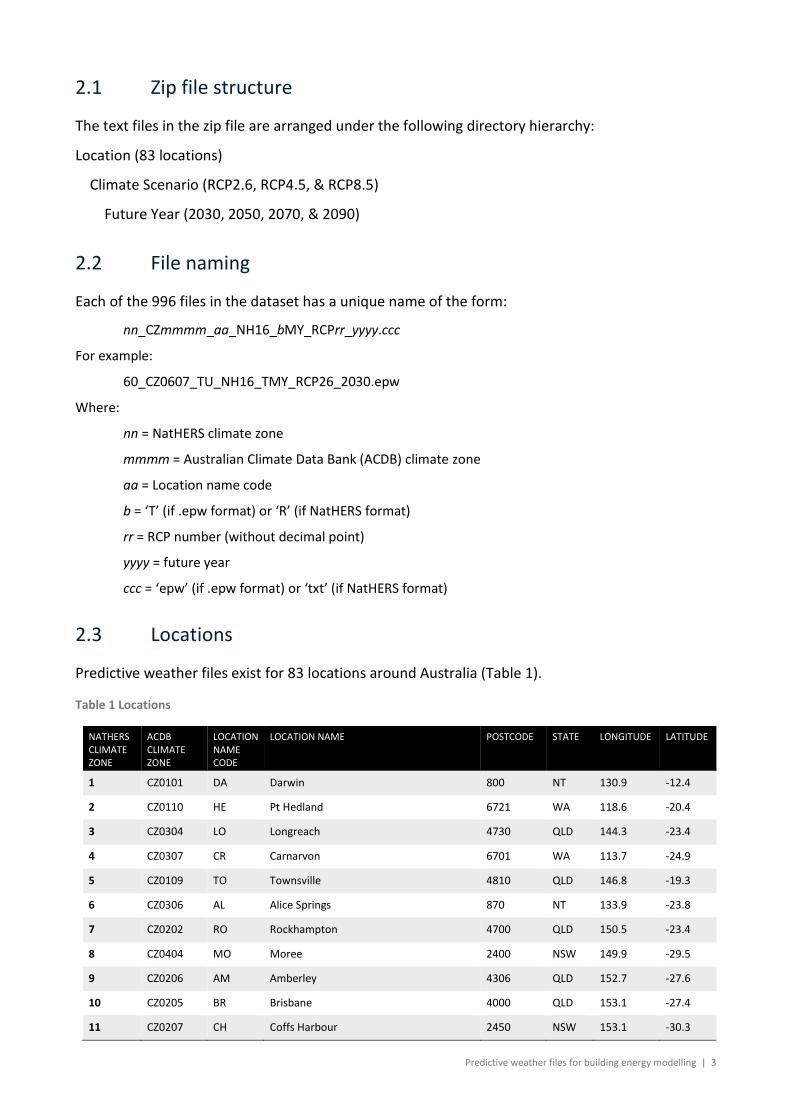
2.1 Zip file structure
The text files in the zip file are arranged under the following directory hierarchy:
Location (83 locations)
Climate Scenario (RCP2.6, RCP4.5, & RCP8.5)
Future Year (2030, 2050, 2070, & 2090)
2.2 File naming
Each of the 996 files in the dataset has a unique name of the form:
nn_CZmmmm_aa_NH16_bMY_RCPrr_yyyy.ccc
For example:
60_CZ0607_TU_NH16_TMY_RCP26_2030.epw
Where:
nn = NatHERS climate zone
mmmm = Australian Climate Data Bank (ACDB) climate zone
aa = Location name code
b = ‘T’ (if .epw format) or ‘R’ (if NatHERS format)
rr = RCP number (without decimal point)
yyyy = future year
ccc = ‘epw’ (if .epw format) or ‘txt’ (if NatHERS format)
2.3 Locations
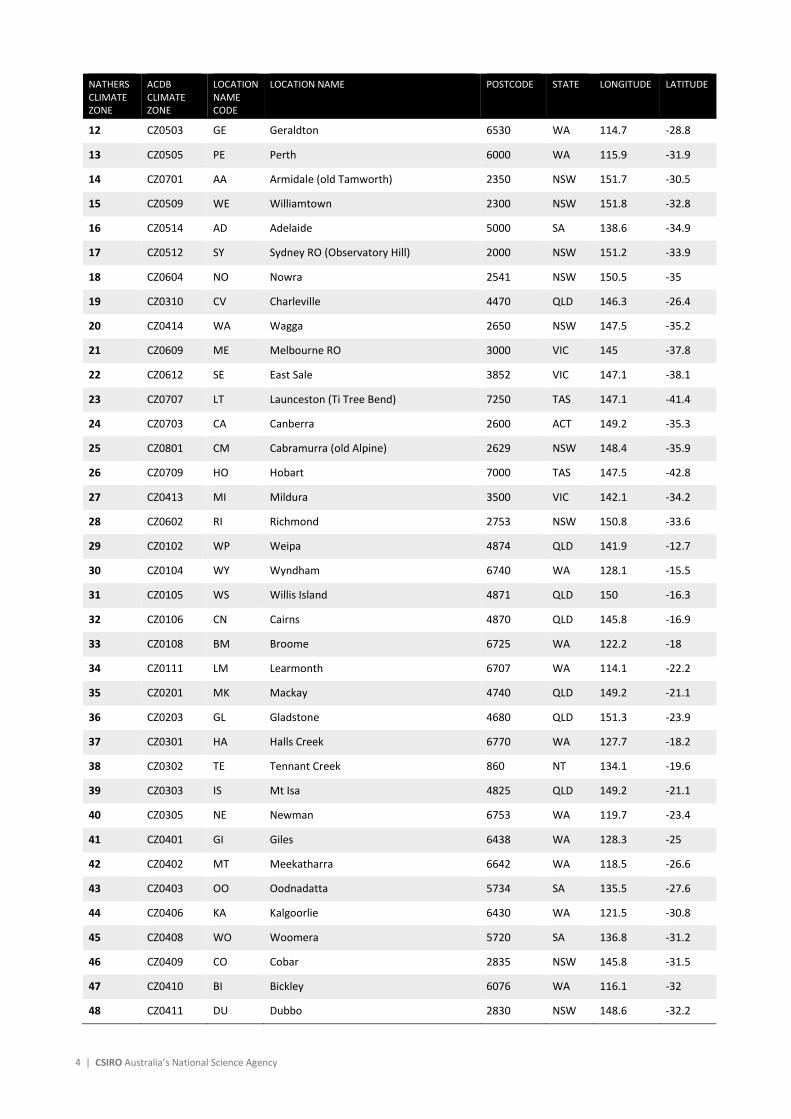
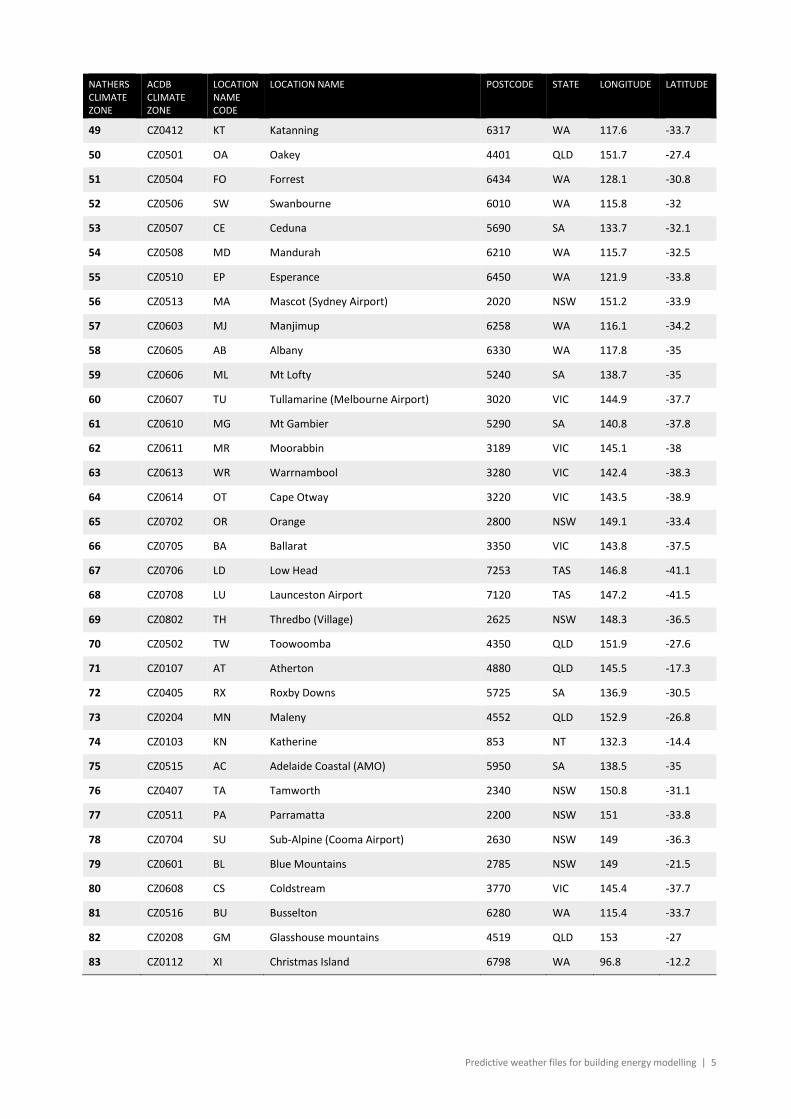
Predictive weather files exist for 83 locations around Australia (Table 1).
Table 1 Locations
NATHERS CLIMATE ZONE
ACDB CLIMATE ZONE
LOCATION NAME CODE
LOCATION NAME POSTCODE STATE LONGITUDE LATITUDE
1 CZ0101 DA Darwin 800 NT 130.9 -12.4
2 CZ0110 HE Pt Hedland 6721 WA 118.6 -20.4
3 CZ0304 LO Longreach 4730 QLD 144.3 -23.4
4 CZ0307 CR Carnarvon 6701 WA 113.7 -24.9
5 CZ0109 TO Townsville 4810 QLD 146.8 -19.3
6 CZ0306 AL Alice Springs 870 NT 133.9 -23.8
7 CZ0202 RO Rockhampton 4700 QLD 150.5 -23.4
8 CZ0404 MO Moree 2400 NSW 149.9 -29.5
9 CZ0206 AM Amberley 4306 QLD 152.7 -27.6
10 CZ0205 BR Brisbane 4000 QLD 153.1 -27.4
11 CZ0207 CH Coffs Harbour 2450 NSW 153.1 -30.3
4 | CSIRO Australia’s National Science Agency
NATHERS CLIMATE ZONE
ACDB CLIMATE ZONE
LOCATION NAME CODE
LOCATION NAME POSTCODE STATE LONGITUDE LATITUDE
12 CZ0503 GE Geraldton 6530 WA 114.7 -28.8
13 CZ0505 PE Perth 6000 WA 115.9 -31.9
14 CZ0701 AA Armidale (old Tamworth) 2350 NSW 151.7 -30.5
15 CZ0509 WE Williamtown 2300 NSW 151.8 -32.8
16 CZ0514 AD Adelaide 5000 SA 138.6 -34.9
17 CZ0512 SY Sydney RO (Observatory Hill) 2000 NSW 151.2 -33.9
18 CZ0604 NO Nowra 2541 NSW 150.5 -35
19 CZ0310 CV Charleville 4470 QLD 146.3 -26.4
20 CZ0414 WA Wagga 2650 NSW 147.5 -35.2
21 CZ0609 ME Melbourne RO 3000 VIC 145 -37.8
22 CZ0612 SE East Sale 3852 VIC 147.1 -38.1
23 CZ0707 LT Launceston (Ti Tree Bend) 7250 TAS 147.1 -41.4
24 CZ0703 CA Canberra 2600 ACT 149.2 -35.3
25 CZ0801 CM Cabramurra (old Alpine) 2629 NSW 148.4 -35.9
26 CZ0709 HO Hobart 7000 TAS 147.5 -42.8
27 CZ0413 MI Mildura 3500 VIC 142.1 -34.2
28 CZ0602 RI Richmond 2753 NSW 150.8 -33.6
29 CZ0102 WP Weipa 4874 QLD 141.9 -12.7
30 CZ0104 WY Wyndham 6740 WA 128.1 -15.5
31 CZ0105 WS Willis Island 4871 QLD 150 -16.3
32 CZ0106 CN Cairns 4870 QLD 145.8 -16.9
33 CZ0108 BM Broome 6725 WA 122.2 -18
34 CZ0111 LM Learmonth 6707 WA 114.1 -22.2
35 CZ0201 MK Mackay 4740 QLD 149.2 -21.1
36 CZ0203 GL Gladstone 4680 QLD 151.3 -23.9
37 CZ0301 HA Halls Creek 6770 WA 127.7 -18.2
38 CZ0302 TE Tennant Creek 860 NT 134.1 -19.6
39 CZ0303 IS Mt Isa 4825 QLD 149.2 -21.1
40 CZ0305 NE Newman 6753 WA 119.7 -23.4
41 CZ0401 GI Giles 6438 WA 128.3 -25
42 CZ0402 MT Meekatharra 6642 WA 118.5 -26.6
43 CZ0403 OO Oodnadatta 5734 SA 135.5 -27.6
44 CZ0406 KA Kalgoorlie 6430 WA 121.5 -30.8
45 CZ0408 WO Woomera 5720 SA 136.8 -31.2
46 CZ0409 CO Cobar 2835 NSW 145.8 -31.5
47 CZ0410 BI Bickley 6076 WA 116.1 -32
48 CZ0411 DU Dubbo 2830 NSW 148.6 -32.2
Predictive weather files for building energy modelling | 5
NATHERS CLIMATE ZONE
ACDB CLIMATE ZONE
LOCATION NAME CODE
LOCATION NAME POSTCODE STATE LONGITUDE LATITUDE
49 CZ0412 KT Katanning 6317 WA 117.6 -33.7
50 CZ0501 OA Oakey 4401 QLD 151.7 -27.4
51 CZ0504 FO Forrest 6434 WA 128.1 -30.8
52 CZ0506 SW Swanbourne 6010 WA 115.8 -32
53 CZ0507 CE Ceduna 5690 SA 133.7 -32.1
54 CZ0508 MD Mandurah 6210 WA 115.7 -32.5
55 CZ0510 EP Esperance 6450 WA 121.9 -33.8
56 CZ0513 MA Mascot (Sydney Airport) 2020 NSW 151.2 -33.9
57 CZ0603 MJ Manjimup 6258 WA 116.1 -34.2
58 CZ0605 AB Albany 6330 WA 117.8 -35
59 CZ0606 ML Mt Lofty 5240 SA 138.7 -35
60 CZ0607 TU Tullamarine (Melbourne Airport) 3020 VIC 144.9 -37.7
61 CZ0610 MG Mt Gambier 5290 SA 140.8 -37.8
62 CZ0611 MR Moorabbin 3189 VIC 145.1 -38
63 CZ0613 WR Warrnambool 3280 VIC 142.4 -38.3
64 CZ0614 OT Cape Otway 3220 VIC 143.5 -38.9
65 CZ0702 OR Orange 2800 NSW 149.1 -33.4
66 CZ0705 BA Ballarat 3350 VIC 143.8 -37.5
67 CZ0706 LD Low Head 7253 TAS 146.8 -41.1
68 CZ0708 LU Launceston Airport 7120 TAS 147.2 -41.5
69 CZ0802 TH Thredbo (Village) 2625 NSW 148.3 -36.5
70 CZ0502 TW Toowoomba 4350 QLD 151.9 -27.6
71 CZ0107 AT Atherton 4880 QLD 145.5 -17.3
72 CZ0405 RX Roxby Downs 5725 SA 136.9 -30.5
73 CZ0204 MN Maleny 4552 QLD 152.9 -26.8
74 CZ0103 KN Katherine 853 NT 132.3 -14.4
75 CZ0515 AC Adelaide Coastal (AMO) 5950 SA 138.5 -35
76 CZ0407 TA Tamworth 2340 NSW 150.8 -31.1
77 CZ0511 PA Parramatta 2200 NSW 151 -33.8
78 CZ0704 SU Sub-Alpine (Cooma Airport) 2630 NSW 149 -36.3
79 CZ0601 BL Blue Mountains 2785 NSW 149 -21.5
80 CZ0608 CS Coldstream 3770 VIC 145.4 -37.7
81 CZ0516 BU Busselton 6280 WA 115.4 -33.7
82 CZ0208 GM Glasshouse mountains 4519 QLD 153 -27
83 CZ0112 XI Christmas Island 6798 WA 96.8 -12.2
6 | CSIRO Australia’s National Science Agency
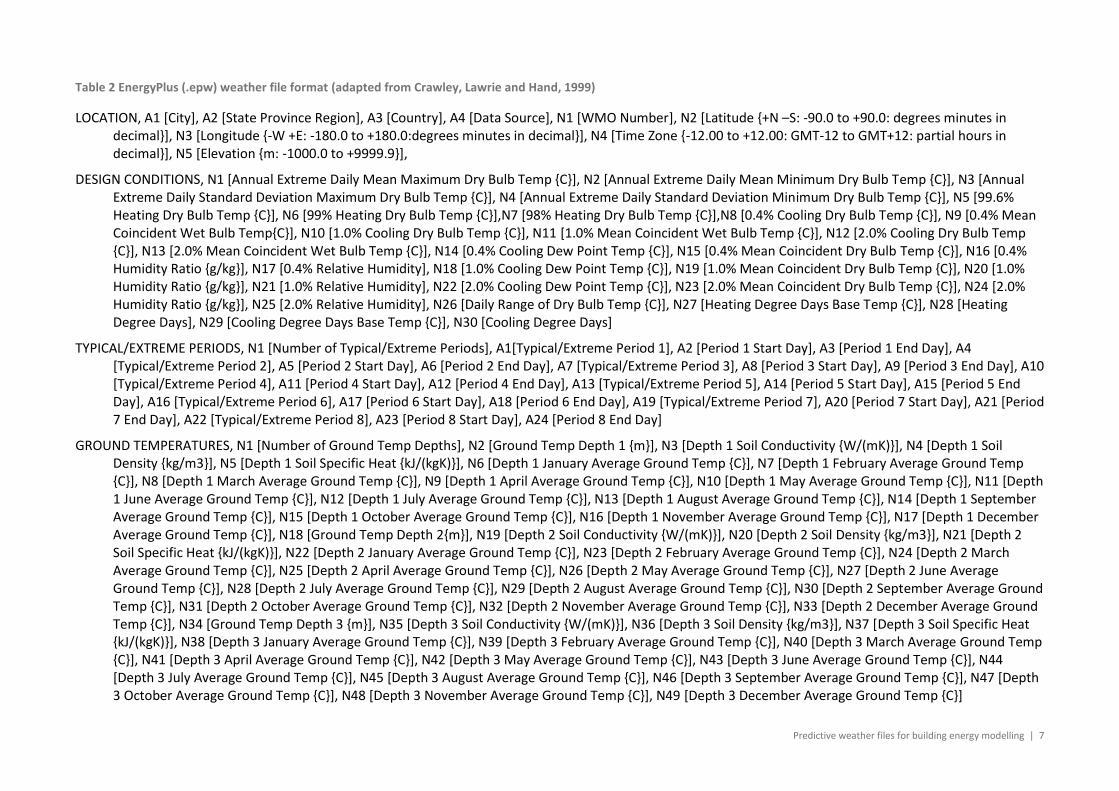
2.4 EnergyPlus weather file (.epw) format
The EnergyPlus weather file format (.epw) is a text format with variable values separated by
commas. The file structure is shown in Table 2. A sample of the data is shown in Figure 3.
The format is based on TMY2 which is a strict, position-specific format, with missing data filled
with nines. SI units were used for all the data. Each weather file has basic (header) information
followed by time step data.
The first eight lines provide basic information, including longitude, latitude, time zone, elevation,
annual design conditions, monthly average ground temperatures, typical and extreme periods,
holidays/daylight savings periods, and data periods.
The remaining lines provide time step data, including Dry Bulb Temperature, Dew Point
Temperature, Relative Humidity, Atmospheric Station Pressure, Radiation (Extraterrestrial
Horizontal, Extraterrestrial Direct Normal, Horizontal Infrared Radiation from Sky, Global
Horizontal, Direct Normal, Diffuse Horizontal), Illuminance (Global Horizontal, Direct Normal,
Diffuse Horizontal, Zenith), Wind (Direction, Speed), Sky Cover (Total, Opaque, Visibility, Ceiling
Height), Present Weather (Observation, Codes), Precipitable Water, Aerosol Optical Depth, and
Snow (Depth, Days Since Last Snowfall).
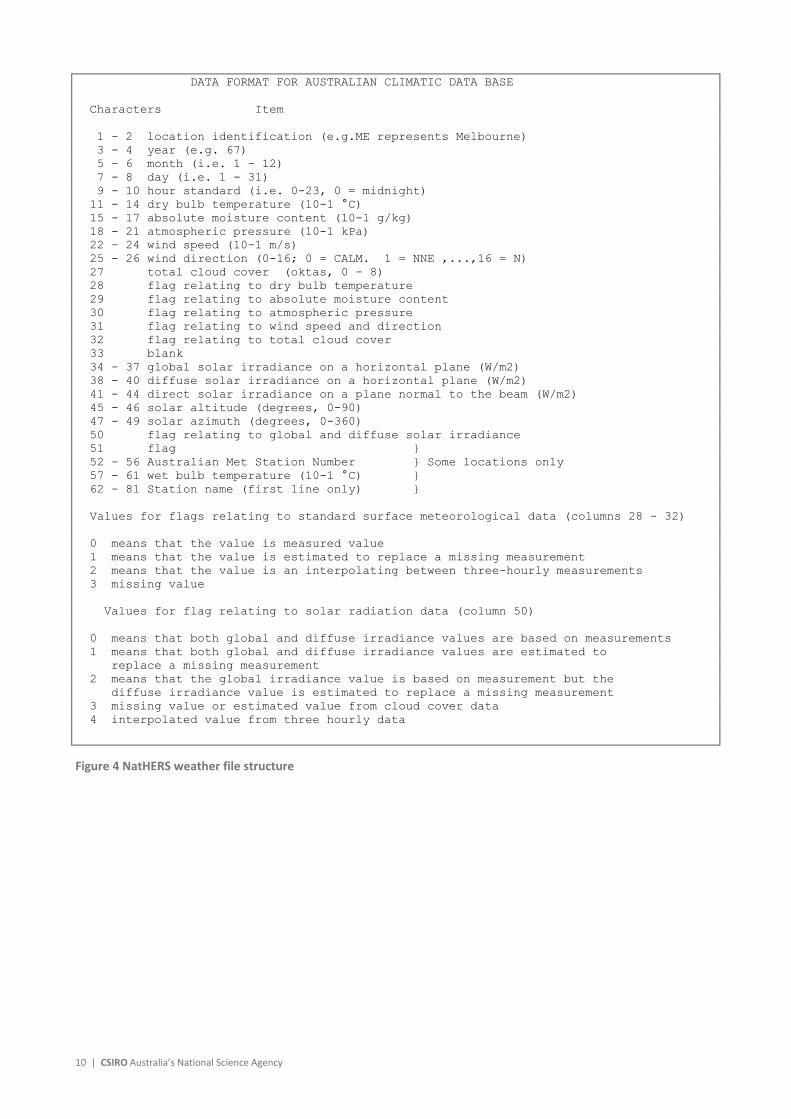
2.5 NatHERS weather file format
The NatHERS weather file has a position-specific text format. The file structure is shown in Figure
4. A sample of the data is shown in Figure 5
Weather data includes dry bulb temperature, absolute humidity, atmospheric pressure, wind
(speed, direction), solar radiation (global, direct, diffuse), cloud cover, solar altitude, and solar
azimuth.
Predictive weather files for building energy modelling | 7
Table 2 EnergyPlus (.epw) weather file format (adapted from Crawley, Lawrie and Hand, 1999)
LOCATION, A1 [City], A2 [State Province Region], A3 [Country], A4 [Data Source], N1 [WMO Number], N2 [Latitude {+N –S: -90.0 to +90.0: degrees minutes in decimal}], N3 [Longitude {-W +E: -180.0 to +180.0:degrees minutes in decimal}], N4 [Time Zone {-12.00 to +12.00: GMT-12 to GMT+12: partial hours in decimal}], N5 [Elevation {m: -1000.0 to +9999.9}],
DESIGN CONDITIONS, N1 [Annual Extreme Daily Mean Maximum Dry Bulb Temp {C}], N2 [Annual Extreme Daily Mean Minimum Dry Bulb Temp {C}], N3 [Annual Extreme Daily Standard Deviation Maximum Dry Bulb Temp {C}], N4 [Annual Extreme Daily Standard Deviation Minimum Dry Bulb Temp {C}], N5 [99.6% Heating Dry Bulb Temp {C}], N6 [99% Heating Dry Bulb Temp {C}],N7 [98% Heating Dry Bulb Temp {C}],N8 [0.4% Cooling Dry Bulb Temp {C}], N9 [0.4% Mean Coincident Wet Bulb Temp{C}], N10 [1.0% Cooling Dry Bulb Temp {C}], N11 [1.0% Mean Coincident Wet Bulb Temp {C}], N12 [2.0% Cooling Dry Bulb Temp {C}], N13 [2.0% Mean Coincident Wet Bulb Temp {C}], N14 [0.4% Cooling Dew Point Temp {C}], N15 [0.4% Mean Coincident Dry Bulb Temp {C}], N16 [0.4% Humidity Ratio {g/kg}], N17 [0.4% Relative Humidity], N18 [1.0% Cooling Dew Point Temp {C}], N19 [1.0% Mean Coincident Dry Bulb Temp {C}], N20 [1.0% Humidity Ratio {g/kg}], N21 [1.0% Relative Humidity], N22 [2.0% Cooling Dew Point Temp {C}], N23 [2.0% Mean Coincident Dry Bulb Temp {C}], N24 [2.0% Humidity Ratio {g/kg}], N25 [2.0% Relative Humidity], N26 [Daily Range of Dry Bulb Temp {C}], N27 [Heating Degree Days Base Temp {C}], N28 [Heating Degree Days], N29 [Cooling Degree Days Base Temp {C}], N30 [Cooling Degree Days]
TYPICAL/EXTREME PERIODS, N1 [Number of Typical/Extreme Periods], A1[Typical/Extreme Period 1], A2 [Period 1 Start Day], A3 [Period 1 End Day], A4 [Typical/Extreme Period 2], A5 [Period 2 Start Day], A6 [Period 2 End Day], A7 [Typical/Extreme Period 3], A8 [Period 3 Start Day], A9 [Period 3 End Day], A10 [Typical/Extreme Period 4], A11 [Period 4 Start Day], A12 [Period 4 End Day], A13 [Typical/Extreme Period 5], A14 [Period 5 Start Day], A15 [Period 5 End Day], A16 [Typical/Extreme Period 6], A17 [Period 6 Start Day], A18 [Period 6 End Day], A19 [Typical/Extreme Period 7], A20 [Period 7 Start Day], A21 [Period 7 End Day], A22 [Typical/Extreme Period 8], A23 [Period 8 Start Day], A24 [Period 8 End Day]
GROUND TEMPERATURES, N1 [Number of Ground Temp Depths], N2 [Ground Temp Depth 1 {m}], N3 [Depth 1 Soil Conductivity {W/(mK)}], N4 [Depth 1 Soil Density {kg/m3}], N5 [Depth 1 Soil Specific Heat {kJ/(kgK)}], N6 [Depth 1 January Average Ground Temp {C}], N7 [Depth 1 February Average Ground Temp {C}], N8 [Depth 1 March Average Ground Temp {C}], N9 [Depth 1 April Average Ground Temp {C}], N10 [Depth 1 May Average Ground Temp {C}], N11 [Depth 1 June Average Ground Temp {C}], N12 [Depth 1 July Average Ground Temp {C}], N13 [Depth 1 August Average Ground Temp {C}], N14 [Depth 1 September Average Ground Temp {C}], N15 [Depth 1 October Average Ground Temp {C}], N16 [Depth 1 November Average Ground Temp {C}], N17 [Depth 1 December Average Ground Temp {C}], N18 [Ground Temp Depth 2{m}], N19 [Depth 2 Soil Conductivity {W/(mK)}], N20 [Depth 2 Soil Density {kg/m3}], N21 [Depth 2 Soil Specific Heat {kJ/(kgK)}], N22 [Depth 2 January Average Ground Temp {C}], N23 [Depth 2 February Average Ground Temp {C}], N24 [Depth 2 March Average Ground Temp {C}], N25 [Depth 2 April Average Ground Temp {C}], N26 [Depth 2 May Average Ground Temp {C}], N27 [Depth 2 June Average Ground Temp {C}], N28 [Depth 2 July Average Ground Temp {C}], N29 [Depth 2 August Average Ground Temp {C}], N30 [Depth 2 September Average Ground Temp {C}], N31 [Depth 2 October Average Ground Temp {C}], N32 [Depth 2 November Average Ground Temp {C}], N33 [Depth 2 December Average Ground Temp {C}], N34 [Ground Temp Depth 3 {m}], N35 [Depth 3 Soil Conductivity {W/(mK)}], N36 [Depth 3 Soil Density {kg/m3}], N37 [Depth 3 Soil Specific Heat {kJ/(kgK)}], N38 [Depth 3 January Average Ground Temp {C}], N39 [Depth 3 February Average Ground Temp {C}], N40 [Depth 3 March Average Ground Temp {C}], N41 [Depth 3 April Average Ground Temp {C}], N42 [Depth 3 May Average Ground Temp {C}], N43 [Depth 3 June Average Ground Temp {C}], N44 [Depth 3 July Average Ground Temp {C}], N45 [Depth 3 August Average Ground Temp {C}], N46 [Depth 3 September Average Ground Temp {C}], N47 [Depth 3 October Average Ground Temp {C}], N48 [Depth 3 November Average Ground Temp {C}], N49 [Depth 3 December Average Ground Temp {C}]
8 | CSIRO Australia’s National Science Agency
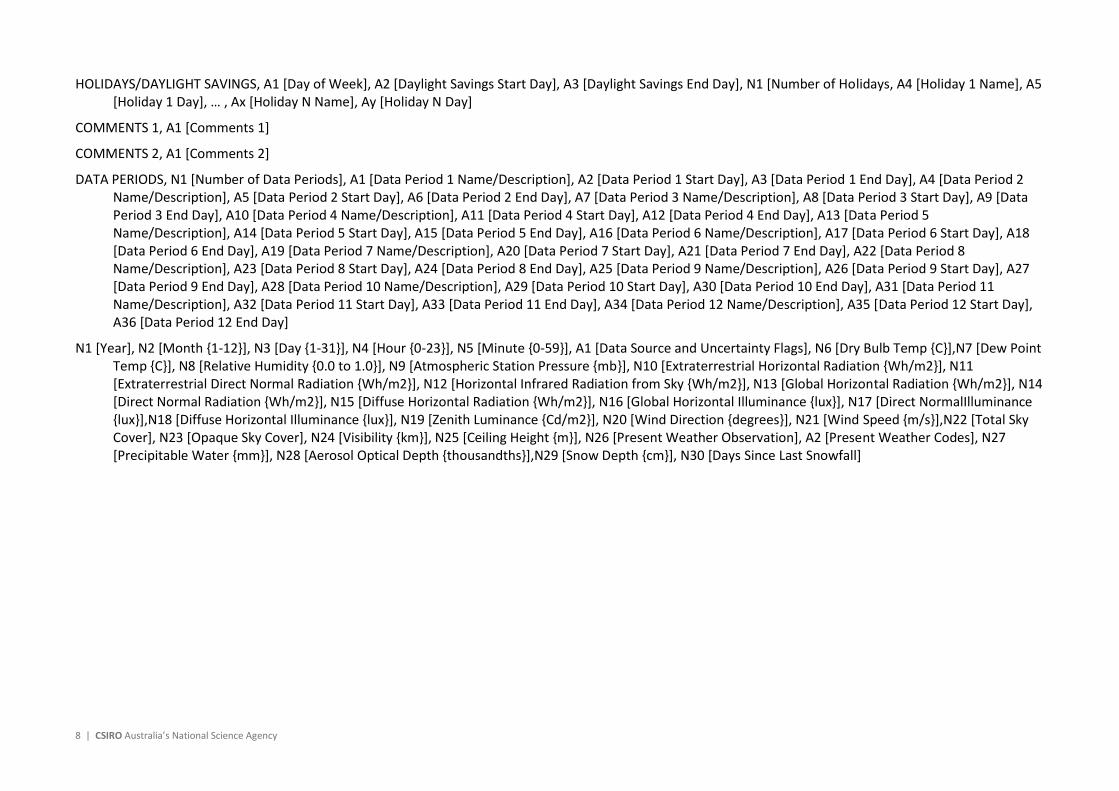
HOLIDAYS/DAYLIGHT SAVINGS, A1 [Day of Week], A2 [Daylight Savings Start Day], A3 [Daylight Savings End Day], N1 [Number of Holidays, A4 [Holiday 1 Name], A5 [Holiday 1 Day], … , Ax [Holiday N Name], Ay [Holiday N Day]
COMMENTS 1, A1 [Comments 1]
COMMENTS 2, A1 [Comments 2]
DATA PERIODS, N1 [Number of Data Periods], A1 [Data Period 1 Name/Description], A2 [Data Period 1 Start Day], A3 [Data Period 1 End Day], A4 [Data Period 2 Name/Description], A5 [Data Period 2 Start Day], A6 [Data Period 2 End Day], A7 [Data Period 3 Name/Description], A8 [Data Period 3 Start Day], A9 [Data Period 3 End Day], A10 [Data Period 4 Name/Description], A11 [Data Period 4 Start Day], A12 [Data Period 4 End Day], A13 [Data Period 5 Name/Description], A14 [Data Period 5 Start Day], A15 [Data Period 5 End Day], A16 [Data Period 6 Name/Description], A17 [Data Period 6 Start Day], A18 [Data Period 6 End Day], A19 [Data Period 7 Name/Description], A20 [Data Period 7 Start Day], A21 [Data Period 7 End Day], A22 [Data Period 8 Name/Description], A23 [Data Period 8 Start Day], A24 [Data Period 8 End Day], A25 [Data Period 9 Name/Description], A26 [Data Period 9 Start Day], A27 [Data Period 9 End Day], A28 [Data Period 10 Name/Description], A29 [Data Period 10 Start Day], A30 [Data Period 10 End Day], A31 [Data Period 11 Name/Description], A32 [Data Period 11 Start Day], A33 [Data Period 11 End Day], A34 [Data Period 12 Name/Description], A35 [Data Period 12 Start Day], A36 [Data Period 12 End Day]
N1 [Year], N2 [Month {1-12}], N3 [Day {1-31}], N4 [Hour {0-23}], N5 [Minute {0-59}], A1 [Data Source and Uncertainty Flags], N6 [Dry Bulb Temp {C}],N7 [Dew Point Temp {C}], N8 [Relative Humidity {0.0 to 1.0}], N9 [Atmospheric Station Pressure {mb}], N10 [Extraterrestrial Horizontal Radiation {Wh/m2}], N11 [Extraterrestrial Direct Normal Radiation {Wh/m2}], N12 [Horizontal Infrared Radiation from Sky {Wh/m2}], N13 [Global Horizontal Radiation {Wh/m2}], N14 [Direct Normal Radiation {Wh/m2}], N15 [Diffuse Horizontal Radiation {Wh/m2}], N16 [Global Horizontal Illuminance {lux}], N17 [Direct NormalIlluminance {lux}],N18 [Diffuse Horizontal Illuminance {lux}], N19 [Zenith Luminance {Cd/m2}], N20 [Wind Direction {degrees}], N21 [Wind Speed {m/s}],N22 [Total Sky Cover], N23 [Opaque Sky Cover], N24 [Visibility {km}], N25 [Ceiling Height {m}], N26 [Present Weather Observation], A2 [Present Weather Codes], N27 [Precipitable Water {mm}], N28 [Aerosol Optical Depth {thousandths}],N29 [Snow Depth {cm}], N30 [Days Since Last Snowfall]

Predictive weather files for building energy modelling | 9
LOCATION,Mascot (Sydney AP),NSW,Australia,NatHERS-TMY2 BoM 66037 CZ0513,947670,-33.94,151.17,10.0,5
DESIGN CONDITIONS,0
TYPICAL/EXTREME PERIODS,0
GROUND TEMPERATURES,0 HOLIDAYS/DAYLIGHT SAVING,No,0,0,0
COMMENTS 1,TMY2 months selected from 1990- 2016 out of 26 years of data; after Marion & Urban (1995), US National Renewable Energy Lab, NREL/SP-463-7668. Data reliability GOOD.
COMMENTS 2,Weights: T_dry 0.20, T_dew 0.20, Wind 0.10, R_glob 0.25, R_dir 0.25. Details in NIWA Client report 2019175WN, Ben Liley <[email protected]>, Apr 2020. DATA PERIODS,1,1,TMY2 Year,Sunday,1/1,12/31
2070,01,01,01,60,E8E8E8E8?0?3?3?3I4I4I6I5B8B8E8E8?0?0E8?0?0?0,20.7,12.5,59,101800,0,1407,9999,0,0,0,0,0,0,0,315,2.4,1,99,9999.,99999,9,999999999,23,0.999,99,99
2070,01,01,02,60,A7A7A7A7?0?3?3?3I4I4I6I5A7A7E8E8?0?0A7?0?0?0,20.8,12.4,58,101600,0,1407,9999,0,0,0,0,0,0,0,337,2.5,1,99,9999.,99999,9,999999999,23,0.999,99,99 2070,01,01,03,60,A7A7A7A7?0?3?3?3I4I4I6I5A7A7E8E8?0?0A7?0?0?0,20.9,12.4,58,101600,0,1407,9999,0,0,0,0,0,0,0,337,2.9,1,99,9999.,99999,9,999999999,23,0.999,99,99
2070,01,01,04,60,A7A7A7A7?0?3?3?3I4I4I6I5A7A7A7A7?0?0A7?0?0?0,20.3,12.3,59,101600,0,1407,9999,0,0,0,0,0,0,0,337,2.9,1,99,9999.,99999,9,999999999,22,0.999,99,99
2070,01,01,05,60,A7A7A7A7?0?3?3?3I4I4I6I5A7A7A7A7?0?0A7?0?0?0,19.0,12.2,64,101600,0,1407,9999,0,0,0,0,0,0,0,315,2.4,1,99,9999.,99999,9,999999999,23,0.999,99,99
2070,01,01,06,60,A7A7A7A7?0A3A3D3I4I4I6I5A7A7A7A7?0?0A7?0?0?0,19.2,12.5,65,101600,16,1407,9999,5,4,5,8544,4612,3949,26,360,2.4,1,99,9999.,99999,9,999999999,23,0.999,99,99
2070,01,01,07,60,A7A7A7A7?0A3A3D3I4I4I6I5A7A7A7A7?0?0A7?0?0?0,19.6,12.5,63,101700,293,1407,9999,176,637,42,32735,68628,6235,76,337,2.9,1,99,9999.,99999,9,999999999,23,0.999,99,99
2070,01,01,08,60,A7A7A7A7?0A3A3D3I4I4I6I5A7A7A7A7?0?0A7?0?0?0,21.0,12.4,57,101700,572,1407,9999,416,933,37,58640,92780,7410,121,315,2.9,1,99,9999.,99999,9,999999999,21,0.999,99,99 2070,01,01,09,60,A7A7A7A7?0A3A3D3I4I4I6I5A7A7A7A7?0?0A7?0?0?0,23.4,11.0,45,101700,832,1407,9999,655,1056,32,81360,99141,12138,190,360,5.5,0,99,9999.,99999,9,999999999,21,0.999,99,99
2070,01,01,10,60,A7A7A7A7?0A3A3D3I4I4I6I5A7A7A7A7?0?0A7?0?0?0,25.1,11.0,40,101700,1056,1407,9999,862,1106,42,98685,101725,14038,279,360,3.4,0,99,9999.,99999,9,999999999,21,0.999,99,99
2070,01,01,11,60,A7A7A7A7?0A3A3D3I4I4I6I5A7A7A7A7?0?0A7?0?0?0,26.5,10.9,37,101700,1230,1407,9999,1007,1098,49,110678,102917,14841,442,360,4.0,1,99,9999.,99999,9,999999999,21,0.999,99,99 2070,01,01,12,60,A7A7A7A7?0A3A3D3I4I4I6I5A7A7A7A7?0?0A7?0?0?0,27.0,10.9,36,101600,1341,1407,9999,1104,1093,61,116454,103322,14882,715,45,4.0,0,99,9999.,99999,9,999999999,20,0.999,99,99
2070,01,01,13,60,A7A7A7A7?0A3A3D3I4I4I6I5A7A7A7A7?0?0A7?0?0?0,27.9,10.6,33,101600,1381,1407,9999,1135,1081,72,116253,103320,14759,964,45,5.8,0,99,9999.,99999,9,999999999,20,0.999,99,99
2070,01,01,14,60,A7A7A7A7?0A3A3D3I4I4I6I5A7A7A7A7?0?0A7?0?0?0,28.4,10.5,32,101500,1348,1407,9999,1107,1094,59,109506,103117,13644,696,45,7.9,0,99,9999.,99999,9,999999999,21,0.999,99,99 2070,01,01,15,60,A7A7A7A7?0A3A3D3I4I4I6I5A7A7A7A7?0?0A7?0?0?0,29.0,10.9,32,101500,1245,1407,9999,1011,1097,49,96695,102103,11794,391,45,8.2,0,99,9999.,99999,9,999999999,20,0.999,99,99
2070,01,01,16,60,A7A7A7A7?0A3A3D3I4I4I6I5A7A7A7A7?0?0A7?0?0?0,28.4,10.2,31,101400,1077,1407,9999,862,1092,42,79218,100550,9414,226,45,7.9,0,99,9999.,99999,9,999999999,22,0.999,99,99
2070,01,01,17,60,A7A7A7A7?0A3A3D3I4I4I6I5A7A7A7A7?0?0A7?0?0?0,28.3,11.5,35,101400,857,1407,9999,664,1056,33,55871,92101,8104,158,45,8.2,1,99,9999.,99999,9,999999999,22,0.999,99,99 2070,01,01,18,60,A7A7A7A7?0A3A3D3I4I4I6I5A7A7A7A7?0?0A7?0?0?0,27.9,11.5,36,101400,600,1407,9999,426,927,31,30087,71823,7243,122,45,7.9,3,99,9999.,99999,9,999999999,23,0.999,99,99
2070,01,01,19,60,A7A7A7A7?0A3A3D3I4I4I6I5A7A7A7A7?0?0A7?0?0?0,26.6,12.4,41,101500,322,1407,9999,172,535,49,3153,57,3156,111,45,7.4,8,99,9999.,99999,9,999999999,25,0.999,99,99
2070,01,01,20,60,A7A7A7A7?0A3A3D3I4I4I6I5A7A7A7A7?0?0A7?0?0?0,25.6,13.5,46,101600,44,1407,9999,0,0,0,0,0,0,0,45,6.4,1,99,9999.,99999,9,999999999,26,0.999,99,99
2070,01,01,21,60,A7A7A7A7?0?3?3?3I4I4I6I5A7A7A7A7?0?0A7?0?0?0,24.9,14.1,50,101600,0,1407,9999,0,0,0,0,0,0,0,22,6.9,1,99,9999.,99999,9,999999999,27,0.999,99,99
2070,01,01,22,60,A7A7A7A7?0?3?3?3I4I4I6I5A7A7A7A7?0?0A7?0?0?0,24.3,14.5,54,101700,0,1407,9999,0,0,0,0,0,0,0,45,4.5,2,99,9999.,99999,9,999999999,28,0.999,99,99 2070,01,01,23,60,A7A7A7A7?0?3?3?3I4I4I6I5A7A7A7A7?0?0A7?0?0?0,24.2,15.0,56,101700,0,1407,9999,0,0,0,0,0,0,0,45,4.5,2,99,9999.,99999,9,999999999,28,0.999,99,99
2070,01,01,24,60,A7A7A7A7?0?3?3?3I4I4I6I5A7A7A7A7?0?0A7?0?0?0,23.3,15.5,61,101700,0,1407,9999,0,0,0,0,0,0,0,45,4.5,2,99,9999.,99999,9,999999999,29,0.999,99,99
2070,01,02,01,60,A7A7A7A7?0?3?3?3I4I4I6I5A7A7A7A7?0?0A7?0?0?0,23.1,15.6,62,101700,0,1407,9999,0,0,0,0,0,0,0,45,2.4,1,99,9999.,99999,9,999999999,29,0.999,99,99 2070,01,02,02,60,A7A7A7E8?0?3?3?3I4I4I6I5A7A7A7A7?0?0A7?0?0?0,23.0,15.8,63,101600,0,1407,9999,0,0,0,0,0,0,0,22,2.4,1,99,9999.,99999,9,999999999,29,0.999,99,99
2070,01,02,03,60,A7A7A7A7?0?3?3?3I4I4I6I5A7A7A7A7?0?0A7?0?0?0,21.9,15.6,67,101600,0,1407,9999,0,0,0,0,0,0,0,337,1.8,1,99,9999.,99999,9,999999999,28,0.999,99,99
2070,01,02,04,60,A7A7A7A7?0?3?3?3I4I4I6I5A7A7A7A7?0?0A7?0?0?0,21.9,15.3,65,101600,0,1407,9999,0,0,0,0,0,0,0,360,1.3,1,99,9999.,99999,9,999999999,28,0.999,99,99 2070,01,02,05,60,A7A7A7A7?0?3?3?3I4I4I6I5A7A7A7A7?0?0A7?0?0?0,20.9,15.3,70,101600,0,1407,9999,0,0,0,0,0,0,0,315,2.1,1,99,9999.,99999,9,999999999,28,0.999,99,99
2070,01,02,06,60,A7A7A7A7?0A3A3D3I4I4I6I5A7A7A7A7?0?0A7?0?0?0,20.9,15.3,70,101700,13,1407,9999,4,1,4,7750,2154,4258,23,315,2.4,1,99,9999.,99999,9,999999999,28,0.999,99,99
2070,01,02,07,60,A7A7A7A7?0A3A3D3I4I4I6I5A7A7A7A7?0?0A7?0?0?0,21.7,15.0,65,101700,290,1407,9999,162,531,52,28988,56931,8647,88,337,2.1,1,99,9999.,99999,9,999999999,28,0.999,99,99 2070,01,02,08,60,A7A7A7A7?0A3A3D3I4I4I6I5A7A7A7A7?0?0A7?0?0?0,23.8,15.0,57,101800,569,1407,9999,396,849,52,56934,90188,7128,119,337,2.4,1,99,9999.,99999,9,999999999,26,0.999,99,99
2070,01,02,09,60,A7A7A7A7?0A3A3D3I4I4I6I5A7A7A7A7?0?0A7?0?0?0,25.4,14.2,49,101800,829,1407,9999,632,994,45,79744,99804,8701,162,360,4.8,1,99,9999.,99999,9,999999999,24,0.999,99,99
2070,01,02,10,60,A7A7A7A7?0A3A3D3I4I4I6I5A7A7A7A7?0?0A7?0?0?0,26.5,12.6,41,101800,1054,1407,9999,834,1045,50,97193,102142,11042,243,22,5.5,1,99,9999.,99999,9,999999999,22,0.999,99,99 2070,01,02,11,60,A7A7A7A7?0A3A3D3I4I4I6I5A7A7A7A7?0?0A7?0?0?0,27.9,11.8,36,101800,1228,1407,9999,985,1052,65,108747,102994,11958,376,45,7.9,2,99,9999.,99999,9,999999999,20,0.999,99,99
2070,01,02,12,60,A7A7A7A7?0A3A3D3I4I4I6I5A7A7A7A7?0?0A7?0?0?0,28.3,10.5,32,101800,1340,1407,9999,1077,1041,85,114034,102750,12317,605,22,8.2,1,99,9999.,99999,9,999999999,20,0.999,99,99
2070,01,02,13,60,A7A7A7A7?0A3A3D3I4I4I6I5A7A7A7A7?0?0A7?0?0?0,29.3,10.3,30,101700,1381,1407,9999,1104,1020,102,114414,103691,11487,763,22,7.9,0,99,9999.,99999,9,999999999,22,0.999,99,99 2070,01,02,14,60,A7A7A7A7?0A3A3D3I4I4I6I5A7A7A7A7?0?0A7?0?0?0,29.9,11.3,31,101700,1348,1407,9999,1081,1043,80,108524,103569,11195,585,45,8.8,1,99,9999.,99999,9,999999999,23,0.999,99,99
Figure 3 Sample of .epw format data
10 | CSIRO Australia’s National Science Agency
DATA FORMAT FOR AUSTRALIAN CLIMATIC DATA BASE
Characters Item
1 - 2 location identification (e.g.ME represents Melbourne)
3 - 4 year (e.g. 67)
5 - 6 month (i.e. 1 - 12)
7 - 8 day (i.e. 1 - 31)
9 - 10 hour standard (i.e. 0-23, 0 = midnight)
11 - 14 dry bulb temperature (10-1 °C)
15 - 17 absolute moisture content (10-1 g/kg)
18 - 21 atmospheric pressure (10-1 kPa)
22 - 24 wind speed (10-1 m/s)
25 - 26 wind direction (0-16; 0 = CALM. 1 = NNE ,...,16 = N)
27 total cloud cover (oktas, 0 - 8)
28 flag relating to dry bulb temperature
29 flag relating to absolute moisture content
30 flag relating to atmospheric pressure
31 flag relating to wind speed and direction
32 flag relating to total cloud cover
33 blank
34 - 37 global solar irradiance on a horizontal plane (W/m2)
38 - 40 diffuse solar irradiance on a horizontal plane (W/m2)
41 - 44 direct solar irradiance on a plane normal to the beam (W/m2)
45 - 46 solar altitude (degrees, 0-90)
47 - 49 solar azimuth (degrees, 0-360)
50 flag relating to global and diffuse solar irradiance
51 flag }
52 - 56 Australian Met Station Number } Some locations only
57 - 61 wet bulb temperature (10-1 °C) }
62 - 81 Station name (first line only) }
Values for flags relating to standard surface meteorological data (columns 28 - 32)
0 means that the value is measured value
1 means that the value is estimated to replace a missing measurement
2 means that the value is an interpolating between three-hourly measurements
3 missing value
Values for flag relating to solar radiation data (column 50)
0 means that both global and diffuse irradiance values are based on measurements
1 means that both global and diffuse irradiance values are estimated to
replace a missing measurement
2 means that the global irradiance value is based on measurement but the
diffuse irradiance value is estimated to replace a missing measurement
3 missing value or estimated value from cloud cover data
4 interpolated value from three hourly data
Figure 4 NatHERS weather file structure

Predictive weather files for building energy modelling | 11
MA120101 0 207 951018 24141000010 0 0 0 018131320
MA120101 1 208 951016 25151111210 0 0 0 016531320
MA120101 2 209 951016 29151000010 0 0 0 015031320
MA120101 3 203 941016 29151000010 0 0 0 013731320
MA120101 4 190 931016 24141000000 0 0 0 012731320
MA120101 5 192 951016 24161000000 5 5 4 111800020
MA120101 6 196 951017 29151000000 176 42 6371211000020
MA120101 7 210 951017 29141000000 416 37 9332410300020
MA120101 8 234 871017 55161000000 655 32105636 9500020
MA120101 9 251 871017 34160000000 862 42110649 8700020
MA12010110 265 871017 401600000001007 49109861 7600020
MA12010111 270 871016 40 210000001104 61109372 5600020
MA12010112 279 861016 58 200000001135 72108179 400020
MA12010113 284 861015 79 200000001107 5910947330700020
MA12010114 290 881015 82 200000001011 4910976228500020
MA12010115 284 841014 79 20000000 862 4210925027400020
MA12010116 283 921014 82 20000000 664 3310563826600020
MA12010117 279 921014 79 21000000 426 31 9272525800020
MA12010118 266 971015 74 23000000 172 49 5351325100020
MA12010119 2561041016 64 27000000 0 0 0 224300020
MA12010120 2491071016 69 11000000 0 0 0 023400020
MA12010121 2431101017 45 21000000 0 0 0 022431320
MA12010122 2421131017 45 22000000 0 0 0 021231320
MA12010123 2331161017 45 22000000 0 0 0 019731320
MA120102 0 2311171017 24 22000000 0 0 0 018131320
MA120102 1 2301191016 24 11000000 0 0 0 016531320
MA120102 2 2191171016 18151001000 0 0 0 015031320
MA120102 3 2191151016 13161000000 0 0 0 013731320
MA120102 4 2091151016 21141000000 0 0 0 012731320
MA120102 5 2091141017 24141000000 4 4 1 111800020
MA120102 6 2171131017 21151000000 162 52 5311211000020
MA120102 7 2381131018 24151000000 396 52 8492410300020
MA120102 8 2541081018 48161000000 632 45 99436 9500020
MA120102 9 265 981018 55 11000000 834 50104549 8700020
MA12010210 279 931018 79 21000000 985 65105261 7600020
MA12010211 283 851018 82 120000001077 85104172 5600020
MA12010212 293 851017 79 100000001104102102079 400020
MA12010213 299 911017 88 200000001081 8010437330800020
MA12010214 296 961016 98 21000000 994 5510596228600020
MA12010215 2931001016 98 20000000 845 4110495027400020
MA12010216 2841031015 93 20000000 641 36 9913826600020
MA12010217 2781111015 98 21000000 401 50 8212525800020
MA12010218 2771171015 98 24000000 157 62 4171325100020
MA12010219 2651161016109 27000000 0 0 0 224300020
MA12010220 2591181016 88 11000000 0 0 0 023500020
MA12010221 2541171017 82 11000000 0 0 0 022431320
MA12010222 2521171017 79 11000010 0 0 0 021231320
Figure 5 Sample of NatHERS weather file data
12 | CSIRO Australia’s National Science Agency
3 CSIRO methodology for constructing future weather data
The dataset ‘Predictive weather files in NatHERS format’ is based on the dataset ‘NatHERS 2016
Reference Meteorological Year (RMY) weather files’. Predicted changes in critical weather
variables due to climate change have been applied to the RMY files (Chen et al. 2020).
The ‘NatHERS 2016 RMY weather files’ contain hourly weather data for a typical meteorological
year in 83 Australian locations. The typical meteorological year is drawn from historical weather
data from 1990 to 2015 using the method described by the New Zealand National Institute of
Water and Atmospheric Research (NIWA 2017).
Future weather predictions were made under 3 different GHG emission scenarios (RCP2.6, RCP4.5,
and RCP8.5) as defined under the Climate Futures Framework
(https://www.climatechangeinaustralia.gov.au/en/). The 3 selected Representative Concentration
Pathways (RCP) reflect varying levels of anthropogenic GHG emissions, atmospheric GHG
concentrations, and the resultant radiative forcing (in W/m2) (Figure 2) for the period from 2020
to 2100. In RCP2.6, atmospheric GHG emissions peak around 2020, then rapidly decline in line
with strong emission reduction measures. In RCP4.5, GHG emissions peak in 2040, while RCP8.5
reflects a future with little curbing of GHG emissions. Further RCP details are described by van
Vuuren et al. (2011).
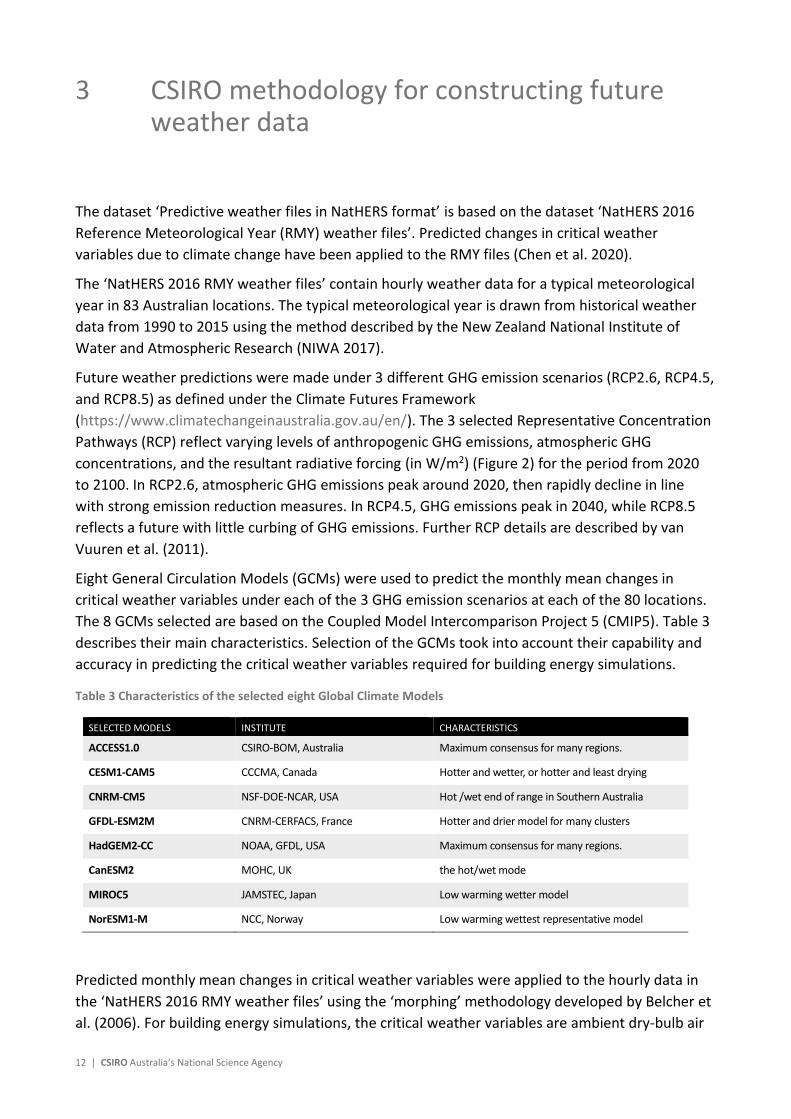
Eight General Circulation Models (GCMs) were used to predict the monthly mean changes in
critical weather variables under each of the 3 GHG emission scenarios at each of the 80 locations.
The 8 GCMs selected are based on the Coupled Model Intercomparison Project 5 (CMIP5). Table 3
describes their main characteristics. Selection of the GCMs took into account their capability and
accuracy in predicting the critical weather variables required for building energy simulations.
Table 3 Characteristics of the selected eight Global Climate Models
SELECTED MODELS INSTITUTE CHARACTERISTICS
ACCESS1.0 CSIRO-BOM, Australia Maximum consensus for many regions.
CESM1-CAM5 CCCMA, Canada Hotter and wetter, or hotter and least drying
CNRM-CM5 NSF-DOE-NCAR, USA Hot /wet end of range in Southern Australia
GFDL-ESM2M CNRM-CERFACS, France Hotter and drier model for many clusters
HadGEM2-CC NOAA, GFDL, USA Maximum consensus for many regions.
CanESM2 MOHC, UK the hot/wet mode
MIROC5 JAMSTEC, Japan Low warming wetter model
NorESM1-M NCC, Norway Low warming wettest representative model
Predicted monthly mean changes in critical weather variables were applied to the hourly data in
the ‘NatHERS 2016 RMY weather files’ using the ‘morphing’ methodology developed by Belcher et
al. (2006). For building energy simulations, the critical weather variables are ambient dry-bulb air
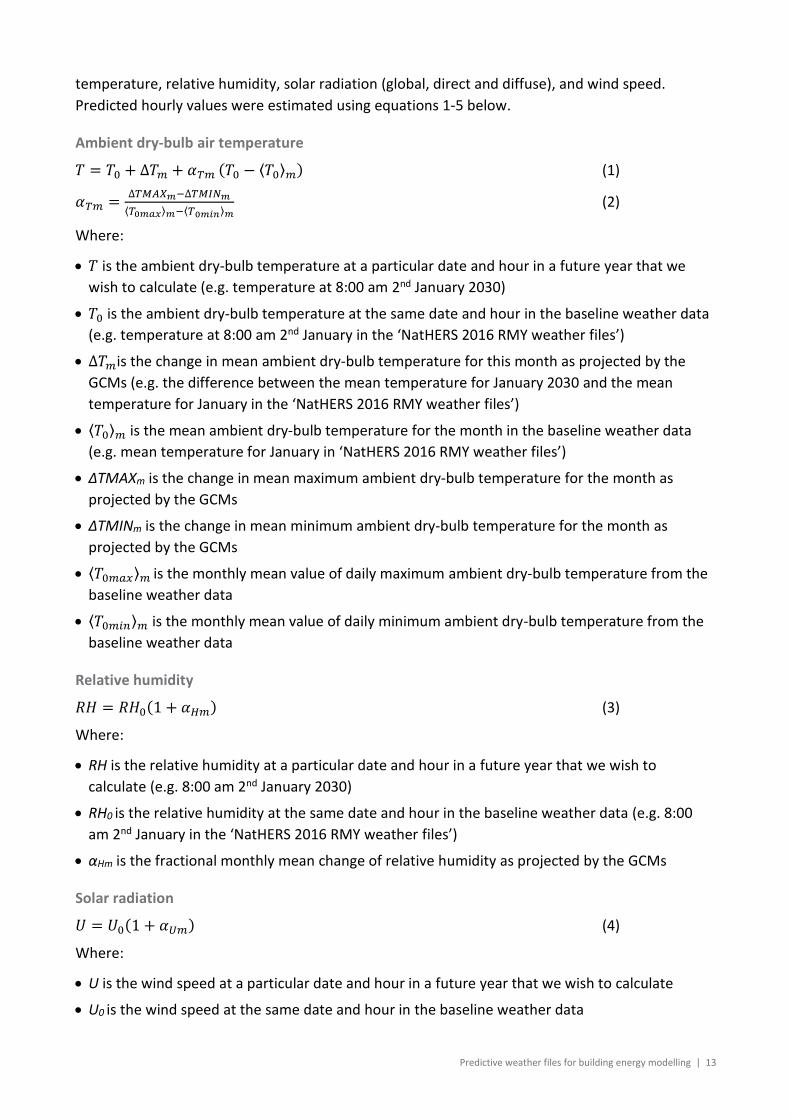
Predictive weather files for building energy modelling | 13
temperature, relative humidity, solar radiation (global, direct and diffuse), and wind speed.
Predicted hourly values were estimated using equations 1-5 below.
Ambient dry-bulb air temperature
𝑇 = 𝑇0 + ∆𝑇𝑚 + 𝛼𝑇𝑚 (𝑇0 − ⟨𝑇0⟩𝑚) (1)
𝛼𝑇𝑚 =∆𝑇𝑀𝐴𝑋𝑚−∆𝑇𝑀𝐼𝑁𝑚
⟨𝑇0𝑚𝑎𝑥⟩𝑚−⟨𝑇0𝑚𝑖𝑛⟩𝑚 (2)
Where:
• 𝑇 is the ambient dry-bulb temperature at a particular date and hour in a future year that we
wish to calculate (e.g. temperature at 8:00 am 2nd January 2030)
• 𝑇0 is the ambient dry-bulb temperature at the same date and hour in the baseline weather data
(e.g. temperature at 8:00 am 2nd January in the ‘NatHERS 2016 RMY weather files’)
• ∆𝑇𝑚is the change in mean ambient dry-bulb temperature for this month as projected by the
GCMs (e.g. the difference between the mean temperature for January 2030 and the mean
temperature for January in the ‘NatHERS 2016 RMY weather files’)
• ⟨𝑇0⟩𝑚 is the mean ambient dry-bulb temperature for the month in the baseline weather data
(e.g. mean temperature for January in ‘NatHERS 2016 RMY weather files’)
• ΔTMAXm is the change in mean maximum ambient dry-bulb temperature for the month as
projected by the GCMs
• ΔTMINm is the change in mean minimum ambient dry-bulb temperature for the month as
projected by the GCMs
• ⟨𝑇0𝑚𝑎𝑥⟩𝑚 is the monthly mean value of daily maximum ambient dry-bulb temperature from the
baseline weather data
• ⟨𝑇0𝑚𝑖𝑛⟩𝑚 is the monthly mean value of daily minimum ambient dry-bulb temperature from the
baseline weather data
Relative humidity
𝑅𝐻 = 𝑅𝐻0(1 + 𝛼𝐻𝑚) (3)
Where:
• RH is the relative humidity at a particular date and hour in a future year that we wish to
calculate (e.g. 8:00 am 2nd January 2030)
• RH0 is the relative humidity at the same date and hour in the baseline weather data (e.g. 8:00
am 2nd January in the ‘NatHERS 2016 RMY weather files’)
• αHm is the fractional monthly mean change of relative humidity as projected by the GCMs
Solar radiation
𝑈 = 𝑈0(1 + 𝛼𝑈𝑚) (4)
Where:
• U is the wind speed at a particular date and hour in a future year that we wish to calculate
• U0 is the wind speed at the same date and hour in the baseline weather data

14 | CSIRO Australia’s National Science Agency
• αUm is the fractional monthly mean change of wind speed as projected by the GCMs
Wind speed
𝐼 = 𝐼0(1 + 𝐼𝑅𝑚) (5)
Where:
• I is the solar radiation at a particular date and hour in a future year that we wish to calculate
• I0 is the solar radiation at the same date and hour in the baseline weather data
• αRm is the fractional monthly mean change of solar radiation as projected by the GCMs
Note
The ‘NatHERS 2016 RMY weather files’ (used as the starting point for constructing future weather
data) contain the variable Absolute Moisture Content instead of Relative Humidity. Relative
Humidity was derived from the variables Atmospheric Pressure, Dry Bulb Temperature, and
Absolute Moisture Content using Equations 6-10 (see section 4). Predicted future values for
Relative Humidity were then calculated as described above. Future values for Absolute Moisture
Content were then derived from the future values of Relative Humidity and Dry Bulb Temperature
together with the (unchanged) Atmospheric Pressure according to the same equations, but in
reverse.
Predictive weather files for building energy modelling | 15
4 CSIRO methodology for converting weather files in NatHERS format to .epw format
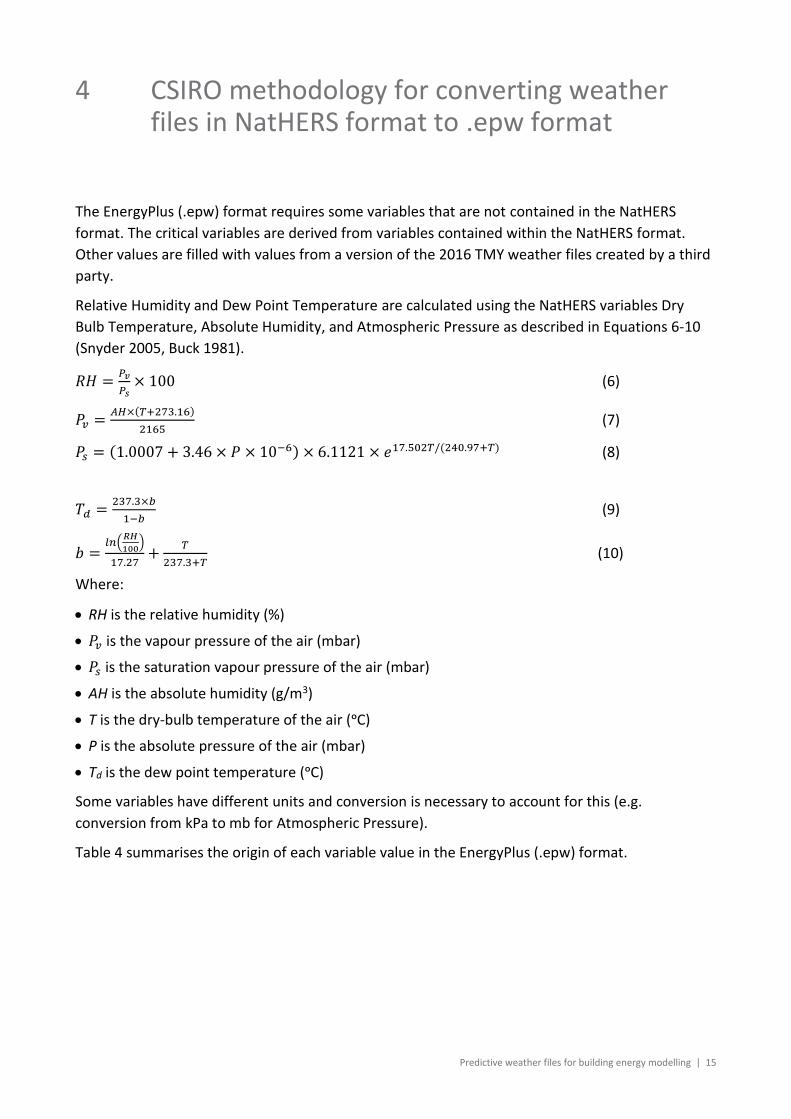
The EnergyPlus (.epw) format requires some variables that are not contained in the NatHERS
format. The critical variables are derived from variables contained within the NatHERS format.
Other values are filled with values from a version of the 2016 TMY weather files created by a third
party.
Relative Humidity and Dew Point Temperature are calculated using the NatHERS variables Dry
Bulb Temperature, Absolute Humidity, and Atmospheric Pressure as described in Equations 6-10
(Snyder 2005, Buck 1981).
𝑅𝐻 =𝑃𝑣
𝑃𝑠× 100 (6)
𝑃𝑣 =𝐴𝐻×(𝑇+273.16)
2165 (7)
𝑃𝑠 = (1.0007 + 3.46 × 𝑃 × 10−6) × 6.1121 × 𝑒17.502𝑇/(240.97+𝑇) (8)
𝑇𝑑 =237.3×𝑏
1−𝑏 (9)
𝑏 =𝑙𝑛(
𝑅𝐻
100)
17.27+
𝑇
237.3+𝑇 (10)
Where:
• RH is the relative humidity (%)
• 𝑃𝑣 is the vapour pressure of the air (mbar)
• 𝑃𝑠 is the saturation vapour pressure of the air (mbar)
• AH is the absolute humidity (g/m3)
• T is the dry-bulb temperature of the air (ᵒC)
• P is the absolute pressure of the air (mbar)
• Td is the dew point temperature (ᵒC)
Some variables have different units and conversion is necessary to account for this (e.g.
conversion from kPa to mb for Atmospheric Pressure).
Table 4 summarises the origin of each variable value in the EnergyPlus (.epw) format.

16 | CSIRO Australia’s National Science Agency
Table 4 Origin of weather variables in .epw files
ENERGYPLUS (.EPW) VARIABLE ORIGIN
Dry Bulb Temp NatHERS Dry bulb temperature with change of unit
Dew Point Temp Calculated using NatHERS Dry Bulb Temperature, Absolute Moisture Content, and Atmospheric Pressure (Eq 6-10)
Relative Humidity Calculated using NatHERS Dry Bulb Temperature, Absolute Moisture Content, and Atmospheric Pressure (Eq 6-8)
Atmospheric Station Pressure NatHERS Atmospheric pressure with change of unit
Extraterrestrial Horizontal Radiation As per 2016 Non-CSIRO TMY
Extraterrestrial Direct Normal Radiation As per 2016 Non-CSIRO TMY
Horizontal Infrared Radiation from Sky As per 2016 Non-CSIRO TMY
Global Horizontal Radiation NatHERS Global solar irradiance on a horizontal plane
Direct Normal Radiation NatHERS Direct solar irradiance on a plane normal to the beam
Diffuse Horizontal Radiation NatHERS Diffuse solar irradiance on a horizontal plane
Global Horizontal Illuminance As per 2016 Non-CSIRO TMY
Direct Normal Illuminance As per 2016 Non-CSIRO TMY
Diffuse Horizontal Illuminance As per 2016 Non-CSIRO TMY
Zenith Luminance As per 2016 Non-CSIRO TMY
Wind Direction 2016 RMY NatHERS Wind direction with change of unit
Wind Speed NatHERS Wind speed with change of unit
Total Sky Cover As per 2016 Non-CSIRO TMY
Opaque Sky Cover As per 2016 Non-CSIRO TMY
Visibility As per 2016 Non-CSIRO TMY
Ceiling Height As per 2016 Non-CSIRO TMY
Present Weather Observation As per 2016 Non-CSIRO TMY
Present Weather Codes As per 2016 Non-CSIRO TMY
Precipitable Water As per 2016 Non-CSIRO TMY
Aerosol Optical Depth As per 2016 Non-CSIRO TMY
Snow Depth As per 2016 Non-CSIRO TMY
Days Since Last Snowfall As per 2016 Non-CSIRO TMY
Predictive weather files for building energy modelling | 17
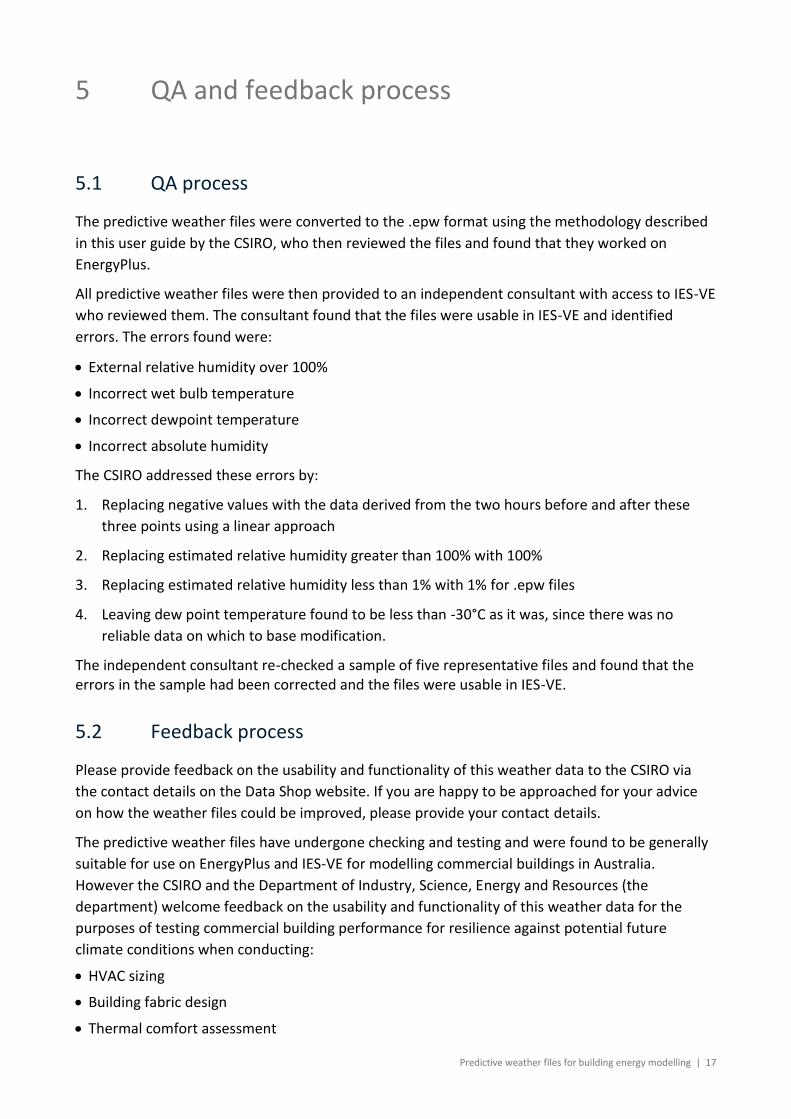
5 QA and feedback process
5.1 QA process
The predictive weather files were converted to the .epw format using the methodology described
in this user guide by the CSIRO, who then reviewed the files and found that they worked on
EnergyPlus.
All predictive weather files were then provided to an independent consultant with access to IES-VE
who reviewed them. The consultant found that the files were usable in IES-VE and identified
errors. The errors found were:
• External relative humidity over 100%
• Incorrect wet bulb temperature
• Incorrect dewpoint temperature
• Incorrect absolute humidity
The CSIRO addressed these errors by:
1. Replacing negative values with the data derived from the two hours before and after these
three points using a linear approach
2. Replacing estimated relative humidity greater than 100% with 100%
3. Replacing estimated relative humidity less than 1% with 1% for .epw files
4. Leaving dew point temperature found to be less than -30°C as it was, since there was no
reliable data on which to base modification.
The independent consultant re-checked a sample of five representative files and found that the errors in the sample had been corrected and the files were usable in IES-VE.
5.2 Feedback process
Please provide feedback on the usability and functionality of this weather data to the CSIRO via
the contact details on the Data Shop website. If you are happy to be approached for your advice
on how the weather files could be improved, please provide your contact details.
The predictive weather files have undergone checking and testing and were found to be generally
suitable for use on EnergyPlus and IES-VE for modelling commercial buildings in Australia.
However the CSIRO and the Department of Industry, Science, Energy and Resources (the
department) welcome feedback on the usability and functionality of this weather data for the
purposes of testing commercial building performance for resilience against potential future
climate conditions when conducting:
• HVAC sizing
• Building fabric design
• Thermal comfort assessment

18 | CSIRO Australia’s National Science Agency
In 2022 the department will set up a technical working group to review the success of this project.
The group will be asked to provide feedback on the ease of access to the weather data, its
suitability for use by commercial building modellers and the level of awareness of how to access
and use the weather data. The group will also be asked to provide suggestions for improvement.
The department will collate the feedback and liaise with the CSIRO to implement improvements
which are agreed by the department.
Predictive weather files for building energy modelling | 19
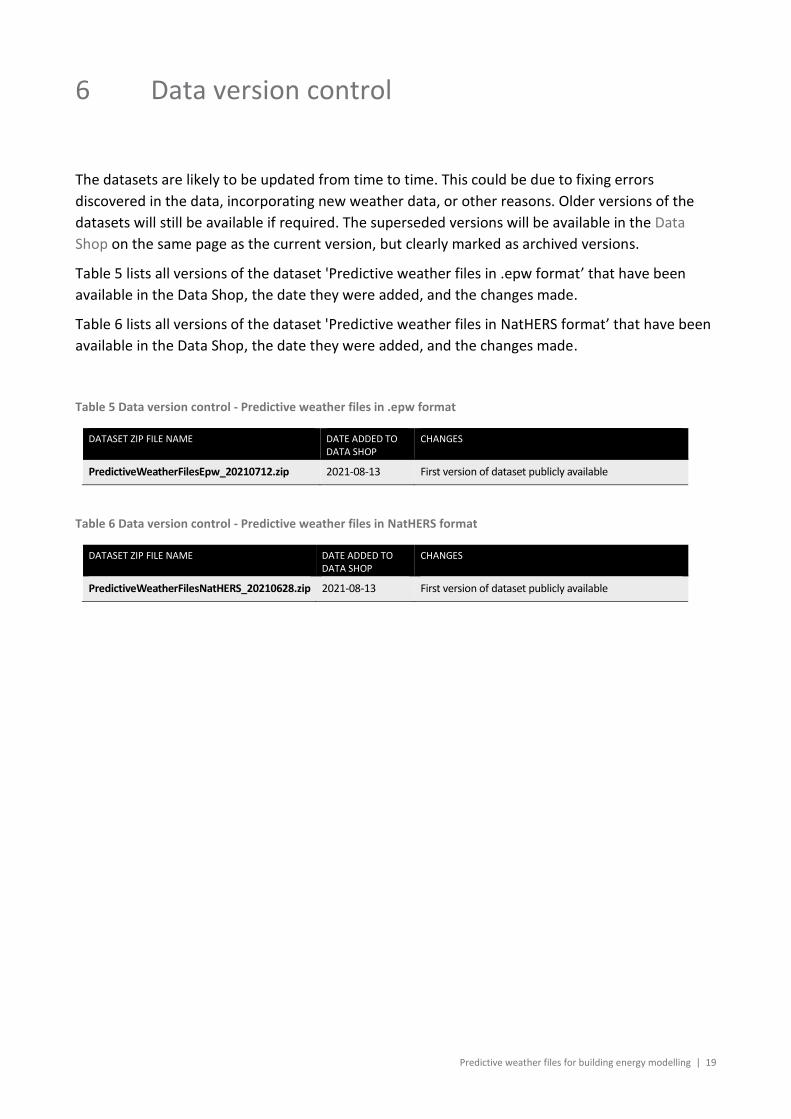
6 Data version control
The datasets are likely to be updated from time to time. This could be due to fixing errors
discovered in the data, incorporating new weather data, or other reasons. Older versions of the
datasets will still be available if required. The superseded versions will be available in the Data
Shop on the same page as the current version, but clearly marked as archived versions.
Table 5 lists all versions of the dataset 'Predictive weather files in .epw format’ that have been
available in the Data Shop, the date they were added, and the changes made.
Table 6 lists all versions of the dataset 'Predictive weather files in NatHERS format’ that have been
available in the Data Shop, the date they were added, and the changes made.
Table 5 Data version control - Predictive weather files in .epw format
DATASET ZIP FILE NAME DATE ADDED TO DATA SHOP
CHANGES
PredictiveWeatherFilesEpw_20210712.zip 2021-08-13 First version of dataset publicly available
Table 6 Data version control - Predictive weather files in NatHERS format
DATASET ZIP FILE NAME DATE ADDED TO DATA SHOP
CHANGES
PredictiveWeatherFilesNatHERS_20210628.zip 2021-08-13 First version of dataset publicly available

20 | CSIRO Australia’s National Science Agency
References
Belcher S, Hacker J, Powell D. Constructing design weather data for future climates. Building
Services Engineering Research and Technology 26(2005):49-61
(https://journals.sagepub.com/doi/abs/10.1191/0143624405bt112oa).
Buck W. New equations for computing vapor pressure and enhancement factor. Journal of Applied
Meteorology and Climatology 20(1981):1527-1532
(https://journals.ametsoc.org/view/journals/apme/20/12/1520-
0450_1981_020_1527_nefcvp_2_0_co_2.xml).
Chen S, Ren Z, Tang Z, Clarke J, Round V, Chen D, Constructing future weather files for building
performance simulation in Australia, Proceeding of 1st Asia Pacific Conference on Sustainable
Development of Energy, Water and Environment Systems, April 06-09, 2020, Gold Coast,
Australia. (CSIRO Research Publications Repository - Publication)
Crawley D, Hand J, Lawrie L, Improving the weather information available to simulation programs,
Proceeding of Building Simulation 1999, September 13-15, 1999, Kyoto, Japan
(https://www.researchgate.net/publication/267720701_Improving_the_Weather_Informati
on_Available_to_Simulation_Programs)
CSIRO and Bureau of Meteorology 2015, Climate Change in Australia Information for Australia’s
Natural Resource Management Regions: Technical Report, CSIRO and Bureau of
Meteorology, Australia
(https://climatechangeinaustralia.gov.au/media/ccia/2.2/cms_page_media/168/CCIA_2015
_NRM_TechnicalReport_WEB.pdf)
Snyder R. Humidity conversion (http://biomet.ucdavis.edu/conversions/HumCon.pdf).
van Vuuren D, Edmonds J, Kainuma M, Riahi K, Thomson A, Hibbard K, Hurtt G, Kram T, Krey V,
Lamarque JF, Masui T, Meinshausen M, Nakicenovic N, Smith S, Rose S. The representative
concentration pathways: an overview. Climate Change 109(2011):5–31
(https://link.springer.com/article/10.1007/s10584-011-0148-z)


22 | CSIRO Australia’s National Science Agency
As Australia’s national science agency and innovation catalyst, CSIRO is solving the greatest challenges through innovative science and technology.
CSIRO. Unlocking a better future for everyone.
Contact us
1300 363 400 +61 3 9545 2176 [email protected] csiro.au
For further information
Energy Zhengen Ren +61 3 9545 2430 [email protected] csiro.au/energy