preface - buecher.de · and it was followed by other low-cost carriers in the uk (e.g. easyjet in...
TRANSCRIPT

Preface
The debate on the future of the aviation sector and the viability of its traditionalbusiness practices is the core of this book. The liberalization of the EU market inthe 1990s has radically modified the competitive environment and the nature ofairline competition. Furthermore, the new millennium began with terrorist attacks,epidemics, trade globalization, and the rise of oil prices, all of which combined topush the industry into a “perfect storm”.
Airline industry profitability has been an elusive goal for several decades and therecent events has only accentuated existing weaknesses. The main concern of indus-try observers is whether the airline business model, successful during the 1980s and1990s, is now sustainable in a market crowded by low-cost carriers. The airlines thatwill respond rapidly and determinedly to increase pressure to restructure, consoli-date and segment the industry will achieve competitive advantages. In this context,the present study aims to model the new conduct of the ‘legacy’ carriers in a newliberalized European market in terms of network and pricing competition with low-cost carriers and competitive reaction to the global economic crises.
The current evolution of the aviation sector in Europe can be described in termsof the combination of two main factors: (1) the liberalization process which began inthe EU during the 1990s and the succeeding boom of the low-cost carriers. This haschanged the nature of competition, as new entrants or potential entrants have differ-ent business models, especially concerning the network organization; and (2) the setof specific exogenous factors such as terrorism, epidemics, trade globalization, andthe rise of oil price.
The traditional model that was successful during the 1980s and 1990s is evolvingin a market where there is fierce competition from the low-cost carriers. The low-cost carriers have had a serious impact on the airline industry, but the extent andnature of this effect have been largely regionalized. The concept of ‘low-cost car-rier’ originated in the United States with Southwest Airlines at the beginning of the1970s. In Europe, the Southwest model was copied in 1991, when the Irish companyRyanair, previously a traditional carrier, transformed itself into a low-cost carrierand it was followed by other low-cost carriers in the UK (e.g. easyJet in 1995). Inthe literature, there are several similar definitions of a low-cost carrier, also known
vii

viii Preface
as a ‘low fare’ or ‘no-frills’ airline, which is described by core characteristics thatseem to be common to the majority of the low-cost models. These are high aircraftutilization; Internet booking; use of secondary airports; minimum cabin crew; lowerwage scales; lower rates of unionization among employees; one class of seating;short ground turn-around times; no cargo carried; very simple fare structures andprice strategies; adoption of strict yield management techniques; e-ticketing; oftenno seat allocation (for faster boarding); no frills, i.e. the passengers having to pay forfood and beverages; no connections; point-to-point services. It should be noted thatthis increased competition in the aviation sector led the traditional airlines to adoptsome of the characteristics of the low-cost airlines in an attempt to better survive inthis new deregulated environment.
This book represents a revised version of my PhD thesis. The original decisionto start researching the observed phenomena in airline economics was based ontwo motivations: my passion for aviation and the great positive influence of a fewoutstanding persons whom I have met during the course of my life. My passionfor aircraft and flying began as a childhood dream, and today in writing this bookI am still living the dream. First, I would like to thank Prof. Aura Reggiani. Sheintroduced me to the international academic arena by offering me the opportunityto work at the University of Italian Switzerland in Lugano. With her intellectualstimulation and pragmatic and tenacious attitude, she convinced me to publish mythesis as a book.
Aura also introduced me to Prof. Peter Nijkamp and Prof. Piet Rietveld. Theyagreed to promote my thesis despite my busy agenda with KLM Royal Dutch Air-lines, and I could not have had better supervisors. I would like to thank Peter andPiet for the style, quality and efficacy of their supervision. At every meeting or worksession and in emails, they never forgot to add inspiring and encouraging words totheir indescribable professionalism and scientific knowledge. Even their tacit criti-cism was motivating and aimed at getting the best out of me. I was impressed byPeter because, in just two lines of comments, he identifies and solves issues, and byPiet because he is always right when commenting on mathematical or econometricmodels.
Dr. Marco Alderighi of Milan Bocconi University and Valle D’Aosta Universitywas a great help. He closely followed all my work and contributed actively. Hisintuitions, innovative ideas and collaboration have made my thesis a better work. Iconsider Marco one of the most intelligent young researchers I have ever met in mylife. Above all, I have found a friend whom I will never forget.
KLM Royal Dutch Airlines has been my employer for the last eight years andhas provided me with the facilities to finalize the book successfully. In particular, Iwould like to thank Anton van Dasler, Domingo De Cola, Hester Bruijninckx, PeterBootsma, Paul Gregorowitsch, Just Kerckhoff, Toon Balm, Harm Kreulen, all thestaff at the Revenue Management Department in Amstelveen, and my colleaguesin the KLM Italian office, from whom I have learned the best business practices ofthe airline industry and some of the “secrets of KLM success”. A ‘thank you’ toPatricia Ellman, who took care of the English correction with incredible speed andquality. Thanks also to Dr. Eric Pels and Dr. Oliviero Baccelli who offered me the

Preface ix
opportunities to organize a few workshops with the students of the Free Universityof Amsterdam and Milan Bocconi University.
Finally, Cristina, my love, and our children Marco, Ester and Luca. Words are notenough to describe the strength you were able to give me. There were uncountablenights and week-ends when I could hear Cristina singing a lullaby to our little oneswhile I was busy writing a new section. A special thank you for your patience andyour faith in me, that helped this flight arrive at its final destination.
Milan, Italy Alessandro Cento12 May 2008

Chapter 2Characteristics of the Airline Industry
The real difficulty in changing any enterprise lies not in developing new ideas, but in escap-ing from the old ones.
John Maynard Keynes
2.1 Introduction
In recent years, the European airline industry has exhibited impressively dynamics.The sector has gone through a drastic change on both the supply and the demandside. Unlikely in other industries, the driving forces governing the recent changes donot depend mainly on technological factors, but on developments in the legal, insti-tutional, and cultural domains. Legal and institutional aspects have clearly affectedthe structure of the market, while cultural forces have influenced spatial mobilityand its characteristics.
On the supply side, we observe that only a few industries have faced changesas dramatic as those that have occurred in the European airline industry in the past20 years. Over this time period, the industry has evolved from a system of long-established state-owned carriers operating in a regulated market to a dynamic, free-market industry. Before the deregulation, only one or two flag carriers operated theEuropean routes, with airfares being regulated by state bilateral agreements.
The process of deregulation and the subsequent process of privatization haveinduced important changes in the structure of the airline market.
This chapter presents a concise analysis of the main characteristics and changesin the aviation sector, mainly from the supply side, which has followed the dereg-ulation.1 The aim is to draw a new profile of the airline industry in terms of newairline business models and compare their characteristics in a way which has rarelybeen presented in the literature to date. Section 2.2 describes the deregulation of
1 This chapter mainly attempts to describe the European market but draws parallels with othermarkets. Thus, some elements of the description can easily be generalizable to other markets.
A. Cento, The Airline Industry: Challenges in the 21st Century, 13c© Springer-Verlag Berlin Heidelberg 2009

14 2 Characteristics of the Airline Industry
the EU aviation market and part of the relevant literature. The discussion mainlyconcerns its effects on the airlines’ strategies and how they have consequently reor-ganized their models. In Sect. 2.3 these new models are described, with particularemphasis on network, pricing, and alliances. These three elements are discussedmore in-depth in Sects. 2.4, 2.5 and 2.6, respectively. Section 2.7 concludes thisanalysis and introduces Parts II and III of this study.
2.2 Market Deregulation
At the Chicago Convention in 1944, 52 state members2 discussed some forms ofagreements in order to regulate: (1) capacity and frequency; (2) airfares; (3) freightlevels; and (4) the application of the traffic rights or ‘air traffic freedoms’.3
The Convention also established the International Aviation Organization (ICAO),i.e. an inter-governmental agency responsible for the coordination of world-wide technical and operational standards. The four regulatory elements togetherwere able to effectively reduce the entry of new carriers, the pricing freedom, andthe production levels, and therefore they limited any form of price or network com-petition. International carriers such as KLM or Lufthansa defined their internationalstrategy depending on a set of bilateral service agreements (known as ‘bilaterals’)between the government of their country of aircraft registration and the destinationcountry. The bilateral agreements specified the traffic rights for each operatingcarrier, the number of airports in which they operate, the number of carriers, and thefrequencies of flights between the fixed airports. Those airlines were, in practice,the national flag carriers of each country (state-owned). Since 1947 the Interna-tional Air Transport Association (IATA) has had the authority to set the ticket pricescharged by international airlines at the worldwide international IATA conference.4
The national carriers, national governments, and the national airports dominatedinternational air-transport until 1978.
In 1978, the United Stated domestic market started to become liberalized. Inthe 1980s and 1990s many international bilateral agreements were changed (seeDoganis 2001). Almost 25 years after the US market deregulation, Andersonet al. (2005) identified the major changes produced in the US market. Thosechanges include the entry of the low-cost carriers, waves of mergers among themajor carriers, rapid growth in the number of air travellers, general decline ofairfares, increased variability in fares across the market, and the emergence of theHS system. Anderson provides evidence on the nature of the competition in the
2 The national government involvement in the development of the airline industry was decided inthe Paris Convention in 1919, where the allied countries after the First World War decided thatnation states would have sovereignty on their own airspace.3 See Appendix I for the complete list of ‘Freedoms of the Air’.4 The International Air Transport Association was founded in Havana in 1945. Its main purposewas to represent the interests of airlines and counterweight the ICAO. Tariffs come to be regulatedby the IATA.
2.2 Market Deregulation 15
post-deregulation US market. The study presents a historical review of the USmarket since deregulation, and then develops an econometric model of domesticair fares in order to investigate how the level of competition, the low-cost carrierentry, or the HS systems affect the airfares of a particular route or airport. The paperconcludes that airfares decreased in US as a result of higher competition and thelow-cost carrier entry. However there was also found to be a ‘hub effect’, i.e. thecarrier applies a price premium on the traffic originating from its main hubs.
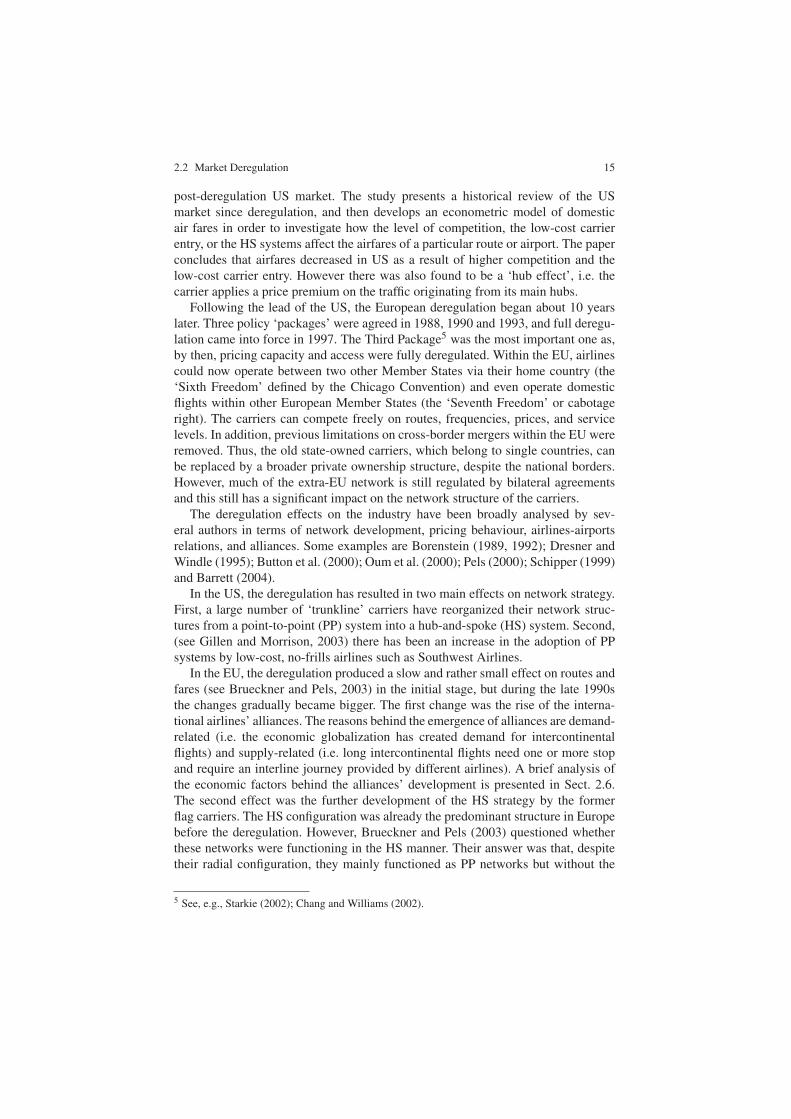
Following the lead of the US, the European deregulation began about 10 yearslater. Three policy ‘packages’ were agreed in 1988, 1990 and 1993, and full deregu-lation came into force in 1997. The Third Package5 was the most important one as,by then, pricing capacity and access were fully deregulated. Within the EU, airlinescould now operate between two other Member States via their home country (the‘Sixth Freedom’ defined by the Chicago Convention) and even operate domesticflights within other European Member States (the ‘Seventh Freedom’ or cabotageright). The carriers can compete freely on routes, frequencies, prices, and servicelevels. In addition, previous limitations on cross-border mergers within the EU wereremoved. Thus, the old state-owned carriers, which belong to single countries, canbe replaced by a broader private ownership structure, despite the national borders.However, much of the extra-EU network is still regulated by bilateral agreementsand this still has a significant impact on the network structure of the carriers.
The deregulation effects on the industry have been broadly analysed by sev-eral authors in terms of network development, pricing behaviour, airlines-airportsrelations, and alliances. Some examples are Borenstein (1989, 1992); Dresner andWindle (1995); Button et al. (2000); Oum et al. (2000); Pels (2000); Schipper (1999)and Barrett (2004).
In the US, the deregulation has resulted in two main effects on network strategy.First, a large number of ‘trunkline’ carriers have reorganized their network struc-tures from a point-to-point (PP) system into a hub-and-spoke (HS) system. Second,(see Gillen and Morrison, 2003) there has been an increase in the adoption of PPsystems by low-cost, no-frills airlines such as Southwest Airlines.
In the EU, the deregulation produced a slow and rather small effect on routes andfares (see Brueckner and Pels, 2003) in the initial stage, but during the late 1990sthe changes gradually became bigger. The first change was the rise of the interna-tional airlines’ alliances. The reasons behind the emergence of alliances are demand-related (i.e. the economic globalization has created demand for intercontinentalflights) and supply-related (i.e. long intercontinental flights need one or more stopand require an interline journey provided by different airlines). A brief analysis ofthe economic factors behind the alliances’ development is presented in Sect. 2.6.The second effect was the further development of the HS strategy by the formerflag carriers. The HS configuration was already the predominant structure in Europebefore the deregulation. However, Brueckner and Pels (2003) questioned whetherthese networks were functioning in the HS manner. Their answer was that, despitetheir radial configuration, they mainly functioned as PP networks but without the
5 See, e.g., Starkie (2002); Chang and Williams (2002).

16 2 Characteristics of the Airline Industry
relevant volume of connecting traffic. The main reason for this was that, given thegeographical size of the European countries and the fact that the flag carriers wereconnecting all major cities with price and capacity regulated by bilateral agreements,the potential for connecting traffic within Europe was limited.
At an earlier stage of the EU deregulation, Berechman and de Wit (1996)addressed a potential deregulation effect which still seems to be still latent in themarket. Their research question was: ‘. . . in a profit maximizing environment ifairlines are free to enter and exit the market, design their networks and set faresand level of services, which West European airports will they favour as their mainhub?. . . ’. The study was carried out in 1996 when the EU liberalization was not yetfinalized but one of its conclusions was that the airlines would intensify the use ofthe HS system and would select a specific hub so as to maximize their profits.
Berechman and de Wit concluded that, in the immediate future, national carriersin the EU will continue to operate in their national home base for a substantialpart of their products, but they will probably take the opportunity of a liberalizedmarket by developing a secondary Euro-hub complementary to their national hub.Finally a concentration in the internal market will take place thus creating roomfor enhanced HS operations. While the concentration and development of the HSsystem is widely documented as the main effect of deregulation, the selection ofa specific hub by airlines is not evident. Most of the carriers still have their hubsin their original country. However, this aspect raises the questions whether the EUderegulation has effectively created sufficient market liberalization, as simulated bythe Berechman and de Wit model or whether it was able to diminish the role of hubsas entry market barriers.
The third effect was the growth of low-cost carriers such as Ryanair and easyJet.They experienced fast growth after 1999 and often compete with full-service carrierson the same routes and for coincident segments, and they did not suffer as muchfrom the crisis in the air transport industry after September 11, this is because thelow fare levels still attract many passengers, and the air travelling public’s fearingof flying to sensitive regions (North America and Asia) diverted passengers to flyintra-Europe.
The deregulation and the increased competition have reduced the air fares. Thussome effects on the charter operations are possible given that the gaps between thecharter fares and the scheduled low-cost carrier fares are being reduced.
2.3 The Open-Skies Agreement between the EU and the US
On 30 March 2008, the most ambitious air service deal ever negotiated, took effect.European airlines can now fly without restrictions from any point in the EU to anypoint in the US. The new EU–US agreement is expected to increase competition andreduce the airfares in the biggest international air transport market.
The Open-Skies agreement contains numerous positive elements but three keyelements seem decisive in the future of the worldwide air traffic.

2.4 Airline Business Models 17
1. Recognition of all European airlines as ‘community air carriers’: All Europeancompanies are classified identically without discrimination based on their coun-try of origin (if in the EU).
2. Flights now possible between any point in the EU to any point in the US: theairlines will be able to fly from any European airport to any US destination.
3. Flights now possible beyond the US towards third countries: European compa-nies will also be allowed to go beyond the US and provide destinations usingthe US as a stopover. With respect to the operation of cargo flights between theUS and third countries: freight will follow the same above-mentioned rules aspassenger traffic.
This will allow flights from any European airport to any US airport with anyEuropean or US company. This major improvement will equalize the rights of allEU Member States which previously did not have a bilateral agreement with the USand thus enhance the destination possibilities for many Europeans.
Some other key factors of the agreement provide for cooperation in fields suchas security, safety and environment.
1. Security: The EU and the US will work towards compatible standards and prac-tices for entering territories in order to facilitate air regulation.
2. Safety: A consultation procedure will be set up to consider safety concerns oneither side, and there will be recognition of the development of safety responsi-bilities at EU level.
3. Environment: The US airlines may be subject to taxation of aviation fuel onroutes between Member States.
This agreement represents only a first step in the process of metallization of theEuropean and US sky. Both the EU and US agreed to engage a second phase ofnegotiations after May 2008 aimed at tackling the following issues: facilitating for-eign investments; fostering the development of liberalization. Indeed the deal leavesin place some key limitations:
1. Ownership and the control of the airlines. Foreign entities remain limited to own-ing no more than 25 percent of the voting shares in a US carrier—49 percent inan EU carrier—and foreigners can not exercise actual control on US carriers.
2. The US domestic market remains entirely closed to foreign airlines, and cabotagein the US remains prohibited under the ‘Fly America’ policy.
Most important of all, the US carriers will finally enter London Heathrow, the keygetaway airport in Europe for the US to full compete with the EU carriers.
2.4 Airline Business Models
The emerging forms of business models in the airline industry are presented in termsof how the carrier generates revenue, its product offering, value-added services,revenue sources, and target customers.

18 2 Characteristics of the Airline Industry
The deregulation and new competitive interactions between firms always resultin some adjustment of the player’s own business model to that of the competitor.
Three main sets of airline business models that will be described in the nextsections are:
1. Full-service carrier or FSC2. Low-cost carrier or LCC3. Charter carrier or CC
2.4.1 Full-Service Carriers
A full-service carrier (FSC) is defined in this study as an airline company developedfrom the former state-owned flag carrier, through the market deregulation process,into an airline company with the following elements describing its business model:
• Core business: Passenger, Cargo, Maintenance.• Hub-and-spoke network: This has as its major objective the full coverage of as
many demand categories as possible (in terms of city-pairs6) through the opti-mization of connectivity in the hub. This item will be presented in-depth, inSect. 2.4.
• Global player: Domestic, international and intercontinental markets are coveredwith short-, medium- and long-haul flights from the hubs to almost every conti-nent.
• Alliances development: No individual airline has developed a truly global net-work. Thus the network is virtually enlarged by interlining with partner carriersand become part of multi-HS systems.
• Vertical product differentiation: This is affected through in-flight and ground ser-vice, electronic services (Internet check-in) and travel rules to cover all possiblemarket segments.
• Customer relationship management (CRM): Every FSC has a loyalty program toretain the most frequent flyers. The frequent flyers programs (FFP) have becamepart of a broader strategy called CRM. The general purpose of CRM7 is to enablecarriers to better manage their customers through the introduction of reliableprocesses and procedures for interacting with those customers. The final aim ofthe CRM is to enhance the passenger’s buying and travelling experience in order
6 Airlines’ demand can be divided into: primary need, or the need for a passenger to travel fromA (origin) to B (destination) and back at a certain time on a certain day. The use of the ‘city-pair market’ or ‘O&D market’ derives from this reason; and secondary need or the preference fora certain airline, compared in terms of product quality, brand, and pre-and post-sales customerservices, etc.7 The term CRM is used to describe either the software or the whole business strategy orientedto customer needs. The main misconception of CRM is that it is only software, but actually it isthe whole business strategy. Major areas of CRM focus on automated service processes, personalinformation gathering and processing, and self-service. It attempts to integrate and automate thevarious customer-serving processes within a company.

2.4 Airline Business Models 19
to personalize the carriers’ services. In this perspective, the CRM is an extra toolto differentiate the airline product.
• Yield management and pricing: To support product differentiation, pricing andyield management is sophisticated, with the aim of maximizing the network rev-enues. This item will be presented in-depth in Sect. 2.6.1.
• Multi-channel sales: Sales channels are divided into indirect off-line (interme-diate travel agencies) or indirect on-line (web intermediate electronic-agents);direct on-line: the passenger buys the tickets directly via the airline’s Internetsite8; direct off-line: the passenger buys the tickets directly via the airline’s callcentre, the airlines city office (CTO), or the airline’s airport office (ATO). TheFSC cover all of these channels.
• Distribution system: The complexity of the distribution system described aboveis technologically supported by external companies called Global Distribu-tion Systems (GDSs). Among the most diffused GDSs are: Galileo, Amadeus,WorldSpan, Sabre.
2.4.2 Low-Cost Carriers
The concept of ‘low-cost carriers’ or LCC originated in the United States withSouthwest Airlines at the beginning of the 1970s. In Europe, the Southwest modelwas copied in 1991, when the Irish company Ryanair, previously a traditional car-rier, transformed itself into an LCC and was followed by other LCCs in the UK (e.g.easyJet in 1995). In the literature, there are several similar definitions of an LCC,also known as a low fare or no-frills airline (see Appendix II for a complete listof LCC existing in Europe). In this study an LCC is defined as an airline companydesigned to have a competitive advantage in terms of costs over an FSC.9 In orderto achieve this advantage, an LCC relies on a simplified business model (comparedwith the FSC), a model which is characterized by some or all of the following keyelements:
• Core business: This is passenger air-service despite the ancillary offers areincreasing and becoming part of the LCC core business.
• Point-to-point network: The network is developed from one or a few airports,called ‘bases’, from which the carrier starts operating routes to the main destina-tions. Destinations are only continental within the EU or the US. No connectionsare provided at the airport bases, which function as aircraft logistics and mainte-nance bases.
• Secondary airports: City-pairs are connected mainly from the secondary or eventertiary airports—such as London Luton—that are less expensive in terms oflanding tax and handling fee and experience less congestion than the larger ones,
8 Some authors have analyzed the e-commerce market in the airline industry (see Roy andFiliatrault, 1998; Nyshadham, 2000; Jarach, 2002).9 Riley (2003) defines the LCC as an airline that ‘. . . aims to keep operating costs significantlylower than the traditional flag-carrying airlines. . . ’ [p. 16].

20 2 Characteristics of the Airline Industry
such as London Heathrow. Small airports will strive to gain the LCC’ operationand the usual way is to reduce airport charges. Similarly, air transport activitygenerates welfare that is a multiple of the airports’ activities, inducing regionaleconomic and social development. Local authorities recognize that the LCC oper-ation is a potential driver for social and economic developments, and are willingto provide financial help (for example: tax exemption, marketing support whileLCCs start a new connection). The reduced airport fees can be understood as anincentive, as most of these secondary airports are public. These incentives can bequite relevant and can be deemed to contravene the EU’s competition rules.
• Single aircraft fleet: In general, the LCC operates with one type of aircraft suchas the Boeing 737 series with a configuration of 149 seats. The fleet compositionalso depends on the fact that they operate on only short- or medium-haul routes.
• Aircraft utilization: The aircraft is in the air, on average, more hours a day com-pared with FSCs that have to respect the connectivity schedule.
• No frills service: The product is not differentiated as they do not offer loungeservices at airports, choice of seats, and in-flight service, and they do not have afrequent flyer program. Fare restrictions are removed so that the tickets are notrefundable and there is no possibility to rebook with other airlines. This item willbe presented in-depth in Sect. 2.5.2.
• Minimized sales/reservation costs: All tickets are electronic and the distributionsystem is implemented via the Internet or telephone sales centre (only directchannels). Passengers receive an e-mail containing their travel details and con-firmation number, when they purchase. The LCC does not intermediate the salewith travel agents and nor does it outsource the distribution to GDS companies.
• Ancillary services: LCC increasingly have revenue sources other than ticketsales. Typical examples are commissions from hotels and car rental companies,credit card fees, (excess) luggage charges, in-flight food and beverages, adver-tising space. The potential growth of this revenue comes from telephone opera-tions and gambling on board. Mintel (2006) reported that Ryanair’s revenue fromsources other than ticket sales contributed e259 million to its 2005–06 net profitof e302 million. Those revenues already represent 16 percent of the carrier’stotal revenue. For easy Jet, that kind of income originally represented only 6.5percent of the airline’s total revenue, but it increased by 41.3 percent from 2004.
Not every low-cost airline implements all of the points mentioned above. For exam-ple, in 2005 Air Berlin started the UK domestic services as feeders to its Germanservices out of Stansted, exploring the hub-and-spoke operations.
The differences between the FSC and LCC business models are multifaceted(see, e.g., Alderighi et al., 2004). The significant structural cost gap between thetwo models results from these fundamental differences. Table 2.1 breaks down thecost gap between the FSC and the LCC business models. Overall, the LCC modelcan operate at 49 percent of FSC costs. In particular, 37 percent out of a total 51percent of costs difference can be attributed to explicit network and airport choices(or business place and process complexity); another 9 percent of the LCC costadvantage comes from the distribution system and commercial agreements (costswhich are narrowing with the elimination of commissions and GDS). A remarkably

2.4 Airline Business Models 21
Table 2.1 The LCC has 51% cost advantages in relation to the FSC (Source: Doganis, 2001)
Cost reduction Cost per seat
Full-service carrier 100%Low-cost carrier
Operating advantagesHigher seating density −16 84Higher aircraft utilization −2 82Lower flight and cabin crew costs −3 79Use cheaper secondary airports −4 75Outsourcing maintenance/single aircraft type −2 73
Product/service featuresMinimal station costs and outsourced handling −7 66No free in-flight catering, fewer passenger services −5 61
Differences in distributionNo agents or GDS commissions −6 55Reduced sales/reservation costs −3 52
Other advantagesSmaller administration and fewer staff/offices −3 49
Low-cost carrier compared with a full-service carrier 49%
small proportion (13 percent) of the cost differential is product/in-flight service-related. The relative simplicity or complexity of their business models distinguishesthe LCCs from the FSCs.
LCCs have successfully designed a focused, simple operating model around non-stop air travel to and from high-density markets. On the other hand, the FSC modelis cost-penalized by the synchronized hub operations (e.g. long aircraft turns, slackbuilt into schedules to increase connectivity) that implicitly accept the extra-timeneeded for passengers and baggage to make connections. In addition, the FSC busi-ness model relies upon highly sophisticated information systems and infrastructureto optimize its hubs. Franke (2004) stated that the most relevant success factors ofLCCs are their network configuration and their streamlined production processes inrelation to FSCs. This issue will be addressed in more depth in Chaps. 6 and 7.
2.4.3 Charter Carriers
A charter carrier (CC) is defined, in this study,10 as ‘an airline company that oper-ates flights outside normal schedules, by a hiring arrangement with a particularcustomer’.11 Charter flights have acquired the more specific meaning of a flightwhose only function is to transport holidaymakers to tourist destinations. However,
10 Studying the charter business model does not come within the scope of the study. However forthe sake of completeness, we have decided to include a concise description of this model here.11 The CCs are defined in contrast to scheduled flights even though they also operate to regularschedules (not always published).

22 2 Characteristics of the Airline Industry
tickets are not sold directly by the charter airline, but by tour operator companieswho have chartered the flight.
Although charter airlines typically carry passengers who have booked, individu-ally or as small groups to beach resorts, historic towns, or cities where a cruise shipis waiting for them, sometimes an aircraft is chartered by a single group, such asmembers of a company, a sports team, or the military. In general, charter flights aresold as part of a package holiday in which the price paid includes flights, accommo-dation and other services. In the past, this was a regulatory requirement. With theEU deregulation the ‘flight-only packages’ can now be sold only to those who wantto travel to the destination.
Most European charter airlines now form part of vertically-integrated organi-zations, incorporating a tour operator, travel agency chain, airline and, more oftenhotels and ground transportation companies. Some examples of vertically-integratedcharters are Britannia Gmbh, Condor, Air Jet, and Virgin Sun. Some FSCs have setup charter divisions: for example, KLM owns Martin Air or Lufthansa owns Condor.For a detailed description of the charter market, we refer to Doganis (1991).
Furthermore, CCs frequently operate from airports, or dedicated terminals, wherethere is no scheduled service. Much of the traffic through small- and medium-sizedairports in the United Kingdom consists of charter flights, and the survival of theseairports often depends on the airline landing fees they get from the charter com-panies. The economy of density pursued by CCs requires that the flights shouldoperate on the basis of near 100 percent seat occupancy, and the standard of seatingand service may be lower than on scheduled airlines. (But this is by no meansalways the case).
Mason et al. (2000) reveal that in 1997 the two largest LCCs in Europe, easyJetand Ryanair, had unit costs more than double those of the largest UK charter airlines.CCs were divided into the ones that form part of vertically-integrated tour operatinggroups and those that remain independent. The sources of cost advantage that thetwo types of charter airline have over the LCCs were analysed and identified as thefollowing:
• Larger aircraft and longer-haul destinations;• Higher load factor, aircraft utilization and labour productivity; and• Lower distribution costs, landing fees, aircraft leasing costs, and admin & finance
costs.
Williams (2001) provides a brief overview of the charter carrier business modeland its vertical integration in the EU. He addresses the question whether Europe’scharter carriers will be replaced by LCCs and his answer is negative.
2.5 Competition between Business Models
Competitive interactions between firms always result in adapting the player’s ownbusiness model to that of the competitors, and this is also occurring in the airlineindustry. The LCC sector continues to grow strongly, and as it does so the business

2.5 Competition between Business Models 23
Share of weekly seats in Europe
Low-cost carriers,18.40%
AEA carriers, 55.70%
Charter carriers, 25.90%
Share of weekly seats for LCCs in Europe
bmibaby Transavia
Jet2 Vueling SkyEurope
Hapag-Lloyd Express
others, 24%
Ryanair, 31%
easyJet, 26%
Air Berlin, 13%
Aerlingus, 6%
Fig. 2.1 Weekly seats supplied in Europe in summer 2006 (Source: European Parliament Study,2007)
model is refined and adapted. Figure 2.1 gives the weekly percentage share of seats,and refers to the supply of seats in Europe. The ‘other’ group corresponds essentiallyto the CC. Three companies (Ryanair, easyJet and Air Berlin) account for 75 percentof the LCC’s seats. Some LCCs have tried to avoid mutual competition. Ryanair, forinstance, focuses on smaller markets and regional airports, while easyJet is targetingbigger markets and primary airports.
The European LCC market continues to grow strongly: for example, Ryanair(+23 percent) and easyJet (+16 percent) in 2006. The flag carriers are slightly losingmarket share to the LCCs. The main question is whether the same growth rhythmand market share evolution will continue and whether those companies can keeptheir current cost structure. Indeed some inputs, such as fuel, labour cost and aircraftleasing, could become much more expensive, resulting in a slowdown in this growth.But also an explosive growth can become a threat to the low-cost philosophy, andgenerates higher wages and a more complex management structure. As an example,Air Berlin with the acquisition of dba in 2006 and the charter company LTU in 2007is growing with economies of scope, as LTU has rights over a considerable numberof valuable slots at congested airports (e.g. Dusseldorf).
Airbus and Boeing, the main aircraft manufacturers, have a huge list of ordersfrom airlines and this has changed their negotiating positions resulting in higherpurchase prices and lease costs for the carriers. The same cost increases for LCCapplies to pilots. Ryanair, for instance, is not longer charging pilots for their training.Finally, some airports are becoming congested, resulting in cost increases for theairlines. These developments may reduce the future competitive cost advantages ofLCCs compared with FSCs or CCs.
A study by Mintel (2006) has concluded that there are some signs that themarket has reached a certain level of maturity. Some of the signals are the poten-tially increasing competition from conventional carriers on city pairs. This isdemonstrated by, amongst other, Brussels Airlines’ price reaction to the entry ofeasyJet on the Brussels-Geneva route. With increased competition there is the

24 2 Characteristics of the Airline Industry
Table 2.2 LCCs consolidation and bankruptcies in Europe (Source: European Parliament Study,2007)
Year Airline Country Event
1999 AB Airlines UK BankruptcyColor Air Norway BankruptcyDebonair UK Bankruptcy
2002 GO UK Merger with Ryanair2003 Air Lib France Bankruptcy
Buzz UK Merger with RyanairGoodjet Sweden Bankruptcy
2004 Air Polinia Poland BankruptcyBasic Air Netherlands Re-branded in TransaviaDuo Airways UK BankruptcyGermaia Express Germany Merged with dbaFlying Finn Finland BankruptcyGetJet Poland BankruptcyJetgreen Ireland BankruptcySkynet Airlines UK BankruptcyV-Bird Netherlands BankruptcyVolareWeb Italy Bankruptcy
2005 Air Andalucia Spain BankruptcyEujet Ireland BankruptcyIntersky Austria BankruptcyMaersk Air Denmark Merged with Sterling
2006 Air Tourquoise France BankruptcyAir Wales UK BankruptcyBudget Air Ireland BankruptcyDba Germany Merged with Air BerlinFlywest France BankruptcyHiFly/Air Luxor Portugal BankruptcyMyTravelite UK Reintegrated into MyTravel AirwaysSnalskjusten Sweden Bankruptcy
2007 LTU Germany Merged with Air Berlin
possibility, as in any competitive market, of short-term excess capacity, and thenbankruptcies, mergers and takeovers can occur. Table 2.2 shows that for some air-lines (e.g. Air Berlin) the strong growth can partly be explained by the acquisitionof other airlines.
The CCs as well were confronted with a decreasing market share due to LCCcompetition. Some of them, such as Thomsonfly in the UK, introduced LCC char-acteristics into their business model. Both Air Berlin and Sterling Airways are alsogood examples of traditional CCs that re-branded into LCCs. Other charter compa-nies started to offer air-only tickets, besides their traditional holiday packages.
To compete with the LCCs, the FSCs implemented more strategies, the mainones are the following:

2.5 Competition between Business Models 25
Table 2.3 Examples of LCC subsidies created by FSC
Holding LCC subsidy
AirFrance-KLM TransaviaIberia ClickairSAS SnowflakeBmi Bmibaby
• Creation or acquisition of LCC subsidies in order to establish a multi-brand strat-egy and maintain a strict distinction between the products. Some examples ofsubsidy creation are listed in Table 2.3.
• Network rationalization by cutting the less profitable routes. For example,Lufthansa abandoned Berlin when Air Berlin became a dominant carrier, thesame happened for Swiss in Geneva with easyJet dominance.
• Reinvention of the business model into an LCC. Aer Lingus (2006) andMeridiana (2003) are two examples of network carriers that transformed them-selves into LCCs. Aer Lingus is the most significant example as it faced a majorchallenge to survive in the new environment after September 11, from its mainshort-haul competitor Ryanair. The reaction of the Board of Aer Lingus to thenew environment was the creation of a survival plan for the company which wasunveiled in 2001. Its main objectives were to create a more efficient businessmodel, implement a significant cost-reduction programme, reduce staff numbersby one-third, and radically change the way it does business. Aer Lingus had toimplement some low-cost principles and redefine itself as a quasi-LCC facing aprominent competitor, Ryanair. Willie Walsh, known as a miracle worker for theAer Lingus plan, is today the new chief executive of British Airways.
This evolution shows that most of the FSCs are continuously adjusting someimportant characteristics of their business models. The reaction is basically the samefor most of the European traditional carriers. In the markets where the competitionfrom LCCs is strong, traditional carriers are endeavouring to decrease their unit costin order to offer lower prices.
2.5.1 FSC Aiming for Higher Cost-Efficiency
The differences in operating costs between FSCs and LCCs are quite relevant. IATA(Economics Briefing No. 5, 2006) reported that in Europe these differences were40 percent versus easyJet and 64 percent versus Ryanair in 2004, while in the USAthere was a 36 percent cost gap in terms of operating costs per available seat kilome-tre (ASK) for the three largest US network airlines versus Southwest. The advantageof the LCCs in Europe reflects the premium service offered by the FSCs, and theuse of short-haul traffic to feed into long-haul networks, which enables the FSCs

26 2 Characteristics of the Airline Industry
Southwest
Valujet /AirTrain
Legacy carriers
JetBlue
1
2
3
4
5
6
7
8
1996 1997 1998 1999 2000 2001 2002 2003 2004
adjusted to an average stage length of 1400 km
cost
per
AS
K (
$ ce
nts)
−36%−36%
−45%
Fig. 2.2 Cost per ASK for US airlines, 1996–2004 (Source: IATA)
to derive higher average yields than the LCCs. Major restructuring among the USFSCs has seen the gap with Southwest Airlines narrow from 45 percent in 2001 to36 percent in 2004 (see Fig. 2.2).
Southwest Airlines shows a sable cost trend and the difference versus FSCs in2004 was the same as in 1996. JetBlue and AirTran have also managed to maintaina significant cost difference with the FSCs.
European FSCs have reduced their unit costs since 2001, especially on the salesand distribution side (see Fig. 2.3). However Ryanair, easyJet and Virgin Expresshave also managed to reduce costs to a similar or even greater magnitude. Whilethe larger LCCs continue to exert strong low-cost competition, it is not such a clearpicture for other smaller LCCs. The smaller LCCs (e.g. AirTran in the US, VirginExpress in Europe) have less of a cost gap compared with the FSC and have seen amore volatile movement in costs over time.
Cost restructuring should involve short-term cost reduction in order to con-serve cash and supply with constrained demand. The FSCs and CCs have alreadycut staff, deferred marketing expenses, reduced capacity, retired equipment earlyand cancelled plane deliveries. Those initial cuts will however, not be sufficient.Surviving companies will need to make longer-term adjustments, including restruc-turing their fleets, product reconfiguration, and renegotiation of labour agreements,some carriers have even sought bankruptcy protection as a means of resetting theircost structure (Delta and Northwest Airlines benefit from the so ‘Chap. 11’ legalconditions).

2.5 Competition between Business Models 27
Ryanair
Virgin Express
Legacy carriers
easyJet
2
4
6
8
10
12
14
1997 1998 1999 2000 2001 2002 2003 2004
adjusted to an average stage length of 800 km
cost
per
AS
K (
$ ce
nts)
−64%
−51%−40%−38%
Fig. 2.3 Cost per ASK for European airlines, 1997–2004 (Source: IATA)
2.5.2 The Rise in Fuel Prices
The emergence of LCCs empathize the need for many existing airlines to improvetheir cost efficiency. The sharp rise in oil and jet fuel prices since 2003 has addedgreater urgency to the need to cost cutting. The average crude oil price has increasedfrom $31 per barrel in 2003 to $60 per barrel in 2006 and an expected average of$106 per barrel in 2008 (see Fig. 2.4). The FSC has used a combination of strongerrevenue growth and higher efficiency gains to offset the large impact of higher fuelcosts. However, though the industry has made substantial improvements it still facesa degree of inefficiency to bear the actual oil price increase. Today in May 2008 thecrude oil price has reached levels $120, and analysts expect it to reach $ 200 in 2009.
Most airlines hedge their fuel costs. Fuel hedging is the practice of makingadvance purchases of fuel at a fixed price for future delivery to protect against theshock of anticipated rises in price. In this period of rising in oil prices, hedging is acrucial part of business for the most successful airlines as fuel is usually an airline’ssecond highest cost (after labor). All the major airlines have hedged fuel prices sincethe 1980s, but as the major carriers have run into financial difficulties in recent years,they have no longer had the cash to play the oil-futures market. Last year Delta heldpositions but was forced to sell them in a short-term cash crunch. Those hedgeswould have protected about a third of its fuel needs. Continental has no hedges in

28 2 Characteristics of the Airline Industry
0
20
40
60
80
100
120
140
1/2/
90
1/2/
91
1/2/
92
1/2/
93
1/2/
94
1/2/
95
1/2/
96
1/2/
97
1/2/
98
1/2/
99
1/2/
00
1/2/
01
1/2/
02
1/2/
03
1/2/
04
1/2/
05
1/2/
06
1/2/
07
1/2/
08
Daily Europe Brent Oil Price($ per barrel)
Fig. 2.4 Europe Brent Spot Price FOB - Dollars per Barrel. (Source: US Energy InformationAdministration)
oil-futures contracts this year. United Airlines, which filed for bankruptcy protectionin December 2002, has 30% of its fuel hedged at $45 per barrel.
Even the most successful airlines are likely to run into difficulties on the hedgingfront soon. With oil prices so high for so long, no investment bank is willing to cover$106 barrels of oil, no matter how much cash the airlines can provide. Thus, thechallenge for the coming years is to control energy costs, maintain the low airfaresthat consumers increasingly favor and not transfer entirely the jet fuel surcharges tothe final price.
LCC can be particularly vulnerable to the fuel price increase. They benefit from37% operational cost advantage on FSC, which comes from higher seat density.This advantage can vanish as the fuel price will impact more on their higher fleetutilization costs than the FSCs.
Small airlines and with small scale cost advantage are entering bankruptcy orstopped operating. Some bankrupted small companies in 2006–07 are: Western,Aloha Airways, Ata Airways, Skybus, Frontier, Eos, Big Sky Airlines, Cham-pion Air, Harmony Airways Nac Air in Usa and Canada: Euromanx, Silverjet, QuickAirways, Air Adriatic, Direct Fly, Coast Air, Fly Air in Europe: Adam Air, Oasisin Asia.
Andy Harrison, chief executive of EasyJet, said:Oil remains the biggest challenge and uncertainty.The FSC sector in Europe has gone through a consolidation. We may expect
that it is now the turn of the LCCs. In Europe there are some LCCs with goodprofit margins (esayJet, Ryanair, Air Berlin), and around three or four majors willconsolidate the others that can not face this emergency situation.

2.6 Airline Network 29
2.6 Airline Network
The network is a key strategic factor of airlines, as it is the main driver for gen-erating revenue and costs as well as a source of competitive strength or weakness.Gillen (2005) considers the network strategy to be an integral part of the airlinestrategy, and the network structure to be a function of demand side externalities anduncertainty, as well as supply-side network economics. Network economies havemainly been on the demand side, while in the airline networks they are viewed asbeing, for the most part, on the supply side. Network configuration is not just a costissue: a network strategy can confer revenue advantages as well.
The network structure ranges from fully-connected or point-to-point (PP) tohub-and-spoke (HS) to alliance (fully-contracted), or to a mix of these strategies.The forces leading to the choice of each strategy will be described in the followingsections and analyzed in Chaps. 6 and 7.
2.6.1 Network Economics
The US deregulation has resulted in the rise of the HS system by the FSCs and theincreased adoption of the PP system by the LCCs. In the EU this result has not beenwidely documented in the literature. Berechman and Shy (1996) have highlightedthree elements to explain the rise of the HS structure: firm costs; demand and entrydeterrence.
Network costs are driven by economy of scope, economy of density and routelength. Economies of scope arise when many travellers of different city-pair mar-kets are combined for at least part of their journey on a single aircraft. These areexploited by bundling traffic over one or more hubs of an HS or multi-HS system.Economies of density are derived from the aircraft size. Unit costs (seat-kilometrecosts) decrease with the aircraft size, but they do not necessarily have a linear rela-tionship (production scale). Economies of density are exploited if the network isdesigned in order to bundle small traffic flows onto routes that would otherwise sup-port smaller aircraft with higher seat-km costs. Caves et al. (1984) and Brueckneret al. (1992) provides empirical evidence of economy of density in airline network.Hendricks et al. (1995) show that economies of density can explain why the HSsystem is the optimal system. The key to this explanation lies in the level of den-sity economies. However, when they compare the HS with the PP system, theyfind that an HS network is preferred if the marginal costs are high and demandis low. But given fixed costs and intermediate values of variable costs, a PP systemis preferred.12
Route length affects the aircraft unit cost, which falls as route length increases.This holds since the fixed costs related to the flights are spread over a larger
12 Pels et al. (2000) explored the optimality of airlines networks using linear marginal cost func-tions and symmetric demand functions.

30 2 Characteristics of the Airline Industry
output, and the variable costs do not increase proportionally with distance (seeHolloway (2003). There are a few papers that model airline network competition.Among these, it is worth mentioning Oum et al. (1995), who present a network gamein which carriers investing in hubbing make a firm ‘tough’ in the multi-productmarket competition. The use of HS networks turns out to be a device for entrydeterrence. Another contribution to the analysis of network competition is givenby Adler (2001) who studies a two-stage duopoly competition where carriers firstchoose their hubs, the connections to spokes and the frequencies, and then theycompete both on direct and indirect routes. She finds that there are multiple equi-libria as well as no equilibrium, depending on the parameters. Other papers on thetopic include Hansen (1990), who studies hub competition in choosing the levelof frequencies, and Hong and Harker (1992), who mainly analyse the competitionfor slot allocation. Bhaumik (2002) investigated the welfare implications of carri-ers’ competition and the role of a regulator. Finally, Hendricks et al. (1997) analyseasymmetric duopoly competition where departure time is used as a crucial compet-itive variable.
2.6.2 Network Management
Carriers determine network supply through a process called network management.This process can be described in four steps (see Fig. 2.5; for a recent review ofnetwork management, see Holloway (2003).
1. Network strategy. This is the highest level of network decision with two to threeyears’ horizontal time ahead, including fleet development, financial targets andalliances for passage, cargo and maintenance production lines. The decision isbased on the current and forecasted situation in terms of traffic, air-politics, eco-nomics, and competitors’ development. Chin and Tay (2001), Smith (1997), andBruning and Hu (1988) focus on the profitability and investment decision toexpand the fleet of North American and Asian carriers.
• Hub–and-Spoke vs.
Point-to-Point
• Connectivity criteria
and bank structure
design
• Market development
• Financial and air-
political context
• Competition
• Target
• Fleet planning
• Forms
• Key partners
• Performance
analysis
• Connectivity optimization
• Crew rotation planning
• Fleet maintenance
• Spare capacity
• Punctuality optimization
• Baggage irregularity
Network strategy Network design Alliances Network planning
Fig. 2.5 Network Management phases

2.6 Airline Network 31
2. Network design. This is the translation of the network strategy into network con-figuration (HS or PP), connectivity, and hub developments. It includes long- andmedium-term fleet planning and supply issues such as frequency, aircraft rotationand hub waves design.
3. Alliances. The network can be broadened by incorporating the departures ofalliances partners in order to increase the offer to the customers. No airline has—or it is likely to develop—a truly global network. Dennis (2000) considers thescheduling issues that particularly affect alliances including multiple-hub opera-tions, other interfaces between routes, airport slot and terminal allocations, andthe through-working of aircraft.Chang and Williams (2002) and Janic 1997) investigate the relation between theliberalization, alliance, and performance of the airlines. The reasons behind thedevelopments of alliances will be presented in Sect. 2.6.
4. Network planning. This refers to short-term adjustments of schedules and pro-duction planning on a day-to-day basis, which takes place every semester. Thoseinclude action to optimize connection time at the hub, ad-hoc changes of theaircraft size, crew planning, punctuality and baggage irregularity. This processfollows the short-term demand fluctuation and competitor moves. Crises such asSeptember 11 or the SARS epidemic have affected the network planning of theEuropean carriers. Chapters 3 and 4 are dedicated to analyzing how the carrier’snetwork planning has functioned to react to the global crises.
2.6.3 Network Definitions
There is no unique or even widely-used definition of what exactly constitutes an HSor a PP network, instead a number of definitions coexist. From a network designperspective, the HS or PP network can be described by using a simple network offour nodes. Figure 2.6 depicts two ways of connecting the nodes: on the right, thenodes are fully connected through point-to-point relations, while, on the left, thereis a hub-and-spoke relation. Airport H is the hub through which the other airportsare connected. Note from the Fig. 2.6 that it takes three routes to connect all thenodes in the HS system, whereas this takes six routes in the PP network. Gener-alizing the example, given n airports, the possible number of city-pair combina-tions is n(n− 1)/2. Hence, the pure PP system requires n(n− 1)/2 routes to coverall combinations, whereas the HS system allows carriers to cover the same airportcombinations with only (n−1) routes.
From an air traffic management perspective, Reynolds-Feighan (2001) identifiedthe HS configuration of a carrier when there is a high concentration level of airtraffic in both space and time. Burghouwt and de Wit (2003) explain the spatial con-figuration by the levels of concentration of an airline network around one or a fewcentral hubs. This definition was adopted in many geographical network analysesand measured by the Herfindal index (McShan, 1986), or by Gini index or Theil’sentropy index (Reynolds-Feighan, 1998). Temporal configuration is related to the

32 2 Characteristics of the Airline Industry
Point-to-pointHub-and-spoke
BA
CC
BA
HH
Point-to-pointHub-and-spoke
BA
CC
BA
HH
Fig. 2.6 A scheme of point-to-point and hub-and-spoke configurations
easyJetKLM
Fig. 2.7 The hub-and-spoke network of KLM in Europe versus the ‘almost-fully-connected’(point-to-point) network of easyjet (Source: OAG, November 2004)
airline’s flight schedule. Bootsma (1997) defines the temporal configuration as ‘thenumber or quality of indirect connections offered by an airline or alliance by adopt-ing a wave-system structure in the flight schedule. A wave-system structure consistsof a number of connection waves, which are a complex of incoming and outgoingflights, structured such that all incoming flights connect to all outgoing flights [. . . ]’Bootsma (1997, p. 53).
In contrast, a network is PP-structured when traffic flows are temporally and spa-tially dispersed. However, the development of a PP network originates from one orfew airports, called bases, from which the carrier starts operating routes to the maindestinations. The number of routes may increase, but hardly ever reaches the idealPP configuration where all the airports are connected to each other. The reasonsfor this strategy are economic and air-political. Not all the city-pairs have enoughdemand volume to justify the operation of profitable flights, or there may be difficul-ties for carriers to obtain slots at all airports, and finally, logistic costs of fleet rota-tion may make it convenient for the airlines to develop operational bases. Figure 2.7provides an example of real HS versus PP configurations.

2.7 Pricing and ‘Yield’ Management 33
2.7 Pricing and ‘Yield’ Management
Air-travel demand is characterized by factors such as high fluctuations, consumerheterogeneity, and uncertainty about the traveller’s departure date or even the ulti-mate destination of the journey. On the other side, airline supply is limited by air-craft capacity and has a very perishable nature, i.e. the unsold seats cannot be reusedafter the flight has departed. Thus the process of pricing and inventory control (allo-cation of aircraft seats) is among one of the most complex ones faced by the modernairlines.
Over the past years, a set of techniques to allocate limited and highly perishableresources among differentiated consumers have been adopted by carriers. Thesetechniques are known as ‘yield management’,13 also known as revenue manage-ment or revenue enhancement. Lieberman (1991), defines yield management asa ‘systematic approach to applying pricing and inventory controls to the sale ofa perishable asset’. The goal of yield management is to maximize the operatingrevenue in such a complex market environment. In this definition there are threekeywords: (a) differentiated customers, (b) limited and perishable resources, and(c) revenue maximization. Customers are not homogeneous in travel behaviour andin willingness-to-pay, thus carriers can segment the demand and differentiate theirproduct to fulfil the demand. The second and the third item can be explained jointly.Once the perishable output is produced (availability of seats), costs can be consid-ered sunk costs, and therefore the yield maximization problem coincides with profitmaximization.14
2.7.1 The FSC Yield Management
We call FSC yield management the set of techniques that are usually adopted by theFSC. A recent review of research in yield management as well as a taxonomy of theFSC revenue management is given by Weatherford and Bodily (1992) or Gallegoand van Ryzin (1997). Weatherford and Bodily identify 14 descriptors that can beused to set the yield management problems. Our description is organized in termsof seven simple principles:
(a) Market segmentation. Travellers do not have homogeneous behaviour anddemand can be segmented. The demand for business travel is concentrated onflights at the start and end of working days of the week. Business travellersbook later than leisure travellers and need to change travel arrangements atshort notice. Some of the segmentation key variables are: the purpose of travel(business or leisure); the purchase timing (early bookings or last-minute book-ings); and the purchase location (country of purchase, Internet, travel agent or
13 For a review of different yield management techniques, we refer to Weatherford andBodily (1992).14 This explains why it is called revenue or yield management and not profit management.

34 2 Characteristics of the Airline Industry
airport ticket office). Further segmentation can be created through distributionchannels; specialist markets such as marine, missionary, ethnic and students,are sold tickets through dedicated agents.
(b) Product differentiation. To respond to the market segmentation, airlines dif-ferentiate the supplied quality by adding extra services to the basic transport.Those are typically in-flight services, ground services (food and entertainment,fast check-in, VIP waiting lounges, etc.) and fences (see c below).
(c) Booking classes and fences. In order to ensure that any segment of passengerspurchases its required levels of quality, the carriers apply fences. Product fencesare rules that regulate the ticketing purchase and the conditions imposed oneach traveller category. In general, the fences are known to the passenger as thetravel rules and conditions included in the tickets. Some examples are: ticketcancellation or travel date change penalties, purchase time limits, or minimumnumber of days to stay at the travel destination (see Table 2.4). Air productsare offered to the market through the aircraft reservation classes.15 One or moreairfares are applicable to each class of reservation.
(d) Price setting. The purpose of travel and the passenger’s personal characteris-tics influence their willingness to pay, their price elasticity, and their qualitydemand. Leisure travellers may be very price-elastic, and businessmen may bemore time-sensitive and less price-elastic (see Fig. 2.8). Airfare levels are setaccording to the different willingness-to-pay and product quality desired by thetravellers. The theoretical literature shows that the use of booking classes and
Table 2.4 KLM travel conditions from the Netherlands to Europe in 2005 (Source: www.klm.com)
Product Bookingclasses
Conditions (fences)
Minimum stay Changes Cancellations Combinations
TAKE OFFSuper-deal fare
E, N, T, L, K 3 nights or oneSaturday night
No No No
OVERNIGHTattractive andflexible fare
B, S 1 night Yes at e 25 Yes at e 75 with SameDay ReturnFare and/orSelect Fare
SAME DAYRETURNEconomy classsame day returnfare
X None Yes at e 25 Yes at e 75 withOvernightFare and/orSelect Fare
SELECTcomfort andease fare
Z, C, J None Yes Yes withOvernightFare andSame DayReturn Fare
15 Carriers label classes with capital letters. For example, the booking classes of KLM are: J, C, I,Z for business cabin and X, S, B, M, H, K, L, Q, T, V for economy cabin.

2.7 Pricing and ‘Yield’ Management 35
a
b
c
d
m
fg h
kil
n q
Business cabin
a
b
c
d
Booking classesbusiness
BusinessDemand
Volume
Price
m
fg h
kil
n q
EconomyDemand
Economy cabin
Booking classes economy
Business cabin
Fig. 2.8 Demand curves for economy and business product and the use of booking classes to pricediscriminate the passengers
fences allows carriers to price discriminate (see Fig. 2.8). Dana (1998) showedthat carriers use those restrictions to screen consumers when their demand isheterogeneous and uncertain. Although even those restrictions have some effecton air carriers’ costs, they constitute major discriminatory tools used by airlines.Two theoretical studies have addressed the connection between price discrimi-nation and market concentration in the airline market: Dana (1998) showed thatprice discrimination by air carriers could be observed even if market concen-tration is low and a carrier has no market power; and Gale and Holmes (1993)proved that, under certain conditions, a monopoly airline will offer tickets withrestrictions so that they will be selected by the consumer with a high valuationof time. Both studies pointed out that carriers use fences to price discrimi-nate. Empirical studies of the airline market show that, as market concentra-tion increases, so does the average price level (Borenstein, 1992; Morrison andWinston, 1990). Borenstein and Rose (1994), in their seminal paper on pricedispersion in the airline market, found a negative effect of market concentrationon price dispersion.
(e) Forecasting and inventory control. By having discrete fare classes, the yieldmanagement system has to face the problem of forecasting the demand andthen allocating the right number of seats to each class in order to optimize therevenue. This activity is called inventory control, and it is usually implementedfor all flights operating between any combinations of city-pairs of the networkup to one year into the future. The approach is to forecast and protect enoughseats for high yielding demand and then leave other seats progressively avail-able for lower fares. The seat availabilities are set to obtain that particular mixof business in each class which will maximize the expected revenue. In short

36 2 Characteristics of the Airline Industry
the yield management problem is to get the best mix from a portfolio of fareswith different values and risks attached. The problem is solved by optimizationalgorithms, which depend on forecasts of demand for each booking class. Theseforecasts are based on large databases recording the complete booking historyof each booking class per flight, per day over several years.
(f) Overbooking, no-shows and go-shows. Because of the possibility of no-shows(a passenger who books a seat but does not show-up at the departure time)and go-shows (a passenger who has a valid ticket without a reservation butjust shows up at the departure time), most airlines accept reservations in excessof capacity. This may result in flights being overbooked and the possibility ofrefusing seats to ticketed passengers (denied boarding). The overbooking levelis set equal to the difference between the forecasted no-shows and go-shows.When demand exceeds capacity, customers are serviced by other airlines orgiven compensations (nearby hotel, free taxi, etc.). The problem is to determinethe pricing and the overbooking policy, that maximize the expected revenue.In the absence of a proper overbooking policy the unpredicted no-shows meansthat the flight departs with empty seats. For a more detailed analysis of thistopic, we refer to Gallego and van Ryzin (1997), who developed a dynamic,stochastic yield management model including the overbooking policy.
(g) Distribution. From a yield management perspective, the airline product is thecombination of a route connecting point A to point B of the network, rules andtravel conditions, and seat allocation, which is all sold for a certain airfare. Thedistribution system should display the product’s characteristics and its actualavailability (seat availability) for each origin and destination and booking class.Therefore, inventory control and the distribution system must be linked. Themodern GDS (global distribution system) is able to support the different air-lines’ own inventory control.
The airlines price setting will be extensively analysed in Chap. 5 where a theo-retical model of airline price competition with product differentiation and consumerheterogeneity is developed and empirically tested.
2.7.2 The LCC Yield Management
The LCC yield management differs radically from traditional yield management. Itis based on the concept that there is a latent large-price sensitive market, which willtravel (or travel by plane) only at a low enough price.
(a) No-explicit market segmentation. There is no explicit segmentation or, at least,the segmentation is only applied through time of booking and choice of flight.The passenger who wishes to pay lower prices must book early or on the flightsfor which there is less demand.
(b) No-product differentiation. The product is not differentiated and the fences areremoved: no Sunday rule, date limits, changes fee, and so on. This means thatone-way pricing is possible with the outbound and inbound journey being priced

2.7 Pricing and ‘Yield’ Management 37
separately but fully combinable. Those factors make the inventory control ofLCCs from a technical perspective simpler to manage than FSCs.
(c) Price versus demand is a continuum function. The key factor in being able tooffer low fares is to have low operating costs. However, the LCC fare setting iscounter to the traditional model. LCCs modify the selling price of each flight asa function of the departure date. If a price is too low, the flight will fill up earlyand higher-yielding late-booking business will be turned away. On the contrary,if the price is too high, the flight is at risk of departing with empty seats.
(d) Booking classes. Each flight only has one price available at any point in timeand not as many booking classes as the FSC.
(e) Internet distribution. The passengers purchase via the Internet and have thetransparency to compare prices as a function of date or time of departure. Thosewho are more price-sensitive can choose the lower demand flights.
The problem is therefore much simpler than that of the FSCs. The idea is that thedemand will be such that on busier flights a premium fare can still be applied.Indeed, it is often observable that LCCs are actually more expensive than their FSCcompetitors. At the same time, on other flights the lower prices ensure a reason-able load factor. Solving this problem requires an understanding of the relationshipbetween the demand and the price. Thus, the traditional approach of booking-classmix has turned into a price optimization problem. Prices are no longer fixed butdynamic and adjusted to reflect demand at one point in time. This can be achievedby plotting the optimal path thought the price/demand graph as in Fig. 2.9. The
Nu
mb
er o
f se
ats
sold
Price too high and seats wasted
Price too low and high yield late bookings turn away Optimal price?
10
B
A
Aircraft capacity
Days to departure40 030 2050
Fig. 2.9 Optimal and sub-optimal booking patterns up to the day of departure (Source:Fletcher (2003))

38 2 Characteristics of the Airline Industry
difficulty with this approach is that the price elasticity can change throughout theperiod before the flight departure as the mix of travellers can change.
To summarize, the LCC yield management is much simpler than the conventionalapproach of the FSC. Instead of forecasting the different segments of demand andtrying to achieve the best booking-class mix, the alternative is to create demandby low fares and use the pressure of the created extra demand to fill the flightand increase the yield (price optimization).
2.8 Airline Alliances
The emergence of the international alliances occurred after the market deregula-tion. The alliances affect the major activities of the carriers depending on the typeand level of alliance. Networks could be integrated into different forms by incor-porating the departures/arrivals of a partner carrier. The major objective is to addas many destinations as possible by accessing the connection system of the part-ners. The reasons for creating the alliances are air-political, i.e. the airline has notraffic rights and is precluded from controlling a foreign carrier that has this right;economical, e.g. its costs or fleet are unsuitable for that market; infrastructural, e.g.slots are not available; or financial-related, e.g. the airline has insufficient resourcesto develop new markets. Pels (2001) analysed the benefit for both airlines and cus-tomers to enter alliances. For an airline, the benefits are the same as adopting a hub-and spoke network: cost factors, demand factors and entry deterrence. By enteringinto an alliance, a carrier can increase market densities and reduce fixed costs in themarkets with, for example, a code-sharing agreement. From the customer’s perspec-tive, Pels states that the major sources of the potential increase in consumer surplusare: the network effect; increased densities on different links; and joint pricing ofcomplementary links. Park and Zhang (2000) find that consumer surplus tends toincrease if an alliance is a complementary alliance, but it decreases if the allianceis parallel (collusive) in nature. A recent paper of Zhang (2005) examines the com-petition models for three types of strategic alliances: vertical, horizontal and hybridalliances. The authors define vertical alliances when two firms link up their comple-mentary products. This form of alliance confers a strategic advantage by allowingthe partners to commit credibly to grater outputs, and the strategic effects arisingfrom the elimination of the double-marginalization problem in vertical integration.The horizontal alliances reduce competition not only in the market where prior com-petition between the partners takes place, but also in the other markets of the alliancenetwork. The hybrid alliance is a mix of vertical and horizontal alliances and it islikely to have both pro- and anti-competitive effects.
From the airline perspective, network complementary amongst partners is clearlyone key factor in creating an alliance. This stimulates the creation of multi-hubsystems to capture traffic flows from a secondary or tertiary airport behind onehub to a secondary or tertiary airport behind another hub. Dennis (2000) consid-ers the scheduling issues that particularly affect alliances including: multiple-hub

2.8 Airline Alliances 39
Company
Routesin ‘JointVenture’
Level of integration
Coordination
Integrated units
Managerial
codesharing,pricing, etc.
Merger of shares(one bottom-line)
Full merger
Air France-KLM
Economic benefits
KLM-Northwest
SkyTeam alliance, Air France-Delta
Fig. 2.10 Different forms of alliances (Source: KLM, (2005))
operations; other interfaces between routes; airport slot and terminal allocations;and the through-working of aircraft. The idea behind alliances is the outsourcingof capacity supply when the use of the carrier’s aircraft is not possible. The typesof outsourcing most adopted are: the code-sharing agreements; the blocked-spaceagreement; franchising and/or leasing agreements; and joint venture service. For acomplete description of these agreements, we refer to Holloway (2003).
Figure 2.10 shows different forms of alliances plotted according to the increasedeconomies of scale and scope levels that can be reached. Coordination alliances arethe first levels of cooperation among partners, usually in terms of schedules, code-sharing, pricing and frequent flyer programmes. Examples of coordination alliancesare presented in Table 2.5 and the global network created by Star alliance is dis-played in Fig. 2.11.
Airlines can integrate part of the network or company unit. An example is thejoint venture of KLM and Northwest Airlines for the routes between the US and theNetherlands. A joint service requires that one of the carriers undertakes the revenuemanagement activities for both carriers. Inventory on the joint service is jointlypriced and promoted. In this case, the partners are not competing against each other.Joint services generally require either a revenue sharing agreement (based on somelevel of assumed costs attributed to the operating partner) or a cost-and-revenuesharing agreement. A specific joint revenue management unit has been establishedin the KLM headquarters in Amsterdam to manage these joint routes for bothcarriers.
Before the market deregulation, national institutions and regulation were againstmergers and takeovers, constituting international barriers that lead to the formationof alliances. Recently, both in the US and the EU, these barriers are being reducedand alliances are evolving in company merging. Brueckner and Spiller (1994), and

40 2 Characteristics of the Airline Industry
Table 2.5 Major airline alliance groups in 2008
Aer Lingus Aeroflot—Russian Airlines Air CanadaAmerican Airlines China Southern Airlines Air ChinaBritish Airways Aeromexico Air New ZealandCathay Pacific Air France—KLM ANAFinnair Alitalia Asiana AirlinesIberia CSA Czech Airlines AustrianLAN Chile Continental Airlines BMIQantas Delta Air Lines LOT Polish AirlinesJapan Airlines Korean Air LufthansaMalev Hungarian Airlines Northwest Airlines SASRoyal Jordanian Airlines Air Europa Singapore Airlines
Copa Airlines Shanghai AirlinesKenya Airways South African Airways
SpanairSwissThai Airways InternationalTAP PortugalTurkish AirlinesUnitedUS Airways
Fig. 2.11 The global network of Star Alliance in 2006 (Source: OAG)

2.9 Mergers and Acquisitions; Three Mega-Carriers in Europe? 41
Keeler and Formby (1994) demonstrated the cost incentives for airline consolida-tion. On the revenue side, the stronger market presence of the merged networks maytranslate into higher fares (Morrison, 1996).
In 2004, KLM and Air France created the first-cross border merger in Europe.A new group, called Air France-KLM, controls 100 percent of the two former oper-ational airlines, which so far remain operationally independent. Apart from AirFrance-KLM, a new consolidation in the EU is taking place between Lufthansa andSwiss or in the US between American West and US Airways. Carlton et al. (1980)developed a methodology for estimating consumer’ benefits resulting from a mergerin the US. They indicated that airline mergers may confer substantial consumer ben-efits in the form of superior service (single carriers in place of multiple-carriers).
2.9 Mergers and Acquisitions; Three Mega-Carriers in Europe?
Cost efficiency can also be achieved by mergers or acquisitions (M&A). This con-solidation phase has started mainly in Europe between the FSCs but also betweenLCCs, and it could reshape the national carriers’ scope and increase competitionbetween US, EU and Asian carriers. Indeed, consolidation can yield three majorbenefits to airlines.
First, operational synergies can provide opportunities for cost rationalization,from scale benefits in procurement, sales, maintenance, and airport operations tosharing overheads and information technology systems. Secondly, network syner-gies can reduce costs and improve asset utilization by eliminating of redundantroutes. Increased revenues can be generated through pricing harmonization achiev-able thanks to the increased market share and improved load factors. Third, con-solidation can improve carriers’ competitive positions by providing a platform forgrowth, greater negotiation power with partners, and benefits from improved capitalmanagement. Therefore, consolidation would usually provide the greatest scope forvalue creation.
The acquisition of KLM Royal Dutch Airlines by Air France in 2004, has shownits rivals what can be achieved with greater economy of scale in the highly frag-mented industry. After integrating its two networks and hubs, Air France–KLM SAhas reached a growing portion of European market share, particularly among high-paying business travellers on long-haul flights. Lufthansa followed in 2005 with thesmaller acquisition of Swiss International Air Lines. The success of that deal hasmade Lufthansa open to the possibility of further acquisition, as its executives havedeclared. Iberia declared itself to be open to a potential acquisition and receiveda proposal from British Airways which already owns 10 percent of Iberia. BritishAirways could face further competitive pressure from Lufthansa. Scandinavian Air-lines System planned to sell its 20 percent share in British Midland Airways (bmi).Lufthansa already owns 30 percent shares of bmi and it will most probably becomethe client of SAS to reach 50 percent ownership of bmi. Lufthansa could gain market

42 2 Characteristics of the Airline Industry
Table 2.6 Largest network airlines in EU by share of ASK and speculation about mergers
% ASK in 2004 in 2006 Mega-carriers (?)
British Airways 20.4 Air France—KLM 22.5 Lufthansa SwissSAS AustrianVirgin Atlantic
31.2
Lufthansa 17.8 Lufthansa—Swiss 20.6 Air France KLMAlitalia
27.4
AirFrance 14.9 British Airways 20.4 British AirwaysIberia
27.2
KLM 7.6 Alitalia 4.9 Other 14.2Iberia 6.8 Virgin Atlantic 4.0Alitalia 4.9 SAS 3.8Virgin Atlantic 4.0 Austrian 2.8SAS 3.8 Other 21.0Swiss 2.8Austrian 2.8Other 14.2
Source: OAG(2004) and own elaboration.
shares by buying a large stake in Virgin Atlantic Airways Ltd. Singapore Airlines islooking for a buyer of its 49 percent stake in Virgin Atlantic.
Table 2.6 illustrates that British Airways, Lufthansa and Air France are the prin-cipal FSCs in the EU market (the data exclude the LCCs). These three carriers areresponsible for over half the ASK and over 40 percent of weekly flights operatedby the EU network airlines. If KLM’s operation is added to that of its owner, AirFrance, or Swiss’s operation is added to that of Lufthansa, then 63.5 percent ofASK are performed by the top three carriers. The rest of the EU’s airlines offermuch smaller shares of capacity.
In the coming year, a series of deals could result that may even leave the Europeanairlines industry built around the region’s three biggest carriers: British AirwaysPLC, Deutsche Lufthansa AG and Air France-KLM SA.
This could put the European FSC, even more in competition with US carriersthat have expanded their international network in recent years to escape from com-petition from the LCCs in the US domestic market.
2.10 Conclusions
In this chapter we have provided a brief description of the airline industry in termsof new airline business models and a comparison of their main characteristics. Theprocess of deregulation and the subsequent process of privatization have inducedimportant changes in the strategy of the airlines. At least three new business modelscan be identified: full-service carriers (FSCs), low-cost carriers (LCCs), and chartercarriers (CCs).

2.10 Conclusions 43
The FSC model developed from the former state-owned flag carrier model,through the market deregulation process, into a new airline company with a hub-and-spoke network or, through international alliances, multi-hub-and-spokes sys-tems. Sophisticated yield management techniques were adopted in order to controlthe aircraft availability and to provide an even more differentiated product. The LCCbusiness model has experienced fast growth in Europe after the deregulation. LCCshave successfully designed a focused, simple operating model around a point-to-point, no-frills product. They did not suffer as much as the FSCs from the crisis inthe air transport industry after September 11, thanks to the low fare levels which stillcontinue to attract many passengers and the diversion away from sensitive regions(North America and Asia) towards intra-European flights.
Nowadays, FSCs and LCCs often compete on the same routes and for coincidentsegments, while the LCCs’ performance indicators are in general higher than thoseof FSCs. The conclusions of this chapter are threefold:
1. LCCs can provide some important cost lessons for FSCs. There are still largecost differences between FSC and LCCs both in EU end US, though the natureof the gap can differ between the US and the EU. For example, there is less ofa difference in infrastructure costs in the US than, in other regions, with lessopportunity for LCCs to concentrate on secondary airports. The size and spreadof the cost gap highlights that there are several areas, from distribution to aircraftutilization, where the network airlines can move closer to an LCC approach inorder to lower costs.
2. Greater Cost Efficiency is already being achieved by FSCs. US and EuropeanFSCs have managed to make progress in lower their unit costs (and particu-larly non-fuel unit costs) since 2001. A reduction in distribution and overheadcosts has been the main driver. Cost efficiency is also being achieved by mergeror acquisitions (M&A). The acquisition of KLM Royal Dutch Airlines by AirFrance in 2004 has shown its rivals what can be achieved with greater economyof scales in the highly fragmented industry.
3. The Hub-and-Spoke model can, however, also provide some competitiveadvantages. The higher product quality that can be offered by FSCs (e.g. com-fort, more convenient airports, personal rewards through loyalty schemes) canbe used to attract customers willing-to-pay a premium for the additional service.FSCs do still have advantages within their own business model by for distanceusing multiple aircraft types to adjust capacity to prevailing demand condi-tions on different routes. In addition, the airline network itself provides severaladvantages over LCCs on many routes. For example, over half of all Europeanlong-haul traffic originates from short-haul traffic on feeder routes, thus, FSCscan benefit from a higher level of economy of scope.
In the remainder of this study, first, in Part II, we analyse how the FSCs haveconducted themselves and reacted to the September 11 and the SARS crises in view

44 2 Characteristics of the Airline Industry
of their short-term network planning and long-term network strategy. Then, in PartIII, the competition between LCCs and FSCs is addressed in terms of both networkand pricing. The price reaction of the FSCs to the entry of the LCCs, is analysed the-oretically and tested empirically in relation to the revenue management strategies.Finally, the differences between, and the coexistence of, different FSC and LCCnetwork designs are discussed and measured empirically.