preferred citation style - eth zarchiv.ivt.ethz.ch/vpl/publications/presentations/v214.pdf · 1...
TRANSCRIPT
1
Preferred citation style
Axhausen, K.W. (2007) Spatial patterns of social networks and social contacts, Kolloquium Geographische Informationswissenschaft, Universität Zürich, Zürich, April 2008.
Spatial patterns of social networks and social contacts
KW Axhausen
IVTETHZürich
April 2008
3
Acknowledgments
Collaborators: • Andreas Frei, ETH Zürich• Timo Ohnmacht, HSW Luzern
• Jonas Larsen and John Urry, Lancaster University
Funders: • BBW, Bern• ifmo, Berlin
• UK Department for Transport, London
4
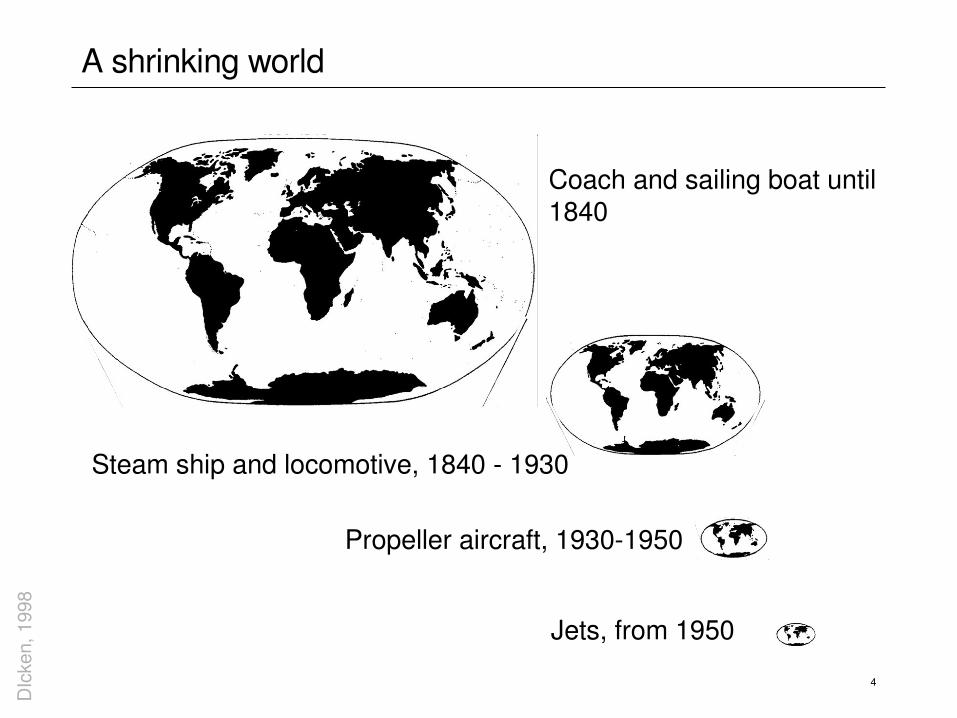
A shrinking world
Coach and sailing boat until 1840
Steam ship and locomotive, 1840 1930
Propeller aircraft, 19301950
Jets, from 1950
DIc
ken,
199
8
5
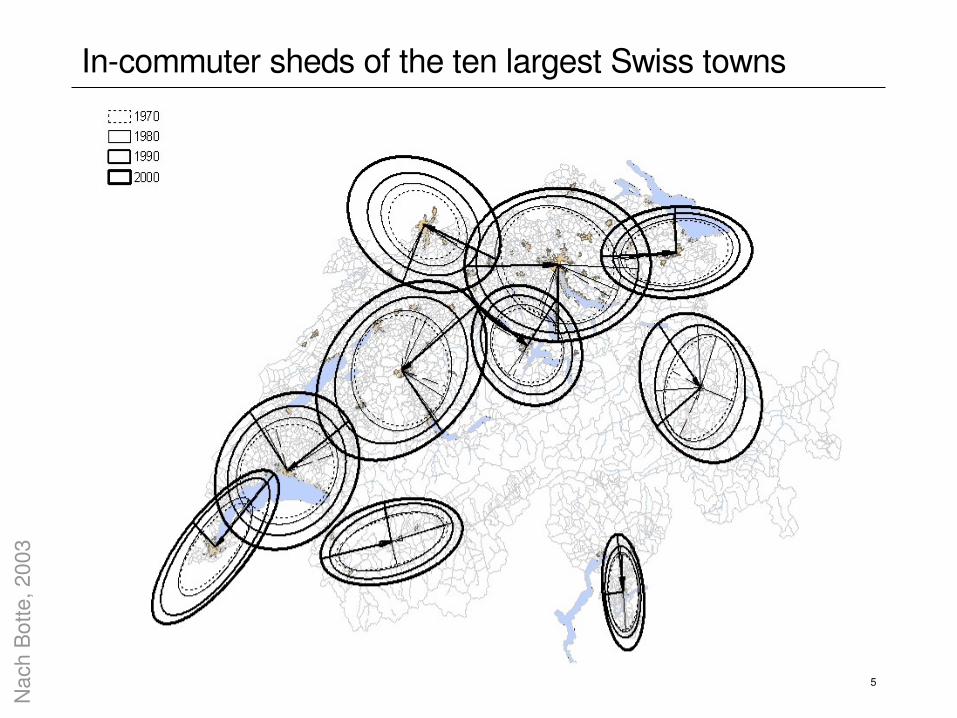
Incommuter sheds of the ten largest Swiss townsN
ach
Bot
te, 2
003
6
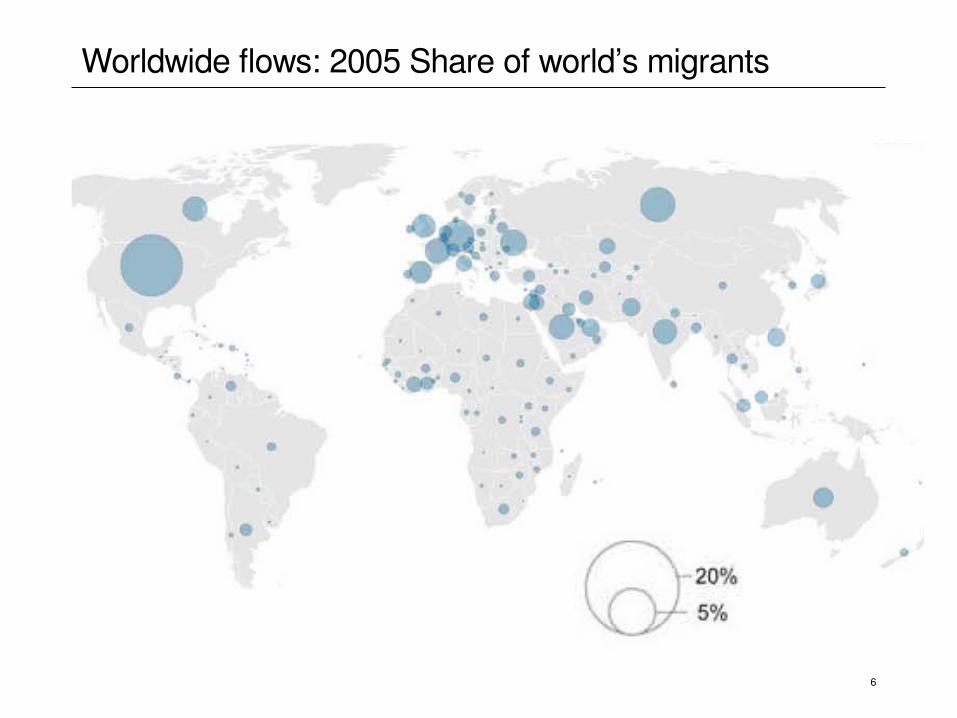
Worldwide flows: 2005 Share of world’s migrants
7
How to explain travel ?
• Distribution of activities• Distribution of land uses
• Generalised costs on the available infrastructure• Generalised costs of the activity (time, money, social
content)
• Budget constraints • Capability constraints
8
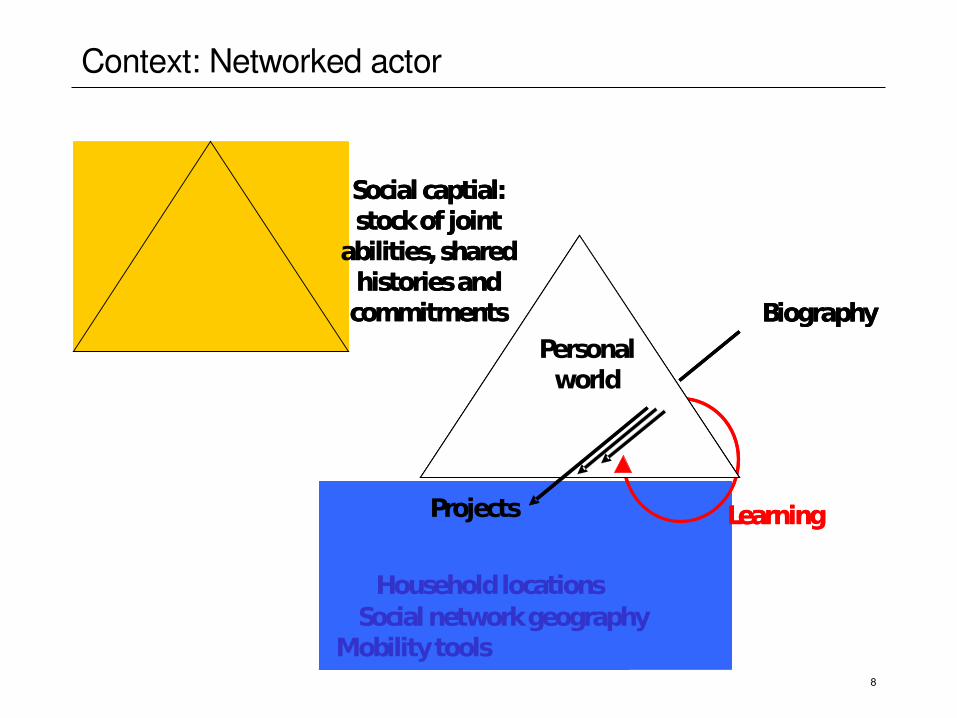
Context: Networked actor
Personalworld
Biography
Projects Learning
Personalworlds ofothers
Social captial: stock of joint
abilities, sharedhistories and commitments
Household locationsSocial network geography
Mobility tools
Personalworld
Personalworld
Biography
Projects Learning
Personalworlds ofothers
Social captial: stock of joint
abilities, sharedhistories and commitments
Household locationsSocial network geography
Mobility tools
9
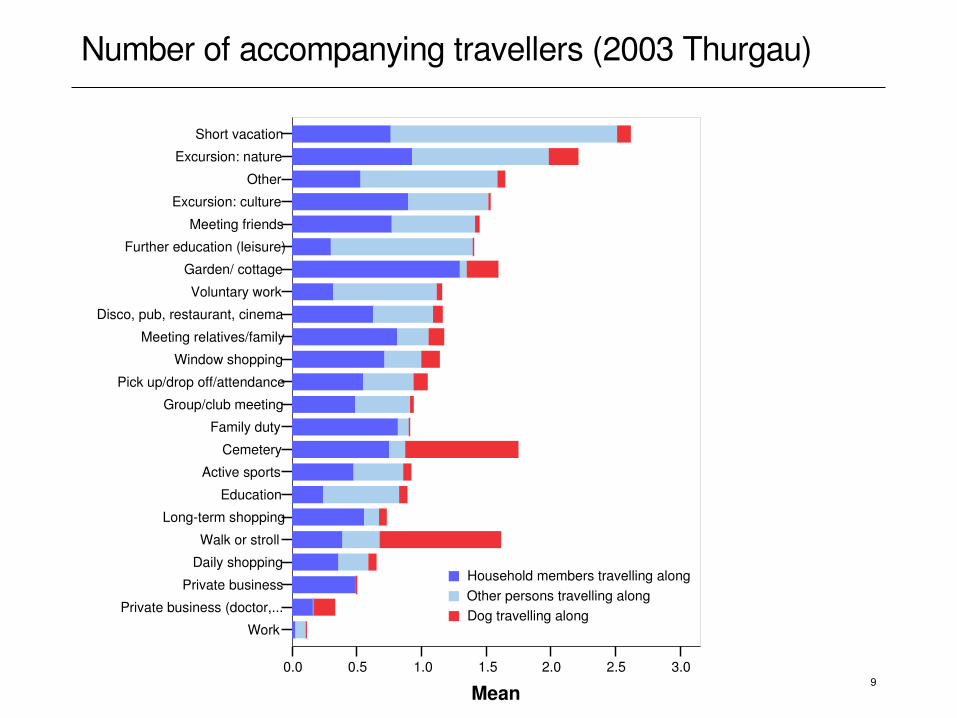
Short vacation
Excursion: nature
Other
Excursion: culture
Meeting friends
Further education (leisure)
Garden/ cottage
Voluntary work
Disco, pub, restaurant, cinema
Meeting relatives/family
Window shopping
Pick up/drop off/attendance
Group/club meeting
Family duty
Cemetery
Active sports
Education
Longterm shopping
Walk or stroll
Daily shopping
Private business
Private business (doctor,...
Work
3.02.52.01.51.00.50.0
Mean
Dog travelling alongOther persons travelling alongHousehold members travelling along
Number of accompanying travellers (2003 Thurgau)
10
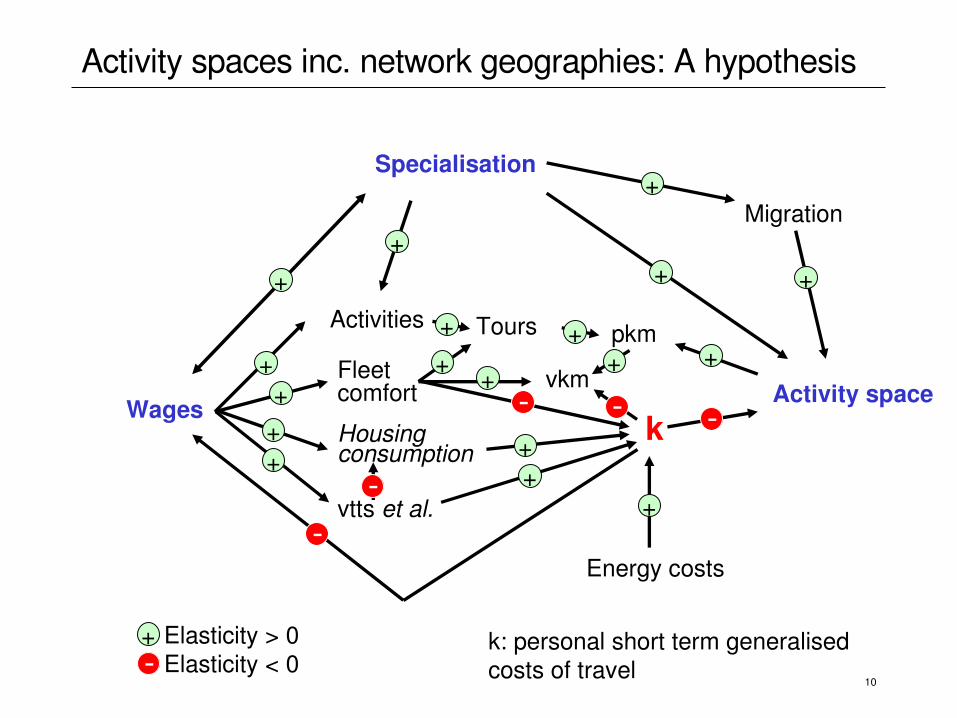
Activity spaces inc. network geographies: A hypothesis
Wages
Fleetcomfort
Housingconsumption
vtts et al.
Activities
Specialisation
Activity spacek
vkm
pkmTours ++
+
++
++
++
++
+
+
+
Energy costs
+
+
Elasticity > 0 Elasticity < 0
k: personal short term generalisedcosts of travel
+
Migration+
+
11
Travel and social networks
Maintenance of the networks requires:
• Face to face interaction• Balanced by other forms of interaction
• Travel ~ Physical spread of the contacts
• Tradeoff between loosing contacts and “social” capital and investing in new contacts closer to home
12
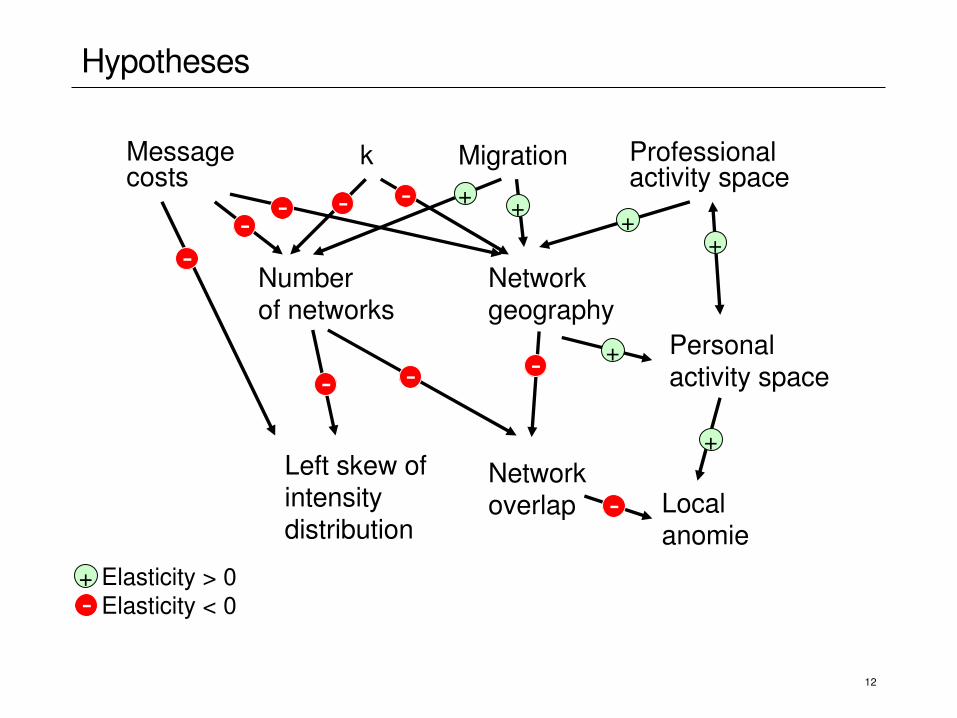
Hypotheses
Professionalactivity space
MigrationkMessagecosts
Numberof networks
Networkgeography
Networkoverlap
Left skew ofintensity distribution
Personal activity space
Local anomie
+
Elasticity > 0 Elasticity < 0
+ + ++
+
+
13
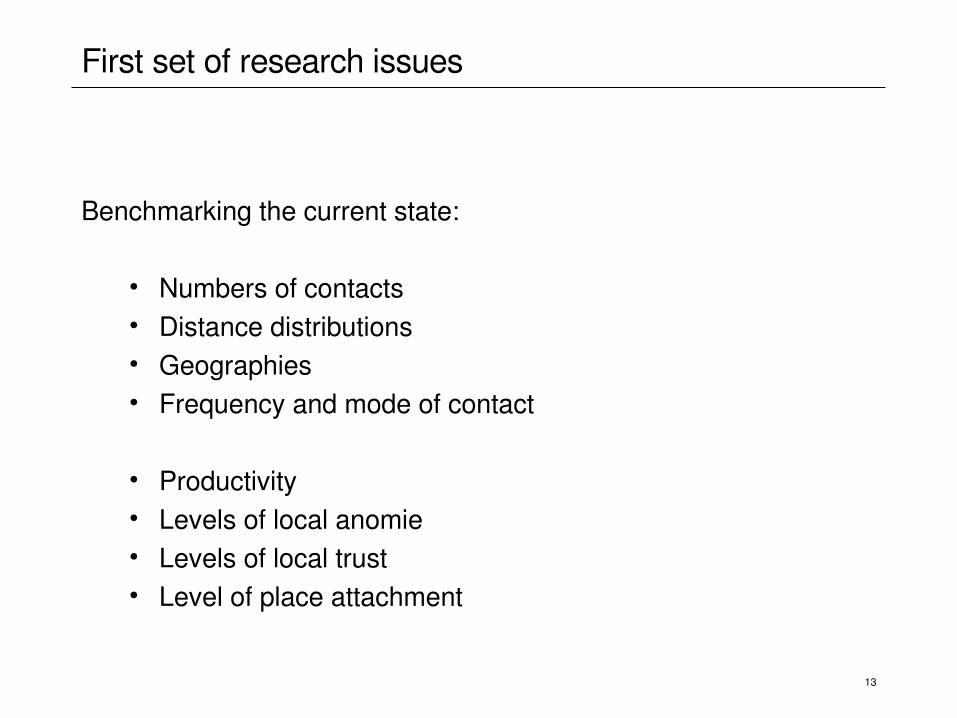
First set of research issues
Benchmarking the current state:
• Numbers of contacts• Distance distributions• Geographies• Frequency and mode of contact
• Productivity• Levels of local anomie• Levels of local trust• Level of place attachment
14
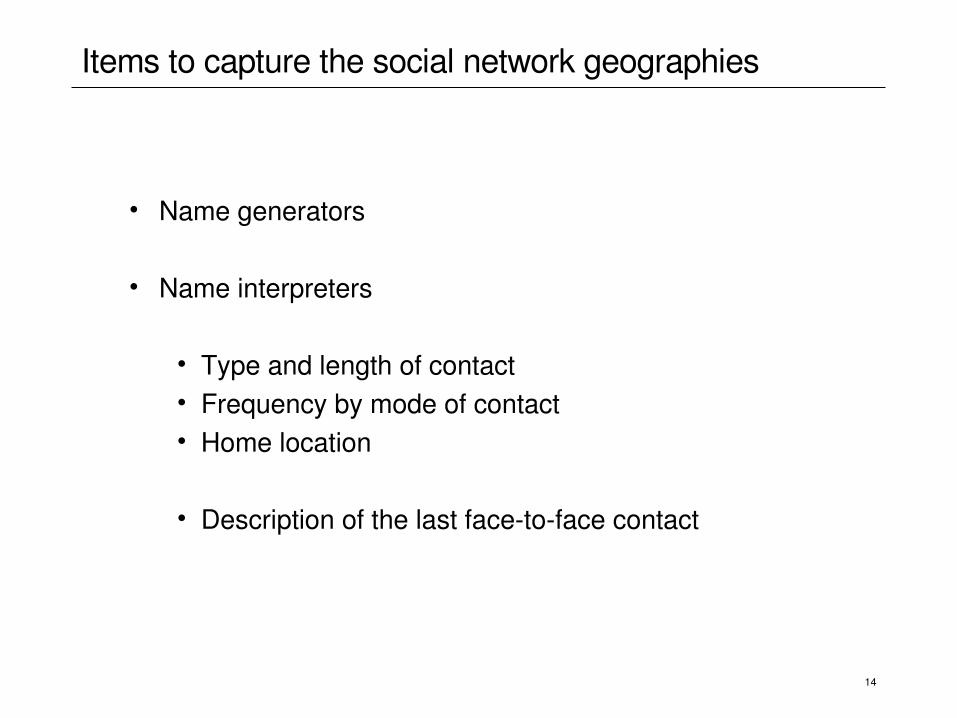
Items to capture the social network geographies
• Name generators
• Name interpreters
• Type and length of contact• Frequency by mode of contact• Home location
• Description of the last facetoface contact
15
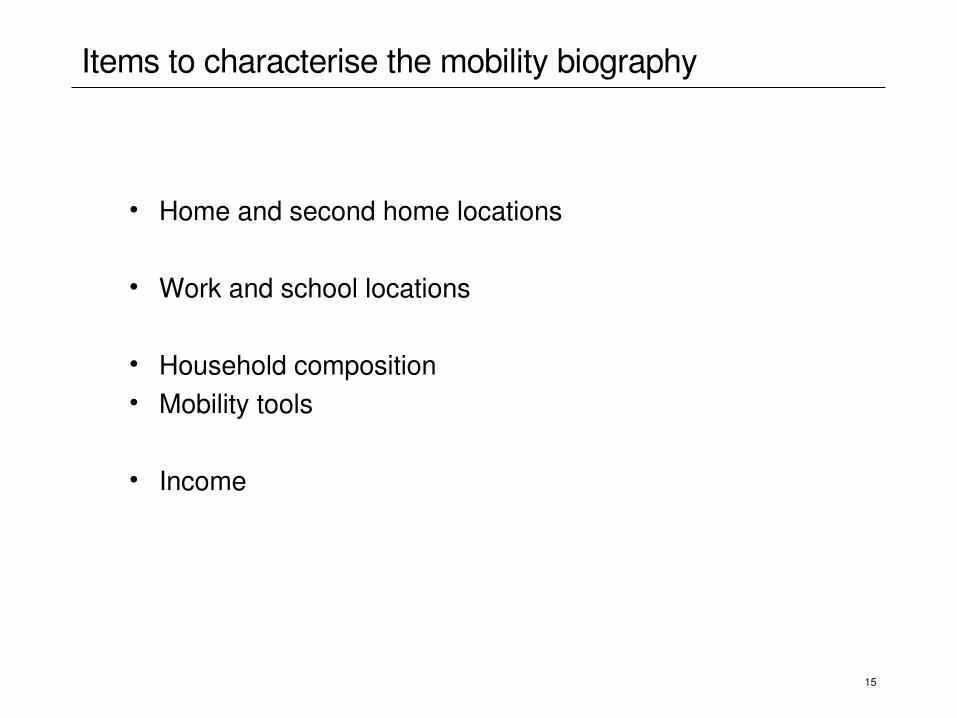
Items to characterise the mobility biography
• Home and second home locations
• Work and school locations
• Household composition• Mobility tools
• Income
16
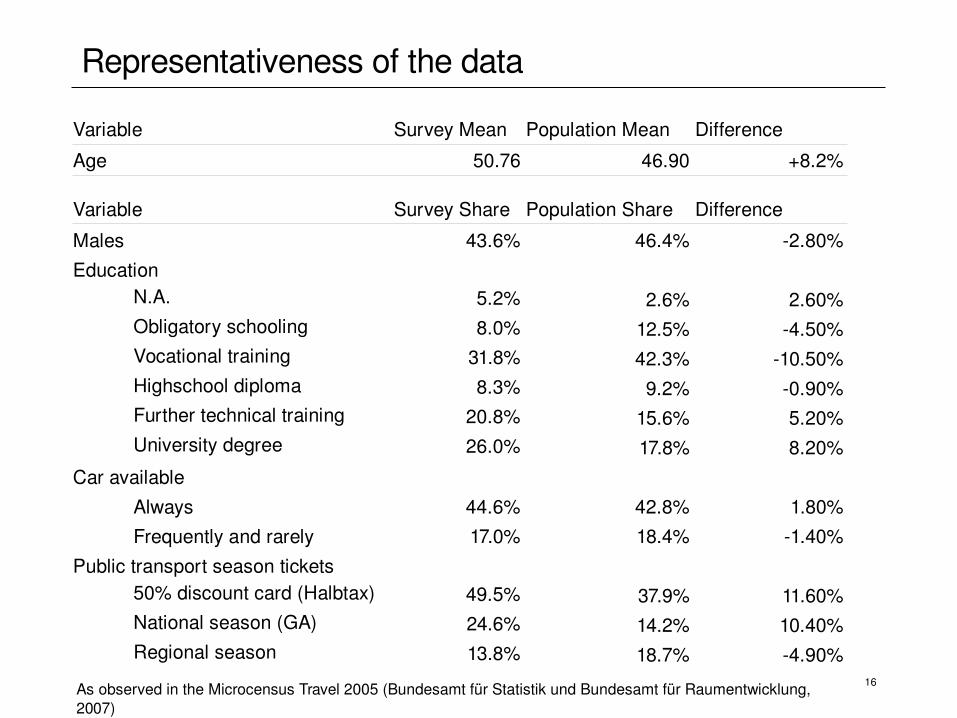
Representativeness of the data
Variable Survey Mean Population Mean Difference
Age 50.76 46.90 +8.2%
Variable Survey Share Population Share Difference
Males 43.6% 46.4% 2.80%Education
N.A. 5.2% 2.6% 2.60%Obligatory schooling 8.0% 12.5% 4.50%Vocational training 31.8% 42.3% 10.50%Highschool diploma 8.3% 9.2% 0.90%Further technical training 20.8% 15.6% 5.20%University degree 26.0% 17.8% 8.20%
Car available
Always 44.6% 42.8% 1.80%Frequently and rarely 17.0% 18.4% 1.40%
Public transport season tickets50% discount card (Halbtax) 49.5% 37.9% 11.60%National season (GA) 24.6% 14.2% 10.40%Regional season 13.8% 18.7% 4.90%
As observed in the Microcensus Travel 2005 (Bundesamt für Statistik und Bundesamt für Raumentwicklung,2007)
17
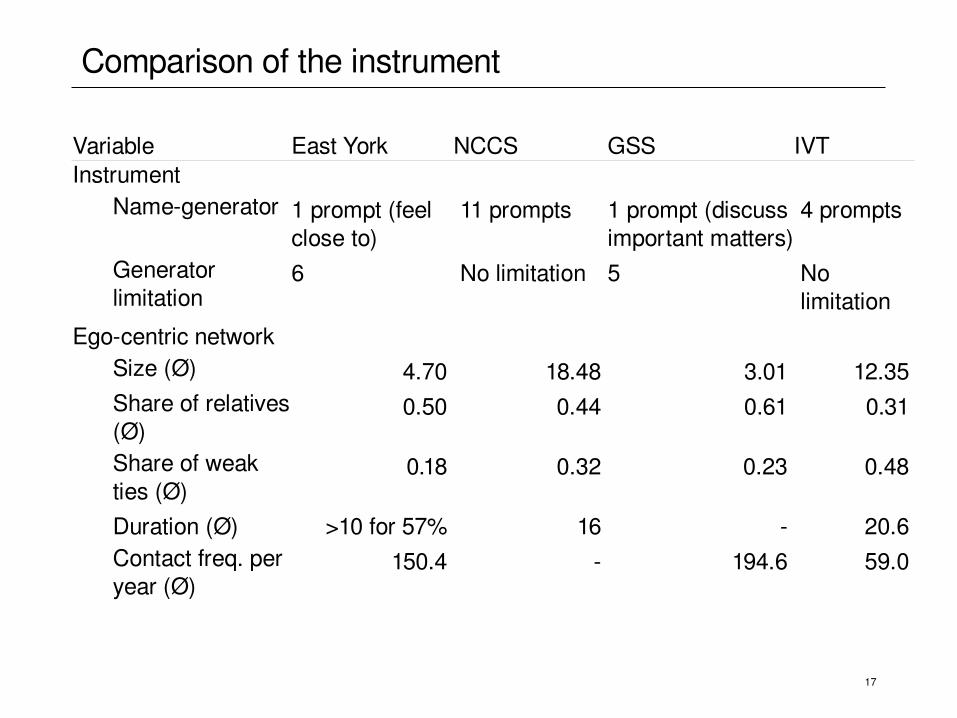
Comparison of the instrument
Variable East York NCCS GSS IVTInstrument
Namegenerator 1 prompt (feelclose to)
11 prompts 1 prompt (discussimportant matters)
4 prompts
Generatorlimitation
6 No limitation 5 Nolimitation
Egocentric networkSize (Ø) 4.70 18.48 3.01 12.35Share of relatives(Ø)
0.50 0.44 0.61 0.31
Share of weakties (Ø)
0.18 0.32 0.23 0.48
Duration (Ø) >10 for 57% 16 20.6Contact freq. peryear (Ø)
150.4 194.6 59.0
18
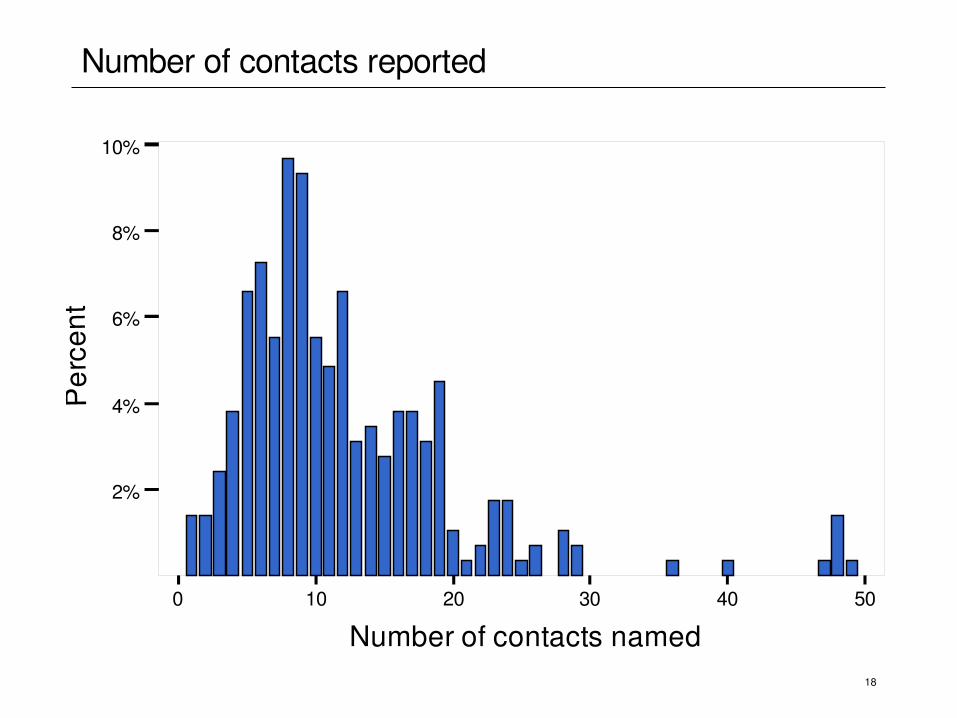
Number of contacts reported
Bars show percents
0 10 20 30 40 50
Number of contacts named
2%
4%
6%
8%
10%
Per
cent
19
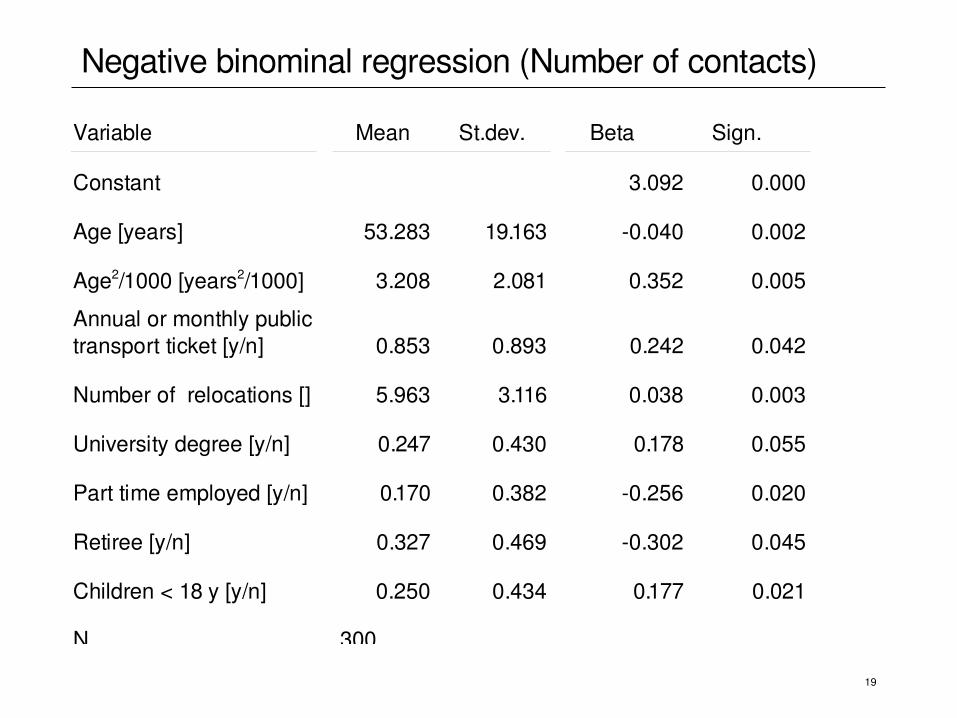
Negative binominal regression (Number of contacts)
Variable Mean St.dev. Beta Sign.
Constant 3.092 0.000
Age [years] 53.283 19.163 0.040 0.002
Age2/1000 [years2/1000] 3.208 2.081 0.352 0.005
Annual or monthly publictransport ticket [y/n] 0.853 0.893 0.242 0.042
Number of relocations [] 5.963 3.116 0.038 0.003
University degree [y/n] 0.247 0.430 0.178 0.055
Part time employed [y/n] 0.170 0.382 0.256 0.020
Retiree [y/n] 0.327 0.469 0.302 0.045
Children < 18 y [y/n] 0.250 0.434 0.177 0.021
N 300
20
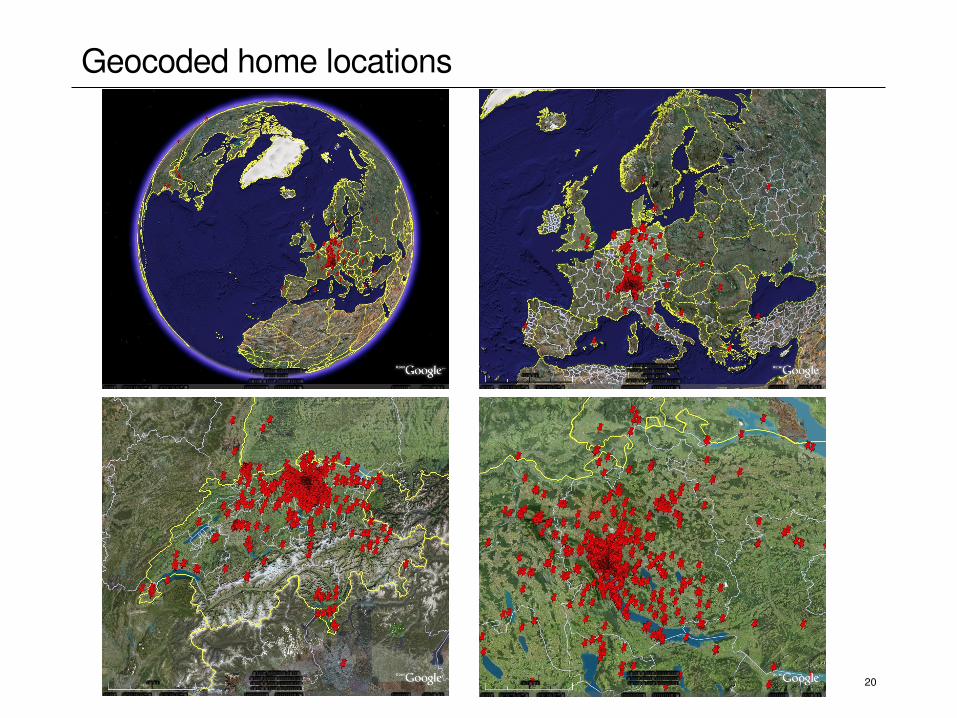
Geocoded home locations
21
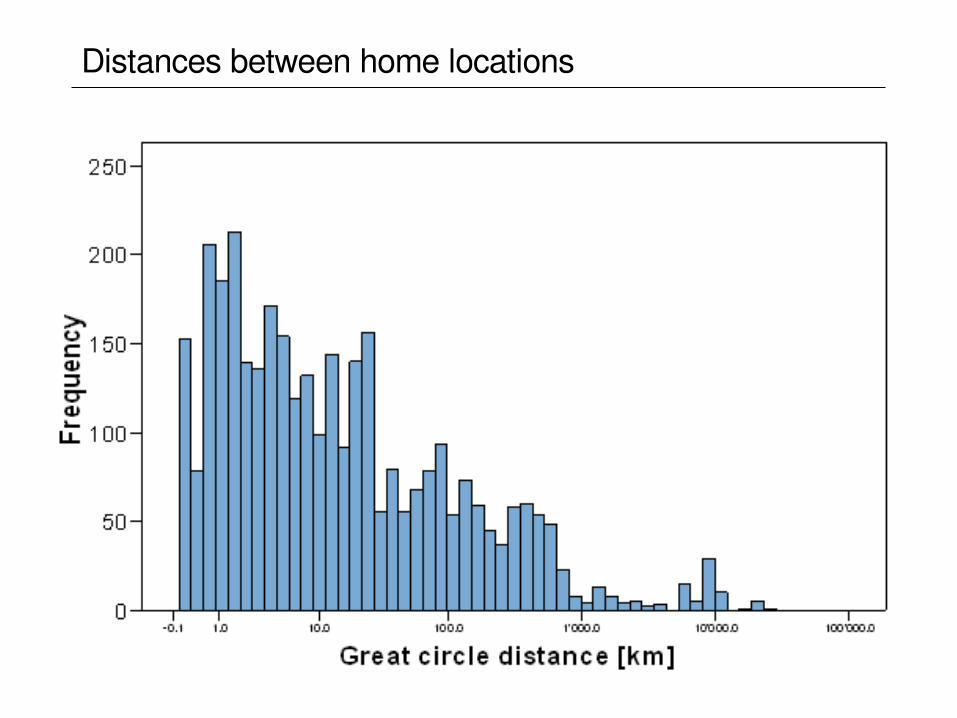
Distances between home locations
22
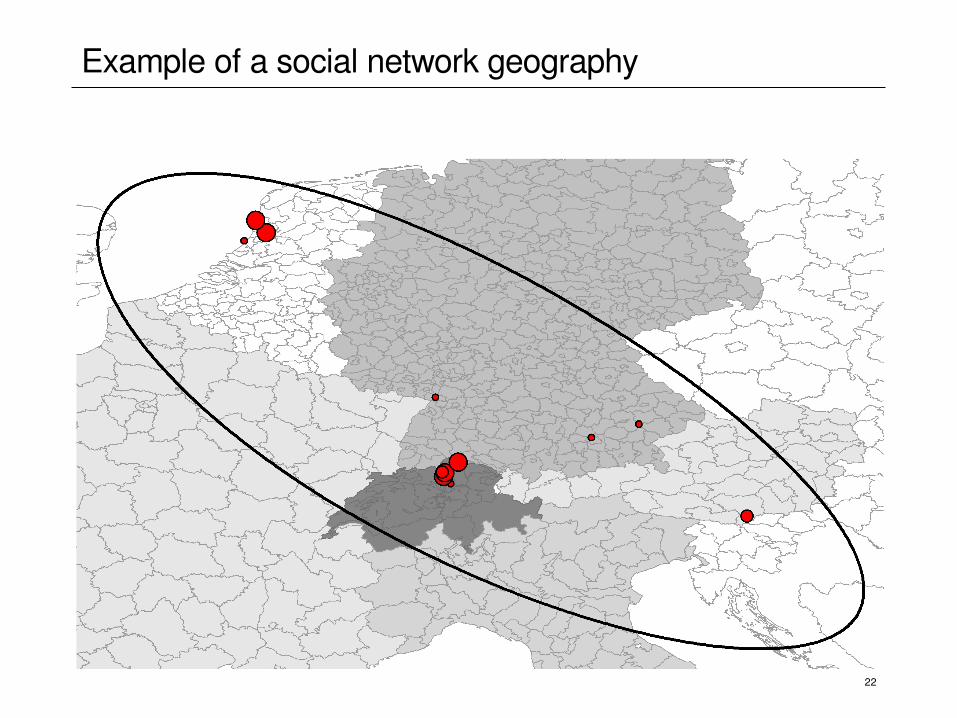
Example of a social network geography
23
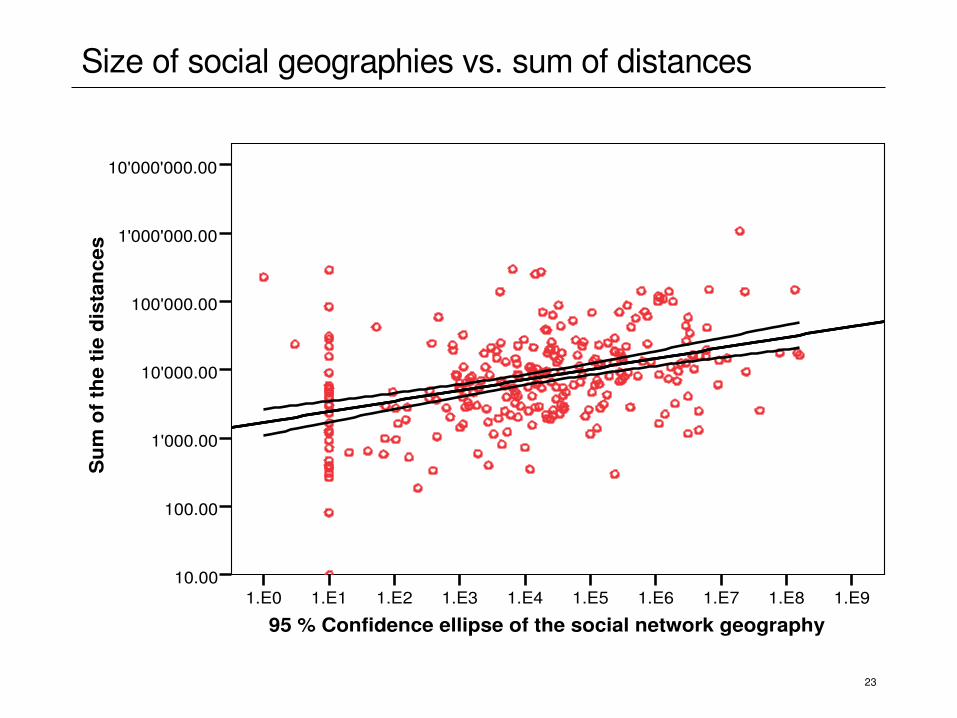
Size of social geographies vs. sum of distances
95 % Confidence ellipse of the social network geography1.E91.E81.E71.E61.E51.E41.E31.E21.E11.E0
Su
m o
f th
e ti
e d
ista
nce
s
10'000'000.00
1'000'000.00
100'000.00
10'000.00
1'000.00
100.00
10.00
24
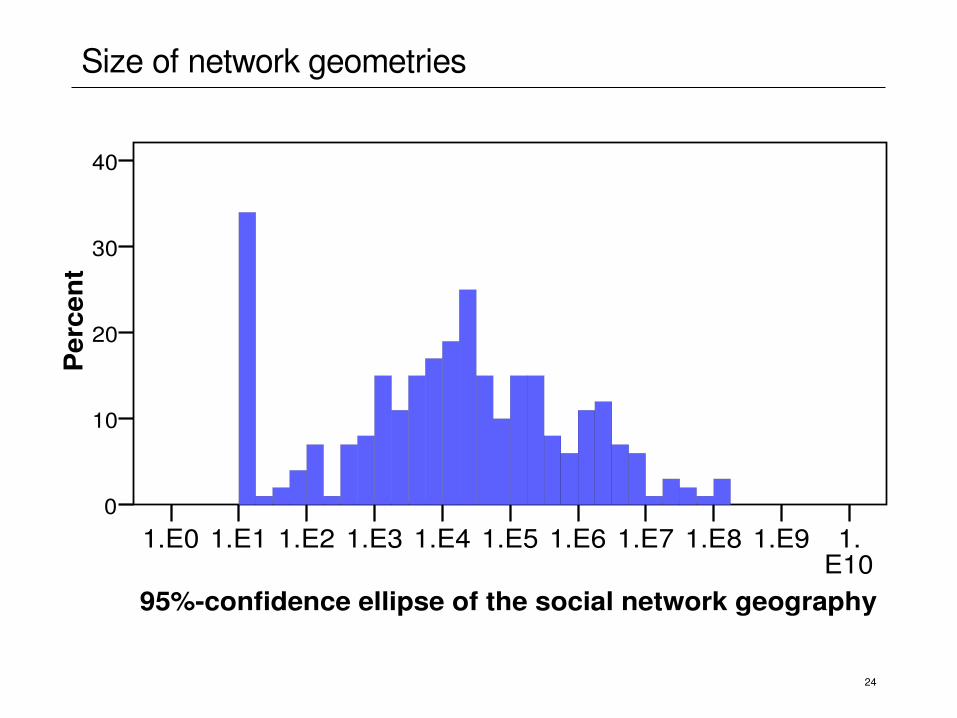
Size of network geometries
95%confidence ellipse of the social network geography
1.E10
1.E91.E81.E71.E61.E51.E41.E31.E21.E11.E0
Per
cen
t
40
30
20
10
0
25
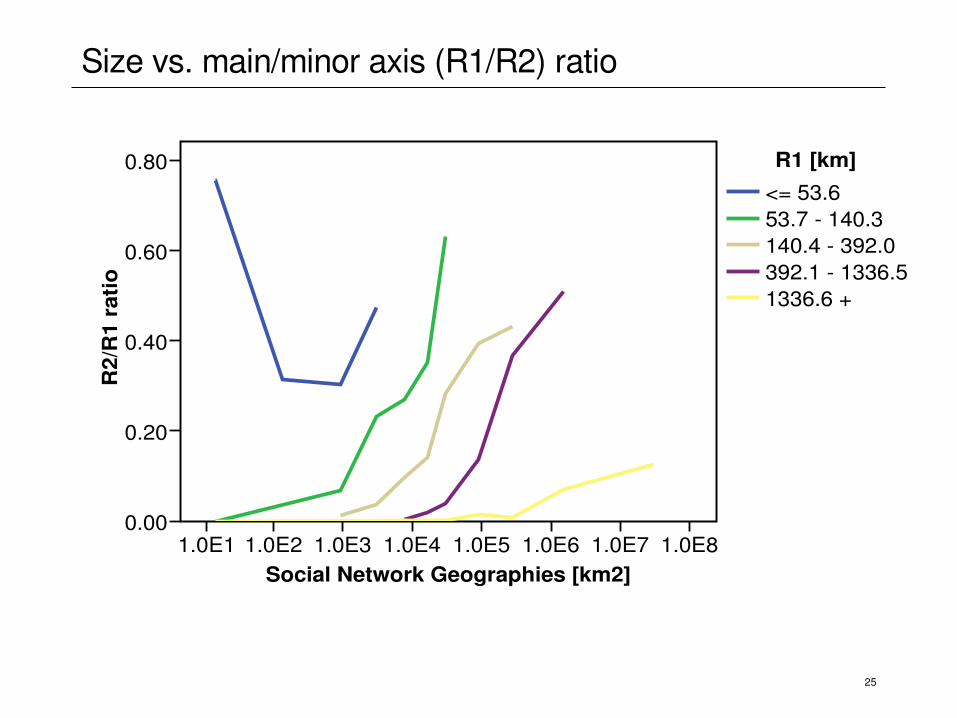
Size vs. main/minor axis (R1/R2) ratio
Social Network Geographies [km2]1.0E81.0E71.0E61.0E51.0E41.0E31.0E21.0E1
R2/
R1
rati
o
0.80
0.60
0.40
0.20
0.00
1336.6 +392.1 1336.5140.4 392.053.7 140.3<= 53.6
R1 [km]
26
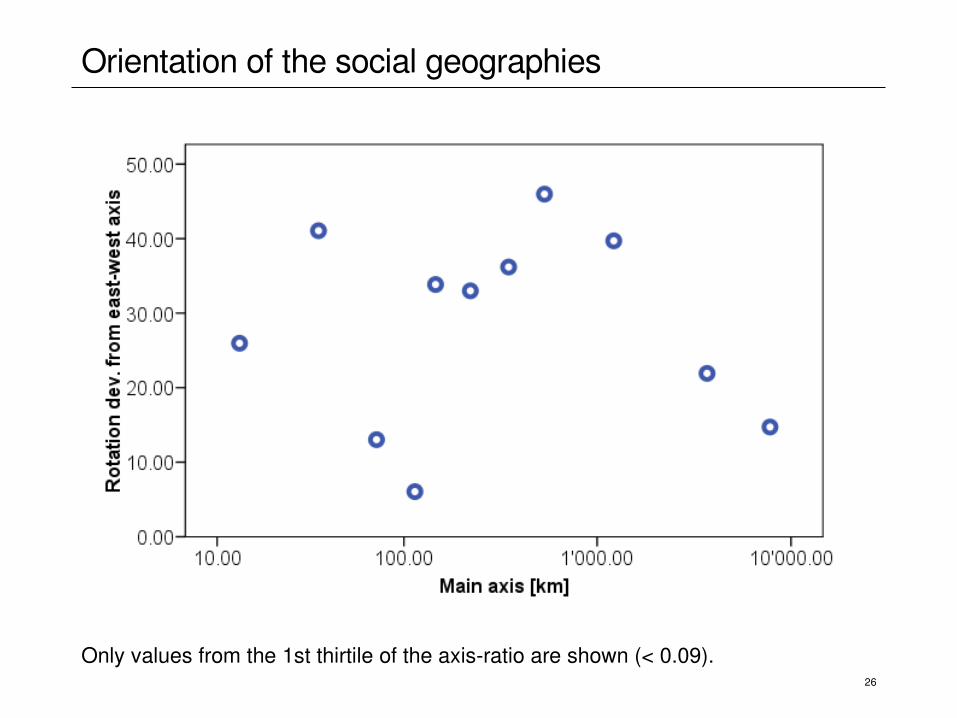
Orientation of the social geographies
Only values from the 1st thirtile of the axisratio are shown (< 0.09).
27
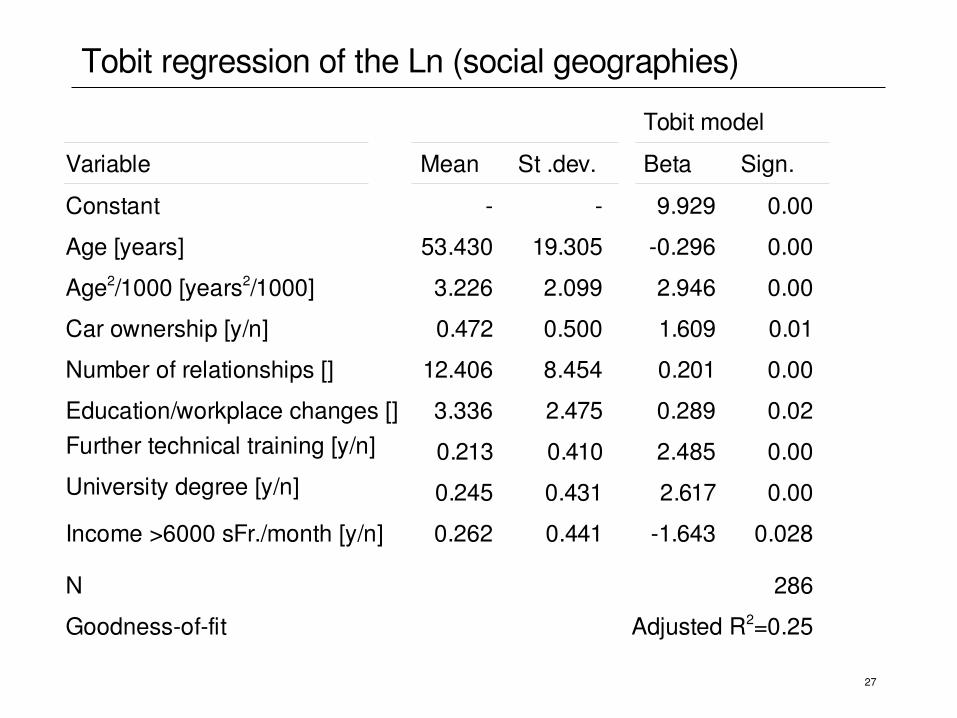
Tobit regression of the Ln (social geographies)
Tobit model
Variable Mean St .dev. Beta Sign.
Constant 9.929 0.00
Age [years] 53.430 19.305 0.296 0.00
Age2/1000 [years2/1000] 3.226 2.099 2.946 0.00
Car ownership [y/n] 0.472 0.500 1.609 0.01
Number of relationships [] 12.406 8.454 0.201 0.00
Education/workplace changes [] 3.336 2.475 0.289 0.02Further technical training [y/n] 0.213 0.410 2.485 0.00University degree [y/n] 0.245 0.431 2.617 0.00
Income >6000 sFr./month [y/n] 0.262 0.441 1.643 0.028
N 286
Goodnessoffit Adjusted R2=0.25
28
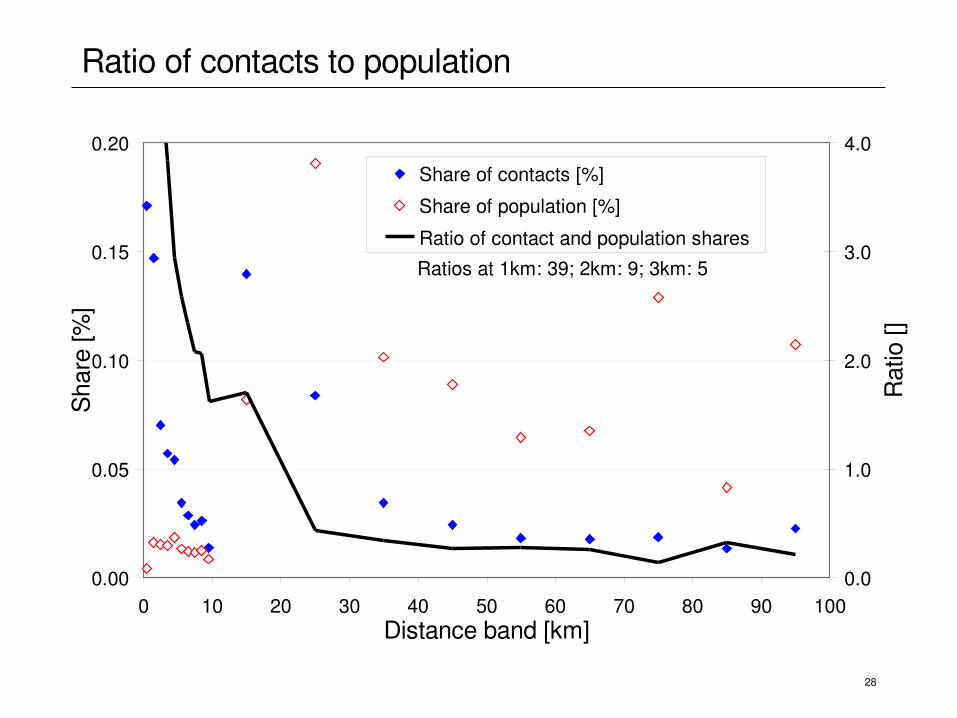
Ratio of contacts to population
0.00
0.05
0.10
0.15
0.20
0 10 20 30 40 50 60 70 80 90 100Distance band [km]
Sha
re [%
]
0.0
1.0
2.0
3.0
4.0
Rat
io []
Share of contacts [%]
Share of population [%]
Ratio of contact and population shares
Ratios at 1km: 39; 2km: 9; 3km: 5
29
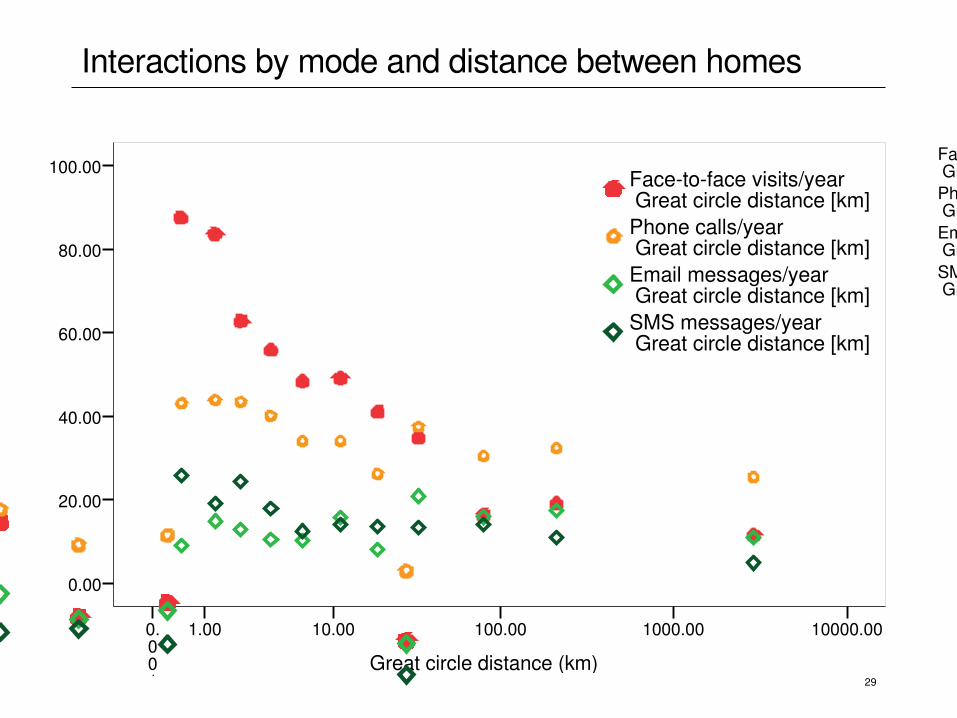
Interactions by mode and distance between homes
10000.001000.00100.0010.001.000.001
100.00
80.00
60.00
40.00
20.00
0.00
SMS messages/year Great circle distance [km]
Email messages/year Great circle distance [km]
Phone calls/year Great circle distance [km]
Facetoface visits/year Great circle distance [km]
Great circle distance (km)
10000.001000.00100.0010.001.000.001
100.00
80.00
60.00
40.00
20.00
0.00
SMS messages/year Great circle distance [km]
Email messages/year Great circle distance [km]
Phone calls/year Great circle distance [km]
Facetoface visits/year Great circle distance [km]
Great circle distance (km)
30
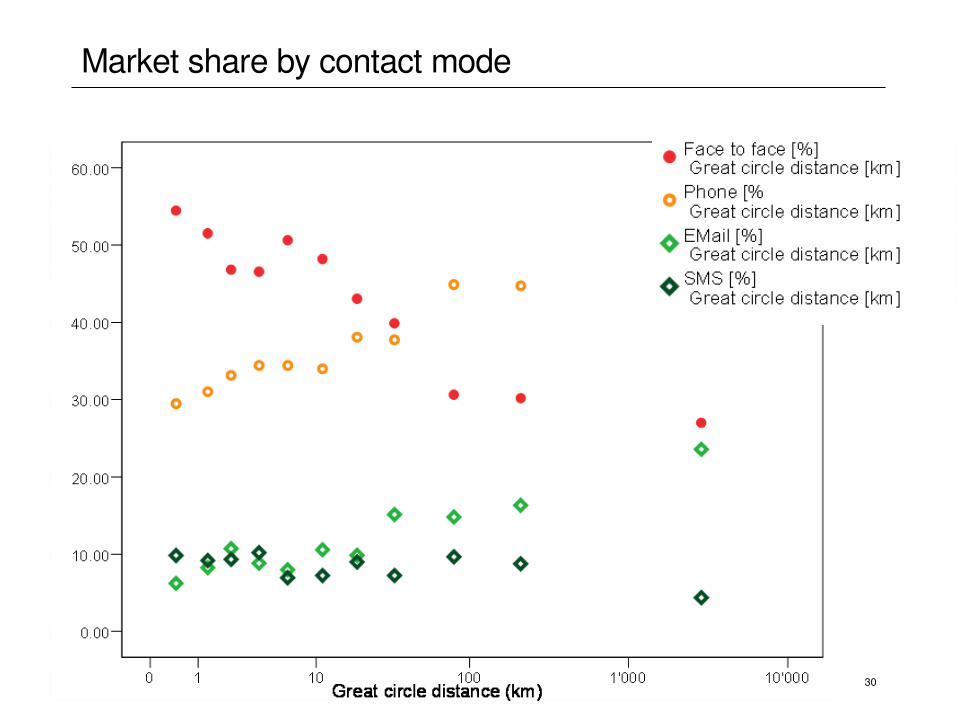
Market share by contact mode
31
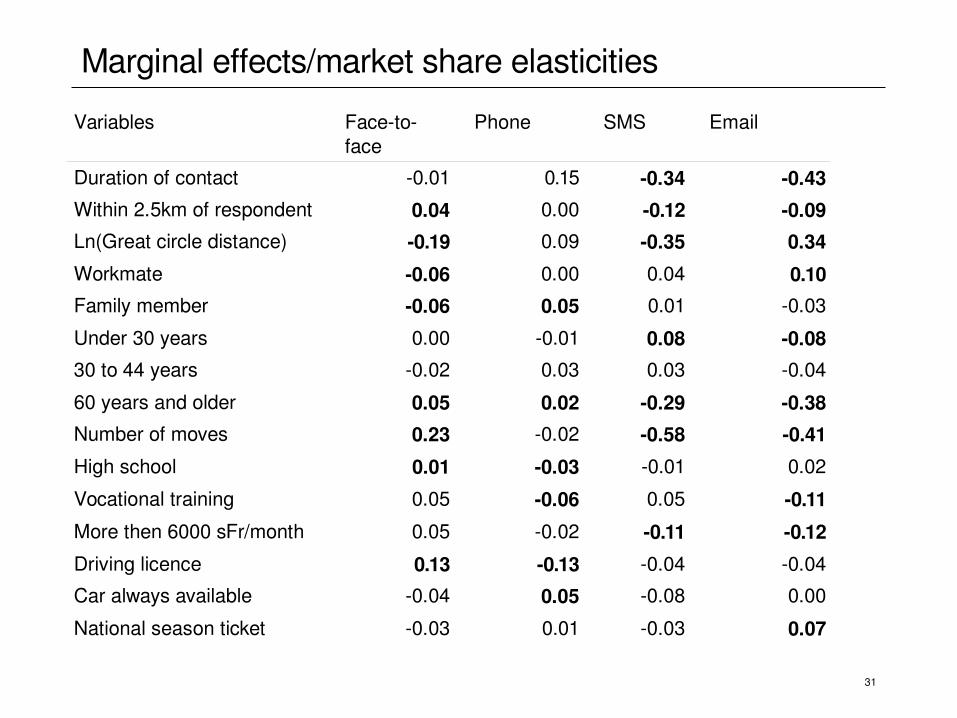
Marginal effects/market share elasticities
Variables Facetoface
Phone SMS Email
Duration of contact 0.01 0.15 0.34 0.43Within 2.5km of respondent 0.04 0.00 0.12 0.09Ln(Great circle distance) 0.19 0.09 0.35 0.34
Workmate 0.06 0.00 0.04 0.10Family member 0.06 0.05 0.01 0.03
Under 30 years 0.00 0.01 0.08 0.0830 to 44 years 0.02 0.03 0.03 0.04
60 years and older 0.05 0.02 0.29 0.38Number of moves 0.23 0.02 0.58 0.41
High school 0.01 0.03 0.01 0.02
Vocational training 0.05 0.06 0.05 0.11
More then 6000 sFr/month 0.05 0.02 0.11 0.12
Driving licence 0.13 0.13 0.04 0.04
Car always available 0.04 0.05 0.08 0.00
National season ticket 0.03 0.01 0.03 0.07
32
Second set of research issues
• Reconstruction of historical/prior activity spaces
• Taste differences in network form and geography• Social/cultural preferences for network form and geography
• Stability of the geographies under pressure• Elasticities to policy (or environmental) change• Time until trend change

33
Policy questions
• Is „happiness“ still growing ?
• How large are the social externalities ?
• How stable is the overall system under pressure ?
• How can public policy support a possible need to reconstruct the networks ?
34
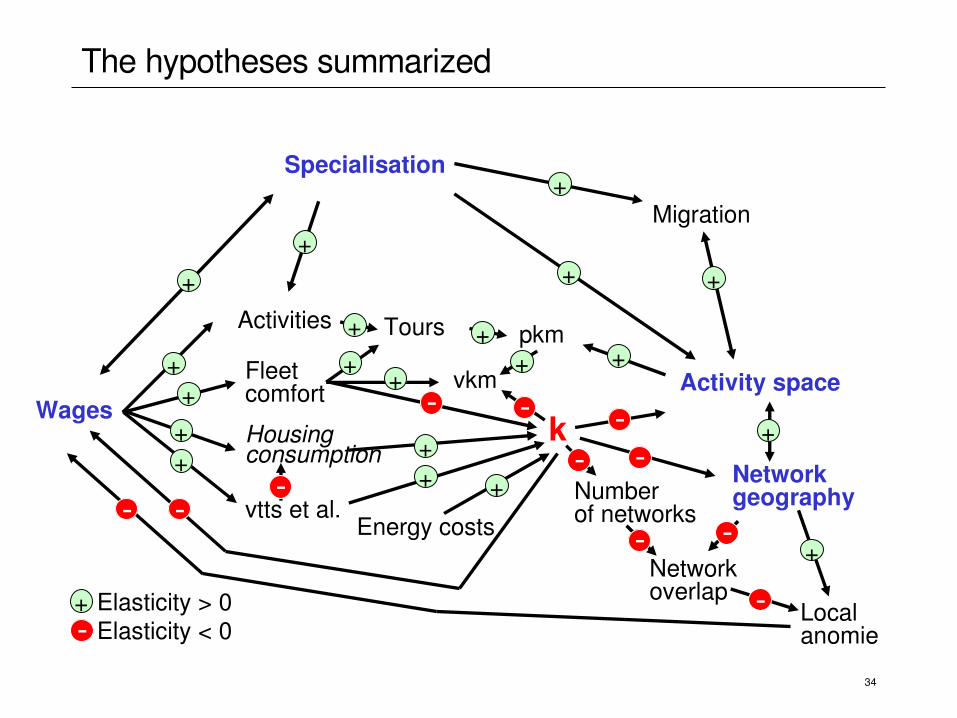
The hypotheses summarized
Wages
Fleetcomfort
Housingconsumption
vtts et al.
Activities
Specialisation
kvkm
pkmTours ++
+
++
++
++
++
+
+
+
Energy costs
+
+
Elasticity > 0 Elasticity < 0
+
Migration+
+
Activity space
NetworkgeographyNumber
of networks
Networkoverlap
Local anomie
+
+

35
For more information see
www.ivt.ethz.ch
36
Literature and references
Axhausen, K.W. (2000) Geographies of somewhere: A review of urban literature, Urban Studies, 37 (10) 18491864.
Axhausen, K.W. (Forthcoming) Social networks, mobility biographies and travel: The survey challenges, Environment and Planning B
Axhausen, K.W. (2007) Activity spaces, biographies, social networks and their welfare gains and externalities: Some hypotheses and empirical results, Mobilities, 2 (1) 1536.
Axhausen, K.W., C. Dolci, Ph. Fröhlich, M. Scherer and A. Carosio (2006) Constructing time scaled maps: Switzerland 1950 2000, Arbeitsberichte Verkehrs und Raumplanung, 342, IVT, ETH Zürich, Zürich.
Axhausen, K.W. and A. Frei (2007) Contacts in a shrunken world, Arbeitsbericht Verkehrs und Raumplanung, 440, IVT, ETH Zürich, Zürich.
Botte, M. (2003) Strukturen des Pendelns in der Schweiz, Diplomarbeit, Fakultät für Bauingenieurwesen, TU Dresden, August 2003.
37
Literature and references
Frei, A. and K.W. Axhausen (2007) Size and structure of social netowork geographies, Arbeitsberichte Verkehrs und Raumplanung, 439, IVT, ETH Zürich, Zürich.
Dicken, P. (1998) Global Shift: Transforming the World Economy, Paul Chapman Publishing, London.
FCC (2001) Long distance telecommunication industry, FCC, Washington, D.C.Gruber, A. (1998) Technology and Global Change, Cambridge University Press,
Cambridge.Larsen, J., J. Urry and K.W. Axhausen (2006) Mobilities, Networks, Geographies,
Ashgate, Aldershot.Putnam, R.D. (1999) Bowling Alone: The collapse and revival of American
community, Schuster and Schuster, New York.

38
Definition of a social network
The topology of a social network describes
• Which person/firm (node) is linked to which other persons/firms
• By contacts (links) of a certain quality (impedance or cost)
Closeness ~ 1/Impedance
39
Social networks: Hypotheses
[1] The size of the social network geography is inversely proportional to the generalised costs of travel and communication
[2] The number of contacts individuals maintain is inversely proportional to the generalised costs of travel and communication
[3] The probability of being linked to a member of one’s network through multiple networks increases with the spatial density of one’s contacts
[4] The distribution of effort on nonhousehold members will become more left skewed as the spatial social network tightness decreases
[5] The knowledge about the contacts of contacts in a social network is proportional to the generalised costs of travel and communication
40
Social networks: Hypotheses (2)
[6] The activity space of an individual is proportional to its social network geography
[7a] The size of the local activity space of an individual stabilises after an initial exploration.
[7b] The size of the total activity space will grow in line with the growth of social network geographies.
[8] The reliance on commercial or publicly funded personal services increases proportionally with the geography of social networks
[9] The welfare of the individuals should increase inversely proportional to the generalised costs of travel