preliminary draft document - subject to change for
TRANSCRIPT

Preliminary Draft Document - Subject to ChangeFor Informational Purposes Only - Not for Comment
April 1999
Preliminary Draft Document - Subject to ChangeFor Informational Purposes Only - Not for Comment
April 1999
US Army Corps of EngineersWalla Walla District
Lower Snake River Juvenile Salmon Migration Feasibility Study
Recreation and Tourism Analysis
Foreword
This document is the product of the U.S. Army Corps of Engineers’ (Corps) efforts toinvolve the region in the development of the Lower Snake River Juvenile Salmon MigrationFeasibility Report/Environmental Impact Statement (FR/EIS). The Corps has reached out toregional stakeholders (states, tribes, Federal agencies, organizations and individuals) fortheir input and development of various work products. This and various other productsassociated with the development of the EIS were authored and developed by theseregional stakeholders and contractors. Please note that this document is a draft orpreliminary report and is subject to change or revision. Although the Corps has acquiredthis document as part of its EIS process, the opinions and/or findings expressed herein donot necessarily reflect the official policy or position of the Corps. The Corps will review andincorporate information from these products into our analysis and development of the DraftFR/EIS.
The Recreation Workgroup, a Drawdown Regional Economic Workgroup (DREW)subgroup, has completed a preliminary report on the recreation and tourism analysis for theLower Snake River Juvenile Salmon Migration Feasibility Study. Recreation on the fourlower Snake River reservoirs is an authorized project purpose. Existing recreation andtourism will be affected in the event a decision is made to breach the four lower SnakeRiver dams. A recreation survey was developed as one tool to gather information for use inrecreation analysis. Results of the survey are incorporated into a draft Recreation andTourism Analysis for review by the DREW and the Independent Economic Analysis Board(IEAB). The final draft report will become the Recreation and Tourism Analysis chapter ofthe Economic Appendix of the EIS.
In addition, this analysis is only one part of the overall Economic Appendix of the EIS.Other critical components of the economic analysis include power, transportation, watersupply, tribal, regional, and social analysis. For a true economic analysis of the implicationsof any of the study alternatives, economic costs and benefits of all the components of theanalysis must be considered, but without any individual component taken out of context.

Preliminary Draft Document - Subject to ChangeFor Informational Purposes Only - Not for Comment
April 1999
Preliminary Draft Document - Subject to ChangeFor Informational Purposes Only - Not for Comment
April 1999
It is important to note this draft analysis is still preliminary data, and is subject to review andrevision. The conclusions of the draft report are subject to change.
This draft document is being released for information purposes only. The Corps will notbe responding to comments at this time. The formal comment period will coincide with therelease of the Draft FR/EIS, expected in October 1999.

Preliminary Draft Document - Subject to ChangeFor Informational Purposes Only - Not for Comment
April 1999
Preliminary Draft Document - Subject to ChangeFor Informational Purposes Only - Not for Comment
April 1999
Table of Contents
Foreword
Purpose
Methods
Techniques Used to Measure Visitor Benefits
Surveys
Survey Findings
Lower Snake River Reservoir
Upriver of Lewiston, Idaho
Central Idaho
Natural River Drawdown Recreation
Application of Survey Results
River Recreation
Recreational Fishing
Calculation of Present Value of Recreation Benefits
Summary of Recreation Results
Risk and Uncertainty
Evaluation of Alternatives Without California River Visitors
Avoided Cost Analysis
Mitigation
Passive Use Values of Wild Salmon and Free-Flowing Rivers
Conclusion
References

Preliminary Draft Document - Subject to ChangeFor Informational Purposes Only - Not for Comment
April 1999
Preliminary Draft Document - Subject to ChangeFor Informational Purposes Only - Not for Comment
April 1999
Tables
Table R-1 Summary of Existing Recreation Use and Benefits (1998 Dollars)
Table R-2 Recreation Suitability Recovery after Dam Removal
Table R-3 Summary of Natural River Recreation Use and Benefits (1998 Dollars)
Table R-4APresent Value (PV) and Annualized (AAEV) Value of RecreationBenefits Over 100 Years - Millions of 1998 Dollars at 6.875 Percent(COE Rate)
Table R-4BPresent Value (PV) and Annualized (AAEV) Value of RecreationBenefits Over 100 Years - Millions of 1998 Dollars at 4.75 Percent(BPA Rate)
Table R-4CPresent Value (PV) and Annualized (AAEV) Value of RecreationBenefits Over 100 Years - Millions of 1998 Dollars at Zero Percent(Tribal Rate)
Table R-5Difference in PV and Annualized (AAEV) Value of Recreation BenefitsFrom Alternative A1 - Millions of 1998 Dollars at 6.875 Percent (COERate)
Table R-6
Present Value (PV) and Annualized (AAEV) Value of RecreationBenefits Over 100 Years - Millions of 1998 Dollars at 6.875 Percent(COE Rate), California Visitors Removed From River RecreationScenario

Preliminary Draft Document - Subject to ChangeFor Informational Purposes Only - Not for Comment
April 1999
Preliminary Draft Document - Subject to ChangeFor Informational Purposes Only - Not for Comment
April 1999
PURPOSE
This chapter summarizes results of four recreation use surveys conducted to estimate thevisitation and benefits associated with current reservoir recreation, major systemimprovements and potential river recreation with natural river drawdown. References to thedetailed reports are provided for interested readers. This chapter also applies the results ofthose surveys to the EIS alternatives and accounts for the timing of when recreationalfisheries benefits would be obtained. Finally, the chapter summarizes the passive usevalues for wild salmon and river recovery.
METHODS
The Principles and Guidelines (U.S. Water Resources Council, 1983) which governs theconduct of benefit-cost analyses by federal agencies such as the U.S. Army Corps ofEngineers (COE), requires that benefits to the visitor be measured as the additional amountthe visitor would pay for the recreation experience over and above their current costs. Thisbenefit measure is referred to as net willingness to pay (WTP) and is the measure the COEuses when measuring National Economic Development (NED) benefits. The economicsprofession also recommends net WTP as the conceptually correct measure of benefits forbenefit-cost analysis (Sassone and Schaeffer, 1978; Loomis and Walsh, 1997).
The actual expenditures of visitors are costs to visitors (not benefits) but contribute toregional economic development (RED). The local income and employment generated fromrecreation visitor spending is reported in a separate chapter entitled Regional EconomicDevelopment.
Techniques Used to Measure Visitor Benefits
The Principles and Guidelines (U.S. Water Resources Council, 1983) recommends thateither the Travel Cost Method (TCM) or Contingent Valuation Method (CVM) be used toquantify visitors net WTP. Both of these methods are used by other Federal agencies andfrequently used by economists (Loomis and Walsh, 1997). In this study TCM is applied toestimate net WTP for the current reservoir recreation, river recreation above Lewiston,Idaho and in the Snake River basin in central Idaho. TCM uses the actual number of tripstaken by an individual as the quantity variable and the visitor's travel cost as the pricevariable to statistically trace out a demand curve for recreation using multiple regression.From this demand curve the net WTP is calculated. See McKean (1998a,b) for more detailson the TCM demand models used.
Since natural river conditions do not exist in the Lower Snake River, one cannot surveyexisting users and directly apply a standard TCM to estimate the value of river recreationwith dam removal. Therefore a hybrid TCM approach known as "contingent behavior" (CB)is used to estimate the value of river recreation under the Natural River DrawdownAlternative. This hybrid approach involves: (a) describing the new recreation conditions--

Preliminary Draft Document - Subject to ChangeFor Informational Purposes Only - Not for Comment
April 1999
Preliminary Draft Document - Subject to ChangeFor Informational Purposes Only - Not for Comment
April 1999
e.g., natural river scenario; (b) asking whether the person would visit and if so, how manytimes per year; (c) asking the distance, travel cost and travel time to their most likely spoton the river they would visit. Thus, the variables are similar to what is used in the TCM forcurrent reservoir recreation. In addition, the same statistical regression models are appliedto the data for all alternatives. Thus, the same general recreation valuation approaches areused to value the different types of recreation across alternatives. The contingent behaviorapproach is becoming widely used in economics, previously applied in the Columbia RiverSystem Operation Review (Callaway, et al., 1995) and has been shown to be reliable(Loomis, 1993). See Loomis, 1999 for discussion of the contingent behavior TCM.
Surveys
Surveys were designed to allow estimation of both types of Travel Cost Method demandmodels. Questions included travel expenditures, travel time, time on site, discretionary timeavailable for recreation and questions regarding visitor demographics.
Reservoir Recreation Surveys: Two separate travel cost method mail survey instrumentswere developed, an angler survey and a general recreation survey. These two surveyswere relatively short, being three pages in length. Visitors names and addresses to allowmailing of these surveys were collected by University of Idaho students stationed atrecreation access points along the lower Snake River. Visitors were sampled at thereservoirs from May to October of 1997. A total of 408 completed surveys were mailedback from non-angler river visitors, representing a response rate of 65%. A total of 537completed surveys were mailed back by anglers, representing a response rate of 59%.Copies of the survey instrument are in McKean (1998a,b).
Snake River Above Lewiston, Idaho Survey: This was a survey of anglers, generally fishingfor steelhead in the 30 mile stretch of the Snake River, above the town of Lewiston, Idaho.The names and addresses were collected from September 1997 to March 1998. A total of247 completed surveys were returned, yielding a response rate of 72%. A copy of thesurvey instrument is in McKean (1998c).
Central Idaho Surveys for Angling and Rafting: Due to the variety of access points, thesesurveys were distributed to anglers and rafters using several methods including on-sitecontacts and via guides. A total of 257 useable responses was obtained from anglers, while190 useable surveys were returned by other river recreation users such as rafters. Copiesof the survey instrument are in McKean (1999a,b).
Natural River Conditions Recreation Survey: Because the free-flowing lower Snake Riverdoes not exist, a stratified sample of households was mailed an eight page survey. Thesample was determined by evaluating the origin of current visitors to the Snake River andfrom guidance from the Drawdown Review Economics Workgroup (DREW). The sampleincluded residents of Idaho, Oregon, Washington, western Montana and California. A localsample strata of counties surrounding the lower Snake River was included to insureadequate representation of these households. The overall response rate was 54%representing 4,780 completed surveys. Only a portion of the 4,780 households returning

Preliminary Draft Document - Subject to ChangeFor Informational Purposes Only - Not for Comment
April 1999
Preliminary Draft Document - Subject to ChangeFor Informational Purposes Only - Not for Comment
April 1999
surveys indicated they would visit the lower Snake River under the Natural River Drawdowncondition, however. A copy of the survey instrument is in Loomis (1999).

Preliminary Draft Document - Subject to ChangeFor Informational Purposes Only - Not for Comment
April 1999
Preliminary Draft Document - Subject to ChangeFor Informational Purposes Only - Not for Comment
April 1999
SURVEY FINDINGS
Lower Snake River Reservoir
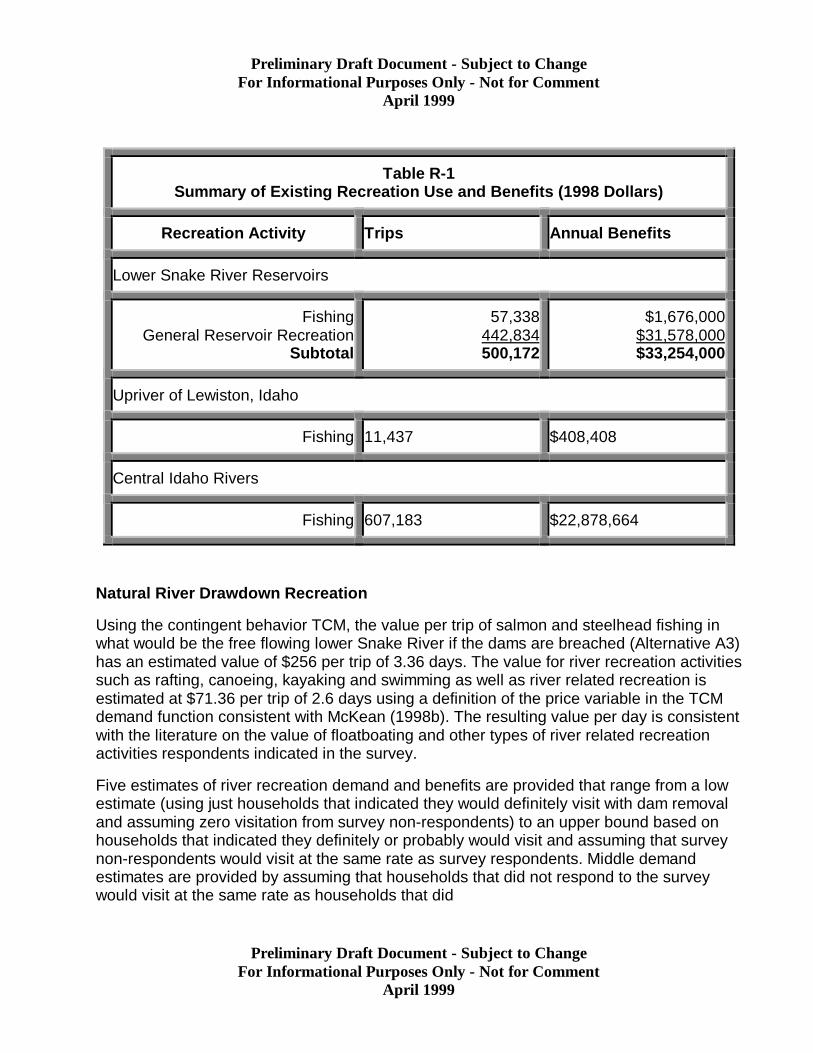
The average net WTP per trip of reservoir fishing was $29.23 (many of these are very shorttrips of a day or less). When multiplied by an estimated 57,338 angler trips yields annualbenefits of $1.676 million.
The average net WTP or net benefit per day of non-angling reservoir recreation such asboating and waterskiing was $71.31 per trip. When multiplied by an estimated 442,834 tripsyields an annual recreation benefit of $31.578 million. Details of the per trip and annualbenefits methodology for reservoir recreation analyses can be found in McKean (1998a,b).
Upriver of Lewiston, Idaho
The average net WTP for anglers fishing in the 30 mile stretch of the Snake River aboveLewiston, Idaho is $35.71 per trip. Multiplying this be an estimated 11,437 angler tripsyields an annual value of $408,408. Details of the per trip and annual benefits of thisupriver angler analysis can be found in McKean (1998c).
Central Idaho
Anglers in Central Idaho (Snake River Basin) had an average net WTP per trip of $37.68.When multiplied by an estimated 607,183 trips yields an annual benefit of $22,878,664.The average net WTP for non-angling upriver recreation such as rafting is $87.24.Estimated use is 497,480 trips. This yields an annual value of $43,400,000.
Table R-1 lists existing reservoir recreation use and benefits (Alternative A1), which totalabout 500,172 trips worth $33.254 million annually.
Preliminary Draft Document - Subject to ChangeFor Informational Purposes Only - Not for Comment
April 1999
Preliminary Draft Document - Subject to ChangeFor Informational Purposes Only - Not for Comment
April 1999
Table R-1Summary of Existing Recreation Use and Benefits (1998 Dollars)
Recreation Activity Trips Annual Benefits
Lower Snake River Reservoirs
FishingGeneral Reservoir Recreation
Subtotal
57,338442,834500,172
$1,676,000$31,578,000$33,254,000
Upriver of Lewiston, Idaho
Fishing 11,437 $408,408
Central Idaho Rivers
Fishing 607,183 $22,878,664
Natural River Drawdown Recreation
Using the contingent behavior TCM, the value per trip of salmon and steelhead fishing inwhat would be the free flowing lower Snake River if the dams are breached (Alternative A3)has an estimated value of $256 per trip of 3.36 days. The value for river recreation activitiessuch as rafting, canoeing, kayaking and swimming as well as river related recreation isestimated at $71.36 per trip of 2.6 days using a definition of the price variable in the TCMdemand function consistent with McKean (1998b). The resulting value per day is consistentwith the literature on the value of floatboating and other types of river related recreationactivities respondents indicated in the survey.
Five estimates of river recreation demand and benefits are provided that range from a lowestimate (using just households that indicated they would definitely visit with dam removaland assuming zero visitation from survey non-respondents) to an upper bound based onhouseholds that indicated they definitely or probably would visit and assuming that surveynon-respondents would visit at the same rate as survey respondents. Middle demandestimates are provided by assuming that households that did not respond to the surveywould visit at the same rate as households that did
Preliminary Draft Document - Subject to ChangeFor Informational Purposes Only - Not for Comment
April 1999
Preliminary Draft Document - Subject to ChangeFor Informational Purposes Only - Not for Comment
April 1999
respond to the survey but applying this assumption only to the fraction of the populationthat were definitely sure they would visit. Lastly, an middle-high demand estimate isprovided which uses the households that indicated they definitely or probably would visitbut assuming that survey non-respondents would not visit.
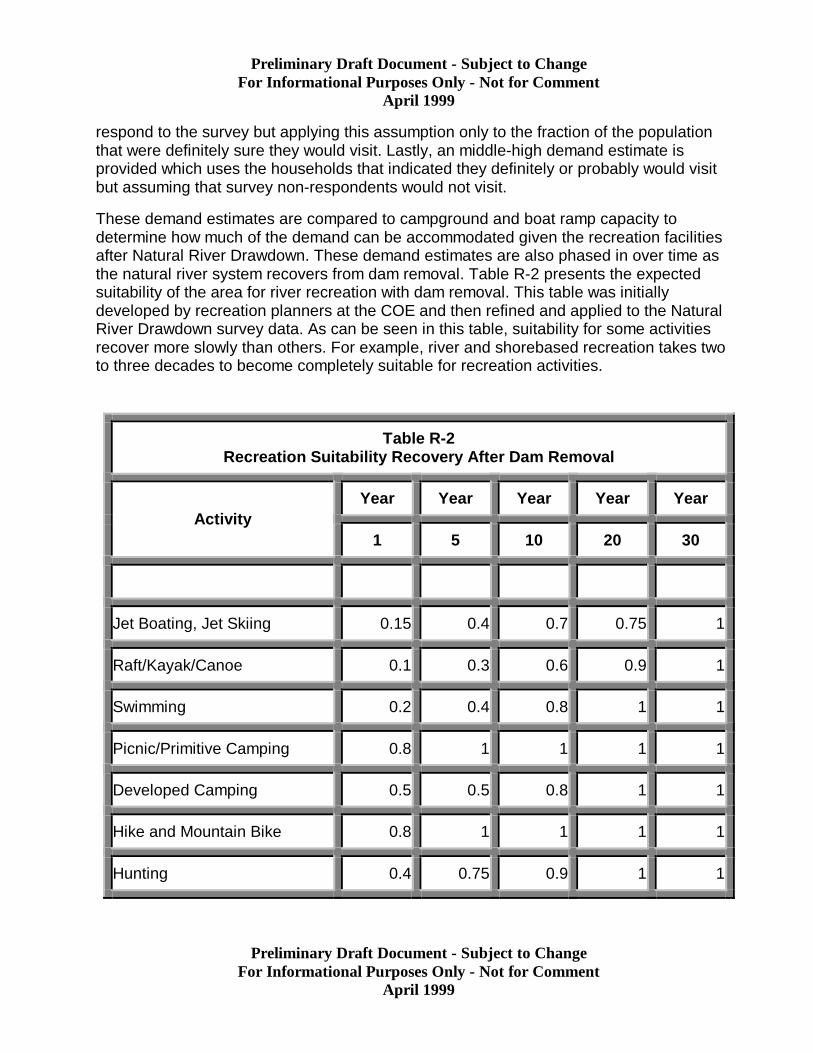
These demand estimates are compared to campground and boat ramp capacity todetermine how much of the demand can be accommodated given the recreation facilitiesafter Natural River Drawdown. These demand estimates are also phased in over time asthe natural river system recovers from dam removal. Table R-2 presents the expectedsuitability of the area for river recreation with dam removal. This table was initiallydeveloped by recreation planners at the COE and then refined and applied to the NaturalRiver Drawdown survey data. As can be seen in this table, suitability for some activitiesrecover more slowly than others. For example, river and shorebased recreation takes twoto three decades to become completely suitable for recreation activities.
Table R-2Recreation Suitability Recovery After Dam Removal
Year Year Year Year YearActivity
1 5 10 20 30
Jet Boating, Jet Skiing 0.15 0.4 0.7 0.75 1
Raft/Kayak/Canoe 0.1 0.3 0.6 0.9 1
Swimming 0.2 0.4 0.8 1 1
Picnic/Primitive Camping 0.8 1 1 1 1
Developed Camping 0.5 0.5 0.8 1 1
Hike and Mountain Bike 0.8 1 1 1 1
Hunting 0.4 0.75 0.9 1 1

Preliminary Draft Document - Subject to ChangeFor Informational Purposes Only - Not for Comment
April 1999
Preliminary Draft Document - Subject to ChangeFor Informational Purposes Only - Not for Comment
April 1999
The visitation estimates for General River Recreation given in Table R-3, reflect theapplication of these suitability factors to the respective demand estimates. Further, theamount of existing facilities may also limit visitor use. Three key capacities were examined:boat ramps, developed campsites and areas available for primitive camping. COErecreation planners provided information on the number of boat ramps, developedcampsites and suitable areas for primitive camping. To calculate visitor day capacities, wetook the recreation season as April through October. This time period coincides with springbreak through the steelhead fishing season as well as summer vacations. This area isattractive in spring and fall, due to the early warm temperatures. While rather hot during thesummer, the area receives high use during the vacation months of July and August. Giventhe average party size of three persons, the maximum number of visitor days that could beaccommodated during this April through October time period was calculated. This figurelimited the amount of camping demand that could be accommodated in all scenarios,including the low visitor use scenario (starting in year 10 for that scenario, but starting inyear 1 for all other scenarios). This assumes no new camping facilities are constructed byfederal, state or county agencies to accommodate increased camping demand over time.Primitive camping was limited during the first few years until the receding beaches becamesuitable for camping. Boat ramp capacity was sufficient for all but the highest use scenario,although they would be used at close to capacity in the middle-high use estimate.
Unlike current conditions, with the Natural River Drawdown our surveys predict that a largepercentage of total river recreation use would come from distant states like California.Specifically, 30-45% of the total trips are from California depending on the sampleexpansion assumptions. This percentage of trips is not out of line with the fact Californiarepresents 60%-70% of the population of our sampling area. While the percent visiting isquite low and only one trip is taken per year, these are long trips being more than a week induration. As such, they contribute large number of visitor days. Because only 20% of theCalifornia respondents indicating they would visit the Snake River if the dams wereremoved had visited in the previous year (they may have visited at some time in the past,however), there was concern by COE regarding the accuracy of California householdresponses. To test the sensitivity of the overall economic analysis to inclusion of Californiavisitors, the Recreation Risk and Uncertainty Section provides a more detailed analysis ofthe California visitors and then calculates the Natural River Drawdown estimates withoutCalifornia visitors.
However, this change in distribution of the origin of visitors is consistent with the patternfound in McKean's travel cost analyses of actual visitation. Specifically, the currentreservoirs are primarily local use areas with a majority of visitors coming from within 100-120 miles (McKean, 1998a,b). However, in the free-flowing river sections of Central Idaho21% of the river visitors come from 1,000 miles or more away, with 12% coming from 1,500miles or further (McKean, 1999). This pattern is consistent with the lack of availability ofsubstitute rivers of the size and magnitude of what the Lower Snake River will be with thedams removed. Thus people are willing to travel

Preliminary Draft Document - Subject to ChangeFor Informational Purposes Only - Not for Comment
April 1999
Preliminary Draft Document - Subject to ChangeFor Informational Purposes Only - Not for Comment
April 1999
greater distances to visit free flowing rivers. Besides the limited number of major rivers inthe western U.S., many existing rivers such as the Rogue, Salmon or the Colorado haveuse limits and permits are rationed by lottery. By contrast, reservoir visitors do not have totravel great distances as there are numerous reservoirs in the local area, including LakeWallula downstream from Ice Harbor dam very near the Tri-Cities area, DworshakReservoir near Lewiston, ID and three large lakes near Spokane, Washington.
As explained in more detail below, salmon and steelhead fishing demand with natural rivercondition is constrained by availability of salmon and steelhead. The availability of salmonfor harvest was estimated by the interagency PATH biologists as extended by ShannonDavis (see Radtke, Davis and Johnson, 1999). The limited availability of salmon forrecreational fishing constrains the desired angler days to an annual average of 32,255angler days or 9,600 angler trips over the period of analysis. This is about 2% of the lowestimate of salmon angler demand.
The same pattern is evident for steelhead, where numbers of fish limit angler days to anannual average of 338,242 or 100,667 trips over the period of analysis. This represents26% of the lowest estimated demand. As explained in more detail in the next section, aportion of the resident fishing angler demand is also supplied with the Natural RiverDrawdown Alternative (A3).
Table R-3Summary of Natural River Recreation Use and Benefits (1998 Dollars)
Recreation Activity Trips Annual Benefits
Fishing (resident, steelhead, and salmon inYear 10) 142,512 $30,275,570
General River Recreation (In Year 10)
LowLow Middle
MiddleMiddle High
High
570,464813,654
1,177,0881,944,1544,970,854
$40,700,000$58,000,000$84,000,000
$138,700,000$354,600,000

Preliminary Draft Document - Subject to ChangeFor Informational Purposes Only - Not for Comment
April 1999
Preliminary Draft Document - Subject to ChangeFor Informational Purposes Only - Not for Comment
April 1999
Natural River Drawdown (A3) is expected to have at least 721,000 trips worth an estimated$70 million annually, ten years after dam breaching and river restoration.
APPLICATION OF SURVEY RESULTS TO EIS ALTERNATIVES
There are eight different alternatives evaluated in the EIS. However, from the standpoint ofgeneral/non-fishing recreation, these alternatives can be grouped into two main categories:(1) alternatives in which the dams remain; and (2) Natural River Drawdown (A3). Group (1)includes Existing System (A1), Existing System with Maximize salmon transport ( A-2) andMajor System Improvements for salmon such as surface bypass collectors (A-2').
River Recreation
For the Natural River Drawdown Alternative, the estimated time path of river recoveryfollowing dam removal and its influence on recreation suitability and facility availability wasestimated by COE recreation staff. In Table R-2 these recreation carrying capacityestimates by time interval were refined and used to estimate the percentage of the differentrecreation activities that could be accommodated in each time period. These percentageswere applied to the five different estimates of non-angling river recreation demandcalculated from the survey. These resulting visitation figures were reduced by the carryingcapacity of the developed campgrounds in the all estimates and boat ramps in the high useestimate. The resulting visitor days are valued using the benefits calculated from the TCM.
Recreational Fishing
The estimated salmon and steelhead that can be recreationally harvested with eachalternative was provided by Shannon Davis (see Radtke, Davis and Johnson, 1999 fordetails). Davis based his estimates on PATH analysis and made additional assumptions togeneralize the seven PATH index stocks to all Snake River stocks. He also usedinformation from various international and national fishery treaties to allocate the totalstocks to commercial, tribal and recreational catch. The biological availability of salmon andsteelhead for recreational harvest was used to constrain the river angler demand calculatedfrom the household survey data. Specifically, only the proportion of river angler demandcompatible with salmon and steelhead available for recreational harvest was counted inany given year. This results in only a small fraction of the angler demand indicated in thesurvey being met.
Using Davis' generalization of PATH's estimates of salmon and steelhead with existingreservoirs (A1, A2, A2') we calculated the time path of anadromous fishing benefits withthese three alternatives. These changes in salmon and steelhead available for recreationalharvest reflect fisheries improvements recently put in place (Alternative A1) or proposedimprovements with alternatives A2 or A2'. Mainstem recreational harvest is used with the

Preliminary Draft Document - Subject to ChangeFor Informational Purposes Only - Not for Comment
April 1999
Preliminary Draft Document - Subject to ChangeFor Informational Purposes Only - Not for Comment
April 1999
household survey data from Loomis (1999). The tributary harvests of spring-summerchinook and steelhead are used with McKean's upriver of Lewiston and Central Idahoanalysis. As is evident from Tables R-4A to R-4C, recreational salmon fishing is a smallpart of the overall benefits. In part this is due to the small allocation of available fish torecreational fishing as compared to commercial fishing.
Normandeau and Bennett (1999) analysis of resident fish biology impacts by alternativewas applied to McKean's baseline resident fish benefits to estimate changes in fishing byalternative. Generally Normandeau and Bennett conclude there will be minor effects onresident fish for the non-drawdown alternatives (e.g., A1, A2, A2'). To estimate the effect ofnatural river drawdown (A3), information from Normandeau and Bennett's Table 4-3 onacres of habitat quantity and Table 4-4 on productivity per hectare was used. With naturalriver drawdown, surface area of habitat falls from 33,890 to 13,162. However, estimatedbiomass will increase from 50.9 to 84.7 kg/ha with natural river conditions. If we combinethe two effects, there appears to be a net loss, as the loss in habitat area is greater thanthe gain productivity. Based on these two factors it appears that the loss is about a one-third reduction in resident fish carrying capacity with natural river drawdown. Thus theestimated resident fishing benefits with A3 is two-thirds of estimated current resident anglertrips and $1.13 million in resident angler benefits.
Calculation of Present Value of Recreation Benefits
When using a positive discount rate, the timing of when the different recreation benefits arereceived influences the present worth or present value of recreation under each alternative.The time profile of benefits is quite different among the alternatives. Obviously, ExistingSystem alternatives currently provide their annual level of benefits and these would beexpected to continue each year into the future. Alternatives involving Major SystemImprovements and Natural River Drawdown take several years into the future to deliversome of their benefits and several decades for the salmon fishing benefits to be fullyrealized. To put all dollars of benefits on an equal footing with respect to their worth today,the present worth or present value is calculated using two positive discount rates. Theseare 4.75% which is the rate used by BPA and the discount rate is the rate used by the COEfor Fiscal Year 1999 which is equal to 6.875%. This discount rate weights benefits (andcosts) in the near future more heavily than those received in the distant future. Forpurposes of comparison, the tribal discount rate of zero is presented in Table R4-C. Thisweights all benefits and costs equally overtime. The present value of recreation benefits isshown in the last line of Table R-4.The present values are also converted into averageannual equivalent values (AAEV). This is an annualized present value.
Preliminary Draft Document - Subject to ChangeFor Informational Purposes Only - Not for Comment
April 1999
Preliminary Draft Document - Subject to ChangeFor Informational Purposes Only - Not for Comment
April 1999
SUMMARY OF RECREATION RESULTS
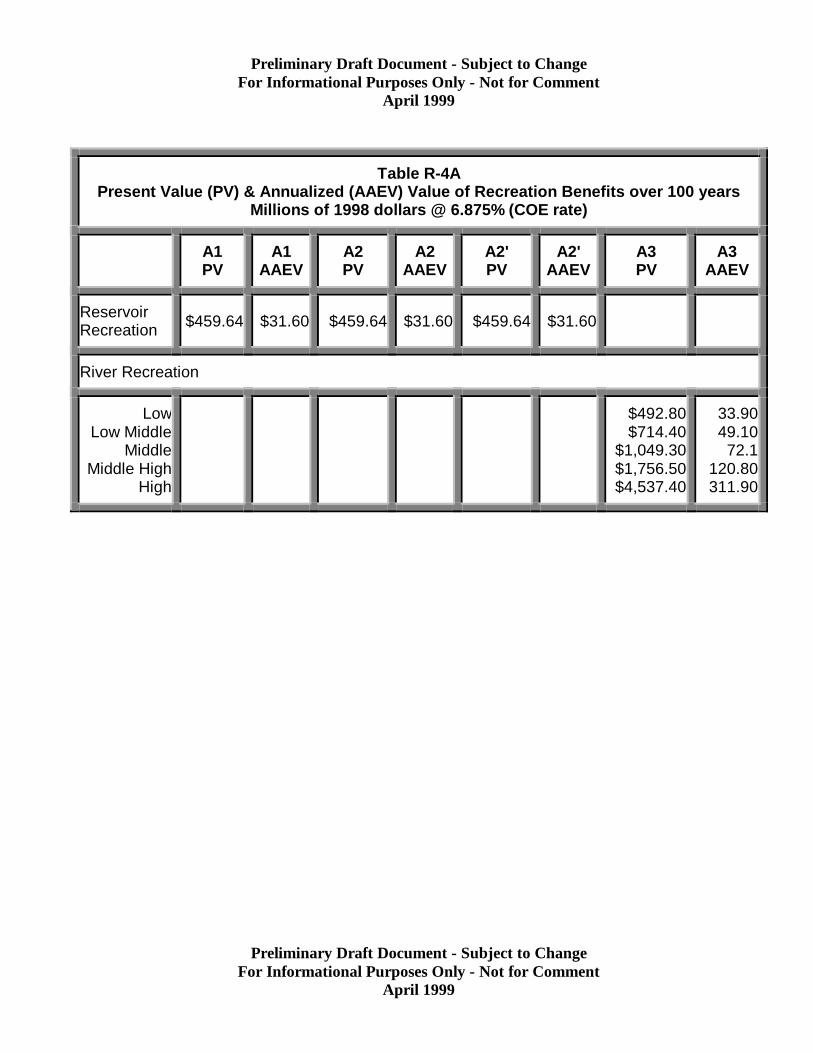
Tables R-4A-C displays the present value of the recreation benefits of each of the EISalternatives at the three different discount rates. All four alternatives have increasing fishingbenefits over time, although PATH estimates for Alternative A3 have the largest salmonand steelhead gains. While much of the gain of A3 is driven by projected increases insteelhead and salmon populations with Natural River conditions, some is also be due tosurvey respondents reported desirability of fishing for anadromous fish in a free-flowingriver environment as compared to a reservoir. With all three discount rates and all ranges ofriver visitor survey response assumptions, the present value of recreation benefits over the100 year period are higher with Natural River conditions (A3) than with other alternatives.The lower the discount rate, the greater the gain in recreation benefits with Natural RiverConditions, in part due to recovery of river recreation requiring 10 years or more. To assessthe sensitivity of these results to removal of California river visitors see Uncertainty andRisk section.
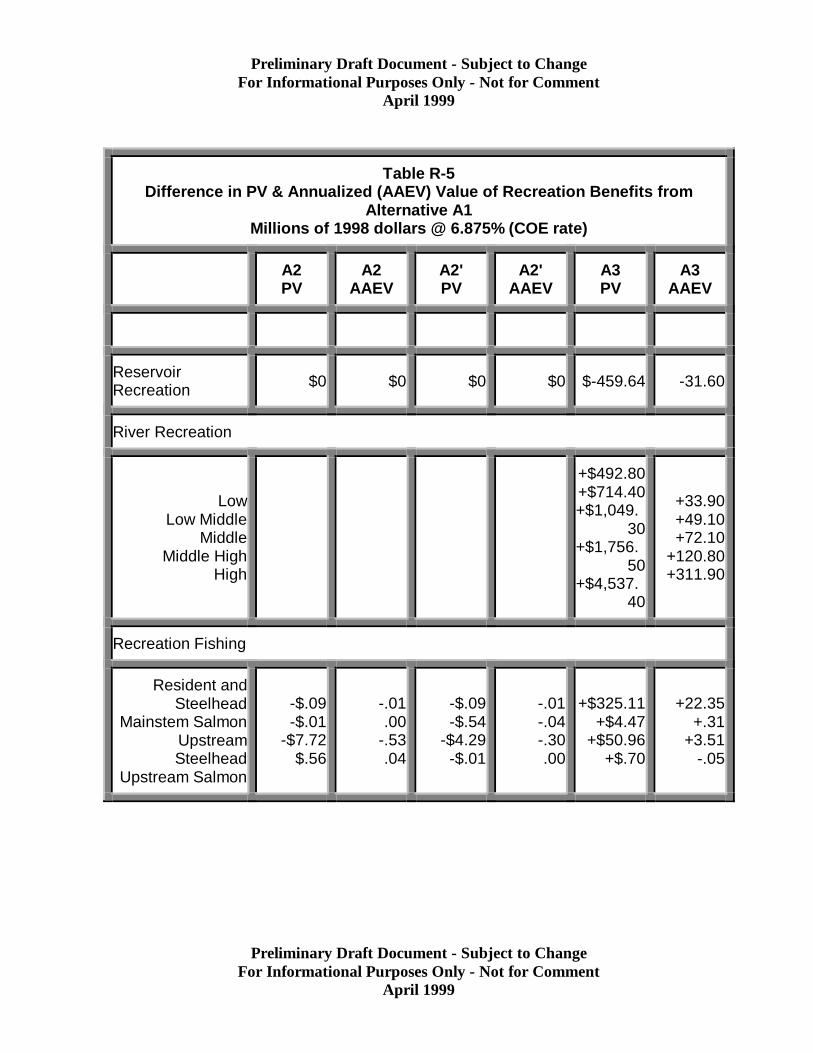
Table R-5 illustrates the net effect of alternatives A2, A2' and A3 as compared to alternativeA1. That is, Table R-5 shows the gain or loss in recreation benefits of each alternativecompared to the current baseline (A1) which is used as the future without. Based on thePATH fish estimates as extended from the PATH stocks to all stocks by Shannon Davis,there are small losses to salmon and steelhead fishing with A2 and A2' as compared to A1.There are large net gains in recreation with alternative A3, ranging from $28 million to $306million annually with a best estimate of $66 million annually.
Preliminary Draft Document - Subject to ChangeFor Informational Purposes Only - Not for Comment
April 1999
Preliminary Draft Document - Subject to ChangeFor Informational Purposes Only - Not for Comment
April 1999
Table R-4APresent Value (PV) & Annualized (AAEV) Value of Recreation Benefits over 100 years
Millions of 1998 dollars @ 6.875% (COE rate)
A1PV
A1AAEV
A2PV
A2AAEV
A2'PV
A2'AAEV
A3PV
A3AAEV
ReservoirRecreation $459.64 $31.60 $459.64 $31.60 $459.64 $31.60
River Recreation
LowLow Middle
MiddleMiddle High
High
$492.80$714.40
$1,049.30$1,756.50$4,537.40
33.9049.1072.1
120.80311.90

Preliminary Draft Document - Subject to ChangeFor Informational Purposes Only - Not for Comment
April 1999
Preliminary Draft Document - Subject to ChangeFor Informational Purposes Only - Not for Comment
April 1999
Recreation Fishing
Resident and Steelhead
$26.11 1.79 $26.02 1.78 $26.06 1.79 $351.22 24.14
Mainstem Salmon
$13.71 .94 $13.70 .94 $13.17 .94 $18.18 1.25
Upstream Steelhead
$401.54 27.60 $393.82 27.07 $397.25 27.3 $452.50 31.11
Upstream Salmon
$4.39 .30 $4.95 .34 $4.38 .30 $3.69 .25
TotalMiddle $905.39 62.23 $898.13 61.73 $900.50 61.93 $1,874.90 128.85
Total Low $1,318.40 90.04
Total High $5,362.90 368.65

Preliminary Draft Document - Subject to ChangeFor Informational Purposes Only - Not for Comment
April 1999
Preliminary Draft Document - Subject to ChangeFor Informational Purposes Only - Not for Comment
April 1999
Table R-4BPresent Value (PV) & Annualized (AAEV) Value of Recreation Benefits over 100
yearsMillions of 1998 dollars @ 4.75% (BPA rate)
A1PV
A1AAEV
A2PV
A2AAEV
A2'PV
A2'AAEV
A3PV
A3AAEV
ReservoirRecreation
$664.80 $31.60 $664.8
0 $31.60 $664.80 $31.60
River Recreation
LowLow Middle
MiddleMiddle High
High
$757.20
$1,096.30
$1,610.40
$2,695.90
$6,821.40
36.0072.1076.50
128.10324.00
Recreation Fishing
Resident andSteelhead
Mainstem SalmonUpstreamSteelhead
Upstream Salmon
$37.90$21.60$579.4
6$6.44
1.791.03
27.52.30
$37.70$20.90$565.9
0$6.95
1.79.99
26.88.33
$37.80$20.40$569.9
0$6.30
1.79.97
27.07.30
$517.10
$31.70$665.5
0$5.90
24.601.50
31.60.28

Preliminary Draft Document - Subject to ChangeFor Informational Purposes Only - Not for Comment
April 1999
Preliminary Draft Document - Subject to ChangeFor Informational Purposes Only - Not for Comment
April 1999
Total Middle $1,310.20 62.20 $1,296
.00 61.61 $1,299.00 61.73 $2,830
.60 134.50
Total Low $1,977.00 93.90
Total High $8,041.00 381.90

Preliminary Draft Document - Subject to ChangeFor Informational Purposes Only - Not for Comment
April 1999
Preliminary Draft Document - Subject to ChangeFor Informational Purposes Only - Not for Comment
April 1999
Table R-4CPresent Value (PV) & Annualized (AAEV) Value of Recreation Benefits over 100
yearsMillions of 1998 dollars @ Zero% (Tribal rate)
A1PV
A1AAEV
A2PV
A2AAEV
A2'PV
A2'AAEV
A3PV
A3AAEV
ReservoirRecreation
$3,157.00 $31.60 $3,157
.00 $31.60 $3,157 $31.60
River Recreation
LowLow Middle
MiddleMiddle High
High
$4,240.00
$6,141.00
$9,037.00
$15,151
$36,306
42.4061.4090.30
151.50363.00
Recreation Fishing
Resident andSteelhead
Mainstem SalmonUpstreamSteelhead
Upstream Salmon
$184.00
$132.20
$2,877.70
$33.40
1.841.32
28.77.33
$182.80
$116.40
$2,769.20
$31.10
1.831.16
27.69.31
$182.90
$117.40
$2,776.90
$30.60
1.831.1727.7
.31
$2,672.00
$243.50
$3,424.40
$.42
26.722.43
34.24.42

Preliminary Draft Document - Subject to ChangeFor Informational Purposes Only - Not for Comment
April 1999
Preliminary Draft Document - Subject to ChangeFor Informational Purposes Only - Not for Comment
April 1999
Total Middle $6,384.30 63.86 $6,256
.50 62.593 $6,264.80 62.60 $15,41
9.30 154.16
Total Low $10,622.30 106.20
Total High $42,688.30 426.80
Preliminary Draft Document - Subject to ChangeFor Informational Purposes Only - Not for Comment
April 1999
Preliminary Draft Document - Subject to ChangeFor Informational Purposes Only - Not for Comment
April 1999
Table R-5Difference in PV & Annualized (AAEV) Value of Recreation Benefits from
Alternative A1Millions of 1998 dollars @ 6.875% (COE rate)
A2PV
A2AAEV
A2'PV
A2'AAEV
A3PV
A3AAEV
ReservoirRecreation $0 $0 $0 $0 $-459.64 -31.60
River Recreation
LowLow Middle
MiddleMiddle High
High
+$492.80+$714.40+$1,049.
30+$1,756.
50+$4,537.
40
+33.90+49.10+72.10
+120.80+311.90
Recreation Fishing
Resident andSteelhead
Mainstem SalmonUpstreamSteelhead
Upstream Salmon
-$.09-$.01
-$7.72$.56
-.01.00
-.53.04
-$.09-$.54
-$4.29-$.01
-.01-.04-.30.00
+$325.11+$4.47
+$50.96+$.70
+22.35+.31
+3.51-.05
Preliminary Draft Document - Subject to ChangeFor Informational Purposes Only - Not for Comment
April 1999
Preliminary Draft Document - Subject to ChangeFor Informational Purposes Only - Not for Comment
April 1999
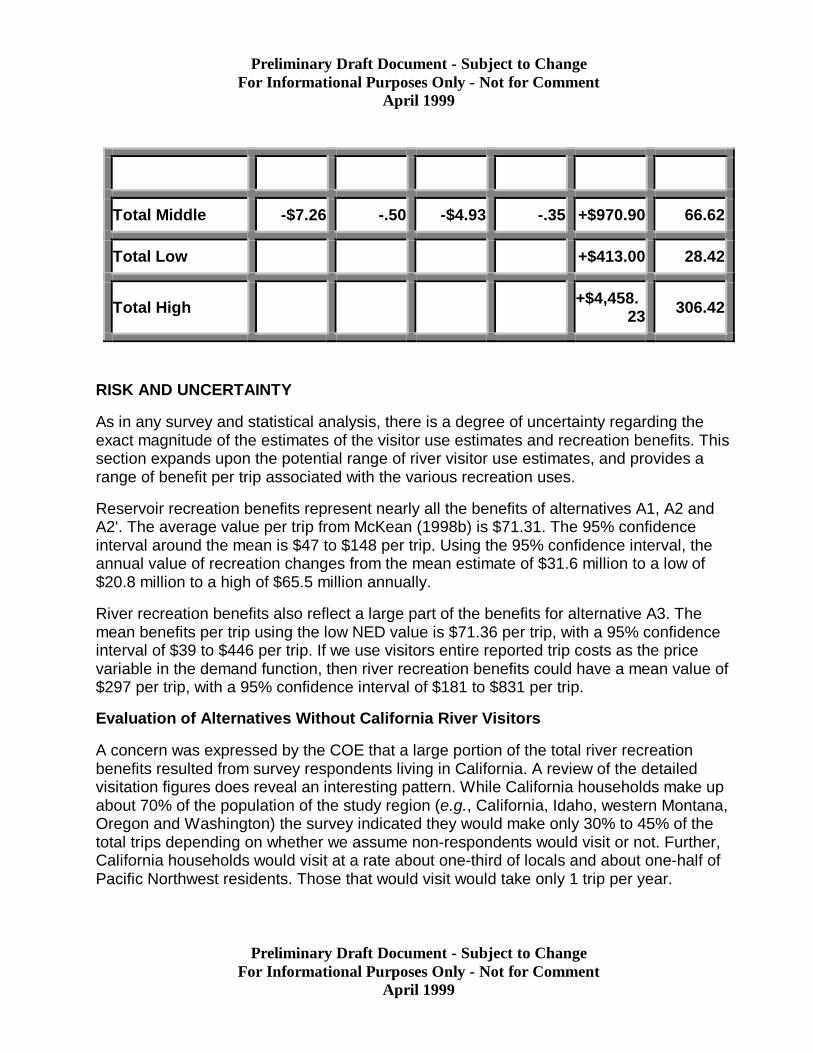
Total Middle -$7.26 -.50 -$4.93 -.35 +$970.90 66.62
Total Low +$413.00 28.42
Total High +$4,458.23 306.42
RISK AND UNCERTAINTY
As in any survey and statistical analysis, there is a degree of uncertainty regarding theexact magnitude of the estimates of the visitor use estimates and recreation benefits. Thissection expands upon the potential range of river visitor use estimates, and provides arange of benefit per trip associated with the various recreation uses.
Reservoir recreation benefits represent nearly all the benefits of alternatives A1, A2 andA2'. The average value per trip from McKean (1998b) is $71.31. The 95% confidenceinterval around the mean is $47 to $148 per trip. Using the 95% confidence interval, theannual value of recreation changes from the mean estimate of $31.6 million to a low of$20.8 million to a high of $65.5 million annually.
River recreation benefits also reflect a large part of the benefits for alternative A3. Themean benefits per trip using the low NED value is $71.36 per trip, with a 95% confidenceinterval of $39 to $446 per trip. If we use visitors entire reported trip costs as the pricevariable in the demand function, then river recreation benefits could have a mean value of$297 per trip, with a 95% confidence interval of $181 to $831 per trip.
Evaluation of Alternatives Without California River Visitors
A concern was expressed by the COE that a large portion of the total river recreationbenefits resulted from survey respondents living in California. A review of the detailedvisitation figures does reveal an interesting pattern. While California households make upabout 70% of the population of the study region (e.g., California, Idaho, western Montana,Oregon and Washington) the survey indicated they would make only 30% to 45% of thetotal trips depending on whether we assume non-respondents would visit or not. Further,California households would visit at a rate about one-third of locals and about one-half ofPacific Northwest residents. Those that would visit would take only 1 trip per year.

Preliminary Draft Document - Subject to ChangeFor Informational Purposes Only - Not for Comment
April 1999
Preliminary Draft Document - Subject to ChangeFor Informational Purposes Only - Not for Comment
April 1999
However, given the long distance of these trips, it is not surprising these trips had a verylong length of stay, of over a week. As a result of their much longer average length of stay,California residents do make up half or more of the visitor days and thus benefits.Currently, the average length of stay of survey respondents visiting the Lower Snake Riverreservoirs is about 3 days in length.
Of course the benefit-cost accounting stance the COE is required to use under the U.S.Water Resources Council is a national one (hence the name National EconomicDevelopment). Therefore, exclusion of benefits arising from one geographic region of thecountry is not permissible unless there is a serious concern regarding its validity. Thespecific concern was that California residents currently do not frequently visit the area andtherefore have lower knowledge of the Lower Snake River than local residents andtherefore these California responses may be less reliable. A review of the California surveyresponses does indicate that only 20% of those California households indicating they woulddefinitely visit if the dams were removed, had visited the Lower Snake River in 1998. We donot know if the other 80% indicating they would definitely visit had visited in previous years,since this question was not asked. However, the concern remains that the surveyresponses for more distant California visitors implies an unusually large percentage of totalvisitation being made up by these distant users. The estimated visitation rates are based on190 returned surveys, so there is not a serious small sample problem. However, Californiadid have the lowest response rate at 28%. This response rate is accounted for in the LowEstimate of visitation this response rate by assuming that the 72% of non-respondentswould not visit at all. But the concern regarding the lower California response rate becomesmore relevant in the Middle Estimate, which makes no adjustment for this lower responserate.
The Low, Low-middle and Middle estimates in all of the tables presented in this chapteruses just those indicating they would definitely visit. Based on the research by Champ, etal. (1997) respondents that are definitely sure of their responses had criterion validity withactual cash payments. Since it is likely that at least some of the respondents indicating theywould Probably Visit the Lower Snake River if the dams were removed may visit, the Low,Low-Middle and Middle estimates are conservative due to the omission of the ProbablyVisit respondents. Further, the Low estimate reduces the Definitely Yes visitation estimateby the survey non-response rate. That is, the Low estimate assumes that none of the non-respondents to the survey would visit the Lower Snake River if the dams were removed.Thus, the Low estimate is doubly conservative.
However, as part of a sensitivity analysis to determine whether the overall NED analysis issensitive to various sources of uncertainty, Table R-6 presents the recreation analysis withCalifornia visitation benefits removed. As can be seen the benefits of Alternative A3 arereduced, although the recreation benefits of A3 still exceed the foregone reservoirrecreation. Nonetheless, the gain is much smaller and this may likely affect the overallbenefit-cost analysis evaluation of the alternatives.

Preliminary Draft Document - Subject to ChangeFor Informational Purposes Only - Not for Comment
April 1999
Preliminary Draft Document - Subject to ChangeFor Informational Purposes Only - Not for Comment
April 1999
Table R6Present Value (PV) & Annualized (AAEV) Value of Recreation Benefits over 100
yearsMillions of 1998 dollars @ 6.875% (COE rate)
California Visitors Removed From River Recreation Scenario
A2 Net A2' Net A3 Net
A1PV
A1AAEV
A2PV
A2AAEV PV
AAEV
A2'PV
A2'
AAEV
PVAAEV
A3PV
A3AAEV(With
outCA)
PVAAEV
ReservoirRecreation
$459.64
$31.6
0
459.6
4
31.60 0 0
459.6
4
31.60 0 0
-$459.64
-$31.60
River Recreation
Low 208.80 14.40
+209.8
0
+14.4
0
Low Middle 235.70 16.20
+235.7
0
+16.2
0
Middle 300.70 20.70
+2300.
70
+20.7
0
Middle High 515.70 35.50
+515.7
0
+35.5
0
High 832.80 57.30
+832.8
0
+57.3
0

Preliminary Draft Document - Subject to ChangeFor Informational Purposes Only - Not for Comment
April 1999
Preliminary Draft Document - Subject to ChangeFor Informational Purposes Only - Not for Comment
April 1999
Recreational Fishing
Resident &Steelhead
$26.1
1
1.79
$26.0
2
1.78
-.09
-.01
$26.0
6
1.79
-.05 .00 $35
1.22 24.14+325.1
1
+22.3
5
MainstemSalmon
$13.7
1.94
$13.7
0.94 -
.01 .00$13.1
7.90 -
.54 .04 $18.18 1.25 +4.
47+0.31
UpstreamSteelhead
$401.54
27.60
$393.80
27.07
-7.7
2
-.53
$397.25
27.30
-4.2
9
-.30
$452.50 31.11 +50
.96+3.51
UpstreamSalmon
$4.39 .30 $4.
95 .34 .56 .04 $4.38 .30 -
.01 .00 $3.69 .25 -.70 -
.05
Without California Visitor Benefits Estimates
Total Middle$905.39
62.23
$898.13
61.73
-7.2
6.50
$900.50
61.90
-4.9
3
-.35
$1,126.3
077.45
+220.9
0
+15.2
2
Total Low$1,035.3
971.15
+130.0
0
+8.92
Total High$1,658.3
9114.05
+753.0
0
+51.8
0
Avoided Cost Analysis
Removal of the dams in alternative A3 will not result in any significant recreationmanagement costs avoided to the COE. Most of the COE recreation maintenance cost isrelated to the developed campground areas and other developed facilities which will remainunder all alternatives. The labor costs associated with rangers will continue as well.

Preliminary Draft Document - Subject to ChangeFor Informational Purposes Only - Not for Comment
April 1999
Preliminary Draft Document - Subject to ChangeFor Informational Purposes Only - Not for Comment
April 1999
Mitigation
The recreation effects from removal of the dams in alternative A3 will not be directlymitigated. Much of the same water based recreation is expected to continue to occur astoday, with the major exception being activities such as waterskiing. The availability ofexisting nearby reservoirs such as Lake Wallula downstream from Ice Harbor dam andnear Tri-Cities, Dworshak Reservoir near Lewiston Idaho and three large lakes nearSpokane (Rufus Woods Lake, Coeur d'Alene and Lake Pend Oreille) provide opportunitiesfor flat water recreation.
PASSIVE USE VALUES OF WILD SALMON AND FREE-FLOWING RIVERS
Avoiding extinction of endangered species is recognized as a source of existence orpassive use values (Meyer, 1974; Randall and Stoll, 1983; Stoll and Johnson, 1984).Existence values are defined as the benefit received from simply knowing the resourceexists even if no use is made of it. Free-flowing rivers, were one of the first examples ofsuch resources with existence values (Krutilla and Fisher, 1975). Essentially people whonever plan to visit, raft, or fish these rivers may still pay something to have a free flowingriver. Wild stocks of Snake River Sockeye and Chinook Salmon clearly fit into this picture.As noted by Olsen, et al. in his existence value of salmon study "Existence values as thevalue an individual (or society) places on the knowledge that a resource exists in a certainstate is theoretically sound and can be measured for assessment within the resourcedecision making arena." Passive use value are also public goods, in that these benefits canbe simultaneously enjoyed by millions of people all across the region and the country(Loomis, 1996a).
Incorporating non-use values has become fairly routine in many Federal benefit-costanalyses for critical habitat designations of endangered species. For example, the USDAEconomic Research Service's economic analysis of salmon recovery efforts on the SnakeRiver included estimates of non-use values drawn from the existing literature (Aillery, et al.1996). Nonetheless, passive-use values are not formally part of the COE's NationalEconomic Development analysis. This may be due, in part, to the benefit-cost procedureswhich must be followed by the COE being originally written about 20 years ago (U.S. WaterResources Council, 1979), before measurement of passive use values had becomecommon. These benefit-cost procedures are silent on measurement of passive use values,although they do allow for measurement of other categories of benefits as long as theprocedures are documented and willingness to pay is used. Passive use values areestimated using a method recommended by the U.S. Water Resources Council for valuingrecreation, but its use to measure passive use values has been controversial (Diamond andHausman, 1996; McFadden, 1994) although it has been given a limited endorsement by aBlue-Ribbon panel chaired by two Nobel Laureate economists (Arrow, et al).
Although the COE will not formally include the passive use values in their official NEDanalysis, the Drawdown Economic Workgroup (DREW) asked that passive use values beincluded in an overall presentation of benefit and cost summary in the Economic Appendix.

Preliminary Draft Document - Subject to ChangeFor Informational Purposes Only - Not for Comment
April 1999
Preliminary Draft Document - Subject to ChangeFor Informational Purposes Only - Not for Comment
April 1999
Therefore, passive use values were calculated to be included in that part of the overalleconomic analysis. DREW had originally requested an original passive use value survey aspart of the recreation survey and such a survey was pretested. However, due to a variety offactors the COE decided the non-use values would be approximated based on existingpassive use value estimates (e.g., using a benefit-transfer approach) rather than a newsurvey as was originally proposed. The final passive use value survey was not conducted.
A passive use value per salmon function was statistically estimated using marginalexistence values per salmon calculated from three previous contingent valuation methodstudies of West Coast residents' WTP for increasing salmon populations. The originalstudies are Olsen, et al., Hanemann, et al., and Loomis, 1996b. The procedures forestimating the function are reported in Loomis, 1999. Using the function the change inannual total passive use values with different levels of wild salmon and wild steelheadrecovery is calculated for non-user households in the Pacific Northwest and California.Data on run size of wild chinook salmon and wild steelhead was obtained from PATHanalyses provided by Shannon Davis. Application of this function to wild salmon andsteelhead populations in alternative A1 is treated as the baseline or future without. Thechange in annual passive use values is then calculated for each of the three alternatives foran increase in wild salmon and steelhead populations.
The natural river drawdown alternative A3, is estimated by PATH to yield a near doubling ofthe wild salmon and wild steelhead run size and therefore produces a $1,040 millionaverage annual increase in passive use values. Given the small reduction in wild salmonand steelhead run sizes of A2 and A2' from the future without (A1), there is a slightreduction in passive use values for A2 (loss of $87 million annually from baseline-A1) andA2' (loss of $29 million annually from baseline A1). A more conservative approach tocalculate the passive use value can be made by matching the change in anadromous fishpopulations in A3 to the one existing study which valued a similar size change in salmon(Loomis, 1996b) rather than using the statistical function estimated from all three studies.The resulting lower estimate of the gain in passive use value would be about $220 millionper year.
However, the $1,040 million for the PATH fisheries biologists estimate of a near doubling ofthe wild salmon and wild steelhead run size in the Snake River is consistent with recentlyreleased results of a survey of Washington residents by Brown, et al., (1999). Theseauthors estimated that Washington residents would pay $307 million annually for adoubling of salmon in eastern Washington and the Columbia River. However, Washingtonresidents reflect only 12% of the households in the Pacific Northwest and California regionused in our analysis. Generalizing the Brown, et al., values to the same geographic regionas used in our analysis, yields a value of $2,557 million for the doubling of salmon runs ineastern Washington and the Columbia River.

Preliminary Draft Document - Subject to ChangeFor Informational Purposes Only - Not for Comment
April 1999
Preliminary Draft Document - Subject to ChangeFor Informational Purposes Only - Not for Comment
April 1999
Also based on the existing literature there appears to be a passive use value of $420million annually for returning the Lower Snake River to a free-flowing condition,independent of any effect on salmon populations. See Loomis, 1999 for literature used anddetails of calculations.
CONCLUSION
If the dam breaching alternative (A3) is implemented on the Lower Snake River it will resultin a loss of some reservoir based recreation activities and replacement with more riverbased recreation activities. Overall both recreational fishing and general recreation use isexpected to increase in ten years once the river is restored and the fisheries respond tonatural river conditions. The present value of recreation benefits accounts for theimmediate impact of the loss of many reservoir recreation activities and the gradual gain inriver recreation activities. The annualized present value of the economic benefits ofrestored river fisheries and river recreation exceeds the loss in reservoir recreation by atleast $28 million per year to as much as $306 million per year with a middle estimate of $66million per year. The incremental passive use values for the increase in anadromous fishdue to the dam breaching is about $1 billion for households in the Pacific Northwest andCalifornia.
References
Aillery, et al., Salmon Recovery in the Pacific Northwest: Agricultural and Other EconomicEffects. Report #727. USDA Economic Research Service, Washington DC.
Arrow, K., R. Solow, P. Portney, E. Leamer, R. Radner and H. Schuman. 1993. Report ofthe NOAA Panel on Contingent Valuation. Federal Register 58(10):4602-4614.
Brown, Gardner, David Layton and Mark Plummer. 1999. Estimated Economic Benefits ofRegulations to Improve Washington State Fisheries. Dept. of Economics, University ofWashington, Seattle (Feb. 4, 1999).
Callaway, John, Shannon Ragland, Salley Keefe, Trudy Cameron and Douglass Shaw.1995. Columbia River System Operation Review Recreation Impacts: Demand Model andSimulation Results.; Appendix J-1, Final Environmental Impact Statement. DOE/EIS-0170,U.S. Army Corps of Engineers, North Pacific Division, Portland, OR
Champ, P., R. Bishop, T. Brown and D. McCollum. 1997. Using Donation Mechanisms toValue Nonuse Benefits from Public Goods. Journal of Environmental Economics andManagement 33(2):151-162.
Diamond, P. and J. Hausman. 1994. Contingent Valuation: Is Some Number Better than NoNumber? Journal of Economic Perspectives 8:45-64.
Krutilla, John and Anthony Fisher. 1975. The Economics of Natural Environments.Resources for the Future, Johns Hopkins University Press. Washington DC.
Preliminary Draft Document - Subject to ChangeFor Informational Purposes Only - Not for Comment
April 1999
Preliminary Draft Document - Subject to ChangeFor Informational Purposes Only - Not for Comment
April 1999
Hanemann, Michael, John Loomis and Barbara Kanninen. 1991. Statistical Efficiency ofDouble Bounded Dichotomous Choice Contingent Valuation. American Journal ofAgricultural Economics, Volume 73(4): 1255-1263.
Loomis, J. 1993. "An Investigation into the Reliability of Intended Visitation Behavior."Environmental and Resource Economics. 3:183-91.
Loomis, John. 1996a. How Large is the Extent of the Market for Public Goods: Evidencefrom a Nationwide Contingent Valuation Survey. Applied Economics 28:779-782.
Loomis, John. 1996b. Measuring the Economic Benefits of Removing Dams and Restoringthe Elwha River: Results of a Contingent Valuation Survey. Water Resources Research,32(2):441-447.
Loomis, John. 1999. Recreation and Passive Use Values from Removing the Dams on theLower Snake River to Increase Salmon. Report from AEI to U.S. Army Corps of Engineers,Walla Walla, WA.
Loomis, John and Richard Walsh. 1997. Recreation Economic Decisions: ComparingBenefits and Costs. 2nd. Edition. Venture Publishing, State College, PA.
McFadden, D. 1994. Contingent Valuation and Social Choice. American Journal ofAgricultural Economics 76(4): 689-708.
McKean, John. 1998a. Sportfishing Use and Value on the Lower Snake River Reservoirs.Agricultural Enterprises Inc., Masonville, CO.
McKean, John. 1998b. Outdoor Recreation Use and Value on Lower Snake RiverReservoirs. Agricultural Enterprises Inc., Masonville, CO.
McKean, John. 1998c. Sportfishing Use and Value on the Free Flowing Snake River AboveLewiston. Agricultural Enterprises Inc., Masonville, CO.
McKean, John. 1999a. The Sportfishing Use and Value in the Snake River Basin in CentralIdaho, 1999. Agricultural Enterprises Inc., Masonville, CO.
McKean, John. 1999b. Outdoor Recreation Use and Value in the Snake River Basin inCentral Idaho, 1999. Agricultural Enterprises Inc., Masonville, CO.
Meyer, Phillip. 1974. Recreation and Preservation Values Associated With Salmon of theFrasier River. Environment Canada. PAC/IN-74-1, Vancouver, Canada.
Normandeau Associates and David Bennett. 1999. Draft Resident Fish Appendix, LowerSnake River Juvenile Salmon Migration Feasibility Study EIS.
Olsen, Darryll, Jack Richards and R.Douglas Scott. 1991. Existence and Sport Values forDoubling the Size of Columbia River Basin Salmon and Steelhead Runs. Rivers 2(1):44-56.

Preliminary Draft Document - Subject to ChangeFor Informational Purposes Only - Not for Comment
April 1999
Preliminary Draft Document - Subject to ChangeFor Informational Purposes Only - Not for Comment
April 1999
Pate, Jennifer and John Loomis. 1997. The Effect of Distance on Willingness to PayValues: A Case Study of Wetlands and Salmon in California. Ecological Economics 20:199-207.
Radtke, Hans, Shannon Davis and Rebecca Johnson. 1999. Anadromous Fish EconomicAnalysis. Lower Snake River Juvenile Salmon Migration Feasibility Study EIS.
Randall, Alan and John Stoll. 1983. "Existence and Sport Values in a Total ValuationFramework." in R. Rowe and L. Chestnut, Managing Air Quality and Scenic Resources atNational Parks and Wilderness Areas. Westview Press: Boulder, CO.
Sassone, Peter and William Schaeffer. 1978. Cost-Benefit Analysis: A Handbook.Academic Press, San Diego, CA.
Stoll, John and Lee Ann Johnson. 1984. Concepts of Value, Nonmarket Valuation and theCase of the Whooping Crane. Transactions of the 49th North American Wildlife and NaturalResources Conference, Wildlife Management Institute. Washington DC.
U.S. Water Resources. 1979. Procedures for Evaluation of National EconomicDevelopment (NED): Benefits and Costs of Water Resources Planning (Level C) FinalRule. Federal Register 44(242): 72892-977.
U.S. Water Resources Council. 1983. Economic and Environmental Principles andGuidelines for Water and Related Land Resources Implementation Studies. U.S.Government Printing Office, Washington DC. March 10, 1983.