preliminary evaluation of ground motions from earthquakes
TRANSCRIPT
Preliminary Evaluation of Ground Motions fromEarthquakes in Albertaby Mark Novakovic and Gail M. Atkinson
INTRODUCTION
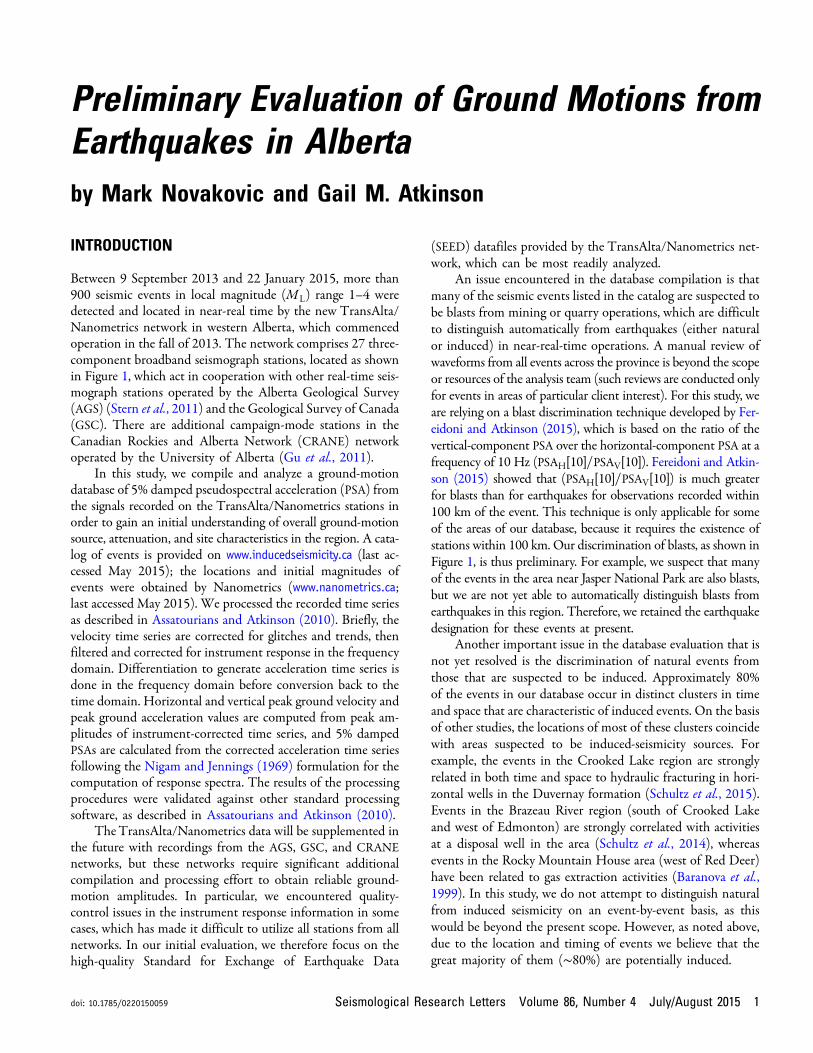
Between 9 September 2013 and 22 January 2015, more than900 seismic events in local magnitude (ML) range 1–4 weredetected and located in near-real time by the new TransAlta/Nanometrics network in western Alberta, which commencedoperation in the fall of 2013. The network comprises 27 three-component broadband seismograph stations, located as shownin Figure 1, which act in cooperation with other real-time seis-mograph stations operated by the Alberta Geological Survey(AGS) (Stern et al., 2011) and the Geological Survey of Canada(GSC). There are additional campaign-mode stations in theCanadian Rockies and Alberta Network (CRANE) networkoperated by the University of Alberta (Gu et al., 2011).
In this study, we compile and analyze a ground-motiondatabase of 5% damped pseudospectral acceleration (PSA) fromthe signals recorded on the TransAlta/Nanometrics stations inorder to gain an initial understanding of overall ground-motionsource, attenuation, and site characteristics in the region. A cata-log of events is provided on www.inducedseismicity.ca (last ac-cessed May 2015); the locations and initial magnitudes ofevents were obtained by Nanometrics (www.nanometrics.ca;last accessed May 2015). We processed the recorded time seriesas described in Assatourians and Atkinson (2010). Briefly, thevelocity time series are corrected for glitches and trends, thenfiltered and corrected for instrument response in the frequencydomain. Differentiation to generate acceleration time series isdone in the frequency domain before conversion back to thetime domain. Horizontal and vertical peak ground velocity andpeak ground acceleration values are computed from peak am-plitudes of instrument-corrected time series, and 5% dampedPSAs are calculated from the corrected acceleration time seriesfollowing the Nigam and Jennings (1969) formulation for thecomputation of response spectra. The results of the processingprocedures were validated against other standard processingsoftware, as described in Assatourians and Atkinson (2010).
TheTransAlta/Nanometrics data will be supplemented inthe future with recordings from the AGS, GSC, and CRANEnetworks, but these networks require significant additionalcompilation and processing effort to obtain reliable ground-motion amplitudes. In particular, we encountered quality-control issues in the instrument response information in somecases, which has made it difficult to utilize all stations from allnetworks. In our initial evaluation, we therefore focus on thehigh-quality Standard for Exchange of Earthquake Data
(SEED) datafiles provided by the TransAlta/Nanometrics net-work, which can be most readily analyzed.
An issue encountered in the database compilation is thatmany of the seismic events listed in the catalog are suspected tobe blasts from mining or quarry operations, which are difficultto distinguish automatically from earthquakes (either naturalor induced) in near-real-time operations. A manual review ofwaveforms from all events across the province is beyond the scopeor resources of the analysis team (such reviews are conducted onlyfor events in areas of particular client interest). For this study, weare relying on a blast discrimination technique developed by Fer-eidoni and Atkinson (2015), which is based on the ratio of thevertical-component PSA over the horizontal-component PSA at afrequency of 10 Hz (PSAH�10�=PSAV �10�). Fereidoni and Atkin-son (2015) showed that (PSAH�10�=PSAV �10�) is much greaterfor blasts than for earthquakes for observations recorded within100 km of the event. This technique is only applicable for someof the areas of our database, because it requires the existence ofstations within 100 km. Our discrimination of blasts, as shown inFigure 1, is thus preliminary. For example, we suspect that manyof the events in the area near Jasper National Park are also blasts,but we are not yet able to automatically distinguish blasts fromearthquakes in this region. Therefore, we retained the earthquakedesignation for these events at present.
Another important issue in the database evaluation that isnot yet resolved is the discrimination of natural events fromthose that are suspected to be induced. Approximately 80%of the events in our database occur in distinct clusters in timeand space that are characteristic of induced events. On the basisof other studies, the locations of most of these clusters coincidewith areas suspected to be induced-seismicity sources. Forexample, the events in the Crooked Lake region are stronglyrelated in both time and space to hydraulic fracturing in hori-zontal wells in the Duvernay formation (Schultz et al., 2015).Events in the Brazeau River region (south of Crooked Lakeand west of Edmonton) are strongly correlated with activitiesat a disposal well in the area (Schultz et al., 2014), whereasevents in the Rocky Mountain House area (west of Red Deer)have been related to gas extraction activities (Baranova et al.,1999). In this study, we do not attempt to distinguish naturalfrom induced seismicity on an event-by-event basis, as thiswould be beyond the present scope. However, as noted above,due to the location and timing of events we believe that thegreat majority of them (∼80%) are potentially induced.
doi: 10.1785/0220150059 Seismological Research Letters Volume 86, Number 4 July/August 2015 1
MAGNITUDE EVALUATIONS
For each event in the database, we estimated the moment mag-nitude (M) using the PSA-based algorithm of Atkinson et al.(2014, hereafter denoted as AGY14):
M � flog10�PSAT � − CT � log10�Z�R�� � γTRg=1:45; �1�in which R is the hypocentral distance and
Z�R� � 1:3 log10�R� for R ≤ 50 km �2a�and
Z�R� � 1:3 log10�20� � 0:5 log10�R=50� for R > 50 km:
�2b�PSAT is the PSA value of the vertical component at period T ,CT is an empirical calibration term, γT is the anelastic attenu-ation term at period T , and Z�R� is a geometric spreadingmodel. As recommended by AGY14 model, we set the focaldepth (h) to 5 km to enable a rapid and robust determinationof R, even if the depth is not well known. The computed valueof R is not sensitive to h, with the exception of the rare ob-servations that are made very close to the source. Our prelimi-nary evaluation of attenuation (as shown later in this article)suggests that the western North American (WNA) crustal at-
tenuation model is appropriate for the study events in this re-gion, regardless of whether the events are east or west of thedeformation front that marks the edge of the RockyMountains(visible in Fig. 1). For WNA, AGY14 model gives recom-mended values for γT and CT as noted in Table 1, whichwe adopt for use in magnitude determination.
We use equation (1) to calculate M for each observation,based on the observed PSAV and R. AGY14 model suggeststhat M be calculated from the 1 Hz PSA in general but thatfor events ofM <3 it is preferable to use the 3.33 Hz PSA dueto noise issues that inflate the 1 Hz amplitudes. A questionthen arises as to which ground-motion measure to use forevents that are close to M 3, because slightly different valueswill result based upon this choice. Moreover, the estimatedvalue will also depend somewhat on the distance constraintsapplied, because noise issues become more problematic formore distant stations. Based on our preliminary evaluation ofthe ground-motion data and its attenuation and noise behaviorwith distance, we restricted the distance range of stations usedin magnitude determination as follows: we use all stations withR < 150 km for events of M ≤2:6 and all stations withR < 300 km for events with M >2:6. As a quality-controlmeasure, we exclude any station for which the value of Mexceeds �2σ of the event average, in which σ is the standarddeviation. The average M for each event is recalculated afterthis initial screening, using both the 1.00 and 3.33 Hzdefinitions (denoted M�1 Hz� and M�3:33 Hz�). The finalM assigned to an event is determined based on the followingcriteria:1. if M�1 Hz� <3 and M�3:33 Hz� <3, then
M � M�3:33 Hz�; or2. if M�1 Hz� ≥3 and M�3:33 Hz� ≥3, then
M � M�1 Hz�; otherwise3. M � �M�1 Hz� �M�3:33 Hz��=2.
In other words, we use the 3.33 Hz measure ifM is clearlybelow 3, the 1 Hz measure ifM is clearly above 3, or an averageof the two if the measures are ambiguous.
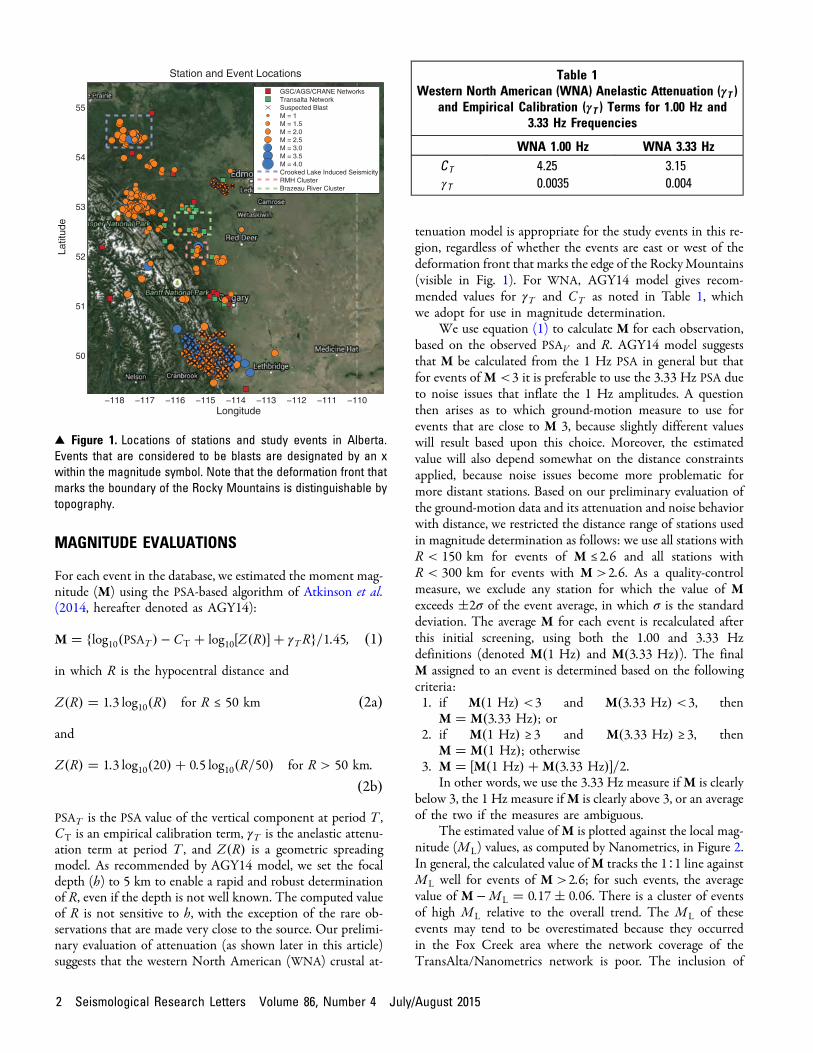
The estimated value ofM is plotted against the local mag-nitude (ML) values, as computed by Nanometrics, in Figure 2.In general, the calculated value ofM tracks the 1∶1 line againstML well for events of M >2:6; for such events, the averagevalue of M −ML � 0:17� 0:06. There is a cluster of eventsof high ML relative to the overall trend. The ML of theseevents may tend to be overestimated because they occurredin the Fox Creek area where the network coverage of theTransAlta/Nanometrics network is poor. The inclusion of
−118 −117 −116 −115 −114 −113 −112 −111 −110
50
51
52
53
54
55
Station and Event Locations
Longitude
Latit
ude
GSC/AGS/CRANE NetworksTransalta NetworkSuspected BlastM = 1M = 1.5M = 2.0M = 2.5M = 3.0M = 3.5M = 4.0Crooked Lake Induced SeismicityRMH ClusterBrazeau River Cluster
▴ Figure 1. Locations of stations and study events in Alberta.Events that are considered to be blasts are designated by an xwithin the magnitude symbol. Note that the deformation front thatmarks the boundary of the Rocky Mountains is distinguishable bytopography.
Table 1Western North American (WNA) Anelastic Attenuation (γT )
and Empirical Calibration (γT ) Terms for 1.00 Hz and3.33 Hz Frequencies
WNA 1.00 Hz WNA 3.33 HzCT 4.25 3.15γT 0.0035 0.004
2 Seismological Research Letters Volume 86, Number 4 July/August 2015
distant noisy stations may have biased the magnitude estimatesfor these events. The low-magnitude range on Figure 2 is alsoaffected by noise issues, as indicated by the departure of theMLversus M trend from the 1∶1 line. For very weak motions,the response of an oscillator is driven by low-frequency noise,even at higher frequencies. The ideal solution would be to havequieter sites, but this would require expensive borehole instal-lations. A more practical alternative (at least in the short term)is to devise an appropriate correction for the noise to reducethe bias in the determined values of M. By inspection of Fig-ure 2, we suggest that such a correction for the stations of theTransAlta/Nanometrics network in western Alberta is givenby the line
Mcorr � 2M − 2:6 for M <2:6; �3�in which Mcorr is the noise-corrected estimate of the momentmagnitude, based on the computed value of M.
EVALUATION OF GROUND MOTIONS
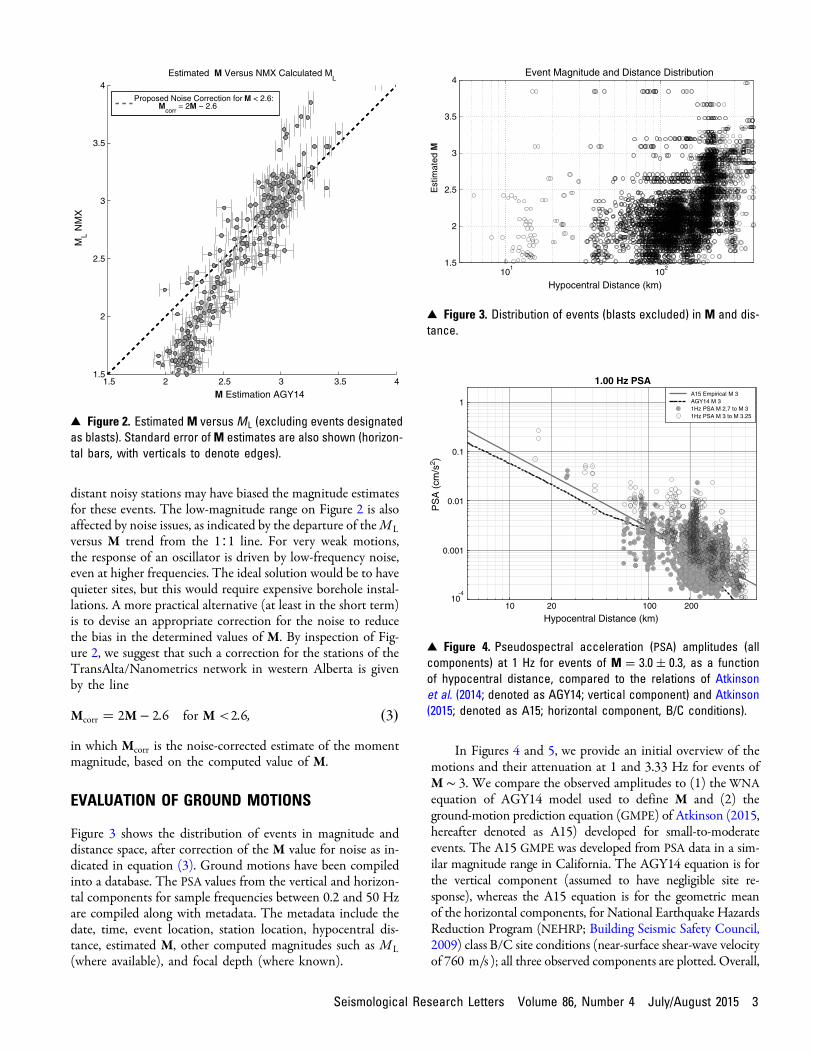
Figure 3 shows the distribution of events in magnitude anddistance space, after correction of the M value for noise as in-dicated in equation (3). Ground motions have been compiledinto a database. The PSA values from the vertical and horizon-tal components for sample frequencies between 0.2 and 50 Hzare compiled along with metadata. The metadata include thedate, time, event location, station location, hypocentral dis-tance, estimated M, other computed magnitudes such as ML(where available), and focal depth (where known).
In Figures 4 and 5, we provide an initial overview of themotions and their attenuation at 1 and 3.33 Hz for events ofM ∼ 3. We compare the observed amplitudes to (1) the WNAequation of AGY14 model used to define M and (2) theground-motion prediction equation (GMPE) of Atkinson (2015,hereafter denoted as A15) developed for small-to-moderateevents. The A15 GMPE was developed from PSA data in a sim-ilar magnitude range in California. The AGY14 equation is forthe vertical component (assumed to have negligible site re-sponse), whereas the A15 equation is for the geometric meanof the horizontal components, for National Earthquake HazardsReduction Program (NEHRP; Building Seismic Safety Council,2009) class B/C site conditions (near-surface shear-wave velocityof 760 m=s ); all three observed components are plotted. Overall,
1.5 2 2.5 3 3.5 41.5
2
2.5
3
3.5
4Estimated M Versus NMX Calculated M
L
M Estimation AGY14
ML N
MX
Proposed Noise Correction for M < 2.6:M
corr = 2M − 2.6
▴ Figure 2. EstimatedM versusML (excluding events designatedas blasts). Standard error ofM estimates are also shown (horizon-tal bars, with verticals to denote edges).
101
102
1.5
2
2.5
3
3.5
4Event Magnitude and Distance Distribution
Hypocentral Distance (km)
Est
imat
ed M
▴ Figure 3. Distribution of events (blasts excluded) in M and dis-tance.
10 20 100 20010
-4
0.001
0.01
0.1
1
Hypocentral Distance (km)
PS
A (
cm/s
2 )
A15 Empirical M 3AGY14 M 31Hz PSA M 2.7 to M 31Hz PSA M 3 to M 3.25
1.00 Hz PSA
▴ Figure 4. Pseudospectral acceleration (PSA) amplitudes (allcomponents) at 1 Hz for events of M � 3:0� 0:3, as a functionof hypocentral distance, compared to the relations of Atkinsonet al. (2014; denoted as AGY14; vertical component) and Atkinson(2015; denoted as A15; horizontal component, B/C conditions).
Seismological Research Letters Volume 86, Number 4 July/August 2015 3
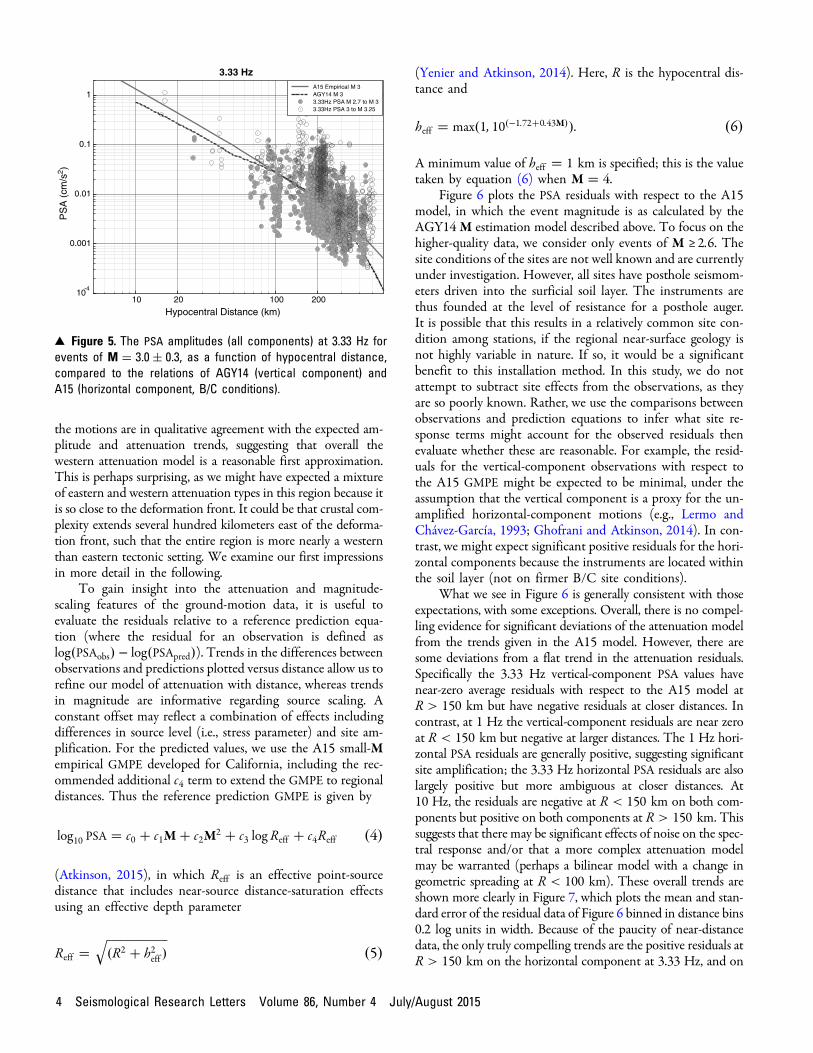
the motions are in qualitative agreement with the expected am-plitude and attenuation trends, suggesting that overall thewestern attenuation model is a reasonable first approximation.This is perhaps surprising, as we might have expected a mixtureof eastern and western attenuation types in this region because itis so close to the deformation front. It could be that crustal com-plexity extends several hundred kilometers east of the deforma-tion front, such that the entire region is more nearly a westernthan eastern tectonic setting. We examine our first impressionsin more detail in the following.
To gain insight into the attenuation and magnitude-scaling features of the ground-motion data, it is useful toevaluate the residuals relative to a reference prediction equa-tion (where the residual for an observation is defined aslog�PSAobs� − log�PSApred�). Trends in the differences betweenobservations and predictions plotted versus distance allow us torefine our model of attenuation with distance, whereas trendsin magnitude are informative regarding source scaling. Aconstant offset may reflect a combination of effects includingdifferences in source level (i.e., stress parameter) and site am-plification. For the predicted values, we use the A15 small-Mempirical GMPE developed for California, including the rec-ommended additional c4 term to extend the GMPE to regionaldistances. Thus the reference prediction GMPE is given by
log10 PSA � c0 � c1M� c2M2 � c3 log Reff � c4Reff �4�
(Atkinson, 2015), in which Reff is an effective point-sourcedistance that includes near-source distance-saturation effectsusing an effective depth parameter
Reff �����������������������
�R2 � h2eff �q
�5�
(Yenier and Atkinson, 2014). Here, R is the hypocentral dis-tance and
heff � max�1; 10�−1:72�0:43M��: �6�
A minimum value of heff � 1 km is specified; this is the valuetaken by equation (6) when M � 4.
Figure 6 plots the PSA residuals with respect to the A15model, in which the event magnitude is as calculated by theAGY14 M estimation model described above. To focus on thehigher-quality data, we consider only events of M ≥2:6. Thesite conditions of the sites are not well known and are currentlyunder investigation. However, all sites have posthole seismom-eters driven into the surficial soil layer. The instruments arethus founded at the level of resistance for a posthole auger.It is possible that this results in a relatively common site con-dition among stations, if the regional near-surface geology isnot highly variable in nature. If so, it would be a significantbenefit to this installation method. In this study, we do notattempt to subtract site effects from the observations, as theyare so poorly known. Rather, we use the comparisons betweenobservations and prediction equations to infer what site re-sponse terms might account for the observed residuals thenevaluate whether these are reasonable. For example, the resid-uals for the vertical-component observations with respect tothe A15 GMPE might be expected to be minimal, under theassumption that the vertical component is a proxy for the un-amplified horizontal-component motions (e.g., Lermo andChávez-García, 1993; Ghofrani and Atkinson, 2014). In con-trast, we might expect significant positive residuals for the hori-zontal components because the instruments are located withinthe soil layer (not on firmer B/C site conditions).
What we see in Figure 6 is generally consistent with thoseexpectations, with some exceptions. Overall, there is no compel-ling evidence for significant deviations of the attenuation modelfrom the trends given in the A15 model. However, there aresome deviations from a flat trend in the attenuation residuals.Specifically the 3.33 Hz vertical-component PSA values havenear-zero average residuals with respect to the A15 model atR > 150 km but have negative residuals at closer distances. Incontrast, at 1 Hz the vertical-component residuals are near zeroat R < 150 km but negative at larger distances. The 1 Hz hori-zontal PSA residuals are generally positive, suggesting significantsite amplification; the 3.33 Hz horizontal PSA residuals are alsolargely positive but more ambiguous at closer distances. At10 Hz, the residuals are negative at R < 150 km on both com-ponents but positive on both components at R > 150 km. Thissuggests that there may be significant effects of noise on the spec-tral response and/or that a more complex attenuation modelmay be warranted (perhaps a bilinear model with a change ingeometric spreading at R < 100 km). These overall trends areshown more clearly in Figure 7, which plots the mean and stan-dard error of the residual data of Figure 6 binned in distance bins0.2 log units in width. Because of the paucity of near-distancedata, the only truly compelling trends are the positive residuals atR > 150 km on the horizontal component at 3.33 Hz, and on
10 20 100 20010
-4
0.001
0.01
0.1
1
Hypocentral Distance (km)
PS
A (
cm/s
2 )
A15 Empirical M 3AGY14 M 33.33Hz PSA M 2.7 to M 33.33Hz PSA 3 to M 3.25
3.33 Hz
▴ Figure 5. The PSA amplitudes (all components) at 3.33 Hz forevents of M � 3:0� 0:3, as a function of hypocentral distance,compared to the relations of AGY14 (vertical component) andA15 (horizontal component, B/C conditions).
4 Seismological Research Letters Volume 86, Number 4 July/August 2015

both components at 10 Hz. The attenuation model will be re-fined because more observations at close distances are obtained,enabling the trends to be more accurately defined.
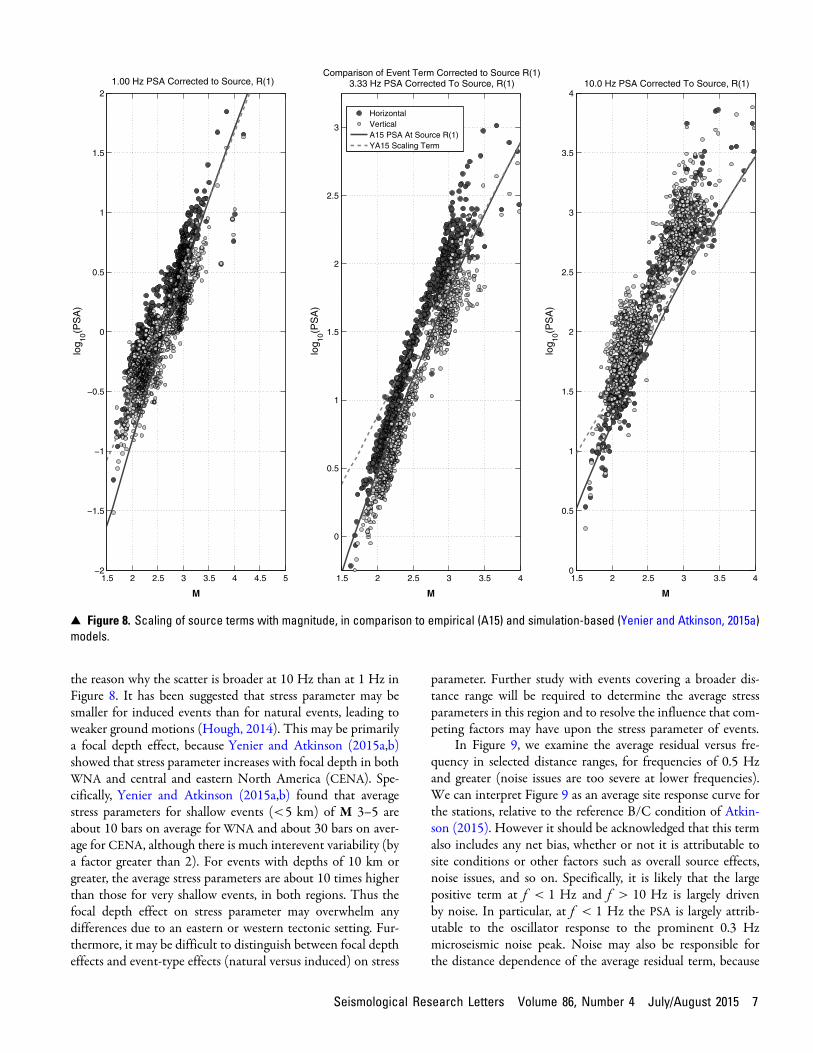
If we subtract the terms in c3 and c4 of equation (4) fromthe observed PSA for each station, we can determine average
source terms for each event; these are the amplitudes thatwould be observed at near-source distances. Figure 8 plots thesesource terms relative to the empirical A15 model. The expectedmagnitude scaling based on the point-source simulation modelof Yenier and Atkinson (2015a) for California is also shown
3.33 Hz Horizontal Component 3.33 Hz Vertical Component
101
102
−1.5
−1
−0.5
0
0.5
1
1.5
Hypocentral Distance (km)
log 10
(PS
A)
Res
idua
ls10
(PSA) Residuals With Respect To A15
1.00 Hz Horizontal Component
2.6 =< M < 3.23.2 =< M
1.00 Hz Vertical Component
10.0 Hz Horizontal Component 10.0 Hz Vertical Component
101
102
−1.5
−1
−0.5
0
0.5
1
1.5
Hypocentral Distance (km)
log 10
(PS
A)
Res
idua
ls
101
102
−1.5
−1
−0.5
0
0.5
1
1.5
Hypocentral Distance (km)
log 10
(PS
A)
Res
idua
ls
101
102
−1.5
−1
−0.5
0
0.5
1
1.5
Hypocentral Distance (km)
log 10
(PS
A)
Res
idua
ls
101
102
−1.5
−1
−0.5
0
0.5
1
1.5
Hypocentral Distance (km)
log 10
(PS
A)
Res
idua
ls
101
102
−1.5
−1
−0.5
0
0.5
1
1.5
Hypocentral Distance (km)
log 10
(PS
A)
Res
idua
ls
log
▴ Figure 6. The PSA residuals forM ≥2:6 for PSA at (top) 1.00 Hz, (middle) 3.33 Hz, and (bottom) 10 Hz for (left) horizontal and (right) verticalcomponents. (Blasts have been removed.)
Seismological Research Letters Volume 86, Number 4 July/August 2015 5
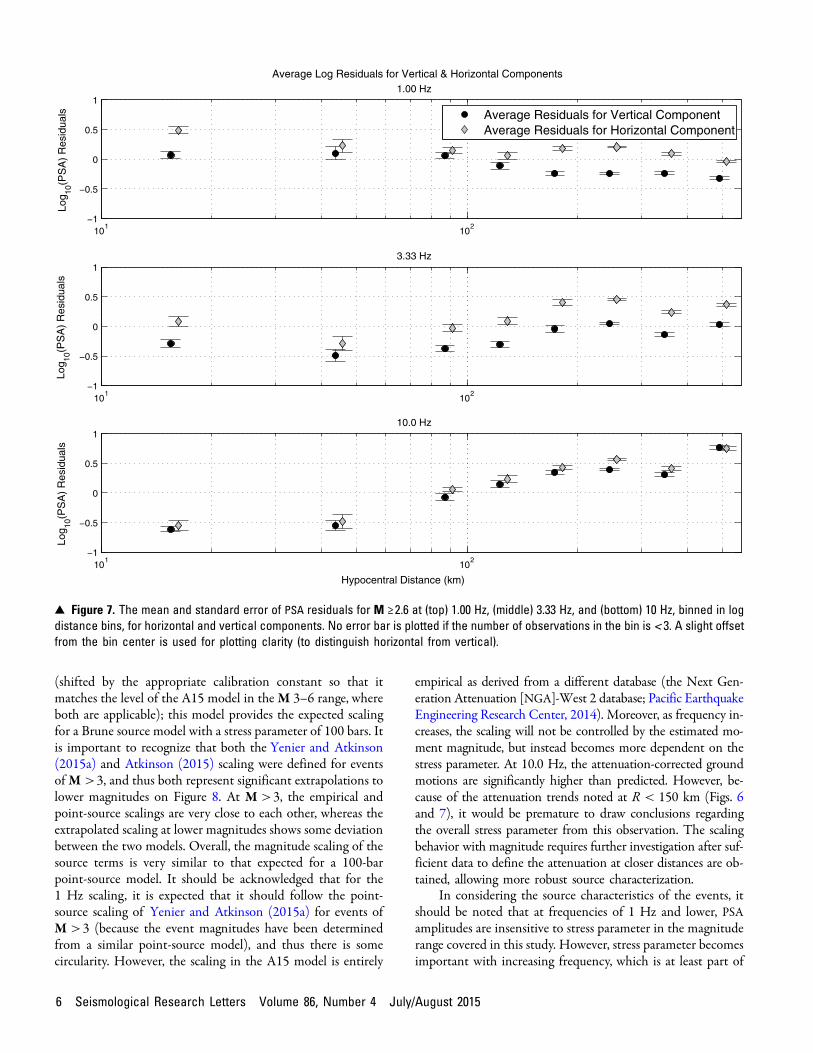
(shifted by the appropriate calibration constant so that itmatches the level of the A15 model in theM 3–6 range, whereboth are applicable); this model provides the expected scalingfor a Brune source model with a stress parameter of 100 bars. Itis important to recognize that both the Yenier and Atkinson(2015a) and Atkinson (2015) scaling were defined for eventsofM >3, and thus both represent significant extrapolations tolower magnitudes on Figure 8. At M >3, the empirical andpoint-source scalings are very close to each other, whereas theextrapolated scaling at lower magnitudes shows some deviationbetween the two models. Overall, the magnitude scaling of thesource terms is very similar to that expected for a 100-barpoint-source model. It should be acknowledged that for the1 Hz scaling, it is expected that it should follow the point-source scaling of Yenier and Atkinson (2015a) for events ofM >3 (because the event magnitudes have been determinedfrom a similar point-source model), and thus there is somecircularity. However, the scaling in the A15 model is entirely
empirical as derived from a different database (the Next Gen-eration Attenuation [NGA]-West 2 database; Pacific EarthquakeEngineering Research Center, 2014). Moreover, as frequency in-creases, the scaling will not be controlled by the estimated mo-ment magnitude, but instead becomes more dependent on thestress parameter. At 10.0 Hz, the attenuation-corrected groundmotions are significantly higher than predicted. However, be-cause of the attenuation trends noted at R < 150 km (Figs. 6and 7), it would be premature to draw conclusions regardingthe overall stress parameter from this observation. The scalingbehavior with magnitude requires further investigation after suf-ficient data to define the attenuation at closer distances are ob-tained, allowing more robust source characterization.
In considering the source characteristics of the events, itshould be noted that at frequencies of 1 Hz and lower, PSAamplitudes are insensitive to stress parameter in the magnituderange covered in this study. However, stress parameter becomesimportant with increasing frequency, which is at least part of
101
102
−1
−0.5
0
0.5
1
Average Log Residuals for Vertical & Horizontal Components1.00 Hz
Log 10
(PS
A)
Res
idua
ls
101
102
−1
−0.5
0
0.5
13.33 Hz
Log 10
(PS
A)
Res
idua
ls
101
102
−1
−0.5
0
0.5
110.0 Hz
Hypocentral Distance (km)
Log 10
(PS
A)
Res
idua
ls
Average Residuals for Vertical ComponentAverage Residuals for Horizontal Component
▴ Figure 7. The mean and standard error of PSA residuals for M ≥2:6 at (top) 1.00 Hz, (middle) 3.33 Hz, and (bottom) 10 Hz, binned in logdistance bins, for horizontal and vertical components. No error bar is plotted if the number of observations in the bin is < 3. A slight offsetfrom the bin center is used for plotting clarity (to distinguish horizontal from vertical).
6 Seismological Research Letters Volume 86, Number 4 July/August 2015
the reason why the scatter is broader at 10 Hz than at 1 Hz inFigure 8. It has been suggested that stress parameter may besmaller for induced events than for natural events, leading toweaker ground motions (Hough, 2014). This may be primarilya focal depth effect, because Yenier and Atkinson (2015a,b)showed that stress parameter increases with focal depth in bothWNA and central and eastern North America (CENA). Spe-cifically, Yenier and Atkinson (2015a,b) found that averagestress parameters for shallow events (<5 km) of M 3–5 areabout 10 bars on average for WNA and about 30 bars on aver-age for CENA, although there is much interevent variability (bya factor greater than 2). For events with depths of 10 km orgreater, the average stress parameters are about 10 times higherthan those for very shallow events, in both regions. Thus thefocal depth effect on stress parameter may overwhelm anydifferences due to an eastern or western tectonic setting. Fur-thermore, it may be difficult to distinguish between focal deptheffects and event-type effects (natural versus induced) on stress
parameter. Further study with events covering a broader dis-tance range will be required to determine the average stressparameters in this region and to resolve the influence that com-peting factors may have upon the stress parameter of events.
In Figure 9, we examine the average residual versus fre-quency in selected distance ranges, for frequencies of 0.5 Hzand greater (noise issues are too severe at lower frequencies).We can interpret Figure 9 as an average site response curve forthe stations, relative to the reference B/C condition of Atkin-son (2015). However it should be acknowledged that this termalso includes any net bias, whether or not it is attributable tosite conditions or other factors such as overall source effects,noise issues, and so on. Specifically, it is likely that the largepositive term at f < 1 Hz and f > 10 Hz is largely drivenby noise. In particular, at f < 1 Hz the PSA is largely attrib-utable to the oscillator response to the prominent 0.3 Hzmicroseismic noise peak. Noise may also be responsible forthe distance dependence of the average residual term, because
1.5 2 2.5 3 3.5 4 4.5 5−2
−1.5
−1
−0.5
0
0.5
1
1.5
21.00 Hz PSA Corrected to Source, R(1)
M
log 10
(PS
A)
1.5 2 2.5 3 3.5 4
0
0.5
1
1.5
2
2.5
3
M
log 10
(PS
A)
Comparison of Event Term Corrected to Source R(1)3.33 Hz PSA Corrected To Source, R(1)
1.5 2 2.5 3 3.5 40
0.5
1
1.5
2
2.5
3
3.5
4
M
log 10
(PS
A)
10.0 Hz PSA Corrected To Source, R(1)
HorizontalVerticalA15 PSA At Source R(1)YA15 Scaling Term
▴ Figure 8. Scaling of source terms with magnitude, in comparison to empirical (A15) and simulation-based (Yenier and Atkinson, 2015a)models.
Seismological Research Letters Volume 86, Number 4 July/August 2015 7
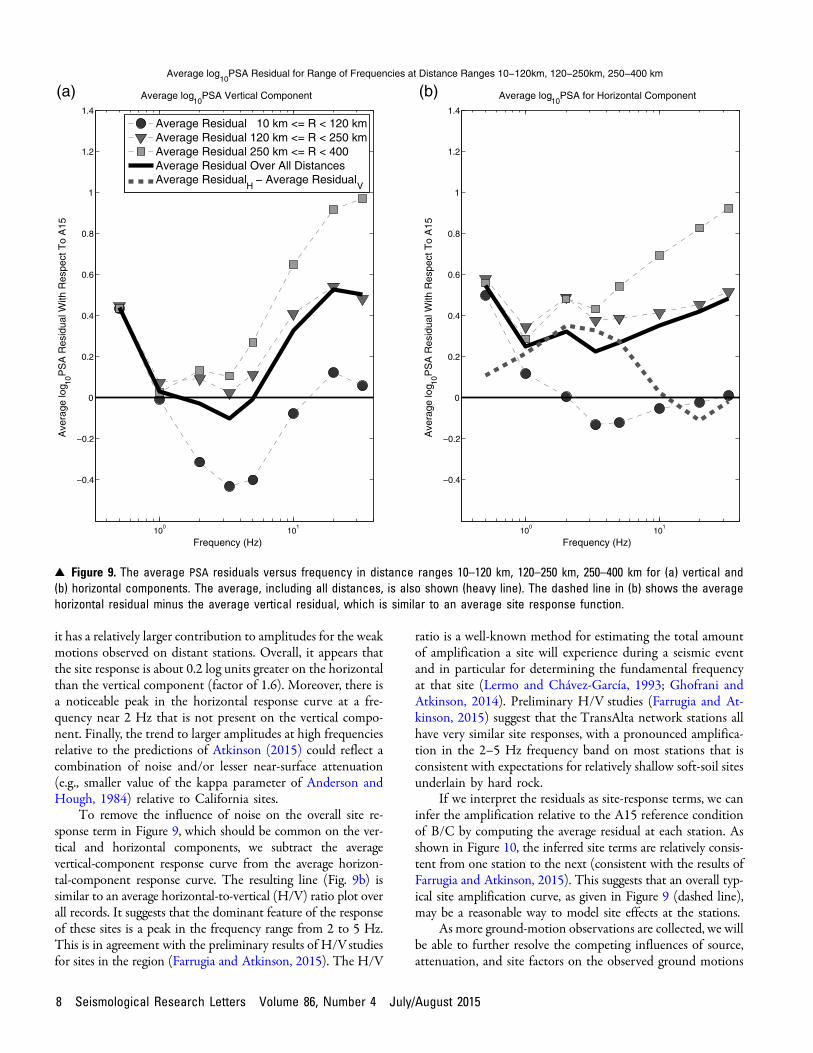
it has a relatively larger contribution to amplitudes for the weakmotions observed on distant stations. Overall, it appears thatthe site response is about 0.2 log units greater on the horizontalthan the vertical component (factor of 1.6). Moreover, there isa noticeable peak in the horizontal response curve at a fre-quency near 2 Hz that is not present on the vertical compo-nent. Finally, the trend to larger amplitudes at high frequenciesrelative to the predictions of Atkinson (2015) could reflect acombination of noise and/or lesser near-surface attenuation(e.g., smaller value of the kappa parameter of Anderson andHough, 1984) relative to California sites.
To remove the influence of noise on the overall site re-sponse term in Figure 9, which should be common on the ver-tical and horizontal components, we subtract the averagevertical-component response curve from the average horizon-tal-component response curve. The resulting line (Fig. 9b) issimilar to an average horizontal-to-vertical (H/V) ratio plot overall records. It suggests that the dominant feature of the responseof these sites is a peak in the frequency range from 2 to 5 Hz.This is in agreement with the preliminary results of H/Vstudiesfor sites in the region (Farrugia and Atkinson, 2015). The H/V
ratio is a well-known method for estimating the total amountof amplification a site will experience during a seismic eventand in particular for determining the fundamental frequencyat that site (Lermo and Chávez-García, 1993; Ghofrani andAtkinson, 2014). Preliminary H/V studies (Farrugia and At-kinson, 2015) suggest that the TransAlta network stations allhave very similar site responses, with a pronounced amplifica-tion in the 2–5 Hz frequency band on most stations that isconsistent with expectations for relatively shallow soft-soil sitesunderlain by hard rock.
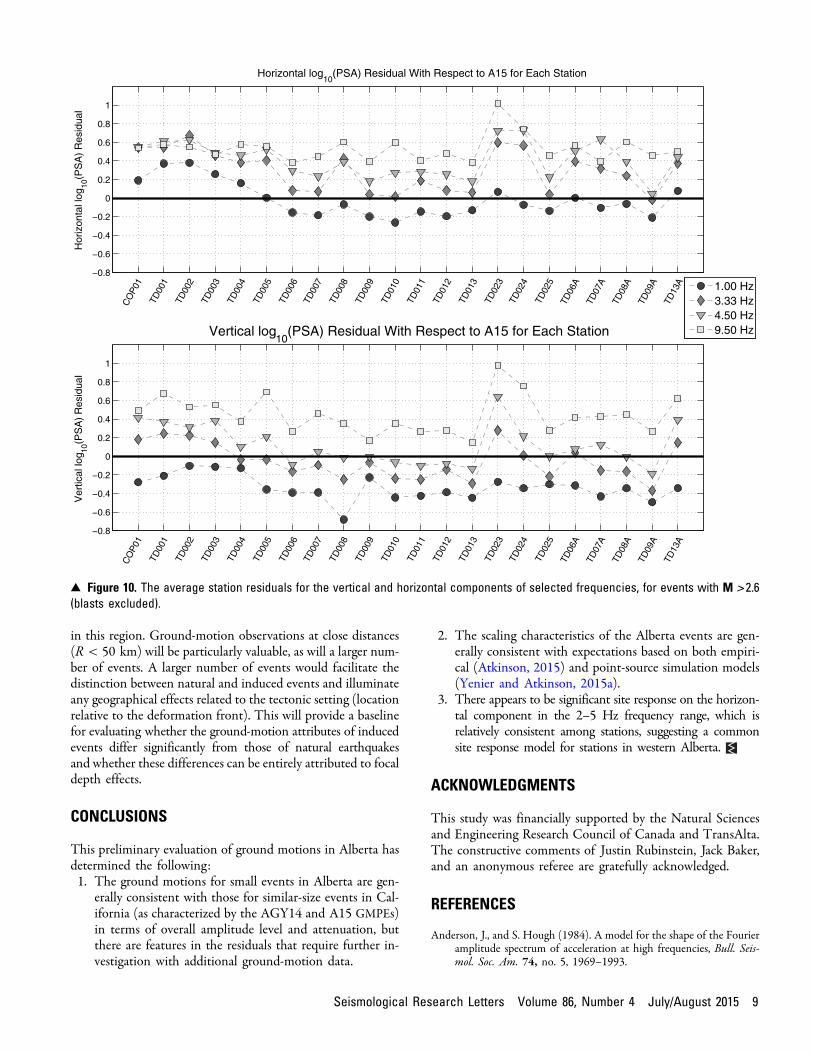
If we interpret the residuals as site-response terms, we caninfer the amplification relative to the A15 reference conditionof B/C by computing the average residual at each station. Asshown in Figure 10, the inferred site terms are relatively consis-tent from one station to the next (consistent with the results ofFarrugia and Atkinson, 2015). This suggests that an overall typ-ical site amplification curve, as given in Figure 9 (dashed line),may be a reasonable way to model site effects at the stations.
As more ground-motion observations are collected, we willbe able to further resolve the competing influences of source,attenuation, and site factors on the observed ground motions
100
101
−0.4
−0.2
0
0.2
0.4
0.6
0.8
1
1.2
1.4
Frequency (Hz)
Ave
rage
log 10
PS
A R
esid
ual W
ith R
espe
ct T
o A
15
10PSA Residual for Range of Frequencies at Distance Ranges 10−120km, 120−250km, 250−400 km
Average log
Average log
10PSA Vertical Component
100
101
−0.4
−0.2
0
0.2
0.4
0.6
0.8
1
1.2
1.4
Frequency (Hz)
Ave
rage
log 10
PS
A R
esid
ual W
ith R
espe
ct T
o A
15
Average log10
PSA for Horizontal Component
Average Residual 10 km <= R < 120 kmAverage Residual 120 km <= R < 250 kmAverage Residual 250 km <= R < 400Average Residual Over All DistancesAverage Residual
H − Average Residual
V
(a) (b)
▴ Figure 9. The average PSA residuals versus frequency in distance ranges 10–120 km, 120–250 km, 250–400 km for (a) vertical and(b) horizontal components. The average, including all distances, is also shown (heavy line). The dashed line in (b) shows the averagehorizontal residual minus the average vertical residual, which is similar to an average site response function.
8 Seismological Research Letters Volume 86, Number 4 July/August 2015
in this region. Ground-motion observations at close distances(R < 50 km) will be particularly valuable, as will a larger num-ber of events. A larger number of events would facilitate thedistinction between natural and induced events and illuminateany geographical effects related to the tectonic setting (locationrelative to the deformation front). This will provide a baselinefor evaluating whether the ground-motion attributes of inducedevents differ significantly from those of natural earthquakesand whether these differences can be entirely attributed to focaldepth effects.
CONCLUSIONS
This preliminary evaluation of ground motions in Alberta hasdetermined the following:1. The ground motions for small events in Alberta are gen-
erally consistent with those for similar-size events in Cal-ifornia (as characterized by the AGY14 and A15 GMPEs)in terms of overall amplitude level and attenuation, butthere are features in the residuals that require further in-vestigation with additional ground-motion data.
2. The scaling characteristics of the Alberta events are gen-erally consistent with expectations based on both empiri-cal (Atkinson, 2015) and point-source simulation models(Yenier and Atkinson, 2015a).
3. There appears to be significant site response on the horizon-tal component in the 2–5 Hz frequency range, which isrelatively consistent among stations, suggesting a commonsite response model for stations in western Alberta.
ACKNOWLEDGMENTS
This study was financially supported by the Natural Sciencesand Engineering Research Council of Canada and TransAlta.The constructive comments of Justin Rubinstein, Jack Baker,and an anonymous referee are gratefully acknowledged.
REFERENCES
Anderson, J., and S. Hough (1984). A model for the shape of the Fourieramplitude spectrum of acceleration at high frequencies, Bull. Seis-mol. Soc. Am. 74, no. 5, 1969–1993.
−0.8
−0.6
−0.4
−0.2
0
0.2
0.4
0.6
0.8
1
Horizontal log10
(PSA) Residual With Respect to A15 for Each StationH
oriz
onta
l log
10(P
SA
) R
esid
ual
CO
P01
TD00
1
TD00
2
TD00
3
TD00
4
TD00
5
TD00
6
TD00
7
TD00
8
TD00
9
TD01
0
TD01
1
TD01
2
TD01
3
TD02
3
TD02
4
TD02
5
TD06
A
TD07
A
TD08
A
TD09
A
TD13
A 1.00 Hz3.33 Hz4.50 Hz9.50 Hz
−0.8
−0.6
−0.4
−0.2
0
0.2
0.4
0.6
0.8
1
Vertical log10
(PSA) Residual With Respect to A15 for Each Station
Ver
tical
log 10
(PS
A)
Res
idua
l
CO
P01
TD00
1
TD00
2
TD00
3
TD00
4
TD00
5
TD00
6
TD00
7
TD00
8
TD00
9
TD01
0
TD01
1
TD01
2
TD01
3
TD02
3
TD02
4
TD02
5
TD06
A
TD07
A
TD08
A
TD09
A
TD13
A
▴ Figure 10. The average station residuals for the vertical and horizontal components of selected frequencies, for events with M > 2:6(blasts excluded).
Seismological Research Letters Volume 86, Number 4 July/August 2015 9

Assatourians, K., and G. Atkinson (2010). Database of processed timeseries and response spectra for Canada: An example applicationto study of the 2005 MN 5.4 Riviere du Loup, Quebec earthquake,Seismol. Res. Lett. 81, no. 6, 1013–1031.
Atkinson, G. M. (2015). Ground-motion prediction equation for small-to-moderate events at short hypocentral distances, with applicationto induced seismicity hazards, Bull. Seismol. Soc. Am. 105, no. 2A,doi: 10.1785/0120140142.
Atkinson, G., W. Greig, and E. Yenier (2014). Estimation of momentmagnitude (M) for small events (M <4) on local networks, Seismol.Res. Lett. 85, 1116–1124.
Baranova, V., A. Mustaqeem, and S. Bell (1999). A model for inducedseismicity caused by hydrocarbon production in the western Canadasedimentary basin, Can. J. Earth Sci. 36, 47–64.
Building Seismic Safety Council (2009). NEHRP Recommended Provi-sions for Seismic regulations for New Buildings and other Structures(FEMA 750), Federal Emergency Management Agency, Washing-ton, D.C.
Farrugia, J., and G. Atkinson (2015). A preliminary evaluation of siteamplification in Alberta, Undergraduate Thesis,Western University,London Ontario, Canada.
Fereidoni, A., and G. Atkinson (2015). Identifying quarry blast events inseismicity catalogs based on ground motion parameters, CanadianGeophysical Union (CGU) Annual Meeting, Montreal, Canada, 3–7May 2015 (unpublished).
Ghofrani, H., and G. Atkinson (2014). Site condition evaluation usinghorizontal-to-vertical spectral ratios of earthquakes in the NGA-West2 and Japanese databases, J. Soil Dyn. Earthq. Eng. 67, 30–43.
Gu, Y., A. Okeler, L. Shen, and S. Contenti (2011). The CanadianRockies and Alberta Network (CRANE): New constraints onthe Rockies and western Canada sedimentary basin, Seismol. Res.Lett. 82, 575–588.
Hough, S. (2014). Shaking from injection-induced earthquakes in thecentral and eastern United States, Bull. Seismol. Soc. Am. 104,2619, doi: 10.1785/0120140099.
Lermo, J., and F. Chávez-García (1993). Site effect evaluation usingspectral ratios with only one station, Bull. Seismol. Soc. Am. 84,1350–1364.
Nigam, N., and P. Jennings (1969). Calculation of response spectra fromstrong-motion earthquake records, Bull. Seismol. Soc. Am. 59, no. 2,909–922.
Pacific Earthquake Engineering Research Center (2014). NGA-West2Ground Motion Database, http://peer.berkeley.edu/ngawest2/databases/ (last accessed May 2015).
Schultz, R., V. Stern, and Y. Gu (2014). An investigation of seismicityclustered near the Cordel field, west central Alberta, and its relationto a nearby disposal well, J. Geophys. Res. Solid Earth 119,3410–3423.
Schultz, R., V. Stern, M. Novakovic, G. Atkinson, and Y. Gu (2015).Hydraulic fracturing and the Crooked Lake sequences: Insightsgleaned from regional seismic networks, published online 23 April2015, Geophys. Res. Lett. doi: 10.1002/2015GL063455.
Stern,V., R. Schultz, and G. Jean (2011). Alberta Microseismicity Project,Phase 1: Site assessments for the ATSN semipermanent stations andthe PSEIP Strachan temporary seismic array, Energy ResourcesConservation Board, ERCB/AGS Open-File Rept. 2011-15, 75 pp.
Yenier, E., and G. Atkinson (2015a). An equivalent point-source modelfor stochastic simulation of earthquake ground motions in Califor-nia, Bull. Seismol. Soc. Am. 105, no. 3, doi: 10.1785/0120140254.
Yenier, E., and G. Atkinson (2015b). A regionally-adjustable genericGMPE based on stochastic point-source simulations, Bull. Seismol.Soc. Am. 105 (unpublished).
Yenier, E., and G. M. Atkinson (2014). Equivalent point-source modelingof moderate-to-large magnitude earthquakes and associated ground-motion saturation effects, Bull. Seismol. Soc. Am. 104, 1458–1478.
Mark NovakovicGail M. Atkinson
Department of Earth SciencesWestern University
London, Ontario N6G 2V4Canada
[email protected]@aol.com
10 Seismological Research Letters Volume 86, Number 4 July/August 2015