preliminary study of noise propagation … · preliminary study of noise propagation behaviour at...
TRANSCRIPT
GEOTHERMAL TRAINING PROGRAMME Reports 2001Orkustofnun, Grensásvegur 9, Number 8IS-108 Reykjavík, Iceland
163
PRELIMINARY STUDY OF NOISE PROPAGATION BEHAVIOURAT THE NESJAVELLIR GEOTHERMAL FIELD, SW-ICELAND
Raúl Edgardo LópezGeotérmica Salvadoreña S.A. de C.V.,
km 11½ Carretera al Puerto La Libertad,Santa Tecla, La Libertad,
El SALVADOR, [email protected]
ABSTRACT
A study of noise propagation was carried out at well sites NV-16, NV-21, NV-22 ofthe Nesjavellir geothermal field in SW-Iceland. Silencer equipment was used as noisesources, through which a double phase flow was discharged to the atmosphere. Thesesources emit noise levels with low frequency characteristics and according tomeasured noise, need distances longer than 160 m to reach reduced noise values onthe order of 50-55 dB (A), the values recommended by the environmental legislationfor residential areas. However, at Nesjavellir there are no communities located closeto the well sites; therefore, the noise emissions do not constitute an environmentalimpact, except for the recreational areas close to Nesjavellir. The study also includedcalculation of noise using the Sound Plan Software, where noise levels weredetermined by modifying environmental variables such as ground type, relativehumidity and inserting acoustic barriers close to the sources. The results indicated thata combination of soft ground at all well sites and acoustic barriers placed very near tothe sources can attenuate the noise levels at short distances, when it is too expensiveto modify the source design in operation projects. Therefore, it is recommended tocarry out experimental testing of noise propagation by modifying environmentalconditions for the purpose of verifying real noise values, and then to applyenvironmental measures to attenuate the noise impact produced by geothermaldevelopment.
1. INTRODUCTION
One of the most commonly observed emissions to the environment is noise produced during thedevelopment and operation of industrial projects. Geothermal projects are an example of this. The noiseemission to the air constitutes an environmental impact when there are people or animal communitiesliving near the project sites. When those conditions are present it becomes necessary to design strategiesfocused to develop projects and at the same time to protect the environment, necessitating the inclusionin design planning of noise reduction programmes and environmental monitoring.
The study of environmental noise produced by geothermal activities should include the analysis of the
López Report 8164
POWER PLANT
SEPARATION STATION
Nesjavellir farm
Staff housing
NV-21NV-22
NV-
HENGILLVolcano
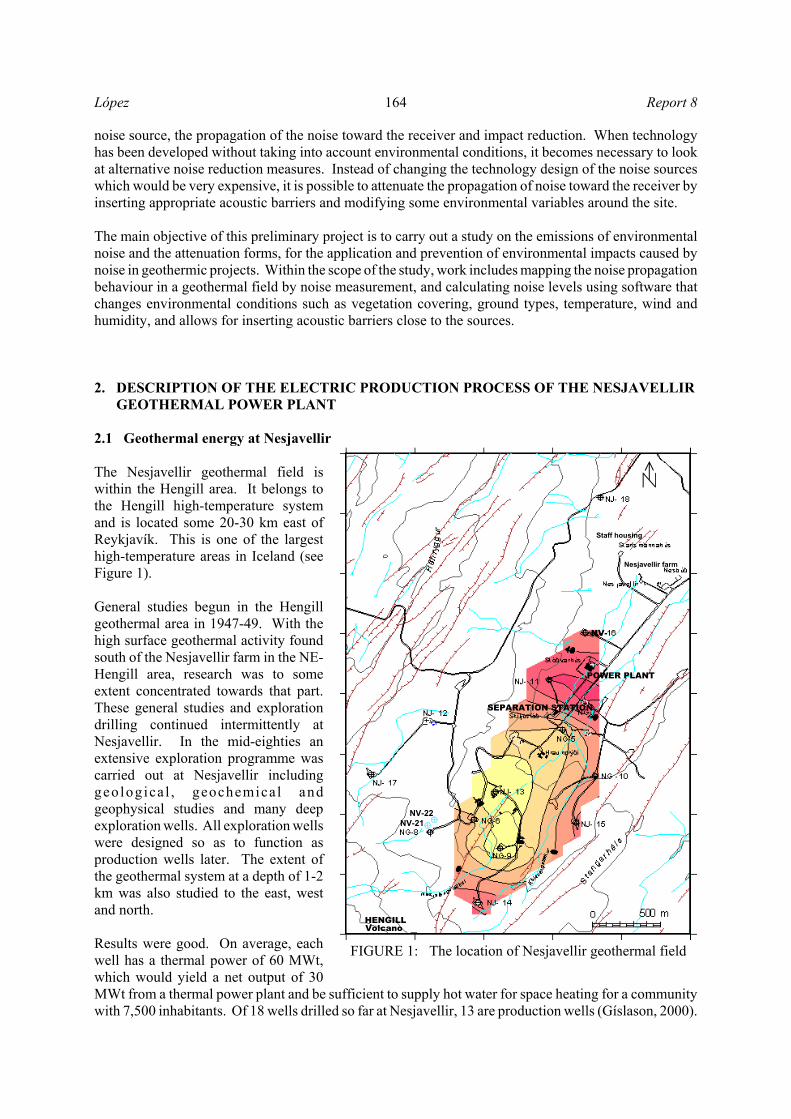
FIGURE 1: The location of Nesjavellir geothermal field
noise source, the propagation of the noise toward the receiver and impact reduction. When technologyhas been developed without taking into account environmental conditions, it becomes necessary to lookat alternative noise reduction measures. Instead of changing the technology design of the noise sourceswhich would be very expensive, it is possible to attenuate the propagation of noise toward the receiver byinserting appropriate acoustic barriers and modifying some environmental variables around the site.
The main objective of this preliminary project is to carry out a study on the emissions of environmentalnoise and the attenuation forms, for the application and prevention of environmental impacts caused bynoise in geothermic projects. Within the scope of the study, work includes mapping the noise propagationbehaviour in a geothermal field by noise measurement, and calculating noise levels using software thatchanges environmental conditions such as vegetation covering, ground types, temperature, wind andhumidity, and allows for inserting acoustic barriers close to the sources.
2. DESCRIPTION OF THE ELECTRIC PRODUCTION PROCESS OF THE NESJAVELLIR GEOTHERMAL POWER PLANT
2.1 Geothermal energy at Nesjavellir
The Nesjavellir geothermal field iswithin the Hengill area. It belongs tothe Hengill high-temperature systemand is located some 20-30 km east ofReykjavík. This is one of the largesthigh-temperature areas in Iceland (seeFigure 1).
General studies begun in the Hengillgeothermal area in 1947-49. With thehigh surface geothermal activity foundsouth of the Nesjavellir farm in the NE-Hengill area, research was to someextent concentrated towards that part.These general studies and explorationdrilling continued intermittently atNesjavellir. In the mid-eighties anextensive exploration programme wascarried out at Nesjavellir includinggeological , geochemical andgeophysical studies and many deepexploration wells. All exploration wellswere designed so as to function asproduction wells later. The extent ofthe geothermal system at a depth of 1-2km was also studied to the east, westand north.
Results were good. On average, eachwell has a thermal power of 60 MWt,which would yield a net output of 30MWt from a thermal power plant and be sufficient to supply hot water for space heating for a communitywith 7,500 inhabitants. Of 18 wells drilled so far at Nesjavellir, 13 are production wells (Gíslason, 2000).

Report 8 López165
The City Council of Reykjavík decided on 20 November 1986 to begin construction of a geothermalpower plant at Nesjavellir. The first stage in this development was a thermal power plant with a capacityof 100 MWt for heating in Reykjavik,. The plant went into operation in September 1990. With recentextensions the Nesjavellir Power Station provides at present 90 MWe of electricity (from three turbines30 MWe) and 200 MWt of thermal power. The plant and the transmission pipelines are designed for amaximum capacity of 400 MWt.
2.2 The Nesjavellir power plant operation
Production process of the geothermal plant at Nesjavellir is summarized here below (Gíslason 2000). Theplant can be divided into five sub-systems all of which have separate functions, including
Geothermal fluid supply; Electricity generation;Cold water supply; Heating and treatment of cold groundwater; Transmission of hot water by pipeline to Reykjavík.
Table 1 presents the total discharge of geothermal fluid and the production of heated water for spaceheating. Table 2 shows the conditions of energy production contained in the hot water and in electric formand the production of steam and gases that are discharged to the atmosphere (before the electric productionwas increased to 90 MWe).
TABLE 1: Production conditions for the Nesjavellir plant
Year Month Discharge(tons × 103)
Production(tons × 103)
1994 3 1219 40451995 12 4963 155281996 12 5717 143311997 12 6456 152661998 12 4231 84451999 12 10470 14646
TABLE 2: Hot water production at the Nesjavellir plant in 2000
Hot waterAverage flow rate 700 kg/sTemperature of heated water 82ºCAverage return temperature 32ºCAverage energy output 147 MWtElectricity 60 MWeTotal energy 207 MW
SteamAverage steam flow 126 kg/sAverage CO2 concentration 3.3 g/kgAverage release of CO2 416 g/sEmission of CO2 from plant 7.2 g/kWh
A mixture of steam and geothermal brine is transported from the wells to a central separation station at200/C and 14 bar. After being separated from the brine, the steam is piped through moisture separatorsto steam heat exchangers inside the plant building. The steam can be piped to steam turbines for co-generation of electricity. Unutilised steam is released through a steam exhaust.

López Report 8166
FIGURE 2: Design of the Nesjavellir plant (Gíslason, 2000)
The steam heat exchangers consist of 295 titanium plates. In them the 120/C steam is cooled underpressure into condensate whose heat is then transferred to cold fresh water in condensate heat exchangers.The condensate cools down in the process to 20/C. Separated geothermal brine has its heat transferredto cold fresh water by geothermal brine heat exchangers. Cold water at 4/C is pumped from wells atGrámelur, near the shore of Lake Thingvallavatn, to a storage tank by the powerhouses. From there, itis pumped to the steam heat exchangers where its temperature is raised to 85-90/C.
The hot water production reaches 1100 l/s. This water is pumped from the power station into a tank nearHengill (406 m above sea level). Through a pipeline 90 cm in diameter and about 30 km long the watergoes by gravity from the tank to Reykjavík. The pipeline is made of steel, insulated with rock wool andcovered by plastic and aluminum on the outside. Good insulation and large flow rate are the main reasonsof only 2/ temperature loss during pumping from Nesjavellir to Reykjavík (Gunnarsson et al., 1992).
The fresh water is saturated with dissolved oxygen that would cause corrosion after being heated. It ispassed through de-aerators where it is boiled at low vacuum pressure to remove the dissolved oxygen andother gases, cooling it to 82-85/C. For this reason, a small amount of geothermal steam containing acidicgases is also injected into the water to rid it of any remaining oxygen and lowering its pH, therebypreventing corrosion and scaling. A flow diagram of the process is shown in Figure 2.
Report 8 López167
3. THE AREA SURROUNDING THE NESJAVELLIR GEOTHERMAL POWER PLANT
As a part of the project of investigation, it is necessary to characterize the environmental and climatologicconditions of the field area. The information of the environmental conditions is decrypted as follows:
3.1 Geology
The Nesjavellir geothermal field belongs to the Hengill high-temperature geothermal area, and is locatedin the northern sector of the Hengill central volcano, within a SW-NE trending fracture zone, whichintersects the volcano. In the uppermost part of the lava pile (above 400 m b.s.l.), basaltic hyaloclastiteformations dominate the rock sequence, while the lower part is characterized by basaltic lava series, withsparse hyaloclastite formations interbedded. Magmatic intrusions become more frequent with depth,composing less than 5% of the rock sequence above 400 m b.s.l., around 20% at 400-1300 m b.s.l. andmore than 50% at 1300-1600 m b.s.l. The majority of these intrusive rocks are of basaltic compositionwith apparent thicknesses of less than 30 m. Below 1400 m b.s.l. intermediate intrusive rocks have beenfound (Franzson et al., 1986).
The area of surface geothermal manifestations in the Hengill area covers about 40 km2. The geothermalarea is characterized by low resistivity, some 110 km2 in areal extent at 200 m depth below sea level. Itscentral part contains a high-resistivity body below the low-resistivity layer, caused mainly by change inalteration minerals from low-temperature minerals to high-temperature minerals and a transition fromwater-dominated to a two-phase system at depth. A negative magnetic anomaly caused by hydrothermalalterations of the magnetite in the basaltic rocks correlates well with outlines of the geothermal area(Árnason et al., 1986).
Aquifers are often found on the peripheries of intrusions, and also at faults that can’t be seen at thesurface, but boreholes show clearly that occur. Rock temperature is highest next to the recently activevolcanic fractures. At sea level, the temperature is approximately 100/C. It increases with depth, and at2 km depth it exceeds 350/C (Steingrímsson et al.,1990).
3.2 Ground type
The ground in Nesjavellir geothermal field is the same as in the lands that are located aroundThingvallavatn lake. The soil is mostly of Aeolian origin, well drained, with a low content of clay anda mineral fraction consisting mainly of volcanic ash. These soils are very susceptible to water and winderosion.
The grounds in Nesjavellir are mostly well drained on highly permeable bedrock such as glacial deposits,palagonite rock and postglacial lavas (Agricultural Research Institute, 1982; Thorsteinsson and Arnalds,1992). The dry land grounds are predominantly formed of Aeolian materials resting upon bedrock ofvarious origins. There are limited occurrences of alluvial flats or water deposits along the few surfacerivers and brooks in the area. The Aeolian soils are mainly characterized by the following:
• Average soil thickness is around 1 m, which is common for soils of this origin in Iceland.• The soils are gravel free with a very low content of clay. The texture is mostly sandy loam and silt
loam, which makes the soils highly permeable and also very susceptible to wind and water erosion.The mineral fraction is likely to be predominantly tephra (volcanic ash).
• The profile is homogenous and without distinct horizons.• The soils have weak structure.• The organic matter content is high, as commonly occurs in cold and cold-temperate climate. This
causes relatively high cation-exchange capacity in spite of low content of inorganic colloids.• The pH is relatively high due to the patchy basaltic, Aeolian addition, which compensates for the loss
of cations by leaching and for organic build-up.
López Report 8168
FIGURE 3: Ground type in the Nesjavellir area (Agricultural Research Institute, 1982)
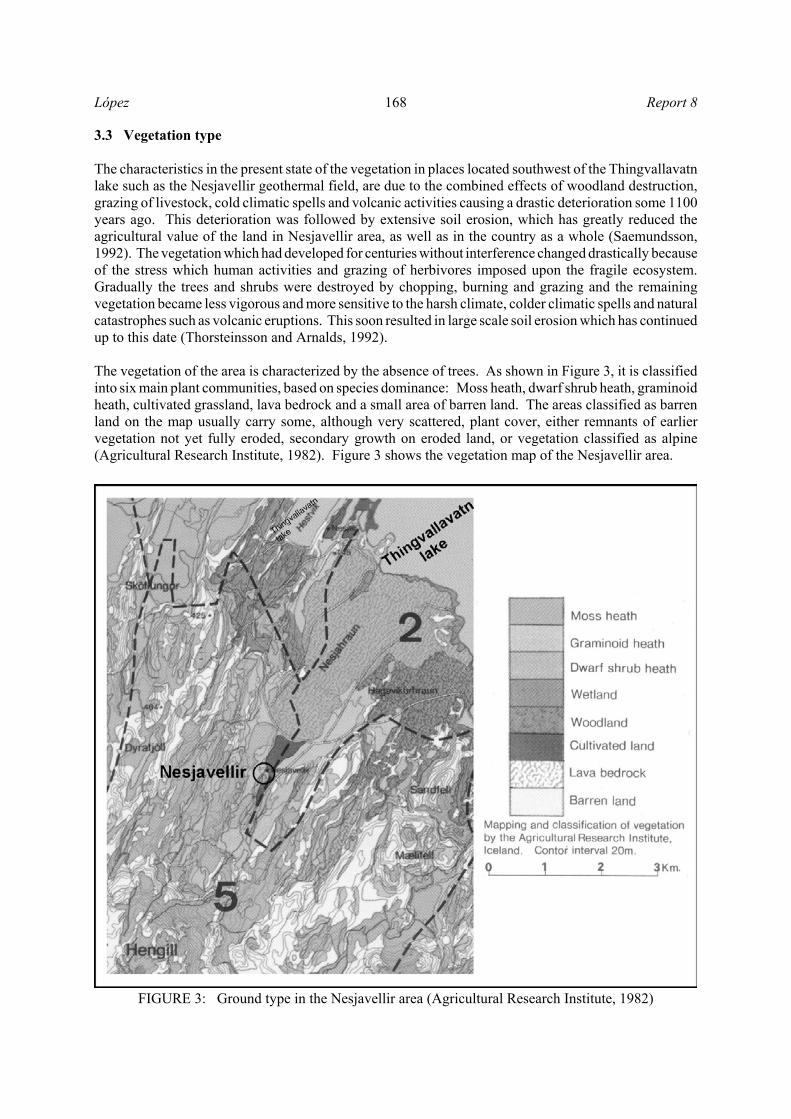
3.3 Vegetation type
The characteristics in the present state of the vegetation in places located southwest of the Thingvallavatnlake such as the Nesjavellir geothermal field, are due to the combined effects of woodland destruction,grazing of livestock, cold climatic spells and volcanic activities causing a drastic deterioration some 1100years ago. This deterioration was followed by extensive soil erosion, which has greatly reduced theagricultural value of the land in Nesjavellir area, as well as in the country as a whole (Saemundsson,1992). The vegetation which had developed for centuries without interference changed drastically becauseof the stress which human activities and grazing of herbivores imposed upon the fragile ecosystem.Gradually the trees and shrubs were destroyed by chopping, burning and grazing and the remainingvegetation became less vigorous and more sensitive to the harsh climate, colder climatic spells and naturalcatastrophes such as volcanic eruptions. This soon resulted in large scale soil erosion which has continuedup to this date (Thorsteinsson and Arnalds, 1992).
The vegetation of the area is characterized by the absence of trees. As shown in Figure 3, it is classifiedinto six main plant communities, based on species dominance: Moss heath, dwarf shrub heath, graminoidheath, cultivated grassland, lava bedrock and a small area of barren land. The areas classified as barrenland on the map usually carry some, although very scattered, plant cover, either remnants of earliervegetation not yet fully eroded, secondary growth on eroded land, or vegetation classified as alpine(Agricultural Research Institute, 1982). Figure 3 shows the vegetation map of the Nesjavellir area.

Report 8 López169
5%
10%
15
10%
5%
5%
5%
10%
5%
10%
15
10%
5%
5%
5%
10%
FIGURE 4: Wind direction in theNesjavellir area (Egilsson et al., 2000)
(1)
3.4 Weather
The data of total accumulated precipitation, mean temperature, mean wind speed and relative humidityfrom the beginning of 1999 to June, 2001 have been prepared by the Icelandic Meteorological Office,based on measurements at a site located west of the Nesjavellir geothermal power plant (IcelandicMeteorological Office, 2001).
The total accumulated precipitation varied between 1709 and1754 mm per annum. The monthly data are presented in Table1 in Appendix I.
The mean temperature monthly data varied from –1.5 to11.6ºC. In the winter the data varied between –1.5 and 2.7ºCand in summer between 1.0 and 11.6ºC. The monthly data ofmaximum and minimum temperature registered are presentedin Table 1 in Appendix I.
The mean wind speed in a month varied from 3.1 to 7.5 m/s. Inthe winter the data varied between 3.3 and 7.5 m/s and insummer between 3.1 and 6.2 m/s. According to the presenteddata, the mean wind speeds can be considered as quite slowwinds. The monthly data are presented in Table 1 in theAppendix I. Figure 4 shows wind direction at the Nesjavellirgeothermal field. The figure was obtained from“Environmental impact assessment to Nesjavellir geothermalpower plant. Project of expansion from 56 to 90 MWe”, byVGK Consulting Engineers Ltd. and published with thepermission of Reykjavík Energy Co. (Egilsson et al., 2000).
The mean relative humidity varied from 65% to 84% on a monthly basis. In winter the data variedbetween 65 and 82% and in summer between 71 and 84%. The monthly data are presented in Table 1 inAppendix I.
4. NOISE PROPAGATION AND MEASUREMENTS
4.1 Theoretical background
4.1.1 Fundamental concepts on noise
The fundamental concepts on environmental noise found in different books that study this parameter typeindicate that the noise is a succession of travelling pressure waves moving away from a source. Althoughthere exists no pressure gradient between a source and its surroundings, pressure waves are transmittedthrough medium (usually air) and since pressure is a force, there must be a flow of momentum and henceenergy. Consequently, sound waves must transmit energy. As this energy is dispersed over a wide areait is more usual to refer to the intensity of sound at a point. Intensity, I, is the amount of energy passingthrough a unit area per unit time and can be expressed in W/m2. There is a direct relationship between theintensity of a sound and its acoustic pressure, p (in N/m2). Therefore, as sound measuring instrumentsmeasure pressure directly, it can be expressed as a value of intensity and the total acoustic power producedby the source can be easily calculated (MWD, 1983; Davis and Cornwell, 1991). The acoustic intensity,I, at a point is given by

López Report 8170
(2)
(3)
(4)
(5)
where D = Density [kg/m3], in air at 20/C and standard pressure it is 1,185 kg/m3;c = Sound velocity [m/s].
The total power, W, of the source is simply the intensity times the area of radiation, A (in m2), or
Then the sound power level, LW of a source can be defined as
In acoustic engineering, the scale which is used is based on the logarithm of the proportions of themeasured quantities compared to specific quantities of reference. The commonly used sound referencepower level is 10-12 W and the sound power level of the source is expressed in decibel (dB). The soundpower, W, is proportional to the square of the sound pressure, with the sound pressure expressed in Pascals(Pa). The sound pressure level, Lp, is actually measured as 10 times the logarithm of the ratio of squaredsound pressure compared to the square of some constant reference pressure. The reference used is thepressure corresponding to the lowest sound pressure that the ear can detect, 20 :Pa, thus, Lp is defined as
or, consequently,
4.1.2 Equivalent continuous sound pressure level - Leq
According to general agreement about noise analysis, the units used to express noise measurementappropriately are decibels or dB(A), which approximates perceived sound by human hearing. However,the noise levels frequently vary with time, and it becomes very complicated to keep track of the dataduring a measurement period. For that reason, it is not convenient to use the instantaneous sound pressurelevel, Lp as a measure parameter for the study of noise propagation behaviour. Rather the equivalentcontinuous sound pressure level, Leq, is used which represents the energy-average of fluctuating noiseduring a time period. Leq is a parameter proposed by ISO (1996, 1971).
The mathematical expression is
where T = Period of time during which LAeq is calculated;p(t) = Instantaneous sound pressure; po = Reference sound pressure (20 :Pa);A = Refers to a weighting of the sound level in order to simulate human hearing;
Equation 5 can be written as

Report 8 López171
(6)
(7)
(8)
where Lp = 10 log10 (P(t) / Po)2
and if the sample methodology is discrete, then LAeq is given by
where n = Number of samples,Li = Sound level in sample i, andti = Time fraction of sample i.
4.1.3 Noise frequency
The frequency is the number of complete variations of pressure or cycles per second and is given by
The frequencies of audible sounds vary from 0.015 to 15 kHz. At frequencies smaller than 15 Hz thesound is not audible, although if it is sufficiently strong it is perceived as a vibration (infrasonicfrequencies). The human voice contains frequencies in the range 80 Hz - 8 kHz, but concentrates at theinterval 0.5 - 2 kHz. In practice, it is not usual to find high levels of sounds at a higher frequency than8 kHz. Therefore, sounds above 8 kHz are ignored in environmental control.
The audible sound spectrum is divided into octave bands. An octave band is the frequency intervalbetween a determined frequency and the double of the same frequency. The analysis of the octave bandsrequires a set of octave filters that can be incorporated into the sound level meter. Hearing is mostsensitive in the frequency range from 1 to 5 kHz. To compensate the dependence of sensitivity to thefrequency, the sound level meter incorporates electronic pondering filters that correspond to the answerof hearing. Two main filters A and C have been established and the more important is filter A. There isa general agreement that noise from traffic, the industrial sector and the communities can be measuredsuitably using this filter (Harris et al., 1995; Beranek, 1971).
4.2 Sound level meters
4.2.1 Type NL-05
For the measurement of environmental noise levels the integrating sound level meter type NL-05 wasused. It is a small piece of equipment for easy handling, manufactured in Tokyo Japan forHigashimotomachi, Kokubunji, and distributed world wide by RION Co., Ltd. The equipment is designedto measure sound parameters in different environments using Quantifier Notation according toInternational Standard and JIS (excerpts from ISO 1996, 3891, IEC Pub. 804 JIS Z8202, 8731). Thesound level meter allows not only conventional sound level measurements, but also incorporatesprocessing functions, which make it possible to determine Lp (instantaneous sound pressure level) Leq(equivalent continuous sound pressure level), LE (sound exposure level) and Lmax (maximum soundpressure level).

López Report 8172
The equipment calculates the Leq for different measurement times, such as 10 seconds, 1, 5, 10, 15, and30 minutes, 1, 8 and 24 hours. Once the calculation has been completed the data is automatically storedin the memory of the unit. Stored data can be called up on the display to be used for noise analysis.Before starting a measurement, the sound meter is calibrated using an electrical calibrating method; here,one need only press the cal button to activate calibration mode and the indication “Cal 94.0 dB” appearson the display. The controls and functions and operation processing can be seen in the instruction manual(Rion Co., Ltd., 1996).
4.2.2 Type B & K 2218
The B&K 2218 is an analog sound level meter with a wide dynamic range and an integrating sound levelmeter or Leq meter with digital readout. It is used to obtain all conventional sound level meter values, plusa single number description of traffic noise, community noise, industrial noise (ISO noise dose), as wellas noise emission of cyclical machines. It can, in addition, compute the SEL value for characterizingsingle events. The 2218-meter is also of great benefit on the type of fluctuating signal where the dB(A)“slow” reading is not stable. Both the integrated sound level and the elapsed time over which theintegration takes place can be displayed. The integration time may be pre-selected. The 2218-meter alsofunctions as an impulse precision sound level meter with peak hold facility, and has optional frequencyanalysis and tape recording capabilities.
The main uses of this equipment are determination of Leq for assessment of risk of hearing loss or noiseannoyance, measurement of cyclical machine noise, short duration noise dose measurements, investigationof noise dose distribution versus locality and time noise and vibration measurements and analyses. Beforestarting a measurement the sound meter should be calibrated using the electrical calibrating method andacoustic calibration method. The controls and functions and operation processing can be seen in theinstruction manual (Brüel & Kjaer, 1999).
5. NOISE PROPAGATION BEHAVIOUR AT THE NESJAVELLIR FIELD
5.1 Selected noise sources
Three sites located at the Nesjavellir geothermal field were selected as noise sources. These are wells NV-16, NV-21 and NV-22, all operating with the use of the equipment silencers. Measurements of theequivalent continuous sound pressure level (Leq) data were carried out with the silencer equipment usedas the sound sources. The sites can be described as follows:
• The first site is at the NV-16 geothermal well located 250 m to the northeast of the power plant. Thewell produces a two-phase fluid of 13.1 kg/s, of which 7.6 kg/s is steam and the rest water, whichtogether are discharged to the atmosphere through the silencer equipment.
• The second site is the NV-21 geothermal well located approximately 1,500 m to the west of the powerplant. The well produces a two-phase fluid of 15.6 kg/s. The steam flow is 13.2 kg/s but the rest, 2.4kg/s, is water, which together are discharged to the atmosphere through silencer equipment.
• The third noise source is the NV-22 geothermal well, located 40 m to the east of the NV-21geothermal well, and is approximately 1,500 m to the west of the power plant. The NV-22 well hasa directional design and produces a two-phase fluid of 34 kg/s. A flow of 18.2 kg/s is steam and wateris 15.8 kg/s, which together are discharged to the atmosphere through silencer equipment.
Figures 5 and 6 show the well sites, including elevation lines and types of ground surrounding the wellsites.

Report 8 López173
FIGURE 5: Well site NV-16 and the surroundingswith elevation lines and ground types
FIGURE 6: The well site for NV-21 and NV-22 and thesurroundings with elevation lines and ground types

López Report 8174
FIGURE 7: Measurement points around NV-16
FIGURE 8: Measurement points around NV-21/NV-22
5.2 Mapping of noise propagation
The mapping of noise levelpropagation at differentlocations and different distanceswas carried out by measuring at8 selected directions from thesound sources (si lencerequipment of NV-16, NV-21and NV-22). The spacing of themeasurement points was suchthat each time the distance fromthe sound sources was doubled;with radii of 5, 10, 20, 40, and80 m and a maximum one of 160m. This means a maximum of 6points in all eight directions.The measurement time at everypoint was 10 seconds. Thesemeasurements were carried outusing the sound level meter NL-05. The distribution of themeasured points is shown inFigures 7 and 8.
Report 8 López175
545657586062646668707274767880828486889092
North
West
Distance m
Pipeline
Wellhead
dB (A)
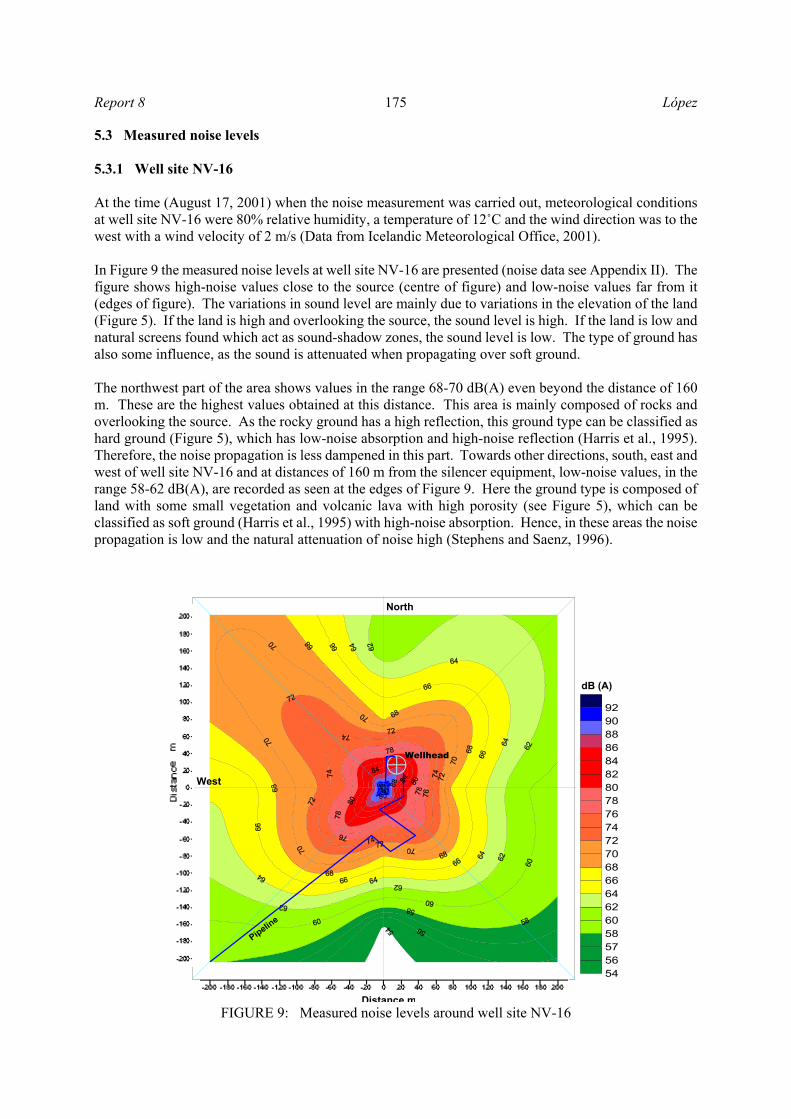
FIGURE 9: Measured noise levels around well site NV-16
5.3 Measured noise levels
5.3.1 Well site NV-16
At the time (August 17, 2001) when the noise measurement was carried out, meteorological conditionsat well site NV-16 were 80% relative humidity, a temperature of 12/C and the wind direction was to thewest with a wind velocity of 2 m/s (Data from Icelandic Meteorological Office, 2001).
In Figure 9 the measured noise levels at well site NV-16 are presented (noise data see Appendix II). Thefigure shows high-noise values close to the source (centre of figure) and low-noise values far from it(edges of figure). The variations in sound level are mainly due to variations in the elevation of the land(Figure 5). If the land is high and overlooking the source, the sound level is high. If the land is low andnatural screens found which act as sound-shadow zones, the sound level is low. The type of ground hasalso some influence, as the sound is attenuated when propagating over soft ground.
The northwest part of the area shows values in the range 68-70 dB(A) even beyond the distance of 160m. These are the highest values obtained at this distance. This area is mainly composed of rocks andoverlooking the source. As the rocky ground has a high reflection, this ground type can be classified ashard ground (Figure 5), which has low-noise absorption and high-noise reflection (Harris et al., 1995).Therefore, the noise propagation is less dampened in this part. Towards other directions, south, east andwest of well site NV-16 and at distances of 160 m from the silencer equipment, low-noise values, in therange 58-62 dB(A), are recorded as seen at the edges of Figure 9. Here the ground type is composed ofland with some small vegetation and volcanic lava with high porosity (see Figure 5), which can beclassified as soft ground (Harris et al., 1995) with high-noise absorption. Hence, in these areas the noisepropagation is low and the natural attenuation of noise high (Stephens and Saenz, 1996).

López Report 8176
76
78
80
82
84
86
88
90
92
94
96
98
100
102
104
106
108
110
76110106
NV-21/NV-22
dB (A)
Distance m
West
North
84
8682
8486
86
FIGURE 10: Measured noise levels at well sites NV-21/22
5.3.2 Well sites NV-21 and NV-22
At the time (August 18, 2001) when the noise measurement was carried out, the meteorological conditionsat well sites NV-21/NV-22 were 80% relative humidity, the temperature was 10ºC and the wind directionwas to the west with the wind velocity 4 m/s (Data from Icelandic Meteorological Office, 2001).
Figure 10 presents noise levels measured at the well sites (noise data see Appendix III). Generally, Figure10 shows high-noise values close to the sources (centre of figure) and low-noise values far from thesources (edges of figure). At the edges, about 160 m from the sources, Figure 10 shows the highest valuestowards south, in the range 88-92 dB(A). This increment in noise levels is due to this part being locatedat a high elevation 400 m a.s.l. with regard to the sound sources (310 m a.s.l.) (see Figure 6). This highzone is mainly composed of bare rocks. As bare rock ground has a high reflection, this ground type canbe classified as hard ground with low-noise absorption (Stephens and Saenz, 1996). This south part isreally a cliff, which constitutes a barrier that produces high-noise reflection between the cliff and the noisesources. For this reason, the noise reflection is increased, such as is shown in Figure 10. Also the chartshows an increment of noise levels to the southeast due to the reflection effect produced from the hill.
To the east, northeast, and north parts of the well sites, the measured values are in the range 82-86 dB(A).Although the ground here has vegetation with some noise absorption it also has a high noise reflectioneffect produced by hot water located in these areas. Generally, water has a high noise reflection, and forthis reason the noise propagation is increased. The lowest noise values at distances up to 160 m, from thewell sites are in the range 76-78 dB(A) and are observed to the northwest, west and southwest. This areahas ground type constituting of volcanic lava with small vegetation that can be considered soft groundwhich presents some noise absorption. Hence, the natural attenuation of noise is increased.
Report 8 López177
0 5 10 15 20 25 30 35 40 45 50 55 60 65Time minutes
82
84
86
88
90
92
94
96
98
100
102
104
106
108
110
112
Noi
se L
eq d
B (A
)
Noise measurement at 5 mNV-16NV-21NV-22
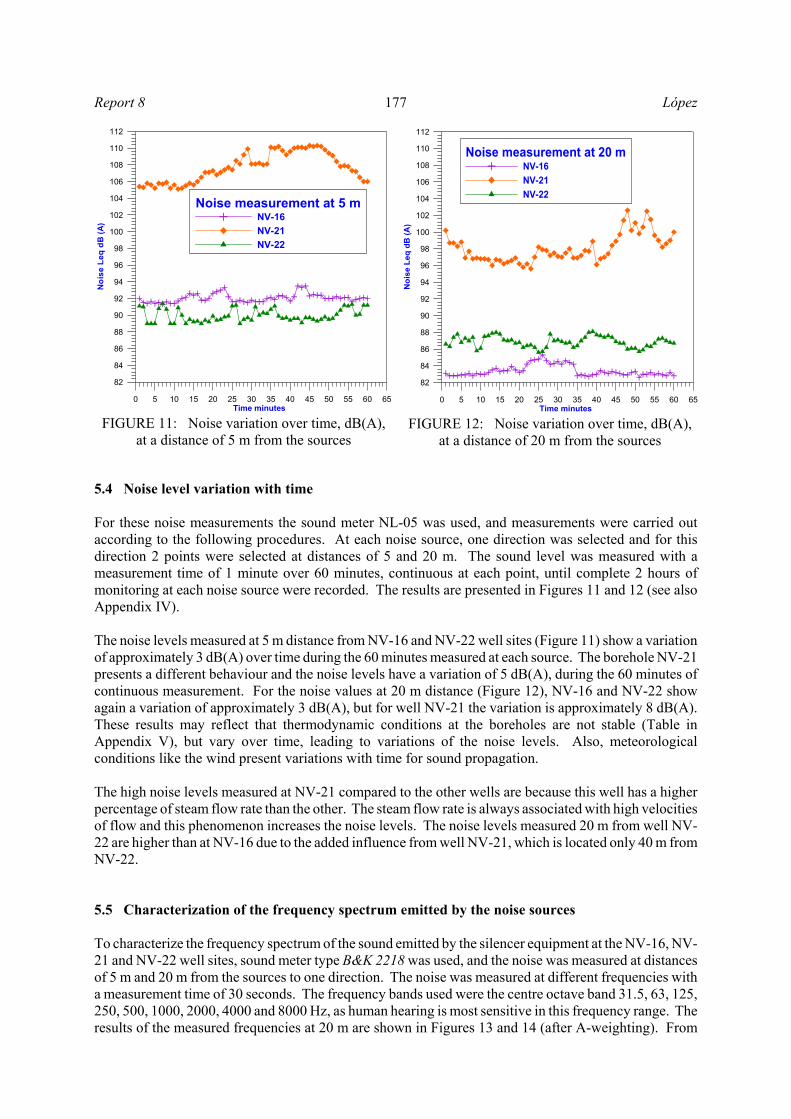
FIGURE 11: Noise variation over time, dB(A),at a distance of 5 m from the sources
0 5 10 15 20 25 30 35 40 45 50 55 60 65Time minutes
82
84
86
88
90
92
94
96
98
100
102
104
106
108
110
112
Noi
se L
eq d
B (A
)
Noise measurement at 20 mNV-16NV-21NV-22
FIGURE 12: Noise variation over time, dB(A),at a distance of 20 m from the sources
5.4 Noise level variation with time
For these noise measurements the sound meter NL-05 was used, and measurements were carried outaccording to the following procedures. At each noise source, one direction was selected and for thisdirection 2 points were selected at distances of 5 and 20 m. The sound level was measured with ameasurement time of 1 minute over 60 minutes, continuous at each point, until complete 2 hours ofmonitoring at each noise source were recorded. The results are presented in Figures 11 and 12 (see alsoAppendix IV).
The noise levels measured at 5 m distance from NV-16 and NV-22 well sites (Figure 11) show a variationof approximately 3 dB(A) over time during the 60 minutes measured at each source. The borehole NV-21presents a different behaviour and the noise levels have a variation of 5 dB(A), during the 60 minutes ofcontinuous measurement. For the noise values at 20 m distance (Figure 12), NV-16 and NV-22 showagain a variation of approximately 3 dB(A), but for well NV-21 the variation is approximately 8 dB(A).These results may reflect that thermodynamic conditions at the boreholes are not stable (Table inAppendix V), but vary over time, leading to variations of the noise levels. Also, meteorologicalconditions like the wind present variations with time for sound propagation.
The high noise levels measured at NV-21 compared to the other wells are because this well has a higherpercentage of steam flow rate than the other. The steam flow rate is always associated with high velocitiesof flow and this phenomenon increases the noise levels. The noise levels measured 20 m from well NV-22 are higher than at NV-16 due to the added influence from well NV-21, which is located only 40 m fromNV-22.
5.5 Characterization of the frequency spectrum emitted by the noise sources
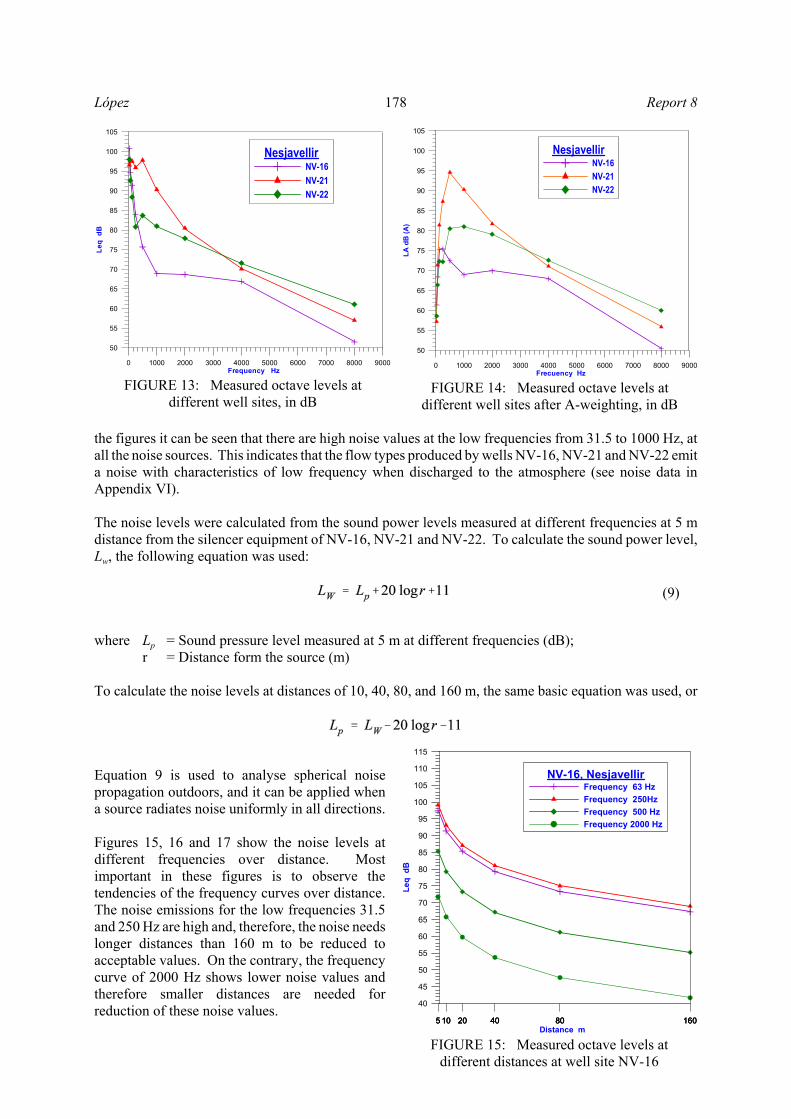
To characterize the frequency spectrum of the sound emitted by the silencer equipment at the NV-16, NV-21 and NV-22 well sites, sound meter type B&K 2218 was used, and the noise was measured at distancesof 5 m and 20 m from the sources to one direction. The noise was measured at different frequencies witha measurement time of 30 seconds. The frequency bands used were the centre octave band 31.5, 63, 125,250, 500, 1000, 2000, 4000 and 8000 Hz, as human hearing is most sensitive in this frequency range. Theresults of the measured frequencies at 20 m are shown in Figures 13 and 14 (after A-weighting). From
López Report 8178
0 1000 2000 3000 4000 5000 6000 7000 8000 9000Frequency Hz
50
55
60
65
70
75
80
85
90
95
100
105
Leq
dB
NesjavellirNV-16NV-21NV-22
FIGURE 13: Measured octave levels atdifferent well sites, in dB
0 1000 2000 3000 4000 5000 6000 7000 8000 9000Frecuency Hz
50
55
60
65
70
75
80
85
90
95
100
105
LA d
B (A
)
NesjavellirNV-16NV-21NV-22
FIGURE 14: Measured octave levels atdifferent well sites after A-weighting, in dB
(9)
5 10 20 40 80 1605 10 20 40 80 1605 10 20 40 80 160Distance m
40
45
50
55
60
65
70
75
80
85
90
95
100
105
110
115
Leq
dB
NV-16, NesjavellirFrequency 63 HzFrequency 250HzFrequency 500 HzFrequency 2000 Hz
FIGURE 15: Measured octave levels atdifferent distances at well site NV-16
the figures it can be seen that there are high noise values at the low frequencies from 31.5 to 1000 Hz, atall the noise sources. This indicates that the flow types produced by wells NV-16, NV-21 and NV-22 emita noise with characteristics of low frequency when discharged to the atmosphere (see noise data inAppendix VI).
The noise levels were calculated from the sound power levels measured at different frequencies at 5 mdistance from the silencer equipment of NV-16, NV-21 and NV-22. To calculate the sound power level,Lw, the following equation was used:
where Lp = Sound pressure level measured at 5 m at different frequencies (dB);r = Distance form the source (m)
To calculate the noise levels at distances of 10, 40, 80, and 160 m, the same basic equation was used, or
Equation 9 is used to analyse spherical noisepropagation outdoors, and it can be applied whena source radiates noise uniformly in all directions.
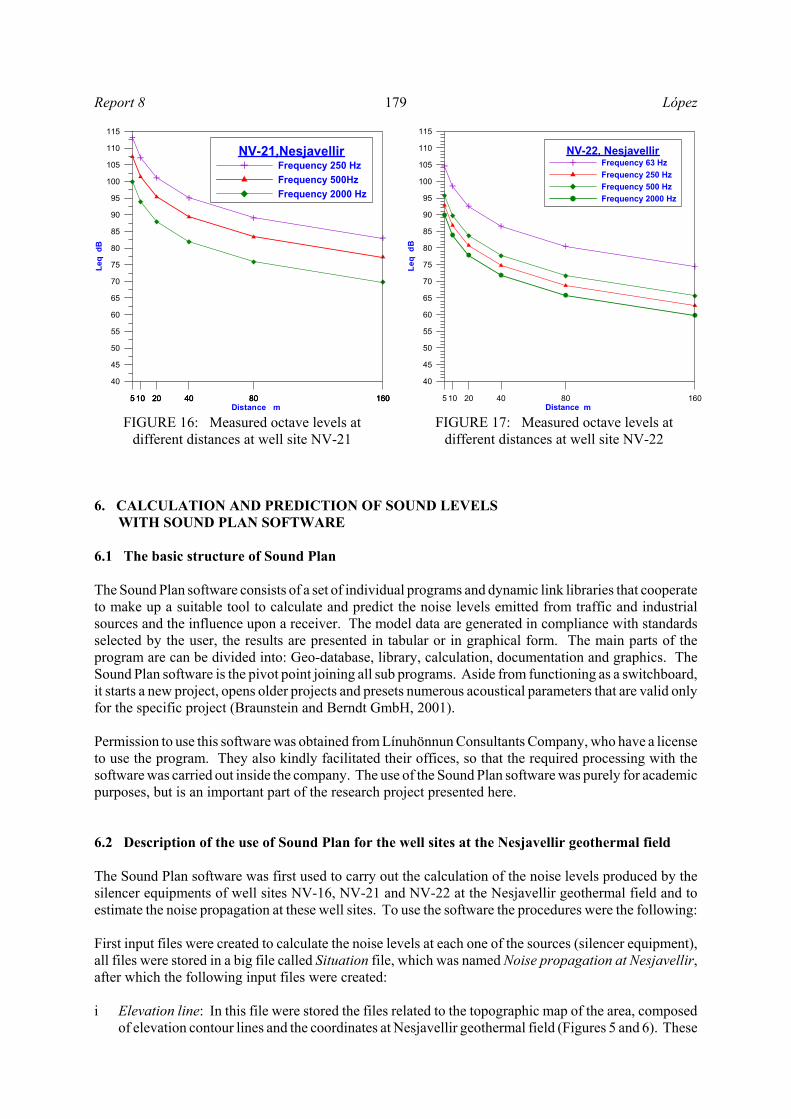
Figures 15, 16 and 17 show the noise levels atdifferent frequencies over distance. Mostimportant in these figures is to observe thetendencies of the frequency curves over distance.The noise emissions for the low frequencies 31.5and 250 Hz are high and, therefore, the noise needslonger distances than 160 m to be reduced toacceptable values. On the contrary, the frequencycurve of 2000 Hz shows lower noise values andtherefore smaller distances are needed forreduction of these noise values.
Report 8 López179
5 10 20 40 80 1605 10 20 40 80 1605 10 20 40 80 160Distance m
40
45
50
55
60
65
70
75
80
85
90
95
100
105
110
115
Leq
dB
NV-21,NesjavellirFrequency 250 HzFrequency 500HzFrequency 2000 Hz
FIGURE 16: Measured octave levels atdifferent distances at well site NV-21
5 4020 16010 80Distance m
40
45
50
55
60
65
70
75
80
85
90
95
100
105
110
115
Leq
dB
NV-22, NesjavellirFrequency 63 HzFrequency 250 HzFrequency 500 HzFrequency 2000 Hz
FIGURE 17: Measured octave levels atdifferent distances at well site NV-22
6. CALCULATION AND PREDICTION OF SOUND LEVELSWITH SOUND PLAN SOFTWARE
6.1 The basic structure of Sound Plan
The Sound Plan software consists of a set of individual programs and dynamic link libraries that cooperateto make up a suitable tool to calculate and predict the noise levels emitted from traffic and industrialsources and the influence upon a receiver. The model data are generated in compliance with standardsselected by the user, the results are presented in tabular or in graphical form. The main parts of theprogram are can be divided into: Geo-database, library, calculation, documentation and graphics. TheSound Plan software is the pivot point joining all sub programs. Aside from functioning as a switchboard,it starts a new project, opens older projects and presets numerous acoustical parameters that are valid onlyfor the specific project (Braunstein and Berndt GmbH, 2001).
Permission to use this software was obtained from Línuhönnun Consultants Company, who have a licenseto use the program. They also kindly facilitated their offices, so that the required processing with thesoftware was carried out inside the company. The use of the Sound Plan software was purely for academicpurposes, but is an important part of the research project presented here.
6.2 Description of the use of Sound Plan for the well sites at the Nesjavellir geothermal field
The Sound Plan software was first used to carry out the calculation of the noise levels produced by thesilencer equipments of well sites NV-16, NV-21 and NV-22 at the Nesjavellir geothermal field and toestimate the noise propagation at these well sites. To use the software the procedures were the following:
First input files were created to calculate the noise levels at each one of the sources (silencer equipment),all files were stored in a big file called Situation file, which was named Noise propagation at Nesjavellir,after which the following input files were created:
i Elevation line: In this file were stored the files related to the topographic map of the area, composedof elevation contour lines and the coordinates at Nesjavellir geothermal field (Figures 5 and 6). These

López Report 8180
files were created first with the AutoCAD program and were later imported to Sound Plan to createthe elevation line file, which is a base data later used in the calculation of noise levels.
ii Ground type: In this file was stored the information relating to ground types existing at well sites NV-16, NV-21 and NV-22 (Figures 5 and 6). The ground types were classified as soft ground (groundcomposed of land with vegetation), mixed ground (ground composed of land with vegetation, volcaniclava and rocks) and hard ground, which is constituted mainly of rocks. Each one of these groundtypes was assigned a value corresponding to noise absorption, so the soft ground was assigned thevalue of 1 (100% absorption), the mixed ground was assigned 0.5 (50% absorption) and the hardground 0 (0% of absorption), as is recommended by the Sound Plan manual.
iii Road file: In this file were characterized the existing roads around the NV-16, NV-21 and NV-22 wellsites. They were also classified as mixed ground and assigned a value of 0.5 (Figures 5 and 6).
iv Water: In this file were grouped the areas where hot water ponds are found around the well sites ofNV-16, NV-21 and NV-22. They were also classified as areas with high values of noise reflectionand assigned 0% noise absorption, see Figures 5 and 6.
v Building: In this file were grouped the wellhead houses NV-16, NV-21 and NV-22 and assignedvalues of 0% noise absorption.
vi Barriers: In this file were grouped the pipelines of NV-16, NV-21 and NV-22, and assigned valuesof 0% noise absorption.
vii Sources: In this file were grouped the silencer equipment of NV-16, NV-21 and NV-22.viii Noise emission: These files were created in the file sources of each geothermal well.ix Calculation file. When all files had been created, the next step was to calculate the noise level
propagation for each noise source (silencer equipment). For this, it was necessary to create thecalculation file, containing the results of the calculated noise levels.
In the noise emission file, the following parameters were set:
• Day histogram, was set at 100% operation time of silencer equipment.• Values, were set as the sound power levels calculated from measured noise values at different
frequencies at 5 m distance from the silencer equipments, see Table 3.• Comments, was set as descriptive information about the noise measurements at NV-16, NV-21 and
NV-22 well sites.• Group, referred to the corresponding noise emission files.• Directivity, was not set to a specific value so the noise propagation is given as equal in all directions.
TABLE 3: Measured noise values at different frequencies for wells NV-16, NV-21, NV-22
Frequency NV-16 NV-21 NV-22type Sound power level Sound power level Sound power level(Hz) (dB) (dB) (dB)31.5 134.0 130.5 135.063 122.4 130.5 129.6
125 122.1 129.3 125.4250 124.1 138.1 117.8500 110.3 132.4 120.7
1000 101.2 133.9 118.02000 96.8 124.9 114.94000 91.3 114.8 108.68000 74.4 107.8 98.1
It is important to mention that every time a file is created, it needs to be saved immediately on a situationfile, which was created at the beginning. This situation file converts all files created from a temporaryfile to a permanent file and so can be used later for other calculations.
Report 8 López181
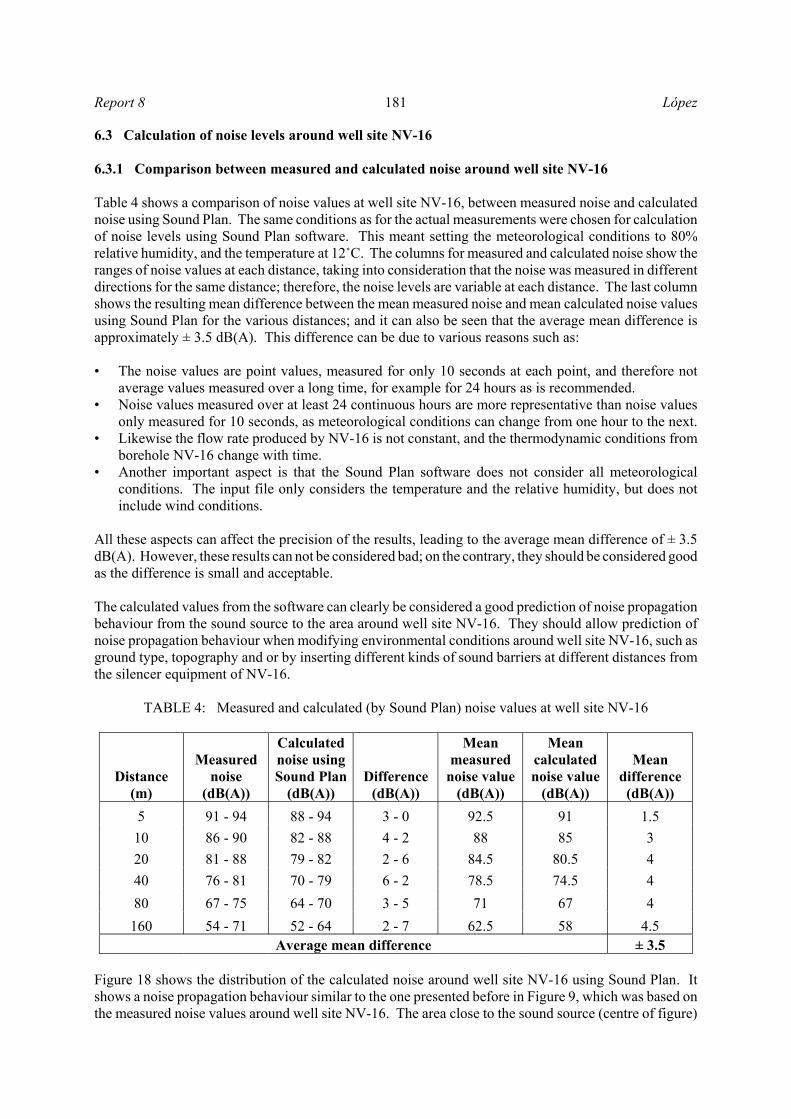
6.3 Calculation of noise levels around well site NV-16
6.3.1 Comparison between measured and calculated noise around well site NV-16
Table 4 shows a comparison of noise values at well site NV-16, between measured noise and calculatednoise using Sound Plan. The same conditions as for the actual measurements were chosen for calculationof noise levels using Sound Plan software. This meant setting the meteorological conditions to 80%relative humidity, and the temperature at 12/C. The columns for measured and calculated noise show theranges of noise values at each distance, taking into consideration that the noise was measured in differentdirections for the same distance; therefore, the noise levels are variable at each distance. The last columnshows the resulting mean difference between the mean measured noise and mean calculated noise valuesusing Sound Plan for the various distances; and it can also be seen that the average mean difference isapproximately ± 3.5 dB(A). This difference can be due to various reasons such as:
• The noise values are point values, measured for only 10 seconds at each point, and therefore notaverage values measured over a long time, for example for 24 hours as is recommended.
• Noise values measured over at least 24 continuous hours are more representative than noise valuesonly measured for 10 seconds, as meteorological conditions can change from one hour to the next.
• Likewise the flow rate produced by NV-16 is not constant, and the thermodynamic conditions fromborehole NV-16 change with time.
• Another important aspect is that the Sound Plan software does not consider all meteorologicalconditions. The input file only considers the temperature and the relative humidity, but does notinclude wind conditions.
All these aspects can affect the precision of the results, leading to the average mean difference of ± 3.5dB(A). However, these results can not be considered bad; on the contrary, they should be considered goodas the difference is small and acceptable.
The calculated values from the software can clearly be considered a good prediction of noise propagationbehaviour from the sound source to the area around well site NV-16. They should allow prediction ofnoise propagation behaviour when modifying environmental conditions around well site NV-16, such asground type, topography and or by inserting different kinds of sound barriers at different distances fromthe silencer equipment of NV-16.
TABLE 4: Measured and calculated (by Sound Plan) noise values at well site NV-16
Distance(m)
Measurednoise
(dB(A))
Calculatednoise usingSound Plan
(dB(A))Difference
(dB(A))
Meanmeasured
noise value(dB(A))
Meancalculatednoise value
(dB(A))
Meandifference(dB(A))
5 91 - 94 88 - 94 3 - 0 92.5 91 1.510 86 - 90 82 - 88 4 - 2 88 85 320 81 - 88 79 - 82 2 - 6 84.5 80.5 440 76 - 81 70 - 79 6 - 2 78.5 74.5 480 67 - 75 64 - 70 3 - 5 71 67 4
160 54 - 71 52 - 64 2 - 7 62.5 58 4.5Average mean difference ± 3.5
Figure 18 shows the distribution of the calculated noise around well site NV-16 using Sound Plan. Itshows a noise propagation behaviour similar to the one presented before in Figure 9, which was based onthe measured noise values around well site NV-16. The area close to the sound source (centre of figure)

López Report 8182
FIGURE 18: Calculated noise levels at well site NV-16 by Sound Plan
has high noise values and low noise values are seen for the area far from the source (edges of figure).Noise values between 64 and 70 dB(A) can be seen towards northwest of the well site NV-16, extendingto distances of 80-160 m. These values are the highest obtained at this distance. This effect is becauseof the rising elevation of the land toward northwest from well site NV-16 and its surface being mainly ofrocks, which have high noise reflection. Therefore, the noise is highest in this part of the area aroundNV-16. In other part the ground is lower and softer with more noise absorption, such as was indicatedin Figure 9. In Figure 18 a screening effect of noise produced by the wellhead house and the pipeline canalso be seen. The noise screening effect decreases at increased distances.
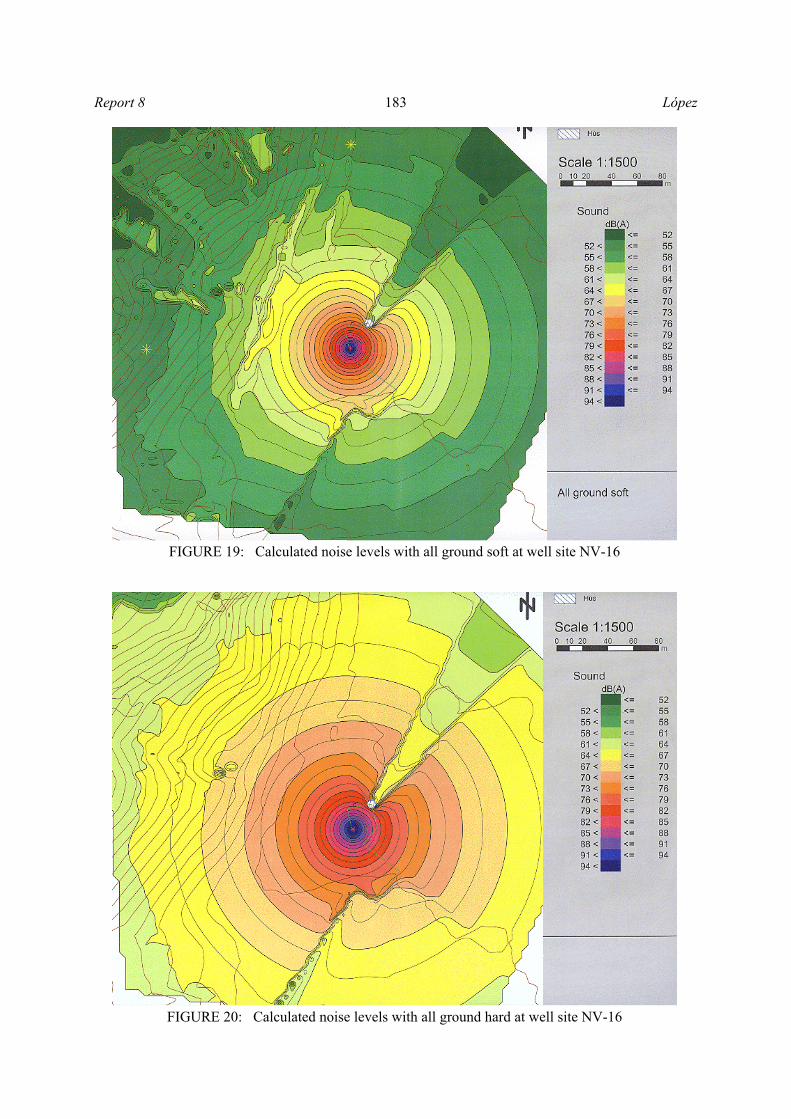
6.3.2 Noise level calculations modifying the ground type
In order to assess the effect of the ground type, all ground types around well site NV-16 were changed tosoft ground and with these new conditions noise levels were recalculated. Figure 19 shows the noisepropagation for the modified ground conditions. The reflection effect of noise in the area northwest ofwell site NV-16, as seen in Figure 18, has mostly disappeared and the noise propagation is reduced by thesoft ground, which has high absorption of noise and constitutes a natural environment of noise attenuation.The noise levels obtained at a distance of 80 m are between 55 and 61 dB(A). Figure 19 demonstrates thatsoft ground has a good capacity for noise absorption and can be used as a natural source to attenuate noiselevels.
The opposite situation is observed in Figure 20, which shows the noise propagation calculated around wellsite NV-16 with all ground types changed to hard ground. The reflection effect of noise has been extendedto all the areas around the well site within distances of 160 m and the noise values are between 64 and 67dB(A). The hard ground produces a spherical noise propagation around the area of the well site, with theexception of the effect produced by the wellhead house, which reduces the noise levels behind it.
Report 8 López183
FIGURE 19: Calculated noise levels with all ground soft at well site NV-16
FIGURE 20: Calculated noise levels with all ground hard at well site NV-16

López Report 8184
FIGURE 21: Noise levels with inserted barrier at silencer equipment of borehole NV-16
6.3.3 Noise level calculations inserting a sound barrier
A sound barrier was inserted at 1 m distance from the silencer equipment at NV-16. The barrier is a box,with 4 walls of 6 × 6 m and 0.1 m of thickness, and the construction material was considered to have highnoise absorption. The calculated results of the effect of the barrier are observed in Figure 21, which showsa big reduction of noise propagation around well site NV-16. This figure indicates noise values of 61dB(A) at a distance of 40 m and at 160 m the noise levels are between 52 and 55 dB(A). This result isvery important as it shows that a barrier placed very close to the sound source, can effectively reduce thenoise levels, when it is not possible modify the design of the noise source or when it would be tooexpensive to abandon communities living close to the well sites (Stephens and Saenz, 1996).
6.4 Calculation of noise levels around well site NV-21/NV-22
6.4.1 Comparison between measured and calculated noise around well site NV-21/NV-22
Table 5 shows the caomparison of measured noise values and noise values calculated using Sound Planaround well sites NV-21 and NV-22, similar as Table 4 did for NV-16. The calculation of noise levelswas carried out setting meteorological conditions the same as during measurements, i.e. 80% relativehumidity and the temperature at 10ºC. Again, the columns for measured and calculated noise do not showpoint values but value ranges for each distance, as the noise was measured for different directions at thesame distance, and the noise levels are variable with regard to each direction. The last column shows theresulting mean difference, between the mean noise measured and the mean noise calculated using SoundPlan. The average of the mean difference is approximately ± 2 dB(A). The reasons for this differencewere discussed in Section 6.3.1.
The resulting mean difference, ± 2 dB(A), can be considered good, being small and, thus, acceptable.Also the calculated values from Sound Plan clearly permit an assessment of the noise propagation

Report 8 López185
behaviour from the source to the area around well sites NV-21 and NV-22, and also prediction of the noisepropagation by modifying the environmental conditions around the well sites, for example ground typeand topography and by inserting different types of barriers at different distances from the silencerequipment of NV-21 and NV-22.
TABLE 5: Measured and calculated noise values for well sites NV-21, NV-22
Distance(m)
Measurednoise
(dB(A))
Calculatednoise usingSound Plan
(dB(A))Difference
(dB(A))
Meanmeasured
noise value(dB(A))
Meancalculatednoise value
(dB(A))
Meandifference(dB(A))
5 104 - 111 104 - 107 0 - 4 107.5 105.5 210 99 - 107 101 - 104 2 - 3 103 102.5 0.520 96 - 103 98 - 101 2 - 2 99.5 99.5 040 88 - 98 92 - 98 4 - 0 93 95 280 81 - 93 83 - 92 2 - 1 87 87.5 0.5
160 77 - 93 77 - 83 0 - 10 85 80 5Average mean difference ± 2
Figure 22 presents the calculated noise using Sound Plan at well sites NV-21/NV-22. The noise emissionis similar to the measured noise values around well sites NV-21/NV-22 seen in Figure 10. The figureshows high noise values, between 83 and 86 dB (A), at distances of 160 m south of the well sites. Thehigher noise values obtained here are due to the fact that here is a cliff composed mainly of bare rocks,which constitutes a barrier and, thus, a noise reflection effect is produced between the noise sources andthe cliff. Other areas around the well sites have lower noise levels, as explained in Figure 10.
FIGURE 22: Calculated noise levels around well sites NV-21 and NV-22

López Report 8186
FIGURE 23: Calculated noise levels with all ground softaround well sites NV-21 and NV-22
6.4.2 Noise level calculations modifying the ground type
Figure 23 shows the calculation of noise propagation around well sites NV-21/NV-22, when all groundtypes at the well sites are modelled to be soft . The noise levels are lower, especially in the south,compared to those seen in Figure 22, as is to be expected. The values obtained at distances of 160 m inthe southern part are in the range 77-80 dB(A), which is a reduction of 6 dB(A) compared to the naturalconditions shown in Figure 22.
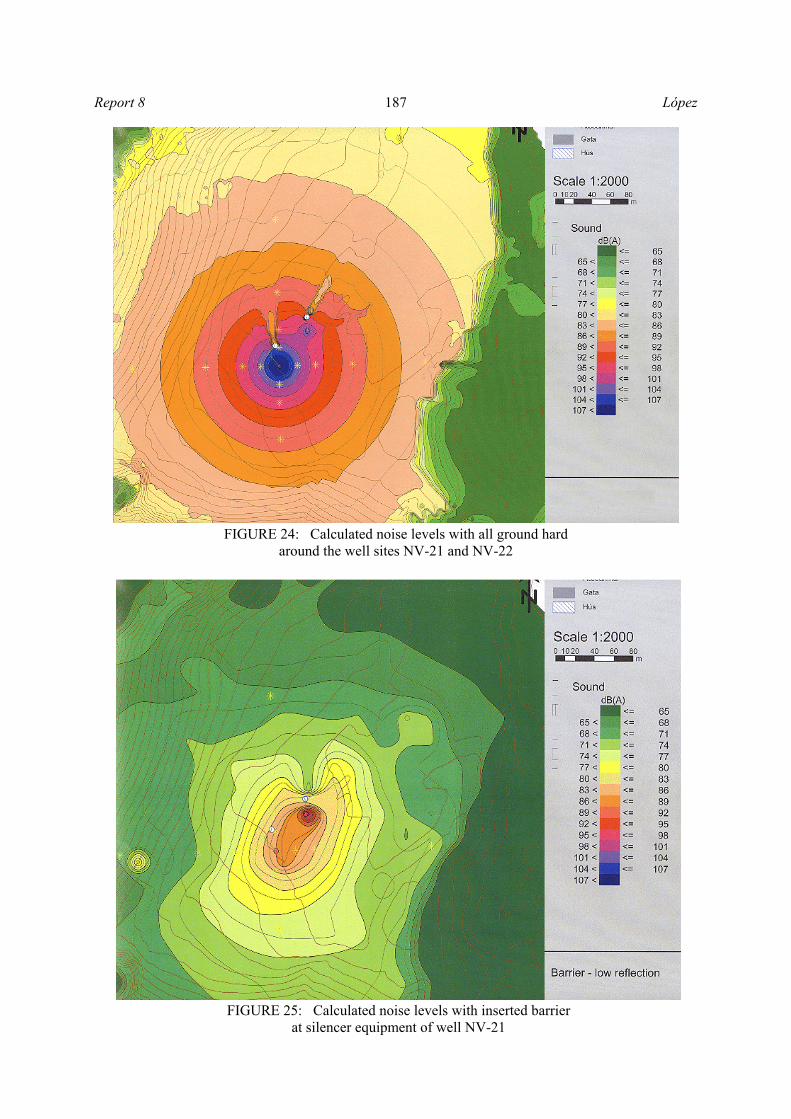
A different situation can be seen in Figure 24, which shows the ground conditions modelled as hardground around the well sites. Now the noise levels in other areas around the well sites have increased,from the range of 77-80 dB(A) shown in Figure 22 to 83-86 dB(A).
6.4.3 Noise level calculations inserting a sound barrier
The noise propagation obtained for the natural environment shown in Figure 22, is reduced when groundconditions are changed to soft ground such as was discussed above, and the noise levels can be reducedeven further when a barrier is inserted to mitigate the noise.
The silencer equipment of borehole NV-21 was closed using a barrier with a box form placed at a distanceof 1 m from the equipment; the size of the 4 walls used was 6 × 6 m and the thickness 0.1 m. Figure 25shows the effect produced by the barrier. The noise values obtained 160 m south of the well sites are inthe range 71-74 dB(A), a reduction of 12 dB(A) compared to values shown in Figure 23. The values inthe range 71-74 dB(A) can still be considered high, and the reason is that a barrier was only placed closeto the silencer equipment of borehole NV-21. The silencer equipment of the other borehole NV-22, alsoin operation, was not closed by a barrier.
Figure 26 presents a different effect produced by a barrier. In this case the barrier was placed 40 m to thesouthwest of the silencer equipment of borehole NV-21. The barrier has one wall 40 × 6 m and another80 × 6 m and the thickness 0.1.
Report 8 López187
FIGURE 24: Calculated noise levels with all ground hardaround the well sites NV-21 and NV-22
FIGURE 25: Calculated noise levels with inserted barrierat silencer equipment of well NV-21

López Report 8188
FIGURE 26: Calculated noise levels with a barrier inserted at 40 m distanceto the southwest from the silencer equipment of borehole NV-21
The noise values obtained indicate a noise reduction of 15 dB(A) behind the barrier. But at distancesabove 40 m from the barrier, the noise levels start to increase again, by 3 dB(A), and at a distance of 160m the values are increased by 6 dB(A). The noise propagation behaviour seen in Figure 26 indicates thatwhen a barrier is placed far from a source, the size of the barrier needs to increase, and the mitigationeffect is not as efficient as up close to the source.
For a good mitigation effect to be produced by a barrier, the barrier has to be tight and made of heavy,sound-insulating material of approximately 20 kg/m2. It must also be high and either placed close to thesource or the receiver. It is also good if the surface of the barrier (in the direction of the source) has goodsound absorption. If the barrier is reflective, the sound is reflected towards the source and the sound levelon that side of the barrier increases when the barrier is built. A barrier is also more effective at a highfrequency source than at a source with a dominating low frequency, as here. When the wavelength of thesound is equal to the height of the a barrier, the sound waves can go over the top of the barrier more easilyand the sound reduction of the barrier is reduced (Maekawa and Lord, 1994; Beranek, 1971).
7. CONCLUSIONS AND RECOMMENDATIONS
1. With the elaboration of this research report it has been possible to recognise distinct environmentalvariables that affect noise propagation behaviour in geothermal fields. A suitable combination ofthese variables can help to attenuate, in natural form, noise impacts when it is too expensive to modifythe design of noise sources in operation projects.
2. The scope of this study was focussed on noise sources located in outdoor environmental settings andsources located inside buildings were not included. The purpose was to study the attenuation formsof outdoor noise levels produced from a point source such as silencer equipment at well sites whichmight have communities living close by.
Report 8 López189
3. A similar study can also be applied to the drilling of boreholes where there are several simultaneouslyactive noise sources. It can also be applied to all kinds of geothermal activities that emit noise andaffect communities living close to the work areas.
4. No noise source emitting dominant high frequency noise was found in the Nesjavellir geothermalfield.
5. The present report can be considered a preliminary stage in studying the noise propagation behaviourfor geothermal projects. The obtained results and information can help to improve and developenvironmental management aimed at low cost measures for the mitigation of environmental impacts.
6. Experimental testing of noise propagation is recommended, modifying environmental conditions suchas ground type, and inserting acoustic barriers of different sizes and construction materials for thepurpose of obtaining low noise values. These could later be applied to environmental measures fornoise attenuation.
7. It would be advisable to carry out studies of noise propagation for different designs of silencerequipment using construction materials with high noise absorption, for the purpose of improvingcurrent designs and to obtain an equipment design that might be classified as ecological with lownoise levels in accordance with environmental legislation.
8. Finally, it is recommended when carrying out noise measurements at test points to use a longermeasuring time, about 24 hours, in order to obtain good representative noise values from the source.
ACKNOWLEDGMENTS
First, my deepest gratitude to God and Jesus Christ for giving my dear wife Sonia del Carmen de López,my dear daughter Yadid Eloany Lopez and myself the necessary support during my geothermal trainingfor the six months in Iceland. I want to express my gratitude to the government of Iceland, United NationsUniversity and Geotérmica Salvadoreña S. A. de C. V. for permitting me to attend the GeothermalTraining Programme. Thanks to those who coordinate the programme, Dr. Ingvar B. Fridleifsson,director, Mr. Lúdvík S. Georgsson, deputy director and Mrs. Gudrún Bjarnadóttir, administrative assistant,for their efficient help and kindness during training.
Great thanks to Dr. Steindór Gudmundsson, my supervisor, for comments, ideas and patient revision ofthe draft of this report. Also I want to thank Dr. Halldór Ármannsson, for his unconditional support andReykjavík Energy Co., especially Mr. Gestur Gíslason, for all the assistance given at Nesjavellir PowerPlant. Likewise, I am very grateful to Línuhönnun Consulting Engineers Company, who kindly facilitatedtheir offices, for processing part of this report. Finally, I would like to extend my gratitude to theenvironmental team from El Salvador and to all the people that collaborated in carrying out this researchstudy.
REFERENCES
Agricultural Research Institute, 1982: Vegetation map of Iceland, sheet 133, Thingvellir. AgriculturalResearch Institute, Reykjavík.
Árnason, K., Haraldsson, G.I., Johnsen, G.V., Thorbergsson, G., Hersir G.P., Saemundsson, K, Georgsson,L.S., and Snorrason, S.P., 1986: Nesjavellir, geological and geophysical exploration in 1985.Orkustofnun, Reykjavík, report OS-86014/JDH-02 (in Icelandic), 125 pp.
Beranek, L.L., 1971: Noise and vibration control. McGraw-Hill, New York., 127 pp.
López Report 8190
Braunstein and Berndt GmbH, 2001: User's manual of SoundPLAN Wins software, Sound PLAN 5.0.Braunstein and Berndt GmbH., Denmark, 448 pp.
Brüel & Kjaer, 1999: Instruction manual, precision integrating sound level meter, type 2218, IEC-651.Brüel & Kjaer, Nærum, Denmark.
Davis, M.L., and Cornwell, D.A., 1991: Introduction to environmental engineering. McGraw-Hill, NewYork, 1527 pp.
Egilsson, K., Hardardóttir, M., and Gudjónsson, G., 2000: Environmental impact assessment atNesjavellir geothermal power plant. Project of expansion from 56 to 90 MWe. VGK Consulting EngineersLtd., Iceland.
Franzson, H., Gudmundsson, Á., Fridleifsson, G.Ó., and Tómasson, J., 1986: Nesjavellir high-temperature field, SW-Iceland. Reservoir geology. Extended abstracts of 5th International Symposiumon Water-Rock Interaction, Reykjavík, 210-213.
Gíslason, G., 2000: Nesjavellir co-generation plant, Iceland. Flow of geothermal steam and non-condensable gases. Proceedings of the World Geothermal Congress 2000, Kyushu - Tohoku, Japan, 585-590.
Gunnarsson, Á., Steingrímsson, B., Gunnlaugsson, E., Magnússon, J., and Maack, R., 1992: Nesjavellirgeothermal co-generation power plant. Geothermics, 21- 4, 559-583.
Harris, C.M., Piercy, J.E., and Daigle, G.A., 1995: Manual of acoustic measures and noise control.Technical School of Architectural Acoustics, Madrid, Spain.
Icelandic Meteorological Office, 2001: Climate of Iceland. The Icelandic Meteorological Office, Internetweb page, http://www.vedur.is/english/index_eng.htm1.
MWD, 1983: Ohaaki geothermal power station, noise level survey. AEL, report 83/84, 21 pp.
Maekawa, Z., and Lord, P., 1994: Environmental and architectural acoustics. Chapman & Hall, KobeUniversity of Osaka, and University of Salford, UK., 371 pp.
Rion Co., Ltd, 1996: Instruction manual. Integrating sound level meter NL-05. Higashimotomachi,Kokubunji, Tokyo, Japan.
Saemundsson, K., 1992: Geology of the Thingvallavatn area. Oikos, 64, 40-68.
Stephens, R.W.B., and Saenz, A.L., 1996: Noise pollution. Institute of Acoustic CSIC, Madrid, Spain.
Steingrímsson, B., Gudmundsson, A., Franzson, H., and Gunnlaugsson, E., 1990: Evidence of asuperficial fluid at depth in the Nesjavellir field. Proceedings of the 15th Workshop on GeothermalReservoir Engineering, Stanford University, California, 81-88.
Thorsteinsson, I., and Arnalds, Ó., 1992: The vegetation and soil of the Thingvallavatn area. Oikos, 64,105-116.

Report 8 López191
López Report 8192
APPENDIX II: Noise values collected around borehole NV-16 ofNesjavellir geothermal power plant
Report 8 López193
APPENDIX III: Noise values collected around boreholes NV-21/22 ofNesjavellir geothermal power plant

López Report 8194
APPENDIX IV: Noise measurements with time

Report 8 López195
APP
EN
DIX
V:
Pro
duct
ion
cond
ition
s of b
oreh
oles
NV
-16,
NV
-21
and
NV
-22
with
dis
char
ge to
sile
ncer
equ
ipm
ent,
disc
harg
e at
100
ºC

López Report 8196
APPENDIX VI: Noise measurements
Noise measurements with regards to the frequency type at 5 m distance from boreholes

Report 8 López197
Noise measurements with regards to the frequency type at 20 m distance from boreholes

López Report 8198
Noise measurements with regards to the frequency and distances