prepaid top up analytics.docx
DESCRIPTION
GOODTRANSCRIPT

Prepaid Top-up AnalysisUser Manual
For
Document Review Histor y Reviewer Designation Date Version
Archit Sarwal Associate Consultant . SAP BO
13thJune 2013 1.0 (Initial Draft)
V. Krishna Kumar Business Head – Middle East
........ 1.0
P a g e | 1

Contents
1 Introduction 4
2 Features 4
3 Functional specifications 4
4 Action and Trigger Points 5
5 Selecting Region and Period 7
6 Section : All channels 8
Purpose 8
6.1 Stock chart 9
6.2 Virtual recharge sales 10
6.3 Virtual recharge revenue 10
6.4 Physical voucher sales 11
6.5 Physical voucher revenue 11
7 Section: Branches 13
Purpose 13
7.1 Stock chart 13
7.2 Virtual recharge sales 14
7.3 Virtual recharge revenue 15
7.4 Physical voucher sales 15
7.5 Physical voucher revenue 16
8 Section: Franchise 18
Purpose 18
8.1 Stock chart 19
8.2 Virtual recharge sales 20
8.3 Virtual recharge revenue 20
P a g e | 2
8.4 Physical voucher sales 20
8.5 Physical voucher revenue 21
9 Section: Distributors 22
Purpose 22
9.1 Stock chart 24
9.2 Virtual recharge sales 24
9.3 Virtual recharge revenue 25
9.4 Physical voucher sales 25
9.5 Physical voucher revenue 26
10 Constraints 26
P a g e | 3

1. Introduction
Q-Tel offers its customers the convenient means of direct recharge (Top up), through their strong
distribution channels like their branches, Franchise and distributor networks. They are providing
different facility of top-up recharge in form of physical vouchers as well as virtual recharge for both
voice and data services which ranges from 0.5 KWD to 20 KWD.
In this well designed and formulated dashboard, the Q-Tel management will be able to view the
details for Prepaid top-up’s revenue, stock availability of recharges, number of prepaid top-up
recharges through virtual recharges and physical recharges for various channels. This will help them
to monitor and control dedicated prepaid recharge strategies efficiently and effectively. This
Dashboard will also give them top view information regarding prepaid top-ups and Management
can take any corrective steps based on it if required.
2. Features
The new BO based Prepaid Top-ups Analysis covers all the needs of above mentioned, Dashboard
will have the following features:
Facility to view stock availability of various recharges ranging from 0.5 KWD to 20 KWD with
different channels such as Branches, Franchise, Distributor network and with all of them
together for specific time period.
Facility to view details for virtual recharges, number of recharges done of different charges
and for voice and data services by various channels for specific time period. Also, user can
also view revenue earned for the same.
Facility to view details for Physical vouchers, number of recharges sold out by distributors,
branches, franchise and all together for different values of 0.5KWD to 20 KWD. User can also
view revenue earned for different channels for specific time period.
3. Functional Specification in Detail
Prepaid Top-up Analytics has 1 Dashboard Document which help in loading the dashboard faster, and also maintenance will be easier. It has 4 sections showing Prepaid details for Top-up recharges for their channels like distributors, franchise, branches and All channels together.
1. All channels – section gives details about the stock availability of recharges with all channels together within specific time period. Detailed information is also present
P a g e | 4
for number of recharges sold for virtual and physical vouchers along with their revenues.
2. Distributors – section gives details about the stock availability of recharges with distributor network within specific time period. Detailed information is also present for number of recharges sold for virtual and physical vouchers along with their revenues for that specific time period.
3. Franchise – section gives details about the stock availability of recharges with franchise network within specific time period. Detailed information is also present for number of recharges sold for virtual and physical vouchers along with their revenues for that specific time period.
4. Branches – section gives details about the stock availability of recharges with their branches within specific time period. Detailed information is also present for number of recharges sold for virtual and physical vouchers along with their revenues for that specific time period.
4. Action & Trigger Points
Action & Trigger Points Type Action Detail Period Dropdown Select the Period
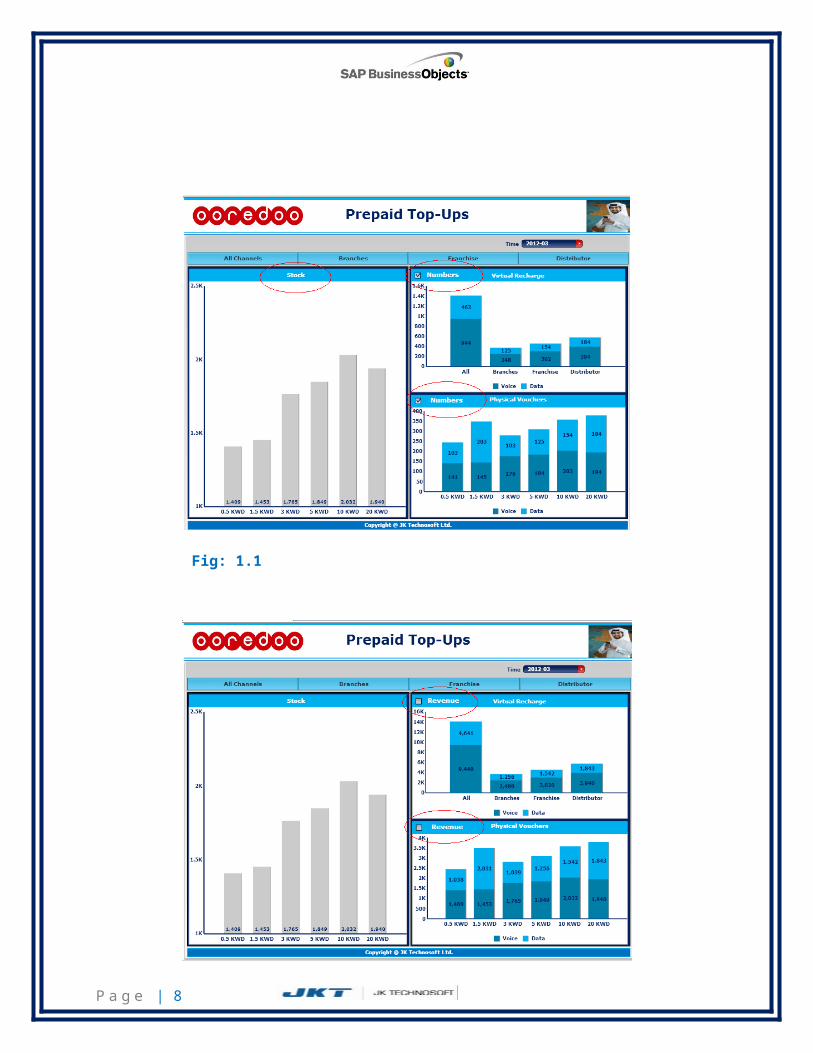
Once you open the dashboard it will open with the all channels section by default. This shows the stocks availability, number of recharges sold, revenue from top-ups for voice and data services :
P a g e | 5
Fig: 1.1
Fig: 1.2
P a g e | 6

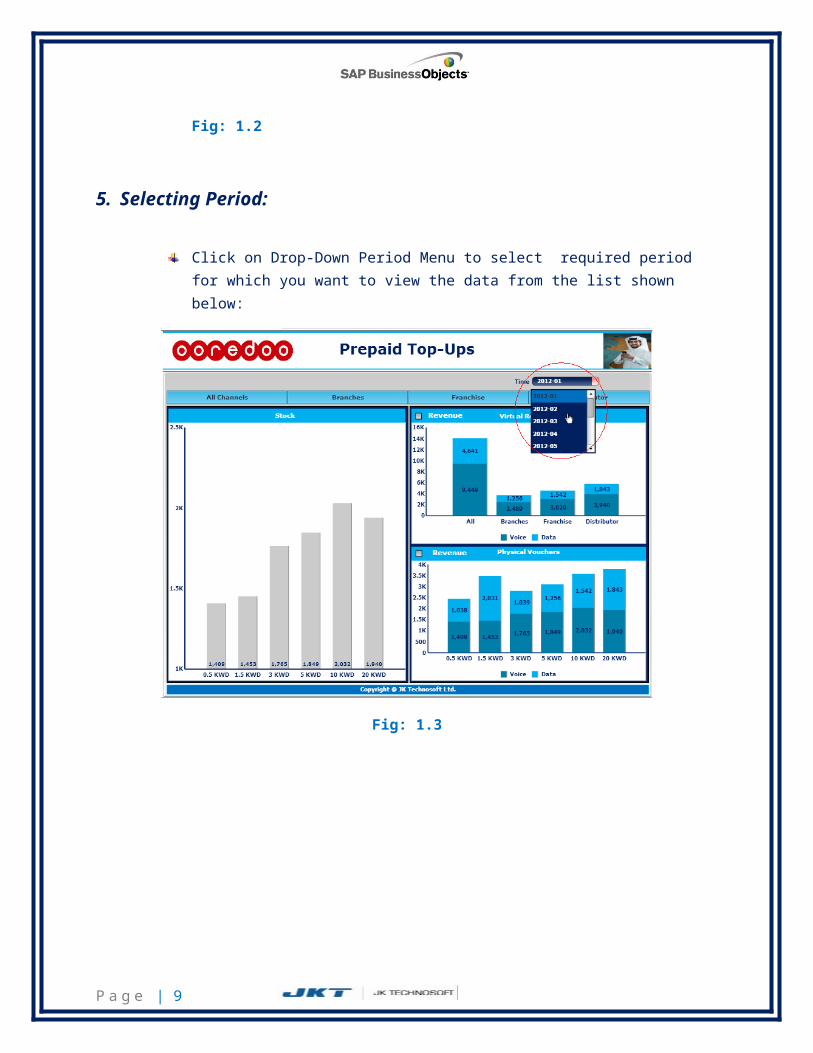
5. Selecting Period:
Click on Drop-Down Period Menu to select required period for which you want to view the data from the list shown below:
Fig: 1.3
P a g e | 7
6. Section: All channels
PurposeUser can able to see the stocks available for the recharges with all the channels together, number of virtual recharges done and number of physical recharge vouchers sold, both along with the revenue generated taking all the channels together for various recharge values like 0.5 KWD and 10 KWD for specific time period
You can observe the Stock availability of recharges, numbers of recharges sold and done, revenues earned from prepaid recharges from various charts in dashboard.
The Highlights: Stock availability of recharges Number of virtual recharges done along with revenues earned Number of physical recharge voucher sold along with revenues
earned Observe under the individual headings with a brief description.
Fig: 1.4
P a g e | 8
After touching the check boxes in Number chart for Virtual recharge and Physical vouchers, we get the Revenue chart as shown below:
Fig: 1.5
P a g e | 9

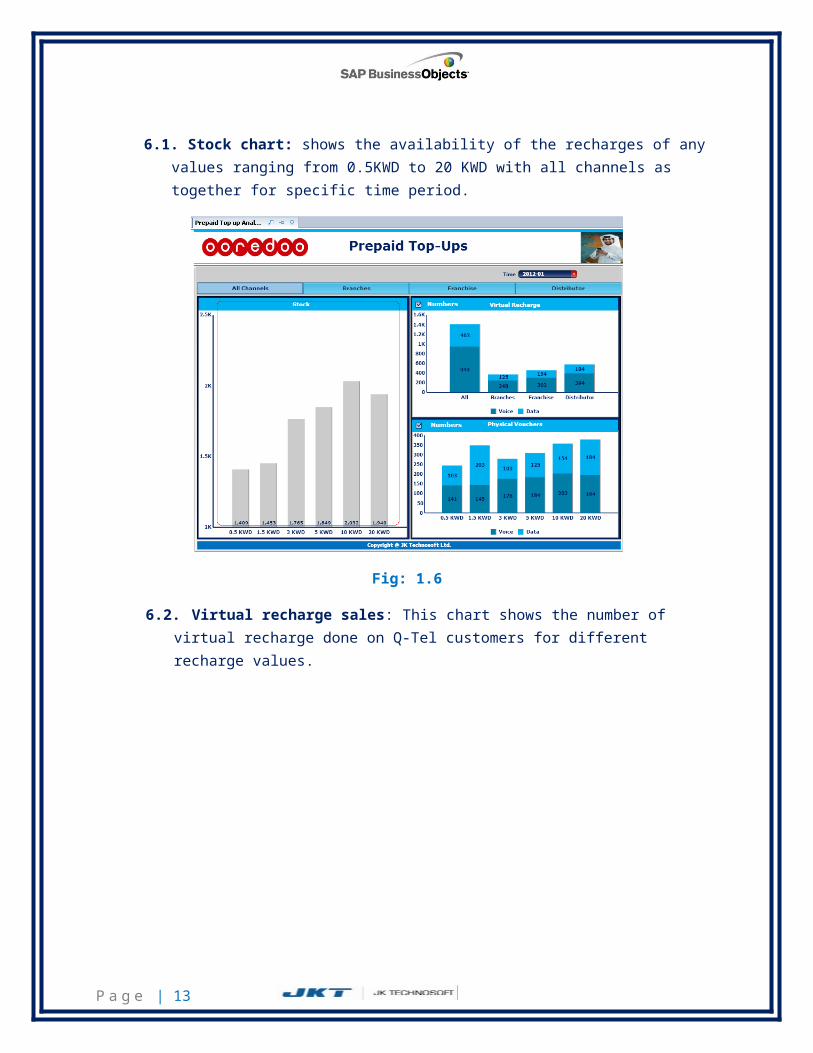
6.1. Stock chart: shows the availability of the recharges of any values ranging from 0.5KWD to 20 KWD with all channels as together for specific time period.
Fig: 1.6
6.2. Virtual recharge sales: This chart shows the number of virtual recharge done on Q-Tel customers for different recharge values.
P a g e | 10
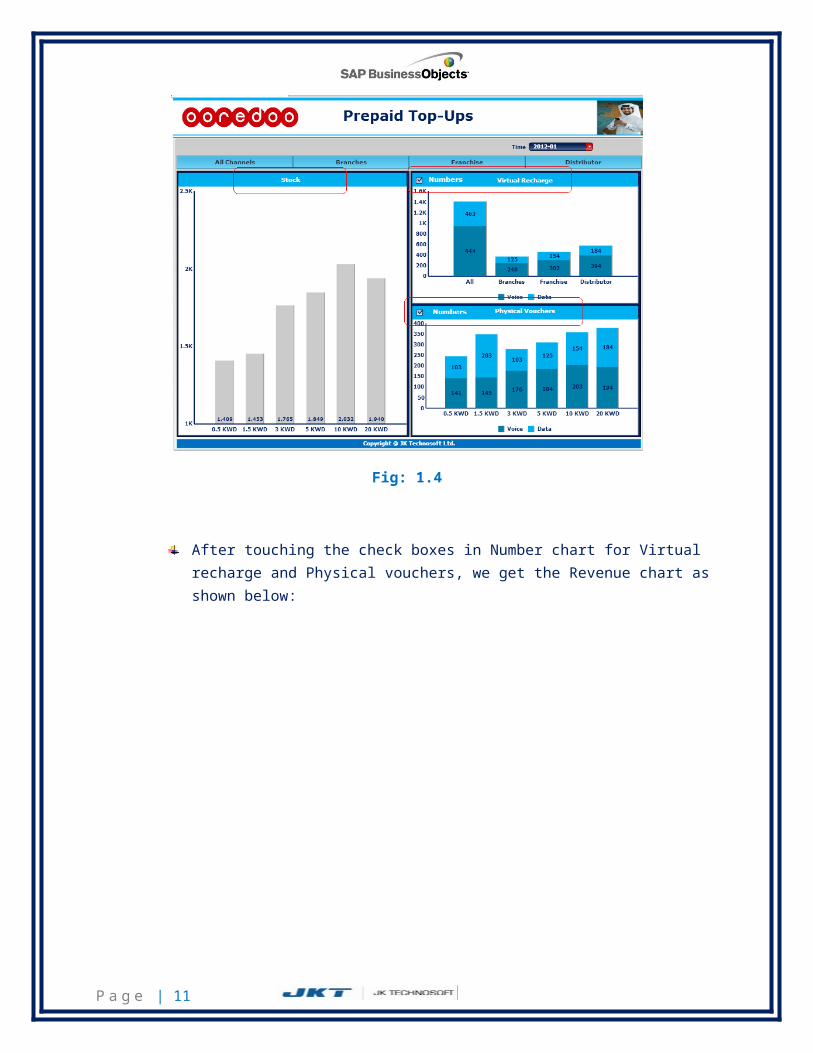
Fig 1.76.3. Virtual recharge revenues (highlighted below as figure) shows the revenues generated
from selling of virtual recharges for all channels together within specific time period. User will have to click the check box present along with Number of Virtual recharge chart.
Fig: 1.8
6.4. Physical recharge vouchers sale: This chart shows the number of virtual recharge done on Q-Tel customers for different recharge values.
P a g e | 11
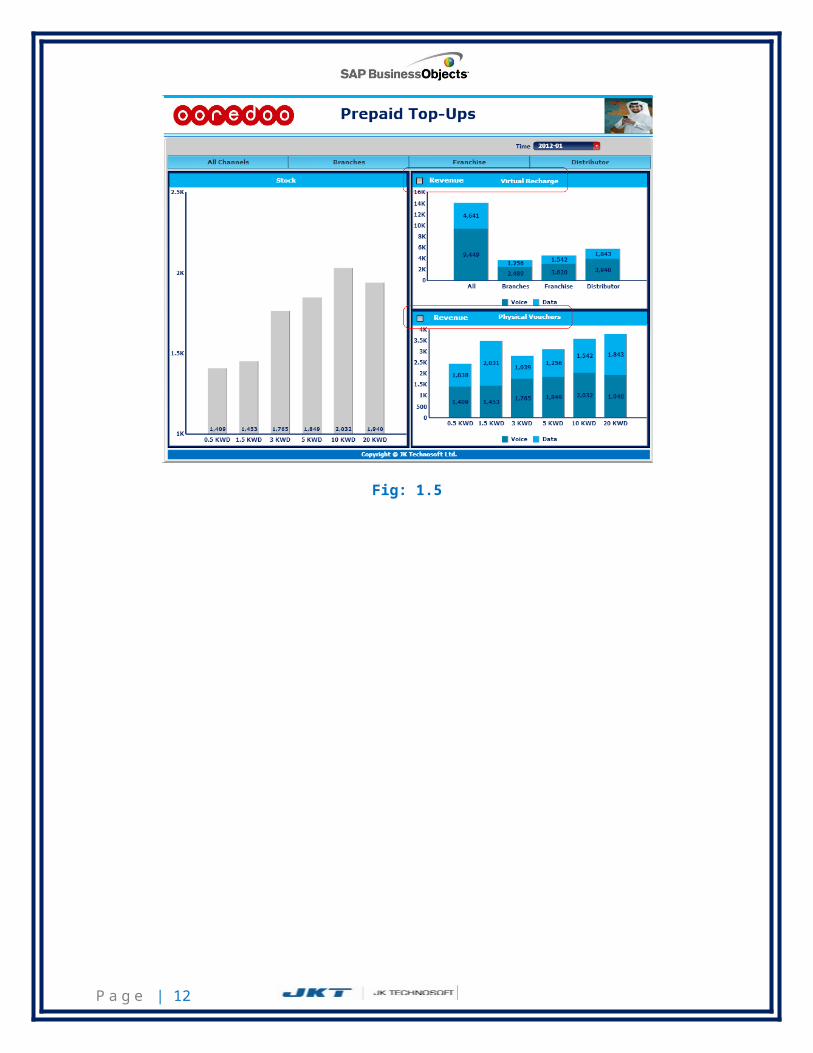
Fig 1.9
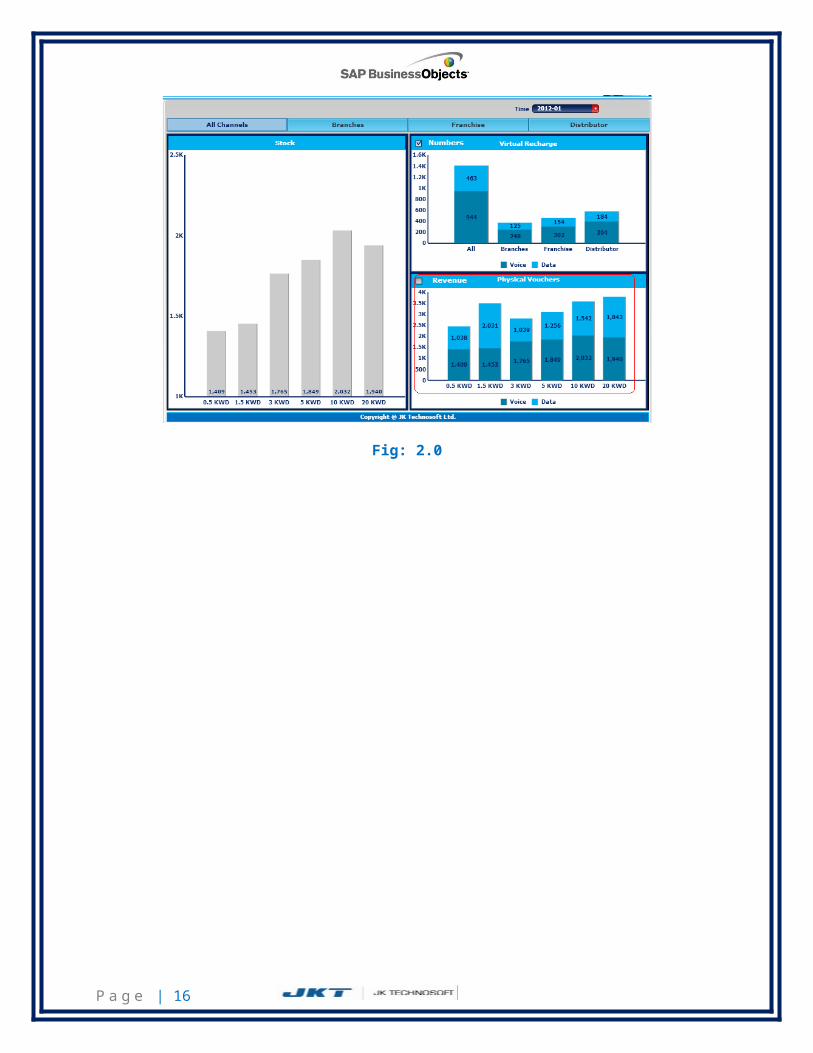
6.5. Physical voucher revenues: shows the revenues generated from selling of virtual recharges for all channels together within specific time period. User will have to click the check box present along with Number of Physical voucher’s chart.
Fig: 2.0
P a g e | 12
7. Section: Branches
PurposeUser can able to see the stocks available for the recharges with Q-Tel Branches, number of virtual recharges done and number of physical recharge vouchers sold, both along with the revenue generated by their branches for various recharge values like 0.5 KWD and 10 KWD for specific time period
You can observe the Stock availability of recharges, numbers of recharges sold and done, revenues earned from prepaid recharges from various charts in dashboard.
The Highlights: Stock availability of recharges Number of virtual recharges done along with revenues earned Number of physical recharge voucher sold along with revenues
earned Observe under the individual headings with a brief description.
P a g e | 13

Fig: 2.1
After touching the check boxes in Number chart for Virtual recharge and Physical vouchers, we get the Revenue chart as shown below:
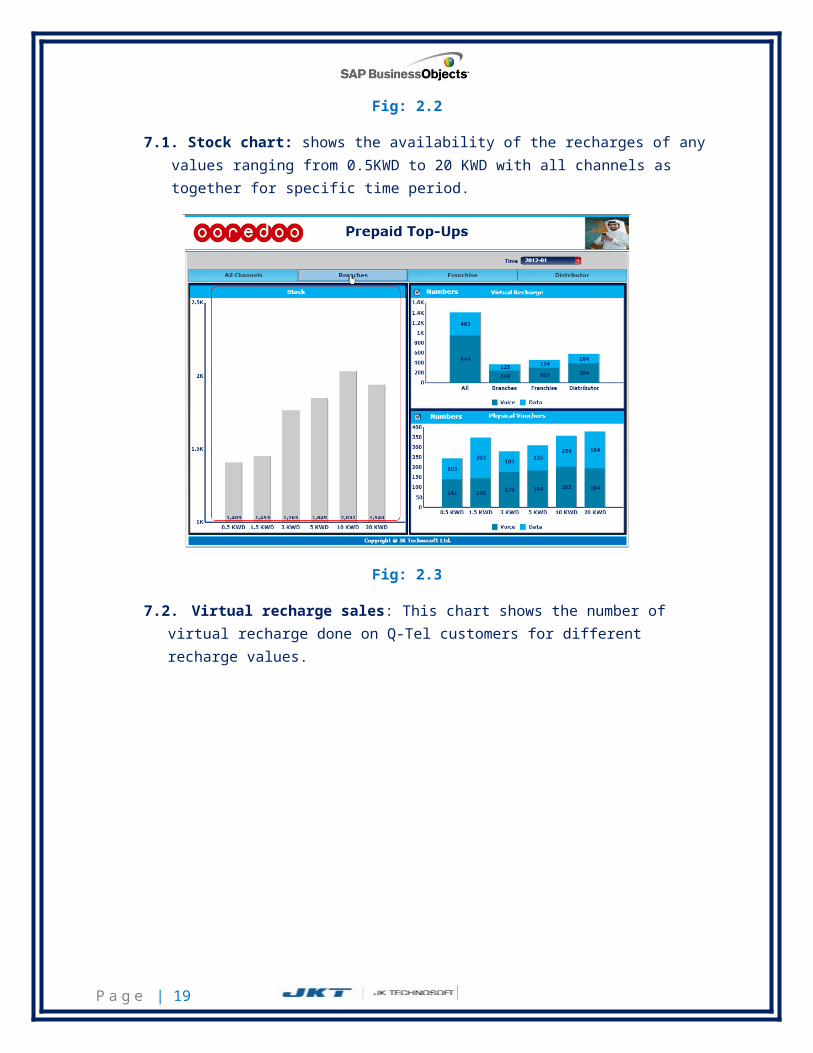
Fig: 2.2
P a g e | 14

7.1. Stock chart: shows the availability of the recharges of any values ranging from 0.5KWD to 20 KWD with all channels as together for specific time period.
Fig: 2.3
7.2.Virtual recharge sales: This chart shows the number of virtual recharge done on Q-Tel customers for different recharge values.
Fig 2.4
P a g e | 15
7.3 Virtual recharge revenues (highlighted below as figure) shows the revenues generated from selling of virtual recharges by their entire branches within specific time period. User will have to click the check box present along with Number of Virtual recharge chart.
Fig: 2.5
7.4 Physical recharge vouchers sale: This chart shows the number of virtual recharge done on Q-Tel customers for different recharge values.
P a g e | 16

Fig 2.6
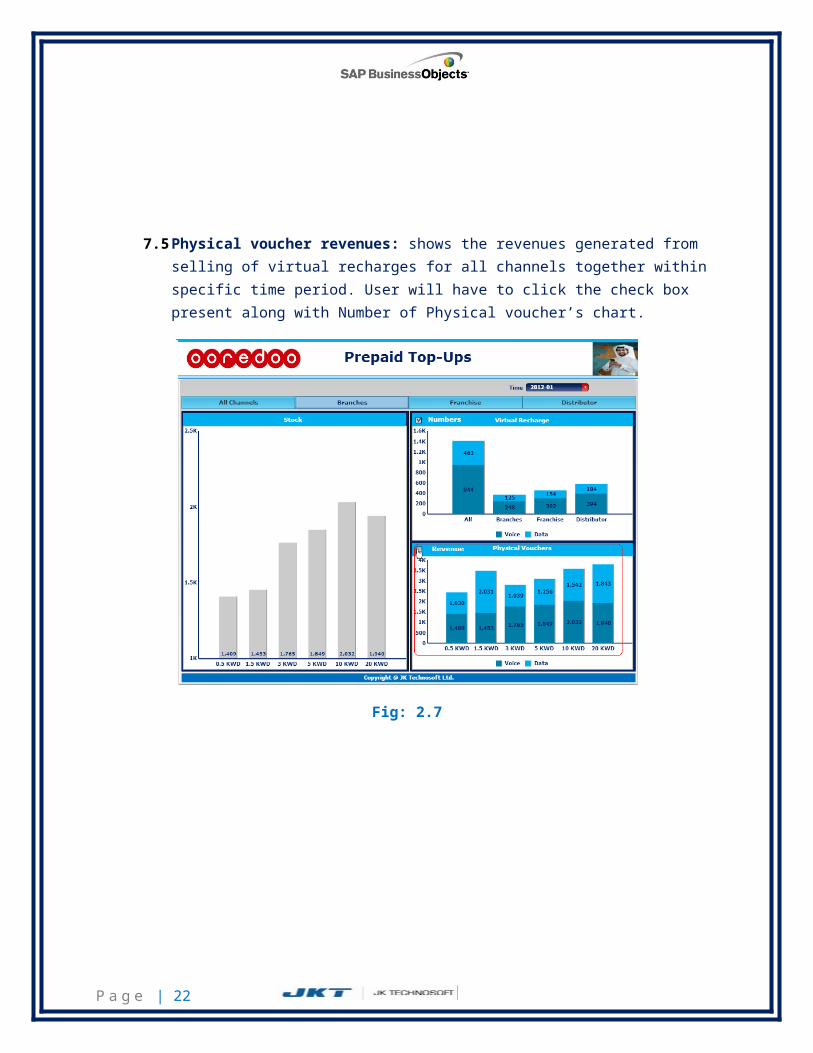
7.5 Physical voucher revenues: shows the revenues generated from selling of virtual recharges for all channels together within specific time period. User will have to click the check box present along with Number of Physical voucher’s chart.
P a g e | 17
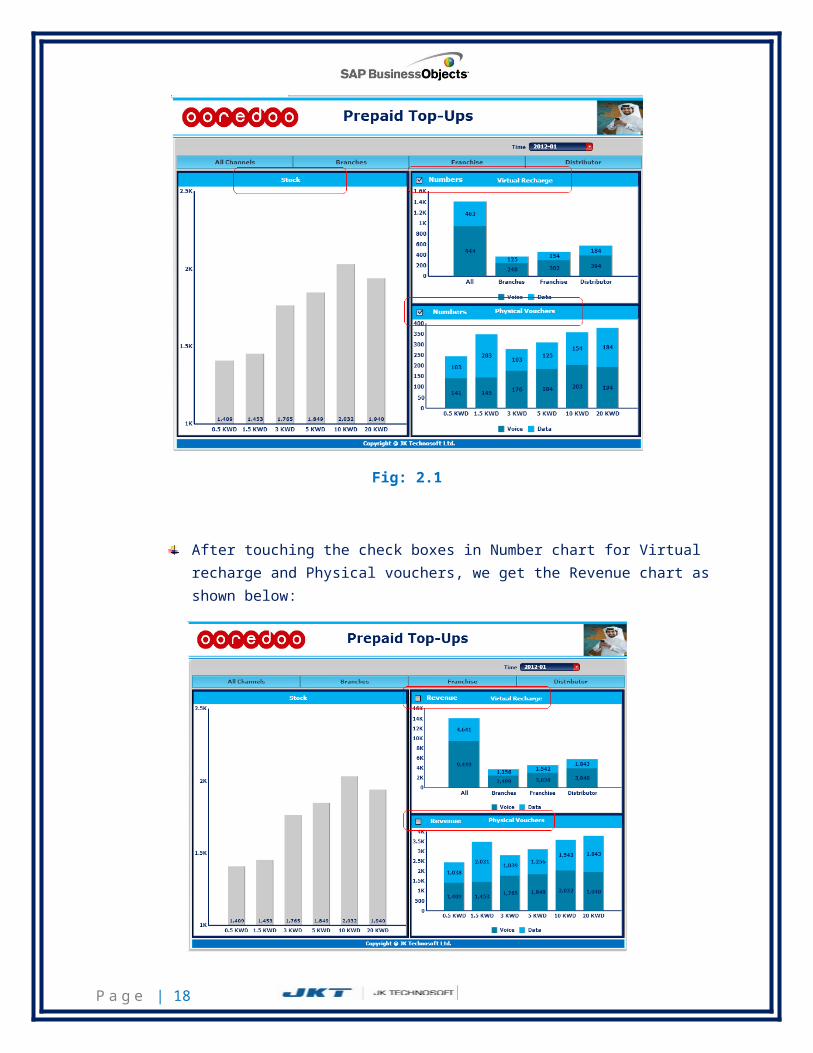
Fig: 2.7
P a g e | 18
8. Section: Franchise
PurposeUser can able to see the stocks available for the recharges with Q-Tel Franchise, number of virtual recharges done and number of physical recharge vouchers sold, both along with the revenue generated by them for various recharge values like 0.5 KWD and 10 KWD for specific time period
You can observe the Stock availability of recharges, numbers of recharges sold and done, revenues earned from prepaid recharges from various charts in dashboard.
The Highlights: Stock availability of recharges Number of virtual recharges done along with revenues earned Number of physical recharge voucher sold along with revenues
earned Observe under the individual headings with a brief description.
Fig: 2.8
P a g e | 19

After touching the check boxes in Number chart for Virtual recharge and Physical vouchers, we get the Revenue chart as shown below:
Fig: 2.9
8.1 Stock chart: shows the availability of the recharges of any values ranging from 0.5KWD to 20 KWD with all channels as together for specific time period.
Fig: 3.0
P a g e | 20

8.2 Virtual recharge sales: This chart shows the number of virtual recharge done on Q-Tel customers for different recharge values.
Fig 3.1
8.3 Virtual recharge revenues (highlighted below as figure) shows the revenues generated from selling of virtual recharges by their entire franchise within specific time period. User will have to click the check box present along with Number of Virtual recharge chart.
Fig: 3.2
P a g e | 21
8.4 Physical recharge vouchers sale: This chart shows the number of virtual recharge done on Q-Tel customers for different recharge values.
Fig 3.3
8.5 Physical voucher revenues: shows the revenues generated from selling of virtual recharges for entire franchise within specific time period. User will have to click the check box present along with Number of Physical voucher’s chart.
Fig: 3.4
P a g e | 22

9. Section: Distributors
PurposeUser can able to see the stocks available for the recharges with Q-Tel Distributors, number of virtual recharges done and number of physical recharge vouchers sold, both along with the revenue generated by them for various recharge values like 0.5 KWD and 10 KWD for specific time period
You can observe the Stock availability of recharges, numbers of recharges sold and done, revenues earned from prepaid recharges from various charts in dashboard.
The Highlights: Stock availability of recharges Number of virtual recharges done along with revenues earned Number of physical recharge voucher sold along with revenues
earned Observe under the individual headings with a brief description.
Fig: 3.5
P a g e | 23

After touching the check boxes in Number chart for Virtual recharge and Physical vouchers, we get the Revenue chart as shown below:
Fig: 3.6
P a g e | 24

9.1 Stock chart: shows the availability of the recharges of any values ranging from 0.5KWD to 20 KWD with distributor network for specific time period.
Fig: 3.7
9.2 Virtual recharge sales: This chart shows the number of virtual recharge done on Q-Tel customers for different recharge values.
P a g e | 25
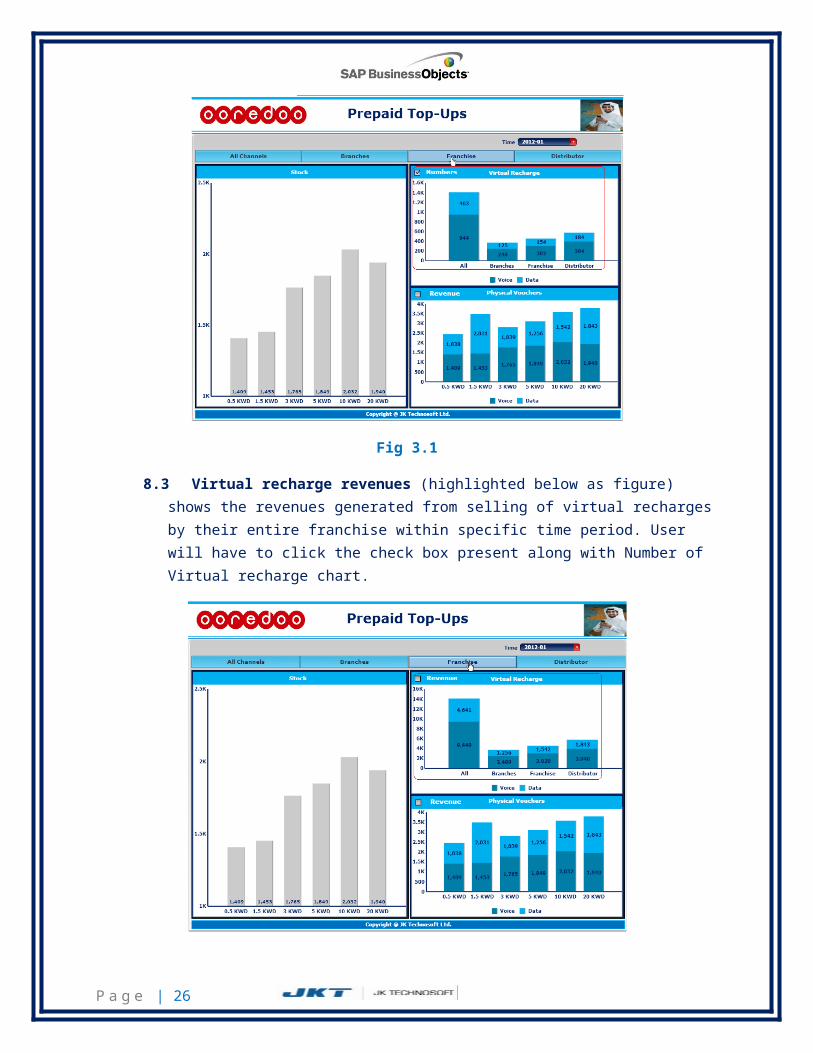
Fig 3.8
9.3 Virtual recharge revenues : shows the revenues generated from selling of virtual recharges by their entire distributors network within specific time period. User will have to click the check box present along with Number of Virtual recharge chart.
Fig: 3.9
9.4 Physical recharge vouchers sale: This chart shows the number of virtual recharge done on Q-Tel customers for different recharge values.
P a g e | 26
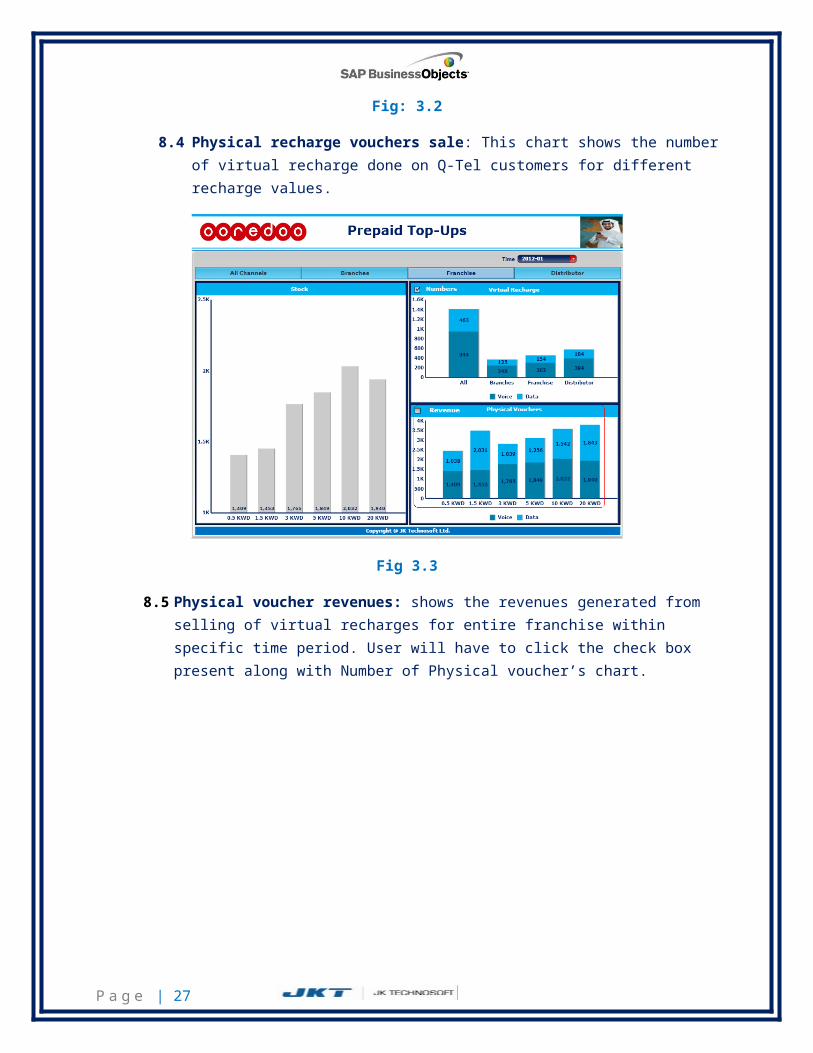
Fig 4.0
9.5 Physical voucher revenues: shows the revenues generated from selling of virtual recharges for entire franchise within specific time period. User will have to click the check box present along with Number of Physical voucher’s chart.
Fig: 4.1
10. Constraints
On pressing save, Dashboard will take a maximum of 5 to 7 seconds to save to Database. Dashboard will take a maximum of 15 to 18 seconds to load from Database.
P a g e | 27