preparation and characterization of a (viologen
TRANSCRIPT

San Jose State University San Jose State University
SJSU ScholarWorks SJSU ScholarWorks
Master's Theses Master's Theses and Graduate Research
Fall 2017
Preparation and Characterization of a (Viologen) Containing Main Preparation and Characterization of a (Viologen) Containing Main
Chain PEG-Carbon Nanotubes Phase for Hybrid Supercapacitor Chain PEG-Carbon Nanotubes Phase for Hybrid Supercapacitor
Application Application
Kanishka Rana San Jose State University
Follow this and additional works at: https://scholarworks.sjsu.edu/etd_theses
Recommended Citation Recommended Citation Rana, Kanishka, "Preparation and Characterization of a (Viologen) Containing Main Chain PEG-Carbon Nanotubes Phase for Hybrid Supercapacitor Application" (2017). Master's Theses. 4883. DOI: https://doi.org/10.31979/etd.xvq6-3d59 https://scholarworks.sjsu.edu/etd_theses/4883
This Thesis is brought to you for free and open access by the Master's Theses and Graduate Research at SJSU ScholarWorks. It has been accepted for inclusion in Master's Theses by an authorized administrator of SJSU ScholarWorks. For more information, please contact [email protected].

PREPARATION AND CHARACTERIZATION OF A (VIOLOGEN) CONTAINING MAIN CHAIN PEG-CARBON NANOTUBES PHASE FOR HYBRID
SUPERCAPACITOR APPLICATION
A Thesis
Presented to
The Faculty of the Department of Chemistry
San José State University
In Partial Fulfillment
of the Requirements for the Degree
Master of Science
by
Kanishka Rana
December 2017

© 2017
Kanishka Rana
ALL RIGHTS RESERVED

The Designated Thesis Committee Approves the Thesis Titled
PREPARATION AND CHARACTERIZATION OF A (VIOLOGEN) CONTAINING MAIN CHAIN PEG-CARBON NANOTUBES PHASE FOR HYBRID
SUPERCAPACITOR APPLICATION
by
Kanishka Rana
APPROVED FOR THE DEPARTMENT OF CHEMISTRY
SAN JOSÉ STATE UNIVERSITY
December 2017
Roger Terrill, Ph.D. Department of Chemistry
Joseph Pesek, Ph.D. Department of Chemistry
Chester Simocko, Ph.D. Department of Chemistry

ABSTRACT
PREPARATION AND CHARACTERIZATION OF A (VIOLOGEN) CONTAINING MAIN CHAIN PEG-CARBON NANOTUBES PHASE FOR HYBRID
SUPERCAPACITOR APPLICATION
by Kanishka Rana
Supercapacitors (SCs) and batteries are recognized as the two most
important electrical energy storage devices. SCs have some distinct advantages
such as high-power density and long cycle life when compared to batteries.
However, they have yet to match the energy densities of batteries. In an effort to
improve the energy density of SCs, a hybrid supercapacitor was developed using
a pair of single-walled carbon nanotube electrodes and two polyethylene glycol
(PEG400) gel-polymer electrolytes (GPEs) containing redox additives of viologen
(V) and ferrocene dicarboxylic acid (Fc), respectively. The introduction of V and
Fc, was expected to improve the energy performance of the SC due to reversible
Faradaic reactions between them in the corresponding GPEs. The V-PEG
polymer electrolyte was used in the oxidation half-cell and the Fc-PEG polymer
electrolyte was used in the reduction-half cell of the SC, which were separated by
polycarbonate membranes in a sandwich configuration. The electrochemical
performances of the SC were evaluated by cyclic voltammetry and
chronoamperometry. The results confirmed V-PEG polymer and Fc-PEG polymer
as suitable electrolyte materials for their application in a hybrid supercapacitor.

v
ACKNOWLEDGMENTS
I would like to thank my research advisor Dr. Roger Terrill for his continued
support and guidance in carrying out this research project. I appreciate all his
contributions of time, and ideas to make my graduate school experience
productive and stimulating. I would also like to thank my committee members, Dr.
Simocko, and Dr. Pesek for their valuable time in evaluating my research work
and provide insightful comments.
I would like to acknowledge Shalaka Rahangdale, my fellow lab mate for
helping me throughout this project. I would also like to thank my parents for all
their love and encouragement. Most importantly, I must thank my loving and
supportive husband, Manish Rana, for his patience and unyielding support
throughout the process of researching and writing this thesis. This
accomplishment would not have been possible without him.

vi
TABLE OF CONTENTS
LIST OF TABLES ................................................................................................. ix
LIST OF FIGURES ................................................................................................ x
LIST OF SCHEMES ............................................................................................ xiii
: INTRODUCTION ................................................................................ 1 1.1 Global Energy Issues ................................................................................. 1 1.2 Energy Storage .......................................................................................... 2 1.3 Electrical Energy Storage Systems ............................................................ 3
1.3.1 Capacitors ......................................................................................... 3 1.3.2 Batteries ............................................................................................ 6 1.3.3 Supercapacitors ................................................................................. 9
1.4 Performance Comparison of Energy Storage Systems ........................... 12 1.5 Research Motivation and Objective ......................................................... 15
: MATERIALS FOR THE OXIDATION HALF-CELL OF THE HYBRID SUPERCPACITOR ............................................................................... 17
2.1 Introduction .............................................................................................. 17 2.2 Electrode Materials .................................................................................. 18 2.3 Electrolyte Materials ................................................................................. 19
2.3.1 Electrolyte Salt and Solvent ............................................................. 19 2.3.2 Redox Additive ................................................................................ 21
2.4 Separator ................................................................................................. 23
: FUNCTIONALIZATION OF SINGLE-WALLED CARBON NANOTUBES ...................................................................................................... 24
3.1 Introduction .............................................................................................. 24 3.2 Experimental Section ............................................................................... 26
3.2.1 Materials .......................................................................................... 26 3.2.2 Experimental Procedures ................................................................ 26
3.2.2.1 Ozonolysis ............................................................................... 26 3.2.2.2 Maleic Anhydride Treatment ................................................... 27 3.2.2.3 Concentrated H2SO4/HNO3 Mixture (3:1) Treatment .............. 27 3.2.2.4 Nitric Acid Oxidation ................................................................ 28
3.3 Characterization Techniques ................................................................... 28 3.3.1 Raman Spectroscopy ...................................................................... 28 3.3.2 Attenuated Total Reflection Fourier-Transform Infrared (ATR-FTIR) Spectroscopy ........................................................................ 32
3.4 Results and Discussion ............................................................................ 34 3.4.1 Ozonolysis ....................................................................................... 34 3.4.2 Maleic Anhydride Treatment ............................................................ 35

vii
3.4.3 Concentrated H2SO4/HNO3 Mixture (3:1) Treatment ....................... 35 3.4.4 Nitric Acid Oxidation ........................................................................ 36
3.5 Conclusions ............................................................................................. 39
: SYNTHESIS OF VIOLOGEN-POLYETHYLENE GLYCOL (V-PEG) POLYMER ............................................................................................ 40
4.1 Introduction .............................................................................................. 40 4.2 Experimental Section ............................................................................... 42
4.2.1 Materials .......................................................................................... 42 4.2.2 Experimental Procedures ................................................................ 42
4.2.2.1 Tosylation of PEG-400 ............................................................ 42 4.2.2.1.1 Tosylation of PEG using Triethylamine ........................... 43 4.2.2.1.2 Tosylation of PEG using Pyridine ................................... 43
4.2.2.2 Synthesis of Viologen-Polyethylene Glycol Polymer ............... 44 4.3 Characterization Techniques ................................................................... 44
4.3.1 Nuclear Magnetic Resonance Spectroscopy (NMR) ....................... 45 4.3.2 Electrochemical Analysis ................................................................. 46
4.3.2.1 Liquid Phase Characterization ................................................ 50 4.3.2.2 Semi-Solid Phase Characterization ........................................ 52
4.4 Results and Discussion ............................................................................ 53 4.4.1 Nuclear Magnetic Resonance Spectroscopy (NMR) Results .......... 53
4.4.1.1 Ditosylated PEG ...................................................................... 53 4.4.1.2 Viologen Polymer: ................................................................... 55
4.4.2 Cyclic Voltammetry Results ............................................................. 57 4.4.2.1 Liquid Phase Characterization ................................................ 57
4.4.2.1.1 Analysis of 4,4’-bipyridine using Micro- and Ultramicroelectrode ........................................................................ 57 4.4.2.1.2 Analysis of Viologen Polymer using Micro- and Ultramicroelectrode ........................................................................ 59
4.4.2.2 Semi-Solid Phase Characterization ........................................ 60 4.4.3 FTIR Spectroscopy Results ............................................................. 62
4.5 Conclusions ............................................................................................. 63
: FUNCTIONALIZATION OF OXIDIZED SINGLE-WALLED CARBON NANOTUBES WITH V-PEG POLYMER ............................................. 65
5.1 Introduction .............................................................................................. 65 5.2 Experimental Section ............................................................................... 67
5.2.1 Materials .......................................................................................... 67 5.2.2 Experimental Procedures ................................................................ 67
5.2.2.1 Grafting SWCNTs with V-PEG Polymer .................................. 67 5.3 Characterization Techniques ................................................................... 68 5.4 Results and Discussion ............................................................................ 69
5.4.1 Cyclic Voltammetry Results ............................................................. 69 5.4.2 FTIR Spectroscopy Results ............................................................. 70

viii
5.5 Conclusions ............................................................................................. 72
: CELL FABRICATION AND CHARACTERIZATION ......................... 73 6.1 Introduction .............................................................................................. 73 6.2 Cell Fabrication Procedure ...................................................................... 75
6.2.1 Cell Fabrication Materials ................................................................ 75 6.2.2 Cell Assembly .................................................................................. 75
6.3 Cell Characterization ................................................................................ 77 6.3.1 Chronoamperometry ........................................................................ 78
6.4 Results and Discussion ............................................................................ 80 6.4.1 CV Analysis ..................................................................................... 80 6.4.2 Chronoamperometry Analysis ......................................................... 81
6.4 Conclusions and Future Work .................................................................. 84
REFERENCES .................................................................................................... 86

ix
LIST OF TABLES
Table 1.1 Performance Comparison Table. ........................................................ 14
Table 6.1 Chronoamperometry Graphs of the Prototype Cell. ............................ 82
Table 6.2 Charging-Discharging Currents of the Prototype Cell. ........................ 84

x
LIST OF FIGURES
Figure 1.1 An electrostatic capacitor. .................................................................... 4
Figure 1.2 Representation of the commonly used lithium-ion battery based on LiCoO2 cathodes and graphite anodes. . ............................................... 8
Figure 1.3 An electric double layer supercapacitor showing charge accumulation at the electrode/electrolyte interface. ............................................ 11
Figure 1.4 Ragone plot of energy density vs power density for various energy storage systems. . ................................................................................... 13
Figure 2.1 Proposed hybrid supercapacitor in a sandwich-type configuration. ....................................................................................................... 17
Figure 2.2 Structure of single-walled carbon nanotubes. .................................... 18
Figure 2.3 Possible structures of V-PEG polymer. .............................................. 22
Figure 3.1 A schematic view of the energy transitions involved in (a) Rayleigh scattering, (b) Raman scattering (stokes scattering) and (c) Raman scattering (anti-stokes). .......................................................................... 30
Figure 3.2 Schematic representation of infrared beam path length through the ATR crystal. ................................................................................................... 33
Figure 3.3 Solubility test of CNTs, (1) p-SWCNTs in water and (2) acid treated SWCNTs in water. ................................................................................... 36
Figure 3.4 Raman spectra of (a) p-SWCNTs and (b) acid treated SWCNTs. . ... 37
Figure 3.5 FTIR spectra of (a) p-SWCNTs and (b) acid treated SWCNTs. ......... 38
Figure 4.1 A cyclic voltammogram. ..................................................................... 48
Figure 4.2 Three-electrode electrochemical cell setup for analysis of 4,4’-bipyridine. ..................................................................................................... 51
Figure 4.3 Three-electrode electrochemical cell setup for analysis of viologen polymer. ................................................................................................ 52
Figure 4.4 Semi-solid phase characterization setup for viologen polymer. ......... 53

xi
Figure 4.5 1H NMR spectrum of ditosylated PEG in DMSO and structural identification. ....................................................................................................... 54
Figure 4.6 13C NMR spectrum of ditosylated PEG in DMSO and structural identification. ....................................................................................................... 55
Figure 4.7 1H NMR spectrum of viologen polymer in DMSO and structural identification. ....................................................................................................... 56
Figure 4.8 13C NMR spectrum of viologen polymer in DMSO and structural identification. ....................................................................................................... 57
Figure 4.9 Cyclic voltammogram of 4,4’-bipyridine using Pt microelectrode. ...... 58
Figure 4.10 Cyclic voltammogram of 4,4’-bipyridine using Pt ultramicroelectrode. ............................................................................................. 58
Figure 4.11 Cyclic voltammogram of viologen polymer using Pt microelectrode. .................................................................................................... 59
Figure 4.12 Cyclic voltammogram of viologen polymer using Pt ultramicroelectrode. ............................................................................................. 60
Figure 4.13 Cyclic voltammogram of viologen polymer using Ag plate as AE and RE, and Pt as the working electrode. ..................................................... 61
Figure 4.14 FTIR spectra of (a) PEG-400, (b) viologen polymer and (c) 4,4’-bipyridine. ................................................................................................ 63
Figure 5.1 CV setup for analysis of the SWCNTs/V-PEG polymer composite. ........................................................................................................... 69
Figure 5.2 Cyclic voltammogram of SWCNTs/V-PEG polymer composite using Pt ultramicroelectrode. ............................................................................... 70
Figure 5.3 FTIR spectra of (a) o-SWCNTs, (b) SWCNTs/V-PEG polymer composite and (c) V-PEG polymer. ..................................................................... 72
Figure 6.1 The schematic representation of the supercapacitor cell with SWCNTs/Fc-PEG polymer and SWCNTs/V-PEG polymer composites. ............. 73
Figure 6.2 Aluminium current collector with a platinum cavity. ............................ 76

xii
Figure 6.3 Schematic of prototype cell fabrication procedure. ............................ 77
Figure 6.4 Electrochemical setup for analysis of the prototype cell. ................... 78
Figure 6.5 (a)Potential waveform and (b) the signal for double pulse chronoamperometry. ........................................................................................... 79
Figure 6.6 Cyclic voltammograms of the prototype cell at scan rate (a) 0.1 V s-1, (b) 0.01 V s-1 and (c) 0.05 V s-1. ..................................................... 81

xiii
LIST OF SCHEMES
Scheme 2.1 Schematic illustration of lithium-ion conduction in PEG. ................. 21
Scheme 2.2 Redox behavior of viologen species ............................................... 23
Scheme 3.1 Diels-Alder reaction mechanism. .................................................... 25
Scheme 3.2 Acid treatment of SWCNTs. ............................................................ 26
Scheme 4.1 Tosylation of (a) PEG-400 using (b) p-toluenesulfonyl chloride. ..... 41
Scheme 4.2 Synthesis of viologen-polyethylene glycol polymer using (a) ditosylated PEG and (b) 4,4-bipyridine. ......................................................... 42
Scheme 5.1 Acyl chlorination of oxidized-SWCNTs. ........................................... 66
Scheme 5.2 Mechanism of acyl chloride formation using oxalyl chloride. .......... 66
Scheme 5.3 Grafting of viologen polymer to acyl-chlorinated SWCNTs. ............ 67

1
: INTRODUCTION
1.1 Global Energy Issues
At present, the consumption of fossil fuels has dramatically increased due to
the rapid development of the global economy and the increasing world
population. It has not only depleted the existing fossil fuel reserves, but also
adversely impacted the environment, resulting in increased health risks and
global climate change. To address these concerns, clean, sustainable and
efficient renewable energy sources as well as new technologies associated with
energy conversion and storage have become the primary focus in the industrial
and scientific communities.1
Renewable energy is energy that is generated from natural processes, which
are naturally replenished faster than consumed. This includes hydropower, tidal,
solar, geothermal, biomass, and wind energies. The fluid flows associated with
wind, hydroelectric, and tidal energies are utilized to drive a generator. The
energy from the sun is used to super-heat water to convert it into steam, that
drives an electricity-generating turbine.2 Geothermal energy helps to create
electricity by using heat sources from within the earth. Biomass is converted into
biofuels which are used in the same way as fossil fuels. However, each form of
renewable energy conversion suffers from its own set of complications and some
are easier to exploit than others. Renewable energy sources like solar and wind
are not constant as they depend on the weather or climate to work effectively. In

2
order to effectively implement these intermittent energy sources, it is pivotal to
develop efficient electrical energy storage systems.2,3
1.2 Energy Storage
The process of converting electrical energy from a power grid into a storable
form is referred as electrical energy storage (EES).4 EES, is one of the key
technologies that enables electricity to be produced from intermittent energy
sources. In addition, it also plays a pivotal role in reducing the electricity costs by
storing electricity generated at off-peak times when the generation cost is low
and helps to maintain the power quality and reliability.2
In recent decades, a wide variety of EES systems have been developed for
the effective implementation of renewable energy sources. These systems can
be classified in a variety of ways, such as response time and useful storage
durations. In general, these methods differ in the form of energy stored in the
system.4 They can be grouped into mechanical, thermal, electrical,
electrochemical, chemical, and thermochemical energy storage systems. They all
differ in characteristics like efficiency, energy density or power density. The most
common mechanical storage systems are kinetic energy storage systems like
flywheels and potential energy storage systems like compressed air energy
storage (CAES) and pumped hydro storage (PHS).5 Thermal energy storage
systems include low temperature energy storage (cryogenic energy storage,
aquiferous cold energy storage) and high temperature energy storage (steam or
hot water accumulators, hot rocks, latent heat systems such as phase change

3
materials).5 Electrical energy storage systems include electrostatic capacitors,
supercapacitors, and superconducting magnetic energy storage systems.4
Electrochemical energy storage systems include lead-acid or lithium-ion
batteries. Chemical energy storage systems include fuel cells, and
thermochemical energy storage systems include solar fuel cells.4
Among these technologies, electrochemical energy storage systems are
recognized as the most effective and practical technologies for reversibly storing
electrical energy.3 Currently, the major commercialized energy storage systems
available in the market are capacitors, batteries, and supercapacitors. They are
the focus of current research because of their key role regarding mobile energy.
The structure, mechanism and performance comparison of these devices are
discussed in the following sections of this chapter.
1.3 Electrical Energy Storage Systems
1.3.1 Capacitors
Conventional capacitors, also known as electrostatic capacitors, are passive
electrical devices that are capable of directly storing electrical energy, without
converting it into another form of energy.6 This technology was started by the
invention of the Leyden jar by Pieter van Musschenbroek in 1746 at the
University of Leyden in Holland. It was the first device capable of storing
electrical charge in the form of electrostatic field.7
A typical electrostatic capacitor is composed of two parallel conducting plates
called electrodes separated by an insulating dielectric material, as shown in
4
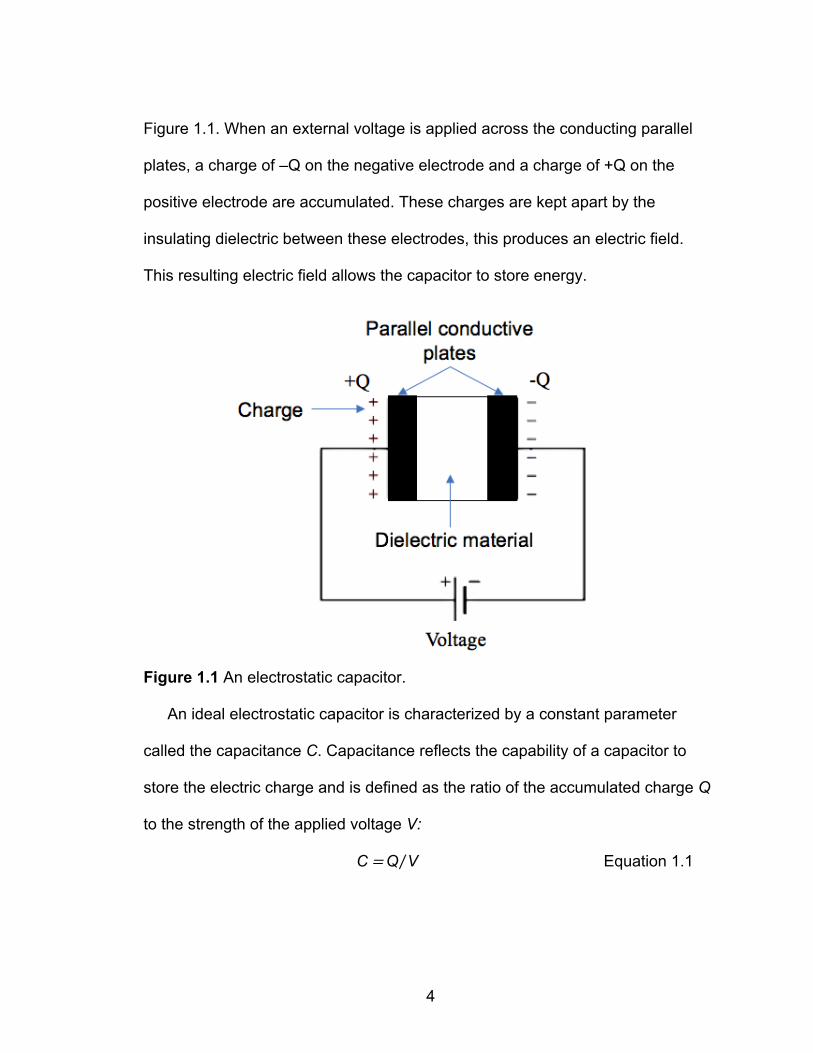
Figure 1.1. When an external voltage is applied across the conducting parallel
plates, a charge of –Q on the negative electrode and a charge of +Q on the
positive electrode are accumulated. These charges are kept apart by the
insulating dielectric between these electrodes, this produces an electric field.
This resulting electric field allows the capacitor to store energy.
Figure 1.1 An electrostatic capacitor.
An ideal electrostatic capacitor is characterized by a constant parameter
called the capacitance C. Capacitance reflects the capability of a capacitor to
store the electric charge and is defined as the ratio of the accumulated charge Q
to the strength of the applied voltage V:
C=Q V Equation 1.1

5
The capacitance of a conventional parallel-plate capacitor with a dielectric
medium between the electrodes can be calculated using the following equation:
C =εοεrAd Equation 1.2
Where A is the surface area of each electrode, d is the distance between
them, εοis the dielectric constant (or “permittivity”) of free space, and εr is the
dielectric constant of the insulating material between the electrodes.
As per above equation, the capacitance of a capacitor can be increased by
shortening the distance between electrodes, increasing the surface area of
electrodes, and lastly by using an insulating dielectric material with high
permittivity.8 For low voltage, single polarity applications, ideal candidates for the
electrode material are carbon based materials with porous structure and high
conductivity, like carbon nanotubes, activated carbon or graphene.6
The two main attributes of a capacitor or any energy storage device is its
energy density (specific energy) and power density (specific power). These
values are calculated as energy or power per unit mass or per unit volume.
Energy density is expressed in Watt-hours per kilogram (Wh kg-1) and the power
density in Watt per kilogram (W kg-1).6,8 The energy E stored in a capacitor is
given by the equation:
E= 12
CV2 Equation 1.3
The maximum power is determined by the following equation:
Pmax=V2
4 × ESR Equation 1.4

6
Here ESR is the equivalent series resistance. This resistance arises due to
internal components of the capacitor (e.g., electrodes, current collectors and
dielectric material).8 Generally, electrostatic capacitors have high power density,
they can be charged and discharged quickly. But they have a very low energy
density and are unable to store a large amount of charge. These characteristics
make electrostatic capacitors suitable for those applications in which power
bursts are required.
1.3.2 Batteries
Batteries are the most widely used electrochemical energy storage devices in
industry and daily life. They are capable of storing and releasing charge via
electron flow through oxidation-reduction reactions. This technology was started
by the invention of the voltaic pile by Alessandro Volta in 1800. It was the first
electrical battery that could continuously supply electric current to a circuit and
consisted of pairs of zinc and copper discs piled on top of each other.9
A typical battery is composed of one or more electrochemical cells connected
in series or parallel, which generate electric current with a desired voltage from
an electrochemical reaction. Each electrochemical cell contains two electrodes
electronically isolated from each other and an electrolyte that facilitates ionic
transport between them. One electrode is responsible for the reduction reactions
and other for oxidation reactions. During operation (charging or discharging), one
electrode is oxidized and releases electrons to move through an external circuit.
This electrode is commonly called the anode, or the negative electrode. The

7
other electrode attracts the electrons from the external circuit and gets reduced.
This electrode is commonly called the cathode or the positive electrode and the
electrons moving from the anode to the cathode through the external circuit
produce electric current.10
On the basis of charging capabilities of batteries, they are grouped into two
categories: primary (or disposable) batteries, and secondary (or rechargeable)
batteries. The primary batteries permit only a single charge-discharge cycle as
the reactions occurring in them are not reversible in nature (e.g., zinc-carbon
batteries).9 On the other hand, the rechargeable batteries can be charged and
discharged multiple times due to the reversible nature of the electrochemical
reactions occurring in them (e.g., lithium-ion batteries). In a rechargeable battery,
the electrodes reverse roles during charging and discharging.9
Lithium-ion batteries are currently the leading energy storage systems due to
their fast response time, high energy density, light weight, small dimensions, and
no memory effect. Since there commercialization by Sony in 1990, they have
become the most common power source for various applications in industrial and
consumer electronics.10 In these batteries, the cathode is generally made of
lithium intercalated metal oxides like cobalt oxide, as they are capable of
releasing and inserting lithium ions in their lattice. The anode is generally made
of graphite or other carbon materials that have large interlayer distances to allow
easy insertion of lithium ions and minimal strain.11
8
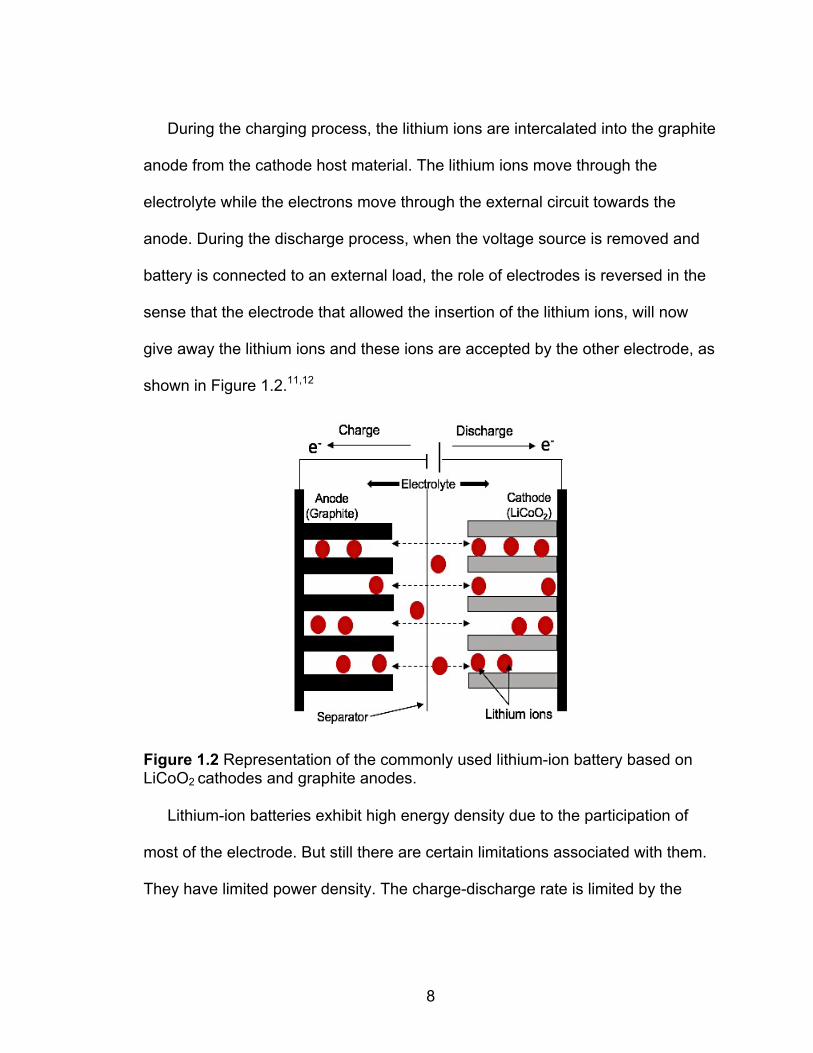
During the charging process, the lithium ions are intercalated into the graphite
anode from the cathode host material. The lithium ions move through the
electrolyte while the electrons move through the external circuit towards the
anode. During the discharge process, when the voltage source is removed and
battery is connected to an external load, the role of electrodes is reversed in the
sense that the electrode that allowed the insertion of the lithium ions, will now
give away the lithium ions and these ions are accepted by the other electrode, as
shown in Figure 1.2.11,12
Figure 1.2 Representation of the commonly used lithium-ion battery based on LiCoO2 cathodes and graphite anodes.
Lithium-ion batteries exhibit high energy density due to the participation of
most of the electrode. But still there are certain limitations associated with them.
They have limited power density. The charge-discharge rate is limited by the

9
intercalation/deintercalation of lithium ions, which involves the expansion of the
host lattice to accommodate multiple layers of the lithium ions. In addition, due to
this process the materials inside the battery degrade overtime and they lose their
ability to retain charge.11
1.3.3 Supercapacitors
Traditional supercapacitors, also called electric double layer supercapacitors,
are charge-storing devices that are governed by the same basic principles as
electrostatic capacitors (discussed in Section 1.3.1). They incorporate electrodes
with a much higher surface area for more charge storage and much thinner
dielectric materials to decrease the separation between the electrodes. This
results in an increased capacitance and energy density. But unlike capacitors,
the charge does not consist exclusively of electrons or holes in metal electrodes,
this charge is stored at the interface between the surface of the metal electrodes
and the electrolytic solution. This technology was discovered by coincidence in
the early 1950’S, when researchers were experimenting with porous carbon
electrodes, in the design of capacitors. They discovered that porous activated
carbon with a high specific surface area can be used for energy storage, and the
first patent was granted to Becker at General Electric Corp. in 1957. In 1971,
these devices were successfully commercialized and marketed as
“supercapacitors” by the Japanese company, NEC corporation.1,13
A typical supercapacitor contains two porous conducting electrodes, an
electrolyte, and a porous ion conducting membrane separator that mechanically

10
separates the two electrodes as shown in Figure 1.3. During the process of
charging, the electrons move from the negative electrode towards the positive
electrode through an external circuit. To maintain electrical neutrality, the cations
diffuse across the separator towards the negative electrode while anions diffuse
towards the positive electrode within the electrolyte. This results in the
accumulation of charge at the electrode/electrolyte interface by electrostatic
means. Opposite charges reside on two different layers; one set resides on the
electrode and the other of opposite polarity in the electrolyte as shown in Figure
1.3. These accumulated charges hence form an electric double-layer which is
separated by a monolayer of solvent molecules, also referred to as the inner
Helmholtz plane (IHP) and can be idealized as a molecular dielectric. Hence, this
interface can be treated as a capacitor with an electric double-layer capacitance
and both the electrodes can be treated as two capacitors in series.14,15

11
Figure 1.3 An electric double layer supercapacitor showing charge accumulation at the electrode/electrolyte interface.
The total capacitance of a supercapacitor (SC) can be described by the
equation:
1/CT =1/C1 + 1/C2 Equation 1.5
Here CT is the total capacitance and C1, C2 are individual capacitance of each
electrode.
During the discharging process, when the applied voltage is replaced with a
load, ions diffuse back into the electrolyte and the role of electrodes is reversed.
In the whole process of charging and discharging, the concentration of electrolyte
remains constant as no net ion exchange takes place between the electrolyte
and the electrode, and no charge transfer occurs at the interface.1 The processes
of charging and discharging can be expressed as equations:

12
At the positive electrode, during charging:
EX+ A-⟶ EX+∥ A-+ e- Equation 1.6
At the positive electrode, during discharging:
EX+∥ A-+ e-⟶EX+ A- Equation 1.7
At the negative electrode, during charging:
Ey+ C++ e-⟶ Ey-∥ C+ Equation 1.8
At the negative electrode, during discharging:
Ey-∥ C+⟶E
y+ C++ e- Equation 1.9
Here Ex and Ey denotes the electrodes, A- and C+ the anions and the cations
and∥the electrode/electrolyte interface.
Supercapacitors exhibit high-power density, high cycle efficiencies and long
cycling times. But they still have low energy density and are not able to store a
large amount of charge. Because of these characteristics, they are considered
suitable for those applications in which power bursts are needed, but high energy
storage capacity is not required, like UPS (uninterruptible power supply) systems,
photographic flashes, regenerative braking, electric vehicle acceleration etc.16
1.4 Performance Comparison of Energy Storage Systems
The two main attributes of any EES system is its energy density and its power
density. Conventional capacitors have a very high-power density but poor energy
density, whereas the opposite applies to batteries. Supercapacitors manage to
obtain a relatively high energy density as compared to conventional capacitors,
while still maintaining the high-power output found in conventional capacitors. But

13
their energy density is still lower than that supplied by a battery. Hence,
supercapacitors serve as a gap between conventional capacitors and batteries.
The variation of energy density versus the power density of these EES systems
are illustrated using the Ragone plot shown in Figure 1.4.
Figure 1.4 Ragone plot of energy density vs power density for various energy storage systems. Adapted with permission from Winter, M.; Brodd, R. J. What are Batteries, Fuel cells, and Supercapacitors. Chem. Rev. 2004, 104, 4245-4269.17 Copyright 2004 American Chemical Society.
It is clear from the plot that capacitors have a very high-power density (>106
W kg-1) compared to batteries and supercapacitors, but relatively low energy
density. On the other hand, batteries have high energy-density (>50 Wh kg-1) but
a poor power density, meaning it can store a large amount of energy but cannot
dissipate it quickly. Supercapacitors occupy an important position in terms of
power density as well as energy density. The detailed performance differences
between these devices are revealed in Table 1.1.17,18

14
Table 1.1 Performance Comparison Table.
Parameters Capacitors Supercapacitors Batteries
Energy density (Wh kg-1) <0.1 0.1-10 10-100
Power density (W kg-1) >100,000 10-100,000 10-1000
Charge time 10-6 to 10-3 sec 1 sec to 1 min 0.3 to 3 hours
Discharge time 10-6 to 10-3 sec 1 sec to 1 min 1 to 5 hours
Cycle-life Almost infinite >500,000 About 1000
Supercapacitors have more energy density than conventional capacitors
because they store charge not only at the electrode surfaces but also in the bulk
near the surface of the electrodes. They have higher power density than batteries
because the charge-discharge process is not limited by ionic-conduction into the
electrode bulk. They also exhibit good cycling efficiency, and longer lifetime than
batteries because their charge storage mechanism does not involve any
oxidation-reduction reactions. But due to the absence of redox reactions they
have much lower energy density compared to batteries.19,20
The low energy density issue of supercapacitors has limited their widespread
use. To overcome this major obstacle, many enterprises have invested time and
money in exploring, researching, and developing supercapacitors with a high
energy density that is close to currently used rechargeable batteries while
maintaining their high-power density and extended cycle life.

15
1.5 Research Motivation and Objective
To address the issue of low energy density of supercapacitors, intensive
research is being carried out to develop new electrode materials for
supercapacitors. Currently, carbon-based materials are mostly used due to their
high surface area for charge storage and favorable chemical properties. But, in
spite of these properties, the charges physically stored on them are unfortunately
limited. To solve this issue, many advanced approaches are being developed.
The electrode materials are hybridized by adding redox active materials like
metal oxides (RuO2, MnO2, Co3O4, etc.)21–23, metal hydroxides (Ni(OH)2,
Co(OH)2, etc.) to carbon-based electrodes or by completely replacing the carbon
electrodes with redox active materials like conducting polymers (polypyrrole,
PANI, etc.).24,25 The SCs with redox active materials as electrodes are called
redox enhanced SCs or hybrid supercapacitors. These hybrid supercapacitors
have been reported to yield much higher specific capacitance and energy density
than conventional supercapacitors and are being considered as promising next
generation energy storage systems.8
In recent decades, different electrode materials have been developed to
enhance the performance of SCs, but only a few materials are explored as redox
additives in electrolytes for SC applications. In this regard, the objective of this
research project was to develop an oxidation half-cell of a hybrid supercapacitor
using a redox additive gel-polymer electrolyte and single-walled carbon nanotube
(SWCNT) electrodes. N,N-disubstituted-4,4-bipyridinium (also referred to as

16
viologen or V2+) species were used as the redox additives in poly(ethylene glycol)
MW=400 (PEG)-lithium perchlorate gel-polymer electrolyte. The viologen centers
were incorporated in the PEG backbone to form a V-PEG copolymer, which was
then tethered to single-walled carbon nanotube electrodes to enhance the energy
density via redox reactions at the electrode-electrolyte interface.
The oxidation half-cell was then coupled with a reduction half-cell containing
ferrocene dicarboxylic acid, to form a hybrid supercapacitor. The reduction half-
cell was developed and characterized by Shalaka Rahangdale.26 The
capacitance and energy density of this hybrid SC is expected to be greater than
conventional SCs, due to the reversible Faradaic reactions related to viologens
and ferrocene dicarboxylic acid in the corresponding half-cells.

17
: MATERIALS FOR THE OXIDATION HALF-CELL OF THE HYBRID SUPERCPACITOR
2.1 Introduction
In the oxidation half-cell of the proposed hybrid supercapacitor, viologen-
polyethylene glycol (V-PEG) polymer was used as the cationic polyelectrolyte
and single-walled carbon nanotubes (SWCNTs) as electrode materials. The
oxidation half-cell was coupled with a reduction half-cell having ferrocene
dicarboxylic acid in it, to compensate for electrochemical reductions of viologens
during charging, as illustrated in Figure 2.1. Porous polycarbonate membranes
were used as separators, to allow the transfer of ions, but prevent electron flow
through them.
Figure 2.1 Proposed hybrid supercapacitor in a sandwich-type configuration.

18
In the oxidation half-cell, the electrode is expected to be the source of double
layer capacitance and the viologen centers in the gel-polymer electrolyte are
expected to be the source of redox capacitance. The oxidation-half cell materials
and their advantages are discussed in detail in the following sections.
2.2 Electrode Materials
The electrode materials for supercapacitors are required to have high
chemical stability for higher cyclic stability, a high specific surface area for higher
specific capacitance, and high electronic conductivity for high power density.1,18,27
In this respect, single-walled carbon nanotubes can be regarded as appealing
electrode materials, as they possess all the above properties.14,28
Carbon nanotubes (CNTs) were discovered in 1993 by Iijima et al. 29 They
can be defined as one atom thick sheets of graphene rolled up into cylinders with
a diameter in the order of 3-30 nm, as shown in Fig 2.2. All carbon atoms in
single-walled CNTs (SWCNTs) are covalently bonded with sp2 geometry to
neighboring carbon atoms with no unpaired electrons on their surface, due to
which they show a high level of chemical stability. They also exhibit a good
thermal conductivity along their axis as they are highly crystalline.28,29 Because of
these reasons, they were used as electrode materials in this project.
Figure 2.2 Structure of single-walled carbon nanotubes.

19
Despite all the appealing properties of SWCNTs, there are certain challenges
associated with them for their application as electrode materials in
supercapacitors (SCs). They are hydrophobic in nature and tend to aggregate
into bundles, rafts, and ropes due to extensive van der Waals interaction
between their sidewalls and the availability of easy packing. This results in their
poor solubility in most of the organic and aqueous solvents.30 To overcome these
limitations of SWCNTs, various chemical groups can be attached on their surface
to improve their solubility by interrupting the van der Waals interaction between
the tubes.31,32
In this project, to improve the solubility of the SWCNTs, they were oxidized
using 13 M nitric acid. The nitric acid-oxidation process is discussed in detail in
Chapter 3. Furthermore, in an attempt to improve the exposed surface area of
oxidized-SWCNTs for enhanced specific capacitance, they were functionalized
with PEG400. The viologen centers were also covalently incorporated into
polyethylene networks to increase their co-solubility with the PEG-derivatized
SWCNTs. The incorporation of viologen species in polyethylene glycol backbone
to form a V-PEG polymer is discussed in Chapter 4 and the derivatization of
SWCNTs with V-PEG polymer is discussed in detail in Chapter 5.
2.3 Electrolyte Materials
2.3.1 Electrolyte Salt and Solvent
Electrodes having a high surface area and high electronic conductivity are
considered critical to enhance the performance of SCs. But besides the two

20
electrodes, research has revealed that their performance depends on the
electrolyte as well.33 The electrolyte provides ionic conductivity, and facilitates the
charge-discharge processes on each electrode. Therefore, it is required to have
a wide voltage window, high electrochemical stability, high ionic concentration,
low resistivity, low solvated ionic radius, low viscosity, low toxicity, and low
volatility.33,34 Three types of electrolytes that are currently used in SC research
are aqueous, organic, and ionic liquid electrolytes.
Aqueous electrolytes such as H2SO4, Na2SO4, and KOH have small ionic radii
and can provide high ionic concentrations and lower resistance. However, their
decomposition voltage is about 1.23 V, and this limits the energy density and
power density of SCs.35 Ionic liquids (ILs) such as N-methyl-N-propyl-
pyrrolidinium bis(fluorosulfonyl)imide have a wide voltage window, high thermal,
and chemical stability. Despite the difficulties in designing ILs to have a wide
potential range, their performance metrics such as high conductivity in a wide
temperature range makes them attractive candidates. Organic electrolytes, such
as tetraethylammonium tetrafluoroborate (TEABF4) dissolved in acetonitrile or
propylene carbonate, can provide a wide voltage window as high as 3.5 V as well
as a wide range of operating temperature.35
In this project, lithium perchlorate (LiClO4) was used as the electrolyte salt
and PEG400 as the electrolyte solvent. Lithium perchlorate was selected because
of its good solubility and high conductivity in liquid PEG400. Compared with other
lithium salts, it is less hygroscopic, stable to ambient moisture, economical, and

21
very easy to handle.36 PEG was used not only due to the solubility factor but also
due to the fact that polymer electrolytes offer a number of advantages compared
to their liquid counterparts. They offer excellent processability, broad
electrochemical stability, they are less reactive, and safer due to their low
flammability.36 In addition, PEG400 is non-toxic, easy to handle, and exhibits ion
conduction at room temperature. The lithium-ion conduction in PEG is illustrated
in Scheme 2.1. The lithium ions are coordinated by ether oxygen atoms on the
segments of PEG chains. They get displaced by the continuous segmental
rearrangements accompanied by the gradual replacement of ligands in the
solvation sheath of lithium ions.
Scheme 2.1 Schematic illustration of lithium-ion conduction in PEG.
2.3.2 Redox Additive
In hybrid SCs, redox additives can be incorporated in the electrolyte to
improve their energy density. Redox additives are directly involved in the electron
transfer redox reactions and they improve the performance of SCs by their redox
capacitance contribution at the electrode-electrolyte interface.34 In this regard,
N,N-disubstituted-4,4-bipyridinium (also referred to as viologen or V2+) species

22
were used as the redox additives for the oxidation half-cell of the proposed hybrid
SC. They were incorporated into the backbone of the polymer electrolyte
(PEG400) to form viologen-PEG (V-PEG) polymers. The different V-PEG polymer
products that can be formed are shown in Figure 2.3. The synthesis of V-PEG
polymer is discussed in detail in Chapter 4. The PEG400 was used for multiple
purposes in the oxidation half-cell. It was not only used to incorporate viologen
species, but also to dissolve lithium perchlorate and functionalize SWCNTs to
increase their exposed surface area, as discussed in the above sections.
Figure 2.3 Possible structures of V-PEG polymer.
The viologen species were selected because they are strong electron
acceptors, possess three redox states (V0, V+˙, and V2+) states, and exhibit fast
and reversible rates of electron transfer.37,38 On charging, viologens (V2+)
undergo one-electron reduction to form the stable but air sensitive cation radicals

23
(V+˙), which further undergo one-electron reduction to form the neutral reduced
form V0, illustrated in Scheme 2.2. After the introduction of viologen species in
the polymer electrolyte of the oxidation half-cell, the energy density and
capacitance value of the proposed hybrid SC is expected to increase due to
reversible Faradaic reactions between viologen species and ferrocene
dicarboxylic acid present in the reduction-half cell of the SC. The chemical
processes involved to store charge in the proposed hybrid supercapacitor are
discussed in detail in Chapter 6.
Scheme 2.2 Redox behavior of viologen species.
2.4 Separator
The separator is located between the two electrodes in a SC, to prevent the
conduction of electrons between them, while permitting the facile transfer of
electrolyte ions. In SCs, the separators are required to have minimum resistance
for the ion transfer within the electrolyte, strong electronic insulating capability,
high electrochemical stability in the electrolyte, and good mechanical strength for
durability.35 Considering all these factors, porous polycarbonate filter membranes
were used as separators in this project.

24
: FUNCTIONALIZATION OF SINGLE-WALLED CARBON NANOTUBES
3.1 Introduction
Carbon nanotubes (CNTs) are inert and insoluble in most aqueous and
organic solvents, but their reactivity and solubility can be improved by
functionalizing them with different chemical groups. The chemical
functionalization can be done either covalently or non-covalently at the ends, on
the sidewall, or inside of CNTs. In an effort to increase the reactivity and solubility
of single-walled carbon nanotubes (SWCNTs), three different approaches were
attempted to covalently functionalize them with hydrophilic groups. The first
approach was to use UV-ozone for oxidatively breaking C-C double bonds in
pristine-SWCNTs and introducing functional groups like carboxylic acids, esters,
and quinones on their sidewalls. It has been proved that UV light excites oxygen
molecules from their spin-triplet state to a spin-singlet state and this excitation
lowers the activation energy of molecular oxygen for chemisorption reactions.
This results in easy charge transfer from the SWCNTs to oxygen molecules.39–41
The second approach was to attach maleic anhydride groups on the surface
of pristine-SWCNTs via a Diels-Alder reaction, as shown in Scheme 3.1. The
Diels-Alder reaction is a cycloaddition reaction between a conjugated diene
(electron rich) and a dienophile (electron poor). The SWCNTs were used as
dienes in this reaction due to the presence of extensive conjugated double
bonds. Maleic anhydride (MA) was used as dienophile, due to the presence of

25
two carbonyl groups which are strong electron withdrawing groups and make the
C=C bond of maleic anhydride electron deficient.42
Scheme 3.1 Diels-Alder reaction mechanism.
The third approach was to oxidize SWCNTs using a 3:1 mixture of sulfuric
acid (98 wt%) and nitric acid (16M), or in a closely related approach, to oxidize
them using 13 M nitric acid. The acid oxidation has been reported to break the
carbon-carbon double bonded network of p-SWCNTs allowing the introduction of
oxygen atoms in the form of carboxylic (-COOH), carbonyl (-CO), and hydroxyl (-
OH) functional groups, as shown in Scheme 3.2.43–45 The experimental
conditions for all the four methods used to covalently functionalize SWCNTs with
hydrophilic groups are described in detail in the following section.

26
Scheme 3.2 Acid treatment of SWCNTs.
3.2 Experimental Section
3.2.1 Materials
Single-walled carbon nanotubes were purchased from Cheap Tubes Inc.
They were used as received without further purification. These SWCNTs have an
average diameter between 1-2 nm and purity above 90%. All other reagents
were purchased from Sigma-Aldrich Inc. and were used as received.
Polycarbonate membranes with 0.6 µm pore size and nylon membranes with
0.45 µm pore size were purchased from Sigma-Aldrich Inc. as well.
3.2.2 Experimental Procedures
3.2.2.1 Ozonolysis
50 mg of SWCNTs was treated with ozone gas, which was generated onsite
using a low-pressure mercury UV lamp. The ozone gas was introduced
continuously into a two port (with one gas inlet and one gas outlet) 100-mL
plastic bottle containing the SWCNTs. The ozone treatment was carried out for 2
hours at room temperature and the bottle was shaken after every 10 minutes to

27
provide a uniform ozone exposure to tubes. The residual ozone gas coming out
from the outlet was scrubbed into 0.5 M potassium iodide solution before its
discharge to the atmosphere. The treated tubes were collected from the bottle
and stored in a glass vial for characterization.
3.2.2.2 Maleic Anhydride Treatment
In an oven dried three-neck flask, 30 mg of SWCNTs was suspended in 20
mL of N-methyl-2-pyrrolidone. The resulting mixture was stirred for 10 minutes
and sonicated in a water bath for 90 minutes. After degassing, 0.15 g mL-1 maleic
anhydride was added to the mixture, which was then stirred for 48 hours at 170
°C under an inert nitrogen atmosphere. After 48 hours, the reaction mixture was
first cooled down to room temperature, then diluted with deionized (DI) water for
its filtration through a 0.6 µm polycarbonate membrane filter. After filtration, no
product was retained on the membrane filter.
3.2.2.3 Concentrated H2SO4/HNO3 Mixture (3:1) Treatment
In an oven dried 50 mL round bottom flask, 20 mg of SWCNTs was
suspended in 20 mL of a 3:1 mixture of concentrated H2SO4(98
wt%)/HNO3(16M). The resulting mixture was sonicated in a water bath for 30
hours. After 30-hour sonication, the resulting reaction mixture was diluted with
200 mL of DI water and filtered through a 0.6 µm pore size polycarbonate
membrane filter. The retained tubes were repeatedly washed with DI water and
dried at 80 °C overnight in an oven.
28
3.2.2.4 Nitric Acid Oxidation
In an oven dried 100 mL round bottom flask, 200 mg of SWCNTs was
refluxed in 55 mL of 13M nitric acid for four days. The refluxed tubes were
collected on a 0.6 µm- pore membrane filter and rinsed with DI water. Then the
tubes were dried at 80 °C overnight in an oven.
3.3 Characterization Techniques
3.3.1 Raman Spectroscopy
Raman spectroscopy is a non-destructive light scattering technique, which
allows analysis of a wide variety of opaque, colored, transparent, and translucent
samples including solutions, suspensions, and solids.46 This technique is named
in honor of its inventor, C. V. Raman, an Indian scientist, and is based on the
Raman effect.47 The Raman effect, is the inelastic scattering of incident radiation
through its interaction with vibrating molecules. The inelastic scattering of light is
used to identify and interrogate vibrational and rotational modes of molecules.
In this technique, when a sample is illuminated with a monochromatic laser
beam (typically in the UV-NIR range), the laser beam interacts with the
molecules present in it and is scattered in all directions. The frequency of the
scattered radiation, is measured, for example, at right angles to the incident
radiation. If the frequency of the scattered radiation is equal to the frequency of
the incident radiation, then it’s called Rayleigh scattering, but if the frequency of
the scattered radiation is different from the frequency of the incident radiation,
then it may be Raman scattering. The majority of the scattered light follows the

29
Rayleigh scattering mechanism, roughly one in 106 of incident photons, and only
a much smaller fraction (again, roughly one in 106) shows Raman scattering. The
scattered light showing Raman scattering is used to construct a Raman
spectrum. If the frequency of the incident radiation is higher than the frequency of
the scattered radiation, the radiation is referred to as Stokes lines and if the
frequency of the incident radiation is lower than the frequency of the scattered
radiation, then it is termed anti-Stokes. In a Raman spectrum, both Stokes and
anti-Stokes lines are present. The difference in frequency between the incident
and scattered radiation is called as the Raman shift. Raman’s insight was to
predict the existence of these bands, and to assign them to inelastic scattering
wherein the incident photon mixes with the vibrational energy of the molecule.
This results in Stokes/anti-Stokes bands appearing at a frequency shift equal to
the vibrational frequency of the bond in question. Stokes bands are more intense
than anti-Stokes bands because they involve transitions from lower to higher
energy vibrational levels and hence are measured in conventional Raman
spectroscopy.47,48 The different types of transitions involved in Rayleigh and
Raman scattering are demonstrated in Figure 3.1.

30
Figure 3.1 A schematic view of the energy transitions involved in (a) Rayleigh scattering, (b) Raman scattering (stokes scattering) and (c) Raman scattering (anti-stokes).
This technique is used for both quantitative and qualitative analysis and is
well known for its minimum requirement for sample preparation and handling. A
Raman spectrum is presented as intensity vs wavelength. Qualitative analysis
can be done by measuring the frequency of scattered radiations while
quantitative analysis can be done by measuring the intensity of scattered
radiations.49 The magnitude of wavelength shifts (frequency values) is
independent of the wavelength of incident radiation, but the intensity of Raman
scattering depends on the wavelength of incident radiation.47
Over the last four decades. Raman spectroscopy has played an important
role in the characterization of carbon nanotubes and identifying the covalent

31
functionalization of SWCNTs. It is used to detect the presence of any defects or
sp3 hybridization within the CNTs. Typically, three types of modes are often
observed with CNTs, referred to as radial breathing mode (RBM), disorder mode
(D band), and tangential mode (G-band). The radial breathing mode between
100-300 cm-1 is dependent on CNT’s diameter. This region shows much variation
with different samples. The tangential mode or the G-band is characteristic of sp2
hybridized carbon atoms present in p-SWCNTs. This band indicates the
presence of highly ordered CNT sidewalls and it appears between 1500-
1600 cm-1. The disorder mode or the D band is characteristic of sp3 hybridized
carbon atoms. It appears between 1200-1350 cm-1, indicating the presence of
some disorder in sp2-hybridized p-CNTS. It is correlated with the extent of
sidewall functionalization of CNTs. The intensity of the D band relative to the
intensity of the G band is expressed as ID/IG. It provides information regarding the
structural changes as a result of covalent functionalization of the SWCNTs. The
higher ID/IG ratio indicates higher degree of covalent functionalization.50,51
However, the Raman spectroscopy does not help in studying the chemistry of
sidewalls of CNTs. The functional groups present on the tube walls cannot be
identified using this technique. To identify the functional groups, present on the
tube walls, infrared spectroscopy is used, which is discussed in the following
section.

32
3.3.2 Attenuated Total Reflection Fourier-Transform Infrared (ATR-FTIR) Spectroscopy
Fourier-transform infrared spectroscopy is a fast, non-destructive analytical
technique which helps to indicate the presence or absence of specific functional
groups in a sample. It is based on triggering molecular vibrations through
irradiation with infrared (IR) light and detecting the absorption of light by the
sample. It commonly utilizes the mid IR region (4000 cm-1 to 400 cm-1). In this
technique, when a sample is illuminated with a beam of IR light, the bonds
present in the molecules absorb the energy of IR radiation. The absorption of IR
light only occurs if the frequency of the incident IR radiation is identical to the
vibrational frequency of the mode in question, i.e. of the specific functional
groups in the molecule. The wavelengths at which the sample absorbs IR light is
characteristic of its molecular structure. For the radiation measured in infrared
frequencies, an interferometer is typically used for spectral dispersion, hence the
need for a Fourier to convert from the time to frequency domain. Thus, from an
FTIR spectrum, the chemical components present in the sample can be
determined.52
In FTIR spectroscopy, the transmission of light is typically used, and IR light is
passed through a sample sandwiched between two IR transparent windows. In
this approach, it is crucial to adjust the sample thickness because the longer path
lengths result in more absorption of incident IR radiation, and potentially none
reaching the detector. The attenuated total reflection (ATR) offers an alternative
sampling technique to overcome the sample thickness limitation of transmission.

33
ATR is a surface sensitive technique, and generally it prevents strong attenuation
of the IR signal in highly absorbing media. In this method, a beam of IR light is
passed through a crystal made of IR transparent material with high refractive
index. The IR beam is totally internally reflected as it passes through the crystal,
reflected at an angle of incidence greater than the critical angle for the crystal
material-organic material interface. This reflection forms the evanescent wave
which extends into the sample and decays exponentially with distance from the
surface as shown in Figure 3.2. It protrudes only a few microns beyond the
crystal surface and interacts with the sample on the top surface of the prism or
ATR crystal. In the regions of the IR spectrum where the sample absorbs energy,
the evanescent wave is attenuated and the attenuated beam is recorded by the
detector to generate a IR spectrum.53 Additionally, this technique allows samples
to be directly deposited onto the ATR crystal with very little sample preparation.
Figure 3.2 Schematic representation of infrared beam path length through the ATR crystal.

34
ATR-FTIR plays an important role in studying the sidewall chemistry of
nanotubes. It can help to identify functional groups like –COOH, -OH, and other
oxygen containing groups attached on the sidewalls of CNTs after their
functionalization. In a typical ATR-FTIR spectra, bands due to C=O stretch are
observed in the range ~1700 cm-1 for the carboxylated SWCNTs. The bands due
to O-H stretch are observed in the range ~3300 cm-1 for the hydroxylated
SWCNTs.54 The presence of these bands can indicate successful
functionalization of SWCNTs with hydroxyl and carboxyl groups.
3.4 Results and Discussion
3.4.1 Ozonolysis
The unfunctionalized SWCNTs are expected to aggregate and be completely
insoluble in water due to their hydrophobic nature. But, the SWCNTs
functionalized with hydrophilic groups through ozonolysis are expected to be
soluble in water. But, when the treated SWCNTs were dispersed in DI water,
they still showed aggregation, indicating their unsuccessful functionalization. The
unsuccessful functionalization can be attributed to a paucity of reaction time or
non-uniform ozone exposure to tubes. To ensure this was the case, the ozone
treatment time was increased and the SWCNTs were suspended in DI water for
uniform ozone exposure. Even after four hours of ozone exposure and constant
stirring, similar results were obtained, and this method was abandoned.

35
3.4.2 Maleic Anhydride Treatment
The maleic anhydride treatment described above yielded SWCNTs that were
difficult to filter through a 0.6 µm polycarbonate membrane filter. During filtration,
most of the tubes passed through the filter membrane along with the reaction
mixture indicating excessive shortening of SWCNTs due to maleic anhydride
treatment. The filtrate obtained was black in color, which suggested improved
solubility of the tubes due to functionalization. In an effort to separate the tubes
from the reaction mixture, the obtained black solution was again filtered through
a 0.45 µm pore size nylon membrane. But filtration was again not successful and
no product was retained on the membrane filter.
After failed filtration attempts, centrifugation was used as an alternative
approach to separate the tubes from the reaction mixture. Small volumes of the
reaction mixture were centrifuged using a Labnet mini centrifuge C-1200
(115V/60 Hz) at a speed of 2000 rpm for an hour, but no two distinct phases
were obtained. This procedure was repeated multiple times and still tubes did not
settle and stayed dispersed in the reaction mixture. This failure may be
attributable to the low rpm value of the instrument.
3.4.3 Concentrated H2SO4/HNO3 Mixture (3:1) Treatment
The acid treated SWCNTs were expected to have improved solubility but
when they were dispersed in DI water, the expected result was not observed.
Even after sonicating the SWCNT-water suspension, the tubes still aggregated in
the aqueous environment. This indicated that this method did not incorporate

36
much hydrophilic functional groups on the CNT surface. This may be due to lack
of heating during sonication which could have lowered the reaction rate. So,
considering all these factors a reflux method was developed to oxidize SWCNTs.
3.4.4 Nitric Acid Oxidation
To check the solubility of acid refluxed tubes, they were dispersed in water
and sonicated for five minutes. After sonication, they were found to be soluble in
water resulting in a black colored solution illustrated in Figure 3.3. This indicated
successful functionalization of SWCNTs.
Figure 3.3 Solubility test of CNTs, (1) p-SWCNTs in water and (2) acid treated SWCNTs in water.
After obtaining positive results from the solubility test, the refluxed tubes were
further characterized using FTIR and Raman spectroscopy. The Raman spectra
of p-SWCNTs and acid treated SWCNTs were recorded at room temperature on
an Enwave Optronics Raman spectrometer using a laser beam of the wavelength
of 785 nm. These spectra are overlapped for comparison, as illustrated in Figure
3.4. In the Raman spectrum of p-SWCNTs (Fig 3.4a), a prominent G-band at

37
1615 cm-1 and a very small D-band at 1300 cm-1 is observed, indicating the
presence of mostly sp2 hybridized carbon-atoms and very few sp3 hybridized
carbon-atoms. However, in the Raman spectrum of acid treated SWCNTs (Fig
3.4b), a distinct D-band is observed at 1316 cm-1, indicating the presence of
some defects caused by acid treatment. The ID/IG ratio of p-SWCNTs and acid
treated were calculated to be 0.08 and 0.15. The higher ID/IG ratio of acid treated
SWCNTs indicated successful activation of tubes as ID/IG ratio is sensitive to sp3
hybridized carbon atoms.
Figure 3.4 Raman spectra of (a) p-SWCNTs and (b) acid treated SWCNTs.

38
The FTIR spectra of acid treated and pristine tubes were taken using Thermo
Nicolet 6700 FT-IR spectrometer, to further confirm the functionalization of
SWCNTs. These spectra are overlapped for comparison, as illustrated in Figure
3.5. In FTIR spectra of both p-SWCNTs and acid treated tubes, a sharp
absorption band at 2100cm-1 is observed, which arises due to C=C stretch mode
in the SWCNTs. However, in the FTIR spectrum of acid treated SWCNTs (Fig
3.5b), additional absorption bands at 3300 cm-1 (O-H, hydroxyl group) and 1650
cm-1 (carboxyl group) are observed, which are consistent with the known
vibrational frequencies of the hydroxyl and carboxyl functional groups.
Consequently, due the presence of these absorption bands (O-H and C=O) in the
FTIR spectrum of acid treated SWNTs, it can be confirmed that the tubes were
successfully oxidized or activated by nitric acid treatment.
Figure 3.5 FTIR spectra of (a) p-SWCNTs and (b) acid treated SWCNTs.
1000 1500 2000 2500 3000 3500 4000
Abso
rban
ce
Wavenumber (cm-1)
pristine refluxed
33001650
210
(a)
(b)

39
3.5 Conclusions
On the basis of above results, it can be concluded that the most simple and
effective method to introduce hydrophilic groups on the surface of p-SWCNTs is
the nitric acid treatment. The data from Raman spectroscopy confirmed that nitric
acid treatment successfully oxidized them by creating some defects in their
structure. The presence of hydroxyl and carboxylic acid groups on the walls of
SWCNTs, was confirmed by the data from FTIR spectroscopy. The oxidized
SWCNTs also revealed good solubility in water. To sum up, CNTs possess
limited solubility and are inert to most of the chemicals, but can be activated by
treating them with nitric acid for a prolonged period of time. These activated
tubes were further functionalized with a V-PEG polymer to increase their
exposed surface area. The functionalization of activated SWCNTs with V-PEG
polymer is discussed in Chapter 5.

40
: SYNTHESIS OF VIOLOGEN-POLYETHYLENE GLYCOL (V-PEG) POLYMER
4.1 Introduction
The salts of 1,1’-disubstituted-4,4’-bipyridinium are commonly known as
viologens. They were discovered in 1993 and since then they have been widely
investigated due to their electrochemical properties.55 These properties include
two reductions corresponding to the three redox forms (V2+,V+, and V0), fast
electron response, and good chemical reversibility. Because of these unique
electrochemical properties, they were originally investigated as redox indicators
in biological studies. Subsequently, they were used as herbicides (paraquat).38
Recently, viologen-based polymers have received much attention as electrode
materials for batteries.37,56
Viologen moieties can be incorporated along the backbone of a polymer chain
to form main-chain viologen polymers.57 This improves the solubility of the
viologen moieties and prevents their crystallization. In 1974, the first viologen
polymer was synthesized using a dihaloarylalkane and 4,4’-bipyridine. Since
then, different polymers with viologen moieties as a part of the polymer backbone
have been studied.57 Because of the presence of viologens, they exhibit a wide
range of properties like electrical conductivity, electrochromism, photochromism,
thermochromism, and photomechanical behavior.58,59 In this project, viologen
moieties were incorporated in the polymer backbone of polyethylene glycol
(PEG-400), to form a cationic polyelectrolyte (V-PEG) for the proposed hybrid
supercapacitor. V-PEG polymer was synthesized by reacting tosylated

41
polyethylene glycol (PEG-400) with 4,4’-bipyridine. First, the tosylation was
carried out to convert the two hydroxyl groups at the end positions of PEG into
tosylates, as illustrated in Scheme 4.1. This step is carried out because tosylates
are excellent leaving groups compared to hydroxyl groups and can be used as
precursors for nucleophilic substitution reactions.59–61
Scheme 4.1 Tosylation of (a) PEG-400 using (b) p-toluenesulfonyl chloride.
The reaction conditions for the tosylation reaction are discussed in detail in
the following section. After this step, the ditosylated PEG chains were used as
prepolymers for the preparation of the corresponding main-chain viologen co-
polymers, V-PEG. The ditosylated PEG chains were reacted with 4,4’-bipyridine
for about 48 hours. These two species react in a SN2 fashion, 4,4’-bipyridine acts
as a nucleophile and replaces the two tosylate groups at the end positions of
PEG, as demonstrated in Scheme 4.2. The departure of tosylate groups occurs
simultaneously with the backside attack of 4,4’-bipyridine, one bond is broken
and one bond is formed synchronously.58,62

42
Scheme 4.2 Synthesis of viologen-polyethylene glycol polymer using (a) ditosylated PEG and (b) 4,4-bipyridine.
4.2 Experimental Section
4.2.1 Materials
All the chemicals and solvents were purchased from Sigma-Aldrich Inc. All
reactions were carried out under an inert N2 (nitrogen) atmosphere in oven-dried
glassware fitted with rubber septa. Teflon-coated magnetic stir bars were used
for stirring and the dry liquid reagents and solvents were transferred using glass
syringes.
4.2.2 Experimental Procedures
4.2.2.1 Tosylation of PEG-400
For tosylating PEG, two different approaches were attempted. In the first
approach, p-toluenesulfonyl chloride was used as the tosylating agent and
triethylamine as the base. In tosylation, usually a non-nucleophilic base is used
because it can readily react with p-toluenesulfonyl chloride instead of removing

43
HCl formed during the reaction. In the second approach, triethylamine was
switched with pyridine, and all the liquid solvents and reagents were dried under
vacuum and stored over molecular sieves before using them.
4.2.2.1.1 Tosylation of PEG using Triethylamine
PEG-400 (1 eq, 2 g, 1.77 mL, 5 mmol) was first dissolved in 20 mL of
dichloromethane (DCM). This solution was mechanically stirred and cooled in an
ice bath. Then p-toluenesulfonyl chloride (1.8 eq, 1.72 g, 9 mmol) and 2 mL of
triethylamine were added to it under continuous stirring. The resulting mixture
was stirred in an ice bath for two hours and then stirred for 6 hours at room
temperature. To obtain the product, the reaction mixture was added dropwise
into 100 mL of cold diethyl ether, but no precipitates were obtained indicating
unsuccessful tosylation of PEG.
4.2.2.1.2 Tosylation of PEG using Pyridine
In a three-necked N2-flushed flask, p-toluenesulfonyl chloride (1.8 eq, 1.72 g,
9 mmol) was first dissolved in 10 mL of dry DCM and then 0.5 mL of pyridine
(previously dried by vacuum distillation and stored over molecular sieves) was
added to it. This solution was mechanically stirred and cooled in an ice bath. To
this rapidly stirred solution, PEG-400 (1 eq, 2 g, 1.77 mL, 5 mmol, dried by
vacuum distillation and stored over molecular sieves) was added very slowly
dropwise. The reaction mixture was kept in the ice bath for 3 hours and then
stirred at room temperature for 12 hours. After 12 hours, a white polymer was
obtained by pouring the reaction mixture into cold diethyl ether. The ditosylated

44
polymers were purified by reprecipitation from dichloromethane and cold diethyl
ether. The purified polymers were dried under vacuum and then stored at -30 ºC
for later use.
4.2.2.2 Synthesis of Viologen-Polyethylene Glycol Polymer
A mixture of ditosylated PEG (3.10 g, 4.38 mmol) and 4,4’-bipyridine (0.68 g,
4.38 mmol) was heated at 60-70 ºC in 50 mL of N,N-dimethylformamide (DMF)
for 48 hours. After 48 hours, the reaction mixture was stirred at room temperature
for two more days. Unreacted 4,4’-bipyridine, excess polyethylene glycol and
partially reacted 4,4’-bipyridine were removed by extractions with cold diethyl
ether and DCM. After drying under the vacuum, light brown highly viscous liquid
polymer was obtained.
4.3 Characterization Techniques
The structures of tosylated PEG and novel viologen-polyethylene glycol
polymer were identified using 1H-NMR, 13C-NMR, and FTIR spectroscopy. The
1H-NMR and 13C-NMR spectra were recorded on Varian 400 MHz spectrometer
and the solvent (DMSO-d6) signal was used as the internal standard. FTIR
spectra were measured on Nicolet 6700 FT-IR spectrometer. The
electrochemical properties of the V-PEG polymer were investigated by the
method of cyclic voltammetry (CV). All the CV experiments were performed using
a CH 660 or PAR 263A electrochemical analyzer. The basic principles and
advantages of NMR and cyclic voltammetry are discussed briefly in sections
below.

45
4.3.1 Nuclear Magnetic Resonance Spectroscopy (NMR)
NMR is a non-destructive analytical technique which exploits the magnetic
properties of atomic nuclei to determine the chemical structure of different
molecules. This technique is based on the interaction of radio frequency pulses
with unpaired nuclear spins (NMR active nuclei) in an external magnetic field.
The NMR active nuclei are first exposed to a strong and constant magnetic field,
then they are excited by a radiofrequency pulse sequence. After the excitation,
the nuclei undergo relaxation and emit electromagnetic signals. These signals
are recorded and converted into a frequency spectrum. From the spectrum,
parameters like chemical shift, splitting pattern, the number of signals, and the
area under each signal provide structural information about a given sample.63–65
In 1H-NMR, the signals arise due to the interaction of radio frequency pulses
with different protons in a sample under study, as a function of chemical shift.
The chemical shift values or position of the signals gives information regarding
the chemical environment of protons. If two or more protons are in an equivalent
environment, then they will have the same chemical shift and will appear as one
signal. The number of signals provide information about the number of
chemically inequivalent protons and the area under each signal gives information
about the relative number of protons that are giving rise to that signal. Integration
can be used for the measurement of the area under each signal. For a given
peak, the splitting pattern provides information about the number of neighboring
inequivalent protons. Splitting of signals is caused by protons bonded to adjacent

46
carbon atoms, and it follows the so called (N+1) rule, where N is the number of
equivalent protons that are bonded to the adjacent carbon atoms.63–65 For
example, if a proton has no neighboring proton, it manifests a single NMR peak
and if it has two neighboring protons, it yields a triplet.
Similar to 1H-NMR, the 13C-NMR the signals arise due to the interaction of
radio frequency pulses with different carbon atoms in a sample under study. It
relies on the magnetic properties of 13C nuclei. The number of signals gives
information about the different carbon atoms or sets of equivalent carbon atoms
present in the sample. The chemical shift values provide information regarding
the chemical environment and hybridization of carbon atoms (sp3, sp2 or sp).
However, in 13C spectra, C-C splitting is rarely observed because only about
1.1% of naturally occurring carbon is 13C and the chances of two 13C next to each
other is very rare. Integration is also not useful in13C NMR because the carbon
intensities don’t accurately reflect the relative number of C-atoms.65 But the
signals are spread over a much wider range (0-250 ppm) compared to 1H NMR
spectra, making it easier to identify and count the different types of nuclei.
4.3.2 Electrochemical Analysis
Cyclic voltammetry is a versatile and widely used electrochemical analysis
technique. It is used for the characterization of electroactive chemical species. It
can provide information about the number and stability of redox states, kinetics of
electron transfers, and diffusion properties. In CV, the voltage is swept at a

47
constant rate, positively and negatively relative to a reference electrode while
monitoring the resulting electrochemical current.66
CV experiments are mostly conducted in a three-electrode electrochemical
cell. These cells are required to have provisions for an inert gas purge, a working
electrode (WE), a reference electrode (RE), and a counter (auxiliary) electrode
(AE). The electrodes are connected to a potentiostat that controls the potential of
the WE and determines resulting current. The working electrode is the critical
component of the cell, as it is where the key reaction under study takes place. It
can act as the anode or cathode, depending on the direction of current flow. This
electrode is usually made of an inert material, that has good conductivity and
good thermodynamic stability, such as platinum, gold, and glassy carbon. The
counter electrode is the AE, it functions as a cathode when the working electrode
is operating as an anode and vice versa. The potential of the AE in an active
feedback loop provides the programmed potential at RE, and therefore drives
current at the WE. Platinum wires are mostly used as counter electrodes due to
their inert nature. The RE is used as a half cell, to measure the potential of the
WE. The potentiostat isolates the RE and does not allow any current to pass
through it. The most common reference electrodes used in the laboratories are
silver-silver chloride electrodes and saturated calomel electrodes (SCE).67,68
In CV experiments, an initial potential is applied to the cell and then a linear
voltage ramp (at a fixed sweep rate, V s-1) is applied first toward one cusp
potential, and then toward the final potential. During the potential sweep, the

48
current response is measured. The current that flows through the working
electrode is plotted against the applied voltage to give a cyclic voltammogram, as
shown in Figure 4.1. In the forward scan, a Faradic current peak is observed for
any analyte that can be reduced within the initial and final potential range. As the
potential applied to the WE approach the reduction potential of the analyte, the
current increases. But then tails off due to the depletion of the analyte at or near
the WE’s surface. In the reverse scan, the applied potential reaches a value
where the product formed in the first reduction reaction gets re-oxidized. This
produces a Faradic current of reverse polarity from the forward scan. This
oxidation peak has similar shape to the reduction peak, and from these peaks,
redox potentials and electrochemical reaction rates of the analytes can be
obtained. The reversibility of any electroactive chemical species can be
measured by changing the scan direction and its stability can be characterized by
repeating the CV scans continuously.67,68
Figure 4.1 A cyclic voltammogram.
49
The room temperature voltammetric peak current for a reversible process is
given by the Randles-Sevcik equation:
ip= 2.69 × 10⁵ n3
2 AD1
2Cv1
2 Equation 1.10
Where ip is the peak current, n is the number of electrons transferred in the
redox event, A is the area of the microelectrode (cm2), D is the diffusion
coefficient (cm2 sec-1), C is the concentration (mol cm-3), and v is the scan rate (V
sec-1). As per this equation, a reaction may be considered kinetically reversible if
the peak current (ip) increases linearly as a function of square root of the scan
rate.66
To study the redox behavior of V-PEG polymer in the liquid and semi-solid
phases, CV experiments were performed using both micro- (3mm diameter) and
ultramicro- (10 µm) working electrodes. The ultramicroelectrodes were used
because they are suitable to perform electrochemical investigations on
polyelectrolytes because their low current defeats the high electrical resistance of
polymers. In addition, they permit measurements on limited quantities and exhibit
relatively faster response time.69 The CV graphs obtained with a microelectrode
is very different from the one obtained with a ultramicroelectrode. This is due to
the differences in mass transport at the electrode surface. At larger electrodes,
mass transport occurs mostly perpendicular to the surface, resulting in a typical
peak-shaped voltammogram. But at ultramicroelectrodes, mass transport takes
on a hemispherical profile, resulting in a sigmoidal, steady state voltammogram.
Unlike microelectrodes, current generated at ultramicroelectrodes are dependent

50
on their geometry. The limiting plateau current from ultramicroelectrodes is given
by Equation (1.11), shown below.62,69
ilim=4nFrDC Equation 1.11
Where ilim is the limiting current (amps), F is Faraday’s constant (C mol-1), and
r is electrode radius (cm). The experimental details of both liquid and semi-solid
phase characterization are discussed below.
4.3.2.1 Liquid Phase Characterization
The liquid phase experiments were performed to analyze the electrochemical
behavior of 4,4’-bipyridine (starting material) and synthesized viologen-PEG
polymer. In all the experiments, a high surface area Pt wire was used as the AE
and silver/silver chloride was used as the RE. The analysis of 4,4’-bipyridine was
first carried out using a Pt microelectrode of diameter 3 mm and then using a Pt
ultramicroelectrode of diameter 10 µm. The apparatus setup for analysis of 4,4’-
bipyridine is depicted in Figure 4.2. All the electrodes were dipped in a cell
containing an electrolyte. The cell lid had holes for the insertion of electrodes and
for nitrogen gas to be bubbled through the solution. Before every experiment, the
working electrode was polished using 1.0, 0.3 and 0.05-micron alumina powder.
A nylon polishing pad was used for the 1.0 and 0.3-micron alumina and a
microcloth polishing pad was used for 0.05-micron alumina powder. The
electrolyte solution was also purged off oxygen by bubbling solvent-saturated
nitrogen in the jar for 5 minutes and a nitrogen blanket was maintained
throughout all electrochemical measurements.

51
Figure 4.2 Three-electrode electrochemical cell setup for analysis of 4,4’-bipyridine.
Similarly, the viologen polymer was analyzed using both Pt micro- and
ultramicroelectrode. For the analysis, a thin layer of the polymer was deposited
on the surface of the WE due to its poor solubility in the electrolyte. The working
electrode was also wrapped with a polycarbonate membrane (of diameter 0.45
µm) to prevent the polymer from leaking. The apparatus setup for analysis of the
viologen polymer is depicted in Figure 4.3.

52
Figure 4.3 Three-electrode electrochemical cell setup for analysis of viologen polymer.
4.3.2.2 Semi-Solid Phase Characterization
In addition to liquid phase characterization, semi-solid phase characterization
of the viologen polymer was also performed using a 10 µm Pt ultramicroelectrode
(WE) and a thin silver plate as both AE and RE. The experimental setup is
depicted in Figure 4.4. A Teflon block was used to hold the WE on top of the
silver plate with the polymer between them. A few drops of electrolyte were also
added to the polymer before conducting CV experiments.

53
Figure 4.4 Semi-solid phase characterization setup for viologen polymer.
4.4 Results and Discussion
4.4.1 Nuclear Magnetic Resonance Spectroscopy (NMR) Results
The molecular structures of ditosylated PEG and viologen polymer were
identified using both 1H and 13C NMR. The chemical shifts (δ) are reported in
ppm relative to the residual solvent signal (DMSO: δ = 2.2 for 1H NMR and δ =
40.0 for 13C NMR). The abbreviations used are as follows: s (singlet), d (doublet),
t (triplet), m (multiplet).
4.4.1.1 Ditosylated PEG
The 1H NMR spectrum of ditosylated PEG in DMSO, including peak
assignments is shown in Figure 4.5. 1H NMR (400 MHz, DMSO-d6): δ (ppm) 36

54
(s, 6H, -CH3), 3.35~3.69 (m, 32 H, -CH2-O-), 4.05 (t, 4H, -CH2-OTs-), 7.45 and
7.99 (m, 8H, -C6H4-). The spectrum was consistent with previously published
work.62 It can be noticed that there is a small amount of impurity detected,
corresponding to the unassigned peaks.
Figure 4.5 1H NMR spectrum of ditosylated PEG in DMSO and structural identification.
The 13C NMR of ditosylated PEG in DMSO, is shown in Figure 4.6. 13C NMR
(400 MHz, DMSO-d6): δ (ppm) 21.72, 60.84, 68.51, 70.64, 72.96, 126.14,
128.75, 130.78, 146.24. The C-atoms giving rise to peaks at 60.84 ppm and
72.96 ppm are not labelled because these peaks arise from the C-atoms of non-
tosylated polymer ends. This spectrum was consistent with previously published
work.70

55
Figure 4.6 13C NMR spectrum of ditosylated PEG in DMSO and structural identification.
4.4.1.2 Viologen Polymer:
The 1H NMR spectrum of viologen polymer in DMSO is shown in Figure 4.7.
1H NMR (400 MHz, DMSO-d6): δ (ppm) 2.43 (s, 6H, CH3-Ph), 3.6-3.84 (m, 32H, -
CH2O-), 4.79 (m, 4H, -CH2-N+-), 7.06 and 7.4 (m, 8H, -C6H4-), 8.6 and 8.9 (m,
8H, -N+C5H4-). These chemical shift values were consistent with previously
published work.62

56
Figure 4.7 1H NMR spectrum of viologen polymer in DMSO and structural identification.
The 13C NMR of viologen polymer in DMSO is shown in Figure 4.8. 13C NMR
(400 MHz, DMSO-d6): δ (ppm) 21.39, 31.29, 44.28, 61.01, 70.41, 124.37,
126.14, 128.75, 138.48, 142.604,145.89. The δ = 61.01-72.9 ppm signals are
due to the inner C-atoms of the polymer. This spectrum was consistent with
previously published work.58

57
Figure 4.8 13C NMR spectrum of viologen polymer in DMSO and structural identification.
4.4.2 Cyclic Voltammetry Results
4.4.2.1 Liquid Phase Characterization
4.4.2.1.1 Analysis of 4,4’-bipyridine using Micro- and Ultramicroelectrode
Cyclic voltammetry of nitrogen-degassed solution of 4,4’-bipyridine in 0.1 M
lithium perchlorate/acetonitrile (ACN) was done using a platinum (Pt)
microelectrode. The potential of the Pt microelectrode was swept between -0.2 V
and -1.2 V vs Ag/AgCl at a scan rate of 0.1 V s-1. The resulting cyclic
voltammogram did not show any redox peaks, as shown in Figure 4.9. The
absence of redox peaks indicated that 4,4-bipyridine is not electroactive. A
similar result was obtained when the cyclic voltammetry analysis of 4,4-bipyridine
was done using a platinum ultramicroelectrode. The potential of the Pt
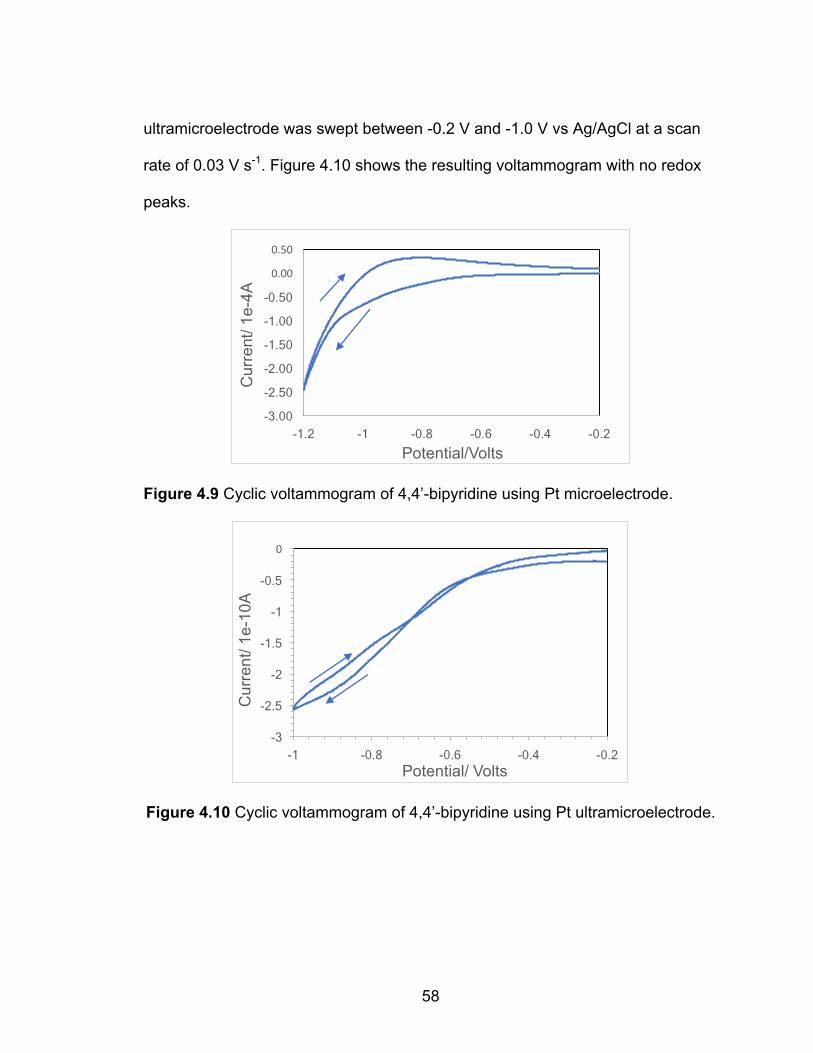
58
ultramicroelectrode was swept between -0.2 V and -1.0 V vs Ag/AgCl at a scan
rate of 0.03 V s-1. Figure 4.10 shows the resulting voltammogram with no redox
peaks.
Figure 4.9 Cyclic voltammogram of 4,4’-bipyridine using Pt microelectrode.
Figure 4.10 Cyclic voltammogram of 4,4’-bipyridine using Pt ultramicroelectrode.
-3.00
-2.50
-2.00
-1.50
-1.00
-0.50
0.00
0.50
-1.2 -1 -0.8 -0.6 -0.4 -0.2
Cur
rent
/ 1e-
4A
Potential/Volts
-3
-2.5
-2
-1.5
-1
-0.5
0
-1 -0.8 -0.6 -0.4 -0.2
Cur
rent
/ 1e-
10A
Potential/ Volts

59
4.4.2.1.2 Analysis of Viologen Polymer using Micro- and Ultramicroelectrode
Cyclic voltammetry of viologen polymer, deposited on the surface of a Pt
microelectrode and dipped in 0.1 M LiClO4/ACN was done at room temperature.
The potential of the Pt electrode was swept between -0.2 V and -1.0 V vs
Ag/AgCl at a scan rate of 0.25 V s-1. In the resulting CV graph (Fig.4.11), two
distinct peaks both on the reduction and oxidation cycles were observed,
corresponding to redox couples V2+/V+• and V+•/V0. The redox potential (E0) or
midpoint potential for V2+/V+• was -0.42 V and E0 for V+•/V0 was -0.76 V. This
confirmed the quaternization of nitrogen atoms of 4,4’-bipyridine by its covalent
linkage to PEG chains, hence making it electroactive. The peak separations of
these two redox couples was approximately 0.1 V for V2+/V+• and 0.12 V for
V+•/V0, indicating that V2+/V+• is a more reversible redox couple than V+•/V0.
Figure 4.11 Cyclic voltammogram of viologen polymer using Pt microelectrode.
-2.7
-2.2
-1.7
-1.2
-0.7
-0.2
0.3
-1 -0.8 -0.6 -0.4 -0.2
Cur
rent
/ 1e-
5A
Potential/ Volts
V2+/V+•
V+•/V0

60
Similarly, the potential of the Pt ultramicroelectrode was swept between -0.2
V and -1.0 V vs Ag/AgCl at a scan rate of 0.03 V s-1. The CV graph showed two
sigmoidal curves corresponding to V2+/V+• and V+•/V0, as shown in Figure 4.12.
The results obtained using both micro- and ultramicroelectrodes were consistent
with previously published work.56,71
Figure 4.12 Cyclic voltammogram of viologen polymer using Pt ultramicroelectrode.
4.4.2.2 Semi-Solid Phase Characterization
Cyclic voltammetry of the viologen polymer deposited over the silver plate
with few drops of 0.1 M LiClO4/ACN in it, was performed at room temperature.
The potential of the Pt ultramicroelectrode was swept between -0.2 V and -1.0 V
vs Ag/AgCl at a scan rate of 0.03 V s-1. In the resulting CV graph (Fig.4.13), two
-7.00
-6.00
-5.00
-4.00
-3.00
-2.00
-1.00
0.00
-1 -0.8 -0.6 -0.4
Cur
rent
/ 1e-
9A
Potential/ Volts
V2+/V+•
VV+•/V0

61
distinct peaks both on the reduction and oxidation cycles were observed,
corresponding to redox couples V2+/V+• and V+•/V0. The redox potential (E0) for
V2+/V+• was -0.37 V and E0 for V+•/V0 was -0.73 V. This again confirmed the
quaternization of nitrogen atoms of 4,4’-bipyridine by its covalent linkage to PEG
chains. The peak separations for these two redox couples were approximately
0.09 V for V2+/V+• and 0.11 V for V+•/V0, indicating that V2+/V+• is a more
reversible redox couple than V+•/V0. The potential values obtained for both redox
couples were consistent with the previously published work.71
Figure 4.13 Cyclic voltammogram of viologen polymer using Ag plate as AE and RE, and Pt as the working electrode.
-8.00
-7.00
-6.00
-5.00
-4.00
-3.00
-2.00
-1.00
0.00
1.00
2.00
-0.9 -0.8 -0.7 -0.6 -0.5 -0.4 -0.3 -0.2
Cur
rent
/ 1e-
9A
Potential/ V
V2+/V+•
VV+•/V0

62
4.4.3 FTIR Spectroscopy Results
The structure of the viologen-PEG polymer was also determined by FTIR
spectroscopy. The overlapped FTIR spectra of 4,4’-bipyridine, PEG-400, and
viologen polymer are shown in Figure 4.14. The spectra of both PEG (Fig. 4.14a,
b) and viologen polymer show absorption bands at 1094 cm-1 and at 2865 cm-1.
The band at 1094 cm-1 corresponds to the C-O stretch mode of the ether group of
PEG and band at 2865 cm-1 corresponds to sp3 hybridized C-H symmetric bond
stretch of PEG backbone. The FTIR spectra of both viologen polymer and 4,4’-
bipyridine (Fig. 4.14b, c) show absorption band at 3024 cm-1 corresponding to
sp2 hybridized C-H bond stretch due to pyridine rings. In addition, the FTIR
spectrum of viologen polymer (Fig 4.14b) shows absorption bands at 1192 (R-N+)
and 1008 cm-1 (S-O), corresponding to R-N stretch mode of the linkage (between
PEG and viologen moieties) and sulfonate group of tosylates. All these values
were consistent with previously published work.58,62,72 Consequently, it was
confirmed that the viologen moieties were covalently attached to PEG chains.

63
Figure 4.14 FTIR spectra of (a) PEG-400, (b) viologen polymer and (c) 4,4’-bipyridine.
4.5 Conclusions
The viologen-polyethylene glycol polymer was successfully synthesized using
tosylated PEG and 4,4’-bipyridine. It was observed that the tosylation reaction is
the most sensitive and critical step in the synthesis of viologen polymer. The
tosylation was only achieved using pyridine and dry chemical reagents, indicating
that tosylation step is moisture sensitive and requires a weaker base. The

64
moisture can lead to the hydrolysis of p-toluenesulfonyl chloride and any strong
base, including water and hydroxide can readily react with p-toluenesulfonyl
chloride.
The redox properties of the V-PEG polymer were also successfully analyzed
using cyclic voltammetry, as CV graphs showed clear two sets of
oxidation/reduction peaks. Based on these results, this polymer was used as a
redox additive polyelectrolyte in the proposed oxidation-half cell of the hybrid
supercapacitor. It was also tethered to the oxidized-SWCNTs, to increase their
exposed surface area. The functionalization of oxidized-SWCNTs with V-PEG
polymer is discussed in the following chapter.

65
: FUNCTIONALIZATION OF OXIDIZED SINGLE-WALLED CARBON NANOTUES WITH V-PEG POLYMER
5.1 Introduction
As discussed in Chapter 2, carbon nanotubes (CNTs) possess limited
solubility and processability due to their association in bundles, which is caused
by the van der Waals interactions between their sidewalls. To circumvent these
issues, the CNTs are commonly functionalized with different chemical groups.
Grafting polymers on the surface of CNTs not only improves their solubility, but
also increases their exposed surface area, even at a low degree of
functionalization.73,74 So, in an effort to increase the exposed surface area of the
oxidized single-walled carbon nanotubes (o-SWCNTs), they were covalently
functionalized with V-PEG polymer.
To carry out this functionalization, the surface-bound carboxylic groups on
oxidized-SWCNTs were first modified into reactive acyl chlorides using oxalyl
chloride and N,N-Dimethylformamide (DMF), as shown in Scheme 5.1.75,76 This
reaction is critical because acyl chlorides are very reactive and can be used to
form ester linkages between oxidized-SWCNTs and V-PEG polymer. The
mechanism of acyl chloride formation using oxalyl chloride is shown in Scheme
5.2. In this reaction, DMF (5.20) reacts with oxalyl chloride (5.21) to give an
iminium intermediate (5.22), which in turn reacts with the carboxylic acid to form
an acyl chloride (5.23).77

66
Scheme 5.1 Acyl chlorination of oxidized-SWCNTs.
Scheme 5.2 Mechanism of acyl chloride formation using oxalyl chloride.
After the acyl chlorination, the oxidized-SWCNTs were mixed with V-PEG
polymer, so that the acyl groups can react with the end hydroxyl groups (-OH) of
V-PEG polymer, to form ester linkages, as shown in Scheme 5.3. The
experimental conditions for these reactions are discussed in detail in the
following section.

67
Scheme 5.3 Grafting of viologen polymer to acyl-chlorinated SWCNTs.
5.2 Experimental Section
5.2.1 Materials
Oxalyl chloride and DMF were purchased from Sigma-Aldrich Inc. All
reactions were carried out under an inert nitrogen atmosphere in an oven-dried
three-neck glassware fitted with rubber septa. Teflon-coated magnetic stir bars
were used for stirring and dry liquid reagents and solvents were transferred using
glass syringes
5.2.2 Experimental Procedures
5.2.2.1 Grafting SWCNTs with V-PEG Polymer
70 mg of oxidized-SWCNTs was first dispersed in 30 mL of
dimethylformamide (DMF) by a 15-minute sonication treatment. Then the
resulting mixture was stirred in an ice-bath for 30 minutes. Next, 2 ml of oxalyl
chloride was added dropwise to the dispersion of oxidized-SWCNTs. The
reaction mixture was stirred in an ice bath for 3 hours and then at room
temperature for 12 hours. Finally, the temperature was raised to 80 ºC and the
mixture was stirred overnight to remove excess oxalyl chloride. Next, the
Ester linkage

68
previously prepared V-PEG polymer (0.08 mmol, 70 mg) was dissolved in DMF
and added to the SWCNT suspension. The mixture was stirred at 100 ºC for 5
days. After cooling to room temperature, the solvent was evaporated using a
rotary evaporator. The remaining black solid was dried under vacuum and used
without further purification.
5.3 Characterization Techniques
The presence of ester linkages between SWCNTs and V-PEG polymer was
analyzed using FTIR spectroscopy. The FTIR spectrum was measured on a
Nicolet 6700 FT-IR spectrometer. The electrochemical behavior of the obtained
product was investigated using cyclic voltammetry (CV). CV experiments were
performed using CH 660 or PAR 263A electrochemical analyzer. The apparatus
setup for CV analysis is depicted in Figure 5.1. Analysis was done using a 10 µm
Pt working electrode (WE) and a thin silver plate as both auxiliary and reference
electrode (AE, RE). A Teflon block was used to hold the WE on top of the silver
plate with the V-PEG polymer/SWCNTs composite between them. A few drops of
electrolyte were also added to the SWCNT-polymer matrix before conducting CV
experiments.

69
Figure 5.1 CV setup for analysis of the SWCNTs/V-PEG polymer composite.
5.4 Results and Discussion
5.4.1 Cyclic Voltammetry Results
Cyclic voltammetry of SWCNTs/ V-PEG polymer composite, prepared with a
few drops of 0.1 M LiClO4/Acetonitrile (ACN), was performed at room
temperature. The potential of the Pt ultramicroelectrode (10 µm) was swept
between -0.2 V and -1.0 V, at a scan rate of 0.01 V s-1, versus an Ag quasi-
reference plane to which both reference and auxiliary electrodes were
connected. This two-electrode experiment is possible because of the low
currents at the 10 µm working electrode. In the resulting CV graph (Fig. 5.2), one
sigmoidal and one half-sigmoidal curve was observed, corresponding to redox

70
couples V+•/V0 and V2+/V+•. The apparent diffusion coefficients of V+•/V0 and
V2+/V+• were calculated to be 1.72×10⁻⁶ cm2 s-1 and 5.6×10⁻⁷ cm2 s-1 using radial
diffusion equation (Equation 1.11 in Chapter 4). This redox behavior strongly
suggests a continuous SWCNTs/V-PEG composite phase with good ionic and
electronic conductivity.
Figure 5.2 Cyclic voltammogram of SWCNTs/V-PEG polymer composite using Pt ultramicroelectrode.
5.4.2 FTIR Spectroscopy Results
FTIR spectroscopy was used to confirm the presence of ester linkages
between V-PEG polymer and oxidized-SWCNTs. The overlapped FTIR spectra
of oxidized-SWCNTs (Figure 5.3a), SWCNT/V-PEG polymer composite (Fig
5.3b), and V-PEG polymer (Fig 5.3c, in the inset) are shown in Figure 5.3. The
-5.50
-5.00
-4.50
-4.00
-3.50
-3.00
-2.50
-2.00
-1.50
-1.00
-0.50
-1 -0.9 -0.8 -0.7 -0.6 -0.5 -0.4 -0.3 -0.2
Cur
rent
/ 1e
-7 A
Potential/ V
V2+/V+•
VV+•/V0

71
spectrum of oxidized-SWCNTs shows absorption bands at 1650 cm-1 (carboxyl
functional group), near ~2100 cm-1 (C=C stretch mode of carbon nanotubes) and
near 3000 cm-1 (O-H, hydroxyl functional group). The spectrum SWCNTs/V-PEG
polymer shows absorption bands near ~2100 cm-1 and ~3000 cm-1, similar to
oxidized-SWCNTs. In addition, it shows an absorption band at 1666 cm-1 which
might be due to the ester linkages between SWCNTs and V-PEG polymer (C=O
stretch of ester bonding). But the spectrum of V-PEG polymer also shows an
absorption band at 1632 cm-1, which might have blue-shifted in the spectrum of
the SWCNTs/V-PEG polymer composite, as shown in the inset (Fig. 5.3b, c).
Based on these results, it was difficult to confirm the presence of ester bonds
between V-PEG polymer and oxidized-SWCNTs.

72
Figure 5.3 FTIR spectra of (a) o-SWCNTs, (b) SWCNTs/V-PEG polymer composite, and (c) V-PEG polymer.
5.5 Conclusions
The results obtained from FTIR spectroscopy were ambiguous with respect to
confirming the final polymer structure, but the CV graphs showed two sets of
oxidation/reduction peaks. Based on these results, the composite of o-SWCNTs
and V-PEG polymer was used as such in the oxidation half-cell of the proposed
hybrid supercapacitor, without further characterization. As the absence or
presence of ester linkages between SWCNTs and V-PEG polymer is not
expected to affect the performance of the cell.

73
: CELL FABRICATION AND CHARACTERIZATION
6.1 Introduction
In an attempt to develop a hybrid supercapacitor, the SWCNTs/V-PEG
polymer composite was combined with a SWCNTs/ Fc-PEG polymer composite.
The SWCNTs/ Fc-PEG polymer composite was synthesized and characterized
by Shalaka Rahangdale. In this composite, ferrocene dicarboxylic acid centers
were covalently incorporated in the polymer backbone of poly(ethylene glycol)
(MW=400) through ester linkages to increase their solubility.26 Both of these
polymer composites were combined in a sandwich configuration with 19 porous
polycarbonate membranes between them to form a two-electrode cell, as shown
in Figure 6.1.
Figure 6.1 The schematic representation of the supercapacitor cell with SWCNTs/Fc-PEG polymer and SWCNTs/V-PEG polymer composites.

74
A few drops of 0.1 M solution of lithium perchlorate in dry acetonitrile were
also added to both half-cells to ensure sufficient conductivity. During charging,
the ferrocene dicarboxylic acid (Fc) centers in the PEG backbone get oxidized
and release electrons. These electrons move through an external circuit towards
the other half-cell containing viologen species. The SWCNTs conduct these
electrons towards the viologen centers, resulting in their reduction. In addition,
the charge is also stored at the interface of SWCNTs and polymer electrolytes by
electrostatic means, as discussed in Chapter 1. Opposite charges reside on two
different layers. In the oxidation half-cell, a positive set resides on the SWCNTs
and a negative set of charge due to perchlorate ions in the electrolyte. In the
reduction half-cell, a negative set of charge resides on the SWCNTs and a
positive set of charge due to lithium ions in the electrolyte as shown in Figure 6.1.
During the discharge process, when the voltage source is removed and the
cell is connected to an external load, the role of viologen and Fc gets reversed in
the sense that viologen gives up electrons and Fc gets reduced. The process of
charging and discharging can be expressed as equations,
During charging, at the positive electrode:
EX+A-⟶EX+∥A-+e-
Fc ⟶ Fc++ e-
During discharging, at the positive electrode:
EX+∥ A-+ e-⟶EX+ A-
Fc++ e-⟶ Fc

75
During charging, at the negative electrode:
Ey+ C++ e-⟶Ey-∥ C+
V2++ e-⟶ V+
During discharging, at the negative electrode:
Ey-∥ C+⟶E
y+ C++ e-
V+⟶ V2++ e-
Here Ex and Ey denotes the SWCNTs, A- and C+ the perchlorate and the
lithium ions and ∥ indicates an intimate association between ion and SWCNT-
electrode at the electrode/electrolyte interface.
6.2 Cell Fabrication Procedure
6.2.1 Cell Fabrication Materials
The materials used to assemble the cell included a SWCNTs/V-PEG polymer
composite, a SWCNTs/Fc-PEG polymer composite, aluminium current collectors,
platinum foil, polycarbonate membrane separators of pore size 0.6 µm, silicon
gaskets, an aluminium C-clamp and a 0.1 M solution of lithium perchlorate in dry
acetonitrile.
6.2.2 Cell Assembly
To assemble the cell, two square-shaped aluminium current collectors with
platinum cavities in the center were used to hold the SWCNTs/V-PEG and
SWCNTs/Fc-PEG polymer composites. The platinum cavities were formed by
first attaching the silicon gaskets (with square cutouts in the center) to the

76
surface of aluminum current collectors, and then inserting platinum foil pieces
inside the obtained cavities, as shown in Figure 6.2.
Figure 6.2 Aluminum current collector with a platinum cavity.
The SWCNTs/V-PEG and SWCNTs/Fc-PEG polymer composites were mixed
with few drops of 0.1 M solution of lithium perchlorate in dry acetonitrile
separately to form two homogeneous mixtures. These two mixtures were
deposited in the platinum cavities of two separate aluminum current collectors.
These current collectors were then combined in a sandwich configuration with 19
porous polycarbonate membranes between them (pore size 0.6 µm). They were
tightly clamped using a C-clamp to form a prototype cell. The whole process of
fabrication is demonstrated in Figure 6.3.

77
Figure 6.3 Schematic of prototype cell fabrication procedure.
6.3 Cell Characterization
The electrochemical characterization of the prototype cell was done using
cyclic voltammetry (CV) and chronoamperometry (CA). All the CV experiments
were performed using CH 660 electrochemical analyzer and all the CA
experiments were performed using EG&G 263A potentiostat/Galvanostat. The
apparatus setup for both the CV and CA analysis is depicted in Figure 6.4. In all
the experiments, the current collector with SWCNTs/Fc-PEG polymer composite
in its Pt cavity was connected with the working electrode and the current collector
with SWCNTs/V-PEG polymer composite in its Pt cavity was connected to both
the auxiliary and reference electrodes. The theoretical aspects of CA are also
discussed briefly in the following section.

78
Figure 6.4 Electrochemical setup for analysis of the prototype cell.
6.3.1Chronoamperometry
Chronoamperometry can be defined as the study of the variation of current
response with time under potentiostatic control. It is a commonly used
electroanalytical technique, useful for determining diffusion coefficients, reaction
kinetics and mechanisms. In this technique, the applied potential remains
constant over a period of time and afterwards the applied potential is set to a
different constant value, either in the potential range of the Faradaic reaction
under study or outside this range to recover initial equilibrium conditions. Based
on the number of potential pulses applied before recovering the equilibrium

79
conditions, this technique is classified as single-, double-, and triple-pulse
chronoamperometry.78,79 The corresponding current response is recorded at the
end of these potential pulses as a function of time, as shown in Figure 6.5.
Figure 6.5 (a) Potential waveform and (b) the signal for double pulse chronoamperometry.
From the current vs the time graph, the concentration gradient at the
electrode surface can be studied. A large current is initially observed which then
gradually decrease due to the depletion of electroactive species at the electrode
surface. This change in current with respect to time is governed by the Cottrell
equation:
i = nFAC Dπt
Equation 1.12
Where i is the current, n is the number of electrons involved in the redox
reaction, F is Faraday's constant, A is the surface area of the (planar) electrode,
C is the concentration of the electroactive species, t is time, and D is the diffusion
coefficient. As per this equation, the current falls as t-1/2. But there is always some

80
capacitive or non-Faradaic current flowing when the potential of an electrode is
changing and it is dominant at short times.79,80 The capacitive current decay with
respect to time at a constant applied potential is governed by the equation:
i= ERu
e-t
RuCd Equation 1.13
Where Ru is an uncompensated resistance, Cd is the double layer
capacitance. As per this equation, the capacitive current decays exponentially.80
6.4 Results and Discussion
6.4.1 CV Analysis
During CV analysis of the cell, the potential of the working electrode was
swept between 0 Volts to 2 Volts at scan rates of 0.1, 0.01, and 0.005 V s-1. The
resulting voltammograms are shown in Figure 6.6. From all the CV graphs,
similar results were obtained. In the forward scan, a large current was observed,
consistent with the charging (oxidation of ferrocene dicarboxylic acid and
reduction of viologen sites). However, no reverse, discharging current was
observed in the reverse scan. The most likely contribution to this include leakage
of electrons through separator membranes between oxidation half-cell and
reduction half-cell of the prototype cell. It is also possible that irreversible redox
reactions were occurring at the aluminum electrodes, and that they dominated
the current response.

81
Figure 6.6 Cyclic voltammograms of the prototype cell at scan rate (a) 0.1 V s-1, (b) 0.01 V s-1 and (c) 0.05 V s-1.
6.4.2 Chronoamperometry Analysis
To investigate the charging and discharging currents of the prototype cell,
four double pulse CA experiments were conducted. During the analysis, two sets
of potential pulses were applied to the prototype cell, an anodic pulse set and a
cathodic pulse set. In the first experiment, the cell was equilibrated for 0.5
seconds at 0 Volts. After the current reached zero, the applied potential was
stepped from 0 V to 1 V and was held there for 0.5 seconds. Then the applied
potential was stepped down from 1 V to 0 V and was held there for 0.5 seconds

82
(0.5 seconds for cathodic pulse and 0.5 seconds for anodic pulse). Similarly,
three other double pulse CA experiments were performed in the same potential
range for 5s, 50 s, and 500 second time intervals. The resulting CA graphs are
shown in Table 6.1
Table 6.1 Chronoamperometry Graphs of the Prototype Cell.
Time Interval (s)
Chronoamperommetry graphs
0.5
5

83
50
500
In the resulting CA graphs, the current decreased gradually with increasing
time intervals. The CA graph obtained at a time interval of 500 seconds (500 s of
cathodic pulse and 500 s of anodic pulse) shows minimum capacitive current
compared to the CA graphs obtained at shorter time intervals (0.5 s, 5 s, and 50
s), as shown in Table 6.1. This occurs because the capacitive current decays
exponentially with time as compared to Faradaic current, as discussed in Section
6.3.1. Therefore, at longer time intervals mostly Faradaic current is observed. In

84
addition, the charging and discharging currents in all the CA graphs were also
observed to be unequal, as tabulated in Table 6.2. This suggested the leakage of
electrons through the separator membranes between oxidation half-cell and
reduction half-cell of the prototype cell. Also, it’s possible that there is leakage of
polymer material onto the aluminum current collectors, and that is yielding
irreversible currents.
Table 6.2 Charging-Discharging Currents of the Prototype Cell.
Time interval (seconds)
Charging current (Amperes)
Discharging current (Amperes)
0.5 1.97 × 10⁻⁴ 1.07× 10⁻⁴ 5 1.36 ×10⁻⁴ 0.81× 10⁻⁴
50 0.92×10⁻⁴ 0.72× 10⁻⁴ 500 0.68× 10⁻⁴ 0.58× 10⁻⁴
6.4 Conclusions and Future Work
The viologen moieties were successfully covalently incorporated in the
poly(ethylene glycol) backbone to form a V-PEG polymer. Cyclic voltammetry
analysis of the V-PEG polymer revealed that it has redox potentials at 0.37 V (vs
Ag/AgCl) and at 0.73 V (vs Ag/AgCl) corresponding to V2+/V+• and V+•/V0 redox
couples, rendering it as a suitable redox additive polyelectrolyte material for a
hybrid supercapacitor. Cyclic voltammetry analysis of the composite of single-
walled carbon nanotubes/V-PEG polymer revealed one sigmoidal and one half-
sigmoidal curves corresponding to V+•/V0 and V2+/V+• redox couples, strongly
suggesting a continuous SWCNTs/V-PEG polymer composite phase with good
ionic and electronic conductivity. Based on all these results, the composite of

85
SWCNTS/V-PEG polymer proves to be a suitable electrode/electrolyte phase for
its application in the oxidation half-cell of a hybrid supercapacitor.
The SWCNTs/Fc-PEG polymer was also reported to exhibit similar reversible
redox behavior as SWCNTS/V-PEG polymer. However, after the coupling of
SWCNTS/V-PEG polymer composite with a SWCNTs/Fc-PEG polymer
composite to form a prototype cell, expected electrochemical results were not
obtained. This failure may be attributable to the leakage of electrons through the
separator membranes between the half-cells of the hybrid SC. This can occur
because CNTs get shortened after prolonged acid treatment and can pass
through the separator membranes, resulting in a short circuit. To prevent this
leakage, different separator membranes with smaller pore sizes can be tested in
the future work. If the issue of leakage between both the half-cells is eliminated,
the energy density of the resulting cell is expected to be greater than
conventional supercapacitors, which do not have any redox-active species in
them.

86
REFERENCES
(1) Wang, G.; Zhang, L.; Zhang, J. A Review of Electrode Materials for Electrochemical Supercapacitors. Chem. Soc. Rev. 2012, 41, 797–828.
(2) Chen, H.; Cong, T. N.; Yang, W.; Tan, C.; Li, Y.; Ding, Y. Progress in Electrical Energy Storage System: A Critical Review. Prog. Nat. Sci. 2009, 19 (3), 291–312.
(3) Rauda, I. E.; Augustyn, V.; Dunn, B.; Tolbert, S. H. Enhancing Pseudocapacitive Charge Storage in Polymer Templated Mesoporous Materials. Acc. Chem. Res. 2013, 46 (5), 1113–1124.
(4) Luo, X.; Wang, J.; Dooner, M.; Clarke, J. Overview of Current Development in Electrical Energy Storage Technologies and the Application Potential in Power System Operation. Appl. Energy 2015, 137, 511–536.
(5) Akinyele, D. O.; Rayudu, R. K. Review of Energy Storage Technologies for
Sustainable Networks. Sustain. Energy Technol. Assessments 2014, 8, 74–91.
(6) Zhang, L. L; Zhao, X. S. Carbon-Based Materials as Supercapacitor Electrodes. Chem. Soc. Rev. 2009, 38, 2520–2531.
(7) Capacitor. https://en.wikipedia.org/wiki/Capacitor (accessed Aug 15, 2017).
(8) Conway, B. E. Electrochemical Supercapacitors: Scientific Fundamentals and Technological Applications; Kluwer-Academic/ Plenum Publisher: New York, 1999; pp 11- 31.
(9) Battery. https://en.wikipedia.org/wiki/Battery_(electricity) (accessed Aug 16, 2017).
(10) Gummow, R. J. Li2MnSiO4 Nanostructured Cathodes for Rechargeable Lithium-Ion Batteries. In Nanomaterials in Advanced Batteries and Supercapacitors; Ozoemena, K. I.; Chen, S.; Nanostructure Science and Technology; Springer International: Switzerland, 2016; pp 25-54.
(11) Etacheri, V.; Marom, R.; Elazari, R.; Salitra, G.; Aurbach, D. Challenges in the Development of Advanced Li-Ion Batteries: A Review. Energy Environ. Sci. 2011, 4, 3243-3262
(12) Liu, C.; Neale, Z. G.; Cao, G. Understanding Electrochemical Potentials of Cathode Materials in Rechargeable Batteries. Mater. Today 2016, 19 (2),
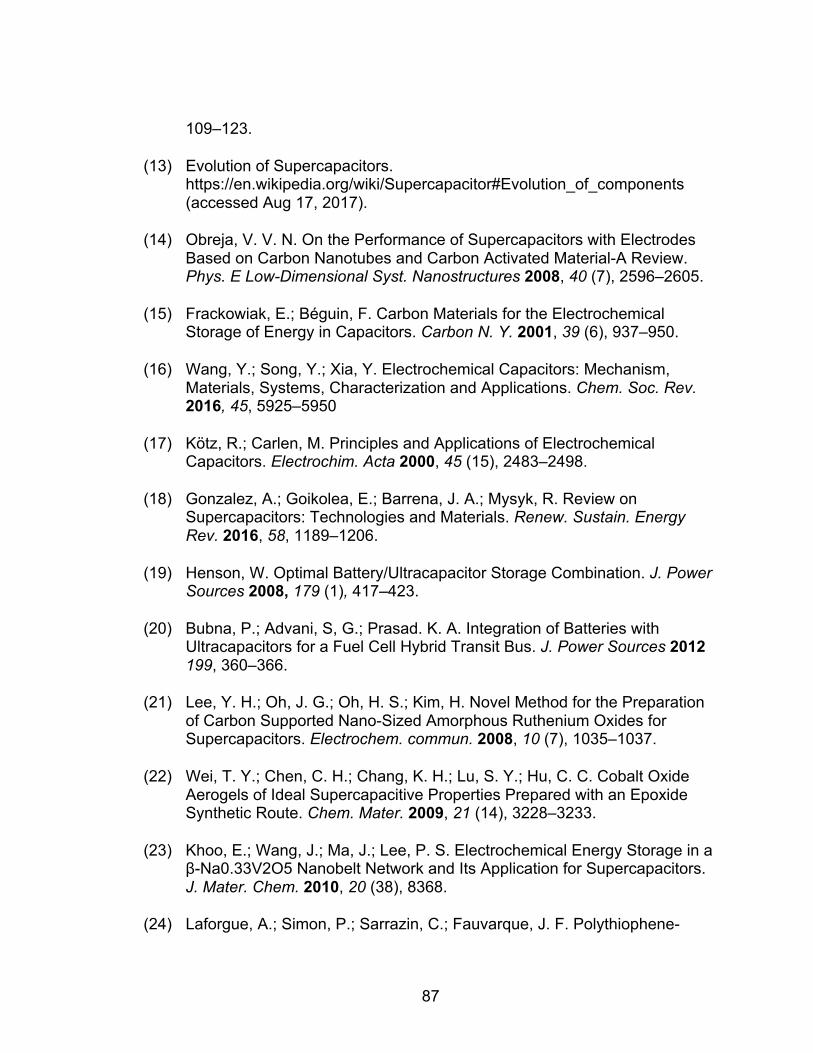
87
109–123.
(13) Evolution of Supercapacitors. https://en.wikipedia.org/wiki/Supercapacitor#Evolution_of_components (accessed Aug 17, 2017).
(14) Obreja, V. V. N. On the Performance of Supercapacitors with Electrodes Based on Carbon Nanotubes and Carbon Activated Material-A Review. Phys. E Low-Dimensional Syst. Nanostructures 2008, 40 (7), 2596–2605.
(15) Frackowiak, E.; Béguin, F. Carbon Materials for the Electrochemical Storage of Energy in Capacitors. Carbon N. Y. 2001, 39 (6), 937–950.
(16) Wang, Y.; Song, Y.; Xia, Y. Electrochemical Capacitors: Mechanism, Materials, Systems, Characterization and Applications. Chem. Soc. Rev. 2016, 45, 5925–5950
(17) Kötz, R.; Carlen, M. Principles and Applications of Electrochemical Capacitors. Electrochim. Acta 2000, 45 (15), 2483–2498.
(18) Gonzalez, A.; Goikolea, E.; Barrena, J. A.; Mysyk, R. Review on Supercapacitors: Technologies and Materials. Renew. Sustain. Energy Rev. 2016, 58, 1189–1206.
(19) Henson, W. Optimal Battery/Ultracapacitor Storage Combination. J. Power Sources 2008, 179 (1), 417–423.
(20) Bubna, P.; Advani, S, G.; Prasad. K. A. Integration of Batteries with Ultracapacitors for a Fuel Cell Hybrid Transit Bus. J. Power Sources 2012 199, 360–366.
(21) Lee, Y. H.; Oh, J. G.; Oh, H. S.; Kim, H. Novel Method for the Preparation of Carbon Supported Nano-Sized Amorphous Ruthenium Oxides for Supercapacitors. Electrochem. commun. 2008, 10 (7), 1035–1037.
(22) Wei, T. Y.; Chen, C. H.; Chang, K. H.; Lu, S. Y.; Hu, C. C. Cobalt Oxide Aerogels of Ideal Supercapacitive Properties Prepared with an Epoxide Synthetic Route. Chem. Mater. 2009, 21 (14), 3228–3233.
(23) Khoo, E.; Wang, J.; Ma, J.; Lee, P. S. Electrochemical Energy Storage in a β-Na0.33V2O5 Nanobelt Network and Its Application for Supercapacitors. J. Mater. Chem. 2010, 20 (38), 8368.
(24) Laforgue, A.; Simon, P.; Sarrazin, C.; Fauvarque, J. F. Polythiophene-

88
Based Supercapacitors. J. Power Sources 1999, 80 (1), 142–148.
(25) Senthilkumar, S. T.; Selvan, R. K.; Melo, J. S. Redox Additive/active Electrolytes: A Novel Approach to Enhance the Performance of Supercapacitors. J. Mater. Chem. A 2013, 1 (40), 12386–12394.
(26) Rahangdale, S. Preparation and Characterization of a Ferrocene containing Main-Chain PEG-CNTs Phase for Hybrid Supercapacitor Application. M.S Thesis, San Jose State Univeristy, San Jose, CA, 2017.
(27) Sharma, P.; Bhatti, T. S. A Review on Electrochemical Double-Layer Capacitors. Energy Convers. Manag. 2010, 51 (12), 2901–2912.
(28) Thostenson, E. T.; Ren, Z.; Chou, T.-W. Advances in the Science and Technology of Carbon Nanotubes and Their Composites: A Review. Compos. Sci. Technol. 2001, 61 (13), 1899–1912.
(29) Sarangdevot, K.; Sonigara, B. S. The Wondrous World of Carbon Nanotubes: Structure, Synthesis, Properties and Applications. J. Chem. Pharm. Res. 2015, 7 (6), 916–933.
(30) Hirsch, A. Functionalization of Single-Walled Carbon Nanotubes. Angew. Chemie - Int. Ed. 2002, 41 (11), 1853–1859.
(31) Tasis, D.; Tagmatarchis, N.; Bianco, A.; Prato, M. Chemistry of Carbon Nanotubes. Chem. Rev. 2006, 106 (3), 1105–1136.
(32) Zhao, B.; Hu, H.; Yu, A.; Perea, D.; Haddon, R. C. Synthesis and Characterization of Water Soluble Single-Walled Carbon Nanotube Graft Copolymers. J. Am. Chem. Soc. 2005, 127 (22), 8197–8203.
(33) Béguin, F.; Presser, V.; Balducci, A.; Frackowiak, E. Carbons and Electrolytes for Advanced Supercapacitors. Adv. Mater. 2014, 26 (14), 2219–2251.
(34) Senthilkumar, S. T.; Selvan, R. K.; Melo, J. S. Redox Additive/Active Electrolytes: A Novel Approach to Enhance the Performance of Supercapacitors. J. Mater. Chem. A 2013, 1 (40), 12386.
(35) Zhong, C.; Deng, Y.; Hu, W.; Qiao, J.; Zhang, L.; Zhang, J. A Review of Electrolyte Materials and Compositions for Electrochemical Supercapacitors. Chem. Soc. Rev. 2015, 44 (21), 7484–7539.
(36) Xu, K. Nonaqueous Liquid Electrolytes for Lithium-Based Rechargeable
89
Batteries. Chem. Rev. 2004, 104 (10), 4303–4417.
(37) Muench, S.; Wild, A.; Friebe, C.; Haupler, B.; Janoschka, T.; Schubert, U. S. Polymer-Based Organic Batteries. Chem. Rev. 2016, 116 (16), 9438–9484.
(38) Lieder, M.; Schla¨Pfer, C. W. Synthesis and Electrochemical Properties of New Viologen Polymers. J. Appl. Electrochem. 1997, 27 (2), 235–239.
(39) Najafi, E.; Kim, J. Y.; Han, S. H.; Shin, K. UV-Ozone Treatment of Multi-Walled Carbon Nanotubes for Enhanced Organic Solvent Dispersion. Colloids Surfaces A Physicochem. Eng. Asp. 2006, 284–285, 373–378.
(40) Li, M.; Boggs, M.; Beebe, T. P.; Huang, C. P. Oxidation of Single-Walled Carbon Nanotubes in Dilute Aqueous Solutions by Ozone as Affected by Ultrasound. Carbon N. Y. 2008, 46 (3), 466–475.
(41) Peng, K.; Liu, L. Q.; Li, H.; Meyer, H.; Zhang, Z. Room Temperature Functionalization of Carbon Nanotubes Using an Ozone/Water Vapor Mixture. Carbon N. Y. 2011, 49 (1), 70–76.
(42) Georgakilas, V.; Kordatos, K.; Prato, M.; Guldi, D. M.; Holzinger, M.; Hirsch, A. Organic Functionalization of Carbon Nanotubes. J. Am. Chem. Soc. 2002, 124, 760-761.
(43) Zhang, J.; Zou, H.; Qing, Q.; Yang, Y.; Li, Q.; Liu, Z. Effect of Chemical Oxidation on the Structure of Single-Walled Carbon Nanotubes. J. Phys. Chem. B 2003, 107(16), 3712–3718.
(44) Yu, H.; Jin, Y.; Peng, F.; Wang, H.; Yang, J. Kinetically Controlled Side-Wall Functionalization of Carbon Nanotubes by Nitric Acid Oxidation. J. Phys. Chem. C 2008, 112 (17), 6758–6763.
(45) Banerjee, S.; Hemraj-Benny, T.; Wong, S. S. Covalent Surface Chemistry of Single-Walled Carbon Nanotubes. Adv. Mater. 2005, 17 (1), 17–29.
(46) Raman Spectroscopy. https://en.wikipedia.org/wiki/Raman_spectroscopy (accessed August 28, 2017).
(47) Bumbrah, G. S.; Sharma, R. M. Raman Spectroscopy – Basic Principle, Instrumentation and Selected Applications for the Characterization of Drugs of Abuse. Egypt. J. Forensic Sci. 2016, 6 (3), 209–215.
(48) Braz, A.; López-López, M.; García-Ruiz, C. Raman Spectroscopy for

90
Forensic Analysis of Inks in Questioned Documents. Forensic Sci. Int. 2013, 232 (1–3), 206–212.
(49) Moura, C. C.; Tare, R. S.; Oreffo, R. O. C.; Mahajan, S. Raman Spectroscopy and Coherent Anti-Stokes Raman Scattering Imaging: Prospective Tools for Monitoring Skeletal Cells and Skeletal Regeneration. J. R. Soc. Interface 2016, 13, 9–11.
(50) Dresselhaus, M. S.; Jorio, A.; Hofmann, M.; Dresselhaus, G.; Saito, R. Perspectives on Carbon Nanotubes and Graphene Raman Spectroscopy. Nano Lett. 2010, 10 (3), 751–758.
(51) Kim, U. J.; Furtado, C. A.; Liu, X.; Chen, G.; Eklund, P. C. Raman and IR Spectroscopy of Chemically Processed Single-Walled Carbon Nanotubes. J. Am. Chem. Soc. 2005, 127 (44), 15437–15445.
(52) Schmitt, J.; Flemming, H. C. FTIR-Spectroscopy in Microbial and Material Analysis. Int. Biodeterior. Biodegradation 1998, 41 (1), 1–11.
(53) Attenuated Total Reflectance. https://en.wikipedia.org/wiki/Attenuated_total_reflectance (accessed August 27, 2017).
(54) Hussain, S. Spectroscopic Investigation of Modified Single Wall Carbon Nanotube (SWCNT). J. Mod. Phys. 2011, 2 (6), 538–543.
(55) Michaelis, L.; Hill, E.S. The Viologen Indicators. J. Gen. Physiol. 1933, 16, 859–873.
(56) Tokue, H.; Oyaizu, K.; Sukegawa, T.; Nishide, H. TEMPO/Viologen Electrochemical Heterojunction for Diffusion-Controlled Redox Mediation: A Highly Rectifying Bilayer-Sandwiched Device Based on Cross-Reaction at the Interface between Dissimilar Redox Polymers. ACS Appl. Mater. Interfaces 2014, 6 (6), 4043–4049.
(57) Dam, H. T. V.; Ponjeé, J. J. Electrochemically Generated Colored Films of Insoluble Viologen Radical Compounds. J. Electrochem. Soc. 1974, 121 (12), 1555.
(58) Bhowmik. P. K.; Akhter, S.; Han, H. Thermotropic Liquid Crystalline Main-Chain Viologen Polymers. Polym. Chem. 1995, 33, 1927-1933.
(59) Bhowmik, P. K.; Han, H.; Cebe, J. J.; Burchett, R. A.; Sarker, A. M. Main-Chain Viologen Polymers with Organic Counterions Exhibiting

91
Thermotropic Liquid-Crystalline and Fluorescent Properties. J. Polym. Sci. Part A Polym. Chem. 2002, 40 (5), 659–674.
(60) Awada, H.; Daneault, C. Chemical Modification of Poly(Vinyl Alcohol) in Water. Appl. Sci. 2015, 5 (4), 840–850.
(61) Hatazaw, T.; Terrill, R. H.; Murray, R. W. Microelectrode Voltammetry and Electron Transport in an Undiluted Room Temperature Melt of an Oligo(ethyleneglycol )-Tailed Viologen. Ana. Chem. 1996, 68 (4), 597–603.
(62) Endo, T.; Kameyama, A.; Mambu, Y.; Kashi, Y.; Okawara, M. Synthesis of Polyethers Containing Viologen Moiety and Their Application to Electron-Transfer Catalyst. J. Polym. Sci. Part A Polym. Chem. 1990, 28 (9), 2509–2516.
(63) Nuclear Magnetic Resonance Spectroscopy. https://www2.chemistry.msu.edu/faculty/reusch/virttxtjml/spectrpy/nmr/nmr1.htm (accessed Sep 5, 2017).
(64) University of California Chemistry Gopher Site. http://www.chem.ucla.edu (Accessed September 5, 2017).
(65) Macomber, R. S. A Complete Introduction to Modern NMR Spectroscopy; John Wiley & Sons: New York, 1997; pp 68-88.
(66) Mabbott, G. A. An Introduction to Cyclic Voltammetry. J. Chem. Educ. 1983, 60 (9), 697.
(67) Van Benschoten, J. J.; Lewis, J. Y.; Heineman, W. R.; Roston, D. A.; Kissinger, P. T. Cyclic Voltammetry Experiment. J. Chem. Educ. 1983, 60 (9), 772.
(68) Kissinger, P. T.; Heineman, W. R. Cyclic Voltammetry. J. Chem. Educ. 1983, 60 (9), 702.
(69) Ching, S.; Dudek, R.; Tabet, E. Cyclic Voltammetry with Ultramicroelectrodes. J. Chem. Educ. 1994, 71, 602–605.
(70) Mahou, R.; Wandrey, C. Versatile Route to Synthesize Heterobifunctional Poly(ethylene Glycol) of Variable Functionality for Subsequent Pegylation. Polymers. 2012, 4 (1), 561–589.
(71) Tahara, H.; Baba, R.; Iwanaga, K.; Sagara, T.; Murakami, H. Active

92
Ferrocene – Viologen Linked Ionic Liquid. Chem. Commun. 2017, 1–4.
(72) Jung, D. H.; Ko, Y. K.; Jung, H. T. Aggregation Behavior of Chemically Attached Poly(Ethylene Glycol) to Single-Walled Carbon Nanotubes (SWNTs) Ropes. Mater. Sci. Eng. C 2004, 24 (1–2), 117–121.
(73) Bilalis, P.; Katsigiannopoulos, D.; Avgeropoulos, A.; Sakellariou, G. Non-Covalent Functionalization of Carbon Nanotubes with Polymers. RSC Adv. 2014, 4 (6), 2911–2934.
(74) Ma, P. C.; Siddiqui, N. A.; Marom, G.; Kim, J. K. Dispersion and Functionalization of Carbon Nanotubes for Polymer-Based Nanocomposites: A Review. Compos. Part A Appl. Sci. Manuf. 2010, 41 (10), 1345–1367.
(75) Ni, Y.; Hu, H.; Malarkey, E. B.; Zhao, B.; Montana, V.; Haddon, R. C.; Parpura, V. Chemically Functionalized Water Soluble Single-Walled Carbon Nanotubes Modulate Neurite Outgrowth. J. Nanosci. Nanotechnol. 2005, 5 (10), 1707–1712.
(76) Zhao, B.; Hu, H.; Haddon, R. C. Synthesis and Properties of a Water-Soluble Single-Walled Carbon Nanotube–Poly(m-Aminobenzene Sulfonic Acid) Graft Copolymer. Adv. Funct. Mater. 2004, 14 (1), 71–76.
(77) Acyl Chlorides. https://en.wikipedia.org/wiki/Acyl_chloride (accessed Jan 1, 2017).
(78) Laborda, E.; González, J.; Molina, Á. Recent Advances on the Theory of Pulse Techniques: A Mini Review. Electrochem. commun. 2014, 43, 25–30.
(79) Hyk, W.; Stojek, Z. Direct Determination of Diffusion Coefficients of Substrate and Product by Chronoamperometric Techniques at Microelectrodes for Any Level of Ionic Support. Anal. Chem. 2002, 74, 149–157.
(80) Denuault, G.; Mirkin, M. V.; Bard, A. J. Direct Determination of Diffusion Coefficients by Chronoamperometry at Microdisk Electrodes. J. Electroanal. Chem. Interfacial Electrochem. 1991, 308, 27–38