prepared by: advanced environmental star_shopping... · the building cooling load, the static...
TRANSCRIPT
Green Building Council of Australia Page 1 of 29
Green Star – Shopping Centre Design PILOT
Energy Calculator Guide
Prepared by: Advanced Environmental

Green Building Council of Australia Page 2 of 29
EXECUTIVE SUMMARY The Green Star Shopping Centre Design Rating Tool has been developed to evaluate the predicted performance of retail shopping centres based on a variety of environmental criteria. The Energy Credit Calculator within this tool will compare the predicted energy consumption of a shopping centre design to a benchmark. This comparison will then be used to award points to any centre which improves on the benchmark.
To use the calculator the predicted energy consumption of the centre must be calculated. Important components of this calculation are the heating and cooling energy consumption of the centre, which must be determined using computer modelling. This guide specifies standard inputs to be used when modelling the heating, ventilation and cooling (HVAC) systems of the centre. The standard inputs include operational profiles and internal heat loads which facilitate comparison between different centres.
This Simulation Methodology is to be used to guide the entire energy modelling process, as it specifies standard inputs. The standard inputs include operational profiles and lighting densities which facilitate comparison between different shopping centre designs.
The predicted ancillary load energy consumption, such as that from lighting, mechanical ventilation and lifts, must also calculated. This guide includes details on how to calculate these loads in such a way that they can be fairly compared to the benchmark.
Finally, this guide includes information on how to enter the simulation outputs and the ancillary load calculations into the Shopping Centre Design Energy Credit Calculator. The calculator compares the performance of the centre relative to set benchmarks. Information on how these benchmarks were set can be found in The Shopping Centre Design “Benchmarking Methodology” document.

Green Building Council of Australia Page 3 of 29
TABLE OF CONTENTS Guidelines for Simulation Input Parameters ..................................................................... 5
General Parameters....................................................................................................... 5 Building Envelope.......................................................................................................... 7 Internal Loads................................................................................................................ 9 A/C Pumping ............................................................................................................... 11 HVAC System Simulations .......................................................................................... 12 HVAC Controls ............................................................................................................ 14
Ancillary Services ............................................................................................................ 16 Guidelines for simulation outputs ................................................................................... 18 Case Study – On-site Energy Generation ....................................................................... 19
LIST OF FIGURES Figure 1: Screenshot of the energy calculator .............................................................................. 18 Figure 2: Entry of case study into the calculator........................................................................... 20
Issue/Status Revision Date Issued Author Checked Approved Comment
Draft for Review
A April 2006 MA MCP MJ Retail Operator Review
Draft for Review
B May 2006 MA SHC MJ Peer Review
Final C June 2006 MA MJ MJ
Final r1 C September 2006
MA Update of language

Green Building Council of Australia Page 4 of 29
INTRODUCTION The Green Building Council Australia (GBCA) has developed a suite of rating tools to assess the environmental performance of buildings in Australia. As part of this package, the Green Star Shopping Centre Design Rating Tool assesses the environmental performance of shopping centres, by measuring their environmental impact. Part of this assessment of environmental performance includes determining the predicted energy consumption of a shopping centre. The Shopping Centre Design Energy Credit Calculator has been developed to compare this to a benchmark. More information on how the benchmarks were set can be found in the Benchmarking Methodology. The building must be simulated, using computer modelling, in order to determine the predicted energy consumption of its Heating, Ventilation and Cooling (HVAC) system. In addition, the predicted energy consumption of the ancillary loads in the building must be calculated. This report has been written as a guide to these calculations, and how they should be entered into the Energy Calculator for comparison.

Green Building Council of Australia Page 5 of 29
Guidelines for Simulation Input Parameters
The parameters used to simulate the HVAC energy consumption of a shopping centres is given in this section. These are standard criteria that must be adhered to in ordered to comply with the Green Star energy credit requirements. The outputs from this will then be entered in the calculator, as outlined in Section 4.
General Parameters
Modelling Parameter Requirements Documentation
Simulation Package
• Passed the BESTEST1 validation test; or • The European Union draft standard EN13791 July 2000; or • Be certified in accordance with ANSI/ASHRAE Standard 140-2001.
Please contact the Green Building Council of Australia if none of the above options can be complied with.
Energy Report: • Simulation brief for assessor
(see Appendix A).
GE
NE
RA
L
Weather Data
• A Test Reference Year (TRY) if the building location is within 50km of the TRY location; or
• In the absence of local TRY weather data, an actual year of recorded weather data from a location within 50km of the building location; or
• In the absence of TRY or actual weather data within 50km, interpolated data based upon 3 points within 250km of the building location.
Please contact the Green Building Council of Australia if none of the above options can be complied with.
Energy Report: • Type of data (TRY / year /
interpolated). • Weather station location.
1 The International Energy Agency, working with the U.S. National Renewable Energy Lab, has created a benchmark for building energy simulation programs. This
benchmark is entitled "BESTEST – International Energy Agency Building Energy Simulation Test and Diagnostic Method".

Green Building Council of Australia Page 6 of 29
Over -shadowing • Demonstrate that overshadowing from the surrounding environment
has been taken into account in the model.
Verification Documents: • Relevant architectural drawings.
Energy Report: • Details of how overshadowing
from the external environment has been represented in the model.
Table 1: General Parameters Table

Green Building Council of Australia Page 7 of 29
Building Envelope
Modelling Parameter
Requirements Documentation
Building Form
• Demonstrate that the simulation model is an accurate representation of the building's shape;
• Demonstrate that all floors in the building are modelled; and • Show that there are limited simplifications to the building form.
Verification Documents: • Relevant architectural
drawings. Energy Report: • Details of how the
building’s physical shape has been represented in the model.
• Details of any simplifications in the model and their effect.
Insulation • Demonstrate that insulation in the walls, ceiling and floors has been accurately represented.
Verification Documents: • Relevant architectural
drawings. • Materials schedule.
Energy Report: • Details on how the
insulation has been represented in the model.
Glazing
• Demonstrate that glazing is modelled using the following parameters: • Visible light transmission; • Solar transmission; • Internal and external solar reflectance; and • Emissivity.
Verification Documents: • Relevant pages from the
glazing or façade specification.
Energy Report:
Details of how glazing has been modelled.
BU
ILD
ING
EN
VE
LOP
E
Windows and Spandrel
• Demonstrate that the sizes of windows and spandrel are accurately represented.
Verification Documents: • Relevant architectural
drawings. Energy Report: • Details of the window and
spandel sizes that have been used in the model.

Green Building Council of Australia Page 8 of 29
Shading • Demonstrate that all shading of windows and external building fabric has been accurately represented.
Verification Documents: • Relevant architectural
drawings. Energy Report: • Details of how window
shading and external building fabric are represented in the model.
Orientation • Demonstrate that the building orientation has been included in the model.
Verification Documents: • Relevant architectural
drawings. Energy Report: • Details of how the
orientation has been represented in the model.
Infiltration • Demonstrate that infiltration has been modelled to reflect façade design
specification. Typical default values are 0.5 air changes per hour for perimeter zones and zero air changes per hour for central zones.
Verification Documents: • Relevant architectural
drawings. • Relevant pages from the
façade specification that show infiltration or façade sealing characteristics.
Energy Report: • Details of how infiltration
has been modelled.
Table 2: Building envelope parameters

Green Building Council of Australia Page 9 of 29
Internal Loads
Modelling Parameter Requirements Documentation
Tenancy Lighting
• Demonstrate that tenancy lighting is calculated based on floor area and 20W/m².
• Demonstrate that the lighting load is modelled using the appropriate operational profile (see Appendix C).
The lighting profile can be adjusted if the following are installed: • Occupancy sensors: Lighting must follow the appropriate
lighting profile whenever the appropriate occupancy profile is larger than 0.
• Time Clocks: If lighting operates on a time clock then common area lighting must follow the appropriate lighting profile when specified as “on” by the electrical specification. This must operate for no less time than described for the previous point.
• Daylight dimming: Details on this system must be provided
Validation Documents • Area schedule.
Energy Report: • Details of tenancy area using the definition
in Appendix B. • Details of how the lighting power density
has been modelled. • Details of how the operational profile has
been modelled.
INT
ER
NA
L L
OA
DS
Non-tenancy lighting
• Demonstrate that non-tenancy lighting is calculated based on floor area.
• Demonstrate that the appropriate operational profile (see Appendix C) has been used in the HVAC Model
Verification Documents: • Area schedule • Reflected ceiling plans with base building
lighting design. • Relevant pages from electrical
specification showing occupancy sensors (if any), time clock (if any), lights and light fittings.
Energy Report: • Details of space type areas using the
definitions in Appendix B. • Details of how the lighting power densities
have been modelled. • Details of how the operational profiles for
the building have been modelled.

Green Building Council of Australia Page 10 of 29
Tenancy equipment
• Demonstrate that tenancy equipment is calculated based upon floor area and 40W/m².
• Demonstrate that the equipment load is modelled using the operational profile as prescribed by Table 12, Appendix C.
Verification Documents: • Area schedule.
Energy Report: • Details of tenancy area using the definition
in Appendix B. • Details of how the equipment power
density has been modelled. • Details of how the operational profile has
been modelled.
Non-tenancy equipment
• Demonstrate that all non-tenancy equipment is calculated based on floor area.
• Demonstrate that the equipment loads are modelled using the operational profiles as prescribed in Appendix C.
Verification Documents: • Area schedule. • Relevant pages from base building design
brief showing equipment loads. Energy Report: • Details of space type areas using the
definitions in Appendix B. • Details of how the equipment load
densities have been calculated. • Details of how the operational profiles
have been modelled.
Tenancy occupancy
• Demonstrate that all tenancy occupancies are calculated based on floor area.
• Demonstrate that the occupancy load and profile used is that prescribed for each space type in Table 12, Appendix C.
Verification Documents: • Area schedule.
Energy Report: • Details of the tenancy area using the
definition in Appendix B • Details on how the occupancy load has
been modelled • Details on the profiles used for occupancy
Non-tenancy occupancy
• Demonstrate that all occupancies are calculated based on floor area.
• Demonstrate that the occupancy profile used is that prescribed for each space type in Appendix C.
Verification Documents: • Area schedule.
Energy Report: • Details of space type areas using the
definitions in Appendix B • Details on how the occupancy loads have
been modelled • Details on the profiles used for occupancy
Table 3: Internal loads parameters
Green Building Council of Australia Page 11 of 29
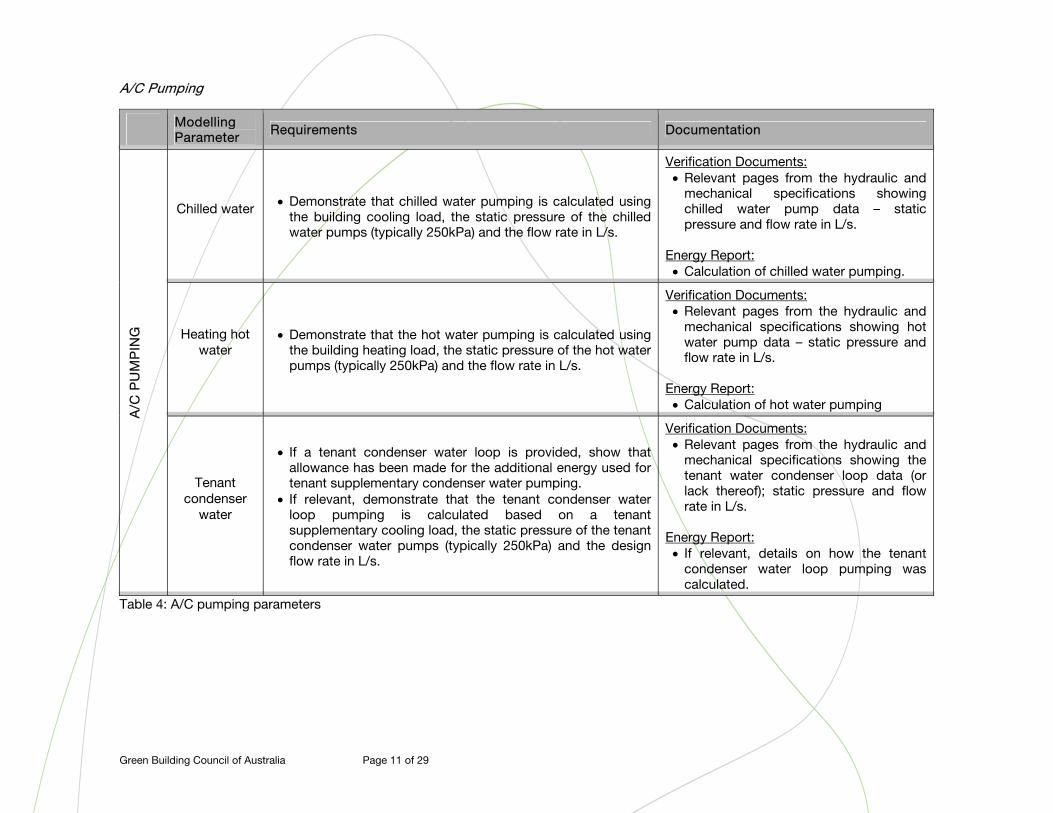
A/C Pumping
Modelling Parameter Requirements Documentation
Chilled water • Demonstrate that chilled water pumping is calculated using the building cooling load, the static pressure of the chilled water pumps (typically 250kPa) and the flow rate in L/s.
Verification Documents: • Relevant pages from the hydraulic and
mechanical specifications showing chilled water pump data – static pressure and flow rate in L/s.
Energy Report: • Calculation of chilled water pumping.
Heating hot water
• Demonstrate that the hot water pumping is calculated using the building heating load, the static pressure of the hot water pumps (typically 250kPa) and the flow rate in L/s.
Verification Documents: • Relevant pages from the hydraulic and
mechanical specifications showing hot water pump data – static pressure and flow rate in L/s.
Energy Report: • Calculation of hot water pumping
A/C
PU
MP
ING
Tenant condenser
water
• If a tenant condenser water loop is provided, show that allowance has been made for the additional energy used for tenant supplementary condenser water pumping.
• If relevant, demonstrate that the tenant condenser water loop pumping is calculated based on a tenant supplementary cooling load, the static pressure of the tenant condenser water pumps (typically 250kPa) and the design flow rate in L/s.
Verification Documents: • Relevant pages from the hydraulic and
mechanical specifications showing the tenant water condenser loop data (or lack thereof); static pressure and flow rate in L/s.
Energy Report: • If relevant, details on how the tenant
condenser water loop pumping was calculated.
Table 4: A/C pumping parameters

Green Building Council of Australia Page 12 of 29
HVAC System Simulations
Modelling Parameter Requirements Documentation
HVAC System design
• Demonstrate that the HVAC system modelled represents the system design for each part of the building.
Verification Documents: • Relevant pages from mechanical
specification describing the basic HVAC system design.
Energy Report: • Details of how the HVAC system
has been represented in the model.
Zoning • Demonstrate that all air conditioning zones represented in the
thermal model accurately reflect system performance and zonal solar diversity.
Energy Report: • Details of how the air conditioning
zones have been represented in the model.
Chiller plant
• Demonstrate that the chiller plant size is accurately reflected in the model.
• Demonstrate that the actual efficiency curves of the installed plant are used in the model.
• Water cooled equipment: Demonstrate that chiller data is specified under conditions that reflect the intended condenser water temperature controls.
• Air cooled equipment: Demonstrate that the air cooled chiller COP profiles have been accurately modelled with regard to loading and ambient conditions.
Verification Documents: • Relevant pages from the
mechanical specification showing the chiller plant size and condenser water operation.
• Documentation from chiller supplier giving part load curves (and condenser water temperatures where applicable).
Energy Report: • Details of how the chiller plant size
has been represented in the model.
• Details of how the actual efficiency curves have been used in the model.
• Details of how the chiller data is relevant to the intended condenser water temperature controls.
HV
AC
Sys
tem
Sim
ulat
ion
Boiler plant • Demonstrate that the boiler plant size, thermal efficiency and distribution efficiency are accurately reflected in the model.
Verification Documents: • Relevant pages from the
mechanical specification which

Green Building Council of Australia Page 13 of 29
show details of the boiler plant size, thermal efficiency and distribution efficiency.
Energy Report: • Details of how the boiler has been
modelled.
Supply Air and Exhaust
Fans
• Demonstrate that fan performance curves are accurately represented in the model.
• Demonstrate that index run pressure drops are accurately represented to include the total static inclusive of filters, coils and diffusers.
Verification Documents: • Pages from the mechanical
specification showing fan performance curves and fan size.
Energy Report: • Details of how the index run
pressure drops have been calculated.
• Details of how these have been modelled.
Cooling Tower Fans
• Demonstrate that allowance for energy consumption from cooling tower fans has been made, based upon the annual cooling load of the building and the supplementary cooling load for tenancy air conditioning.
Energy Report: • Details of how the cooling tower
fans have been modelled.
Cooling Tower and Condenser
Water Pumping
• Demonstrate that allowance for energy consumption from cooling tower and condenser water pumping has been made, based upon the annual cooling load of the building.
Energy Report: • Details of how the cooling tower
and condenser water pumping have been modelled.
Table 5: HVAC system simulation

Green Building Council of Australia Page 14 of 29
HVAC Controls
Modelling Parameter Requirements Documentation
Outside Air • Demonstrate that outdoor air flows have been
modelled as documented in the mechanical design drawings and specifications, and in compliance with the appropriate standards.
Verification Documents: • Relevant pages from mechanical
specification giving details on the correct minimum outside air flow
Energy Report: • Detail of how outside air flow has been
represented in the system
Economy Cycle • Demonstrate that the economy cycle has been modelled to reflect system specification noting any enthalpy/temperature cut-off and control point.
Verification Documents: • Relevant pages from mechanical
specification giving details on the economy cycle of the system
Energy Report: • Detail of how the economy cycle has been
modelled
Primary duct temperature
control
• Constant Volume Systems: Demonstrate that modelling has allowed supply air temperatures to vary to meet loads in the space
• Variable Volume Systems: Demonstrate that modelling has allowed supply air volumes to vary to meet loads in the space
• Demonstrate that setpoints have been rescheduled as specified. Note that simplifications may be made to consider average zone temperature in lieu of high/low select.
Verification Documents: • Relevant pages from mechanical
specification giving details of the design temperature and HVAC cooling and heating setpoints
Energy Report: • Detail of how design temperatures and
setpoints have been modelled
Airflow Control
• Demonstrate that control logic describing the operation of the dampers to control outside and re-circulated airflow is inherent in the model and accurately reflects the airflow characteristics of the system.
Verification Documents: • Relevant pages from the mechanical
specification giving details of the operation of the dampers to control outside and recirculated air
Energy Report: • Details of how these have been represented
in the model
HV
AC
Co
ntro
ls
Minimum • Demonstrate, where relevant, that the minimum Verification Documents:

Green Building Council of Australia Page 15 of 29
turndown turndown airflow of each air supply is accurately reflected in the model.
• Relevant pages from the mechanical specification giving details of the minimum turndown airflow of each air supply
Energy Report: • Details of how the minimum turndown is
modelled for each air supply
Chiller staging • Demonstrate that for systems that employ multiple
chillers with a chiller staging strategy, the correct controls are modelled to reflect the actual relationship between the chillers.
Verification Documents: • Relevant pages from the mechanical
specification giving details of the chiller staging strategy
Energy Report: • Details of how chiller staging has been
modelled
Temperature control bands • Demonstrate that the temperature control bands of the
system accurately reflect the thermal model.
Verification Documents: • Relevant pages from the mechanical
specification giving details of the design specification for the thermal model
Energy Report: • Details of how the temperature control
bands have been modelled
Table 6: HVAC Controls parameters

Green Building Council of Australia Page 16 of 29
Ancillary Services
In addition to the building’s air conditioning system, the following items must also be accounted for in the energy consumption assessment;
o Domestic hot water supply; o Lifts, escalators and travelators; and o Mall, amenity, food court and stage/promotional area lighting and equipment.
These items will be entered separately into the calculator. Domestic water pumping can be ignored. Any other normal or extraordinary energy item that would reasonably be considered significant in an energy model must also be included and the calculation or simulation methodology must be adequately justified. This shall include, but not be limited, to groundwater or blackwater treatment plants.
Modelling Parameter Requirements Documentation
Domestic hot water loads
• Domestic hot water loads (to showers and wash hand basins) are to be calculated using the method outlined in Appendix D.
Verification Documents: • Area schedule • Specification of domestic hot water
systems Energy Report: • Details of how the domestic hot water
heating energy requirement is calculated in accordance with Appendix D.
Anc
illar
y S
ervi
ces
Lift loads • Lift loads are to be calculated using the method outlined in
Appendix D.
Verification Documents: • Area schedule • Specification of lift systems
Energy Report: • Details of how the lift energy requirement
is calculated in accordance with Appendix D.

Green Building Council of Australia Page 17 of 29
Escalator and
travelator loads
• Escalator and travelator loads are to be calculated using the method outlined in Appendix D.
Verification Documents: • Area schedule • Specification of escalator and travelator
systems Energy Report: • Details of how the escalator and travelator
energy requirement is calculated in accordance with Appendix D.
Mall, Amenities, Stages and Food Court
Lighting
• Demonstrate that all non-tenancy lighting is calculated
based on floor area. • Demonstrate that the appropriate Lighting Energy
Consumption Profile in Appendix C has been used. The lighting profile can be adjusted if the following are
installed: • Occupancy sensors: Lighting must follow the appropriate
lighting profile whenever the appropriate occupancy profile is larger than 0.
• Time Clocks: If lighting operates on a time clock then common area lighting must follow the appropriate lighting profile when specified as “on” by the electrical specification. This must operate for no less time than described for the previous point.
o Daylight dimming: Details on this system must be provided
Verification Documents: • Area schedule • Reflected ceiling plans with base building
lighting design • Relevant pages from electrical
specification showing occupancy sensors (if any), time clock (if any), lights and light fittings
Energy Report: • Details of space type areas using the
definitions in Appendix B • Details of how the lighting power densities
have been modelled • Details of how the operational profiles for
the building have been modelled • Details of the lighting control systems and
how they have been modelled
Mall, Amenities, Stages and Food Court Equipment
• Demonstrate that the equipment loads are modelled using the operational profiles as prescribed by Appendix C.
Verification Documents: • Area schedule • Relevant pages from base building design
brief showing equipment loads Energy Report: • Details of space type areas using the
definitions in Appendix B • Details of how the equipment densities
have been calculated. • Details of how the operational profiles
have been modelled.
Table 7: Ancillary services parameters

Green Building Council of Australia Page 18 of 29
Guidelines for simulation outputs
This diagram shows how to enter the simulation outputs into the Shopping Centre Design Rating Tool Energy Credit Calculator. Information should be entered into the white cells. Figure 1: Screenshot of the energy calculator
Green Star- Shopping Centre DesignCredit Summary for:
Energy Credit CalculatorInput information in white cells:
NSW
Space Area (m2) HVAC Benchmark
Greenhouse Emissions (kgCO2/m²/yr)
Modelled Centre Energy Consumption Electricity (kWh/yr) Gas (MJ/yr)
HVAC Energy Consumption (incl. boilers, chillers and fans)
Total Calculated Energy Consumption (kWh/yr)
Benchmark Greenhouse Emissions (kgCO2/yr)
0
0
0
0
Cost Savings CalculatorInput information in white cells:
$0.00
Total Benchmark Emissions (kgCO2/yr)
Actual Centre Emissions (kgCO2/yr)
Back of House (Not Occupied)
Renewable Energy (incl. photovoltaics, geothermal and wind, but not solar hot water)
Possible Annual Cost Saving Compared to Benchmark ($/year)
0
Domestic Hot Water (Select energy source)
Gas - enter value as MJ/yr
Cost of Electricity ($/kWh)Cost of Gas ($/MWh)
Number of Points Achieved
Greenhouse Gas Savings (Difference in greenhouse gas emissions between benchmark and design (kgCO2/yr))
Other
Please note this this calculator does not take inflation or discounting into account. It is only intended as a rough guide to annual cost savings that could be made.
Main HVAC system does not service this space
66.4
0.0
Malls, Amenities, Stages and Food Courts
98.3
Extras
The centre location is used to determine the greenhouse gas coefficient gas
Space Type
Tenancy Spaces (All tenancies excluding majors)
Tenancy Spaces (Majors)
Back of House - Not Occupied
Subtotal
130.2
295
0
Subtotal
Lifts
Escalators and Travelators
Centre Location
Energy Generation Total Calculated Energy Generation (kWh/yr)
Back of House - Permanently Occupied
Lighting and Equipment (Front of House - Mall, Amenities, Stage/Promotional Areas, Food Courts)
Back of House (Permanently Occupied)
Car Park(only include if sub-metering is not installed)
0
0
0
0
0
0
0
0
0
Onsite Generation (incl. electricity from a co-generation system)
Domestic Hot Water (Select energy source, if different to above)
Gas - enter value as MJ/yr 0
Use the drop down menu to choose the Australian state or territory in which the building is located. This only affects the calculation of greenho se gas emissions from gas
Fill out the areas of each space type (as defined in Appendix B)
Enter the predicted HVAC energy consumption for electricity and gas, as calculated using Section 2 of this Simulation Methodology
Enter the lighting and equipment energy consumption from as calculated using Section 3 of this Simulation Methodology. Domestic hot water can be serviced by electricity, gas or both by selecting the energy source from the
Shows the points awarded for the design
Shows the total benchmark emissions versus the actual centre emissions
Enter the price of gas and electricity to find out the cost saving of the design compared to the benchmark energy consumption.
Enter the energy generation from renewable energy (except for solar hot water) and onsite generation (such as
Green Star Benchmarks for each space type are listed in this column

Green Building Council of Australia Page 19 of 29
Case Study – On-site Energy Generation
This case study illustrates how cogeneration and solar hot water energy generation are captured within the calculator
This centre has 25,000m² of tenancy area and 5,000m² of fully enclosed air conditioned malls. It is located in NSW and generates electricity on site using cogeneration, solar hot water and renewable energy.
Firstly, the space type areas are calculated using the definitions in Appendix B.
Space Type Area (m²) Tenancy Spaces (All tenancies excluding majors) 20,000 Tenancy Spaces (Majors) 5,000 Malls, Amenities, Stages and Food Courts 1,000 Back of House - Permanently Occupied 100 Back of House - Not Occupied 1,000
Table 8: Space Type Areas for case study Next, the HVAC energy consumption for electricity and gas is calculated using Section 2 of this Simulation Methodology. In this case the gas consumption fires the cogeneration plant on site.
Energy Source Energy Consumption (kWh/year) Electricity 1,500,000 Gas 100,000
Table 9: HVAC Energy Consumption for case study The lighting and equipment energy consumption is calculated using Section 3 of this Simulation Methodology. Domestic hot water in this case is serviced by solar hot water, so no energy from gas or electricity is used. Item Energy consumption (kWh/year) Lighting and Equipment (Mall, Amenities, Stage/Promotional Areas and Food Courts)
80,000
Back of House (Permanently Occupied) Lighting and Equipment 10,000
Back of House (Not Occupied) Lighting and Equipment 100,000 Car Park Energy Consumption (only enter energy consumption if sub-metering is not installed)
0
Lifts 120,000 Escalators and Travelators 170,000
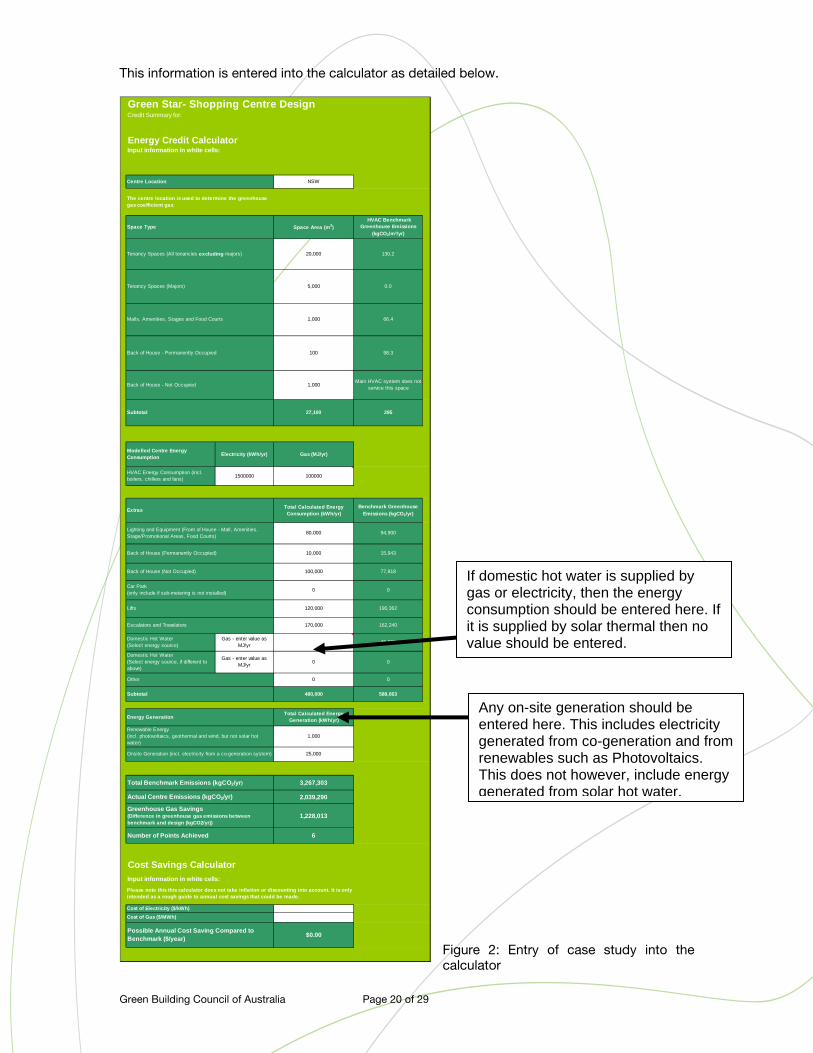
Table 10: Lighting and Equipment Energy Consumption Finally the onsite energy generation is calculated. Note that the solar hot water energy generation is not included here as it has already been included in the table above. The electricity produced from the cogeneration plant however, is included here as it has not been accounted for as yet.
On-site energy generation Energy generation (kWh/year) Renewable Energy (incl. Photovoltaics, Geothermal and Wind, but not solar hot water) 1,000
Onsite Generation (incl. Electricity from a co-generation system) 25,000
Table 11: On-site energy generation
Green Building Council of Australia Page 20 of 29
This information is entered into the calculator as detailed below.
Figure 2: Entry of case study into the calculator
Green Star- Shopping Centre DesignCredit Summary for:
Energy Credit CalculatorInput information in white cells:
NSW
Space Area (m2) HVAC Benchmark
Greenhouse Emissions (kgCO2/m²/yr)
Modelled Centre Energy Consumption Electricity (kWh/yr) Gas (MJ/yr)
HVAC Energy Consumption (incl. boilers, chillers and fans) 1500000 100000
Total Calculated Energy Consumption (kWh/yr)
Benchmark Greenhouse Emissions (kgCO2/yr)
3,267,303
2,039,290
1,228,013
6
Cost Savings CalculatorInput information in white cells:
$0.00
1,000
Total Benchmark Emissions (kgCO2/yr)
Actual Centre Emissions (kgCO2/yr)
Back of House (Not Occupied) 100,000
Renewable Energy (incl. photovoltaics, geothermal and wind, but not solar hot water)
25,000
80,000
120,000
1,000
Possible Annual Cost Saving Compared to Benchmark ($/year)
480,000
Domestic Hot Water (Select energy source)
Gas - enter value as MJ/yr
Cost of Electricity ($/kWh)Cost of Gas ($/MWh)
Number of Points Achieved
Greenhouse Gas Savings (Difference in greenhouse gas emissions between benchmark and design (kgCO2/yr))
Other
Please note this this calculator does not take inflation or discounting into account. It is only intended as a rough guide to annual cost savings that could be made.
170,000
Main HVAC system does not service this space
5,000
66.4
0.0
Malls, Amenities, Stages and Food Courts
20,000
1,000
98.3
Extras
The centre location is used to determine the greenhouse gas coefficient gas
Space Type
Tenancy Spaces (All tenancies excluding majors)
Tenancy Spaces (Majors)
Back of House - Not Occupied
Subtotal
130.2
0
295
10,000
77,818
Subtotal
Lifts
Escalators and Travelators
Centre Location
Energy Generation Total Calculated Energy Generation (kWh/yr)
Back of House - Permanently Occupied
Lighting and Equipment (Front of House - Mall, Amenities, Stage/Promotional Areas, Food Courts)
Back of House (Permanently Occupied)
Car Park(only include if sub-metering is not installed) 0
27,100
100
94,900
15,943
0
190,362
162,240
46,800
0
588,063
Onsite Generation (incl. electricity from a co-generation system)
Domestic Hot Water (Select energy source, if different to above)
Gas - enter value as MJ/yr 0 0
Any on-site generation should be entered here. This includes electricity generated from co-generation and from renewables such as Photovoltaics. This does not however, include energy generated from solar hot water.
If domestic hot water is supplied by gas or electricity, then the energy consumption should be entered here. If it is supplied by solar thermal then no value should be entered.

Green Building Council of Australia Page 21 of 29
APPENDIX A – SIMULATION BRIEF FOR ASSESSORS In order to assess the validity of the final results, it is critical that the assessor and the simulator understand the limitations of the simulation package which has been used. The simulator must provide the assessor with a briefing of the simulation package and model used which shows that the following requirements have been met: • The simulation package has passed external validation standards such as BESTEST2; • The model analyses building performance on an hourly basis for a full year; • The model accurately represents:
• The proposed HVAC system; • The HVAC controls which are to be used; • Glazing on the building – whether the model represents glazing as only a U-
value and shading coefficient; • The performance curves and sizes for plant items; • The daylighting effects and the operation of daylight controls; and
• All other aspects of the building have been modelled correctly, with no significant compromises made.
If these requirements are not met, then the reasons for this will need to be adequately justified.
2 The International Energy Agency, working with the U.S. National Renewable Energy Lab, has created a benchmark for building energy simulation programs. This benchmark is entitled "BESTEST – International Energy Agency Building Energy Simulation Test and Diagnostic Method".

Green Building Council of Australia Page 22 of 29
APPENDIX B: SPACE TYPE DEFINITIONS
The following provides definitions of the space types used within the Shopping Centre Design Energy Credit Calculator.
Tenancy Space Those spaces designated to future retail tenancy cores. They may sometimes be air conditioned by the base building, or as often the case with larger retailer stores they will be provided with a condenser water loop. In this second case, these spaces will be considered unconditioned by the base building. These spaces are generally not provided with any base building lighting. Malls Malls are external and internal covered circulation spaces which open onto shopfronts. These spaces are usually air-conditioned, mechanically ventilated and provided with lighting from the base building. Some equipment may also be provided to these spaces. Amenities Amenities consist of toilets, change rooms, showers, lockers and parents’ rooms. These spaces are usually provided with mechanical ventilation and artificial lighting. Food Courts Food courts are classed as open areas where people eat and congregate. These spaces usually have higher occupant density than mall areas and will be air conditioned and mechanically ventilated by the base building. Lighting may also be provided by the base building. Stage/ Promotional areas Spaces where people congregate to watch spectacles. These spaces will have a higher density than food courts when in use, but may not be used every day. These spaces are usually air conditioned and mechanically ventilated by the base building. They may also be provided with some lighting and equipment. The area of mall, amenity, food court and stage/promotional areas are added as a single area into this calculator. Back of House - Permanently Occupied Back of house areas which are permanently occupied include control rooms and offices. The base building will usually provide these spaces with mechanical ventilation, air conditioning and artificial lighting. Back of House - Not Occupied Back of house areas which are not occupied include non-publicly accessible areas such as plant rooms, storage areas, fire-stairs and passageways. The base building will usually provide these spaces with mechanical ventilation and artificial lighting but not air conditioning. Car Parks and Loading Docks Spaces where cars and delivery vehicles are parked or can circulate. These spaces will have higher circulation rates than commercial building car parks of a similar size. These spaces are considered to be external impermeable spaces and will be provided with mechanical ventilation and artificial lighting by the base building. The energy consumption of these spaces will only be included if sub-metering of these spaces is not included.

Green Building Council of Australia Page 23 of 29
APPENDIX C: OPERATIONAL PROFILES Tenancy Areas Default Inputs: (Can be altered to suit the building and system design): Area Upper Temperature Limit: 24°C Area Lower Temperature Limit: 21°C Area Humidity Upper Limit: 60% Area Humidity Lower Limit: 40% Air change rate: In accordance with AS1668.2 or engineered design
Weekdays, Saturdays and Sundays
Occupancy Gains (W/m²)
Time Lighting
Gain (W/m²)
Equipment Sensible
Gain (W/m²)
Sensible Latent
Occupancy Profile
(m²/person)
Plant Operation
12am – 8am 0 0 0 0 0 Off
8am – 9am 20 40 0 0 0 On
9am – 10am 20 40 15 10.6 5 On
10am – 11am 20 40 17.8 12 4 On
11am – 1pm 20 40 17 11 4 On
1pm – 3pm 20 40 13 9 5 On
3pm – 6pm 20 40 8.9 6 8 On
6pm – 12am 0 0 0 0 0 Off
Table 12: Tenant operational profile

Green Building Council of Australia Page 24 of 29
Malls, Food Courts, Amenities and Stage/Promotional Areas The table below outlines the operational profile for malls, food courts, stage/promotional areas and amenities on weekdays, Saturdays and Sundays. Note that when modelling these spaces, the model should use the lighting and equipment densities as designed for these spaces. Default Inputs: (Can be altered to suit the building and system design): Area Upper Temperature Limit: 24°C Area Lower Temperature Limit: 21°C Area Humidity Upper Limit: 60% Area Humidity Lower Limit: 40% Air change rate: In accordance with AS1668.2 or engineered design
Weekdays, Saturdays and Sundays
Occupancy Gains (W/m²)
Time
Lighting Gain (%
of maximu
m)
Equipment Sensible
Gain (% of maximum)
Sensible
Occupancy Profile
(m²/person)
Plant Operation
12am – 8am 0% 0% 0 0 0 Off
8am – 9am 100% 100% 0 0 0 On
9am – 10am 100% 100% 15 5 5 On
10am – 11am 100% 100% 17.8 4 On
11am – 1pm 100% 100% 17 4 95 On
1pm – 3pm 100% 100% 13 5 75 On
3pm – 6pm 100% 100% 8.9 8 50 On
6pm – 12am 0% 0% 0 0 0 Off
Table 13: Operational profile for malls, food courts, amenities and stage and promotional areas

Green Building Council of Australia Page 25 of 29
Back of House Permanently Occupied
The table below outlines the operational profile for back of house permanently occupied areas on weekdays, Saturdays and Sundays. The operational profile for lighting is generally expected to have a is consistent with the current Green Star Office rating tool where default peak load figures of 12W/m² for lighting, 11W/m² for equipment and occupancy is 1 person per 18m². Default Inputs: (Can be altered to suit the building and system design): Area Upper Temperature Limit: 24°C Area Lower Temperature Limit: 21°C Area Humidity Upper Limit: 60% Area Humidity Lower Limit: 40% Air change rate: In accordance with AS1668.2 or engineered design
Weekdays, Saturdays and Sundays
Occupancy Gains (W/m²)
Time
Lighting Profile (% of
maximum
Equipment Sensible
Gain (W/m²)
Sensible Latent
Occupancy Profile
(m²/person)
Plant Operation
12am -7am 16% 6 0 0 0 Off
7am-8am 42% 7 1 0.5 70 On
8am-9am 92% 9 2 1.5 35 On
9am-5pm 100% 11 4 3 17.5 On
5pm-6pm 83% 9 2 1 35 On
6pm-9pm 58% 7 0 0 0 Off
9pm-12am 16% 6 0 0 0 Off
Table 14: Operational profile for back of house permanently occupied

Green Building Council of Australia Page 26 of 29
Back of House not occupied
The table below outlines the operational profile for the back of house areas which are not occupied. Note that when modelling these spaces, the model should use the lighting and equipment densities as designed for these spaces. Temperature and humidity limits: Uncontrolled Air change rate: In accordance with AS1660.2 (10 air changes per hour) or engineered design
Weekdays, Saturdays and Sundays
Time Infiltration Air (ACH)
Lighting Gain (% of maximum)
Equipment Sensible Gain (%
of maximum)
12am – 8am 0.1 0 0
8am – 6pm 0.1 100% 100%
5pm – 12am 0.1 0 0
Table 15: Operational profile for back of house not occupied

Green Building Council of Australia Page 27 of 29
Car Parks and Loading Docks The table below outlines the operational profile for car parks and loading docks on weekdays, Saturdays and Sundays. Note that when modelling these spaces, the model should use the lighting and equipment densities as designed for these spaces. Note that energy consumption from the car parks and loading docks should only be included if sub-metering of these spaces is not included. Temperature and humidity limits: Uncontrolled Air change rate: In accordance with AS1668.2 or engineered design
Weekdays, Saturdays and Sundays
Time Infiltration Air (ACH)
Lighting Gain (% of maximum)
Equipment Sensible Gain (%
of maximum)
12am – 8am 0.1 0 0
8am – 6pm 0.1 100% 100%
5pm – 12am 0.1 0 0
Table 16: Operational profile for car parks and loading docks

Green Building Council of Australia Page 28 of 29
APPENDIX D: LIFT, ESCALATOR AND DOMESTIC HOT WATER ENERGY CONSUMPTION Benchmarking of domestic hot water energy consumption
Table 17: Benchmarks for hot water energy consumption *The hot water supply is a fixed component. It may only be reduced if documentation is provided proving that hot water consumption is less than average. Protocol for calculating energy use
1. Calculate the Total Domestic Hot Water Requirements multiplying the hot water
supply (L/m²/year) by the total tenancy area (m²). 2. Calculate the Daily Domestic Hot Water Energy Requirements by determining how
much primary energy input is required to heat this amount of water to 60°C per day using the domestic hot water systems as designed for the shopping centre. Ensure distribution and generation efficiencies are included.
3. Multiply the Daily Domestic Hot Water Energy Requirement by 365 days to calculate the Yearly Hot Water Energy Requirement. This is the figure to be entered into the Shopping Centre Design Energy Credit Calculator.
Example (yellow section to be filled in)
Table 18: Example to how to calculate hot water energy consumption
WATER SUPPLIED TO:
DOMESTIC HOT WATER REQUIREMENTS (L/m² of
total tenancy/day)*
0.1
0.05
(if using 4/5A fixtures) Hot water basins 0
(if no hot water is supplied to the bathrooms)
WATER SUPPLIE
D TO:
HOT WATER REQUIREMENT
S (L/m²/day)
TOTAL TENANCY AREA
(m²)
HOT WATER REQUIREMENT
S (L/day)
DAILY ENERGY
REQUIRED TO HEAT
HOT WATER (kWh/day)
YEARLY ENERGY
REQUIRED TO HEAT
HOT WATER (kWh/year)
Hot water basins
0.1 2500 250 12.5 4562.5
TOTAL ENERGY REQUIREMENT (kWh/year) 4562.5

Green Building Council of Australia Page 29 of 29
Protocol for calculating lift energy use
1. Determine the lift power ratings (both freight and customer lifts) from supplier specifications.
2. The Usage Factor is 0.75 and takes into account stopping and starting of the lift. 3. Calculate the Yearly Energy Usage. This can be done by multiplying the lift power rating
by the number of lifts, then by the usage factor and finally by 9 hours a day, 365 days a year (3285 hours/year). This is the figure to be entered into the Shopping Centre Design Energy Credit Calculator.
Example (yellow sections are those that are to be filled in)
LIFT POWER RATING (kW)
NUMBER OF LIFTS
USAGE FACTOR
HOURS IN A YEAR
YEARLY ENERGY USAGE
(kWh/year)
30kW
(passenger lift) 1 0.75 3285 73912.5
50kW (passenger lift)
1 0.75 3285 123187.5
40kW
(freight lift) 1 0.75 3285 98550
TOTAL YEARLY ENERGY CONSUMPTION (kWh/year) 295650
Table 19: Example of how to calculate lift energy consumption Protocol for calculating escalator and travelator energy use
1. Determine the escalator or travelator power rating from supplier specifications.
2. Determine the Usage Factor based on the presence of an escalator or travelator sensor. These sensors detect movement and start the escalator or travelator moving if someone is walking towards it. The usage factor is:
a. 0.75 if there is sensor; and b. 1 with a no sensor.
3. Calculate the Yearly Energy Usage. This can be done by multiplying the power rating
by the number of escalators or travelators, then by the usage factor and finally by 9 hours a day, 365 days a year (3285 hours/year). This is the figure to be entered into the Shopping Centre Design Energy Credit Calculator.
Example (yellow sections are those that are to be filled in)
ESCALATOR TRAVELATOR
POWER RATING
NUMBER OF ESCALATORS
USAGE FACTOR (sensor dependent)
HOURS IN A
YEAR
YEARLY ENERGY USAGE
(kWh/year)
8kW
(without sensor) 4 1 3285 105120
8kW
(with sensor) 2 0.75 3285 39420
TOTAL YEARLY ENERGY CONSUMPTION (kWh/year) 144540
Table 20: Example of how to calculate escalator or travelator energy consumption