prepared by : fatma karadoĞan tohİr akmalzoda gÖkhan seyhan submitted to : assist.prof. dr....
TRANSCRIPT

Prepared by: FATMA KARADOĞAN
TOHİR AKMALZODA
GÖKHAN SEYHAN
Submitted to: Assist.Prof. Dr. KORHAN GÖKMENOĞLU
Chapter 1
Stock and Bond returns since 1802
Financial Market Returns From 1802 The Long-Term Performance of Bonds The end of Gold Standard and Price Stability Total Real Returns Interpretation of Returns( Long-Term Returns) Short-term Returns and Volatility Real Returns on Fixed-Income Assets The Equity Premium Conclusion: Stocks for the Long-Run Stocks from 1802 to 1870 Arithmetic and Geometric Returns
Objectives:
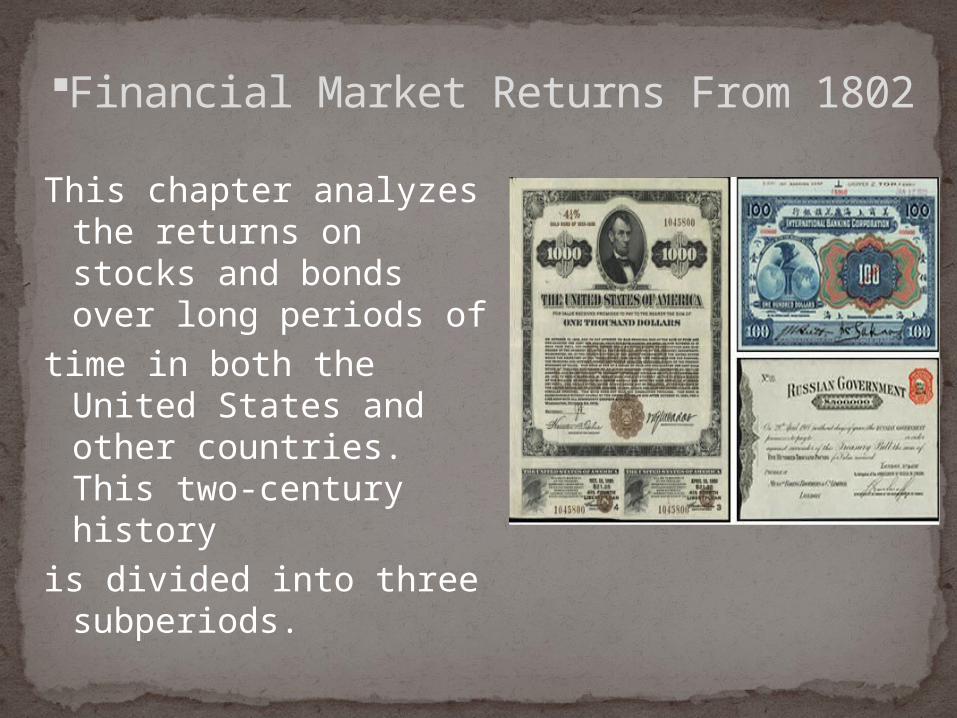
This chapter analyzes the returns on stocks and bonds over long periods of
time in both the United States and other countries. This two-century history
is divided into three subperiods.
Financial Market Returns From 1802
In the first subperiod, from 1802 to 1870, the United States made a change from an agriculture to an industrialized economy, comparable to the change that the “emerging markets” of Latin America and Asia are making today.
In the second subperiod,from 1871 to 1925, the United States became the foremost political and economic power in the world.
The third subperiod, from 1926 to 1932 stock collapse, the Great Depression,and the postwar expansion.

This is the total return indexes for stocks, long and short-termbonds, gold, and commodities from 1802 through 2006.
One dollar invested and reinvested in stocks since 1802 would have accumulated to over $12.7million by the end of 2006.
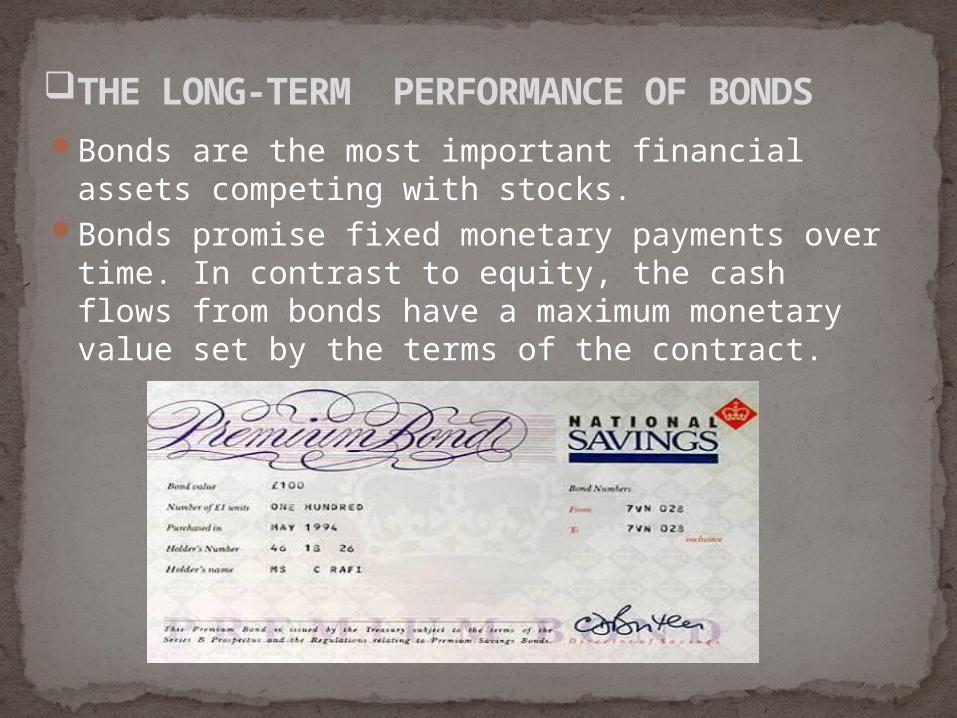
Bonds are the most important financial assets competing with stocks.
Bonds promise fixed monetary payments over time. In contrast to equity, the cash flows from bonds have a maximum monetary value set by the terms of the contract.
THE LONG-TERM PERFORMANCE OF BONDS
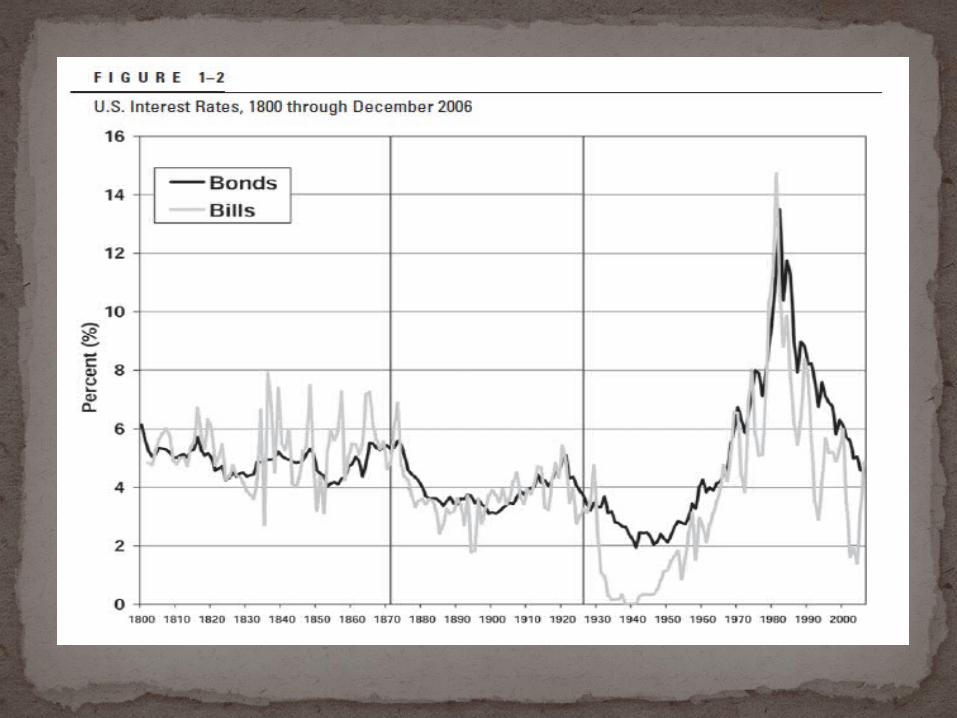
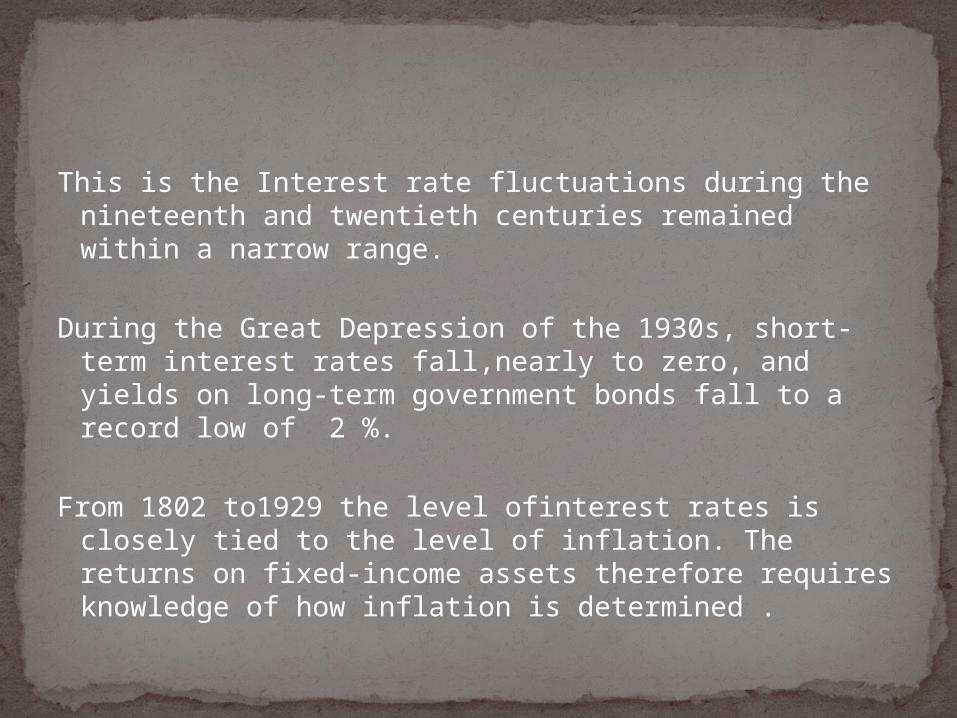
This is the Interest rate fluctuations during the nineteenth and twentieth centuries remained within a narrow range.
During the Great Depression of the 1930s, short-term
interest rates fall,nearly to zero, and yields on long-term government bonds fall to a record low of 2 %.
From 1802 to1929 the level ofinterest rates is closely
tied to the level of inflation. The returns on fixed-income assets therefore requires knowledge of how inflation is determined .

A monetary system in which a country's government allows its currency unit to be freely converted into fixed amounts of gold and vice versa. The exchange rate under the gold standard monetary system is determined by the economic difference for an ounce of gold between two currencies. The gold standard was mainly used from 1875 to 1914 and also during the interwar years
The end of the Gold Standard & Price Stability
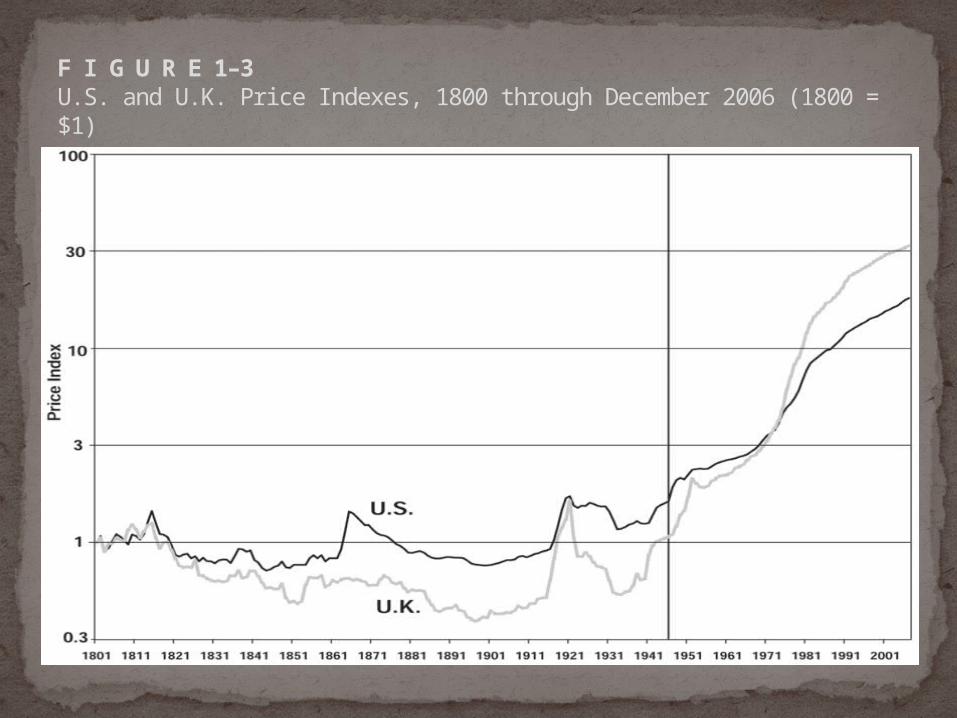
F I G U R E 1–3U.S. and U.K. Price Indexes, 1800 through December 2006 (1800 = $1)
TOTAL REAL RETURNSFigure 1-4 shows the growth of purchasing
power, or total real returns, in the same assets that were graphed in Figure 1-1: stocks, bonds, bills and gold.
Despite ex-traordinary changes in the economic, social, and political environment over the past two centuries, stocks have yielded between 6.6 and 7.0 percent per year after inflation in all major subperiods.
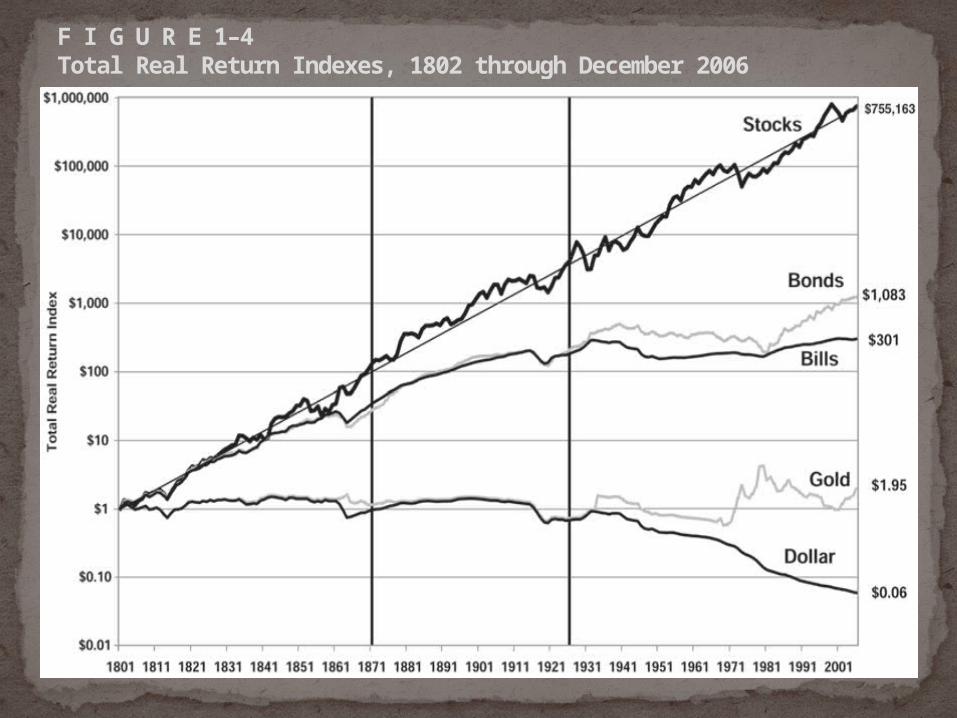
F I G U R E 1–4Total Real Return Indexes, 1802 through December 2006
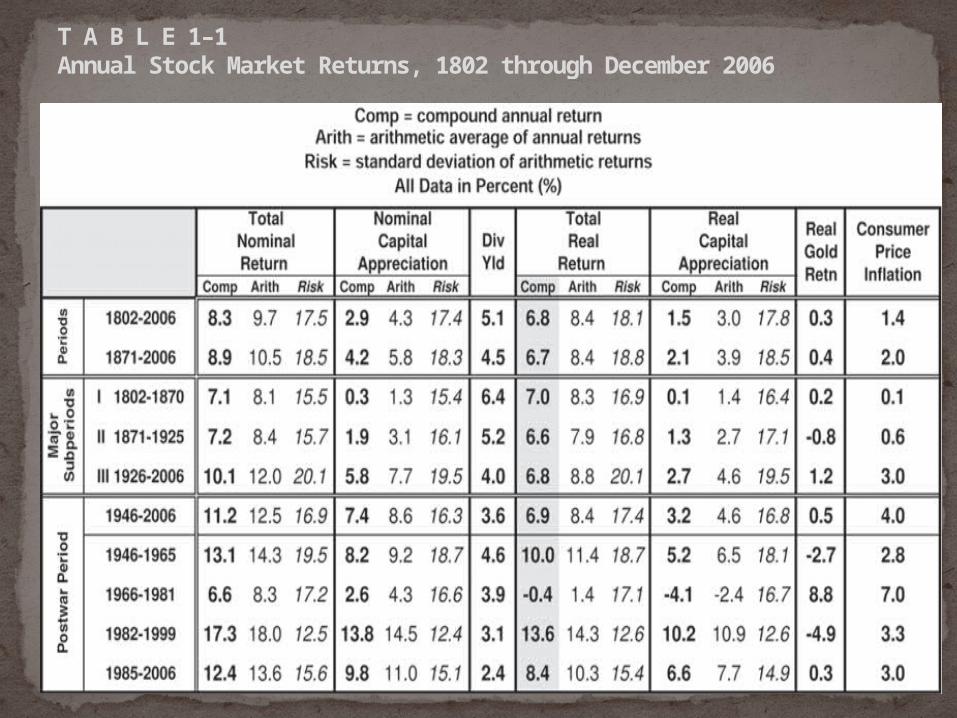
T A B L E 1–1Annual Stock Market Returns, 1802 through December 2006
INTERPRETATION OF RETURNSLong-Term Returns
The real return on equities has averaged 6.8 percent per year over the past 204 years.
Note the extraordinary stability of the real return on stocks over all major subperiods: 7.0 percent per year from 1802 through 1870, 6.6 percent from 1871 through 1925, and 6.8 percent per year since 1926.
This is virtually identical to the previous 125 years, which saw no overall inflation. This remarkable stability is called the mean reversion of equity returns, which means that returns can be very unstable in the short run but very stable in the long run. (1802-1926)

Long-Term ReturnsFigure 1-4. When the total real return on
stocks was substantially above the trend line, such as during the late 1960s and 1990s
The United States evolved from an agricultural to an industrial economy and then to the post industrial, service and technology oriented economy it is today.
Short-Term Returns and Volatility
The bull market from 1982 through 1999 gave investors an extraordinary after-inflation return of 13.6 percent per year, which is double the historical average. This constituted the greatest bull market in U.S. stock market history.
Nevertheless, this bull market carried stocks too high, as total real returns in Figure 1-4 reached 81 percent above the trend line.
REAL RETURNS ON FIXED-INCOME ASSETSThe nominal and real returns on both short-
term and long-term bonds are reported in Table 1-2 covering the same time periods as in Table 1-1.
The real return on bills has dropped precipitously from 5.1% in the early part of the nineteenth century to a bare 0.7% since 1926.
REAL RETURNS ON FIXED-INCOME ASSETSThe real return on long-term bonds has shown a
similar pattern.Bond returns fell from a generous 4.8% in the first subperiod to 3.7% in the second, and then to only 2.4% in the third.
You have to go back the period from 1831 through 1861 to find any 30-year period during which the return on either long- or short-term bonds exceeded that on equities. The dominance of stocks over fixed-income securities is overwhelming for investors with long horizons.
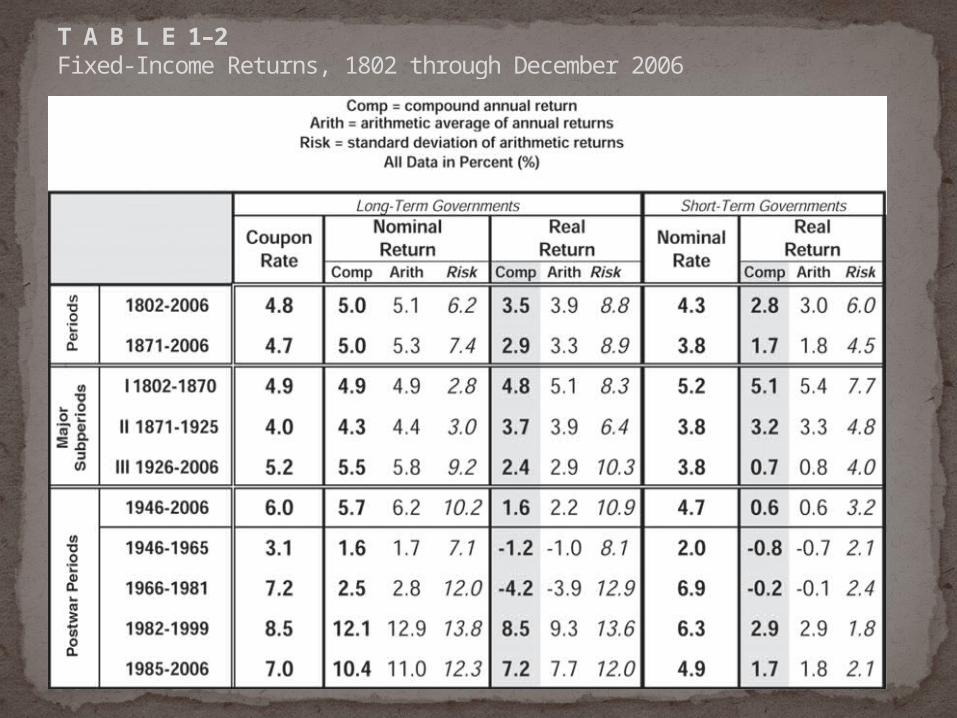
T A B L E 1–2Fixed-Income Returns, 1802 through December 2006
There were some reasons for the decline in the real return on fixed-income assets over the past century, but it is very likely that the real returns on bonds will be higher on average in the future than they have been since the end of World War 2.
The Equity Premium
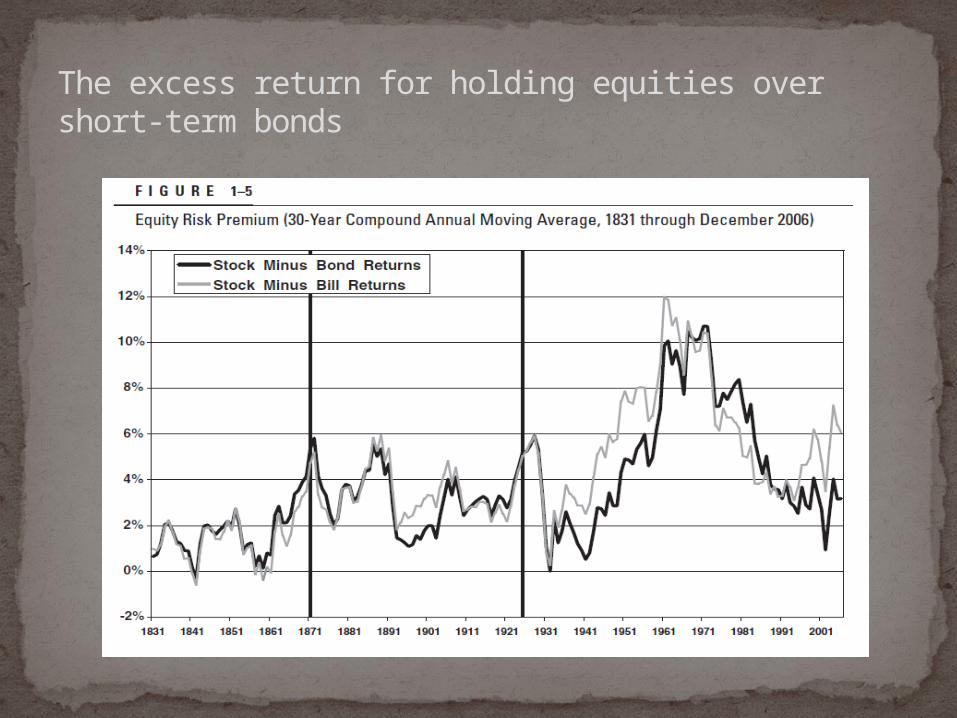
The excess return for holding equities over short-term bonds
Over the past 200 years the compound annual real return on a common stock is nearly 7% in US, and it has shown a wonderful constancy over time.
The reasons for the constancy and long-term stability of stock returns are not well understood.
The superior returns to equity over the past two centuries might be explained by the growing dominance of nations committed to free market economics.
Conclusion: Stocks for the Long-Run

The first actively traded US stocks, floated in 1791, were issued by bank of New York and the Bank of the United States. Both offering were successful and were quickly bid to a premium.
Stocks from 1802 to 1870
The average arithmetic return is the average of each yearly return.
The geometric return is approximately equal to the arithmetic return minus one half the variance of yearly returns.
The average geometric return is always less than the average arithmetic return except when all yearly returns are exactly equal. This difference is related to the volatility of yearly returns.
Arithmetic and Geometric returns

Thanks for your attention!!!