prepared by: jane venohr, ph.d. denver, co 80218 www ... · child support program ... note that the...
TRANSCRIPT

Submitted to: Pennsylvania Department of Human Services
Child Support Program Harrisburg, PA 17106
Prepared by:
Jane Venohr, Ph.D. Center for Policy Research
Denver, CO 80218 www.centerforpolicyresearch.org
303.837.1555 [email protected]
March 31, 2016
Points of view expressed in this document are those of the author and do not necessarily represent the official position of the State, Court or Domestic Relations Procedural Rules Committee. The author is responsible for any errors and omissions.

REVIEW OF THE PENNSYLVANIA CHILD SUPPORT GUIDELINES: TECHNIAL FINDINGS
TABLEOFCONTENTSTable of Contents .......................................................................................................................................... 2
Section I: Introduction ................................................................................................................................. 1
Purpose of Report ..................................................................................................................................... 1
Section II: Findings from the Case File Review on Guidelines Application and Deviation ........................... 4
Purpose of Case File Review ..................................................................................................................... 4
Sampling and Methodology ...................................................................................................................... 4
Average Order Amounts and Payments ................................................................................................... 4
Minimum and Zero Orders ................................................................................................................... 5
Payments............................................................................................................................................... 6
Guidelines Deviations and Reasons .......................................................................................................... 7
Self‐Support Reserve ........................................................................................................................... 14
Range of Noncustodial Parents’ Gross Incomes ................................................................................. 14
Evidence and Source of Noncustodial Parent’s Income ..................................................................... 15
Order Amount as a Percentage of Gross Income and Payments ........................................................ 16
Gross Income of Custodial Parents ..................................................................................................... 19
Evidence and Source of Custodial Parent’s Income ............................................................................ 19
Noncustodial Parent’s Share of Combined Income ............................................................................ 20
Adjustments for Substantial Shared Physical Custody ....................................................................... 23
Adjustments for Multiple Families ...................................................................................................... 23
Spousal Support/Alimony Pendente Lite (APL) ................................................................................... 24
Section III: Guidelines Models and Economic Evidence on the Cost of Raising Children .......................... 25
Introduction ............................................................................................................................................ 25
Guidelines Models .................................................................................................................................. 25
Income Shares Model ......................................................................................................................... 26
Percentage‐of‐Obligor Income Model ................................................................................................ 26
Melson Formula .................................................................................................................................. 27
Other Guidelines Model ...................................................................................................................... 27
Other State Guidelines Differences .................................................................................................... 27
Economic Evidence on the Cost of Raising Children ............................................................................... 27
Current Studies of Child‐Rearing Expenditures .................................................................................. 29

REVIEW OF THE PENNSYLVANIA CHILD SUPPORT GUIDELINES: TECHNIAL FINDINGS
Data Source of the Estimates .............................................................................................................. 31
Section IV: Development of an Updated Schedule .................................................................................... 33
Considerations, Steps, and Assumptions ................................................................................................ 33
Betson‐Rothbarth Measurements ...................................................................................................... 33
Change in Price Levels ......................................................................................................................... 34
Excluded Expenses .............................................................................................................................. 34
Adjusting for Timesharing ................................................................................................................... 35
Incorporating a Self‐Support Reserve ................................................................................................. 36
Adjustment for Higher Incomes .......................................................................................................... 37
Other Assumptions and Steps ............................................................................................................. 37
Comparisons of Existing and Updated Schedule .................................................................................... 38
Section VI: Summary and Conclusions ........................................................................................................ 63
Findings from Case File Data ................................................................................................................... 63
Economic Data and Updated Schedule ................................................................................................... 64
References .................................................................................................................................................. 66
Appendix A: Methodology for Measuring Guidelines Deviations .............................................................. 69
Appendix B: Proposed, Updated Schedule ................................................................................................. 71
Appendix C: Side‐by‐Side Comparisons ...................................................................................................... 84

REVIEW OF THE PENNSYLVANIA CHILD SUPPORT GUIDELINES: TECHNIAL FINDINGS
1
SECTIONI:INTRODUCTION
PurposeofReportPennsylvania is reviewing its child support guidelines as required by federal regulation and state laws
and rules.1 In Pennsylvania, child support orders are calculated using the child support guidelines
provided under rules of civil procedure [Pa.R.C.P. 1910.16‐1, et seq.]. Federal regulation requires that a
state’s guidelines review consider economic data on the cost of raising children and examine case file
data to analyze the application and deviation from the guidelines. This report fulfills these
requirements.
The Domestic Relations Procedural Rules Committee of the Pennsylvania Supreme Court is charged with
conducting the guidelines review. The Committee is considering many factors in its review. It may
recommend guidelines changes, including the updated schedule provided in this report. The standard
process for recommended rule changes involves publishing them for public comment. Upon reviewing
the public comments, the Committee may revise or finalize its recommended changes before submitting
them to the Supreme Court of Pennsylvania. Ultimately, the Supreme Court may adopt, amend, or
reject any recommendation.
Child support income is an important source of income to many families. National data from 2013 finds
that child support income accounts for 70.3 percent of the mean annual income for custodial parents
below poverty who receive full child support.2 The Pennsylvania child support program collected and
distributed almost $1.3 billion in child support in Federal Fiscal Year 2014.3 The Pennsylvania child
support program includes the combined efforts of the federal Office of Child Support Enforcement
(OCSE), the Pennsylvania Department of Human Services (DHS) Child Support Program (CSP), and the
Domestic Relations Sections (DRSs) of the county courts of common pleas.4 According to OCSE, there
were 541,120 children in the 2014 Pennsylvania child support program caseload.5 In contrast, the U.S.
Census Bureau counts 2,700,178 Pennsylvania children total in 2014.6 In addition to the children in the
state child support program caseload, there is unknown number of Pennsylvania children eligible for
child support. Many receive child support that is not paid through the state child support system.
Although state data are not available, the U.S. Census Bureau finds that nationally, 26.6 percent of all
1Title 45, Code of Federal Regulations, CFR §302.56(e), 23 Pa.C.S.A. §4322(a) and Pa.R.C.P. 1910.16‐1(e). 2 Grall, Timothy. (January 2016). Custodial Mothers and Fathers and Their Child Support: 2013. Current Population Survey, Report P60‐246. U.S. Census Bureau, Washington, D.C. Retrieved from http://www.census.gov/content/dam/Census/library/publications/2016/demo/P60‐255.pdf . 3 Federal Office of Child Support Enforcement (OCSE), Report to Congress: Preliminary 2014, Washington, D.C. Retrieved from https://www.acf.hhs.gov/sites/default/files/programs/css/fy2014_preliminary.pdf 4 See Pennsylvania Department of Human Services (DHS)for more information about how the program is administered and services are provided. Note that the DHS was formerly called the Department of Public Welfare. https://www.humanservices.state.pa.us/CSWS/csws_controller.aspx?HtWspJxl7ngbuxSR5seD4miXoFSzsh_H4DYs7tBzZv1KJnnqykaNllhKaq6bxb9cktJrS@yIUUaVcLmIZj5bX9cmA7MA3yt7zyUqGkJIQhGgVngermSb. 5 Supra note 3, Table P‐93. 6 State caseload data is from the OCSE report. The number of children is from the U.S. Census American Community Survey and retrieved from http://factfinder.census.gov.

REVIEW OF THE PENNSYLVANIA CHILD SUPPORT GUIDELINES: TECHNIAL FINDINGS
2
children under 21 years old lived in families with only one of their parents while the other parent lived
elsewhere.7
A state’s guidelines are to be used to determine the award amount in all proceedings involving a child
support issue regardless whether the case is in the state caseload. Federal regulation requires each
state to have one set of guidelines that are to be applied presumptively. It also requires each state to
establish deviation criteria that allow for the rebuttal of the state’s presumptive guidelines. The state‐
determined criteria must take into consideration the best interest of the child.
The core of the Pennsylvania
guidelines calculation is a lookup
schedule of monthly basic
obligations for a range of incomes
and number of children. (Exhibit 1
shows an excerpt of the current
schedule.) The basic obligations in
the schedule reflect economic data
on the costs of raising children. They
relate to the combined income of
the parents. The support award is
determined by prorating the obligated parent’s share of the basic obligation. For example, if each
parent’s net income is $1,500 per month, the combined net income would be $3,000 per month and,
using the schedule in Exhibit 1, the basic obligation for one child is $704. The obligated parent’s
prorated amount in this example would be $352. This is the basis of the support award amount
although there may be other adjustments for other considerations such as the cost of the child’s health
insurance or substantial shared custody.
The Center for Policy Research (CPR), as a technical and economic advisor on the guidelines review to
Pennsylvania, has prepared this report. CPR has provided similar technical assistance for Pennsylvania’s
last two reviews and for about 25 states in the past nine years. CPR also has prepared an updated
schedule with input and direction from the Committee, analyzed case file data, and provided other
technical assistance.
This report is organized into the following sections.
Section II summarizes the findings from an analysis of casefile data on the application and deviation
from the guidelines.
Section III compares guidelines models and summarizes the current economic data on the cost of
raising children that is available for updating the schedule or this is used by state.
7 Grall (2016), supra note 2.
Exhibit 1: Excerpt from Schedule of Basic Support Obligations
Combined Adjusted Net
Income One Child
Two Children
Three Children
Four Children
Five Children
Six Children
3000 704 1015 1189 1328 1461 1588
3050 716 1032 1209 1350 1485 1614
3100 727 1048 1228 1372 1509 1640
3150 738 1065 1247 1393 1532 1666
3200 747 1077 1261 1408 1549 1684
3250 756 1089 1274 1423 1565 1701
3300 765 1101 1287 1438 1582 1719
3350 774 1113 1300 1453 1598 1737
3400 783 1125 1314 1468 1614 1755
3450 792 1137 1327 1482 1631 1772
REVIEW OF THE PENNSYLVANIA CHILD SUPPORT GUIDELINES: TECHNIAL FINDINGS
3
Section IV details the methodology used to prepare an updated child support schedule. It also
compares the existing schedule and proposed updated schedule to those of bordering states.
Section V compares Pennsylvania’s provisions for other factors considered in the calculation of
support (e.g., shared parenting and multiple families) to those of other states.
Section VI provides a summary and conclusion.

REVIEW OF THE PENNSYLVANIA CHILD SUPPORT GUIDELINES: TECHNIAL FINDINGS
4
SECTIONII:FINDINGSFROMTHECASEFILEREVIEWONGUIDELINESAPPLICATIONANDDEVIATION
PurposeofCaseFileReviewFederal regulation (Title 45, CFR §302.56(h)) requires states to analyze case data on the application of
and the deviations from the guidelines. The data is to be examined by the state reviewing its guidelines
to ensure that deviations from the guidelines are limited. This section summarizes the findings from the
analysis of case data conducted for the 2015‐2016 guidelines review of the Pennsylvania guidelines.
SamplingandMethodologyNew and modified orders were randomly selected from the Pennsylvania Child Support Enforcement
system (PACSES) used to track and manage child support cases. Orders were selected from those in
which the PACSES automated child support guidelines calculator was applied and the information from
that calculation was stored. A random sample was obtained from 5,000 orders that included 2,500
newly established orders and 2,500 modified orders in a 12‐month period spanning 2013‐2014. In
calendar year 2013, PACSES recorded 80,791 new order establishments and 114,599 modified orders.
The number of modified orders began outsizing the number of new order establishments around the
time of the Great Recession of 2008‐2009. Parties may have sought modifications to their orders in
response to job losses and income changes.
The sample size is more than adequate to detect statistics differences in guidelines deviation rates from
earlier samples and conduct sub‐analysis. Samples from PACSES were also drawn for earlier reviews.
Previous samples included established orders or modified orders in 2010‐2011, 2005‐2006, and 2001‐
2002. Findings from earlier studies are included as part of the analysis when appropriate.
The PACSES automated guidelines calculator is typically used by County Domestic Relations Sections
(DRSs). The PACSES guidelines calculators consists of dozens of data fields including number of children,
each parent’s income, adjustments to each parent’s income by type and amount, other factors
considered in the calculation of support (e.g., the cost of the child’s health insurance and the
identification of the parent covering that cost) and data fields noting whether there is a guidelines
deviation, the amount of the deviation, reason for the deviation, and other data. Case data were also
matched to payment data. Appendix A documents the methodology for measuring deviations from the
PACSES data. Like previous random samples, one limitation of the PACSES data is that some orders are
established or modified without a guidelines calculation being entered into PACSES.
AverageOrderAmountsandPaymentsExhibit 2 compares average order amounts over time. Based on the 2013‐2014 sample, the average
support order is $426 per month among new orders and $421 per month among modified orders. The
median order amounts among 2013‐2014 new and modified orders are $324 and $350 per month,
respectively. Exhibit 2 shows a small increase in the average monthly support award among new
orders over time, but no significant change in the average monthly support award among modified
orders over time.

REVIEW OF THE PENNSYLVANIA CHILD SUPPORT GUIDELINES: TECHNIAL FINDINGS
5
Several factors affect award amounts. The major factors are the schedule, the self‐support reserve, the
incomes of the parents, and the number of children for whom support is being determined.
Pennsylvania has kept its guidelines schedule and self‐support reserve updated for changes in the price
level. Increases in price levels push support award levels up, but increases in the self‐support reserve,
which affect very low‐income noncustodial parents, pull order amounts down. This push‐pull may
explain why the average order amount is relatively unchanged over time. Changes that resulted from
changes in income and other factors are explored later in this section.
Another comparison of interest is how Pennsylvania orders compare to orders nationally. The U.S.
Census collects data on child support. Its usefulness as a comparison, however, is limited due to the
differences in data collection methodologies. The most recent national data (which is from 2013) finds
that child support orders averaged $481 per month nationally.8 In contrast, Pennsylvania orders average
$421(among modified orders) to $436 (among new orders). The U.S. sample, which is collected through
a survey, may include more high‐income cases than the PACSES sample. Another way to compare
Pennsylvania is to compare the Pennsylvania child support guidelines to other state guidelines using a
range of case scenarios. This comparison is conducted in Section VI.
MinimumandZeroOrdersAnother consideration is the percentage of orders that are set at zero or $50 per month, which was the
presumptive minimum order at the time of the 2010‐2011 data extract. There is no change in the
percentage of orders set at zero. Three percent of new orders in both the 2013‐2014 sample and the
8 Grall, Timothy. (2016). Custodial Mothers and Fathers and Their Child Support: 2013. Current Population Survey, Report P60‐246. U.S. Census Bureau, Washington, D.C. Table 2 shows the average amount due is $5,774. It is converted to a monthly amount. Retrieved from http://www.census.gov/content/dam/Census/library/publications/2016/demo/P60‐255.pdf .
$436 $421 $441
$398 $393 $414 $398 $414
$0
$50
$100
$150
$200
$250
$300
$350
$400
$450
$500
New Orders Modified Orders
Mon
thly
Sup
port
Aw
ard
Exhibit 2:Average Child Support Award over Time
2013-2014 Sample 2010-2011 Sample 2005-2006 Sample 2001-2002 Sample

REVIEW OF THE PENNSYLVANIA CHILD SUPPORT GUIDELINES: TECHNIAL FINDINGS
6
2010‐2011 sample are set at zero and 9 percent of modified orders in both the 2013‐14 sample and the
2010‐2011 sample are set at zero. Fewer orders are set at $50 per month: 4 percent of new 2013‐2014
orders; 2 percent of 2013‐2014 modified orders; 4 percent of new 2010‐2011 orders; and one percent of
modified 2010‐2011 orders. The low frequencies of zero and $50 per month orders suggests that
elimination of the minimum order amount has little to no impact on the frequency of very low orders.
PaymentsThe 2013‐2014 data and the 2010‐
2011 data included payment
information; specifically, the
amount of child support due and the
amount of child support paid over
the past year. Data extracts from
previous years do not include
payment data. Exhibit 3 shows that
the average percentage of current
support paid increased among new
orders but declined among modified
orders since the last review. The
average percentage paid among
new orders increased from 68.7 percent in 2010‐2011 to 72.6 percent in 2013‐2014. It decreased
among modified orders from 81.8 percent in 2010‐2011 to 77.8 percent in 2013‐2014. The differences
are statistically significant for both order types.
The case characteristics and application of specific guidelines provision correlated with payment
patterns is explored in the rest of this section. Each case characteristic and specific guidelines provision
is discussed separately.
There are no national data tracking payments for the first year following an order establishment or
order modification. The most comparable data available consists of a ratio of current support
distributed to current support due in a federal fiscal year (FFY), which runs from October 1 through
September 30 of the following year. The FFY is denoted by the year of the September 30 date.
According to federal Office of Child Support Enforcement (OCSE) data,9 the percentage of current paid
stayed about the same in Pennsylvania cases reported to OCSE (i.e., the percentage paid was 83.9
percent in FFY2011 and 83.5 percent in FFY2014). In contrast, the percentage of current paid increased
for the nation as a whole from 62.4 percent to 64.2 percent over the same time period. The
comparisons illustrate that Pennsylvania collects more that the rest of the nation in general, and that at
a statewide level, Pennsylvania did not experience an increase in payment compliance from 2011 to
9 Federal Office of Child Support Enforcement (April 2015). Preliminary Report: FY2014. Retrieved from http://www.acf.hhs.gov/programs/css/resource/fy‐2014‐preliminary‐report. Tables P‐83 and P‐84.

REVIEW OF THE PENNSYLVANIA CHILD SUPPORT GUIDELINES: TECHNIAL FINDINGS
7
2014. Nonetheless, as shown by the comparison of newly established and modified orders, there may
be some variation for subgroups.
GuidelinesDeviationsandReasonsExhibit 4 shows that the guidelines deviation rate has increased over time. Among new orders, it
increased from 18 percent last review to 25 percent this review. Among modified orders, it increased
from 15 percent last review to 22 percent this review. The differences are statistically significant.
The reasons for increased guidelines deviations are unclear. Increased deviation rates were noted after
the Great Recession in several states, including Pennsylvania during its 2010‐2011 review. The weighted
average deviation rate of all 2013‐2014 Pennsylvania orders (i.e., when newly established and modified
orders in the 2013‐2014 sample are combined into one pool) is 23 percent. This is a common deviation
rate among neighboring states such as Delaware, Maryland, and Ohio. It is also the deviation rate of
Arizona, a state that recently conducted a comprehensive review and sampled from court files, and thus
had fewer data limitations than the Pennsylvania data, which is limited to those orders recorded by a
PACSES guidelines calculation.
Delaware’s guidelines deviation rate was 23 percent in 2010.10 Delaware’s most recent report of its
guidelines review (2014) does not provide a statewide deviation rate. Instead, it provides deviation
rates for subgroups: 17 percent among orders issued from Commissioners and 29 percent among
orders issued from mediation.11
10 Delaware Family Court. (Nov. 2010). Delaware Child Support Formula, Evaluation and Update, Report to the Judiciary submitted to Honorable Chandree Johnson Kuhn, Chief Judge, Wilmington, Delaware, 11 Delaware Family Court. (Nov. 2014). Delaware Child Support Formula Evaluation and Update. Wilmington, Delaware. Retrieved from http://courts.delaware.gov/forms/download.aspx?id=39228

REVIEW OF THE PENNSYLVANIA CHILD SUPPORT GUIDELINES: TECHNIAL FINDINGS
8
Maryland reports a guidelines deviation rate of 23 percent for each of its last two reviews: one
conducted in 200812 and the other conducted in 2012.13 The 2012 study analyzed case data from
2007 through 2010, so is not as recent as the data for the Pennsylvania study.
New York is about to conduct a guidelines review. Its last review dates back to 2010 and found a
guidelines deviation rate of 23 percent.14
Ohio completed its last guidelines review in 2013 and found a guidelines deviation rate of 23
percent.15
West Virginia completed its last guidelines review in 2014 and found a guidelines deviation rate of
15 percent.16
The deviation rate of Arizona remained the same at 23 percent from 2008 to 2014. 17
Other findings about Pennsylvania guidelines deviation from the 2013‐2014 data are summarized below.
Most (89 percent of Pennsylvania deviations) were downward. The comparable percentage was 74
percent last review. Most states find that the majority of deviations are also downward.
The frequencies of deviations by deviation reasons are provided in Exhibit 5. The percentages do not
add up to 100 percent because multiple reasons are documented in some cases. “Other relevant
and appropriate factor” accounts for the majority of the deviations (i.e., 66 percent of the deviations
among newly established orders and 61 percent of modified orders). Other reasons accounting for
at least 5 percent of the deviations are “agreement between the parties,” “assets of the parties,”
“best interest of the child(ren),”and “other support obligations of the parties.” Similar trends were
noted last review; that is, the majority of deviations were “other relevant and appropriate factors,”
and “agreement between the parties” and the “best interest of the child(ren)” were the second and
third most common reasons for guidelines deviation, respectively. The frequency that each
guidelines deviation criterion was used, however, increased from the last review. This suggests that
not any one particular factor caused the increase in guidelines deviations.
12 Saunders, C., Young, D., Ovwigho, P.C. & Born, C. E. (2008). Maryland Child Support Guidelines: Case File Review, Family Welfare and Research Training Group, University of Maryland, Baltimore, MD. 13 Hall, L., Logan Paserella, L., and Born, C.E. (2012). Maryland Child Support Guidelines: Case Level Review 2007‐2010. Family Welfare and Research Training Group, University of Maryland, Baltimore, MD. Retrieved from: http://www.familywelfare.umaryland.edu/reports1/guidelines12.pdf . 14 Venohr, Jane and Everett, Carly (2010), Review of the New York Guidelines, Report to the New York State Department of Temporary and Disability Assistance, Center for Policy Research (October 2010). 15 Ohio Department of Jobs and Family Services. (2013). 2013 Child Support Guidelines Review. Report to the General Assembly. Retrieved from http://jfs.ohio.gov/Ocs/pdf/2013CSGuidelinesAdvCouncilReport.stm 16 Venohr, J.C. (2014). Economic Review of the West Virginia Child Support Table. Report to the West Virginia Department of Health and Human Resources, Bureau of Child Support. Center for Policy Research, Denver, CO. 17Venohr, J.C. (2014). Arizona Child Support Guidelines Review: Findings from the Case File Data. Report to Arizona Supreme Court Administrative Office of the Courts. Retrieved from http://www.azcourts.gov/Portals/31/GuidelinesReview/AZChildSupportGuidelinesReviewFindingsfromCaseFileData082014RED.pdf

REVIEW OF THE PENNSYLVANIA CHILD SUPPORT GUIDELINES: TECHNIAL FINDINGS
9
Exhibit 5: Reasons for Deviations from the Child Support Guidelines (percentage of deviations)
Newly Established Orders (orders with deviations = 630)
Modified Orders (orders with deviations = 554)
Agreement 23% 31%
Assets of Parties 11% 13%
Best Interest of Child(ren) 20% 23%
Other Support Obligations of the Parties 8% 8%
Other Relevant and Appropriate Factors 66% 61%
When newly established orders and modified orders in the 2013‐2014 sample are combined, the
average order amount among orders without and with guidelines deviations is $458 and $333 per
month, respectively. The difference is statistically significant. Last review, the comparable amounts
were $441 and $315 per month, respectively. The lower average among deviated orders reflects
that most deviations are downward adjustments to the guidelines calculation.
The average payment compliance rate does not vary among orders with and without deviations. It
is 75 percent, regardless.
Custody and Gender of Custodial Parents The analysis of the 2013‐2014 sample finds little change in the characteristics of custodial parents by
custody and gender from the 2010‐2011 sample. The support award is calculated assuming that primary
custody is granted to only one parent in 99 percent of both new and modified orders in the 2013‐2014
sample. Split custody is noted in 1 percent of both new and modified orders. A split custody calculation
requires at least two children and at least one child living with one parent and at least one other child
living with the other parent. Although there are few split custody cases, the guidelines deviation rate is
high among 2013‐2014 new orders involving split custody (42 percent) and low among 2013‐2014
modified orders involving split custody (11 percent). Last review, the deviation rate was low for all split
custody cases regardless whether it was a new or modified order. The high deviation rate among new
orders with split custody in the 2013‐2014 sample is of concern and should be monitored in the future
to ensure that the guidelines provision for split custody is appropriate. Pa.R.C.P. 1910.16‐4(d) provides a
formula for split custody situations that essentially calculates support for the children living with each
parent assuming the other parent is the obligated parent, then offsetting the difference between the
two order amounts. However, the high deviation rate observed among new orders with split custody in
the 2013‐2014 sample could be caused by small sample size: there are only 26 new orders with split
custody.
The majority of custodial parents in the 2013‐2014 sample are female. Females comprise 84 percent of
the custodial parents with new orders and 93 percent of the custodial parents with modified orders.
Males comprise 9 percent of custodial parents with new orders and 5 percent of custodial parents with
modified orders. The data extract does not discern whether or how a female or male custodial parent is
related to the child. For example, a female custodial parent could be a mother, grandmother, or aunt.

REVIEW OF THE PENNSYLVANIA CHILD SUPPORT GUIDELINES: TECHNIAL FINDINGS
10
There is a code for “other” although it is not clear how often this is used to indicate that a non‐parent
party, such as a grandmother has custody. The other code is used among 7 percent of new orders and 2
percent of modified orders in the 2013‐2014 sample. As a comparison, national data gathered by the
U.S. Census Bureau find that mothers comprise 82 percent of the custodial parents.18
Average award amounts in the 2013‐2014 sample (that combines new and modified orders) are higher
when the custodial parent is female than when the custodial parent is male (i.e., average award
amounts are $452 and $280 per month, respectively, for female and male custodial parents). This may
reflect that female noncustodial parents generally have lower incomes than male noncustodial parents.
The average net income of male noncustodial parents is $2,207 per month, and the average net income
of female noncustodial parents is $1,510 per month. Female noncustodial parents, on average, pay less
child support than male noncustodial parents. Their respective child support compliance rates are 72.3
and 76.2 percent. The guidelines deviation rate is higher among cases with male custodial parents than
female custodial parents (29 percent compared to 22 percent, respectively).
Number of Children Exhibit 6 shows that the vast majority of 2013‐2014 orders cover one child: 69 percent of new orders
cover one child, while 64 percent of modified orders cover one child. This is the number of children for
whom support is determined. It does not consider that a parent may have more children with another
partner. The patterns illustrated in Exhibit 6 differ little from the patterns observed in the previous case
file data review.
Similar patterns
exist in other
states also.
The average
support award
amount increases
as the number of
children
increases. The
guidelines
deviation rate
and child support
compliance rate
do not vary with the number of children.
Public Assistance Status and Medicaid Receipt Exhibit 7 explores the public assistance status and Medicaid receipt of the 2013‐2014 sample. Due to
data limitations, the public assistance status is at the time of the data extract rather than at the time of
18 Grall, Timothy. (2013). Custodial Mothers and Fathers and Their Child Support: 2011. Census Current Population Report P60‐246. Retrieved from http://www.census.gov/prod/2013pubs/p60‐246.pdf.
REVIEW OF THE PENNSYLVANIA CHILD SUPPORT GUIDELINES: TECHNIAL FINDINGS
11
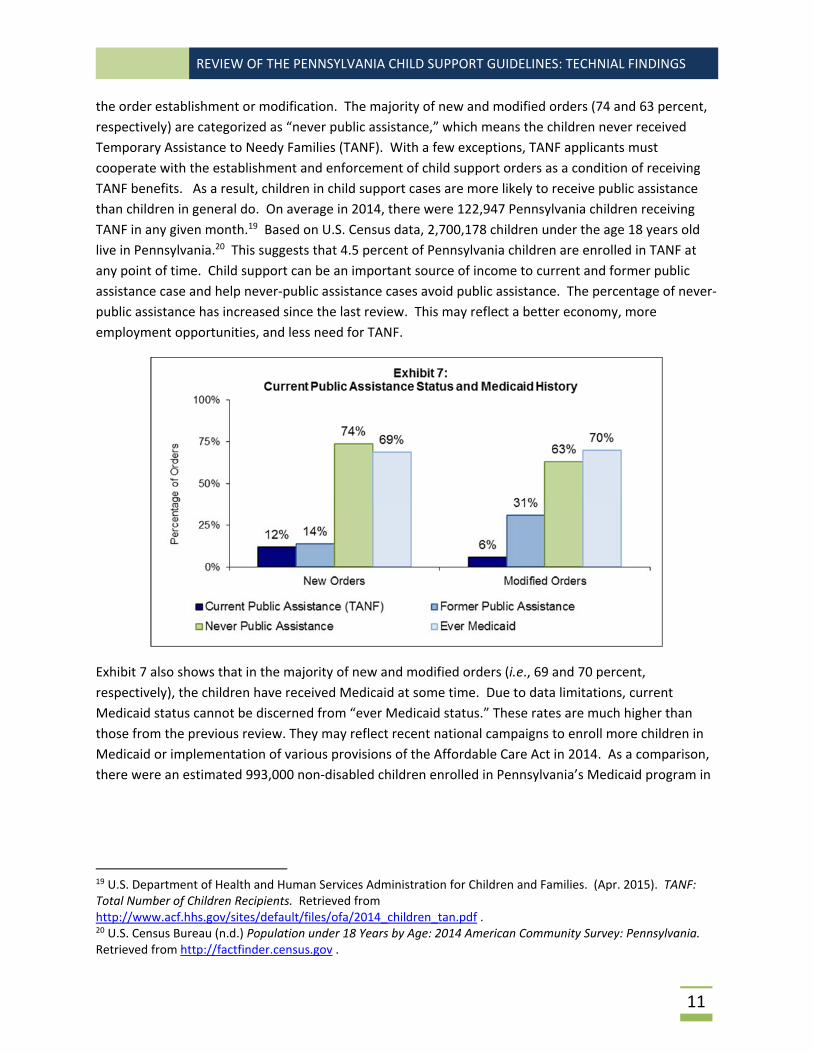
the order establishment or modification. The majority of new and modified orders (74 and 63 percent,
respectively) are categorized as “never public assistance,” which means the children never received
Temporary Assistance to Needy Families (TANF). With a few exceptions, TANF applicants must
cooperate with the establishment and enforcement of child support orders as a condition of receiving
TANF benefits. As a result, children in child support cases are more likely to receive public assistance
than children in general do. On average in 2014, there were 122,947 Pennsylvania children receiving
TANF in any given month.19 Based on U.S. Census data, 2,700,178 children under the age 18 years old
live in Pennsylvania.20 This suggests that 4.5 percent of Pennsylvania children are enrolled in TANF at
any point of time. Child support can be an important source of income to current and former public
assistance case and help never‐public assistance cases avoid public assistance. The percentage of never‐
public assistance has increased since the last review. This may reflect a better economy, more
employment opportunities, and less need for TANF.
Exhibit 7 also shows that in the majority of new and modified orders (i.e., 69 and 70 percent,
respectively), the children have received Medicaid at some time. Due to data limitations, current
Medicaid status cannot be discerned from “ever Medicaid status.” These rates are much higher than
those from the previous review. They may reflect recent national campaigns to enroll more children in
Medicaid or implementation of various provisions of the Affordable Care Act in 2014. As a comparison,
there were an estimated 993,000 non‐disabled children enrolled in Pennsylvania’s Medicaid program in
19 U.S. Department of Health and Human Services Administration for Children and Families. (Apr. 2015). TANF: Total Number of Children Recipients. Retrieved from http://www.acf.hhs.gov/sites/default/files/ofa/2014_children_tan.pdf . 20 U.S. Census Bureau (n.d.) Population under 18 Years by Age: 2014 American Community Survey: Pennsylvania. Retrieved from http://factfinder.census.gov .
REVIEW OF THE PENNSYLVANIA CHILD SUPPORT GUIDELINES: TECHNIAL FINDINGS
12
2013.21 This amounts to about 37 percent of Pennsylvania children being enrolled in family Medicaid in
Pennsylvania at any point of time.
Order amounts and deviation rates for all orders in the 2013‐2014 sample vary by public assistance
status. Average order amounts are higher among never‐public assistance cases ($517 per month) than
current public assistance or former public assistance cases ($173 and $265 per month, respectively).
Deviation rates and child support compliance rates are higher among never public assistance cases than
current and former public assistance cases. Deviation rates are 26 percent among never‐public
assistance cases, 19 percent among current public assistance cases, and 20 percent among former public
assistance cases. Child support compliance rates are 80 percent among never‐public assistance cases,
57 percent among current public assistance cases, and 68 percent among former public assistance cases.
The patterns are generally similar between new and modified orders and the findings from the last
review.
Average order amounts and child support compliance rates are also higher among cases with no
Medicaid history than those that were ever Medicaid. The average order amounts are $669 and $333
per month, respectively. The average compliance rates are 82 and 68 percent, respectively. There is no
difference in the guidelines deviation rates, however. The patterns regarding Medicaid status are
generally similar between new and modified orders and to the findings from the last review.
Incomes of Noncustodial Parents Exhibit 8 compares the average and median incomes of noncustodial parents used for the guidelines
calculation based on the 2013‐2014 sample and the 2010‐2011 sample. Several observations from
Exhibit 8 are made.
The net incomes of noncustodial parents in the 2013‐2014 sample are low when compared to
statewide data on wages. For example, the average net income of a noncustodial parent from the
2013‐2014 data is $2,200 per month among new orders. The average gross income of a
noncustodial parent from the 2013‐2014 data is $2,743 per month among new orders. In contrast,
Pennsylvania labor market information finds that gross incomes in the state are generally higher.
The labor market information shows that the 2014 average statewide wage was $22 per hour, the
average annual salary was $45,760 ($3,813 per month), median annual salary was $35,640 ($2,970
per month), and entry annual wage was $20,530 ($1,711 per month).22
There is a slight increase in noncustodial parents’ incomes from 2010‐2011 to 2013‐2014, but the
difference is not statistically significant. For example, average net income of noncustodial parents
with new orders was $2,126 per month in the 2010‐2011 sample and is $2,200 per month in the
21 The Henry J. Kaiser Family Foundation. (n.d.) “Monthly Medicaid Enrollment for Adults and Children.” State Health Facts. Retrieved from http://kff.org/medicaid/state‐indicator/monthly‐medicaid‐enrollment‐for‐adults‐and‐children‐in‐thousands/ 22 Pennsylvania Department of Labor and Industry. The Center for Workforce Information and Analysis. (n.d.) Pennsylvania Occupational Wages Statewide (May 2014). Retrieved from http://www.portal.state.pa.us/portal/server.pt?open=514&objID=814815&mode=2.

REVIEW OF THE PENNSYLVANIA CHILD SUPPORT GUIDELINES: TECHNIAL FINDINGS
13
2013‐2014 sample. This is an increase of about 3 percent. In contrast, the average wage statewide
increased almost 17 percent from 2011 to 2014, specifically from $18.84 per hour in 2011 to $22.00
per hour in 2014.23
There is little difference in incomes among new and modified orders. New orders tend to have
slightly more income, but the difference is not statistically significant.
The fact that the median income is less than the average income means that more noncustodial
parents have low incomes than high incomes. This is consistent with national trends indicating that
incomes, in general, are not rising and more low‐paying jobs are being created than high‐paying
jobs.
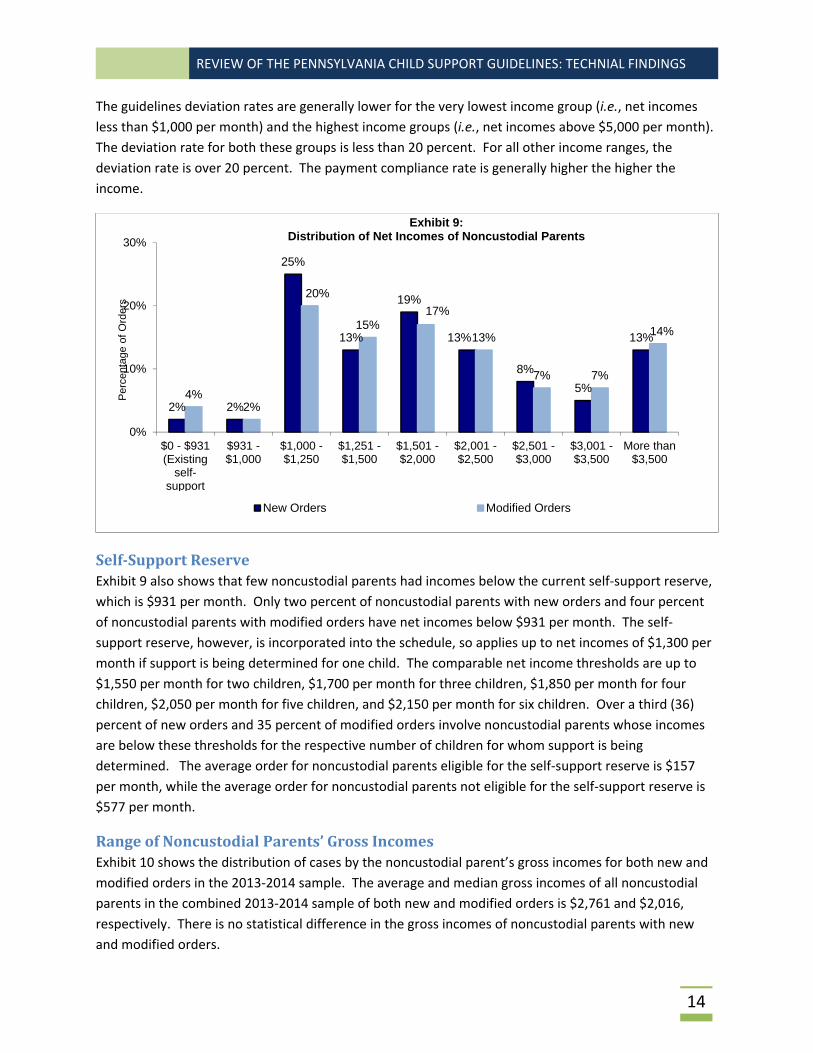
Exhibit 9 shows the income distribution of noncustodial parents. It shows a concentration of
noncustodial parents with net incomes that are essentially equivalent to after‐tax earnings from full‐
time minimum‐wage employment. The net income used for the guidelines calculation ranges from
$1,000 to $1,250 per month for 25 percent of noncustodial parents with new orders and 20 percent of
noncustodial parents with modified orders. Pennsylvania relied on the federal minimum wage ($7.25
per hour) in the years that the sampled orders were established or modified (2013 and 2014). Gross
income from a 40‐hour work week at $7.25 per hour is $1,257 per month. The net income equivalent of
this is about $1,082 per month. The income distribution patterns observed from this case file review
are similar to those observed last review. There is no significant increase or decrease in the proportion
of noncustodial parents in any income category. This suggests that noncustodial parents’ incomes have
remained fairly constant since the last review.
23 U.S. Bureau of Labor Statistics, (n.d.) State Occupation and Wage Estimates, May 2014 and May 2011. Retrieved from http://www.bls.gov/oes/current/oessrcst.htm.
REVIEW OF THE PENNSYLVANIA CHILD SUPPORT GUIDELINES: TECHNIAL FINDINGS
14
The guidelines deviation rates are generally lower for the very lowest income group (i.e., net incomes
less than $1,000 per month) and the highest income groups (i.e., net incomes above $5,000 per month).
The deviation rate for both these groups is less than 20 percent. For all other income ranges, the
deviation rate is over 20 percent. The payment compliance rate is generally higher the higher the
income.
Self‐SupportReserveExhibit 9 also shows that few noncustodial parents had incomes below the current self‐support reserve,
which is $931 per month. Only two percent of noncustodial parents with new orders and four percent
of noncustodial parents with modified orders have net incomes below $931 per month. The self‐
support reserve, however, is incorporated into the schedule, so applies up to net incomes of $1,300 per
month if support is being determined for one child. The comparable net income thresholds are up to
$1,550 per month for two children, $1,700 per month for three children, $1,850 per month for four
children, $2,050 per month for five children, and $2,150 per month for six children. Over a third (36)
percent of new orders and 35 percent of modified orders involve noncustodial parents whose incomes
are below these thresholds for the respective number of children for whom support is being
determined. The average order for noncustodial parents eligible for the self‐support reserve is $157
per month, while the average order for noncustodial parents not eligible for the self‐support reserve is
$577 per month.
RangeofNoncustodialParents’GrossIncomesExhibit 10 shows the distribution of cases by the noncustodial parent’s gross incomes for both new and
modified orders in the 2013‐2014 sample. The average and median gross incomes of all noncustodial
parents in the combined 2013‐2014 sample of both new and modified orders is $2,761 and $2,016,
respectively. There is no statistical difference in the gross incomes of noncustodial parents with new
and modified orders.
2% 2%
25%
13%
19%
13%
8%
5%
13%
4%2%
20%
15%17%
13%
7% 7%
14%
0%
10%
20%
30%
$0 - $931(Existing
self-supportreserve)
$931 -$1,000
$1,000 -$1,250
$1,251 -$1,500
$1,501 -$2,000
$2,001 -$2,500
$2,501 -$3,000
$3,001 -$3,500
More than$3,500
Per
cent
age
of O
rder
s
Exhibit 9:Distribution of Net Incomes of Noncustodial Parents
New Orders Modified Orders

REVIEW OF THE PENNSYLVANIA CHILD SUPPORT GUIDELINES: TECHNIAL FINDINGS
15
Exhibit 10: Distribution of Gross Incomes of Noncustodial Parents
Gross Monthly Income Range
Net Income Used for Guidelines Calculation
Percentage of All (New and Modified) Orders
$0‐ 1,000 $0 ‐ $1,008 4%
$1,001 ‐ $1,200 $804 ‐ $1,208 6%
$1,201 ‐ $1,300 $855 ‐ $1,394 11%
$1,301 ‐ $1,500 $986 ‐ $1,571 10%
$1,501 ‐ $2,000 $1,141 ‐ $2,111 19%
$2,001 ‐ $2,500 $1,018 ‐ $2,500 12%
$2,501 ‐ $3,000 $1,667 ‐ $3,000 9%
$3,001 ‐ $4,000 $1,275 ‐ $4,000 11%
$4,001 ‐ $5,000 $2,143 ‐ $4,935 7%
More than $5,000 $2,992 ‐ $44,000 11%
ALL $0 ‐ $44,000 100%
Exhibit 10 also shows the range of after‐tax income. In other words, the after‐tax incomes are net
incomes that are used to calculate support since the Pennsylvania child support schedule relates to the
net incomes of the parents. In general, the difference between gross and net income is federal, state
and local income taxes and FICA. Less common deductions but noted in at least 5 percent of the cases
are: mandatory retirement contributions (5 percent of noncustodial parents) and union dues (8 percent
of noncustodial parents). There were only 11 cases in which the noncustodial parent’s net income used
in the guidelines calculation was more than his or her gross income. The net incomes of these
noncustodial parents ranged from $686 to $1,695 per month. All but one had an adjustment for the
earned income tax credit (EITC), which could result in after‐tax income more than gross income. A
noncustodial parent could be eligible for the EITC if he or she has additional children living in his or her
home.
EvidenceandSourceofNoncustodialParent’sIncomeThe predominant income source for 73 percent of the noncustodial parents (including noncustodial
parents with new and modified orders) is wages or salaries. Guidelines deviation rates are higher among
those with wage or salary income than those without wage or salary income (i.e., 25 and 20 percent,
respectively). Payment compliance rates are also higher among those with wage/salary income than
those without wage or salary income (i.e., 79 and 66 percent, respectively).
Income is imputed at earning capacity for 10 percent of the noncustodial parents. Unemployment
compensation is the income source for 3 percent of the noncustodial parents. The source of the
noncustodial parents’ income is agreed to by the parties for 10 percent of the noncustodial parents. In
other words, this is similar to the parties agreeing to an order amount (which may be a reason for a
guidelines deviation), but instead the parties agree to what income should be used in the guidelines
calculation. Agreed‐to income may be arrived at during the DRS negotiation conference. The median
and average gross income among cases with agreed‐to income is $2,470 and $1,600 per month,
respectively. The guidelines deviation rate is lower when the noncustodial parent’s income is agreed to
by the parties (19 percent) than when the noncustodial parent’s income is not arrived at through
REVIEW OF THE PENNSYLVANIA CHILD SUPPORT GUIDELINES: TECHNIAL FINDINGS
16
agreement between the parties (24 percent). This may reflect that when the parents negotiate income
they do not negotiate the award amount. The payment compliance rate did not vary between those
with and with agreed‐to income.
Full‐time, minimum‐wage earnings appear to be the most common income amount when the income
source is imputation at earning capacity. The median gross income in these cases is $1,260 per month,
and 52 percent have gross incomes of $1,200 to $1,300 per month. As mentioned earlier, gross earnings
from full‐time minimum‐wage employment would be $1,257 per month. Some guidelines users round
the amount up or down or assume more or less workdays in an average month. The median net income
in cases with gross incomes of $1,200 to $1,300 per month is $1,102 per month, which approximates the
after‐tax income from full‐time, minimum‐wage earnings. There is no difference in guidelines deviation
rates between those with and without imputed incomes. There is, however, a significant difference in
payment compliance rate. Those without income imputation paid 78 percent of current support due
and those with income imputation paid 51 percent of current support due.
OrderAmountasaPercentageofGrossIncomeandPaymentsThe current federal administration proposes major changes to child support policy that they base on
research finding a negative correlation between order amounts as a percentage of the noncustodial
parent’s gross income and payment of child support. In 2014, the Federal Office of Child Support
Enforcement (OCSE) proposed rule changes that essentially would require state child support guidelines
to include a self‐support reserve and limit the use of imputed income.24 The underlying research finds
that payment rates sharply decline when the order exceeds 20 percent of the obligor’s gross income for
one child and 28 percent of the obligor’s gross income for two or more children.25 Most (77 percent) of
all new and modified orders in the Pennsylvania 2013‐2014 sample are below 20 percent of the
noncustodial parent’s gross income. Among orders for one child, 86 percent are less than 20 percent of
the noncustodial parent’s gross income. Among orders for two or more children, 84 percent are less
than 28 percent of the noncustodial parent’s gross income. Moreover, the payment patterns in the
Pennsylvania 2013‐2014 sample are not consistent with the research about the 20‐percent threshold.
For example, among one‐child orders in the Pennsylvania 2013‐2014 sample, the average compliance
rate is more among orders that are 20 percent or more of the noncustodial parent’s gross income than
the compliance rate among orders that are less than 20 percent of the noncustodial parent’s gross
income. The payment compliance rate is 79 percent for one‐child orders that are 20 percent or more of
the noncustodial parent’s gross income and 74 percent for one‐child orders that are less than 20 percent
of the noncustodial parent’s gross income.
Exhibit 11 explores whether there is a correlation between order amount as a percentage of gross
income and compliance rates in more detail. It shows that order amount as a percentage of gross
24 Department of Health and Human Services. (Nov. 17, 2014). “Flexibility, Efficiency, and Modernization in Child Support Enforcement Programs.” Federal Register, vol. 79, No. 221, p. 68580. Retrieved from http://www.acf.hhs.gov/programs/css/resource/nprm‐flexibility‐efficiency‐and‐modernization‐in‐child‐support‐enforcement‐programs. 25 For example, see Takayesu, Mark, A “Guideline“ to Improving Collections, Presentation to the National Child Support Enforcement Association Policy Briefing on February 10, 2012, Washington, D.C.

REVIEW OF THE PENNSYLVANIA CHILD SUPPORT GUIDELINES: TECHNIAL FINDINGS
17
income average 15 percent for all income ranges. It also shows that compliance and the average
number of months with payment are generally less at lower incomes than higher incomes. For example,
the average payment compliance rate is 62 percent among noncustodial parents with gross incomes of
$0 to $1,000 per month, and noncustodial parents in this income range make payments in seven of the
12‐month period tracked, on average. In contrast, the average payment compliance rate is 92 percent
and the average number of months of payments is nine out of 12 months among noncustodial parents
with gross incomes more than $5,000 per month.
As shown in Exhibit 11, the income range with the lowest average compliance rate and lowest average
number of months with payments is $1,201 to $1,300 gross per month. Noncustodial parents whose
income is imputed at full‐time minimum wage would fall into this income range.
Exhibit 11: Payment Patterns by Gross Income of Noncustodial Parents
Gross Monthly Income Range
Order Amount as Percentage of Gross Income (Average)
Average Monthly Order Amount
Average Amount Paid Per Month
Average Compliance
Rate
Average Number of Months with Payments (within
12 months)
$0‐ 1,000 12% $86 $51 62% 7 months
$1,001 ‐ $1,200 10% $107 $64 61% 7 months
$1,201‐ $1,300 9% $108 $56 53% 6 months
$1,301 ‐ $1,500 13% $185 $110 64% 7 months
$1,501 ‐ $2,000 17% $292 $185 70% 7 months
$2,001 ‐ $2,500 18% $402 $270 78% 8 months
$2,501 ‐ $3,000 18% $496 $359 84% 8 months
$3,001 ‐ $4,000 17% $581 $433 87% 9 months
$4,001 ‐ $5,000 16% $696 $550 95% 9 months
More than $5,000 15% $1,154 $930 92% 9 months
ALL 15% $428 $311 75% 8 months
Incomes of Custodial Parents Exhibit 12 compares the average and median incomes of the custodial parents that were used for the
guidelines calculations in the 2013‐2014 and 2010‐2011 samples. It is similar to Exhibit 7 that compares
the incomes of noncustodial parents, but instead Exhibit 12 compares the incomes of custodial parents.
As shown in Exhibit 12, the average and median incomes of custodial parents are low. The average net
incomes of custodial parents in the 2013‐2014 sample are $1,413 and $1,599 per month, respectively,
for new and modified orders. These amounts are not much more than the after‐tax income from full‐
time earnings at minimum wage. The 2013‐2014 averages are more than the 2010‐2011 averages. This
indicates a small increase in income over time. Like the 2010‐2011 averages, however, the incomes of
custodial parents are also substantially less than the average incomes of noncustodial parents.

REVIEW OF THE PENNSYLVANIA CHILD SUPPORT GUIDELINES: TECHNIAL FINDINGS
18
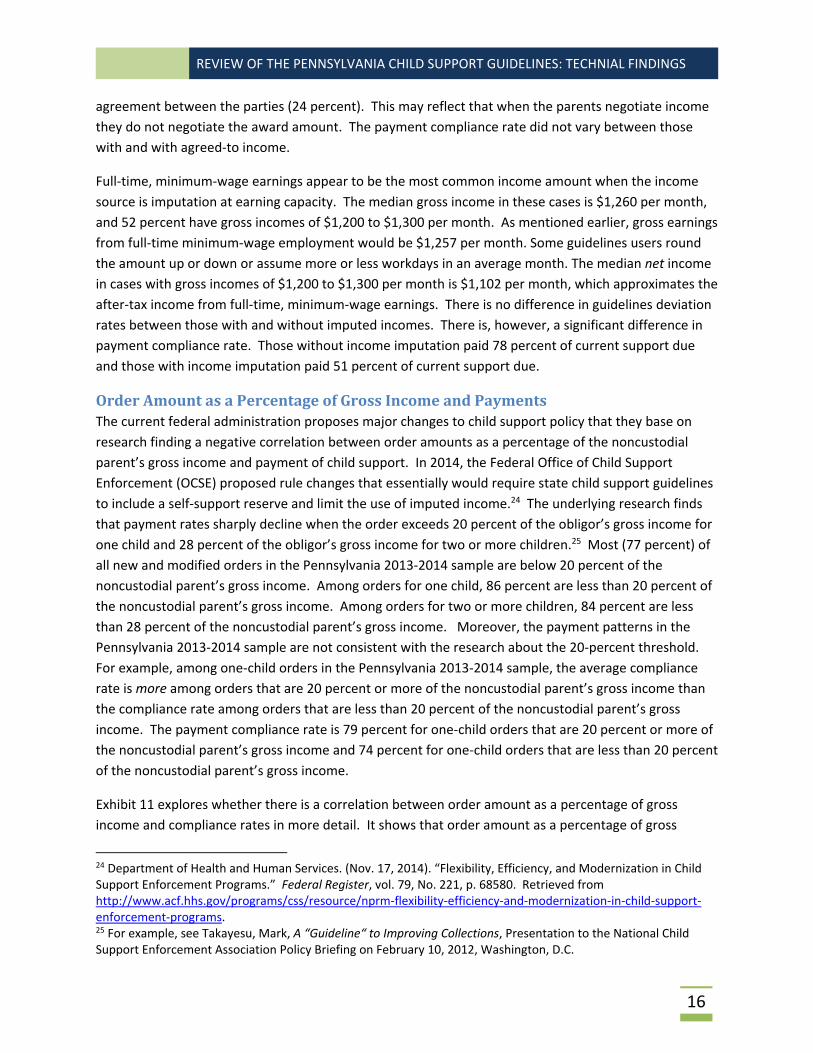
The significant share of custodial parents with zero income contributes to the low average income of
custodial parents. About one‐quarter (24 percent) of the custodial parents with new orders have zero
income and 15 percent of the custodial parents with modified orders have zero income. This is shown in
Exhibit 13, which shows the income distribution of custodial parents. In contrast, zero income is used
for very few noncustodial parents in the guidelines calculation. One reason that zero income is more
likely to be used for a custodial parent in the guidelines calculation is that the Pennsylvania guidelines
provides that income from public assistance is not counted as income for the guidelines calculation and
that income shall be imputed at earning capacity only if the party has willfully failed to obtain or
maintain appropriate employment. The majority of custodial parents with zero income are current or
former public assistance (i.e., 63 percent of custodial parents with zero income in new orders are
current or former public assistance and 72 percent of custodial parents with zero income in modified
orders are current or former public assistance recipients.) In general, custodial parents with zero
income (regardless whether they have a new or modified order) receive less child support for various
reasons including that their noncustodial‐parent counterparts also have low incomes. Custodial parents
with zero income have statistically significant lower order amounts, lower payment compliance rates,
and fewer months of payments than custodial parents with non‐zero income. The noncustodial parents
matched to custodial parents with zero income also have statistically significant less income and are
more likely to have imputed income than custodial parents with non‐zero income.
Exhibit 13 also shows that most custodial parents have lower incomes, and that only a small share have
higher incomes. For example, only 7 percent of custodial parents have net incomes of more than $3,500
per month. Order amounts are generally higher for higher income custodial parents. As seen later, this
is because higher income custodial parents usually have children with higher income noncustodial
parents. Undoubtedly, for similar reasons, payment compliance rates are generally more for higher
custodial parent incomes. There is no correlation between deviation rates and custodial parents’
incomes.
REVIEW OF THE PENNSYLVANIA CHILD SUPPORT GUIDELINES: TECHNIAL FINDINGS
19
GrossIncomeofCustodialParentsThe average and median gross income of custodial parents for all orders (i.e., new and modified orders)
in the 2013‐2014 sample is $1,781 and $1,284 per month, respectively. When converting gross income
to after‐tax income for use in the guidelines calculation, the tax filing status is head‐of‐household for 62
percent of custodial parents and single for 28 percent of custodial parents. Almost half (41 percent) of
the custodial parents with single tax‐filing status have incomes of zero.
EvidenceandSourceofCustodialParent’sIncomeThe predominant income source for 72 percent of the custodial parent in the 2013‐2014 sample is
wages and salaries. As shown earlier, income from wages and salaries is also the predominant source
of income for noncustodial parents. Income, however, is imputed at earning capacity more often for
custodial parents than noncustodial parents. Thirteen percent of custodial parents have income
imputed at earning capacity, while only 10 percent of noncustodial parents have incomes imputed at
earning capacity. Another notable difference is guidelines income based on unemployment
compensation. Unemployment compensation is more often a source of income for custodial parents
than noncustodial parents: unemployment compensation was noted as a source of income among 7
percent of custodial parents and only 3 percent of noncustodial parents.
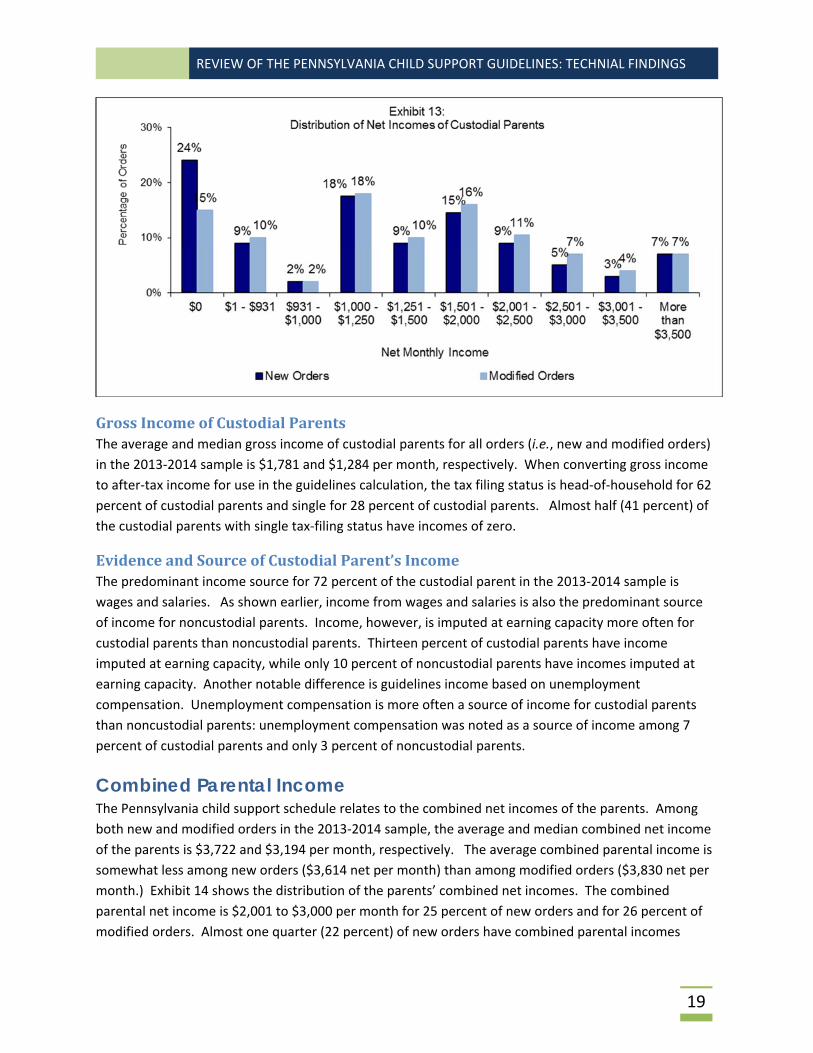
Combined Parental Income The Pennsylvania child support schedule relates to the combined net incomes of the parents. Among
both new and modified orders in the 2013‐2014 sample, the average and median combined net income
of the parents is $3,722 and $3,194 per month, respectively. The average combined parental income is
somewhat less among new orders ($3,614 net per month) than among modified orders ($3,830 net per
month.) Exhibit 14 shows the distribution of the parents’ combined net incomes. The combined
parental net income is $2,001 to $3,000 per month for 25 percent of new orders and for 26 percent of
modified orders. Almost one quarter (22 percent) of new orders have combined parental incomes
REVIEW OF THE PENNSYLVANIA CHILD SUPPORT GUIDELINES: TECHNIAL FINDINGS
20
below $2,000 per month and 17 percent of modified orders have combined parental incomes below
$2,000 per month. A small percentage of orders have combined parental incomes above $7,000 per
month (i.e., 7 percent of new orders and 9 percent of modified orders), which is the highest income
range examined in Exhibit 14.
Average order amounts and compliance rates are generally higher when combined parental income is
higher. However, combined parental income does not correlate with the guidelines deviation rate. In
all, these patterns are the same patterns observed with obligor income. They reflect that obligor
income is part of the parents’ combined income and income is an integral component of the guidelines
formula.
NoncustodialParent’sShareofCombinedIncomeIn the income shares guidelines, which is discussed more in the next section, each parent is financially
responsible for his or her prorated share of child‐rearing expenses. This includes the schedule amount
and additional child‐rearing expenses such as actual child care expenses and the child’s health insurance
premium. In the 2013‐2014 sample, the noncustodial parent’s average share of the parental combined
income is 66 percent in new orders and 61 percent in modified orders. The median noncustodial
parent’s share is 60 percent in new orders and 57 percent in modified orders. In the 2010‐2011 sample,
the median noncustodial parent’s share was 74 percent in new orders and 70 percent in modified
orders. The noncustodial parent’s share in the 2013‐2014 sample is statistically less than the
noncustodial parent’s share in the 2010‐2011 sample. This is because noncustodial parents’ incomes
have generally not increased as much as custodial parents’ incomes over time.
Exhibit 15 show the frequency of orders by the noncustodial parent’s prorated share of the parental
combined income. It places noncustodial parent’s prorated share of income into four categories. The
first category is when the custodial parent has no income, which means the noncustodial parent’s

REVIEW OF THE PENNSYLVANIA CHILD SUPPORT GUIDELINES: TECHNIAL FINDINGS
21
prorated share is 100 percent. This accounts for almost a quarter (24 percent) of new orders and 15
percent of modified orders. The second category is when the custodial parent has income, but the
noncustodial parent’s income is significantly more that the custodial parent’s income (i.e., it is 55 to 99
percent of the parental combined income. Over a third (37 percent) of new orders fall and 40 percent of
modified orders fall into this category. The third category is when the parents’ incomes are almost
equal, which is when the noncustodial parent’s share is 45 to 55 percent of the parental combined
income. This accounts for just under a quarter (23 and 24 percent, respectively) of new and modified
orders. The final category is when the custodial parent has significantly more income than the
noncustodial parent, which is defined as the noncustodial parent’s share being less than 45 percent of
the parental combined income. This accounts for 16 percent of the new orders and 21 percent of the
modified orders.
ApplicationofOtherGuidelinesProvisionsThe guidelines provide that additional child‐rearing expenses are be added to the basic obligation.26 This
includes work‐related child care expenses; the child’s health insurance premiums; the child’s
unreimbursed medical expenses; other expenses such as private school tuition, summer camp, and
other needs; and mortgage payments. The actual amount of these expenses may be added to the basic
obligation on a case‐by‐case basis. Exhibit 16 shows the frequency that these additional expenses are
part of the support award for new and modified orders in the 2013‐2014 sample and the 2010‐2011
26 Pa. R.C.P. 1910.16‐6.

REVIEW OF THE PENNSYLVANIA CHILD SUPPORT GUIDELINES: TECHNIAL FINDINGS
22
sample. Child care expenses are considered in 17 and 16 percent of new and modified orders,
respectively, in the 2013‐2014 sample. This is an increase in the percentage for new orders from the last
review, which found that child care expenses were considered in 14 percent of new orders. A similar
change did not occur among modified orders. When child care expenses are considered in the 2013‐
2014 sample, the average child care expense is $375 per month while the median is $300 per month.
This is not statistically more than the amount of childcare expense in the 2010‐2011 sample.
Exhibit 16 shows that 27 percent of 2013‐2014 new orders and 32 percent of 2013‐2014 modified orders
have an adjustment for the cost of the child’s health insurance. These percentages are less than the last
review (i.e., 30 percent of 2010‐2011 new orders and 34 percent of 2010‐2011 modified orders). The
decrease is consistent with an increase in the percentage of children who have ever been enrolled in
Medicaid. If more children are enrolled in Medicaid, there may be fewer children relying on the parent’s
health insurance. The parent responsible for providing private health insurance is the custodial parent
in 44 percent of the 2013‐2014 new orders, the noncustodial parent in 51 percent of the 2013‐2014 new
orders, and both parents in 5 percent of the 2013‐2014 new orders. The parent responsible for
providing private health insurance is the custodial parent in 50 percent of the 2013‐2014 modified
orders, the noncustodial parent in 44 percent of the 2013‐2014 modified orders, and both parents in 6
percent of the 2013‐2014 modified orders. The median cost of private health insurance for the
child(ren) for whom support is being determined that are part of the guidelines calculation are $96 per
month among custodial parents with new orders, $90 among custodial parents with modified orders,
$104 per month among noncustodial parents with new orders, and $109 per month among noncustodial
parents with modified orders. The 2013‐2014 medians are somewhat more than the 2011‐12 medians
(i.e., $74 per month among custodial parents and $83 per month among noncustodial parents). This
undoubtedly reflects increases in health care costs. Each parent’s health plan covers an average of
three persons regardless whether it is the custodial parent or noncustodial parent who is carrying the

REVIEW OF THE PENNSYLVANIA CHILD SUPPORT GUIDELINES: TECHNIAL FINDINGS
23
insurance or whether it is a new or modified order. The number covered by a healthplan is important
because only the cost for the child(ren) for whom support is being determined can be considered in the
guidelines calculation.
Exhibit 16 also shows that the child’s unreimbursed medical expenses and additional needs are
considered in few cases. Less than 1 percent of the cases include an adjustment for the child’s
unreimbursed medical expenses, and 3 percent of new orders and 4 percent of modified orders include
adjustments for the child’s additional needs.
Order amounts that are adjusted for childcare expenses are statistically higher than those that are not
adjusted for childcare expenses and have a higher guidelines deviation rate and payment rate than
those not adjusted for childcare expenses. In general, orders adjusted for childcare expenses have
higher income parents. The trends for orders that are adjusted for the child’s health insurance provided
for by the custodial parent also have similar patterns (i.e., higher orders, higher guidelines deviation
rates, and higher compliance rates). Again, this may reflect higher income cases. The trends among
orders in which the noncustodial parent provides for the child’s health insurance also have higher order
amounts and compliance rates than those in which the noncustodial parent doesn’t provide for the
child’s health insurance, but they do not have higher guidelines deviation rates. In fact, the guidelines
deviation rates are significantly higher when the noncustodial parent does not provide for the child’s
health insurance. This may reflect a traditional expectation that the noncustodial parent is responsible
for the child’s health insurance.
AdjustmentsforSubstantialSharedPhysicalCustodyThe guidelines provide an additional adjustment when the children spend 40 percent or more of their
time during the year with the obligor.27 The adjustment is applied in 9 percent of new orders and 7
percent of modified orders. These percentages are essentially the same as last review. The typical
timesharing arrangement considered in these cases is that the child spends 182 overnights with one
parent and 183 overnights with the other parent.
The average order amount is $587 per month among those with a shared‐physical custody adjustment
and $414 per month among those cases in which the adjustment was not applied. The guidelines
deviation rate is 24 percent regardless whether the adjustment is applied. Payment compliance rates
are significantly more among orders with the adjustment (the average payment compliance rate is 86
percent and 74 percent, respectively, among cases in which the adjustment was and was not applied.)
AdjustmentsforMultipleFamiliesThe guidelines provide that the obligor’s child support order can be reduced if the total of the obligor’s
basic child support obligations equals more than 50 percent of his or her monthly net income.28 The
intent of the adjustment is to treat all children of the obligor equally and not give preference to an
obligor’s first or later family. The adjustment is applied to 14 percent of new orders and 16 percent of
27 Pa.R.C.P. 1910.16‐4(c). 28 Pa.R.C.P. 1910.16‐7.

REVIEW OF THE PENNSYLVANIA CHILD SUPPORT GUIDELINES: TECHNIAL FINDINGS
24
modified orders. This is statistically more than the application rate in the 2010‐2011 sample, which was
10 percent of new orders and 14 percent of modified orders.
The adjustment reduces the order amount. The average order among cases adjusted for multiple
families is $223 per month, while the average order amount for those not adjusted is $465 per month.
The payment compliance rate is 67 percent among those with the adjustment and 77 percent among
those without the adjustment. The lower payment reflect that the noncustodial parent is also paying for
other orders, so the total amount paid for all of his or her orders may be spread thinner.
SpousalSupport/AlimonyPendenteLite(APL)In addition to child support, spousal support or alimony pendente lite (APL) may be ordered. In a small
proportion of the sample (13 percent of new orders and 8 percent of modified orders), spousal
support/APL is combined with the child support order. These were the same percentages as in the 2010‐
2011 sample.

REVIEW OF THE PENNSYLVANIA CHILD SUPPORT GUIDELINES: TECHNIAL FINDINGS
25
SECTIONIII:GUIDELINESMODELSANDECONOMICEVIDENCEONTHECOSTOFRAISINGCHILDREN
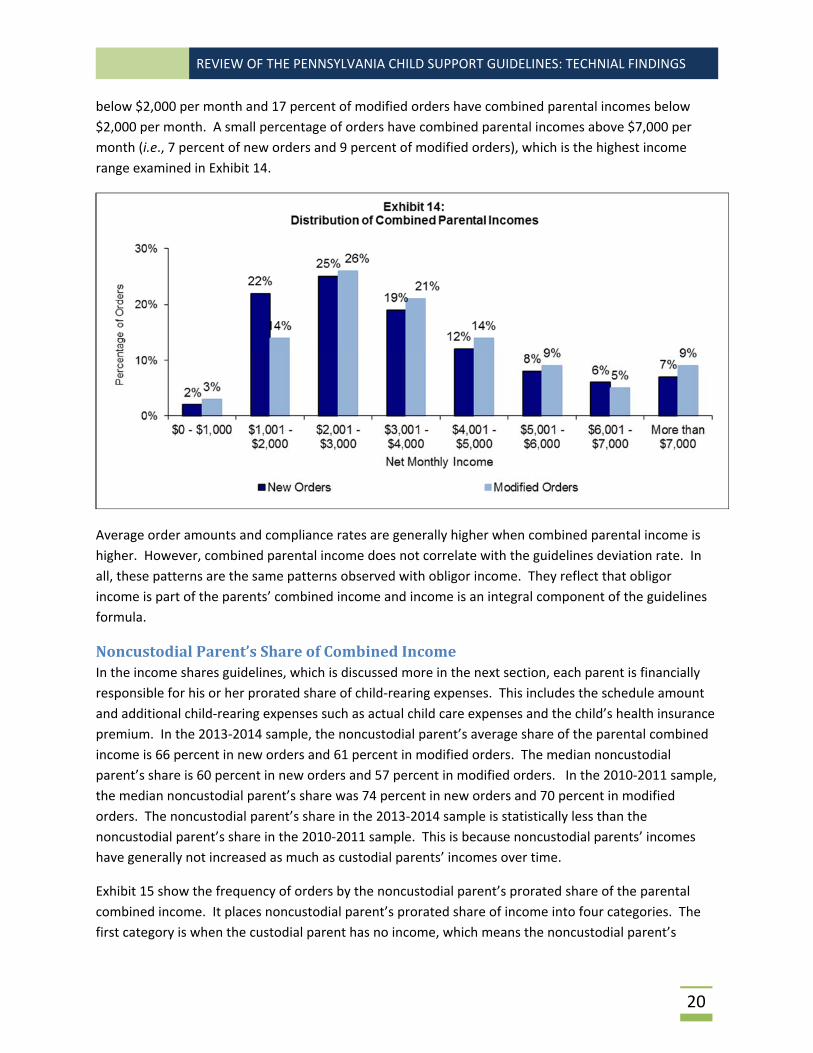
IntroductionState guidelines are partially based on economic data and partially based on policy. Most state
guidelines, including Pennsylvania, base their guideline schedules on measurements of child‐rearing
expenditures. Federal regulation (45 C.F.R. §302.56(h)) require the consideration of economic data on
the cost of child rearing in a state’s guidelines review. The intent is to ensure that state guidelines
reflect current economic data. Most states base their child support guidelines on principles and models
relating to the cost of raising children. Further, all states provide for higher support awards when the
noncustodial parent has more income. No state limits its guidelines amounts to a subsistence level or
how much is spent on children in single‐parent families. One reason is that states do not use child‐
rearing expenditures in single‐parent families is that an inordinate number of single‐parent families live
in poverty. Based on 2014 Census data, 39.7 percent of Pennsylvania female‐headed families with
children lived in poverty, and only 13.7 percent of Pennsylvania female‐headed families with children
had incomes above $60,000 per year. In contrast, 74.5 percent of Pennsylvania two‐parent families with
children had incomes above $60,000 per year. For most states, it is important that its guidelines
schedule/formula cover a wide range of incomes.
GuidelinesModelsThe most common principle used for state guidelines models is what University of Wisconsin
researchers call “continuity of expenditures model;” that is, the child support award should allow the
children to benefit from the same level of expenditures had the children and both parents lived
together.29 The consequence is that continuity‐of‐expenditures model states base their guidelines on
measurements of child‐rearing expenditures in intact families. State guidelines based on this principle
essentially believe that the guidelines should apply equally to children of divorce and children of
unmarried parents, regardless of whether the parents ever lived together, because most states believe
that children should not be the economic victims of their parents’ decisions to live apart.
States rely on two variations of the continuity‐of‐expenditures model: the income shares guidelines
model, and the percentage‐of‐obligor income model. As shown in Exhibit 17, 39 states including
Pennsylvania rely on the income shares model and 9 states rely on the percentage‐of‐obligor income
model. Besides these two models, 3 states rely on the “Melson” formula. All of the states bordering
Pennsylvania rely on the income shares except for New York, which uses the percentage‐of‐obligor
income model and Delaware, which uses the Melson formula.
29 Ingrid Rothe and Lawrence Berger, “Estimating the Costs of Children: Theoretical Considerations Related to Transitions to Adulthood and the Valuation of Parental Time for Developing Child Support Guidelines” (April 2007), IRP Working Paper, University of Wisconsin: Institute for Research on Poverty, Madison, Wisconsin.

REVIEW OF THE PENNSYLVANIA CHILD SUPPORT GUIDELINES: TECHNIAL FINDINGS
26
IncomeSharesModelThe income shares model was
developed through the 1984‐
1987 National Child Support
Guidelines Project that was
convened and tasked with
making recommendations to
states to help them develop
statewide guidelines in order to
fulfill a congressional request.
Federal law (the Child Support
Amendments of 1984 and the
Family Support Act of 1988,
respectively) required each state to have advisory guidelines by 1987 and rebuttal, presumptive
guidelines by 1989.
The income shares model was developed to embody the principles of state child support guidelines
identified by the Guidelines Project’s Advisory Panel. Among other things, these principles state that
both parents should share in the financial support of their children and the guidelines should not
assume whether the mother or father is the custodial parent.30
All six states (e.g., District of Columbia and West Virginia) that switched guidelines models in the last
two decades switched to the income shares model. The income shares model is perceived to be more
equitable because it explicitly considers both parents’ incomes and can accommodate many special
factors in the calculation, such as parenting time and the actual cost of childcare in a particular case.
Percentage‐of‐ObligorIncomeModelThe percentage‐of‐obligor income only considers the income of the noncustodial parent. Nonetheless,
most percentage‐of‐obligor models assume that the primary custodial parent devotes the same dollar
amount or percentage of income to child‐rearing expenditures as what the noncustodial parent owes
for the support award. On a practical level, the key difference between the income shares model and
the percentage‐of‐obligor income model is that under the income shares model, the support award is
lowered if the custodial parent has income and the more income that the custodial parent has, the
lower the support award. Under the percentage‐of‐obligor income model, the custodial parent income
has no bearing on the support award amount. New York bases its percentage‐of‐obligor income on the
Wisconsin percentage‐of‐obligor model, which is one of the earliest guidelines models used. The
30 National Center for State Courts. (1987). Development of Guidelines for Child Support Orders, Final Report. Report to U.S. Department of Health and Human Services, Office of Child Support Enforcement, Williamsburg, Virginia.

REVIEW OF THE PENNSYLVANIA CHILD SUPPORT GUIDELINES: TECHNIAL FINDINGS
27
Wisconsin percentage were developed by a University of Wisconsin professor and relate to
measurements of child‐rearing costs.
MelsonFormulaUsed by Delaware, Hawaii, and Montana, the Melson formula is named after a Delaware judge. It first considers the basic needs of the children and each parent. If the obligated parent’s income is more than sufficient to cover his or her share of the basic needs of the children and his or her basic needs, an additional percentage of that parent’s remaining income is assigned to child support. This additional percentage ensures that the children share in the standard of living afforded by the obligated parent.
OtherGuidelinesModelOver the decades, several alternative guidelines models have been proposed but never adopted. For example, Arizona explored the child outcome‐based support model (COBS) in 200931 and several states explored the cost shares model earlier.32 Many of these alternative models consider the living standard of each parent and the child after the transfer of support. Despite this commonality, the alternative models vary in outcomes because of variations in the assumption about parenting time and how that is addressed, tax assumptions, and the barometer used to compare standard of living. There are many nuances in tax assumptions. For example, some believe that the child tax credit should offset the child support award. Others oppose that because not all custodial households realize the federal child tax credit, and those that do, do not get it until tax filing time because it is not advanced. In other words, it does not benefit their monthly income, which constrains monthly budgeting of household expenses.
OtherStateGuidelinesDifferencesStates using the same guidelines model rarely yield similar amounts for the same case circumstances.33
This is because state guidelines use different studies of child‐rearing measurements as the base of their
schedule, price levels and tax rates from different years, and different state tax rates. State guidelines
also vary considerably in their assumptions and treatment of the child’s time with each parent,
adjustments for low‐income parents, and other factors.
EconomicEvidenceontheCostofRaisingChildrenThere are several studies measuring the cost of raising children. Most state guidelines rely on studies of
child‐rearing expenditures across a range of incomes rather than studies that examine the minimum and
basic needs of children. This is because the premise of most state guidelines is that children should
share in the lifestyle afforded by their parents. The studies typically develop measurements from
examining expenditures data from thousands of families participating in the Consumer Expenditure
Survey (CES), the nation’s largest and most comprehensive survey of household expenditures. The
studies of child‐rearing expenditures vary in the age of the data used, the methodology used to separate
31 Arizona Child Support Guidelines Review Committee, Interim Report of the Committee, Submitted to Arizona Judicial Council, Phoenix, Arizona on October 21, 2009. 32 Beld, Jo Michelle and Len Biernat (2003). “Federal Intent for State Child Support Guidelines, Income Shares, Cost Shares, and the Realities of Shared Parenting.” 37 Family Law Quarterly 165. 33 Jane C. Venohr (2013) “Child Support Guidelines and Guidelines Reviews: State Differences and Common Issues,” 43 Family Law Quarterly, 3 (Fall 2013).

REVIEW OF THE PENNSYLVANIA CHILD SUPPORT GUIDELINES: TECHNIAL FINDINGS
28
the child’s share of expenditures from total household expenditures, and other data or methodological
issues.
Economists do not agree on which methodology best measures actual child‐rearing expenditures.
Nonetheless, economists generally agree on which methodologies understate and overstate actual
child‐rearing expenditures. It is widely accepted that any guidelines amount between the lower and
upper bounds of credible measurements of child‐rearing expenditures are appropriate guidelines
amounts. In general, guidelines amounts below the lower bound are deemed to be inadequate for the
support of children.
Through a contract with the U.S. Department of Health and Human Services, Lewin/ICF (1990)34
developed this approach for assessing state guidelines. Since then, several states have used this
approach and continue to use it. The most commonly used methodology, the “Rothbarth” methodology
is generally considered the lower bound in the range of available estimates. The Betson‐Rothbarth (BR)
measurements form the basis of 29 state guidelines including Pennsylvania’s. Over time, four sets of BR
measurements have been produced. For Betson’s first study,35 he used 1980‐1986 CES Data. For his
second study, 36 he initially used from 1996‐1998 CES data, but later expanded it to encompass 1996‐
1999. For his third37and fourth studies,38 respectively, he used data from the 1998‐2004 and 2004‐2009
CES. The existing Pennsylvania schedule is based on BR3.
The most current study considered for the upper bound is conducted by the United States Department
of Agriculture (USDA). Minnesota is the only state to use the USDA study as the basis of its guidelines.
With the exception of New Jersey, which is discussed in more detail later, most of the states that do not
rely on BR measurements for their guidelines rely on very old studies of child‐rearing expenditures
dating back to the 1980s.39
34 Lewin/ICF. (1990). Estimates of Expenditures on Children and Child Support Guidelines. Report to U.S. Department of Health and Human Services, Office of the Assistant Secretary for Planning and Evaluation. Fairfax, Virginia. 35 David M. Betson (1990). Alternative Estimates of the Cost of Children from the 1980‐86 Consumer Expenditure Survey, Report to U.S. Department of Health and Human Services, Office of the Assistant Secretary for Planning and Evaluation, University of Wisconsin Institute for Research on Poverty, Madison, Wisconsin. 36 Betson, David M. (2001). “Chapter 5: Parental Expenditures on Children.” in Judicial Council of California, Review of Statewide Uniform Child Support Guideline. San Francisco, California. 37 Betson, David M. (2006). “Appendix I: New Estimates of Child‐Rearing Costs” in State of Oregon Child Support Guidelines Review: Updated Obligation Scales and Other Considerations, Report to State of Oregon, Prepared by Policy Studies Inc., Denver Colorado. Available at http://www.oregonchildsupport.gov/laws/guidelines_archive/docs/psi_guidelines_review_2006.pdf 38 Betson, David M. (2010). “Appendix A: Parental Expenditures on Children.” in Judicial Council of California, Review of Statewide Uniform Child Support Guideline. San Francisco, California. 39 Over a dozen of states base their guidelines on the following two studies: Jacques van der Gaag (1981). On Measuring the Cost of Children. Discussion Paper 663‐81. University of Wisconsin Institute for Research on Poverty, Madison, Wisconsin, and Thomas J. Espenshade. (1984). Investing in Children: New Estimates of Parental Expenditures, Urban Institute Press: Washington, D.C.

REVIEW OF THE PENNSYLVANIA CHILD SUPPORT GUIDELINES: TECHNIAL FINDINGS
29
CurrentStudiesofChild‐RearingExpendituresThere are three new and credible studies of child‐rearing expenditures.
Betson, David M. (2010). “Appendix A: Parental Expenditures on Children.” in Judicial Council of
California, Review of Statewide Uniform Child Support Guideline. San Fran‐cisco, California. Retrieved
from http://www.courts.ca.gov/partners/documents/2011SRL6aGuidelineReview.pdf
New Jersey Child Support Institute. (March 2013). Quadrennial Review: Final Report, Institute for
Families, Rutgers, the State University of New Jersey, New Brunswick, NJ. Retrieved from
http://www.judiciary.state.nj.us/reports2013/F0_NJ+QuadrennialReview‐
Final_3.22.13_complete.pdf
Lino, Mark (2014). Expenditures on Children by Families: 2013 Annual Report. U.S. Department of
Agriculture, Center for Nutrition and Policy Promotion. Miscellaneous Publication No. 1528‐2013,
Washington, D.C. Retrieved from http://www.cnpp.usda.gov/publications/crc/crc2013.pdf
Betson‐RothbarthMeasurementsBetson’s four different studies estimating child‐rearing expenditures over the past few decades vary in
other ways besides data years. Some of his studies use other methodologies besides the Rothbarth
methodology to measure child‐rearing expenditures. Betson’s first study was conducted in 1990 and
responded to a congressional mandate to provide information about child‐rearing expenditures for
states to develop and revise child support guidelines. For this study, he used and compared five
different methodologies for measuring child‐rearing expenditures and concluded that the Rothbarth
estimator produced the most “robust” (i.e., sound and statistically reliable) results and recommended its
use for state guidelines.
The Rothbarth methodology is a marginal cost approach that compares expenditures of two sets of
equally well‐off households: one set consists of two‐parent families with children and the other consists
of couples without children. The difference in their expenditures is presumed to be spent on child
rearing. The Rothbarth methodology relies on the percentage of total expenditures devoted to adult
goods (i.e., adult clothing in Betson’s application) to determine equally well‐off families.
The first three sets of BR measurements (BR1, BR2, and BR3) rely on the same assumptions and
methodologies, but different data years. The most recent BR measurements (BR4) included two
changes in data assumptions. Earlier BR measurement considers “expenditures,” while BR4 considers
“expenditures‐outlays.” Expenditures include the purchase price (and sales tax) on any item purchased
within the survey year regardless of whether the item was purchased through installments. In contrast,
outlays only capture what was actually paid toward that item during the survey period. So, if there were
only four out of 20 installment payments made during the survey period, only those four payments are
captured.
Unlike expenditures, outlays also capture mortgage principal payments, payments on second
mortgages, and payments on home equity loans. Both expenditures and outlays capture interest on the
first mortgage among homeowners and rent, utilities, and other housing expenses among renters. The

REVIEW OF THE PENNSYLVANIA CHILD SUPPORT GUIDELINES: TECHNIAL FINDINGS
30
merit of expenditures for use of state guidelines is that it excludes mortgage principal payments. This is
consistent with property settlements that have historically addressed equity in the home as part of the
divorce settlement. The merit of outlays for use in state guidelines is it is a better reflection of actual
family budgeting on a monthly basis.
The second difference is that Betson relied on a newly available measure of income developed by the
U.S. Bureau of Labor Statistics, the organization that conducts the CES. The under‐reporting of income is
a problem inherent to most surveys. The new measure attempts to correct under‐reporting, particularly
at low incomes. The problem was identified from findings from earlier CES that revealed that many low‐
income families spend considerably more than what they report as income. The new measurement
essentially bumps income for some families, hence reducing the percentage of their income spent on
child rearing.
The findings from the BR3 measurements are that, on average, child‐rearing expenditures as a
percentage of total household expenditures are 25 percent for one child, 37 percent for two children,
and 44 percent for four children. The comparable percentages from the BR4 measurements are 27
percent for one child, 37 percent for two children, and 45 percent for four children. BR4 produces
smaller amounts at low incomes and larger amounts at high incomes than BR3 does. The decrease at
low incomes may be attributable to the refinement to the income measurement, while the increase at
high income may be attributable to the use of outlays because higher income families are more likely to
have more and larger installment payments.
Seven states (i.e., Colorado, Maine, North Carolina, Rhode Island, Vermont, Virginia, and Wyoming) rely
on the most recent Betson‐Rothbarth (BR4) measurements. Still other states (i.e., Arizona, Iowa, and
Pennsylvania) have decided to retain the BR3 measurements to avoid a reduction in the schedule
amounts just because of the data assumption changes from BR3 to BR4. Another justification for
retaining BR3 is that it produces schedule amounts still within the range of BR4 and the USDA
measurements.
USDAStudyThe United States Department of Agriculture (USDA) estimates child‐rearing expenditures individually
for several expenditure categories (e.g., food, transportation, housing), then adds them to develop a
total. Only one state (Minnesota) relies on the USDA measurements as the basis of its child support
guidelines. The USDA study is considered the upper bound of current measurements of child‐rearing
expenditures. The most recent USDA study is for 2013, and it found that average child‐rearing expenses
are $10,890 to $29,060 per year for the youngest child in a two‐child family in the urban region,
including Pennsylvania, depending on family income and child age. The comparable amount for a child
in rural areas ranges from $7,510 to $19,070 per year depending on family income and child age. The
USDA finds that child‐rearing expenditures are higher in high‐income families and for older children.
When converted to a schedule, the USDA amounts are generally much higher than the BR amounts. As
a comparison, the USDA suggests the schedule amount for a combined gross income of just under
$40,000 per year would be $1,229 per month for one child. In contrast, the existing schedule amount is
$623 per month for one child at the comparable net income amount. Exhibit 18 illustrates the
REVIEW OF THE PENNSYLVANIA CHILD SUPPORT GUIDELINES: TECHNIAL FINDINGS
31
differences between the USDA and the existing Pennsylvania schedule amounts for a range of incomes.
It also illustrates the differences with the BR4 and the New Jersey‐Rothbarth measurements.
NewJerseyStudyIn 2013, New Jersey updated its guidelines using a study that was conducted by a Rutgers University
professor applying the Rothbarth methodology. However, it produced very different results from the BR
measurements. It generally shows that the percentage expended on one child is more than the BR
measurement for one child. The Rutgers study also suggests that two children do not cost much more
than one child (i.e., the amount allocated for two children is about 10 percent more than the amount
allocated for one child based on the New Jersey study).40 The Rutgers study considers expenditures data
from a larger time period (2000 through 2011), and made an adjustment to reflect New Jersey’s higher
incomes because New Jersey has one of the highest median family incomes in the nation. The Rutgers
study also considers single‐parent families and families with more than two adults living in the
household, while the BR studies consider dual‐parent families only.
DataSourceoftheEstimatesAll of the economists of the studies cited above estimated child‐rearing expenditures from the
Consumers Expenditures Survey (CES) that is administered by the U.S. Bureau of Labor Statistics (BLS).
Economists use the CES because it is the most comprehensive and detailed survey conducted on
household expenditures and consists of a large sample. The CES surveys about 6,000 households per
quarter on expenditures, income, and household characteristics (e.g., family size). Households remain in
the survey for five consecutive quarters, with households rotating in and out each quarter. Most
40 Jane C. Venohr. (2013.) “Child Support Guidelines and Guidelines Reviews: State Differences and Common Issues,” 43 Family Law Quarterly, 3 (Fall 2013).
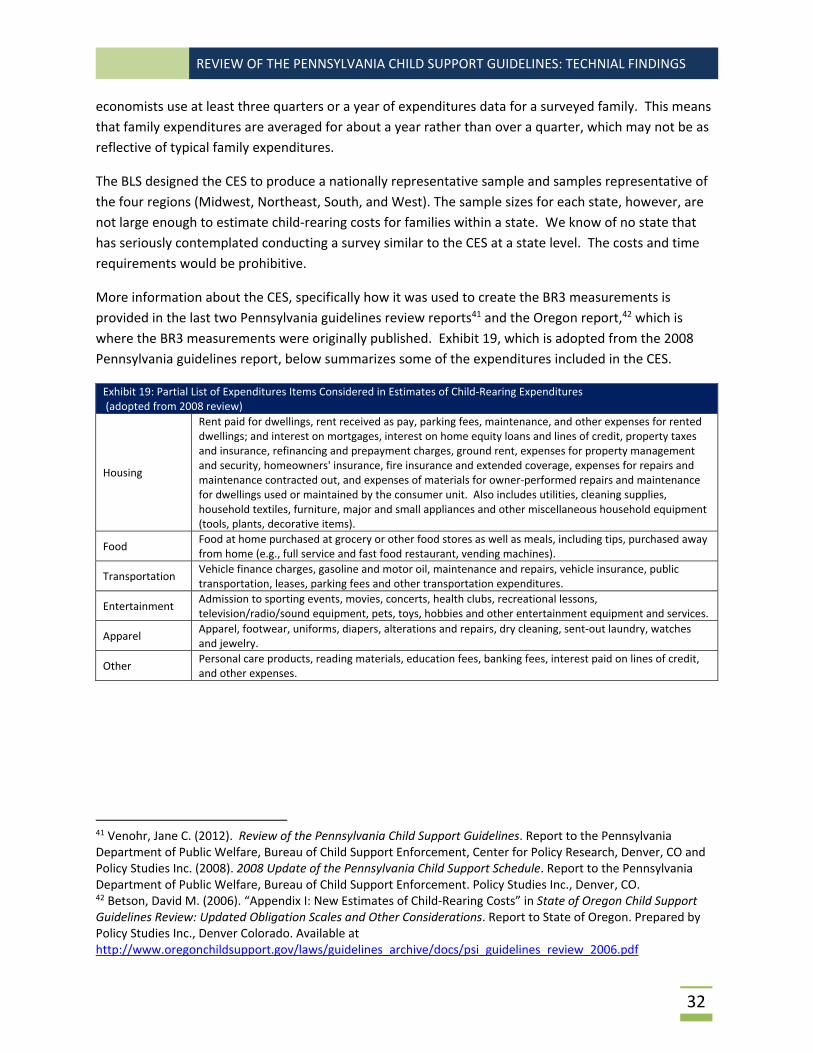
REVIEW OF THE PENNSYLVANIA CHILD SUPPORT GUIDELINES: TECHNIAL FINDINGS
32
economists use at least three quarters or a year of expenditures data for a surveyed family. This means
that family expenditures are averaged for about a year rather than over a quarter, which may not be as
reflective of typical family expenditures.
The BLS designed the CES to produce a nationally representative sample and samples representative of
the four regions (Midwest, Northeast, South, and West). The sample sizes for each state, however, are
not large enough to estimate child‐rearing costs for families within a state. We know of no state that
has seriously contemplated conducting a survey similar to the CES at a state level. The costs and time
requirements would be prohibitive.
More information about the CES, specifically how it was used to create the BR3 measurements is
provided in the last two Pennsylvania guidelines review reports41 and the Oregon report,42 which is
where the BR3 measurements were originally published. Exhibit 19, which is adopted from the 2008
Pennsylvania guidelines report, below summarizes some of the expenditures included in the CES.
Exhibit 19: Partial List of Expenditures Items Considered in Estimates of Child‐Rearing Expenditures (adopted from 2008 review)
Housing
Rent paid for dwellings, rent received as pay, parking fees, maintenance, and other expenses for rented dwellings; and interest on mortgages, interest on home equity loans and lines of credit, property taxes and insurance, refinancing and prepayment charges, ground rent, expenses for property management and security, homeowners' insurance, fire insurance and extended coverage, expenses for repairs and maintenance contracted out, and expenses of materials for owner‐performed repairs and maintenance for dwellings used or maintained by the consumer unit. Also includes utilities, cleaning supplies, household textiles, furniture, major and small appliances and other miscellaneous household equipment (tools, plants, decorative items).
Food Food at home purchased at grocery or other food stores as well as meals, including tips, purchased away from home (e.g., full service and fast food restaurant, vending machines).
Transportation Vehicle finance charges, gasoline and motor oil, maintenance and repairs, vehicle insurance, public transportation, leases, parking fees and other transportation expenditures.
Entertainment Admission to sporting events, movies, concerts, health clubs, recreational lessons, television/radio/sound equipment, pets, toys, hobbies and other entertainment equipment and services.
Apparel Apparel, footwear, uniforms, diapers, alterations and repairs, dry cleaning, sent‐out laundry, watches and jewelry.
Other Personal care products, reading materials, education fees, banking fees, interest paid on lines of credit, and other expenses.
41 Venohr, Jane C. (2012). Review of the Pennsylvania Child Support Guidelines. Report to the Pennsylvania Department of Public Welfare, Bureau of Child Support Enforcement, Center for Policy Research, Denver, CO and Policy Studies Inc. (2008). 2008 Update of the Pennsylvania Child Support Schedule. Report to the Pennsylvania Department of Public Welfare, Bureau of Child Support Enforcement. Policy Studies Inc., Denver, CO. 42 Betson, David M. (2006). “Appendix I: New Estimates of Child‐Rearing Costs” in State of Oregon Child Support Guidelines Review: Updated Obligation Scales and Other Considerations. Report to State of Oregon. Prepared by Policy Studies Inc., Denver Colorado. Available at http://www.oregonchildsupport.gov/laws/guidelines_archive/docs/psi_guidelines_review_2006.pdf

REVIEW OF THE PENNSYLVANIA CHILD SUPPORT GUIDELINES: TECHNIAL FINDINGS
33
SECTIONIV:DEVELOPMENTOFANUPDATEDSCHEDULE There are several considerations and steps taken to update the schedule. The economic data and
assumptions underlying the updated schedule are summarized below.
There are no significant changes in the underlying principles and guidelines model. (Guidelines
principles and models were discussed in the previous section.)
The basis for the schedule is the third set of Betson‐Rothbarth measurements, which are
described in the previous section.
The schedule is updated for changes in price levels.
The schedule does not include childcare, the cost of the child’s health insurance premium, and
any out‐of‐pocket expenses for the child’s healthcare. The guidelines calculation considers the
actual amounts expended for these items on a case‐by‐case basis. Specifically, each parent is
responsible for his or her prorated share of these expenses.
The schedule is based on the average of all expenditures on children from ages 0 through 17
years. There is no adjustment for the child’s age.
The schedule factors in an adjustment for the reduction to the custodial parent’s child‐rearing
expenditures when the child is with the noncustodial parent.
The schedule incorporates a self‐support reserve (SSR), and the SSR is updated for changes in
the federal poverty level.
The measurements of child‐rearing expenditures are extrapolated so the schedule can cover
very high incomes and provide formulas for combined parental incomes above $30,000 net per
month.
An updated schedule based on these considerations is provided in Appendix B.
Considerations,Steps,andAssumptionsMore detail on the assumptions and data updates are provided in the remainder of this section.
Betson‐RothbarthMeasurementsAs discussed in the previous section, the Pennsylvania schedule relies on BR3. The updated schedule
developed in this report is also based on BR3. Schedules based on the BR4 and USDA measurements
were considered for both this review and the 2012 review. They were rejected because either
measurement would have resulted in significant or non‐intuitive schedule changes that were caused by
differences in measurement methodology or assumptions, rather than real changes in child‐rearing
expenditures over time. As discussed in the previous section, there is no consensus that either the BR or
USDA approach is a better approach to measuring actual child‐rearing expenditures, and any amount
between the two measurements is considered appropriate for state guidelines usage. The BR3

REVIEW OF THE PENNSYLVANIA CHILD SUPPORT GUIDELINES: TECHNIAL FINDINGS
34
measurement is within this range (e.g., see Exhibit 18). The sense of the 2012 committee is still
applicable today.
In time, one additional consideration is that the USDA measurement is typically updated annually by the
USDA, while there is no government agency or institution that routinely updates the BR measurements.
ChangeinPriceLevelsThe existing schedule relies on September 2011 price levels. The updated schedule relies on September
2015 price levels. Price levels have increased 4.9 percent since the existing schedule was updated.
When updating for price levels, it is assumed that changes in income and consumption have kept up
with or surpassed changes in prices. Average consumption for two‐parent families with children and
one‐parent families with children has increased 10.5 percent and 6.5 percent, respectively, from 2011 to
2014.43 Recent data compiled by the Pennsylvania Department of Labor and Industry, also shows that
the average annual wage increased from $42,040 per year in 2011 to $45,750 in 2014, which is an 8.8
percent increase.44 (2014 is the most recent year for which data are available.) In other words, average
wage growth has surpassed price increases in recent years. Some of the increase is catch‐up from the
Great Recession of 2008‐2009 and its lingering aftermath, which included lackluster employment and
wage growth. One caveat is that it only reflects wages of those who are working and not those who lost
their job and never returned to work. Another caveat is other data finds that wage growth has varied by
occupation.
The increases are made to the BR3 measurements shown in Exhibit 20, which also appeared in the 2012
and 2008 reports.
ExcludedExpensesThe studies measuring child‐rearing expenditures include all expenditures on the children, including
work‐related child care expenses, the cost of the child’s health insurance benefit, and the child’s
unreimbursed medical expenses.45 In contrast, most income shares guidelines, including the existing
Pennsylvania guidelines, consider the actual amount of these expenses on a case‐by‐case basis when
calculating the support award. Since the actual amounts are considered, they are not included in the
schedule. Including them in both the schedule and worksheet would result in double‐accounting of
those expenses.
43 U.S. Bureau of Labor Statistics, Table 1502. Composition of Consumer Unit: Annual Expenditures Consumer Expenditure Survey 2011 and 2014. Retrieved from http://www.bls.gov/cex/2014/combined/cucomp.pdf 44 Pennsylvania Department of Labor & Industry. (n.d.) Occupational Employment and Wage Rates (OES) for Total, All Occupations in Pennsylvania in All time periods. Retrieved from https://paworkstats.geosolinc.com/vosnet/analyzer/results.aspx?session=oeswage 45 As discussed more in the next section, the schedule includes the first $250 per child per year to cover ordinary, uninsured medical expenses (e.g., bandages and over‐the‐counter medicines), and the appropriate amount for that should be reassessed once expenditures patterns become more stable as well as data becomes available reflecting the healthcare landscape after impact of implementing the Affordable Care Act.
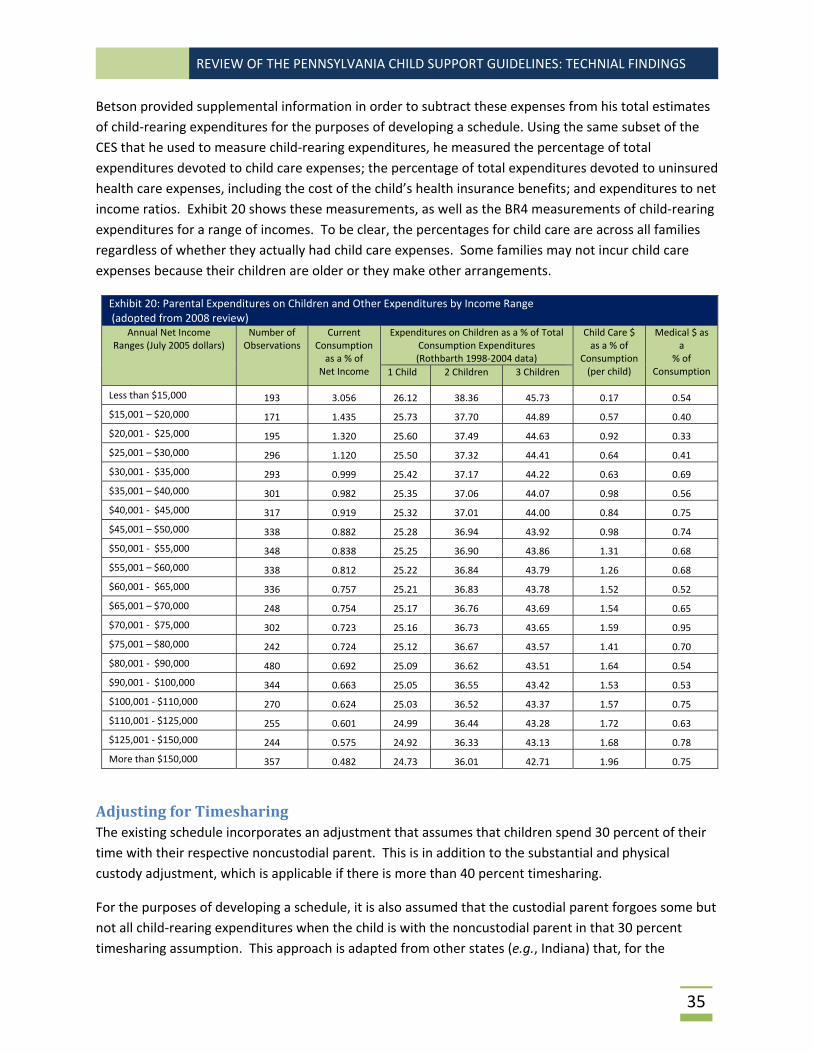
REVIEW OF THE PENNSYLVANIA CHILD SUPPORT GUIDELINES: TECHNIAL FINDINGS
35
Betson provided supplemental information in order to subtract these expenses from his total estimates
of child‐rearing expenditures for the purposes of developing a schedule. Using the same subset of the
CES that he used to measure child‐rearing expenditures, he measured the percentage of total
expenditures devoted to child care expenses; the percentage of total expenditures devoted to uninsured
health care expenses, including the cost of the child’s health insurance benefits; and expenditures to net
income ratios. Exhibit 20 shows these measurements, as well as the BR4 measurements of child‐rearing
expenditures for a range of incomes. To be clear, the percentages for child care are across all families
regardless of whether they actually had child care expenses. Some families may not incur child care
expenses because their children are older or they make other arrangements.
Exhibit 20: Parental Expenditures on Children and Other Expenditures by Income Range (adopted from 2008 review)
Annual Net Income Ranges (July 2005 dollars)
Number of Observations
Current Consumption as a % of
Net Income
Expenditures on Children as a % of TotalConsumption Expenditures (Rothbarth 1998‐2004 data)
Child Care $ as a % of
Consumption (per child)
Medical $ as a
% of Consumption 1 Child 2 Children 3 Children
Less than $15,000 193 3.056 26.12 38.36 45.73 0.17 0.54
$15,001 – $20,000 171 1.435 25.73 37.70 44.89 0.57 0.40
$20,001 ‐ $25,000 195 1.320 25.60 37.49 44.63 0.92 0.33
$25,001 – $30,000 296 1.120 25.50 37.32 44.41 0.64 0.41
$30,001 ‐ $35,000 293 0.999 25.42 37.17 44.22 0.63 0.69
$35,001 – $40,000 301 0.982 25.35 37.06 44.07 0.98 0.56
$40,001 ‐ $45,000 317 0.919 25.32 37.01 44.00 0.84 0.75
$45,001 – $50,000 338 0.882 25.28 36.94 43.92 0.98 0.74
$50,001 ‐ $55,000 348 0.838 25.25 36.90 43.86 1.31 0.68
$55,001 – $60,000 338 0.812 25.22 36.84 43.79 1.26 0.68
$60,001 ‐ $65,000 336 0.757 25.21 36.83 43.78 1.52 0.52
$65,001 – $70,000 248 0.754 25.17 36.76 43.69 1.54 0.65
$70,001 ‐ $75,000 302 0.723 25.16 36.73 43.65 1.59 0.95
$75,001 – $80,000 242 0.724 25.12 36.67 43.57 1.41 0.70
$80,001 ‐ $90,000 480 0.692 25.09 36.62 43.51 1.64 0.54
$90,001 ‐ $100,000 344 0.663 25.05 36.55 43.42 1.53 0.53
$100,001 ‐ $110,000 270 0.624 25.03 36.52 43.37 1.57 0.75
$110,001 ‐ $125,000 255 0.601 24.99 36.44 43.28 1.72 0.63
$125,001 ‐ $150,000 244 0.575 24.92 36.33 43.13 1.68 0.78
More than $150,000 357 0.482 24.73 36.01 42.71 1.96 0.75
AdjustingforTimesharingThe existing schedule incorporates an adjustment that assumes that children spend 30 percent of their
time with their respective noncustodial parent. This is in addition to the substantial and physical
custody adjustment, which is applicable if there is more than 40 percent timesharing.
For the purposes of developing a schedule, it is also assumed that the custodial parent forgoes some but
not all child‐rearing expenditures when the child is with the noncustodial parent in that 30 percent
timesharing assumption. This approach is adapted from other states (e.g., Indiana) that, for the

REVIEW OF THE PENNSYLVANIA CHILD SUPPORT GUIDELINES: TECHNIAL FINDINGS
36
purposes of the parenting‐time adjustment in their child support guidelines, categorize child‐rearing
expenditures into three groups: transferred expenses, duplicated fixed, and controlled expenses.
Transferred expenses are those that are incurred only by one parent when the children are physically
with that parent. A transferred expense (e.g., movie ticket) is transferred to the other parent when the
child “moves” from one parent’s residence to the other parent’s residence. Fixed duplicated expenses
are those incurred by both parents for the child (e.g., the cost of an extra bedroom for the child).
Controlled expenses are those typically paid by one parent and are not transferred or duplicated (e.g., a
cell phone for the child or a child’s winter coat). Economists, researchers, and policy experts have not
standardized which expenses are transferred, duplicated fixed, and controlled. There are only a handful
of states that incorporate this concept into their child support guidelines.
The existing Pennsylvania schedule incorporates the assumption that most food expenditures and all
expenditures on admissions and fees for the child’s entertainment are transferrable. Specifically, 75
percent of the child’s food expenses are assumed to be transferrable. One hundred percent is not used
to account for volume discount pricing (e.g., buying a gallon of milk instead of buying a quart). The
updated schedule uses the same assumption and data. The only difference is that instead of using 2010
data on entertainment admissions and fees, it uses the same information from the third quarter of 2013
through the second quarter of 2014, which was the most current data available when the updated
schedule was developed.46
IncorporatingaSelf‐SupportReserveThe intent of the self‐support reserve is to allow the obligated parent sufficient income after payment of child support to live at least at a subsistence level. The existing schedule uses the 2012 federal poverty level (FPL) for one person ($931 per month). The updated schedule includes the 2015 FPL, which is $981
per month. It is incorporated into the schedule by examining the BR3‐calculated amount to the difference between
net income and the self‐support reserve that is weighted by a factor of 90 percent for one child, 91
percent for two children, 93 percent for three children, and so forth. The purpose of the weight is not to
assign each additional dollar to child support. If the weighted difference is less than the BR3‐caculated
amount, it appears in the schedule.
For example, at a net income of $1,000 per month, the BR3‐calculated amount for one child would be
$243. The difference between $1,000 and $981 is $19 per month, and 90 percent of $19 is $17, which is
less than $243 per month. So, the $17 amount is what appears in the proposed schedule at the net
income of $1,000 per month for one child.
The self‐support reserve is phased out of the schedule when the net income is above $1,300 per month
for one child, $1,550 per month for two children, $1,700 per month for three children, $1,850 per
month for four children, $2,000 per month for five children, and $2,150 for six children.
46 Bureau of Labor Statistics. (n.d.) Table 1502. Composition of Consumer Unit: Annual Expenditure (3rd quarter 2013 through 2nd quarter 2014). Retrieved from http://www.bls.gov/cex/2014/share/cucomp.xls .

REVIEW OF THE PENNSYLVANIA CHILD SUPPORT GUIDELINES: TECHNIAL FINDINGS
37
AdjustmentforHigherIncomesThe existing schedule stops at $30,000 net per month. The existing guidelines, however, provide a
formula for incomes above that. For example, if income is above $30,000 per month, the one‐child
formula is $2,801 plus 8.5 percent of combined net income above $30,000 per month. The $2,801
amount is the highest amount in the schedule, and its inclusion in the formula implicitly states that the
basic obligation for very high incomes shall not be less than the highest amount in the schedule.
The existing schedule amounts above combined net incomes of $22,000 per month and the high income
formula for combined net incomes above $30,000 per month are based on extrapolations from the BR3
measurements. The extrapolations are necessary because there are insufficient numbers of very high‐
income families to produce robust measurements at very high incomes.
The high‐income percentages for the existing guidelines were developed using a regression equation in
which the BR3 percentages (with the other adjustments described above) are logged on to income to
the third degree. Using the same approach would just shift the percentages but not increase the
percentage applied to higher incomes. Instead, those percentages are increased by the median
percentage increase for the updated schedule. For example, the updated formula for one child is $2,839
plus 8.6 percent of combined net income above $30,000 per month. The $2,839 is the highest amount
on the proposed schedule. The 8.6 percent results from the previous percentage (8.5 percent)
multiplied by the median change in one‐child schedule amounts, which is 1.7 percent. The median
changes are shown in the table comparisons in Appendix C.
A redline/strikeout version of the proposed changes to the formulas for net incomes above $30,000 per
month is shown below.
One child: $2,801 2,839 + 8.5 8.6% of combined net income above $30,000 per month.
Two children: $3,836 3,902 + 11.6 11.8% of combined net income above $30,000 per month.
Three children: $4,277 4,365 + 12.6 12.9% of combined net income above $30,000 per month.
Four children: $4,718 4,824 + 14.3 14.6% of combined net income above $30,000 per month.
Five children: $5,190 5,306 + 15.8 16.1% of combined net income above $30,000 per month.
Six children: $5,641 5,768 + 17.1 17.5% of combined net income above $30,000 per month.
OtherAssumptionsandStepsLike the existing schedule, the updated schedule includes other assumptions and steps. One of the
other steps considers extending the BR3 measurements (which are limited to one, two, and three
children) to four and more children. Like the existing schedule, this is done using the equivalence scale
developed by the National Research Council (NRC).47 The NRC is:
= (Number of adults + 0.7 x number of children)0.7
47 Citro, Constance F. and Robert T. Michael, Editors. (1995). Measuring Poverty: A New Approach. National Academy Press. Washington, D.C.

REVIEW OF THE PENNSYLVANIA CHILD SUPPORT GUIDELINES: TECHNIAL FINDINGS
38
Another step is converting the BR3 measurements to net income, which is the basis of the Pennsylvania
schedule. The BR3 measurements are expressed as a percentage of total household expenditures. Some
families spend more or less than their after‐tax income. As shown in Exhibit 20, lower‐income families
spend more of their after‐tax incomes on average and higher‐income families spend less than their
after‐tax income on average. The BR3 percentages are converted to percentages of net incomes using
this information by multiplying the BR3 percentage (adjusted for child care expenses and the child’s
health care expenses) by the average expenditures ratio for each income bracket. An exception is made
for families spending more than 100 percent of their after‐tax income. At these income levels, it is
assumed that the BR3 measurement is the same as the percentage of net income devoted to child‐
rearing expenditures. Without this cap, the percentages at very low‐incomes would be much higher.
The latest published CES data48 shows that the bottom 50th percentile of consumer units (i.e., all
households in the CES, not just those that are families with children) spend more than their after‐tax
income. The after‐tax income of the 50th percentile (in other words, the median income) is $39,810 per
year.
ComparisonsofExistingandUpdatedScheduleAppendix C contains a detailed, side‐by‐side comparison of the existing and proposed schedules. It
shows that the average change is about 1.4 percent and the median change is about 2.0 percent. It
shows that the only decreases are areas in which the self‐support reserve has been updated.
Exhibits 21, 22, and 23 compare the difference between the existing schedule and updated schedule
using five scenarios for one child, two children, and three children, respectively. The case examples
consider median income by educational attainment of Pennsylvania male and female workers. The
data are from the 2015 Census Community Survey and, shown below are broken down into five levels of
educational attainment.
Median Earnings by Gender and Educational Attainment for Pennsylvania Workers 25 years and over with earnings (Source: U.S. Census Bureau 2014 American Community Survey
Annual Earnings Less than high school graduate
High school graduate (includes
equivalency)
Some college or associate’s
degree
Bachelor’s degree
Graduate or professional
degree
Male Median Earnings/Income of Noncustodial parent $26,036 $36,370 $41,979 $60,385 $81,156
Female Median Earnings/Income of Custodial Parent $14,451 $22,720 $29,893 $41,185 $56,021
Gross income is converted to after‐tax income using prevailing federal and state income withholding
formulae and FICA. It is assumed that the noncustodial parent’s filing status is single and the custodial
parent files as a head of household and claims the children as tax exemptions. It is assumed that there
are no adjustment to either parent’s income, there are no additional expenses such as child care
expenses, and that there is no adjustment for substantial or physical custody.
48 U.S. Bureau of Labor Statistics. (n.d.) Table 1110. Deciles of income before taxes: Annual expenditures (2014 Consumer Expenditure Survey). Retrieved from http://www.bls.gov/cex/2014/combined/decile.pdf
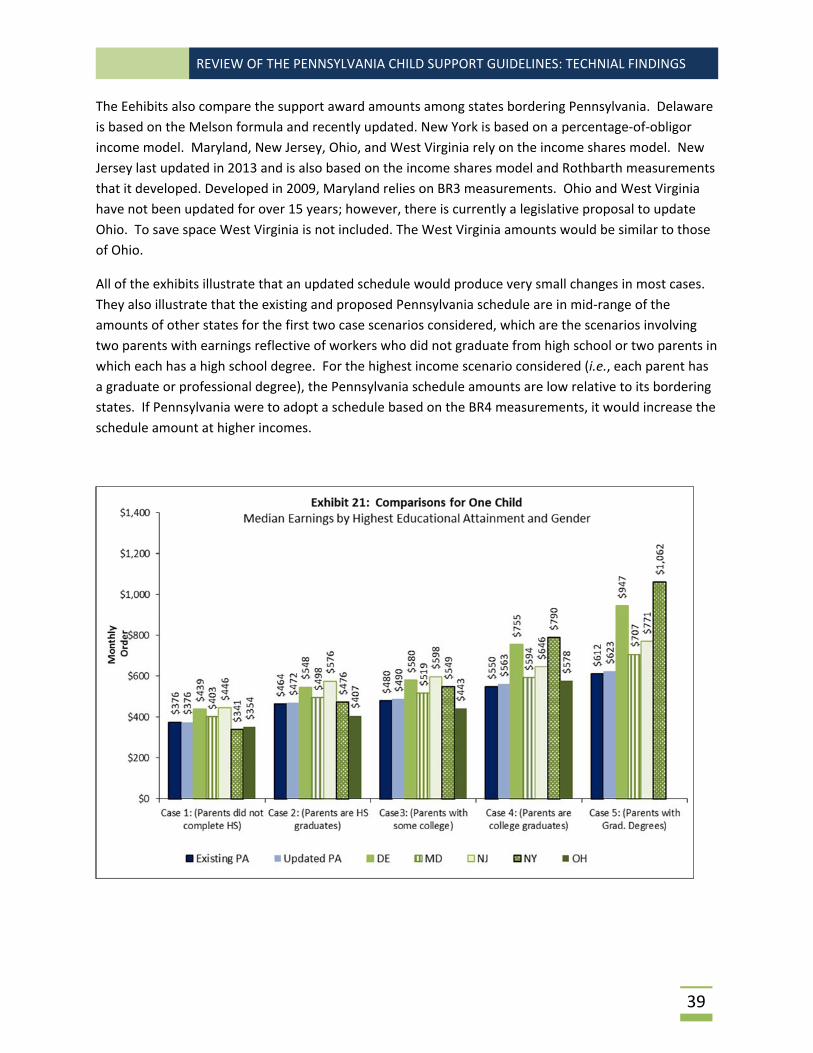
REVIEW OF THE PENNSYLVANIA CHILD SUPPORT GUIDELINES: TECHNIAL FINDINGS
39
The Eehibits also compare the support award amounts among states bordering Pennsylvania. Delaware
is based on the Melson formula and recently updated. New York is based on a percentage‐of‐obligor
income model. Maryland, New Jersey, Ohio, and West Virginia rely on the income shares model. New
Jersey last updated in 2013 and is also based on the income shares model and Rothbarth measurements
that it developed. Developed in 2009, Maryland relies on BR3 measurements. Ohio and West Virginia
have not been updated for over 15 years; however, there is currently a legislative proposal to update
Ohio. To save space West Virginia is not included. The West Virginia amounts would be similar to those
of Ohio.
All of the exhibits illustrate that an updated schedule would produce very small changes in most cases.
They also illustrate that the existing and proposed Pennsylvania schedule are in mid‐range of the
amounts of other states for the first two case scenarios considered, which are the scenarios involving
two parents with earnings reflective of workers who did not graduate from high school or two parents in
which each has a high school degree. For the highest income scenario considered (i.e., each parent has
a graduate or professional degree), the Pennsylvania schedule amounts are low relative to its bordering
states. If Pennsylvania were to adopt a schedule based on the BR4 measurements, it would increase the
schedule amount at higher incomes.
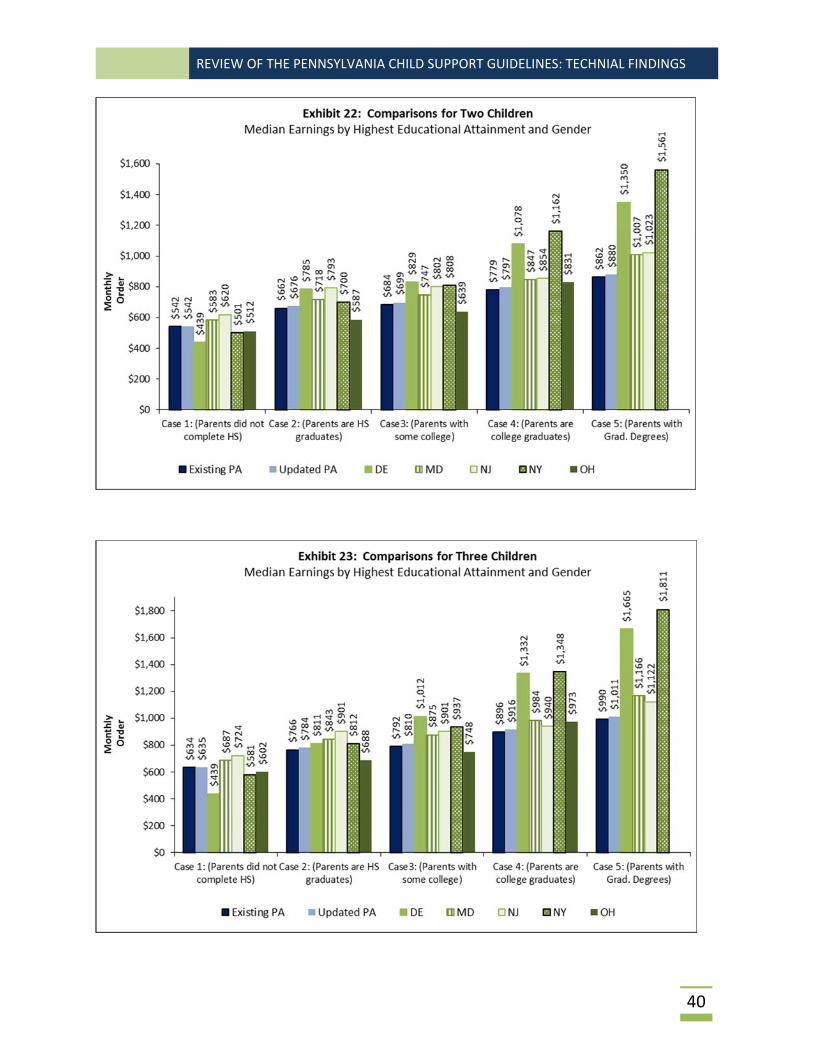
REVIEW OF THE PENNSYLVANIA CHILD SUPPORT GUIDELINES: TECHNIAL FINDINGS
40

REVIEW OF THE PENNSYLVANIA CHILD SUPPORT GUIDELINES: TECHNIAL FINDINGS
41
SECTIONV:CONSIDERATIONOFSPECIALFACTORS:COMPARISONTOOTHERSTATES
This section considers how the Pennsylvania provisions for several special factors compare to those of
other states, particularly neighboring states. The section discusses adjustments for substantial or shared
physical custody, adjustments for additional child‐rearing expenditures (i.e., child care expenses and the
cost of the child’s health insurance premium and other non‐reimbursed health care costs for the child),
adjustments for an obligated parent with multiple families, adjustments for the cost of living, and
income issues. The income issues consist of categories of income, treatment of overtime income,
imputed income and earning capacity, low‐income adjustments including a self‐support reserve, and
formulas for high‐income parties.
OverviewofStatesUsedinComparisonsPennsylvania is the sixth largest state in the nation. Its child support program ranks among the highest
in state child support performance measures (e.g., percent of current collected) as provided for in the
Child Support Performance and Incentive Act of 1998. Exhibit 16 compares state characteristics relevant
to child support among Pennsylvania and neighboring states. Exhibit 16 also considers Michigan and the
District of Columbia because of their geographical proximity as well as their similarities and differences
with Pennsylvania.
Exhibit 24: Comparison of Selected Characteristics among Pennsylvania and Neighboring States
State Total
Populationa Number of Childrena
State Child Support Caseloadb
Percentage of Caseload
under Orderb
Percent‐age of Current Support Collectedb
Median Income of Married‐Couples with
Childrena
Poverty Rate among Female‐Headed
Families with Childrena
Pennsylvania 12,787,209 2,700,178 405,107 89.79% 83.54% $ 91,674 40%
Delaware 935,614 203,842 79,936 70.52% 58.18% $100,387 31%
Dist. of Col. 658,893 115,030 51,122 68.28% 61.53% $156,438 38%
Maryland 5,976,407 1,351,175 214,415 85.21% 67.75% $115,514 25%
Michigan 9,099,877 2,223,636 954,770 79.64% 68.87% $ 83,788 44%
New Jersey 8,938,175 2,012,197 363,950 80.86% 65.41% $117,618 32%
New York 19,746,227 4,225,273 903,606 82.13% 65.70% $ 95,033 39%
Ohio 11,594,163 2,635,640 873,517 88.34% 67.99% $ 85,604 45%
W. Virginia 1,850,326 383,200 132,528 87.19% 65.41% $ 70,965 52%
USA 318,857,056 73,577,423 15,123,618 84.69% 64.21% $ 85,739 41% aU.S. Census Bureau. (n.d.) 2014 American Community Survey. Available from:http://factfinder.census.gov bFederal Office of Child Support Enforcement. (2015) Annual Report: Preliminary 2014. Available from:https://www.acf.hhs.gov/sites/default/files/programs/css/fy2014_preliminary.pdf
Exhibit 24 also shows that 2.7 million children live in Pennsylvania. Children account for 21 percent of Pennsylvania’s total population and 23 percent of the nation’s population. Census data also find that 26 percent of Pennsylvania children live in female‐headed families. This is identical to the national percentage: that is, 26 percent of all U.S. children live in female‐headed families. These children are likely to be eligible for child support. In addition, children living in male‐headed families are likely to be eligible for child support, and children living with a married couple in which one of the parents is a
REVIEW OF THE PENNSYLVANIA CHILD SUPPORT GUIDELINES: TECHNIAL FINDINGS
42
stepparent may be eligible for child support. In other words, 26 percent likely understates the percentage of children eligible for child support. Exhibit 24 shows each state’s IV‐D caseload, which is named after Section IV‐D of the Social Security Act that authorizes state child support programs. Pennsylvania has a state child support caseload of 405,107. Michigan, New York, and Ohio have higher state caseloads. In all, Pennsylvania ranks ninth among states in state child support caseload size. More populous states generally have higher caseloads. Another factor affecting state caseload is the extent that child support cases are automatically put into the IV‐D caseload. For example, Michigan’s Friend of the Court system routes almost every legal complaint in which child support is an issue, including divorcing cases, into the Michigan IV‐D program. A third factor concerns differences in states’ case closure procedure. Some states are more or less likely to use federally permissible criteria to close a case (e.g., closing an arrears‐only case in which all arrears is owed to the State and the noncustodial parent is not located.)
Adjustments for Parenting Time (Substantial or Shared Custody) Research generally shows that children do better when both parents are in their children’s lives.49 It
shows that positive father involvement can improve a child’s academic success, reduce levels of
delinquency, and promote the child’s social and emotional well‐being.50 If each parent cares for the
children some of the time, each parent will incur some direct child‐rearing expenditures. State
guidelines deal with this fact a variety of ways.
RelevantFactsandStatisticsandFederalGuidance:ParentingTimeThe U.S. Census uses the terms, “visitation privilege” and “joint custody” in its surveys about parenting
time in child support cases. Problems exist with both terms. It is generally recognized that the term
visitation does not adequately capture the action of parenting. When the children are with the
noncustodial parent, the children are in the care of the noncustodial parent, not just visiting. Other
terms such as “parenting time,” “shared parenting,” and “shared responsibility” have replaced the use
of the term, “visitation,” but not one term has emerged as the standard and consistent replacement.
“Joint custody” can be a legal term used to described joint physical custody or joint legal custody and
may not be consistently defined from state to state. Despite these caveats, the terms “visitation
privilege: and “joint custody,” which are the U.S. Census terms, are used to describe the findings from
the U.S. Census.
Based on U.S. Census surveys of custodial parents who were supposed to receive child support in 2013,
80 percent of the custodial parents nationally reported that the other parent had visitation privileges
and 30 percent reported that the other parent had joint custody, either legal or physical or both. In all,
83 percent of custodial parents who were supposed to receive child support in 2013 reported that the
other parent had either visitation privileges or joint custody. Having visitation privileges or joint custody
is only part of picture. Another consideration is whether the other parent exercises visitation or physical
49 For example, see U.S. Department of Health and Human Services, Administration for Children and Families. (n.d.) Pathways to Fatherhood. Retrieved from http://www.acf.hhs.gov/programs/ofa/programs/healthy‐marriage/responsible‐fatherhood. 50 Osborne, Cynthia and Ankrum, Nora. (April 2015.) “Understanding Today’s Changing Families.” Family Court Review, Vol. 53, No. 2. pp 221‐232.

REVIEW OF THE PENNSYLVANIA CHILD SUPPORT GUIDELINES: TECHNIAL FINDINGS
43
custody. Most (73 percent) of the surveyed parents reported that the other parent had some contact
with the child in the last year.
Another way to look at the issue is the extent that fathers living apart from their children are involved
with their children. The Pew Research Center finds that the percentage of children living apart from
their fathers has increased from 11 percent in 1960 to 27 percent in 2010.51 The same Pew study finds
that among fathers and children living separately, 22 percent have contact more than once a week, 29
percent have contact one to four times a month, 21 percent have contact several times a year, and 27
percent have no visits.
Pennsylvania‐specific data on the number of child support cases in which the parent obligated to pay
support has visitation privileges or joint legal custody are not readily available. Similarly, there is no
Pennsylvania specific data on the frequency of visitation when fathers and children live apart. The
analysis of the 2013‐2014 casefile data reveals that an adjustment for substantial or shared physical
custody was applied in 9 percent of new orders and 7 percent of modified orders. These percentages do
not reflect all cases in which the obligated parent has visitation privileges or joint custody because the
guidelines adjustment can only be applied when the children spend 40 percent or more of their time
with the obligated parent. Some parents may have visitation privileges that consist of less than 40
percent timesharing.
There are no federal regulations addressing adjustments for physical custody visitation privileges,
shared placement, or shared responsibility in state child support guidelines.
Pennsylvania’sCurrentProvision:ParentingTimePennsylvania’s consideration of parenting time in its child support guidelines is unique, and consists of
two components. The first component is the incorporation of a timesharing adjustment into the basic
child support schedule. The second component is an adjustment formula for when the children are with
the obligated parent for 40 percent or more of the time. The schedule adjustment assumes that the
obligated parent has 30 percent parenting time. The formulaic adjustment for 40 percent or more
parenting time is shown below. It affects the obligated parent’s prorated share of the total child
support obligation (i.e., the amount owed by both parties), which is core to the calculation of the
support award. It essentially reduces the obligated parent’s prorated share by 10 percentage points;
then, the percentage point reduction incrementally increases to a 20 percentage point reduction at 50
percent timesharing. It also generally requires that the parent with the higher income pays support if
the children spend equal time with both parents.
51 Livingston, Gretchen, and Parker, Kim. (June 2011) A Tale of Two Fathers: More Are Active, but More Are Absent. Pew Social & Demographic Trends. Retrieved from http://www.pewsocialtrends.org/files/2011/06/fathers‐FINAL‐report.pdf /

REVIEW OF THE PENNSYLVANIA CHILD SUPPORT GUIDELINES: TECHNIAL FINDINGS
44
ProvisionsinOtherStatesMost (37) state guidelines provide a presumptive formula for parenting time or shared custody. Most
states impose two criteria before the adjustment can be applied: a timesharing threshold must be met,
and there must be court‐ordered parenting time, a parenting plan, and/or agreement between the
parties. The timesharing threshold ranges from one overnight (e.g., Oregon) to essentially equal
timesharing (e.g., Kansas). The timesharing threshold for applying the formulaic adjustment is 20
percent or less in eight states (including the neighboring state of New Jersey); more than 20 percent
timesharing but less than 35 percent timesharing in 20 states (including the neighboring states of
Delaware, Maryland, and District of Columbia); and 35 percent or more in nine states (including
Pennsylvania). Only six states have a higher timesharing threshold for their shared‐custody formula
than Pennsylvania. Several states (e.g., Delaware, Massachusetts, and Nebraska) have lowered their
timesharing threshold in recent years.
The Pennsylvania formula that applies to 40 percent or more timesharing is not used by any other state,
and it produces a smaller adjustment in most cases than any other state’s timesharing formula. This is
apparent in Exhibits 25 and 26, which compare the shared‐custody formulas of Pennsylvania, Delaware,
Maryland, New Jersey, and West Virginia.52 The graphs in Exhibits 25 and 26 consider a range of
timesharing arrangements, each assuming that the mother is the primary custodial parent. The first
graph uses average income from the casefile data (i.e., $3,660 net per month for the father and $2,000
net per month for the mother.) The second graph flips the incomes: the mother’s income is $3,660 net
per month and the father’s income is $2,000 net per month.
52 New York and Ohio, which are also states neighboring Pennsylvania, are not included because they do not have a presumptive formula to adjust for shared physical custody. Both state, however, currently provide court discretion in shared custody cases. The 2016 Ohio legislature is considering a bill that would provide a presumptive formula.
PA Rule 1910.16‐6.4(c) Substantial or Shared Physical Custody. (1) When the children spend 40% or more of their time during the year with the obligor, a rebuttable presumption arises that the obligor is entitled to a reduction in the basic support obligation to reflect this time. This rebuttable presumption also applies in high income cases decided pursuant to Rule 1910.16‐3.1. Except as provided in subsection (2) below, the reduction shall be calculated pursuant to the formula set forth in Part II of subdivision (a) of this rule. For purposes of this provision, the time spent with the children shall be determined by the number of overnights they spend during the year with the obligor. (2) Without regard to which parent initiated the support action, when the children spend equal time with both parents, the Part II formula cannot be applied unless the obligor is the parent with the higher income. In no event shall an order be entered requiring the parent with the lower income to pay basic child support to the parent with the higher income. However, nothing in this subdivision shall prevent the entry of an order requiring the parent with less income to contribute to additional expenses pursuant to Rule 1910.16‐6. Pursuant to either party’s initiating a support action, the trier of fact may enter an order against either party based upon the evidence presented without regard to which party initiated the action. In all cases in which the parties share custody equally and the support calculation results in the obligee receiving a larger share of the parties’ combined income, then the court shall adjust the support obligation so that the combined income is allocated equally betweenthe two households. In those cases, no spousal support or alimony pendente lite shall be awarded.

REVIEW OF THE PENNSYLVANIA CHILD SUPPORT GUIDELINES: TECHNIAL FINDINGS
45
Maryland and West Virginia rely on the cross‐credit formula, which is the shared‐custody formula most
commonly used by states. (It is used by 21 states. Besides the cross‐credit formula, there is no
timesharing formula that is used in more than one state.) An illustration of the cross‐credit formula is in
Exhibit 27. The cross‐credit formula essentially offsets theoretical support award calculations for each
parent. The theoretical support awards are adjusted to account for the additional expense of raising a
child in two homes rather than one home and the percentage of time the child spends with each parent.
The parent with the larger theoretical support award is the obligated parent. The cross‐credit can result
Child's Time
with FatherPA DE MD NJ WV
Child's Time
with FatherPA DE MD NJ WV
0% (0 days) 656$ 773$ 620$ 759$ 545$ 0% 100% 118% 100% 100% 100%
5% (18 days) 656$ 719$ 620$ 598$ 545$ 5% 100% 110% 100% 79% 100%
10% (36 days) 656$ 666$ 620$ 576$ 545$ 10% 100% 101% 100% 76% 100%
15% (55 days) 656$ 612$ 620$ 555$ 545$ 15% 100% 93% 100% 73% 100%
20% (73 days) 656$ 559$ 620$ 533$ 545$ 20% 100% 85% 100% 70% 100%
25% (91 days) 656$ 505$ 620$ 511$ 545$ 25% 100% 77% 100% 67% 100%
30% (110 days) 656$ 452$ 620$ 502$ 545$ 30% 100% 69% 100% 66% 100%
35% (128 days) 656$ 398$ 447$ 497$ 397$ 35% 100% 61% 72% 65% 73%
40% (146 days) 555$ 345$ 375$ 459$ 330$ 40% 85% 53% 60% 61% 61%
45% (164 days) 504$ 303$ 422$ 263$ 45% 77% 49% 56% 48%
50% (182.5 days) 453$ 230$ 384$ 196$ 50% 69% 37% 51% 36%
Support Due ($$ per month) % of Sole‐Custody Order

REVIEW OF THE PENNSYLVANIA CHILD SUPPORT GUIDELINES: TECHNIAL FINDINGS
46
in the parent with more parenting time owing support if that parent has substantially more income than
the other parent. This is illustrated in Exhibit 26 by both Maryland and West Virginia at 50 percent
timesharing. Pennsylvania designates the parent with higher income as the obligated parent in equal
custody situations.
The New Jersey adjustment is a percentage adjustment in which the percentage becomes larger once 28
percent timesharing is reached. Delaware, which just revised its parenting time adjustment, also
provides a sliding‐scale percentage adjustment, but allows for a cross‐credit‐like approach when custody
is almost equal (i.e., each parent has the child more than 164 nights per year). The premise underlying
a percentage adjustment is that as the child spends more time with the other parent, that parent incurs
more types of child‐rearing expenses. For example, if the child is with the other parent just one night
Child's Time with
FatherPA DE MD NJ WV
Child's Time
with FatherPA DE MD NJ WV
0% (0 days) 359$ 300$ 362$ 415$ 318$ 0% 100% 84% 100% 100% 100%
5% (18 days ) 359$ 245$ 362$ 341$ 318$ 5% 100% 68% 100% 82% 100%
10% (36 days ) 359$ 190$ 362$ 319$ 318$ 10% 100% 53% 100% 77% 100%
15% (55 days ) 359$ 135$ 362$ 297$ 318$ 15% 100% 38% 100% 72% 100%
20% (73 days ) 359$ 80$ 362$ 276$ 318$ 20% 100% 22% 100% 66% 100%
25% (91 days ) 359$ 25$ 362$ 254$ 318$ 25% 100% 7% 100% 61% 100%
30% (110 days ) 359$ ‐$ 362$ 111$ 318$ 30% 100% 0% 100% 27% 100%
35% (128 days ) 359$ ‐$ 43$ 61$ 4$ 35% 100% 0% 12% 15% 1%
40% (146 days ) 257$ ‐$ (28)$ 10$ (62)$ 40% 72% 0% ‐8% 2% ‐20%
45% (164 days ) 206$ (100)$ (40)$ (129)$ 45% 58% ‐28% ‐10% ‐41%
50% (182.5 days) (453)$ (171)$ (91)$ (196)$ 50% ‐126% ‐47% ‐22% ‐62%
Support Due ($$ per month) % of Sole‐Custody Order

REVIEW OF THE PENNSYLVANIA CHILD SUPPORT GUIDELINES: TECHNIAL FINDINGS
47
per month, food may be the only child‐rearing expense incurred by that parent; yet, if the child is with
the other parent 15 nights per month, that parent may also incur child‐rearing expenses for the child’s
housing, transportation, clothing, and other needs. In all, nine states rely on a percentage adjustment.
None of these states use the same percentage. Further, Exhibits 25 and 26 do not show Delaware
amounts for timesharing arrangements exceeding 44 percent (164 overnights) because this is when the
other Delaware formula applies, and there appears to be some “cliff effects” moving from the
percentage adjustment to the other formula.
Exhibit 27. Illustration of the Cross‐Credit Formula to Adjust for Parenting Time
Line Mother Father Combined
1 Monthly Combined Net Income $2,000 $3,660 $5,660
2 Percentage Share of Income 35% 65% 100%
3 Basic Obligation for 1 Child (Line 1 combined applied to Schedule)
$1,015
4 Shared Custody Basic Obligation (Line 3 x 1.5) $1,523
5 Each Parent’s Share (Line 4 x each parent’s Line 2) $533 $990
6 Overnights with Each Parent (must total 365) 200 165 365
7 Percentage Time with Each Parent (Line 6 divided by 365) 55% 45% 100%
8 Amount Retained (Line 5 x Line 7 for each parent) $293 $446
9 Each Parent’s Obligation (Line 5 – Line 8) $240 $544
10 Amount transferred for basic obligation (Subtract smaller from larger on Line 9, parent owning greater amount on Line 9 is the obligated parent)
$304
In addition to Pennsylvania, a few other states have two components to their adjustment: one for low‐
levels of timesharing and another for substantial physical custody. Besides Pennsylvania, Louisiana and
Kansas are the only other states to incorporate an adjustment for routine or typical timesharing into
their basic schedule. Both Louisiana and Kansas also provide an additional formula when there is
substantial physical custody; specifically, these states provide a “cross‐credit formula,” for substantial
physical custody. A few other states (i.e., Minnesota, Missouri, and New Jersey) also have two‐tier
adjustments: that is, a smaller adjustment for low levels of parenting time (e.g., a 12 percent flat
adjustment in Minnesota) and another formula or provision for substantial shared custody. In 2015, the
Minnesota legislature appointed a committee to address the perceived cliff effect between the two
adjustment methods. The committee recommended Michigan’s formula, which is a more
mathematically complicated formula.
Besides Minnesota, many other states have recently or are currently recommending changes to their
timesharing formulas that essentially make them more favorable to the obligated parent. Michigan, for
example, is proposing a change to its formula that will further reduce the amount for timesharing. The
impetus for Michigan’s change is public input that the existing Michigan adjustment in an inadequate
amount. Proponents of the change argue that the Michigan adjustment does not even cover the child’s
food cost when with the obligated parent. In making this argument, the cost of U.S. Department of
Agriculture food plans were considered. The USDA provides a range of food budgets for individuals and
families by age and gender for four income levels. The lowest is used for SNAP (formerly called Food
REVIEW OF THE PENNSYLVANIA CHILD SUPPORT GUIDELINES: TECHNIAL FINDINGS
48
Stamps) benefits. The highest is used for military per diem rates. A moderate USDA food budget, which
is what Michigan used, works out to be about an $8 per day adjustment for the child’s food.53
Discussion:AdjustmentsforParentingTimeIn general, there are merits and limitations to Pennsylvania’s two‐component approach. Incorporating
an adjustment for standard or typical parenting time into the basic schedule effectively applies the
adjustment to all noncustodial parents regardless whether they exercise parenting time and without
regard to the amount of parenting time that the parent actually exercises. The merits of incorporating
the adjustment into the schedule are all noncustodial parents receive the adjustment, and it avoids
minute changes in the support award for one or two more overnights.
Nonetheless, Pennsylvania’s shared‐custody formula requires a higher timesharing threshold than many
states and results in a smaller adjustment for most case scenarios than other states’ adjustment
formulas. The cross‐credit formula is the only formula to be used by more than one state, but it will not
always result in the parent with more “custody” receiving child support. No other state formula clearly
surfaces as being ideal: that is, has been researched extensively to definitively conclude that it would be
better than Pennsylvania’s current approach.
Adjustments for Child Care Expenses Most state guidelines (including Pennsylvania) do not include child care expenses in their basic
formula/schedule because not all parents incur child care expenses, and among those that do, the
expense is highly variable from case to case. Instead, the actual amount of work‐related child care
expense is considered on a case‐by‐case basis in the calculation of the support award. Most states like
Pennsylvania add the work‐related child care expense to the basic obligation. Each parent is responsible
for his or her prorated share. The parent incurring the expense receives a credit against his or her share.
RelevantFactsandStatisticsandFederalGuidance:ChildCareExpensesThe analysis of 2013‐2014 case file data finds that only 17 percent of new orders and 16 percent of
modified orders include an adjustment for child care expenses. Other parents may not have child care
expenses because their children are older, a parent does not work outside the home, the parents share
child care responsibilities, barter child care services with a friend or relative, receive substantial child
care subsidies, or have other arrangements.
The case file analysis also found that new and modified orders adjusted for child care expenses tend to
have higher payment compliance rates as well as higher guidelines deviation rates. This undoubtedly
reflects that these parents have higher incomes, hence better ability to pay to pay both private child
care expenses and child support. The underlying reason for the higher deviation rate among orders
adjusted for child care expenses, however, is unclear. There are few orders with both an adjustment for
53 The USDA food budget are available from http://www.cnpp.usda.gov/sites/default/files/CostofFoodSep2015.pdf.

REVIEW OF THE PENNSYLVANIA CHILD SUPPORT GUIDELINES: TECHNIAL FINDINGS
49
child care expenses and a deviation, so the number of cases in which this occurs may be too small to
warrant additional clarification.
There are no federal regulations addressing child care expenses in child support guidelines.
Pennsylvania’sCurrentProvision:ChildCareExpensesThe Pennsylvania provision as shown below is limited to child care expenses that are work‐related.
Pennsylvania, unlike many states, also clearly specifies what to do if there is a child care subsidy.
ProvisionsinOtherStates:ChildCareExpensesPennsylvania’s provision for child care expenses is very similar to those of other states, including its
bordering states. The only exceptions are nuances. Delaware prohibits the imputation of child care
expenses. District of Columbia provides that the cost of providing licensed child care shall be used if the
cost of the actual experience of the family is not in the best of the interest of the child. Michigan, New
Jersey and Ohio specify that the net cost (i.e., after federal child care tax credits) should be considered in
the child support calculation. West Virginia has a formula for simplifying the federal child care tax
credit, but it is outdated. The West Virginia formula recognizes that low‐ to middle‐income parents do
not have sufficient tax liability to be eligible for a federal child care tax credit. As a consequence,
consideration of the federal child care tax credit adds another complication to the calculation, but often
does not affect the award amount.
In addition, some states have other unique provisions pertaining to child care expenses. A few states
cap the combined obligation (i.e., the obligated parent’s share of the schedule amount and the child
care expenses) such that it does not exceed a state‐determined threshold. For example, South Dakota
provides that the support award cannot exceed 50 percent of the obligated parent’s net income, and
Washington provides a similar cap of 45 percent. Washington’s provision is also unique because it
requires that the custodial parent repay the obligor if the guidelines calculation includes child care
expenses but the child care does not occur.
PA Rule 1910.16‐6. Support Guidelines. Adjustments to the Basic Support Obligation. Allocation of Additional Expenses. Additional expenses permitted pursuant to this Rule 1910.16‐6 may be allocated between the parties even if the parties’ incomes do not justify an order of basic support. (a) Child care expenses. Reasonable child care expenses paid by either parent, if necessary to maintain employment or appropriate education in pursuit of income, shall be allocated between the parties in proportion to their net incomes and added to his and her basic support obligation. When a parent is receiving a child care subsidy through the Department of Public Welfare, the expenses to be allocated between the parties shall be the amount actually paid by the parent receiving the subsidy.

REVIEW OF THE PENNSYLVANIA CHILD SUPPORT GUIDELINES: TECHNIAL FINDINGS
50
Discussion:ChildCareExpensesThere is no overwhelming evidence suggesting major issues with the Pennsylvania child care provisions.
The provision is applied infrequently, the payment compliance rates are higher among orders in which
they are applied, and Pennsylvania’s child care provision is generally similar to those of other states.
Provision and Cost of Child’s Health Insurance There are two considerations to the child’s health insurance: ordering one or both parents to provide
health care coverage for the children, and how the cost of the child’s health insurance shall be
considered in the calculation of the support obligation. Federal regulation requires that state guidelines
address, “How the parents will provide for the child(ren)’s health care needs through health insurance
coverage and/or thorough cash medical support… .”54 Pennsylvania actually addresses the ordering of
health care coverage in statute (23 PA CSA § 4326), and the cost of the child’s health insurance in the
child support guidelines.
Most states guidelines, including the Pennsylvania guidelines, do not include the cost of the child’s
health insurance in their basic formula/schedule for the same reason that they do not include child care
expenses: they are highly variable from case to case. Pennsylvania and most states treat the cost of the
child’s health insurance identical to how they treat the cost of work‐related child care expenses.
RelevantFactsandStatisticsandFederalRegulation:Child’sHealthInsuranceThe analysis of 2013‐2014 case file data finds that the cost of the child’s health insurance is considered
in the calculation of the support award in 17 percent of new orders and 27 percent of modified orders.
The low rates of consideration may reflect high Medicaid enrollment rates. There is no “insurance
premium” when a child is enrolled in Medicaid. Most (69 percent of new orders and 70 percent of
modified orders) include a child that was ever Medicaid. (There is not a readily available data field
noting current Medicaid status.) As discussed previously, recent data finds that over a third (37
percent) of all Pennsylvania children are enrolled in Medicaid at any point in time. In general, Medicaid
enrollments have gone up across the nation. Children comprise over 50 percent of Medicaid
enrollments in most states, including Pennsylvania.55
The provision for health insurance coverage is part of the broader type of child support called “medical
child support” that also covers the uninsured medical expenses of the child and essentially any order or
provision of a child support order concerning the health care needs of the child. The federal rules
pertaining to medical child support orders, which were last changed in 2008,56 do not align with the
Affordable Care Act of 2010 (ACA). One example of the difference is that the 2008 rules require states
54Title 45, Public Welfare, C.F.R § 302.56(c)(3). Retrieved from http://www.ecfr.gov/cgi‐bin/retrieveECFR?gp=&SID=d829d9fb6969a2402303f45c14097e61&r=PART&n=45y2.1.2.1.3#45:2.1.2.1.3.0.1.28 55 Artiga, Samantha, et al. (2015.) Recent Trends in Medicaid and CHIP Enrollment as of January 2015: Early Findings from the CMS Performance Indicator Project. Kaiser Family Foundation. Retrieved from http://kff.org/report‐section/recent‐trends‐in‐medicaid‐and‐chip‐enrollment‐as‐of‐january‐2015‐issue‐brief/ . 56 U.S. Department of Health and Human Services Administration for Children and Families (ACF), (2008), “Child Support Enforcement Program; Medical Support: Final Regulation.” Federal Register, Vol. 73 , No. 140 (July 21, 2008, pp. 42416‐42442). Retrieved from http://www.gpo.gov/fdsys/pkg/FR‐2008‐07‐21/html/E8‐15771.htm

REVIEW OF THE PENNSYLVANIA CHILD SUPPORT GUIDELINES: TECHNIAL FINDINGS
51
to define whether the cost of child’s health care coverage is reasonable to a parent, while the ACA
considers affordability of health care for an entire household based on household income and cost of
plans offered through the health care exchange. Although many advocate for alignment, it would
require statutory changes at the federal level.57
Another arguable key difference is that the 2008 rules prioritize a parent’s private health insurance as
coverage for the child over Medicaid and CHIP while the ACA and the Children's Health Insurance
Program Reauthorization Act of 2009 (CHIPRA) expanded and strengthened Medicaid and CHIP for
children. As a consequence, most state guidelines do not recognize Medicaid or CHIP coverage as health
insurance. That difference would be solved by a pending federal rule change that requires states to
include public coverage in their definition of health insurance.58 This is not an issue for Pennsylvania,
however, because Pennsylvania statute does recognize Medicaid and CHIP as health care coverage.
In addition, the pending federal rule change could give states more flexibility in how they factor the cost
of the child’s health insurance coverage in the calculation of the support award. The current rule
requires states to isolate the cost of insurance attributable to the child(ren) for whom support is being
determined. Most states accomplish this by prorating or taking the difference in cost for an individual
plan and the family plan for the parent carrying the insurance. The proposed rule eliminates the
attribution requirement, but states could still elect to do so.
Pennsylvania’sCurrentProvision:Child’sHealthInsuranceAs mentioned above, the existing federal requirements for the child’s health insurance and reasonable
cost are fulfilled in Pennsylvania statue. The Pennsylvania rule fulfills the federal requirements for
addressing the cost of the child’s health insurance.
ProvisionsofOtherStates:Child’sHealthInsurancePennsylvania’s statue providing for the ordering of the child’s health care coverage is similar to that of
most states. It can be ordered to either parent or both parents if health insurance is available at a
reasonable cost. In addition, the treatment of the cost of the child’s health insurance, as provided in
the Pennsylvania child support guidelines, is the most common method used among all states. All of
the states bordering Pennsylvania use the same methodology. There are, however, about a dozen states
that subtract the cost of the child’s health insurance from the income of the parent providing it. In fact,
Montana just switched from treating health insurance similar to how Pennsylvania does to a deduction
from income.
57 See session at the Western Interstate Child Support Enforcement Association. (Sept 2014). Medical Support and the Affordable Care Act at the Western Interstate Child Support Enforcement Association meeting at Mission Bay, California. 58Department of Health and Human Services. (Nov. 17, 2014). “Flexibility, Efficiency, and Modernization in Child Support Enforcement Programs.” Federal Register, vol. 79, No. 221, p. 68580. Retrieved from http://www.acf.hhs.gov/programs/css/resource/nprm‐flexibility‐efficiency‐and‐modernization‐in‐child‐support‐enforcement‐programs .

REVIEW OF THE PENNSYLVANIA CHILD SUPPORT GUIDELINES: TECHNIAL FINDINGS
52
Discussion:Child’sHealthInsurancePennsylvania’s existing statute and guidelines fulfill current federal requirements pertaining to the
child’s health insurance. Moreover, they fulfill proposed federal requirements, as published in
November 2014.59 The caveat is that the final federal requirements have not been released. To this
end, Pennsylvania should doublecheck its compliance once the federal rules are finalized. In addition,
Pennsylvania should watch for further federal changes since the federal rules on medical support and
the ACA do not align. Finally, once the federal landscape appears to be stabilized, Pennsylvania may
want to carefully review all of its medical child support provisions, both in statute and rule.
59 Ibid.
PA Rule 1910.16‐6. Support Guidelines. Adjustments to the Basic Support Obligation. Allocation of Additional Expenses.
b) Health Insurance Premiums. (1) A party’s payment of a premium to provide health insurance coverage on behalf of the other party and/or the children shall be allocated between the parties in proportion to their net incomes, including the portion of the premium attributable to the party who is paying it, as long as a statutory duty of support is owed to the party who is paying the premium. If there is no statutory duty of support owed to the party who is paying the premium, the portion attributable to that person must be deducted from the premium as set forth in subdivision (2) below. If, prior to the entry of a divorce decree, a party’s policy covers that party, a child and a spouse and the spouse has separate additional coverage not needed to cover the child and/or the other party, the cost of the spouse’s insurance premium shall not be allocated between the parties. If, prior to the entry of a divorce decree, a party provides coverage for that party and a child, but not the spouse, and the spouse has separate coverage, both parties’ premiums shall be allocated between the parties in proportion to their respective incomes. If, prior to the entry of a divorce decree, each spouse has his or her own health insurance that does not cover the other party, and there are no children subject to the order, the cost of both parties’ premiums shall be allocated between the parties in proportion to their respective incomes. If health insurance coverage for a child who is the subject of the support proceeding is being provided and paid for by a third party resident of either party’s household, the cost shall be allocated between the parties in proportion to their net incomes. If the obligor is paying the premium, then the obligee’s share is deducted from the obligor’s basic support obligation. If the obligee is paying the premium, then the obligor’s share is added to his or her basic support obligation. Employer‐paid premiums are not subject to allocation. (2) When the health insurance covers a party to whom no statutory duty of support is owed, even if that person is paying the premium as set forth in subdivision (1) above, or other persons who are not parties to the support action or children who are not the subjects of the support action, the portion of the premium attributable to them must be excluded from allocation. In the event that evidence as to this portion is not submitted by either party, it shall be calculated as follows. First, determine the cost per person by dividing the total cost of the premium by the number of persons covered under the policy. Second, multiply the cost per person by the number of persons who are not owed a statutory duty of support, or are not parties to, or the subject of the support action. The resulting amount is excluded from allocation. (2.1) The actual incremental amount of the premium which provides coverage for the subjects of the support order, if submitted by either party, shall be used in determining the amount of the premium to be allocated between the parties. If not submitted by either party, then the amount of the premium shall be divided by the number of persons covered to calculate the portion of the premium that providing coverage to each parent.

REVIEW OF THE PENNSYLVANIA CHILD SUPPORT GUIDELINES: TECHNIAL FINDINGS
53
Child’s Unreimbursed Health Care Expenses Some children may have no uninsured medical expenses while other children may have substantial
medical expenses. Most states including Pennsylvania have a provision to address these expenses,
particularly if the expense is incurred for the necessary health and well‐being of the child.
RelevantFactsandStatistics:UnreimbursedHealthCareExpensesThe analysis of 2013‐2014 casefile data finds that less than one percent of analyzed orders, regardless
whether they are new or modified orders, have an adjustment for the child’s unreimbursed medical
expenses. One reason for this is that few children have recurring unreimbursed medical expenses, such
as asthmatic treatments, at the time of the order establishment or modification. Children are generally
healthy and consume less for health care expenses relative to adults. Also, many children are enrolled in
Medicaid, which typically has no out‐of‐pocket expenses such as copays, deductibles, or co‐insurance.
According to the 2013 National Medical Expenditure Survey, the average out‐of‐pocket health care
expense is $260 per child per year.60 The average is less for children enrolled in Medicaid and more for
children with private insurance. Many believe that the dust has not settled from implementing the
Affordable Care Act of 2010 and the Children's Health Insurance Program Reauthorization Act of 2009.
Both laws affect children’s access to health care and the cost of health care for children.
Pennsylvania’sCurrentProvision:UnreimbursedHealthCareExpensesThe Pennsylvania provision for unreimbursed medical expenses is shown below. Like child care
expenses and the child’s health insurance cost, it is also prorated between the parents. There are two
criteria for applying the adjustment: the expense must be reasonably necessary (e.g., orthodontia), and
it must exceed the $250 threshold per child per year. The threshold is important because the schedule
includes $250 per child per year to cover out‐of‐pocket expenses for the child’s health care. This is based
on previous data indicating $250 was a typical amount.
ProvisionsofOtherStates:UnreimbursedHealthCareExpensesMost states’ provisions for unreimbursed medical expenses are similar to Pennsylvania’s. A few states,
however, use more or less for the threshold. For example, Delaware’s threshold is $350 per child per
year and Maryland’s threshold is $100 per illness but is based on older data. The $250 threshold is the
mode among other states. Michigan does not incorporate ordinary medical expenses in its basic
schedule like Pennsylvania does (i.e., the Pennsylvania schedule includes $250 per child per year to
cover the child’s ordinary medical expenses). Instead, Michigan provides that $357 per child per year is
to be added on to the Michigan’s basic obligation to cover the child’s ordinary medical expenses. In
other words, it is similar to how Pennsylvania treats child care expenses and the cost of the child’s
health insurance premium. This gives Michigan more discretion of when to order it, however, Michigan
usually adds the $357 per child per year to every case.
60 U.S. Dept. of Health and Human Services Agency for Health Care Research and Quality. (nd). Medical Expenditure Survey. “Total amt paid by self/family (TOTSLF13) for ages 0 ‐17.” Retrieved from: http://meps.ahrq.gov/mepsweb/data_stats/MEPSnetHC/results.action
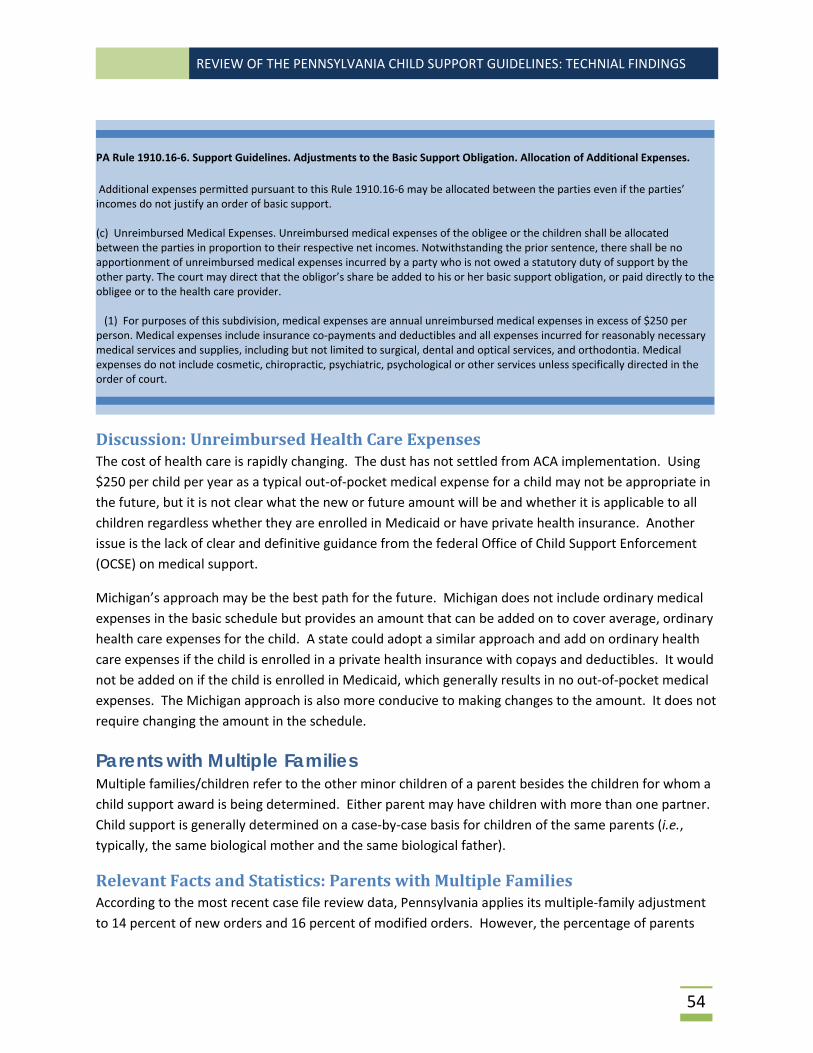
REVIEW OF THE PENNSYLVANIA CHILD SUPPORT GUIDELINES: TECHNIAL FINDINGS
54
Discussion:UnreimbursedHealthCareExpensesThe cost of health care is rapidly changing. The dust has not settled from ACA implementation. Using
$250 per child per year as a typical out‐of‐pocket medical expense for a child may not be appropriate in
the future, but it is not clear what the new or future amount will be and whether it is applicable to all
children regardless whether they are enrolled in Medicaid or have private health insurance. Another
issue is the lack of clear and definitive guidance from the federal Office of Child Support Enforcement
(OCSE) on medical support.
Michigan’s approach may be the best path for the future. Michigan does not include ordinary medical
expenses in the basic schedule but provides an amount that can be added on to cover average, ordinary
health care expenses for the child. A state could adopt a similar approach and add on ordinary health
care expenses if the child is enrolled in a private health insurance with copays and deductibles. It would
not be added on if the child is enrolled in Medicaid, which generally results in no out‐of‐pocket medical
expenses. The Michigan approach is also more conducive to making changes to the amount. It does not
require changing the amount in the schedule.
Parents with Multiple Families Multiple families/children refer to the other minor children of a parent besides the children for whom a
child support award is being determined. Either parent may have children with more than one partner.
Child support is generally determined on a case‐by‐case basis for children of the same parents (i.e.,
typically, the same biological mother and the same biological father).
RelevantFactsandStatistics:ParentswithMultipleFamiliesAccording to the most recent case file review data, Pennsylvania applies its multiple‐family adjustment
to 14 percent of new orders and 16 percent of modified orders. However, the percentage of parents
PA Rule 1910.16‐6. Support Guidelines. Adjustments to the Basic Support Obligation. Allocation of Additional Expenses.
Additional expenses permitted pursuant to this Rule 1910.16‐6 may be allocated between the parties even if the parties’ incomes do not justify an order of basic support. (c) Unreimbursed Medical Expenses. Unreimbursed medical expenses of the obligee or the children shall be allocated between the parties in proportion to their respective net incomes. Notwithstanding the prior sentence, there shall be no apportionment of unreimbursed medical expenses incurred by a party who is not owed a statutory duty of support by the other party. The court may direct that the obligor’s share be added to his or her basic support obligation, or paid directly to the obligee or to the health care provider. (1) For purposes of this subdivision, medical expenses are annual unreimbursed medical expenses in excess of $250 per person. Medical expenses include insurance co‐payments and deductibles and all expenses incurred for reasonably necessary medical services and supplies, including but not limited to surgical, dental and optical services, and orthodontia. Medical expenses do not include cosmetic, chiropractic, psychiatric, psychological or other services unless specifically directed in the order of court.
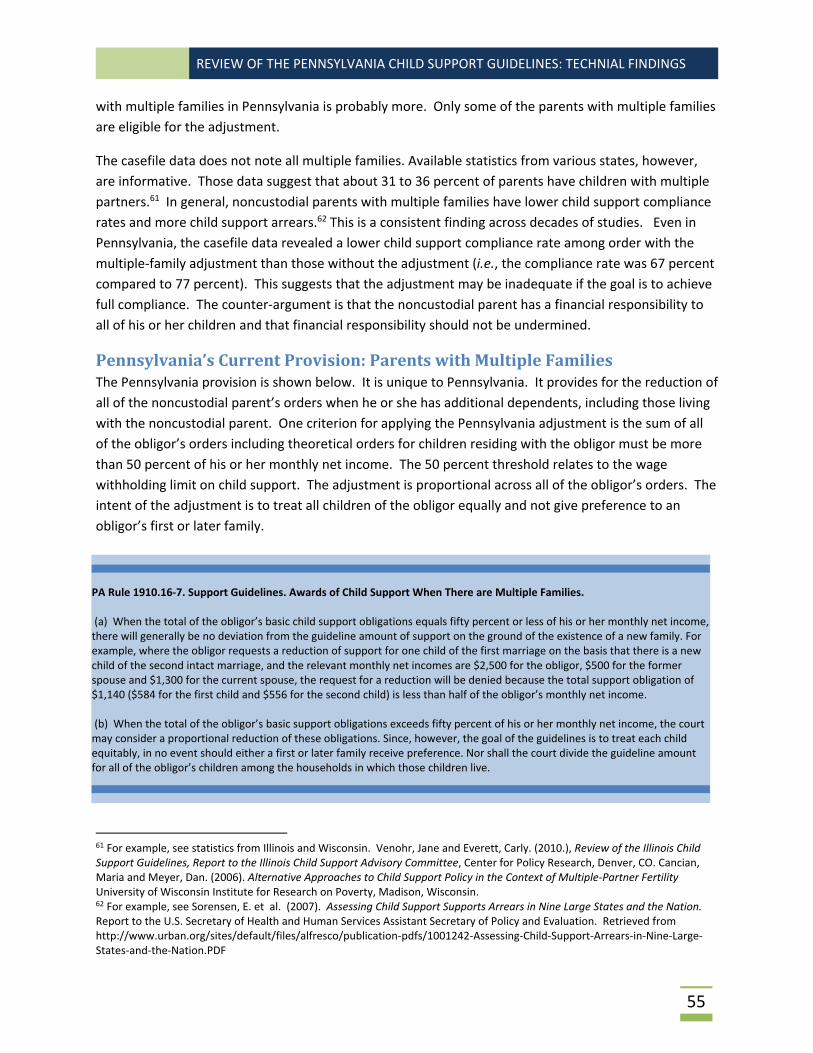
REVIEW OF THE PENNSYLVANIA CHILD SUPPORT GUIDELINES: TECHNIAL FINDINGS
55
with multiple families in Pennsylvania is probably more. Only some of the parents with multiple families
are eligible for the adjustment.
The casefile data does not note all multiple families. Available statistics from various states, however,
are informative. Those data suggest that about 31 to 36 percent of parents have children with multiple
partners.61 In general, noncustodial parents with multiple families have lower child support compliance
rates and more child support arrears.62 This is a consistent finding across decades of studies. Even in
Pennsylvania, the casefile data revealed a lower child support compliance rate among order with the
multiple‐family adjustment than those without the adjustment (i.e., the compliance rate was 67 percent
compared to 77 percent). This suggests that the adjustment may be inadequate if the goal is to achieve
full compliance. The counter‐argument is that the noncustodial parent has a financial responsibility to
all of his or her children and that financial responsibility should not be undermined.
Pennsylvania’sCurrentProvision:ParentswithMultipleFamiliesThe Pennsylvania provision is shown below. It is unique to Pennsylvania. It provides for the reduction of
all of the noncustodial parent’s orders when he or she has additional dependents, including those living
with the noncustodial parent. One criterion for applying the Pennsylvania adjustment is the sum of all
of the obligor’s orders including theoretical orders for children residing with the obligor must be more
than 50 percent of his or her monthly net income. The 50 percent threshold relates to the wage
withholding limit on child support. The adjustment is proportional across all of the obligor’s orders. The
intent of the adjustment is to treat all children of the obligor equally and not give preference to an
obligor’s first or later family.
61 For example, see statistics from Illinois and Wisconsin. Venohr, Jane and Everett, Carly. (2010.), Review of the Illinois Child Support Guidelines, Report to the Illinois Child Support Advisory Committee, Center for Policy Research, Denver, CO. Cancian, Maria and Meyer, Dan. (2006). Alternative Approaches to Child Support Policy in the Context of Multiple‐Partner Fertility University of Wisconsin Institute for Research on Poverty, Madison, Wisconsin. 62 For example, see Sorensen, E. et al. (2007). Assessing Child Support Supports Arrears in Nine Large States and the Nation. Report to the U.S. Secretary of Health and Human Services Assistant Secretary of Policy and Evaluation. Retrieved from http://www.urban.org/sites/default/files/alfresco/publication‐pdfs/1001242‐Assessing‐Child‐Support‐Arrears‐in‐Nine‐Large‐States‐and‐the‐Nation.PDF
PA Rule 1910.16‐7. Support Guidelines. Awards of Child Support When There are Multiple Families. (a) When the total of the obligor’s basic child support obligations equals fifty percent or less of his or her monthly net income, there will generally be no deviation from the guideline amount of support on the ground of the existence of a new family. For example, where the obligor requests a reduction of support for one child of the first marriage on the basis that there is a new child of the second intact marriage, and the relevant monthly net incomes are $2,500 for the obligor, $500 for the former spouse and $1,300 for the current spouse, the request for a reduction will be denied because the total support obligation of $1,140 ($584 for the first child and $556 for the second child) is less than half of the obligor’s monthly net income. (b) When the total of the obligor’s basic support obligations exceeds fifty percent of his or her monthly net income, the court may consider a proportional reduction of these obligations. Since, however, the goal of the guidelines is to treat each child equitably, in no event should either a first or later family receive preference. Nor shall the court divide the guideline amount for all of the obligor’s children among the households in which those children live.

REVIEW OF THE PENNSYLVANIA CHILD SUPPORT GUIDELINES: TECHNIAL FINDINGS
56
ProvisionsofOtherStates:ParentswithMultipleFamiliesNo state has a guidelines provision that makes the adjustment to the order like Pennsylvania does.
Most states’ adjustments for multiple families consist of an income deduction. The income deduction is
typically the amount of child support paid or the theoretical amount of child support for non‐joint
children in the home of the parent receiving the income deduction. For example, the District of
Columbia provides a theoretical order for the child living with the parent should be calculated based on
that parent’s income alone and 75 percent of that amount be deducted from that parent’s income. (The
75 percent serves to equalize the amount of income that the parent has for each set of children.)
When the custodial parent has non‐joint children in the home, application of the adjustment to the
custodial parent’s income generally results in a nominal increase in the support award. A notable
exception is the “whole family approach,” which is an approach often used in Washington State, but is
not codified.63 The whole family approach which considers all children of the parents and all income of
the parents, as well as the income of new spouses results in the support award being less if the custodial
parent has non‐joint children in the home.
Discussion:ParentswithMultipleFamiliesAdjustments for multiple families is a difficult policy issue. Often, a noncustodial parent with multiple
families has inadequate financial resources to support all of his or her families. The policy question then
becomes how to divide his or her financial resources fairly across families while allowing the
noncustodial parent to retain a sufficient amount of income for subsistence. Complicating this policy
decision, however, is the residential parent may also have children with multiple orders. Should that
increase the support award (which is what the income deduction does, but it is a nominal decrease) or
decrease the support award (as the Washington whole families approach does)? In addition, the policy
decision becomes even more complicated when it is recognized that a parent may be a custodial parent
for one child and a noncustodial parent for another child.
Income Provisions At the heart of the guidelines calculation is the income used to determine for support. There are many
subissues pertaining to income: categories of income, treatment of overtime income, imputation of
income and earning capacity, low‐income adjustments, and table/schedule amounts at high incomes.
IncomeCategoriesThe income categories contained in the Pennsylvania child support guidelines, as shown below, are
similar to those of most states. Pennsylvania, like several states, essentially excludes any sort of public
assistance as income for the purposes of the guidelines calculation. Pennsylvania specifically excludes
Social Security income (SSI), which is a means‐tested disability benefit. The maximum amount that can
63 Policy Studies Inc. (January, 2005). Washington State Child Support Schedule: Selected Issues Affecting Predictability, Retrieved from: http://www.dshs.wa.gov/pdf/esa/dcs/reports/AppendixIV‐d.pdf .
REVIEW OF THE PENNSYLVANIA CHILD SUPPORT GUIDELINES: TECHNIAL FINDINGS
57
be received by an individual is $733 per month. Generally, more progressive states exclude SSI from the
calculation of child support.
A few states have more or fewer income categories than Pennsylvania’s categories. A notable example
of a state with fewer is New York, which essentially defers to what income is identified as taxable for
federal income taxes. A notable example of a state with more is Michigan. Some of the categories
Michigan addresses that are not specifically mentioned in the Pennsylvania guidelines are tips,
gratuities, capital gains, employer contributions to pension or other retirement plans, military
specialty pay and other military benefits, and veterans’ administration benefits. Michigan also
includes exhaustive details on the consideration of income for self‐employed individuals, business
owners, and executives.
Pennsylvania also provides for how to address Social Security Disability Insurance (SSDI) payments. SSDI
is based on the parent’s work history in jobs covered by the Social Security payroll tax. The adjustment
considers any SSDI benefit that the Social Security Administration (SSA) delivers directly to where the
child lives even though the noncustodial parent is eligible for the SSDI. Family members including
nonresidential children and divorced spouses are eligible for up to 50 percent of the SSDI benefit rate.
Pennsylvania’s approach is similar to the handful of states that address SSDI benefits. The notable
exception is New York, where New York specifically prohibits the noncustodial parent from receiving a
credit for any SSDI that the SSA directly sends the family. New York’s rational is that the noncustodial
parent’s SSDI benefit amount is unaffected by what is sent to the children. In other words, the SSDI
check sent to the children is in addition to the benefit already received by the noncustodial parent.
PA Rule 1910.16‐2. Support Guidelines. Calculation of Net Income. Generally, the amount of support to be awarded is based upon the parties’ monthly net income. (a) Monthly Gross Income. Monthly gross income is ordinarily based upon at least a six‐month average of all of a party’s income. The term ‘‘income’’ is defined by the support law, 23 Pa.C.S.A. § 4302, and includes income from any source. The statute lists many types of income including, but not limited to: (1) wages, salaries, bonuses, fees and commissions; (2) net income from business or dealings in property; (3) interest, rents, royalties, and dividends; (4) pensions and all forms of retirement; (5) income from an interest in an estate or trust; (6) Social Security disability benefits, Social Security retirement benefits, temporary and permanent disability benefits, workers’ compensation and unemployment compensation; (7) alimony if, in the discretion of the trier of fact, inclusion of part or all of it is appropriate and (8) other entitlements to money or lump sum awards, without regard to source, including lottery winnings, income tax refunds, insurance compensation or settlements; awards and verdicts; and any form of payment due to and collectible by an individual regardless of source.

REVIEW OF THE PENNSYLVANIA CHILD SUPPORT GUIDELINES: TECHNIAL FINDINGS
58
There is a cap on the total amount that can be paid, but any reduction paid is to the amounts paid to
family not the parent directly eligible for SSDI.64
There is no specific code for SSDI in the casefile data, but there are codes for disability income, which
may include SSDI or another source of disability income, and Social Security income, which could include
SSDI or another benefit such Social Security for old age. Neither income category was noted for more
than 1 percent of the noncustodial parents.
OvertimeIncomeThe Pennsylvania child support guidelines do not directly address overtime income. However, it
addresses “fluctuations of income,” but does not specifically classify overtime income as fluctuating
income. The guidelines provide that there should be no adjustment in support payments for normal
fluctuations in earnings.
States are mixed on whether they specifically mention overtime income, as well how to treat overtime
income. States that specifically mention overtime income generally include it as income for calculating
support with some exceptions concerning whether the parent realized overtime income in the year prior
to the establishment of the order. Most of the states bordering Pennsylvania do include overtime
income. New Jersey does and specifies that it should be averaged over the last 12 months.
64 Social Security Administration. (n.d.) Disability Planner: Family Benefits. Retrieved from https://www.ssa.gov/planners/disability/dfamily.html#&sb=1 .
PA Rule 1910.16.2 d) Reduced or Fluctuating Income. (1) Voluntary Reduction of Income. When either party voluntarily assumes a lower paying job, quits a job, leaves employment, changes occupations or changes employment status to pursue an education, or is fired for cause, there generally will be no effect on the support obligation. (2) Involuntary Reduction of, and Fluctuations in, Income. No adjustments in support payments will be made for normal fluctuations in earnings. However, appropriate adjustments will be made for substantial continuing involuntary decreases in income, including but not limited to the result of illness, lay‐off, termination, job elimination or some other employment situation over which the party has no control unless the trier of fact finds that such a reduction in income was willfully undertaken in an attempt to avoid or reduce the support obligation. (4) Earning Capacity. If the trier of fact determines that a party to a support action has willfully failed to obtain or maintain appropriate employment, the trier of fact may impute to that party an income equal to the party’s earning capacity. Age, education, training, health, work experience, earnings history and child care responsibilities are factors which shall be considered in determining earning capacity. In order for an earning capacity to be assessed, the trier of fact must state the reasons for the assessment in writing or on the record. Generally, the trier of fact should not impute an earning capacity that is greater than the amount the party would earn from one full‐time position. Determination of what constitutes a reasonable work regimen depends upon all relevant circumstances including the choice of jobs available within a particular occupation, working hours, working conditions and whether a party has exerted substantial good faith efforts to find employment.

REVIEW OF THE PENNSYLVANIA CHILD SUPPORT GUIDELINES: TECHNIAL FINDINGS
59
HighIncomeEconomic evidence on the cost of raising children is limited at high incomes. There is an insufficient
number of very high income families in the Consumer Expenditure Survey, the data set used to measure
child‐rearing expenditures, to produce statistically reliable measurements of child‐rearing expenditures
at very high incomes. Most states stop their child support guidelines schedule at the highest income for
which the measurements are statistically reliable (i.e., about $30,000 gross per month or $25,000 net
per month). The Pennsylvania schedule from about $25,000 to $30,000 per month is based on an
extrapolation of the economic evidence on child‐rearing expenditures from incomes below about
$22,000 per month. The formula for incomes above $30,000 per month is also an extrapolation.
Most states guidelines do not provide a formula for incomes above the highest income considered in the
table/schedule, but provide for court discretion above that income and that the court cannot use an
amount lower than the highest amount from the table/schedule for that number of children. As an
illustration, if this approach was used in Pennsylvania, the basic obligation used in the calculation of
support for one child when the parents’ combined net income exceeds $30,000 per month would never
be less than $2,801 per month because that is the maximum schedule amount for one child.
In addition to Pennsylvania, there are 11 states that provide a presumptive formula to an infinitive
amount of income. The percentages in these states are generally in the range of 6 to 25 percent of
gross or net income for one child and 7 to 33 percent of gross to net income for two children. The
percentages tend to be higher among those states relying on the Melson formula (i.e., Delaware, Hawaii,
and Montana). For example, they are 19 percent for one child and 27 percent for two children in
Delaware. The percentages also tend to be lower in those states that essentially factor in the
diminishing rate of expenditures at higher incomes; that is, as income rises, a smaller percentage of
income is actually spent. For those states that made an extrapolation similar to Pennsylvania’s, the
percentages range from 6 to about 10 percent for one child and 7 to 15 percent for two children.
PA Rule 1910.16‐3.1. Support Guidelines. High Income Cases. (a) Child Support Formula. When the parties’ combined monthly net income is above $30,000, the following three‐step process shall be applied to calculate the parties’ respective child support obligations. The amount of support calculated pursuant to this three‐step process shall in no event be less than the amount of support that would have been awarded if the parties’ combined net monthly income were $30,000. That amount shall be a presumptive minimum. (1) First, the following formula shall be applied as a preliminary analysis in calculating the amount of basic child support to be apportioned between the parties according to their respective incomes: One child: $2,801 + 8.5% of combined net income above $30,000 per month. Two children: $3,836 + 11.6% of combined net income above $30,000 per month. Three children: $4,277 + 12.6% of combined net income above $30,000 per month. Four children: $4,718 + 14.3% of combined net income above $30,000 per month. Five children: $5,190 + 15.8% of combined net income above $30,000 per month. Six children: $5,641 + 17.1% of combined net income above $30,000 per month;
REVIEW OF THE PENNSYLVANIA CHILD SUPPORT GUIDELINES: TECHNIAL FINDINGS
60
There are obvious trade‐offs in presumptive formulas for high incomes. A presumptive formula
produces consistency and predictability in support award amounts. Nonetheless, because of data
limitations it may not reflect what is actually spent on child‐rearing at very high incomes. Further, it is
difficult to provide a formula that addresses all ranges of high incomes. For example, child‐rearing
expenditures for a family with $35,000 net income per month may spend a different percentage on
child‐rearing expenditures than a family with $100,000 net income per month.
LowIncomeThe Office of Child Support Enforcement (OCSE) proposed federal rule change in November 2014 aimed
to improve child support policies affecting low‐income noncustodial parents.65 The impetus for the
proposed changes consists of research that finds low‐income noncustodial parents often face multiple
employment barriers and have order amounts beyond what they can reasonably pay, hence are often
not paid and arrears accumulate. In turn, unpaid child support payments trigger enforcement actions
(e.g., driver’s license suspension) that may create additional barriers to work or even hinder parent‐child
contact. One of the provisions of the 2014 proposed rule change called for state guidelines to consider
the subsistence needs of the noncustodial parent. OCSE is currently revising the proposed rule based on
public comment and intends to release the finalized rule in 2016.
The Pennsylvania child support guidelines currently provide for the subsistence needs of the
noncustodial parent using a Self‐Support Reserve of $931 per month, which was the federal poverty
level (FPL) for one person when the guidelines were last reviewed. The 2016 FPL is $990 per month.
There are 36 other state guidelines that provide a self‐support reserve (SSR). Like Pennsylvania, most
states base their self‐support reserve on the federal poverty guidelines for one person from the year in
which that state last updated its guidelines. For example, Ohio last updated its guidelines schedule in
the mid 1990s and the Ohio SSR is based on the 1992 FPL. West Virginia and Maryland also have low
SSRs because they have not updated their guidelines in a while. Other neighboring states have slightly
higher SSRs for two reasons. They index their SSR to the most current FPL, and they inflate the FPL by a
percentage. New Jersey uses 105 percent of the FPL, New York uses 135 percent of the FPL, and the
District of Columbia uses 133 percent of the FPL. Delaware currently sets its SSR at $1,000 per month,
which exceeds the 2016 FPL for one person, but also provides that the Delaware SSR should be updated
to the FPL in every odd year.
65 Department of Health and Human Services. (Nov. 17, 2014). “Flexibility, Efficiency, and Modernization in Child Support Enforcement Programs.” Federal Register, vol. 79, No. 221, p. 68580. Retrieved from http://www.acf.hhs.gov/programs/css/resource/nprm‐flexibility‐efficiency‐and‐modernization‐in‐child‐support‐enforcement‐programs.

REVIEW OF THE PENNSYLVANIA CHILD SUPPORT GUIDELINES: TECHNIAL FINDINGS
61
Despite the provisions of neighboring states, most states do not index the SSR or provide that it should
be more than 100 percent of the FPL. On the one hand, indexing the SSR to annual changes in the FPL
keeps the SSR more current. On the other hand, the indexed change may not significantly impact award
amounts but require some effort to publish the change, make automated system changes if necessary,
and inform guidelines users of the change. With regard to using a higher percentage of the FPL as the
SSR, these states often justify the higher percentage based on income eligibility thresholds for public
assistance programs available to families that are higher than 100 percent of the FPL (e.g., Medicaid’s
income eligibility threshold is often 185% of FPL). Further, the FPL reflects an after‐tax income amount,
while some state guidelines (e.g., District of Columbia and New York) are gross‐income based guidelines.
The higher percentage essentially accounts for the difference between gross and after‐tax income.
ImputedIncomeandActualIncomeAnother proposed federal rule change aims to limit income imputation, particularly among low‐income
noncustodial parents. It is common practice across the nation to impute full‐time, minimum‐wage
income to a parent with no evidence of current income, limited income history, no recent employment
history, and no evidence of employability above minimum‐wage due that parent’s lack of skills or
education. The OCSE proposed rule change calls for the use of “actual income” of the parent. Among
other things, OCSE’s intent with the requirement to use actual income is to prohibit the imputation of
income to incarcerated noncustodial parents without financial resource and limit income imputation
among parents whose income is involuntarily reduced or fluctuates substantially.
The existing provision of Pennsylvania guidelines, shown below, appears to fulfill the federal rule change
range regarding income imputation. Further, evidence from the casefile data shows that income is
PA Rule 1910.16‐2. 1) Low Income Cases. (A) When the obligor’s monthly net income and corresponding number of children fall into the shaded area of the schedule set forth in Rule 1910.16‐3, the basic child support obligation shall first be calculated using the obligor’s income only. For example, where the obligor has monthly net income of $1,100, the presumptive amount of support for three children is $156 per month. This amount is determined directly from the schedule in Rule 1910.16‐3. Next, calculate the obligor’s child support obligation as in any other case, using both parties’ monthly net incomes. The lower of the two calculations shall be the obligor’s basic child support obligation. (B) In computing a basic spousal support or alimony pendente lite obligation, the presumptive amount of support shall not reduce the obligor’s net income below the Self‐Support Reserve of $931 per month. For example, if the obligor earns $1,000 per month and the obligee earns $300 per month, the formula in Part IV of Rule 1910.16‐4 would result in a support obligation of $280 per month. Since this amount leaves the obligor with only $720 per month, it must be adjusted so that the obligor retains at least $931 per month. The presumptive minimum amount of spousal support, therefore, is $69 per month in this case. (C) When the obligor’s monthly net income is $931 or less, the court may award support only after consideration of the parties’ actual financial resources and living expenses.

REVIEW OF THE PENNSYLVANIA CHILD SUPPORT GUIDELINES: TECHNIAL FINDINGS
62
imputed to only 10 percent of noncustodial parents and 13 percent of custodial parents. Among these
parents, imputation at an income equivalent to full‐time, minimum wage employment is common.
These rates are below or in line with the percentage of parents with income equivalent to full‐time,
minimum wage income in other states.66 This suggests that this is not problem for Pennsylvania.
When OCSE does release the final rule changes, Pennsylvania may want to review its income imputation
provisions to ensure that it does indeed comply with the final rule. As is, there were requests for OCSE
to define what it means by “actual income.” Most states including Pennsylvania do not provide a
definition in their guidelines. A notable exception is Delaware, which defines actual income as a “parent
employed full‐time in a manner commensurate with his or her training, education and experience shall
be presumed to have reached their reasonable earning capacity.”
Cost-of-Living Adjustments Pennsylvania like most states typically updates its guidelines formula/table for changes in price levels
once every four years as a consequence of a state’s quadrennial child support guidelines review. No
state applies an automatic cost‐of‐living adjustment (COLA) to its core guidelines formula/schedule. A
handful of states (e.g., District of Columbia, Nebraska, New York, and Washington) automatically update
their self‐support reserve, which is part of their guidelines. These states annually update for changes to
the federal poverty level, which is published by the U.S. Department of Health and Human Services and
released in about February of each year. As discussed earlier, the merit of this approach is that it keeps
the self‐support reserve updated. The limitation of this approach is it requires making annual changes
and notifying guidelines users of the change such that they use it.
66 For example, see Venohr, Jane. (February 2015). “Income Available for Child Support: Fact and Fiction in State Child Support Guidelines.” National Child Support Enforcement Association Commique, Fairfax, Virginia.
PA Rule 1910.16.2 d) Reduced or Fluctuating Income. (4) Earning Capacity. If the trier of fact determines that a party to a support action has willfully failed to obtain or maintain appropriate employment, the trier of fact may impute to that party an income equal to the party’s earning capacity. Age, education, training, health, work experience, earnings history and child care responsibilities are factors which shall be considered in determining earning capacity. In order for an earning capacity to be assessed, the trier of fact must state the reasons for the assessment in writing or on the record. Generally, the trier of fact should not impute an earning capacity that is greater than the amount the party would earn from one full‐time position. Determination of what constitutes a reasonable work regimen depends upon all relevant circumstances including the choice of jobs available within a particular occupation, working hours, working conditions and whether a party has exerted substantial good faith efforts to find employment.
REVIEW OF THE PENNSYLVANIA CHILD SUPPORT GUIDELINES: TECHNIAL FINDINGS
63
SECTIONVI:SUMMARYANDCONCLUSIONS This report fulfills the federal requirement that states must examine case file data and consider the
economic evidence on the cost of raising children as part of a state’s review of its child support
guidelines. This report also develops an updated schedule for Pennsylvania using more current
economic data.
FindingsfromCaseFileDataA random sample of 5,000 cases from the automated calculator that is part of the Pennsylvania Child
Support Enforcement system (PACSES) was analyzed. The sample is equally divided between newly
established and modified orders. The guidelines formula was not applied in almost a quarter (23
percent) of the orders. In other words, there is a guidelines deviation rate of 23 percent. The guidelines
deviation rate has increased significantly for both newly established and modified orders since the last
guidelines review. It has increased from 18 to 25 percent among newly established orders and from 15
to 22 percent among modified orders. The Pennsylvania guidelines deviation rate is in line with the
guidelines deviation rates of Delaware, Maryland, Ohio, and other states. Most of the deviations were
downward, which is the trend in other states. A generic deviation code was used for the majority of
deviations. No specific deviation stood out as being used any more or less than it was during the last
review.
The Pennsylvania guidelines provides numerous provisions to adjust for special factors. These
adjustments effectively tailor the guidelines calculation for a particular case. Only a couple provisions
stood out as being used frequently. Based on income and number of children, it appears that one‐third
of noncustodial parents are eligible for the self‐support reserve (SSR). (Eligibility and application of SSR
test is not recorded by PACSES.) It appears that the SSR was applied because the average order among
those who appeared eligible is $157 per month, while the average order is $577 per month among those
who do not appear income eligible. The second most commonly used provision was to adjust for the
actual cost of the child’s health insurance premium. That provision was applied in about 30 percent of
the orders. One reason that more orders are not adjusted for the actual cost of the child’s health
insurance premium is many Pennsylvania children are enrolled in Medicaid. A history of Medicaid
receipt was common in the sampled orders.
Other guidelines provisions adjusting for special factors were generally used infrequently. The
adjustment for actual child care expenses was made in less than 20 percent of the orders, the
adjustment for the child’s unreimbursed medical expenses was made in less than 1 percent of the
orders, and the adjustment for the child’s additional needs was made in less than 5 percent of the
orders. Less than 10 percent of the sampled orders had an adjustment for substantial or shared physical
custody. Split custody was noted in less than 1 percent of the orders. An adjustment for multiple
families was made in about 15 percent of the orders. Spousal support or alimony pendent lite was
combined with the child support in about 10 percent of the orders.

REVIEW OF THE PENNSYLVANIA CHILD SUPPORT GUIDELINES: TECHNIAL FINDINGS
64
The predominant source of income is wages and salaries. Income imputation at earning capacity was
noted in a small percentage of the sample. It was noted for 10 percent of the noncustodial parents and
13 percent of the custodial parents. Limiting income imputation and using actual incomes are important
goals of the federal Office of Child Support Enforcement, and it appears that Pennsylvania is meeting
those goals.
Most of Pennsylvania’s provisions for special factors are similar to those of other states. The notable
exceptions are Pennsylvania’s treatment of parenting time and multiple orders. Pennsylvania’s
timesharing threshold for applying the substantial/shared physical custody is high relative to other
states and produces a smaller adjustment than many states. Pennsylvania’s adjustment for multiple
orders has been recognized as a best practice nationally, but other states are reluctant to implement it
because it requires modifying more than one child support order.
EconomicDataandUpdatedScheduleChild support schedules consist of both economic data and policy decisions. Most states base their child
support schedules on economic data on the cost of raising children. In all, state guidelines rely on nine
different studies of child‐rearing expenditures that vary in age and methodology used to separate child‐
rearing expenditures from total expenditures in a household. There is no consensus on which
methodology best reflects actual child‐rearing expenditures. However, many economists and
policymakers believe that any amounts between the lower and upper bound of credible measurements
of child‐rearing expenditures are appropriate.
The existing Pennsylvania schedule was developed in 2011. Three new and credible studies of child‐
rearing expenditures have been released or are available for updating the Pennsylvania schedule: the
United States Department of Agriculture (USDA) study of child‐rearing expenditures, a more current
study of child‐rearing expenditures by Professor Betson using the Rothbarth methodology, and a New
Jersey study of child‐rearing expenditures using the Rothbarth methodology. The existing Pennsylvania
schedule produces amounts within the range of these studies. To that end, it produces appropriate
amounts for child support awards. However, there is no overwhelming justification to switch from the
economic study underlying the current Pennsylvania child support guidelines to one of these studies.
Each of these studies includes assumptions or methodology that differ from the economic study
underlying the current Pennsylvania child support schedule. Some of the differences in assumption or
methodology are not overwhelmingly better. Moreover, the impact of the change is of major concern,
particularly because it stems more from differences in assumptions or methodology rather than real
changes in child‐rearing expenditures. Adaption of the USDA or New Jersey study would produce
substantial increases to the existing schedule. Adaption of the Betson‐Rothbarth measurement would
produce some decreases to the existing schedule. Retaining the current economic basis of the existing
schedule, however, keeps Pennsylvania schedule amounts in between these current studies.
Although there is no change in the study used as the basis of the Pennsylvania child support schedule,
the schedule is updated for changes in price levels and the federal poverty level since the schedule was
developed in 2011. There is also an update for new economic data on entertainment fees that is a
factor considered in the adjustment for parenting time. Updating the schedule for these factors

REVIEW OF THE PENNSYLVANIA CHILD SUPPORT GUIDELINES: TECHNIAL FINDINGS
65
produces increases of about 1.4 percent. The increase is small, but warranted. There has been little
inflation in recent years, but keeping child support guidelines up to date is in the best interest of
Pennsylvania children and just to the parties.
REVIEW OF THE PENNSYLVANIA CHILD SUPPORT GUIDELINES: TECHNIAL FINDINGS
66
REFERENCESAmerican Community Survey. (2014). U.S. Census, Washington, D.C. Data available at
http://www.census.gov .
Arizona Child Support Guidelines Review Committee (2009). Interim Report of the Committee, Submitted to Arizona Judicial Council, Phoenix, Arizona.
Beld, Jo Michelle and Len Biernat. (2003). Federal Intent for State Child Support Guidelines, Income Shares, Cost Shares, and the Realities of Shared Parenting. 37 Family Law Quarterly 165.
Barnow, Burt S. (1994). “The Economic Studies of Expenditures on Children and Their Relationship to Child Support Guidelines,” Child Support Guidelines: The Next Generation. U.S. Department of Health and Human Services, Administrative for Children and Families, Office of Child Support Enforcement, Washington, D.C.
Betson, David M. (2010). “Appendix A: Parental Expenditures on Children.” in Judicial Council of California, Review of Statewide Uniform Child Support Guideline. San Francisco, California.
Betson, David M. (2006). “Appendix I: New Estimates of Child‐Rearing Costs in State of Oregon Child Support Guidelines Review: Updated Obligation Scales and Other Considerations. Report to State of Oregon, Prepared by Policy Studies Inc., Denver Colorado.
Betson, David M. (2001). “Chapter 5: Parental Expenditures on Children.” in Judicial Council of California, Review of Statewide Uniform Child Support Guideline. San Francisco, California.
Betson, David M. (1990). Alternative Estimates of the Cost of Children from the 1980‐86 Consumer Expenditure Survey. Report to U.S. Department of Health and Human Services, Office of the Assistant Secretary for Planning and Evaluation. University of Wisconsin Institute for Research on Poverty, Madison, Wisconsin.
Cancian, Maria and Meyer, Dan. (2006). Alternative Approaches to Child Support Policy in the Context of Multiple‐Partner Fertility. University of Wisconsin Institute for Research on Poverty, Madison, Wisconsin.
Citro, Constance F. and Robert T. Michael, Editors. (1995). Measuring Poverty: A New Approach.
National Academy Press. Washington, D.C. Espenshade, Thomas J. (1984). Investing in Children: New Estimates of Parental Expenditures. Urban
Institute Press: Washington, D.C.
Federal Office of Child Support Enforcement, (2015). Report to Congress, Preliminary 2014, Federal Office of Child Support Enforcement, Washington, DC.
Grall, Timothy. (2016). “Custodial Mothers and Fathers and Their Child Support: 2013,” Current Population Reports, P60‐240, Washington, D.C.
Hall, L., Logan Paserella, L., and Born, C.E. (2012). Maryland Child Support Guidelines: Case Level Review 2007‐2010. Family Welfare and Research Training Group, University of Maryland, Baltimore, MD. Retrieved from: http://www.familywelfare.umaryland.edu/reports1/guidelines12.pdf .

REVIEW OF THE PENNSYLVANIA CHILD SUPPORT GUIDELINES: TECHNIAL FINDINGS
67
Lewin/ICF. (1990). Estimates of Expenditures on Children and Child Support Guidelines. Report to U.S. Department of Health and Human Services, Office of the Assistant Secretary for Planning and Evaluation. Fairfax, Virginia.
Lino, Mark (2014). Expenditures on Children by Families: 2013 Annual Report. U.S. Department of Agriculture, Center for Nutrition and Policy Promotion. Miscellaneous Publication No. 1528‐2013, Washington, D.C.
Livingston, Gretchen, and Parker, Kim. (June 2011). A Tale of Two Fathers: More Are Active, but More Are Absent. Pew Social & Demographic Trends. Retrieved from http://www.pewsocialtrends.org/files/2011/06/fathers‐FINAL‐report.pdf
National Center for State Courts. (1987). Development of Guidelines for Child Support Orders, Final
Report. Report to U.S. Department of Health and Human Services, Office of Child Support Enforcement, Williamsburg, Virginia.
New Jersey Child Support Institute. (March 2013). Quadrennial Review: Final Report, Institute for Families, Rutgers, the State University of New Jersey, New Brunswick, NJ. Available at: http://www.judiciary.state.nj.us/reports2013/F0_NJ+QuadrennialReview‐Final_3.22.13_complete.pdf
Ohio Department of Jobs and Family Services. (2013). 2013 Child Support Guidelines Review. Report to the General Assembly. Retrieved from http://jfs.ohio.gov/Ocs/pdf/2013CSGuidelinesAdvCouncilReport.stm
Osborne, Cynthia and Ankrum, Nora. (April 2015). “Understanding Today’s Changing Families.” Family Court Review, Vol. 53, No. 2. pp 221‐232.
Pennsylvania Department of Labor and Industry. (n.d.) Labor Market Information, various years,
Harrisburg, PA. Retrieved from http://paworkstats.geosolinc.com Policy Studies Inc. (2008), 2008 Update of the Pennsylvania Child Support Guidelines Schedule,
submitted by Policy Studies Inc., Denver, Colorado.
Policy Studies Inc. (January, 2005). Washington State Child Support Schedule: Selected Issues Affecting Predictability, Retrieved from: http://www.dshs.wa.gov/pdf/esa/dcs/reports/AppendixIV‐d.pdf
Sorensen, E. et al. (2007). Assessing Child Support Supports Arrears in Nine Large States and the Nation. Report to the U.S. Secretary of Health and Human Services Assistant Secretary of Policy and Evaluation.
Saunders, C., Young, D., Ovwigho, P.C., & Born, C. E. (2008). Maryland Child Support Guidelines: Case File Review, Family Welfare and Research Training Group, University of Maryland, Baltimore, MD.
Takayesu, Mark. (2012), A “Guideline“ to Improving Collections. Presentation to the National Child Support Enforcement Association Policy Briefing on February 10, 2012, Washington, D.C.
U.S. Bureau of Labor Statistics. (2015). Consumer Expenditure Survey. Details available at www.bls.gov/cex/home.html
REVIEW OF THE PENNSYLVANIA CHILD SUPPORT GUIDELINES: TECHNIAL FINDINGS
68
U.S. Bureau of Labor Statistics. (n.d.), State Occupation and Wage Estimates, May 2014 and May 2011. Retrieved from http://www.bls.gov/oes/current/oessrcst.htm.
U.S. Department of Health and Human Services. (Nov. 17, 2014). “Flexibility, Efficiency, and
Modernization in Child Support Enforcement Programs.” Federal Register, vol. 79, No. 221, p.
68580. Retrieved from http://www.acf.hhs.gov/programs/css/resource/nprm‐flexibility‐
efficiency‐and‐modernization‐in‐child‐support‐enforcement‐programs
U.S.. Department of Health and Human Services, Administration for Children and Families. (n.d.) Pathways to Fatherhood. Retrieved from http://www.acf.hhs.gov/programs/ofa/programs/healthy‐marriage/responsible‐fatherhood
van der Gaag, Jacques (1981). On Measuring the Cost of Children. Discussion Paper 663‐81. University of
Wisconsin Institute for Research on Poverty, Madison, Wisconsin.
Venohr, Jane. (February 2015). “Income Available for Child Support: Fact and Fiction in State Child
Support Guidelines.” National Child Support Enforcement Association Commique, Fairfax,
Virginia. Venohr, J.C. (2014). Economic Review of the West Virginia Child Support Table. Report to the West
Virginia Department of Health and Human Resources, Bureau of Child Support. Center for Policy Research, Denver, CO.
Venohr, J.C. (2014). Arizona Child Support Guidelines Review: Findings from the Case File Data. Report to Arizona Supreme Court Administrative Office of the Courts. Retrieved from http://www.azcourts.gov/Portals/31/GuidelinesReview/AZChildSupportGuidelinesReviewFindingsfromCaseFileData082014RED.pdf
Jane C. Venohr (2013) “Child Support Guidelines and Guidelines Reviews: State Differences and Common Issues,” Family Law Quarterly, vol. 43, no. 3 (Fall 2013).
Venohr, Jane and Everett, Carly (2010), Review of the New York Guidelines, Report to the New York State Department of Temporary and Disability Assistance, Center for Policy Research.

REVIEW OF THE PENNSYLVANIA CHILD SUPPORT GUIDELINES: TECHNIAL FINDINGS
69
APPENDIXA:METHODOLOGYFORMEASURINGGUIDELINESDEVIATIONS
PACSES indicates guidelines deviations by recording the guidelines‐calculated amount, the
recommended order amount, and the actual order amount, as well as the reason for the deviation.
Reason codes include nondeviation codes such as the application of the multiple family adjustment
that is part of the guidelines. Table A‐1 shows the reason codes listed in PACSES, which ones are
classified and counted as a guidelines deviation, and
which ones are not.
In some instances where the PACSES guidelines‐
calculated amount does not match the actual order
amount, it is because PACSES records the guidelines
amount prior to the consideration of some
guidelines provisions such as the consideration of
the obligor’s actual living expenses when the
obligor’s net income is $931 per month or less.
There are 62 cases total among both modified and
newly established orders that were excluded as
deviations for this reason.
Another common reason for the guidelines and final
orders amounts not matching is when spousal
support/alimony pendente lite (APL) is combined
with the child support amount even though spousal
support/APL and child support are both calculated
according to the guidelines. There are 128 cases
total among both modified and newly established
orders that were excluded for this reason.
Rounding off the guidelines amount also overstates
guidelines deviations. To rectify this, if the final
order differs from the guidelines amount by less
than 5 percent or less than $20 per month it is not
classified as a deviation. There are 344 cases total
among both modified and newly established orders
that are excluded for this reason.
Before any of the last three adjustments, the deviation
rate would be 34 percent across all modified and newly
established orders.
Rule 1910.16-5. Support Guidelines. Deviation. (a) Deviation. If the amount of support deviates from the amount of support determined by the guidelines, the trier of fact shall specify, in writing or on the record, the guideline amount of support, and the reasons for, and findings of fact justifying, the amount of the deviation. Official Note The deviation applies to the amount of the support obligation and not to the amount of income. (b) Factors. In deciding whether to deviate from the amount of support determined by the guidelines, the trier of fact shall consider: (1) unusual needs and unusual fixed obligations; (2) other support obligations of the parties; (3) other income in the household; (4) ages of the children; (5) the relative assets and liabilities of the parties; (6) medical expenses not covered by insurance; (7) standard of living of the parties and their children; (8) in a spousal support or alimony pendente lite case, the duration of the marriage from the date of marriage to the date of final separation; and (9) other relevant and appropriate factors, including the best interests of the child or children.

REVIEW OF THE PENNSYLVANIA CHILD SUPPORT GUIDELINES: TECHNIAL FINDINGS
70
Table A.1 Frequencies of PACSES Deviation Codes
(Counts do not add to 5,000 orders due to multiple responses)
REASON-CODE DESCRIPTION
Counted as a
DeviationNumber of
Cases AD APPROVED 2 AG AGREEMENT 38 AS ASSETS OF PARTIES 99 BI BEST INTEREST OF CHILDREN 333 CD CONDUCT CONFERENCE No 2 GC GOOD CAUSE 4 HD HEARING DEMANDED No 1 HR HRG OFFICER'S RECOMMENDATION No 5 IE INCOME EQUALIZED 33 IO INTERIM ORDER ENTERED No 0 JA JUDGE ACCEPTS No 1 ME MEDICAL EXP NOT COVERED BY INS 5 MZ MELZER CALCULATION No 0 NG NO AGREEMENT No 6 OB OTHER SUP OBLIG OF THE PARTIES 105 OD OTHER RELEVANT FACTOR 1,170 OI OTHER INCOME IN THE HOUSEHOLD 23
OR ORDER REDUC DUE TO OVERPAYMENT No 1
RD PROPORTIONATE REDUCTION No 609 SC SUPPORT CONFERENCE CONDUCTED No 1 SL STANDARD OF LIVING 54 UM ORDER MODIFIED UPWARD No 1 UN UNUSUAL NEEDS/FIXED OBLIGS 21 No Code No 3,112
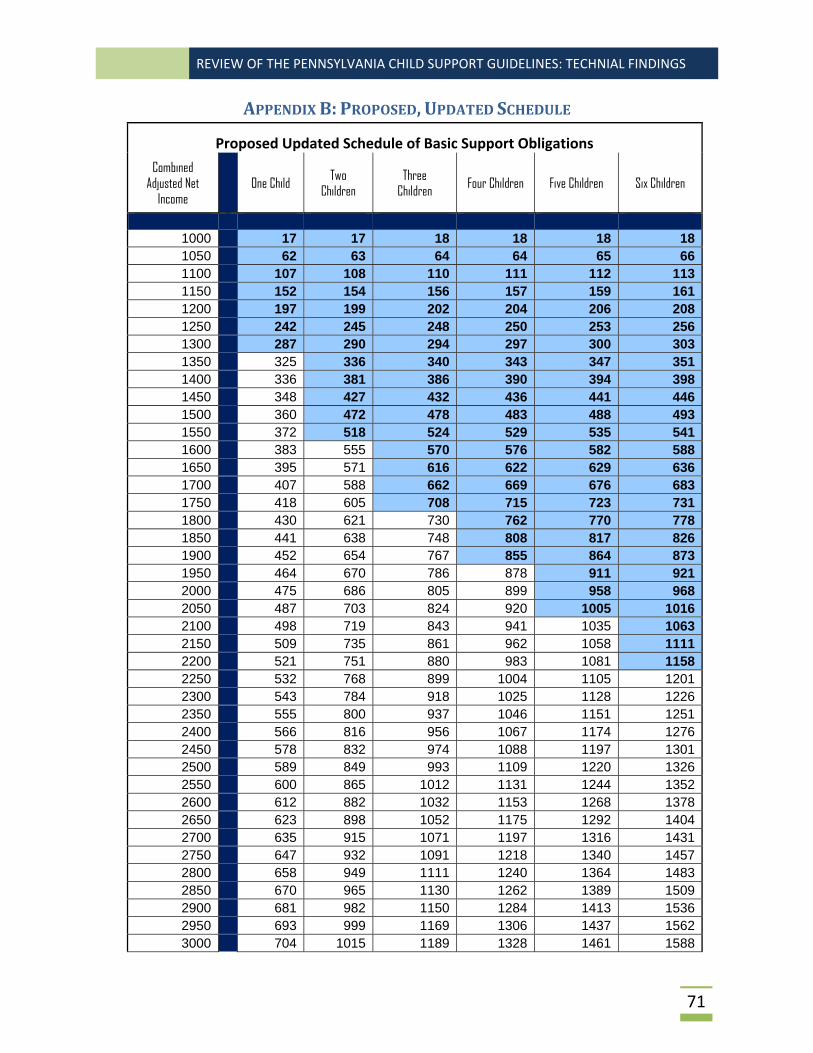
REVIEW OF THE PENNSYLVANIA CHILD SUPPORT GUIDELINES: TECHNIAL FINDINGS
71
APPENDIXB:PROPOSED,UPDATEDSCHEDULE
Proposed Updated Schedule of Basic Support Obligations
Combined Adjusted Net
Income
One Child Two
Children Three
Children Four Children Five Children Six Children
1000 17 17 18 18 18 18 1050 62 63 64 64 65 66 1100 107 108 110 111 112 113 1150 152 154 156 157 159 161 1200 197 199 202 204 206 208 1250 242 245 248 250 253 256 1300 287 290 294 297 300 303 1350 325 336 340 343 347 351 1400 336 381 386 390 394 398 1450 348 427 432 436 441 446 1500 360 472 478 483 488 493 1550 372 518 524 529 535 541 1600 383 555 570 576 582 588 1650 395 571 616 622 629 636 1700 407 588 662 669 676 683 1750 418 605 708 715 723 731 1800 430 621 730 762 770 778 1850 441 638 748 808 817 826 1900 452 654 767 855 864 873 1950 464 670 786 878 911 921 2000 475 686 805 899 958 968 2050 487 703 824 920 1005 1016 2100 498 719 843 941 1035 1063 2150 509 735 861 962 1058 1111 2200 521 751 880 983 1081 1158 2250 532 768 899 1004 1105 1201 2300 543 784 918 1025 1128 1226 2350 555 800 937 1046 1151 1251 2400 566 816 956 1067 1174 1276 2450 578 832 974 1088 1197 1301 2500 589 849 993 1109 1220 1326 2550 600 865 1012 1131 1244 1352 2600 612 882 1032 1153 1268 1378 2650 623 898 1052 1175 1292 1404 2700 635 915 1071 1197 1316 1431 2750 647 932 1091 1218 1340 1457 2800 658 949 1111 1240 1364 1483 2850 670 965 1130 1262 1389 1509 2900 681 982 1150 1284 1413 1536 2950 693 999 1169 1306 1437 1562 3000 704 1015 1189 1328 1461 1588

REVIEW OF THE PENNSYLVANIA CHILD SUPPORT GUIDELINES: TECHNIAL FINDINGS
72
3050 716 1032 1209 1350 1485 1614 3100 727 1049 1228 1372 1509 1641 3150 739 1065 1248 1394 1534 1667 3200 751 1082 1268 1416 1558 1693 3250 762 1099 1287 1438 1582 1719 3300 774 1115 1307 1460 1606 1745 3350 782 1127 1320 1475 1622 1763 3400 791 1140 1333 1489 1638 1781 3450 800 1152 1347 1504 1655 1799 3500 809 1164 1360 1519 1671 1817 3550 818 1176 1373 1534 1687 1834 3600 827 1188 1387 1549 1704 1852 3650 836 1200 1400 1564 1720 1870 3700 845 1212 1413 1579 1737 1888 3750 853 1224 1427 1594 1753 1905 3800 862 1236 1440 1608 1769 1923 3850 868 1245 1450 1620 1782 1937 3900 873 1253 1460 1630 1793 1949 3950 879 1261 1469 1641 1805 1962 4000 884 1269 1479 1652 1817 1975 4050 890 1277 1488 1662 1829 1988 4100 895 1285 1498 1673 1840 2001 4150 900 1293 1508 1684 1852 2013 4200 906 1301 1517 1695 1864 2026 4250 911 1309 1527 1705 1876 2039 4300 917 1317 1536 1716 1888 2052 4350 922 1325 1545 1726 1899 2064 4400 928 1333 1555 1736 1910 2076 4450 934 1341 1564 1747 1921 2088 4500 940 1349 1573 1757 1932 2100 4550 946 1357 1582 1767 1943 2113 4600 952 1365 1591 1777 1955 2125 4650 957 1373 1600 1787 1966 2137 4700 963 1381 1609 1797 1977 2149 4750 969 1389 1618 1807 1988 2161 4800 975 1397 1627 1817 1999 2173 4850 979 1403 1633 1824 2006 2181 4900 983 1407 1637 1828 2011 2186 4950 986 1411 1641 1833 2016 2191 5000 990 1415 1644 1837 2020 2196 5050 993 1419 1648 1841 2025 2201 5100 996 1423 1652 1845 2030 2206 5150 1000 1427 1656 1850 2034 2211 5200 1003 1431 1660 1854 2039 2217 5250 1007 1436 1663 1858 2044 2222 5300 1010 1440 1667 1862 2049 2227 5350 1014 1445 1672 1868 2055 2234 5400 1018 1451 1679 1876 2063 2243

REVIEW OF THE PENNSYLVANIA CHILD SUPPORT GUIDELINES: TECHNIAL FINDINGS
73
5450 1022 1457 1686 1883 2072 2252 5500 1027 1463 1693 1891 2080 2261 5550 1031 1469 1700 1899 2089 2270 5600 1036 1475 1707 1906 2097 2279 5650 1040 1481 1714 1914 2105 2289 5700 1044 1487 1720 1922 2114 2298 5750 1049 1493 1727 1929 2122 2307 5800 1053 1499 1734 1937 2131 2316 5850 1057 1505 1741 1945 2139 2325 5900 1062 1511 1748 1952 2148 2334 5950 1066 1517 1755 1960 2156 2343 6000 1071 1523 1761 1968 2164 2353 6050 1075 1529 1768 1975 2173 2362 6100 1079 1536 1775 1983 2181 2371 6150 1085 1542 1783 1992 2191 2381 6200 1090 1549 1791 2000 2200 2392 6250 1095 1556 1798 2009 2210 2402 6300 1100 1563 1806 2017 2219 2412 6350 1105 1570 1814 2026 2228 2422 6400 1110 1577 1821 2034 2238 2432 6450 1115 1584 1829 2043 2247 2443 6500 1120 1591 1836 2051 2256 2453 6550 1125 1598 1844 2060 2266 2463 6600 1130 1605 1852 2068 2275 2473 6650 1135 1612 1859 2077 2285 2483 6700 1140 1619 1867 2085 2294 2494 6750 1145 1625 1875 2094 2303 2504 6800 1151 1632 1882 2103 2313 2514 6850 1156 1639 1890 2111 2322 2524 6900 1160 1646 1898 2120 2332 2535 6950 1165 1653 1906 2129 2342 2546 7000 1170 1660 1914 2138 2352 2556 7050 1175 1667 1922 2147 2361 2567 7100 1180 1674 1930 2156 2371 2578 7150 1185 1681 1938 2165 2381 2588 7200 1190 1687 1946 2173 2391 2599 7250 1195 1694 1954 2182 2401 2609 7300 1199 1701 1962 2191 2410 2620 7350 1204 1708 1970 2200 2420 2631 7400 1209 1715 1978 2209 2430 2641 7450 1214 1722 1986 2218 2440 2652 7500 1219 1729 1994 2227 2450 2663 7550 1224 1736 2002 2236 2459 2673 7600 1229 1743 2010 2245 2469 2684 7650 1233 1749 2017 2253 2478 2694 7700 1238 1756 2024 2261 2487 2704 7750 1243 1762 2032 2269 2496 2714 7800 1248 1769 2039 2278 2505 2723
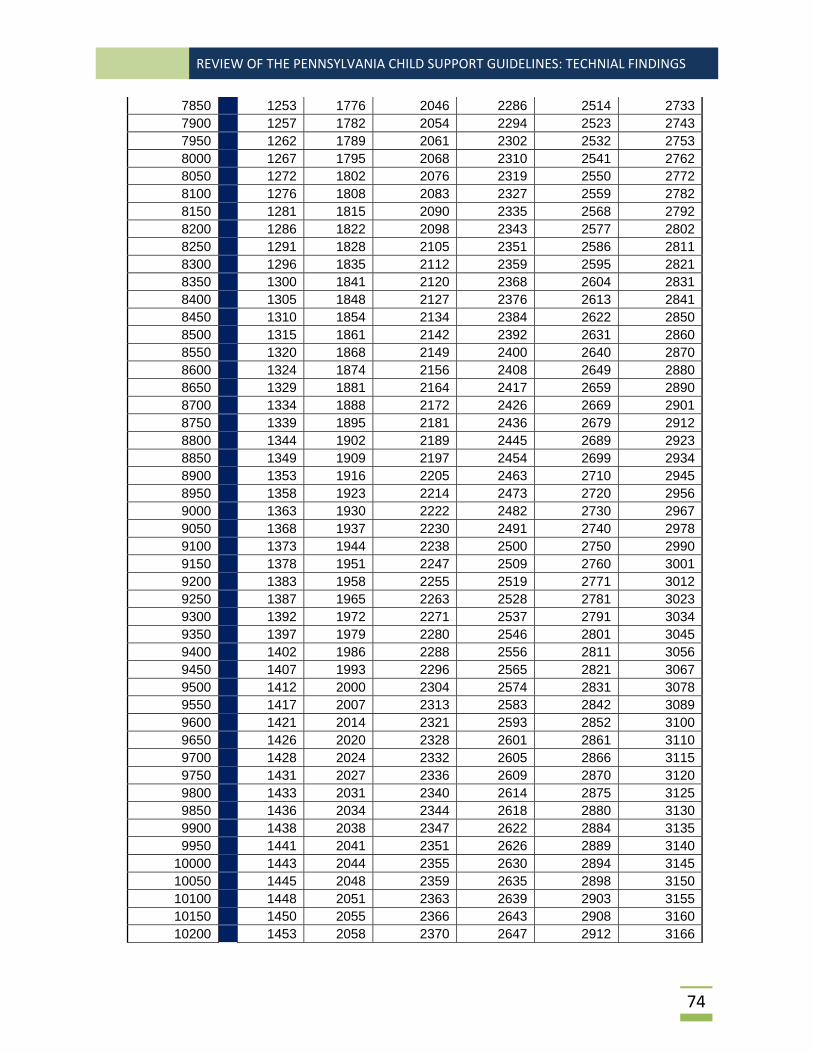
REVIEW OF THE PENNSYLVANIA CHILD SUPPORT GUIDELINES: TECHNIAL FINDINGS
74
7850 1253 1776 2046 2286 2514 2733 7900 1257 1782 2054 2294 2523 2743 7950 1262 1789 2061 2302 2532 2753 8000 1267 1795 2068 2310 2541 2762 8050 1272 1802 2076 2319 2550 2772 8100 1276 1808 2083 2327 2559 2782 8150 1281 1815 2090 2335 2568 2792 8200 1286 1822 2098 2343 2577 2802 8250 1291 1828 2105 2351 2586 2811 8300 1296 1835 2112 2359 2595 2821 8350 1300 1841 2120 2368 2604 2831 8400 1305 1848 2127 2376 2613 2841 8450 1310 1854 2134 2384 2622 2850 8500 1315 1861 2142 2392 2631 2860 8550 1320 1868 2149 2400 2640 2870 8600 1324 1874 2156 2408 2649 2880 8650 1329 1881 2164 2417 2659 2890 8700 1334 1888 2172 2426 2669 2901 8750 1339 1895 2181 2436 2679 2912 8800 1344 1902 2189 2445 2689 2923 8850 1349 1909 2197 2454 2699 2934 8900 1353 1916 2205 2463 2710 2945 8950 1358 1923 2214 2473 2720 2956 9000 1363 1930 2222 2482 2730 2967 9050 1368 1937 2230 2491 2740 2978 9100 1373 1944 2238 2500 2750 2990 9150 1378 1951 2247 2509 2760 3001 9200 1383 1958 2255 2519 2771 3012 9250 1387 1965 2263 2528 2781 3023 9300 1392 1972 2271 2537 2791 3034 9350 1397 1979 2280 2546 2801 3045 9400 1402 1986 2288 2556 2811 3056 9450 1407 1993 2296 2565 2821 3067 9500 1412 2000 2304 2574 2831 3078 9550 1417 2007 2313 2583 2842 3089 9600 1421 2014 2321 2593 2852 3100 9650 1426 2020 2328 2601 2861 3110 9700 1428 2024 2332 2605 2866 3115 9750 1431 2027 2336 2609 2870 3120 9800 1433 2031 2340 2614 2875 3125 9850 1436 2034 2344 2618 2880 3130 9900 1438 2038 2347 2622 2884 3135 9950 1441 2041 2351 2626 2889 3140
10000 1443 2044 2355 2630 2894 3145 10050 1445 2048 2359 2635 2898 3150 10100 1448 2051 2363 2639 2903 3155 10150 1450 2055 2366 2643 2908 3160 10200 1453 2058 2370 2647 2912 3166
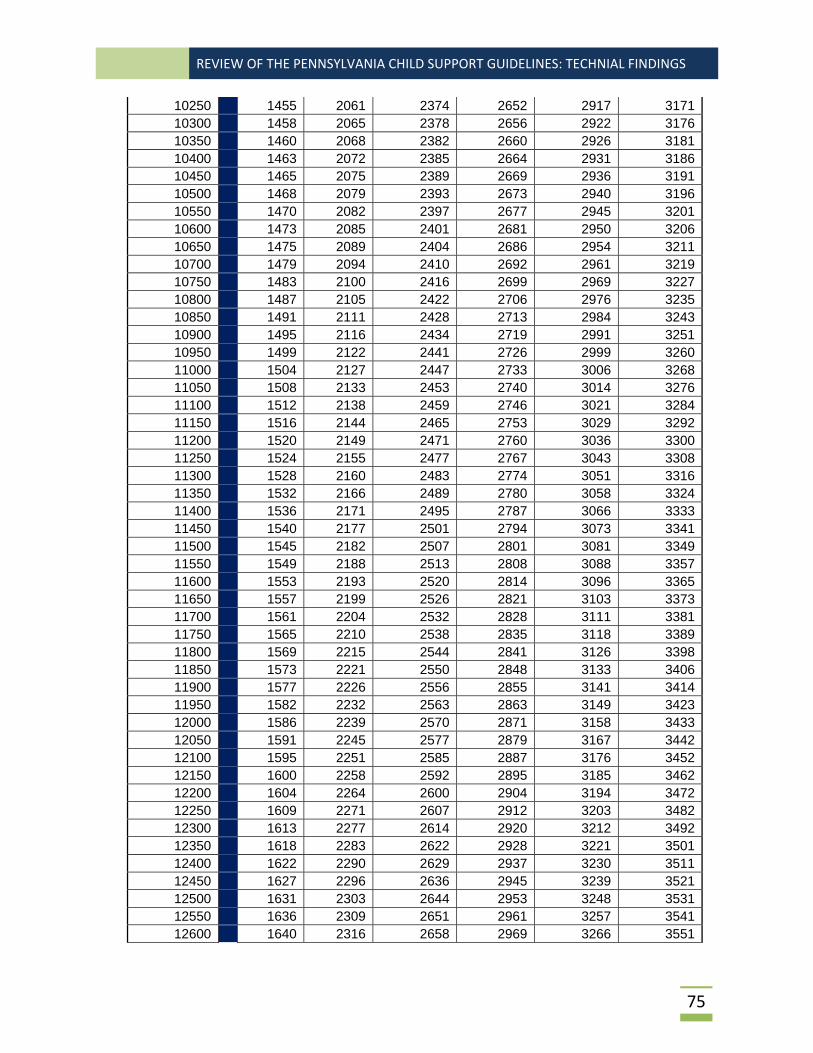
REVIEW OF THE PENNSYLVANIA CHILD SUPPORT GUIDELINES: TECHNIAL FINDINGS
75
10250 1455 2061 2374 2652 2917 3171 10300 1458 2065 2378 2656 2922 3176 10350 1460 2068 2382 2660 2926 3181 10400 1463 2072 2385 2664 2931 3186 10450 1465 2075 2389 2669 2936 3191 10500 1468 2079 2393 2673 2940 3196 10550 1470 2082 2397 2677 2945 3201 10600 1473 2085 2401 2681 2950 3206 10650 1475 2089 2404 2686 2954 3211 10700 1479 2094 2410 2692 2961 3219 10750 1483 2100 2416 2699 2969 3227 10800 1487 2105 2422 2706 2976 3235 10850 1491 2111 2428 2713 2984 3243 10900 1495 2116 2434 2719 2991 3251 10950 1499 2122 2441 2726 2999 3260 11000 1504 2127 2447 2733 3006 3268 11050 1508 2133 2453 2740 3014 3276 11100 1512 2138 2459 2746 3021 3284 11150 1516 2144 2465 2753 3029 3292 11200 1520 2149 2471 2760 3036 3300 11250 1524 2155 2477 2767 3043 3308 11300 1528 2160 2483 2774 3051 3316 11350 1532 2166 2489 2780 3058 3324 11400 1536 2171 2495 2787 3066 3333 11450 1540 2177 2501 2794 3073 3341 11500 1545 2182 2507 2801 3081 3349 11550 1549 2188 2513 2808 3088 3357 11600 1553 2193 2520 2814 3096 3365 11650 1557 2199 2526 2821 3103 3373 11700 1561 2204 2532 2828 3111 3381 11750 1565 2210 2538 2835 3118 3389 11800 1569 2215 2544 2841 3126 3398 11850 1573 2221 2550 2848 3133 3406 11900 1577 2226 2556 2855 3141 3414 11950 1582 2232 2563 2863 3149 3423 12000 1586 2239 2570 2871 3158 3433 12050 1591 2245 2577 2879 3167 3442 12100 1595 2251 2585 2887 3176 3452 12150 1600 2258 2592 2895 3185 3462 12200 1604 2264 2600 2904 3194 3472 12250 1609 2271 2607 2912 3203 3482 12300 1613 2277 2614 2920 3212 3492 12350 1618 2283 2622 2928 3221 3501 12400 1622 2290 2629 2937 3230 3511 12450 1627 2296 2636 2945 3239 3521 12500 1631 2303 2644 2953 3248 3531 12550 1636 2309 2651 2961 3257 3541 12600 1640 2316 2658 2969 3266 3551

REVIEW OF THE PENNSYLVANIA CHILD SUPPORT GUIDELINES: TECHNIAL FINDINGS
76
12650 1645 2322 2666 2978 3275 3560 12700 1649 2328 2673 2986 3285 3570 12750 1654 2335 2681 2994 3294 3580 12800 1659 2341 2688 3002 3303 3590 12850 1663 2348 2695 3011 3312 3600 12900 1668 2354 2703 3019 3321 3610 12950 1672 2360 2710 3027 3330 3619 13000 1677 2367 2717 3035 3339 3629 13050 1681 2373 2725 3044 3348 3639 13100 1686 2380 2732 3052 3357 3649 13150 1690 2386 2739 3060 3366 3659 13200 1695 2392 2747 3068 3375 3669 13250 1699 2399 2754 3076 3384 3678 13300 1704 2405 2762 3085 3393 3688 13350 1708 2412 2769 3093 3402 3698 13400 1713 2418 2776 3101 3411 3708 13450 1717 2424 2784 3109 3420 3718 13500 1722 2431 2791 3118 3429 3728 13550 1726 2437 2798 3126 3438 3737 13600 1731 2444 2806 3134 3447 3747 13650 1735 2450 2813 3142 3456 3757 13700 1740 2457 2820 3150 3465 3767 13750 1745 2463 2828 3159 3475 3777 13800 1749 2469 2835 3167 3484 3787 13850 1754 2476 2843 3175 3493 3797 13900 1758 2482 2850 3183 3502 3806 13950 1763 2489 2857 3192 3511 3816 14000 1766 2493 2863 3198 3517 3823 14050 1770 2498 2868 3203 3524 3830 14100 1773 2503 2873 3209 3530 3837 14150 1776 2507 2878 3215 3536 3844 14200 1780 2512 2883 3221 3543 3851 14250 1783 2517 2889 3227 3549 3858 14300 1786 2521 2894 3232 3556 3865 14350 1790 2526 2899 3238 3562 3872 14400 1793 2531 2904 3244 3568 3879 14450 1797 2535 2909 3250 3575 3886 14500 1800 2540 2915 3256 3581 3893 14550 1803 2545 2920 3261 3588 3900 14600 1807 2549 2925 3267 3594 3907 14650 1810 2554 2930 3273 3600 3914 14700 1814 2558 2935 3279 3607 3921 14750 1817 2563 2941 3285 3613 3927 14800 1820 2568 2946 3290 3620 3934 14850 1824 2572 2951 3296 3626 3941 14900 1827 2577 2956 3302 3632 3948 14950 1830 2582 2961 3308 3639 3955 15000 1834 2586 2967 3314 3645 3962

REVIEW OF THE PENNSYLVANIA CHILD SUPPORT GUIDELINES: TECHNIAL FINDINGS
77
15050 1837 2591 2972 3320 3651 3969 15100 1841 2596 2977 3325 3658 3976 15150 1844 2600 2982 3331 3664 3983 15200 1847 2605 2987 3337 3671 3990 15250 1851 2610 2993 3343 3677 3997 15300 1854 2614 2998 3349 3683 4004 15350 1858 2619 3003 3354 3690 4011 15400 1861 2624 3008 3360 3696 4018 15450 1864 2628 3013 3366 3703 4025 15500 1868 2633 3019 3372 3709 4032 15550 1871 2638 3024 3378 3715 4039 15600 1874 2642 3029 3383 3722 4046 15650 1878 2647 3034 3389 3728 4053 15700 1881 2652 3039 3395 3735 4059 15750 1885 2656 3045 3401 3741 4066 15800 1888 2661 3050 3407 3747 4073 15850 1891 2666 3055 3412 3754 4080 15900 1895 2670 3060 3418 3760 4087 15950 1898 2675 3065 3424 3767 4094 16000 1902 2679 3071 3430 3773 4101 16050 1905 2684 3076 3436 3779 4108 16100 1908 2689 3081 3442 3786 4115 16150 1912 2693 3086 3447 3792 4122 16200 1915 2698 3091 3453 3798 4129 16250 1918 2703 3097 3459 3805 4136 16300 1922 2707 3102 3465 3811 4143 16350 1925 2712 3107 3471 3818 4150 16400 1929 2717 3112 3476 3824 4157 16450 1932 2721 3117 3482 3830 4164 16500 1935 2726 3123 3488 3837 4171 16550 1939 2731 3128 3494 3843 4178 16600 1942 2735 3133 3500 3850 4184 16650 1946 2740 3138 3505 3856 4191 16700 1949 2745 3143 3511 3862 4198 16750 1952 2749 3149 3517 3869 4205 16800 1956 2754 3154 3523 3875 4212 16850 1959 2759 3159 3529 3882 4219 16900 1963 2763 3164 3534 3888 4226 16950 1966 2768 3169 3540 3894 4233 17000 1969 2773 3175 3546 3901 4240 17050 1973 2777 3180 3552 3907 4247 17100 1976 2782 3185 3558 3913 4254 17150 1979 2787 3190 3564 3920 4261 17200 1983 2791 3195 3569 3926 4268 17250 1986 2796 3201 3575 3933 4275 17300 1990 2801 3206 3581 3939 4282 17350 1993 2805 3211 3587 3945 4289 17400 1996 2810 3216 3593 3952 4296

REVIEW OF THE PENNSYLVANIA CHILD SUPPORT GUIDELINES: TECHNIAL FINDINGS
78
17450 2000 2814 3221 3598 3958 4303 17500 2003 2819 3227 3604 3965 4310 17550 2007 2824 3232 3610 3971 4316 17600 2010 2828 3237 3616 3977 4323 17650 2013 2833 3242 3622 3984 4330 17700 2017 2838 3247 3627 3990 4337 17750 2020 2842 3253 3633 3997 4344 17800 2023 2847 3258 3639 4003 4351 17850 2027 2852 3263 3645 4009 4358 17900 2030 2856 3268 3651 4016 4365 17950 2034 2861 3273 3656 4022 4372 18000 2037 2866 3279 3662 4028 4379 18050 2040 2870 3284 3668 4035 4386 18100 2044 2875 3289 3674 4041 4393 18150 2047 2880 3294 3680 4048 4400 18200 2051 2884 3299 3685 4054 4407 18250 2054 2889 3305 3691 4060 4414 18300 2057 2894 3310 3697 4067 4421 18350 2061 2898 3315 3703 4073 4428 18400 2064 2903 3320 3709 4080 4435 18450 2067 2908 3325 3715 4086 4441 18500 2071 2912 3331 3720 4092 4448 18550 2074 2917 3336 3726 4099 4455 18600 2078 2922 3341 3732 4105 4462 18650 2081 2926 3346 3738 4112 4469 18700 2084 2931 3351 3744 4118 4476 18750 2088 2935 3357 3749 4124 4483 18800 2091 2940 3362 3755 4131 4490 18850 2095 2945 3367 3761 4137 4497 18900 2098 2949 3372 3767 4143 4504 18950 2101 2954 3377 3773 4150 4511 19000 2105 2959 3383 3778 4156 4518 19050 2108 2963 3388 3784 4163 4525 19100 2112 2968 3393 3790 4169 4532 19150 2115 2973 3398 3796 4175 4539 19200 2118 2977 3403 3802 4182 4546 19250 2122 2982 3409 3807 4188 4553 19300 2125 2987 3414 3813 4195 4560 19350 2128 2991 3419 3819 4201 4566 19400 2132 2996 3424 3825 4207 4573 19450 2135 3001 3429 3831 4214 4580 19500 2139 3005 3435 3837 4220 4587 19550 2142 3010 3440 3842 4227 4594 19600 2145 3015 3445 3848 4233 4601 19650 2149 3019 3450 3854 4239 4608 19700 2152 3024 3455 3860 4246 4615 19750 2156 3029 3461 3866 4252 4622 19800 2159 3033 3466 3871 4259 4629

REVIEW OF THE PENNSYLVANIA CHILD SUPPORT GUIDELINES: TECHNIAL FINDINGS
79
19850 2162 3038 3471 3877 4265 4636 19900 2166 3043 3476 3883 4271 4643 19950 2169 3047 3481 3889 4278 4650 20000 2172 3052 3487 3895 4284 4657 20050 2176 3056 3492 3900 4290 4664 20100 2179 3061 3497 3906 4297 4671 20150 2183 3066 3502 3912 4303 4678 20200 2186 3070 3507 3918 4310 4685 20250 2189 3075 3513 3924 4316 4692 20300 2193 3080 3518 3929 4322 4698 20350 2196 3084 3523 3935 4329 4705 20400 2200 3089 3528 3941 4335 4712 20450 2203 3094 3533 3947 4342 4719 20500 2206 3098 3539 3953 4348 4726 20550 2210 3103 3544 3959 4354 4733 20600 2213 3108 3549 3964 4361 4740 20650 2216 3112 3554 3970 4367 4747 20700 2220 3117 3559 3976 4374 4754 20750 2223 3122 3565 3982 4380 4761 20800 2227 3126 3570 3988 4386 4768 20850 2230 3131 3575 3993 4393 4775 20900 2233 3136 3580 3999 4399 4782 20950 2237 3140 3585 4005 4405 4789 21000 2240 3145 3591 4011 4412 4796 21050 2244 3150 3596 4017 4418 4803 21100 2247 3154 3601 4022 4425 4810 21150 2250 3159 3606 4028 4431 4817 21200 2254 3164 3611 4034 4437 4823 21250 2257 3168 3617 4040 4444 4830 21300 2261 3173 3622 4046 4450 4837 21350 2264 3177 3627 4051 4457 4844 21400 2267 3182 3632 4057 4463 4851 21450 2271 3187 3637 4063 4469 4858 21500 2274 3191 3643 4069 4476 4865 21550 2277 3196 3648 4075 4482 4872 21600 2281 3201 3653 4080 4489 4879 21650 2284 3205 3658 4086 4495 4886 21700 2288 3210 3663 4092 4501 4893 21750 2291 3215 3669 4098 4508 4900 21800 2294 3219 3674 4104 4514 4907 21850 2298 3224 3679 4110 4520 4914 21900 2301 3229 3684 4115 4527 4921 21950 2305 3233 3689 4121 4533 4928 22000 2308 3238 3695 4127 4540 4935 22050 2311 3243 3700 4133 4546 4942 22100 2315 3247 3705 4139 4552 4949 22150 2318 3252 3710 4144 4559 4955 22200 2321 3257 3715 4150 4565 4962

REVIEW OF THE PENNSYLVANIA CHILD SUPPORT GUIDELINES: TECHNIAL FINDINGS
80
22250 2325 3261 3721 4156 4572 4969 22300 2328 3266 3726 4162 4578 4976 22350 2332 3271 3731 4168 4584 4983 22400 2335 3275 3736 4173 4591 4990 22450 2338 3280 3741 4179 4597 4997 22500 2342 3285 3747 4185 4604 5004 22550 2345 3289 3752 4191 4610 5011 22600 2349 3294 3757 4197 4616 5018 22650 2352 3299 3762 4202 4623 5025 22700 2355 3303 3767 4208 4628 5031 22750 2359 3307 3771 4212 4633 5036 22800 2362 3311 3775 4216 4638 5041 22850 2365 3315 3779 4220 4642 5046 22900 2369 3319 3783 4224 4647 5051 22950 2372 3323 3787 4229 4652 5056 23000 2375 3328 3792 4233 4656 5061 23050 2378 3332 3796 4237 4661 5066 23100 2382 3336 3800 4241 4665 5071 23150 2385 3340 3804 4246 4670 5076 23200 2388 3344 3808 4250 4675 5081 23250 2392 3348 3812 4254 4679 5087 23300 2395 3352 3816 4258 4684 5092 23350 2398 3356 3820 4262 4689 5097 23400 2402 3360 3824 4267 4693 5102 23450 2405 3365 3828 4271 4698 5107 23500 2408 3369 3833 4275 4703 5112 23550 2412 3373 3837 4279 4707 5117 23600 2415 3377 3841 4284 4712 5122 23650 2418 3381 3845 4288 4717 5127 23700 2422 3385 3849 4292 4721 5132 23750 2425 3389 3853 4296 4726 5137 23800 2428 3393 3857 4300 4730 5142 23850 2432 3397 3861 4305 4735 5147 23900 2435 3401 3865 4309 4740 5152 23950 2438 3406 3869 4313 4744 5157 24000 2441 3410 3874 4317 4749 5162 24050 2445 3414 3878 4322 4754 5167 24100 2448 3418 3882 4326 4758 5172 24150 2451 3422 3886 4330 4763 5177 24200 2455 3426 3890 4334 4768 5182 24250 2458 3430 3894 4338 4772 5187 24300 2461 3434 3898 4343 4777 5192 24350 2465 3438 3902 4347 4782 5198 24400 2468 3442 3906 4351 4786 5203 24450 2471 3447 3910 4355 4791 5208 24500 2475 3451 3914 4359 4795 5213 24550 2478 3455 3919 4364 4800 5218 24600 2481 3459 3923 4368 4805 5223

REVIEW OF THE PENNSYLVANIA CHILD SUPPORT GUIDELINES: TECHNIAL FINDINGS
81
24650 2485 3463 3927 4372 4809 5228 24700 2488 3467 3931 4376 4814 5233 24750 2491 3471 3935 4381 4819 5238 24800 2495 3475 3939 4385 4823 5243 24850 2498 3479 3943 4389 4828 5248 24900 2501 3484 3947 4393 4833 5253 24950 2504 3488 3951 4397 4837 5258 25000 2508 3492 3955 4402 4842 5263 25050 2511 3496 3960 4406 4846 5268 25100 2514 3500 3964 4410 4851 5273 25150 2518 3504 3968 4414 4856 5278 25200 2521 3508 3972 4419 4860 5283 25250 2524 3512 3976 4423 4865 5288 25300 2528 3516 3980 4427 4870 5293 25350 2531 3520 3984 4431 4874 5298 25400 2534 3525 3988 4435 4879 5303 25450 2538 3529 3992 4440 4884 5308 25500 2541 3533 3996 4444 4888 5314 25550 2544 3537 4000 4448 4893 5319 25600 2548 3541 4005 4452 4898 5324 25650 2551 3545 4009 4457 4902 5329 25700 2554 3549 4013 4461 4907 5334 25750 2558 3553 4017 4465 4911 5339 25800 2561 3557 4021 4469 4916 5344 25850 2564 3562 4025 4473 4921 5349 25900 2567 3566 4029 4478 4925 5354 25950 2571 3570 4033 4482 4930 5359 26000 2574 3574 4037 4486 4935 5364 26050 2577 3578 4041 4490 4939 5369 26100 2581 3582 4046 4494 4944 5374 26150 2584 3586 4050 4499 4949 5379 26200 2587 3590 4054 4503 4953 5384 26250 2591 3594 4058 4507 4958 5389 26300 2594 3598 4062 4511 4962 5394 26350 2597 3603 4066 4516 4967 5399 26400 2601 3607 4070 4520 4972 5404 26450 2604 3611 4074 4524 4976 5409 26500 2607 3615 4078 4528 4981 5414 26550 2611 3619 4082 4532 4986 5419 26600 2614 3623 4086 4537 4990 5424 26650 2617 3627 4091 4541 4995 5430 26700 2621 3631 4095 4545 5000 5435 26750 2624 3635 4099 4549 5004 5440 26800 2627 3640 4103 4554 5009 5445 26850 2630 3644 4107 4558 5014 5450 26900 2634 3648 4111 4562 5018 5455 26950 2637 3652 4115 4566 5023 5460 27000 2640 3656 4119 4570 5027 5465

REVIEW OF THE PENNSYLVANIA CHILD SUPPORT GUIDELINES: TECHNIAL FINDINGS
82
27050 2644 3660 4123 4575 5032 5470 27100 2647 3664 4127 4579 5037 5475 27150 2650 3668 4132 4583 5041 5480 27200 2654 3672 4136 4587 5046 5485 27250 2657 3676 4140 4592 5051 5490 27300 2660 3681 4144 4596 5055 5495 27350 2664 3685 4148 4600 5060 5500 27400 2667 3689 4152 4604 5065 5505 27450 2670 3693 4156 4608 5069 5510 27500 2674 3697 4160 4613 5074 5515 27550 2677 3701 4164 4617 5079 5520 27600 2680 3705 4168 4621 5083 5525 27650 2684 3709 4173 4625 5088 5530 27700 2687 3713 4177 4629 5092 5535 27750 2690 3718 4181 4634 5097 5541 27800 2693 3722 4185 4638 5102 5546 27850 2697 3726 4189 4642 5106 5551 27900 2700 3730 4193 4646 5111 5556 27950 2703 3734 4197 4651 5116 5561 28000 2707 3738 4201 4655 5120 5566 28050 2710 3742 4205 4659 5125 5571 28100 2713 3746 4209 4663 5130 5576 28150 2717 3750 4213 4667 5134 5581 28200 2720 3754 4218 4672 5139 5586 28250 2723 3759 4222 4676 5143 5591 28300 2727 3763 4226 4680 5148 5596 28350 2730 3767 4230 4684 5153 5601 28400 2733 3771 4234 4689 5157 5606 28450 2737 3775 4238 4693 5162 5611 28500 2740 3779 4242 4697 5167 5616 28550 2743 3783 4246 4701 5171 5621 28600 2747 3787 4250 4705 5176 5626 28650 2750 3791 4254 4710 5181 5631 28700 2753 3796 4259 4714 5185 5636 28750 2756 3800 4263 4718 5190 5641 28800 2760 3804 4267 4722 5195 5646 28850 2763 3808 4271 4727 5199 5651 28900 2766 3812 4275 4731 5204 5657 28950 2770 3816 4279 4735 5208 5662 29000 2773 3820 4283 4739 5213 5667 29050 2776 3824 4287 4743 5218 5672 29100 2780 3828 4291 4748 5222 5677 29150 2783 3832 4295 4752 5227 5682 29200 2786 3837 4299 4756 5232 5687 29250 2790 3841 4304 4760 5236 5692 29300 2793 3845 4308 4764 5241 5697 29350 2796 3849 4312 4769 5246 5702 29400 2800 3853 4316 4773 5250 5707

REVIEW OF THE PENNSYLVANIA CHILD SUPPORT GUIDELINES: TECHNIAL FINDINGS
83
29450 2803 3857 4320 4777 5255 5712 29500 2806 3861 4324 4781 5259 5717 29550 2810 3865 4328 4786 5264 5722 29600 2813 3869 4332 4790 5269 5727 29650 2816 3874 4336 4794 5273 5732 29700 2819 3878 4340 4798 5278 5737 29750 2823 3882 4345 4802 5283 5742 29800 2826 3886 4349 4807 5287 5747 29850 2829 3890 4353 4811 5292 5752 29900 2833 3894 4357 4815 5297 5757 29950 2836 3898 4361 4819 5301 5762 30000 2839 3902 4365 4824 5306 5768

REVIEW OF THE PENNSYLVANIA CHILD SUPPORT GUIDELINES: TECHNIAL FINDINGS
85

REVIEW OF THE PENNSYLVANIA CHILD SUPPORT GUIDELINES: TECHNIAL FINDINGS
86
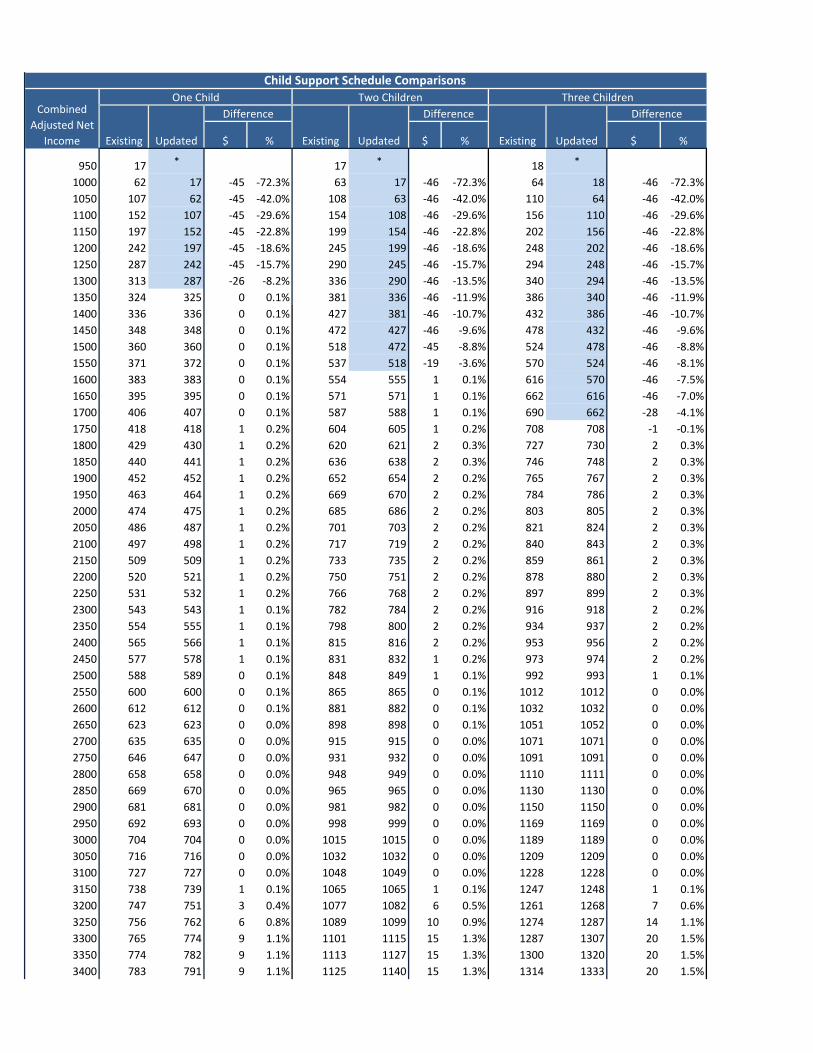
$ % $ % $ %
950 17 * 17 * 18 *
1000 62 17 ‐45 ‐72.3% 63 17 ‐46 ‐72.3% 64 18 ‐46 ‐72.3%
1050 107 62 ‐45 ‐42.0% 108 63 ‐46 ‐42.0% 110 64 ‐46 ‐42.0%
1100 152 107 ‐45 ‐29.6% 154 108 ‐46 ‐29.6% 156 110 ‐46 ‐29.6%
1150 197 152 ‐45 ‐22.8% 199 154 ‐46 ‐22.8% 202 156 ‐46 ‐22.8%
1200 242 197 ‐45 ‐18.6% 245 199 ‐46 ‐18.6% 248 202 ‐46 ‐18.6%
1250 287 242 ‐45 ‐15.7% 290 245 ‐46 ‐15.7% 294 248 ‐46 ‐15.7%
1300 313 287 ‐26 ‐8.2% 336 290 ‐46 ‐13.5% 340 294 ‐46 ‐13.5%
1350 324 325 0 0.1% 381 336 ‐46 ‐11.9% 386 340 ‐46 ‐11.9%
1400 336 336 0 0.1% 427 381 ‐46 ‐10.7% 432 386 ‐46 ‐10.7%
1450 348 348 0 0.1% 472 427 ‐46 ‐9.6% 478 432 ‐46 ‐9.6%
1500 360 360 0 0.1% 518 472 ‐45 ‐8.8% 524 478 ‐46 ‐8.8%
1550 371 372 0 0.1% 537 518 ‐19 ‐3.6% 570 524 ‐46 ‐8.1%
1600 383 383 0 0.1% 554 555 1 0.1% 616 570 ‐46 ‐7.5%
1650 395 395 0 0.1% 571 571 1 0.1% 662 616 ‐46 ‐7.0%
1700 406 407 0 0.1% 587 588 1 0.1% 690 662 ‐28 ‐4.1%
1750 418 418 1 0.2% 604 605 1 0.2% 708 708 ‐1 ‐0.1%
1800 429 430 1 0.2% 620 621 2 0.3% 727 730 2 0.3%
1850 440 441 1 0.2% 636 638 2 0.3% 746 748 2 0.3%
1900 452 452 1 0.2% 652 654 2 0.2% 765 767 2 0.3%
1950 463 464 1 0.2% 669 670 2 0.2% 784 786 2 0.3%
2000 474 475 1 0.2% 685 686 2 0.2% 803 805 2 0.3%
2050 486 487 1 0.2% 701 703 2 0.2% 821 824 2 0.3%
2100 497 498 1 0.2% 717 719 2 0.2% 840 843 2 0.3%
2150 509 509 1 0.2% 733 735 2 0.2% 859 861 2 0.3%
2200 520 521 1 0.2% 750 751 2 0.2% 878 880 2 0.3%
2250 531 532 1 0.2% 766 768 2 0.2% 897 899 2 0.3%
2300 543 543 1 0.1% 782 784 2 0.2% 916 918 2 0.2%
2350 554 555 1 0.1% 798 800 2 0.2% 934 937 2 0.2%
2400 565 566 1 0.1% 815 816 2 0.2% 953 956 2 0.2%
2450 577 578 1 0.1% 831 832 1 0.2% 973 974 2 0.2%
2500 588 589 0 0.1% 848 849 1 0.1% 992 993 1 0.1%
2550 600 600 0 0.1% 865 865 0 0.1% 1012 1012 0 0.0%
2600 612 612 0 0.1% 881 882 0 0.1% 1032 1032 0 0.0%
2650 623 623 0 0.0% 898 898 0 0.1% 1051 1052 0 0.0%
2700 635 635 0 0.0% 915 915 0 0.0% 1071 1071 0 0.0%
2750 646 647 0 0.0% 931 932 0 0.0% 1091 1091 0 0.0%
2800 658 658 0 0.0% 948 949 0 0.0% 1110 1111 0 0.0%
2850 669 670 0 0.0% 965 965 0 0.0% 1130 1130 0 0.0%
2900 681 681 0 0.0% 981 982 0 0.0% 1150 1150 0 0.0%
2950 692 693 0 0.0% 998 999 0 0.0% 1169 1169 0 0.0%
3000 704 704 0 0.0% 1015 1015 0 0.0% 1189 1189 0 0.0%
3050 716 716 0 0.0% 1032 1032 0 0.0% 1209 1209 0 0.0%
3100 727 727 0 0.0% 1048 1049 0 0.0% 1228 1228 0 0.0%
3150 738 739 1 0.1% 1065 1065 1 0.1% 1247 1248 1 0.1%
3200 747 751 3 0.4% 1077 1082 6 0.5% 1261 1268 7 0.6%
3250 756 762 6 0.8% 1089 1099 10 0.9% 1274 1287 14 1.1%
3300 765 774 9 1.1% 1101 1115 15 1.3% 1287 1307 20 1.5%
3350 774 782 9 1.1% 1113 1127 15 1.3% 1300 1320 20 1.5%
3400 783 791 9 1.1% 1125 1140 15 1.3% 1314 1333 20 1.5%
Three Children
Existing Updated
Difference
Two Children
Existing Updated
Difference
One ChildCombined
Adjusted Net
Income Existing Updated
Difference
Child Support Schedule Comparisons

$ % $ % $ %
Three Children
Existing Updated
Difference
Two Children
Existing Updated
Difference
One ChildCombined
Adjusted Net
Income Existing Updated
Difference
Child Support Schedule Comparisons
3450 792 800 9 1.1% 1137 1152 15 1.3% 1327 1347 20 1.5%
3500 801 809 9 1.1% 1149 1164 15 1.3% 1340 1360 20 1.5%
3550 809 818 9 1.1% 1161 1176 15 1.3% 1354 1373 20 1.5%
3600 818 827 8 1.0% 1173 1188 15 1.2% 1367 1387 20 1.4%
3650 826 836 10 1.2% 1184 1200 16 1.4% 1379 1400 21 1.5%
3700 831 845 13 1.6% 1192 1212 20 1.7% 1388 1413 25 1.8%
3750 836 853 17 2.0% 1200 1224 25 2.0% 1398 1427 29 2.1%
3800 842 862 20 2.4% 1208 1236 29 2.4% 1408 1440 32 2.3%
3850 847 868 21 2.5% 1216 1245 29 2.4% 1417 1450 33 2.3%
3900 853 873 21 2.4% 1224 1253 29 2.4% 1427 1460 33 2.3%
3950 858 879 21 2.4% 1232 1261 29 2.4% 1436 1469 33 2.3%
4000 863 884 21 2.4% 1240 1269 29 2.3% 1446 1479 33 2.3%
4050 869 890 21 2.4% 1248 1277 29 2.3% 1456 1488 33 2.3%
4100 874 895 21 2.4% 1256 1285 29 2.3% 1465 1498 33 2.2%
4150 880 900 20 2.3% 1264 1293 29 2.3% 1474 1508 33 2.3%
4200 886 906 20 2.3% 1272 1301 29 2.3% 1483 1517 34 2.3%
4250 892 911 19 2.2% 1280 1309 29 2.3% 1492 1527 34 2.3%
4300 898 917 19 2.1% 1288 1317 29 2.2% 1502 1536 35 2.3%
4350 903 922 19 2.1% 1296 1325 29 2.2% 1511 1545 35 2.3%
4400 909 928 19 2.1% 1304 1333 29 2.2% 1520 1555 35 2.3%
4450 915 934 19 2.1% 1312 1341 29 2.2% 1529 1564 35 2.3%
4500 921 940 19 2.0% 1320 1349 29 2.2% 1538 1573 35 2.3%
4550 927 946 19 2.0% 1328 1357 29 2.2% 1547 1582 35 2.3%
4600 933 952 19 2.0% 1336 1365 29 2.2% 1555 1591 35 2.3%
4650 936 957 22 2.3% 1340 1373 33 2.5% 1559 1600 41 2.6%
4700 939 963 24 2.6% 1344 1381 37 2.7% 1563 1609 46 2.9%
4750 943 969 26 2.8% 1348 1389 41 3.0% 1567 1618 51 3.3%
4800 946 975 29 3.1% 1352 1397 45 3.3% 1571 1627 56 3.6%
4850 949 979 30 3.2% 1356 1403 47 3.4% 1575 1633 58 3.7%
4900 953 983 30 3.1% 1360 1407 47 3.4% 1578 1637 58 3.7%
4950 956 986 30 3.1% 1364 1411 47 3.4% 1582 1641 58 3.7%
5000 960 990 30 3.1% 1369 1415 47 3.4% 1586 1644 58 3.7%
5050 963 993 30 3.1% 1373 1419 47 3.4% 1590 1648 58 3.7%
5100 967 996 30 3.1% 1378 1423 46 3.3% 1595 1652 57 3.6%
5150 971 1000 29 2.9% 1384 1427 44 3.2% 1602 1656 54 3.4%
5200 976 1003 28 2.8% 1390 1431 42 3.0% 1608 1660 51 3.2%
5250 980 1007 27 2.7% 1396 1436 40 2.9% 1615 1663 48 3.0%
5300 984 1010 26 2.6% 1402 1440 38 2.7% 1622 1667 45 2.8%
5350 989 1014 25 2.5% 1408 1445 37 2.6% 1629 1672 43 2.7%
5400 993 1018 25 2.5% 1414 1451 37 2.6% 1636 1679 43 2.6%
5450 997 1022 25 2.5% 1420 1457 37 2.6% 1643 1686 43 2.6%
5500 1002 1027 25 2.5% 1426 1463 37 2.6% 1650 1693 43 2.6%
5550 1006 1031 25 2.5% 1432 1469 37 2.6% 1656 1700 43 2.6%
5600 1011 1036 25 2.5% 1438 1475 37 2.6% 1663 1707 43 2.6%
5650 1015 1040 25 2.5% 1444 1481 37 2.5% 1670 1714 43 2.6%
5700 1019 1044 25 2.5% 1450 1487 37 2.5% 1677 1720 43 2.6%
5750 1024 1049 25 2.4% 1456 1493 37 2.5% 1684 1727 43 2.6%
5800 1028 1053 25 2.4% 1462 1499 37 2.5% 1691 1734 43 2.6%
5850 1033 1057 24 2.4% 1469 1505 36 2.5% 1698 1741 43 2.5%
5900 1038 1062 24 2.3% 1476 1511 35 2.4% 1706 1748 42 2.5%
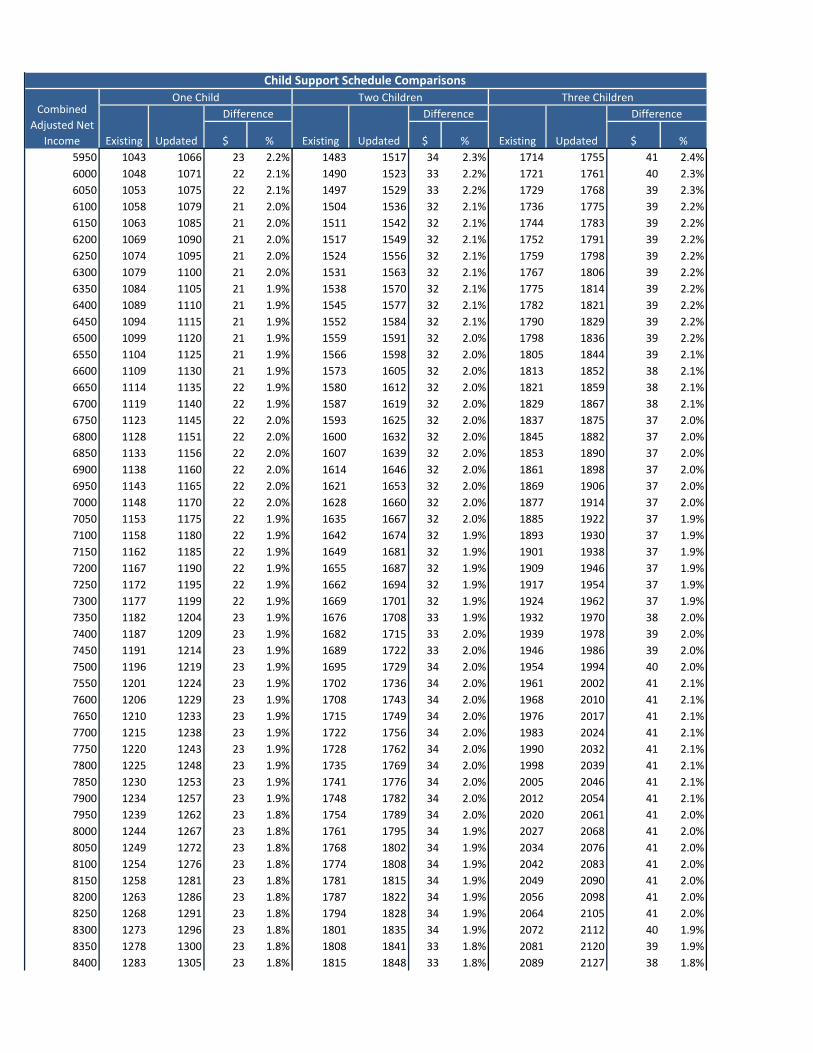
$ % $ % $ %
Three Children
Existing Updated
Difference
Two Children
Existing Updated
Difference
One ChildCombined
Adjusted Net
Income Existing Updated
Difference
Child Support Schedule Comparisons
5950 1043 1066 23 2.2% 1483 1517 34 2.3% 1714 1755 41 2.4%
6000 1048 1071 22 2.1% 1490 1523 33 2.2% 1721 1761 40 2.3%
6050 1053 1075 22 2.1% 1497 1529 33 2.2% 1729 1768 39 2.3%
6100 1058 1079 21 2.0% 1504 1536 32 2.1% 1736 1775 39 2.2%
6150 1063 1085 21 2.0% 1511 1542 32 2.1% 1744 1783 39 2.2%
6200 1069 1090 21 2.0% 1517 1549 32 2.1% 1752 1791 39 2.2%
6250 1074 1095 21 2.0% 1524 1556 32 2.1% 1759 1798 39 2.2%
6300 1079 1100 21 2.0% 1531 1563 32 2.1% 1767 1806 39 2.2%
6350 1084 1105 21 1.9% 1538 1570 32 2.1% 1775 1814 39 2.2%
6400 1089 1110 21 1.9% 1545 1577 32 2.1% 1782 1821 39 2.2%
6450 1094 1115 21 1.9% 1552 1584 32 2.1% 1790 1829 39 2.2%
6500 1099 1120 21 1.9% 1559 1591 32 2.0% 1798 1836 39 2.2%
6550 1104 1125 21 1.9% 1566 1598 32 2.0% 1805 1844 39 2.1%
6600 1109 1130 21 1.9% 1573 1605 32 2.0% 1813 1852 38 2.1%
6650 1114 1135 22 1.9% 1580 1612 32 2.0% 1821 1859 38 2.1%
6700 1119 1140 22 1.9% 1587 1619 32 2.0% 1829 1867 38 2.1%
6750 1123 1145 22 2.0% 1593 1625 32 2.0% 1837 1875 37 2.0%
6800 1128 1151 22 2.0% 1600 1632 32 2.0% 1845 1882 37 2.0%
6850 1133 1156 22 2.0% 1607 1639 32 2.0% 1853 1890 37 2.0%
6900 1138 1160 22 2.0% 1614 1646 32 2.0% 1861 1898 37 2.0%
6950 1143 1165 22 2.0% 1621 1653 32 2.0% 1869 1906 37 2.0%
7000 1148 1170 22 2.0% 1628 1660 32 2.0% 1877 1914 37 2.0%
7050 1153 1175 22 1.9% 1635 1667 32 2.0% 1885 1922 37 1.9%
7100 1158 1180 22 1.9% 1642 1674 32 1.9% 1893 1930 37 1.9%
7150 1162 1185 22 1.9% 1649 1681 32 1.9% 1901 1938 37 1.9%
7200 1167 1190 22 1.9% 1655 1687 32 1.9% 1909 1946 37 1.9%
7250 1172 1195 22 1.9% 1662 1694 32 1.9% 1917 1954 37 1.9%
7300 1177 1199 22 1.9% 1669 1701 32 1.9% 1924 1962 37 1.9%
7350 1182 1204 23 1.9% 1676 1708 33 1.9% 1932 1970 38 2.0%
7400 1187 1209 23 1.9% 1682 1715 33 2.0% 1939 1978 39 2.0%
7450 1191 1214 23 1.9% 1689 1722 33 2.0% 1946 1986 39 2.0%
7500 1196 1219 23 1.9% 1695 1729 34 2.0% 1954 1994 40 2.0%
7550 1201 1224 23 1.9% 1702 1736 34 2.0% 1961 2002 41 2.1%
7600 1206 1229 23 1.9% 1708 1743 34 2.0% 1968 2010 41 2.1%
7650 1210 1233 23 1.9% 1715 1749 34 2.0% 1976 2017 41 2.1%
7700 1215 1238 23 1.9% 1722 1756 34 2.0% 1983 2024 41 2.1%
7750 1220 1243 23 1.9% 1728 1762 34 2.0% 1990 2032 41 2.1%
7800 1225 1248 23 1.9% 1735 1769 34 2.0% 1998 2039 41 2.1%
7850 1230 1253 23 1.9% 1741 1776 34 2.0% 2005 2046 41 2.1%
7900 1234 1257 23 1.9% 1748 1782 34 2.0% 2012 2054 41 2.1%
7950 1239 1262 23 1.8% 1754 1789 34 2.0% 2020 2061 41 2.0%
8000 1244 1267 23 1.8% 1761 1795 34 1.9% 2027 2068 41 2.0%
8050 1249 1272 23 1.8% 1768 1802 34 1.9% 2034 2076 41 2.0%
8100 1254 1276 23 1.8% 1774 1808 34 1.9% 2042 2083 41 2.0%
8150 1258 1281 23 1.8% 1781 1815 34 1.9% 2049 2090 41 2.0%
8200 1263 1286 23 1.8% 1787 1822 34 1.9% 2056 2098 41 2.0%
8250 1268 1291 23 1.8% 1794 1828 34 1.9% 2064 2105 41 2.0%
8300 1273 1296 23 1.8% 1801 1835 34 1.9% 2072 2112 40 1.9%
8350 1278 1300 23 1.8% 1808 1841 33 1.8% 2081 2120 39 1.9%
8400 1283 1305 23 1.8% 1815 1848 33 1.8% 2089 2127 38 1.8%

$ % $ % $ %
Three Children
Existing Updated
Difference
Two Children
Existing Updated
Difference
One ChildCombined
Adjusted Net
Income Existing Updated
Difference
Child Support Schedule Comparisons
8450 1287 1310 23 1.8% 1822 1854 32 1.8% 2097 2134 37 1.8%
8500 1292 1315 23 1.7% 1829 1861 32 1.7% 2105 2142 36 1.7%
8550 1297 1320 22 1.7% 1836 1868 31 1.7% 2114 2149 35 1.7%
8600 1302 1324 22 1.7% 1843 1874 31 1.7% 2122 2156 34 1.6%
8650 1307 1329 22 1.7% 1850 1881 31 1.7% 2130 2164 34 1.6%
8700 1312 1334 22 1.7% 1857 1888 31 1.7% 2138 2172 34 1.6%
8750 1317 1339 22 1.7% 1864 1895 31 1.6% 2147 2181 34 1.6%
8800 1321 1344 22 1.7% 1871 1902 31 1.6% 2155 2189 34 1.6%
8850 1326 1349 22 1.7% 1878 1909 31 1.6% 2163 2197 34 1.6%
8900 1331 1353 22 1.7% 1885 1916 31 1.6% 2172 2205 34 1.6%
8950 1336 1358 22 1.7% 1892 1923 31 1.6% 2180 2214 34 1.5%
9000 1341 1363 22 1.7% 1899 1930 31 1.6% 2188 2222 34 1.5%
9050 1346 1368 22 1.7% 1906 1937 31 1.6% 2196 2230 34 1.5%
9100 1350 1373 22 1.7% 1913 1944 31 1.6% 2205 2238 34 1.5%
9150 1355 1378 22 1.7% 1920 1951 31 1.6% 2213 2247 34 1.5%
9200 1360 1383 23 1.7% 1927 1958 31 1.6% 2220 2255 34 1.5%
9250 1362 1387 25 1.8% 1930 1965 35 1.8% 2224 2263 39 1.7%
9300 1365 1392 28 2.0% 1934 1972 38 2.0% 2228 2271 43 1.9%
9350 1367 1397 30 2.2% 1937 1979 42 2.2% 2232 2280 48 2.1%
9400 1370 1402 32 2.4% 1940 1986 46 2.4% 2236 2288 52 2.3%
9450 1372 1407 35 2.5% 1944 1993 49 2.5% 2239 2296 57 2.5%
9500 1375 1412 37 2.7% 1947 2000 53 2.7% 2243 2304 61 2.7%
9550 1377 1417 39 2.9% 1951 2007 56 2.9% 2247 2313 66 2.9%
9600 1380 1421 42 3.0% 1954 2014 60 3.1% 2251 2321 70 3.1%
9650 1382 1426 44 3.2% 1958 2020 63 3.2% 2255 2328 74 3.3%
9700 1385 1428 44 3.2% 1961 2024 63 3.2% 2258 2332 74 3.3%
9750 1387 1431 44 3.2% 1964 2027 63 3.2% 2262 2336 74 3.3%
9800 1389 1433 44 3.1% 1968 2031 63 3.2% 2266 2340 74 3.3%
9850 1392 1436 44 3.1% 1971 2034 63 3.2% 2270 2344 74 3.2%
9900 1394 1438 44 3.1% 1975 2038 63 3.2% 2274 2347 74 3.2%
9950 1397 1441 44 3.1% 1978 2041 63 3.2% 2277 2351 74 3.2%
10000 1399 1443 44 3.1% 1981 2044 63 3.2% 2281 2355 74 3.2%
10050 1402 1445 44 3.1% 1985 2048 63 3.2% 2285 2359 74 3.2%
10100 1404 1448 44 3.1% 1988 2051 63 3.2% 2289 2363 74 3.2%
10150 1407 1450 44 3.1% 1992 2055 63 3.2% 2293 2366 74 3.2%
10200 1410 1453 42 3.0% 1997 2058 61 3.1% 2298 2370 72 3.1%
10250 1415 1455 41 2.9% 2002 2061 59 3.0% 2304 2374 70 3.0%
10300 1419 1458 39 2.8% 2008 2065 57 2.8% 2310 2378 67 2.9%
10350 1423 1460 38 2.6% 2013 2068 55 2.7% 2316 2382 65 2.8%
10400 1427 1463 36 2.5% 2019 2072 53 2.6% 2323 2385 63 2.7%
10450 1431 1465 34 2.4% 2024 2075 51 2.5% 2329 2389 61 2.6%
10500 1435 1468 33 2.3% 2030 2079 49 2.4% 2335 2393 58 2.5%
10550 1439 1470 31 2.2% 2035 2082 47 2.3% 2341 2397 56 2.4%
10600 1443 1473 29 2.0% 2041 2085 44 2.2% 2347 2401 54 2.3%
10650 1447 1475 28 1.9% 2046 2089 42 2.1% 2353 2404 51 2.2%
10700 1451 1479 28 1.9% 2052 2094 42 2.1% 2359 2410 51 2.2%
10750 1456 1483 28 1.9% 2057 2100 42 2.1% 2365 2416 51 2.2%
10800 1460 1487 28 1.9% 2063 2105 42 2.0% 2371 2422 51 2.2%
10850 1464 1491 28 1.9% 2068 2111 42 2.0% 2377 2428 51 2.2%
10900 1468 1495 28 1.9% 2074 2116 42 2.0% 2383 2434 51 2.1%

$ % $ % $ %
Three Children
Existing Updated
Difference
Two Children
Existing Updated
Difference
One ChildCombined
Adjusted Net
Income Existing Updated
Difference
Child Support Schedule Comparisons
10950 1472 1499 28 1.9% 2079 2122 42 2.0% 2389 2441 51 2.1%
11000 1476 1504 28 1.9% 2085 2127 42 2.0% 2395 2447 51 2.1%
11050 1480 1508 28 1.9% 2090 2133 42 2.0% 2402 2453 51 2.1%
11100 1484 1512 28 1.9% 2096 2138 42 2.0% 2408 2459 51 2.1%
11150 1488 1516 28 1.9% 2101 2144 42 2.0% 2414 2465 51 2.1%
11200 1492 1520 28 1.8% 2107 2149 42 2.0% 2420 2471 51 2.1%
11250 1496 1524 28 1.8% 2112 2155 42 2.0% 2426 2477 51 2.1%
11300 1501 1528 28 1.8% 2118 2160 42 2.0% 2432 2483 51 2.1%
11350 1505 1532 28 1.8% 2123 2166 42 2.0% 2438 2489 51 2.1%
11400 1509 1536 27 1.8% 2130 2171 42 2.0% 2445 2495 50 2.1%
11450 1514 1540 27 1.8% 2136 2177 41 1.9% 2452 2501 49 2.0%
11500 1518 1545 26 1.7% 2142 2182 40 1.9% 2460 2507 48 1.9%
11550 1523 1549 26 1.7% 2149 2188 39 1.8% 2467 2513 46 1.9%
11600 1527 1553 26 1.7% 2155 2193 38 1.8% 2474 2520 45 1.8%
11650 1532 1557 25 1.6% 2162 2199 37 1.7% 2482 2526 44 1.8%
11700 1536 1561 25 1.6% 2168 2204 36 1.7% 2489 2532 43 1.7%
11750 1541 1565 24 1.6% 2174 2210 35 1.6% 2496 2538 41 1.7%
11800 1545 1569 24 1.5% 2181 2215 34 1.6% 2504 2544 40 1.6%
11850 1550 1573 23 1.5% 2187 2221 33 1.5% 2511 2550 39 1.5%
11900 1554 1577 23 1.5% 2194 2226 33 1.5% 2519 2556 37 1.5%
11950 1559 1582 23 1.5% 2200 2232 32 1.5% 2526 2563 37 1.5%
12000 1563 1586 23 1.5% 2206 2239 32 1.5% 2533 2570 37 1.5%
12050 1568 1591 23 1.5% 2213 2245 32 1.5% 2541 2577 37 1.5%
12100 1572 1595 23 1.4% 2219 2251 32 1.4% 2548 2585 37 1.4%
12150 1577 1600 23 1.4% 2226 2258 32 1.4% 2555 2592 37 1.4%
12200 1581 1604 23 1.4% 2232 2264 32 1.4% 2563 2600 37 1.4%
12250 1586 1609 23 1.4% 2238 2271 32 1.4% 2570 2607 37 1.4%
12300 1591 1613 23 1.4% 2245 2277 32 1.4% 2577 2614 37 1.4%
12350 1595 1618 23 1.4% 2251 2283 32 1.4% 2585 2622 37 1.4%
12400 1600 1622 23 1.4% 2258 2290 32 1.4% 2592 2629 37 1.4%
12450 1604 1627 23 1.4% 2264 2296 32 1.4% 2600 2636 37 1.4%
12500 1609 1631 23 1.4% 2271 2303 32 1.4% 2607 2644 37 1.4%
12550 1613 1636 23 1.4% 2277 2309 32 1.4% 2614 2651 37 1.4%
12600 1618 1640 23 1.4% 2283 2316 32 1.4% 2622 2658 37 1.4%
12650 1622 1645 23 1.4% 2290 2322 32 1.4% 2629 2666 37 1.4%
12700 1627 1649 23 1.4% 2296 2328 32 1.4% 2636 2673 37 1.4%
12750 1631 1654 23 1.4% 2303 2335 32 1.4% 2644 2681 37 1.4%
12800 1636 1659 23 1.4% 2309 2341 32 1.4% 2651 2688 37 1.4%
12850 1640 1663 23 1.4% 2315 2348 32 1.4% 2658 2695 37 1.4%
12900 1645 1668 23 1.4% 2322 2354 32 1.4% 2666 2703 37 1.4%
12950 1649 1672 23 1.4% 2328 2360 32 1.4% 2673 2710 37 1.4%
13000 1654 1677 23 1.4% 2335 2367 32 1.4% 2681 2717 37 1.4%
13050 1658 1681 23 1.4% 2341 2373 32 1.4% 2688 2725 37 1.4%
13100 1663 1686 23 1.4% 2347 2380 32 1.4% 2695 2732 37 1.4%
13150 1668 1690 23 1.4% 2354 2386 32 1.4% 2703 2739 37 1.4%
13200 1672 1695 23 1.4% 2360 2392 32 1.4% 2710 2747 37 1.4%
13250 1677 1699 23 1.4% 2367 2399 32 1.4% 2717 2754 37 1.4%
13300 1681 1704 23 1.4% 2373 2405 32 1.4% 2725 2762 37 1.4%
13350 1685 1708 24 1.4% 2378 2412 34 1.4% 2730 2769 39 1.4%
13400 1688 1713 25 1.5% 2383 2418 35 1.5% 2735 2776 41 1.5%

$ % $ % $ %
Three Children
Existing Updated
Difference
Two Children
Existing Updated
Difference
One ChildCombined
Adjusted Net
Income Existing Updated
Difference
Child Support Schedule Comparisons
13450 1691 1717 26 1.5% 2387 2424 37 1.6% 2741 2784 43 1.6%
13500 1695 1722 27 1.6% 2392 2431 39 1.6% 2746 2791 45 1.6%
13550 1698 1726 28 1.7% 2397 2437 41 1.7% 2751 2798 47 1.7%
13600 1702 1731 29 1.7% 2401 2444 42 1.8% 2756 2806 50 1.8%
13650 1705 1735 31 1.8% 2406 2450 44 1.8% 2761 2813 52 1.9%
13700 1708 1740 32 1.9% 2411 2457 46 1.9% 2767 2820 54 1.9%
13750 1712 1745 33 1.9% 2415 2463 48 2.0% 2772 2828 56 2.0%
13800 1715 1749 34 2.0% 2420 2469 49 2.0% 2777 2835 58 2.1%
13850 1718 1754 35 2.0% 2424 2476 51 2.1% 2782 2843 60 2.2%
13900 1722 1758 36 2.1% 2429 2482 53 2.2% 2787 2850 63 2.2%
13950 1725 1763 37 2.2% 2434 2489 55 2.2% 2793 2857 65 2.3%
14000 1729 1766 37 2.2% 2438 2493 55 2.3% 2798 2863 65 2.3%
14050 1732 1770 37 2.2% 2443 2498 55 2.2% 2803 2868 65 2.3%
14100 1735 1773 37 2.2% 2448 2503 55 2.2% 2808 2873 65 2.3%
14150 1739 1776 37 2.2% 2452 2507 55 2.2% 2813 2878 65 2.3%
14200 1742 1780 37 2.2% 2457 2512 55 2.2% 2819 2883 65 2.3%
14250 1746 1783 37 2.1% 2462 2517 55 2.2% 2824 2889 65 2.3%
14300 1749 1786 37 2.1% 2466 2521 55 2.2% 2829 2894 65 2.3%
14350 1752 1790 37 2.1% 2471 2526 55 2.2% 2834 2899 65 2.3%
14400 1756 1793 37 2.1% 2476 2531 55 2.2% 2839 2904 65 2.3%
14450 1759 1797 37 2.1% 2480 2535 55 2.2% 2845 2909 65 2.3%
14500 1763 1800 37 2.1% 2485 2540 55 2.2% 2850 2915 65 2.3%
14550 1766 1803 37 2.1% 2490 2545 55 2.2% 2855 2920 65 2.3%
14600 1769 1807 37 2.1% 2494 2549 55 2.2% 2860 2925 65 2.3%
14650 1773 1810 37 2.1% 2499 2554 55 2.2% 2865 2930 65 2.3%
14700 1776 1814 37 2.1% 2504 2558 55 2.2% 2871 2935 65 2.3%
14750 1779 1817 37 2.1% 2508 2563 55 2.2% 2876 2941 65 2.3%
14800 1783 1820 37 2.1% 2513 2568 55 2.2% 2881 2946 65 2.3%
14850 1786 1824 37 2.1% 2518 2572 55 2.2% 2886 2951 65 2.2%
14900 1790 1827 37 2.1% 2522 2577 55 2.2% 2891 2956 65 2.2%
14950 1793 1830 37 2.1% 2527 2582 55 2.2% 2897 2961 65 2.2%
15000 1796 1834 37 2.1% 2532 2586 55 2.2% 2902 2967 65 2.2%
15050 1800 1837 37 2.1% 2536 2591 55 2.2% 2907 2972 65 2.2%
15100 1803 1841 37 2.1% 2541 2596 55 2.2% 2912 2977 65 2.2%
15150 1807 1844 37 2.1% 2546 2600 55 2.2% 2917 2982 65 2.2%
15200 1810 1847 37 2.1% 2550 2605 55 2.2% 2923 2987 65 2.2%
15250 1813 1851 37 2.1% 2555 2610 55 2.1% 2928 2993 65 2.2%
15300 1817 1854 37 2.1% 2559 2614 55 2.1% 2933 2998 65 2.2%
15350 1820 1858 37 2.1% 2564 2619 55 2.1% 2938 3003 65 2.2%
15400 1823 1861 37 2.1% 2569 2624 55 2.1% 2943 3008 65 2.2%
15450 1827 1864 37 2.1% 2573 2628 55 2.1% 2949 3013 65 2.2%
15500 1830 1868 37 2.0% 2578 2633 55 2.1% 2954 3019 65 2.2%
15550 1834 1871 37 2.0% 2583 2638 55 2.1% 2959 3024 65 2.2%
15600 1837 1874 37 2.0% 2587 2642 55 2.1% 2964 3029 65 2.2%
15650 1840 1878 37 2.0% 2592 2647 55 2.1% 2969 3034 65 2.2%
15700 1844 1881 37 2.0% 2597 2652 55 2.1% 2975 3039 65 2.2%
15750 1847 1885 37 2.0% 2601 2656 55 2.1% 2980 3045 65 2.2%
15800 1851 1888 37 2.0% 2606 2661 55 2.1% 2985 3050 65 2.2%
15850 1854 1891 37 2.0% 2611 2666 55 2.1% 2990 3055 65 2.2%
15900 1857 1895 37 2.0% 2615 2670 55 2.1% 2995 3060 65 2.2%

$ % $ % $ %
Three Children
Existing Updated
Difference
Two Children
Existing Updated
Difference
One ChildCombined
Adjusted Net
Income Existing Updated
Difference
Child Support Schedule Comparisons
15950 1861 1898 37 2.0% 2620 2675 55 2.1% 3001 3065 65 2.2%
16000 1864 1902 37 2.0% 2625 2679 55 2.1% 3006 3071 65 2.2%
16050 1868 1905 37 2.0% 2629 2684 55 2.1% 3011 3076 65 2.2%
16100 1871 1908 37 2.0% 2634 2689 55 2.1% 3016 3081 65 2.1%
16150 1874 1912 37 2.0% 2639 2693 55 2.1% 3021 3086 65 2.1%
16200 1878 1915 37 2.0% 2643 2698 55 2.1% 3027 3091 65 2.1%
16250 1881 1918 37 2.0% 2648 2703 55 2.1% 3032 3097 65 2.1%
16300 1884 1922 37 2.0% 2653 2707 55 2.1% 3037 3102 65 2.1%
16350 1888 1925 37 2.0% 2657 2712 55 2.1% 3042 3107 65 2.1%
16400 1891 1929 37 2.0% 2662 2717 55 2.1% 3047 3112 65 2.1%
16450 1895 1932 37 2.0% 2667 2721 55 2.1% 3053 3117 65 2.1%
16500 1898 1935 37 2.0% 2671 2726 55 2.1% 3058 3123 65 2.1%
16550 1901 1939 37 2.0% 2676 2731 55 2.0% 3063 3128 65 2.1%
16600 1905 1942 37 2.0% 2681 2735 55 2.0% 3068 3133 65 2.1%
16650 1908 1946 37 2.0% 2685 2740 55 2.0% 3073 3138 65 2.1%
16700 1912 1949 37 2.0% 2690 2745 55 2.0% 3079 3143 65 2.1%
16750 1915 1952 37 2.0% 2694 2749 55 2.0% 3084 3149 65 2.1%
16800 1918 1956 37 2.0% 2699 2754 55 2.0% 3089 3154 65 2.1%
16850 1922 1959 37 1.9% 2704 2759 55 2.0% 3094 3159 65 2.1%
16900 1925 1963 37 1.9% 2708 2763 55 2.0% 3099 3164 65 2.1%
16950 1928 1966 37 1.9% 2713 2768 55 2.0% 3105 3169 65 2.1%
17000 1932 1969 37 1.9% 2718 2773 55 2.0% 3110 3175 65 2.1%
17050 1935 1973 37 1.9% 2722 2777 55 2.0% 3115 3180 65 2.1%
17100 1939 1976 37 1.9% 2727 2782 55 2.0% 3120 3185 65 2.1%
17150 1942 1979 37 1.9% 2732 2787 55 2.0% 3125 3190 65 2.1%
17200 1945 1983 37 1.9% 2736 2791 55 2.0% 3131 3195 65 2.1%
17250 1949 1986 37 1.9% 2741 2796 55 2.0% 3136 3201 65 2.1%
17300 1952 1990 37 1.9% 2746 2801 55 2.0% 3141 3206 65 2.1%
17350 1956 1993 37 1.9% 2750 2805 55 2.0% 3146 3211 65 2.1%
17400 1959 1996 37 1.9% 2755 2810 55 2.0% 3151 3216 65 2.1%
17450 1962 2000 37 1.9% 2760 2814 55 2.0% 3157 3221 65 2.1%
17500 1966 2003 37 1.9% 2764 2819 55 2.0% 3162 3227 65 2.0%
17550 1969 2007 37 1.9% 2769 2824 55 2.0% 3167 3232 65 2.0%
17600 1973 2010 37 1.9% 2774 2828 55 2.0% 3172 3237 65 2.0%
17650 1976 2013 37 1.9% 2778 2833 55 2.0% 3177 3242 65 2.0%
17700 1979 2017 37 1.9% 2783 2838 55 2.0% 3183 3247 65 2.0%
17750 1983 2020 37 1.9% 2788 2842 55 2.0% 3188 3253 65 2.0%
17800 1986 2023 37 1.9% 2792 2847 55 2.0% 3193 3258 65 2.0%
17850 1989 2027 37 1.9% 2797 2852 55 2.0% 3198 3263 65 2.0%
17900 1993 2030 37 1.9% 2802 2856 55 2.0% 3203 3268 65 2.0%
17950 1996 2034 37 1.9% 2806 2861 55 2.0% 3209 3273 65 2.0%
18000 2000 2037 37 1.9% 2811 2866 55 1.9% 3214 3279 65 2.0%
18050 2003 2040 37 1.9% 2816 2870 55 1.9% 3219 3284 65 2.0%
18100 2006 2044 37 1.9% 2820 2875 55 1.9% 3224 3289 65 2.0%
18150 2010 2047 37 1.9% 2825 2880 55 1.9% 3229 3294 65 2.0%
18200 2013 2051 37 1.9% 2829 2884 55 1.9% 3235 3299 65 2.0%
18250 2017 2054 37 1.9% 2834 2889 55 1.9% 3240 3305 65 2.0%
18300 2020 2057 37 1.9% 2839 2894 55 1.9% 3245 3310 65 2.0%
18350 2023 2061 37 1.8% 2843 2898 55 1.9% 3250 3315 65 2.0%
18400 2027 2064 37 1.8% 2848 2903 55 1.9% 3255 3320 65 2.0%

$ % $ % $ %
Three Children
Existing Updated
Difference
Two Children
Existing Updated
Difference
One ChildCombined
Adjusted Net
Income Existing Updated
Difference
Child Support Schedule Comparisons
18450 2030 2067 37 1.8% 2853 2908 55 1.9% 3261 3325 65 2.0%
18500 2033 2071 37 1.8% 2857 2912 55 1.9% 3266 3331 65 2.0%
18550 2037 2074 37 1.8% 2862 2917 55 1.9% 3271 3336 65 2.0%
18600 2040 2078 37 1.8% 2867 2922 55 1.9% 3276 3341 65 2.0%
18650 2044 2081 37 1.8% 2871 2926 55 1.9% 3281 3346 65 2.0%
18700 2047 2084 37 1.8% 2876 2931 55 1.9% 3287 3351 65 2.0%
18750 2050 2088 37 1.8% 2881 2935 55 1.9% 3292 3357 65 2.0%
18800 2054 2091 37 1.8% 2885 2940 55 1.9% 3297 3362 65 2.0%
18850 2057 2095 37 1.8% 2890 2945 55 1.9% 3302 3367 65 2.0%
18900 2061 2098 37 1.8% 2895 2949 55 1.9% 3307 3372 65 2.0%
18950 2064 2101 37 1.8% 2899 2954 55 1.9% 3313 3377 65 2.0%
19000 2067 2105 37 1.8% 2904 2959 55 1.9% 3318 3383 65 2.0%
19050 2071 2108 37 1.8% 2909 2963 55 1.9% 3323 3388 65 1.9%
19100 2074 2112 37 1.8% 2913 2968 55 1.9% 3328 3393 65 1.9%
19150 2078 2115 37 1.8% 2918 2973 55 1.9% 3333 3398 65 1.9%
19200 2081 2118 37 1.8% 2923 2977 55 1.9% 3339 3403 65 1.9%
19250 2084 2122 37 1.8% 2927 2982 55 1.9% 3344 3409 65 1.9%
19300 2088 2125 37 1.8% 2932 2987 55 1.9% 3349 3414 65 1.9%
19350 2091 2128 37 1.8% 2937 2991 55 1.9% 3354 3419 65 1.9%
19400 2094 2132 37 1.8% 2941 2996 55 1.9% 3360 3424 65 1.9%
19450 2098 2135 37 1.8% 2946 3001 55 1.9% 3365 3429 65 1.9%
19500 2101 2139 37 1.8% 2951 3005 55 1.9% 3370 3435 65 1.9%
19550 2105 2142 37 1.8% 2955 3010 55 1.9% 3375 3440 65 1.9%
19600 2108 2145 37 1.8% 2960 3015 55 1.9% 3380 3445 65 1.9%
19650 2111 2149 37 1.8% 2964 3019 55 1.8% 3386 3450 65 1.9%
19700 2115 2152 37 1.8% 2969 3024 55 1.8% 3391 3455 65 1.9%
19750 2118 2156 37 1.8% 2974 3029 55 1.8% 3396 3461 65 1.9%
19800 2122 2159 37 1.8% 2978 3033 55 1.8% 3401 3466 65 1.9%
19850 2125 2162 37 1.8% 2983 3038 55 1.8% 3406 3471 65 1.9%
19900 2128 2166 37 1.8% 2988 3043 55 1.8% 3412 3476 65 1.9%
19950 2132 2169 37 1.8% 2992 3047 55 1.8% 3417 3481 65 1.9%
20000 2135 2172 37 1.7% 2997 3052 55 1.8% 3422 3487 65 1.9%
20050 2138 2176 37 1.7% 3002 3056 55 1.8% 3427 3492 65 1.9%
20100 2142 2179 37 1.7% 3006 3061 55 1.8% 3432 3497 65 1.9%
20150 2145 2183 37 1.7% 3011 3066 55 1.8% 3438 3502 65 1.9%
20200 2149 2186 37 1.7% 3016 3070 55 1.8% 3443 3507 65 1.9%
20250 2152 2189 37 1.7% 3020 3075 55 1.8% 3448 3513 65 1.9%
20300 2155 2193 37 1.7% 3025 3080 55 1.8% 3453 3518 65 1.9%
20350 2159 2196 37 1.7% 3030 3084 55 1.8% 3458 3523 65 1.9%
20400 2162 2200 37 1.7% 3034 3089 55 1.8% 3464 3528 65 1.9%
20450 2166 2203 37 1.7% 3039 3094 55 1.8% 3469 3533 65 1.9%
20500 2169 2206 37 1.7% 3044 3098 55 1.8% 3474 3539 65 1.9%
20550 2172 2210 37 1.7% 3048 3103 55 1.8% 3479 3544 65 1.9%
20600 2176 2213 37 1.7% 3053 3108 55 1.8% 3484 3549 65 1.9%
20650 2179 2216 37 1.7% 3058 3112 55 1.8% 3490 3554 65 1.9%
20700 2183 2220 37 1.7% 3062 3117 55 1.8% 3495 3559 65 1.9%
20750 2186 2223 37 1.7% 3067 3122 55 1.8% 3500 3565 65 1.8%
20800 2189 2227 37 1.7% 3072 3126 55 1.8% 3505 3570 65 1.8%
20850 2193 2230 37 1.7% 3076 3131 55 1.8% 3510 3575 65 1.8%
20900 2196 2233 37 1.7% 3081 3136 55 1.8% 3516 3580 65 1.8%

$ % $ % $ %
Three Children
Existing Updated
Difference
Two Children
Existing Updated
Difference
One ChildCombined
Adjusted Net
Income Existing Updated
Difference
Child Support Schedule Comparisons
20950 2199 2237 37 1.7% 3086 3140 55 1.8% 3521 3585 65 1.8%
21000 2203 2240 37 1.7% 3090 3145 55 1.8% 3526 3591 65 1.8%
21050 2206 2244 37 1.7% 3095 3150 55 1.8% 3531 3596 65 1.8%
21100 2210 2247 37 1.7% 3099 3154 55 1.8% 3536 3601 65 1.8%
21150 2213 2250 37 1.7% 3104 3159 55 1.8% 3542 3606 65 1.8%
21200 2216 2254 37 1.7% 3109 3164 55 1.8% 3547 3611 65 1.8%
21250 2220 2257 37 1.7% 3113 3168 55 1.8% 3552 3617 65 1.8%
21300 2223 2261 37 1.7% 3118 3173 55 1.8% 3557 3622 65 1.8%
21350 2227 2264 37 1.7% 3123 3177 55 1.8% 3562 3627 65 1.8%
21400 2230 2267 37 1.7% 3127 3182 55 1.8% 3568 3632 65 1.8%
21450 2233 2271 37 1.7% 3132 3187 55 1.7% 3573 3637 65 1.8%
21500 2237 2274 37 1.7% 3137 3191 55 1.7% 3578 3643 65 1.8%
21550 2240 2277 37 1.7% 3141 3196 55 1.7% 3583 3648 65 1.8%
21600 2243 2281 37 1.7% 3146 3201 55 1.7% 3588 3653 65 1.8%
21650 2247 2284 37 1.7% 3150 3205 55 1.7% 3593 3658 65 1.8%
21700 2250 2288 37 1.7% 3155 3210 56 1.8% 3597 3663 66 1.8%
21750 2253 2291 38 1.7% 3159 3215 56 1.8% 3601 3669 67 1.9%
21800 2257 2294 38 1.7% 3163 3219 57 1.8% 3605 3674 69 1.9%
21850 2260 2298 38 1.7% 3167 3224 57 1.8% 3609 3679 70 1.9%
21900 2263 2301 38 1.7% 3171 3229 58 1.8% 3613 3684 71 2.0%
21950 2267 2305 38 1.7% 3175 3233 58 1.8% 3618 3689 72 2.0%
22000 2270 2308 38 1.7% 3179 3238 59 1.9% 3622 3695 73 2.0%
22050 2273 2311 38 1.7% 3183 3243 59 1.9% 3626 3700 74 2.0%
22100 2277 2315 38 1.7% 3187 3247 60 1.9% 3630 3705 75 2.1%
22150 2280 2318 38 1.7% 3191 3252 61 1.9% 3634 3710 76 2.1%
22200 2283 2321 38 1.7% 3196 3257 61 1.9% 3638 3715 77 2.1%
22250 2287 2325 38 1.7% 3200 3261 62 1.9% 3642 3721 79 2.2%
22300 2290 2328 38 1.7% 3204 3266 62 1.9% 3646 3726 80 2.2%
22350 2293 2332 38 1.7% 3208 3271 63 2.0% 3650 3731 81 2.2%
22400 2297 2335 38 1.7% 3212 3275 63 2.0% 3654 3736 82 2.2%
22450 2300 2338 38 1.7% 3216 3280 64 2.0% 3659 3741 83 2.3%
22500 2303 2342 39 1.7% 3220 3285 64 2.0% 3663 3747 84 2.3%
22550 2307 2345 39 1.7% 3224 3289 65 2.0% 3667 3752 85 2.3%
22600 2310 2349 39 1.7% 3228 3294 65 2.0% 3671 3757 86 2.3%
22650 2313 2352 39 1.7% 3233 3299 66 2.0% 3675 3762 87 2.4%
22700 2316 2355 39 1.7% 3237 3303 66 2.0% 3679 3767 88 2.4%
22750 2320 2359 39 1.7% 3241 3307 66 2.0% 3683 3771 88 2.4%
22800 2323 2362 39 1.7% 3245 3311 66 2.0% 3687 3775 88 2.4%
22850 2326 2365 39 1.7% 3249 3315 66 2.0% 3691 3779 88 2.4%
22900 2330 2369 39 1.7% 3253 3319 66 2.0% 3695 3783 88 2.4%
22950 2333 2372 39 1.7% 3257 3323 66 2.0% 3700 3787 88 2.4%
23000 2336 2375 39 1.7% 3261 3328 66 2.0% 3704 3792 88 2.4%
23050 2340 2378 39 1.7% 3265 3332 66 2.0% 3708 3796 88 2.4%
23100 2343 2382 39 1.7% 3269 3336 66 2.0% 3712 3800 88 2.4%
23150 2346 2385 39 1.7% 3274 3340 66 2.0% 3716 3804 88 2.4%
23200 2350 2388 39 1.7% 3278 3344 66 2.0% 3720 3808 88 2.4%
23250 2353 2392 39 1.6% 3282 3348 66 2.0% 3724 3812 88 2.4%
23300 2356 2395 39 1.6% 3286 3352 66 2.0% 3728 3816 88 2.4%
23350 2360 2398 39 1.6% 3290 3356 66 2.0% 3732 3820 88 2.4%
23400 2363 2402 39 1.6% 3294 3360 66 2.0% 3736 3824 88 2.4%
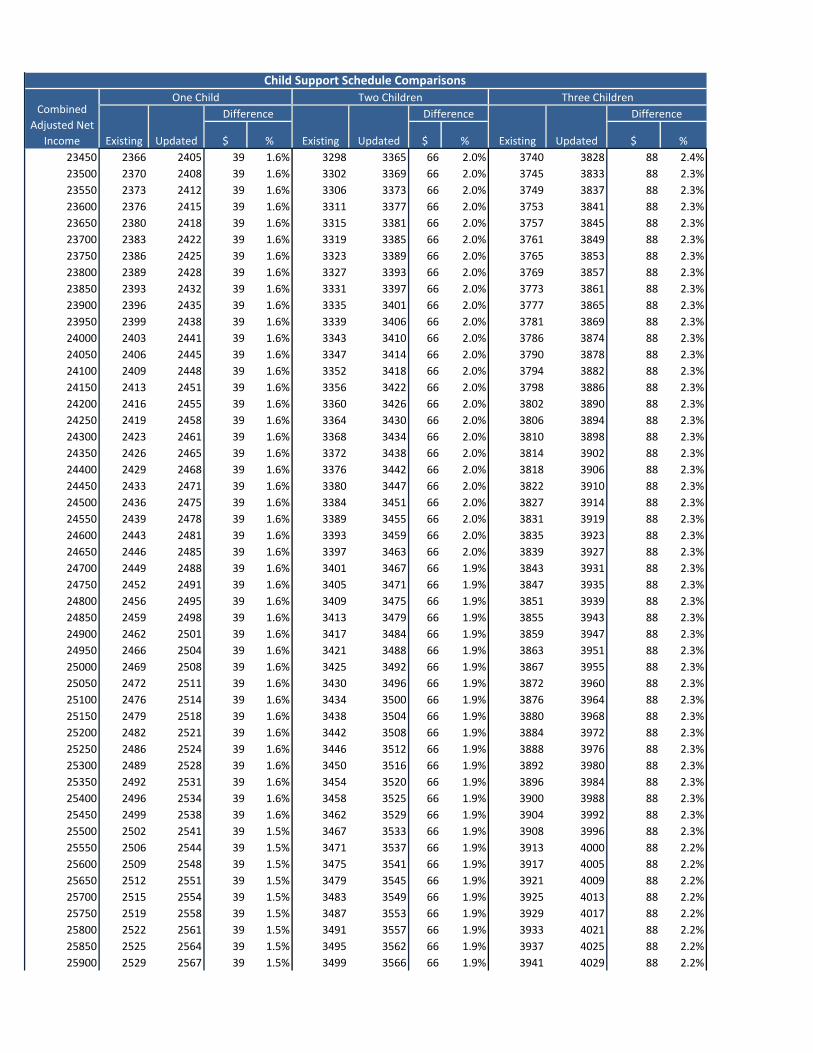
$ % $ % $ %
Three Children
Existing Updated
Difference
Two Children
Existing Updated
Difference
One ChildCombined
Adjusted Net
Income Existing Updated
Difference
Child Support Schedule Comparisons
23450 2366 2405 39 1.6% 3298 3365 66 2.0% 3740 3828 88 2.4%
23500 2370 2408 39 1.6% 3302 3369 66 2.0% 3745 3833 88 2.3%
23550 2373 2412 39 1.6% 3306 3373 66 2.0% 3749 3837 88 2.3%
23600 2376 2415 39 1.6% 3311 3377 66 2.0% 3753 3841 88 2.3%
23650 2380 2418 39 1.6% 3315 3381 66 2.0% 3757 3845 88 2.3%
23700 2383 2422 39 1.6% 3319 3385 66 2.0% 3761 3849 88 2.3%
23750 2386 2425 39 1.6% 3323 3389 66 2.0% 3765 3853 88 2.3%
23800 2389 2428 39 1.6% 3327 3393 66 2.0% 3769 3857 88 2.3%
23850 2393 2432 39 1.6% 3331 3397 66 2.0% 3773 3861 88 2.3%
23900 2396 2435 39 1.6% 3335 3401 66 2.0% 3777 3865 88 2.3%
23950 2399 2438 39 1.6% 3339 3406 66 2.0% 3781 3869 88 2.3%
24000 2403 2441 39 1.6% 3343 3410 66 2.0% 3786 3874 88 2.3%
24050 2406 2445 39 1.6% 3347 3414 66 2.0% 3790 3878 88 2.3%
24100 2409 2448 39 1.6% 3352 3418 66 2.0% 3794 3882 88 2.3%
24150 2413 2451 39 1.6% 3356 3422 66 2.0% 3798 3886 88 2.3%
24200 2416 2455 39 1.6% 3360 3426 66 2.0% 3802 3890 88 2.3%
24250 2419 2458 39 1.6% 3364 3430 66 2.0% 3806 3894 88 2.3%
24300 2423 2461 39 1.6% 3368 3434 66 2.0% 3810 3898 88 2.3%
24350 2426 2465 39 1.6% 3372 3438 66 2.0% 3814 3902 88 2.3%
24400 2429 2468 39 1.6% 3376 3442 66 2.0% 3818 3906 88 2.3%
24450 2433 2471 39 1.6% 3380 3447 66 2.0% 3822 3910 88 2.3%
24500 2436 2475 39 1.6% 3384 3451 66 2.0% 3827 3914 88 2.3%
24550 2439 2478 39 1.6% 3389 3455 66 2.0% 3831 3919 88 2.3%
24600 2443 2481 39 1.6% 3393 3459 66 2.0% 3835 3923 88 2.3%
24650 2446 2485 39 1.6% 3397 3463 66 2.0% 3839 3927 88 2.3%
24700 2449 2488 39 1.6% 3401 3467 66 1.9% 3843 3931 88 2.3%
24750 2452 2491 39 1.6% 3405 3471 66 1.9% 3847 3935 88 2.3%
24800 2456 2495 39 1.6% 3409 3475 66 1.9% 3851 3939 88 2.3%
24850 2459 2498 39 1.6% 3413 3479 66 1.9% 3855 3943 88 2.3%
24900 2462 2501 39 1.6% 3417 3484 66 1.9% 3859 3947 88 2.3%
24950 2466 2504 39 1.6% 3421 3488 66 1.9% 3863 3951 88 2.3%
25000 2469 2508 39 1.6% 3425 3492 66 1.9% 3867 3955 88 2.3%
25050 2472 2511 39 1.6% 3430 3496 66 1.9% 3872 3960 88 2.3%
25100 2476 2514 39 1.6% 3434 3500 66 1.9% 3876 3964 88 2.3%
25150 2479 2518 39 1.6% 3438 3504 66 1.9% 3880 3968 88 2.3%
25200 2482 2521 39 1.6% 3442 3508 66 1.9% 3884 3972 88 2.3%
25250 2486 2524 39 1.6% 3446 3512 66 1.9% 3888 3976 88 2.3%
25300 2489 2528 39 1.6% 3450 3516 66 1.9% 3892 3980 88 2.3%
25350 2492 2531 39 1.6% 3454 3520 66 1.9% 3896 3984 88 2.3%
25400 2496 2534 39 1.6% 3458 3525 66 1.9% 3900 3988 88 2.3%
25450 2499 2538 39 1.6% 3462 3529 66 1.9% 3904 3992 88 2.3%
25500 2502 2541 39 1.5% 3467 3533 66 1.9% 3908 3996 88 2.3%
25550 2506 2544 39 1.5% 3471 3537 66 1.9% 3913 4000 88 2.2%
25600 2509 2548 39 1.5% 3475 3541 66 1.9% 3917 4005 88 2.2%
25650 2512 2551 39 1.5% 3479 3545 66 1.9% 3921 4009 88 2.2%
25700 2515 2554 39 1.5% 3483 3549 66 1.9% 3925 4013 88 2.2%
25750 2519 2558 39 1.5% 3487 3553 66 1.9% 3929 4017 88 2.2%
25800 2522 2561 39 1.5% 3491 3557 66 1.9% 3933 4021 88 2.2%
25850 2525 2564 39 1.5% 3495 3562 66 1.9% 3937 4025 88 2.2%
25900 2529 2567 39 1.5% 3499 3566 66 1.9% 3941 4029 88 2.2%

$ % $ % $ %
Three Children
Existing Updated
Difference
Two Children
Existing Updated
Difference
One ChildCombined
Adjusted Net
Income Existing Updated
Difference
Child Support Schedule Comparisons
25950 2532 2571 39 1.5% 3503 3570 66 1.9% 3945 4033 88 2.2%
26000 2535 2574 39 1.5% 3508 3574 66 1.9% 3949 4037 88 2.2%
26050 2539 2577 39 1.5% 3512 3578 66 1.9% 3954 4041 88 2.2%
26100 2542 2581 39 1.5% 3516 3582 66 1.9% 3958 4046 88 2.2%
26150 2545 2584 39 1.5% 3520 3586 66 1.9% 3962 4050 88 2.2%
26200 2549 2587 39 1.5% 3524 3590 66 1.9% 3966 4054 88 2.2%
26250 2552 2591 39 1.5% 3528 3594 66 1.9% 3970 4058 88 2.2%
26300 2555 2594 39 1.5% 3532 3598 66 1.9% 3974 4062 88 2.2%
26350 2559 2597 39 1.5% 3536 3603 66 1.9% 3978 4066 88 2.2%
26400 2562 2601 39 1.5% 3540 3607 66 1.9% 3982 4070 88 2.2%
26450 2565 2604 39 1.5% 3545 3611 66 1.9% 3986 4074 88 2.2%
26500 2569 2607 39 1.5% 3549 3615 66 1.9% 3990 4078 88 2.2%
26550 2572 2611 39 1.5% 3553 3619 66 1.9% 3994 4082 88 2.2%
26600 2575 2614 39 1.5% 3557 3623 66 1.9% 3999 4086 88 2.2%
26650 2579 2617 39 1.5% 3561 3627 66 1.9% 4003 4091 88 2.2%
26700 2582 2621 39 1.5% 3565 3631 66 1.9% 4007 4095 88 2.2%
26750 2585 2624 39 1.5% 3569 3635 66 1.9% 4011 4099 88 2.2%
26800 2588 2627 39 1.5% 3573 3640 66 1.9% 4015 4103 88 2.2%
26850 2592 2630 39 1.5% 3577 3644 66 1.9% 4019 4107 88 2.2%
26900 2595 2634 39 1.5% 3581 3648 66 1.8% 4023 4111 88 2.2%
26950 2598 2637 39 1.5% 3586 3652 66 1.8% 4027 4115 88 2.2%
27000 2602 2640 39 1.5% 3590 3656 66 1.8% 4031 4119 88 2.2%
27050 2605 2644 39 1.5% 3594 3660 66 1.8% 4035 4123 88 2.2%
27100 2608 2647 39 1.5% 3598 3664 66 1.8% 4040 4127 88 2.2%
27150 2612 2650 39 1.5% 3602 3668 66 1.8% 4044 4132 88 2.2%
27200 2615 2654 39 1.5% 3606 3672 66 1.8% 4048 4136 88 2.2%
27250 2618 2657 39 1.5% 3610 3676 66 1.8% 4052 4140 88 2.2%
27300 2622 2660 39 1.5% 3614 3681 66 1.8% 4056 4144 88 2.2%
27350 2625 2664 39 1.5% 3618 3685 66 1.8% 4060 4148 88 2.2%
27400 2628 2667 39 1.5% 3623 3689 66 1.8% 4064 4152 88 2.2%
27450 2632 2670 39 1.5% 3627 3693 66 1.8% 4068 4156 88 2.2%
27500 2635 2674 39 1.5% 3631 3697 66 1.8% 4072 4160 88 2.2%
27550 2638 2677 39 1.5% 3635 3701 66 1.8% 4076 4164 88 2.2%
27600 2642 2680 39 1.5% 3639 3705 66 1.8% 4081 4168 88 2.2%
27650 2645 2684 39 1.5% 3643 3709 66 1.8% 4085 4173 88 2.2%
27700 2648 2687 39 1.5% 3647 3713 66 1.8% 4089 4177 88 2.2%
27750 2651 2690 39 1.5% 3651 3718 66 1.8% 4093 4181 88 2.1%
27800 2655 2693 39 1.5% 3655 3722 66 1.8% 4097 4185 88 2.1%
27850 2658 2697 39 1.5% 3659 3726 66 1.8% 4101 4189 88 2.1%
27900 2661 2700 39 1.5% 3664 3730 66 1.8% 4105 4193 88 2.1%
27950 2665 2703 39 1.5% 3668 3734 66 1.8% 4109 4197 88 2.1%
28000 2668 2707 39 1.5% 3672 3738 66 1.8% 4113 4201 88 2.1%
28050 2671 2710 39 1.4% 3676 3742 66 1.8% 4117 4205 88 2.1%
28100 2675 2713 39 1.4% 3680 3746 66 1.8% 4121 4209 88 2.1%
28150 2678 2717 39 1.4% 3684 3750 66 1.8% 4126 4213 88 2.1%
28200 2681 2720 39 1.4% 3688 3754 66 1.8% 4130 4218 88 2.1%
28250 2685 2723 39 1.4% 3692 3759 66 1.8% 4134 4222 88 2.1%
28300 2688 2727 39 1.4% 3696 3763 66 1.8% 4138 4226 88 2.1%
28350 2691 2730 39 1.4% 3701 3767 66 1.8% 4142 4230 88 2.1%
28400 2695 2733 39 1.4% 3705 3771 66 1.8% 4146 4234 88 2.1%

$ % $ % $ %
Three Children
Existing Updated
Difference
Two Children
Existing Updated
Difference
One ChildCombined
Adjusted Net
Income Existing Updated
Difference
Child Support Schedule Comparisons
28450 2698 2737 39 1.4% 3709 3775 66 1.8% 4150 4238 88 2.1%
28500 2701 2740 39 1.4% 3713 3779 66 1.8% 4154 4242 88 2.1%
28550 2705 2743 39 1.4% 3717 3783 66 1.8% 4158 4246 88 2.1%
28600 2708 2747 39 1.4% 3721 3787 66 1.8% 4162 4250 88 2.1%
28650 2711 2750 39 1.4% 3725 3791 66 1.8% 4167 4254 88 2.1%
28700 2715 2753 39 1.4% 3729 3796 66 1.8% 4171 4259 88 2.1%
28750 2718 2756 39 1.4% 3733 3800 66 1.8% 4175 4263 88 2.1%
28800 2721 2760 39 1.4% 3737 3804 66 1.8% 4179 4267 88 2.1%
28850 2724 2763 39 1.4% 3742 3808 66 1.8% 4183 4271 88 2.1%
28900 2728 2766 39 1.4% 3746 3812 66 1.8% 4187 4275 88 2.1%
28950 2731 2770 39 1.4% 3750 3816 66 1.8% 4191 4279 88 2.1%
29000 2734 2773 39 1.4% 3754 3820 66 1.8% 4195 4283 88 2.1%
29050 2738 2776 39 1.4% 3758 3824 66 1.8% 4199 4287 88 2.1%
29100 2741 2780 39 1.4% 3762 3828 66 1.8% 4203 4291 88 2.1%
29150 2744 2783 39 1.4% 3766 3832 66 1.8% 4207 4295 88 2.1%
29200 2748 2786 39 1.4% 3770 3837 66 1.8% 4212 4299 88 2.1%
29250 2751 2790 39 1.4% 3774 3841 66 1.8% 4216 4304 88 2.1%
29300 2754 2793 39 1.4% 3779 3845 66 1.8% 4220 4308 88 2.1%
29350 2758 2796 39 1.4% 3783 3849 66 1.8% 4224 4312 88 2.1%
29400 2761 2800 39 1.4% 3787 3853 66 1.7% 4228 4316 88 2.1%
29450 2764 2803 39 1.4% 3791 3857 66 1.7% 4232 4320 88 2.1%
29500 2768 2806 39 1.4% 3795 3861 66 1.7% 4236 4324 88 2.1%
29550 2771 2810 39 1.4% 3799 3865 66 1.7% 4240 4328 88 2.1%
29600 2774 2813 39 1.4% 3803 3869 66 1.7% 4244 4332 88 2.1%
29650 2778 2816 39 1.4% 3807 3874 66 1.7% 4248 4336 88 2.1%
29700 2781 2819 39 1.4% 3811 3878 66 1.7% 4253 4340 88 2.1%
29750 2784 2823 39 1.4% 3816 3882 66 1.7% 4257 4345 88 2.1%
29800 2787 2826 39 1.4% 3820 3886 66 1.7% 4261 4349 88 2.1%
29850 2791 2829 39 1.4% 3824 3890 66 1.7% 4265 4353 88 2.1%
29900 2794 2833 39 1.4% 3828 3894 66 1.7% 4269 4357 88 2.1%
29950 2797 2836 39 1.4% 3832 3898 66 1.7% 4273 4361 88 2.1%
30000 2801 2839 39 1.4% 3836 3902 66 1.7% 4277 4365 88 2.1%
Bue shading indicates schedule amounts adjusted for the self‐support reserve (SSR)
* The schedule would start at $1,000 per month, above the updated SSR of $981/month
30 1.3% 46 1.4% 57 1.5%
37 1.7% 55 1.9% 65 2.1%
‐45 ‐72.3% ‐46 ‐72.3% ‐46 ‐72.3%
44 3.2% 66 3.4% 88 3.7%
Average Change
Median Change
Minimum Change
Maximum Change

$ % $ % $ %
950 18 * 18 * 18 *
1000 64 18 ‐47 ‐72.3% 65 18 ‐47 ‐72.3% 66 18 ‐48 ‐72.3%
1050 111 64 ‐47 ‐42.0% 112 65 ‐47 ‐42.0% 113 66 ‐48 ‐42.0%
1100 157 111 ‐47 ‐29.6% 159 112 ‐47 ‐29.6% 161 113 ‐48 ‐29.6%
1150 204 157 ‐47 ‐22.8% 206 159 ‐47 ‐22.8% 208 161 ‐48 ‐22.8%
1200 250 204 ‐47 ‐18.6% 253 206 ‐47 ‐18.6% 256 208 ‐48 ‐18.6%
1250 297 250 ‐47 ‐15.7% 300 253 ‐47 ‐15.7% 303 256 ‐48 ‐15.7%
1300 343 297 ‐47 ‐13.5% 347 300 ‐47 ‐13.5% 351 303 ‐48 ‐13.5%
1350 390 343 ‐47 ‐11.9% 394 347 ‐47 ‐11.9% 398 351 ‐48 ‐11.9%
1400 436 390 ‐47 ‐10.7% 441 394 ‐47 ‐10.7% 446 398 ‐48 ‐10.7%
1450 483 436 ‐47 ‐9.6% 488 441 ‐47 ‐9.6% 493 446 ‐48 ‐9.6%
1500 529 483 ‐47 ‐8.8% 535 488 ‐47 ‐8.8% 541 493 ‐48 ‐8.8%
1550 576 529 ‐47 ‐8.1% 582 535 ‐47 ‐8.1% 588 541 ‐48 ‐8.1%
1600 622 576 ‐47 ‐7.5% 629 582 ‐47 ‐7.5% 636 588 ‐48 ‐7.5%
1650 669 622 ‐47 ‐7.0% 676 629 ‐47 ‐7.0% 683 636 ‐48 ‐7.0%
1700 715 669 ‐47 ‐6.5% 723 676 ‐47 ‐6.5% 731 683 ‐48 ‐6.5%
1750 762 715 ‐47 ‐6.1% 770 723 ‐47 ‐6.1% 778 731 ‐48 ‐6.1%
1800 808 762 ‐47 ‐5.8% 817 770 ‐47 ‐5.8% 826 778 ‐48 ‐5.8%
1850 833 808 ‐25 ‐3.0% 864 817 ‐47 ‐5.4% 873 826 ‐48 ‐5.4%
1900 854 855 0 0.0% 911 864 ‐47 ‐5.2% 921 873 ‐48 ‐5.2%
1950 875 878 3 0.3% 958 911 ‐47 ‐4.9% 968 921 ‐48 ‐4.9%
2000 897 899 3 0.3% 986 958 ‐28 ‐2.9% 1016 968 ‐47 ‐4.7%
2050 918 920 3 0.3% 1009 1005 ‐4 ‐0.4% 1063 1016 ‐47 ‐4.5%
2100 939 941 3 0.3% 1032 1035 3 0.3% 1111 1063 ‐48 ‐4.3%
2150 960 962 3 0.3% 1056 1058 3 0.3% 1147 1111 ‐37 ‐3.2%
2200 981 983 3 0.3% 1079 1081 3 0.3% 1173 1158 ‐14 ‐1.2%
2250 1002 1004 3 0.3% 1102 1105 3 0.3% 1198 1201 3 0.3%
2300 1023 1025 3 0.2% 1125 1128 3 0.2% 1223 1226 3 0.2%
2350 1044 1046 2 0.2% 1148 1151 3 0.2% 1248 1251 3 0.2%
2400 1065 1067 2 0.2% 1171 1174 3 0.2% 1273 1276 3 0.2%
2450 1086 1088 2 0.2% 1195 1197 2 0.2% 1299 1301 2 0.2%
2500 1108 1109 1 0.1% 1219 1220 1 0.1% 1325 1326 1 0.1%
2550 1130 1131 0 0.0% 1243 1244 0 0.0% 1352 1352 0 0.0%
2600 1152 1153 0 0.0% 1268 1268 0 0.0% 1378 1378 0 0.0%
2650 1174 1175 0 0.0% 1292 1292 0 0.0% 1404 1404 0 0.0%
2700 1196 1197 0 0.0% 1316 1316 0 0.0% 1430 1431 0 0.0%
2750 1218 1218 0 0.0% 1340 1340 0 0.0% 1457 1457 0 0.0%
2800 1240 1240 0 0.0% 1364 1364 0 0.0% 1483 1483 0 0.0%
2850 1262 1262 0 0.0% 1388 1389 0 0.0% 1509 1509 0 0.0%
2900 1284 1284 0 0.0% 1412 1413 0 0.0% 1535 1536 0 0.0%
2950 1306 1306 0 0.0% 1437 1437 0 0.0% 1562 1562 0 0.0%
3000 1328 1328 0 0.0% 1461 1461 0 0.0% 1588 1588 0 0.0%
3050 1350 1350 0 0.0% 1485 1485 0 0.0% 1614 1614 0 0.0%
3100 1372 1372 0 0.0% 1509 1509 0 0.0% 1640 1641 0 0.0%
3150 1393 1394 1 0.1% 1532 1534 1 0.1% 1666 1667 1 0.1%
3200 1408 1416 8 0.6% 1549 1558 9 0.6% 1684 1693 10 0.6%
3250 1423 1438 15 1.1% 1565 1582 17 1.1% 1701 1719 18 1.1%
3300 1438 1460 22 1.5% 1582 1606 24 1.5% 1719 1745 26 1.5%
3350 1453 1475 22 1.5% 1598 1622 24 1.5% 1737 1763 26 1.5%
3400 1468 1489 22 1.5% 1614 1638 24 1.5% 1755 1781 26 1.5%
Difference
Existing Updated
Difference
Child Support Schedule Comparisons
Combined
Adjusted
Net Income
Four Children Five Children Six Children
Existing Updated
Difference
Existing Updated

$ % $ % $ %
Difference
Existing Updated
Difference
Child Support Schedule Comparisons
Combined
Adjusted
Net Income
Four Children Five Children Six Children
Existing Updated
Difference
Existing Updated
3450 1482 1504 22 1.5% 1631 1655 24 1.5% 1772 1799 26 1.5%
3500 1497 1519 22 1.5% 1647 1671 24 1.5% 1790 1817 26 1.5%
3550 1512 1534 22 1.5% 1663 1687 24 1.5% 1808 1834 26 1.5%
3600 1527 1549 22 1.4% 1680 1704 24 1.4% 1826 1852 26 1.4%
3650 1540 1564 24 1.5% 1694 1720 26 1.5% 1841 1870 28 1.5%
3700 1551 1579 28 1.8% 1706 1737 31 1.8% 1854 1888 33 1.8%
3750 1562 1594 32 2.1% 1718 1753 35 2.1% 1867 1905 38 2.1%
3800 1572 1608 36 2.3% 1729 1769 40 2.3% 1880 1923 43 2.3%
3850 1583 1620 37 2.3% 1741 1782 40 2.3% 1893 1937 44 2.3%
3900 1594 1630 37 2.3% 1753 1793 40 2.3% 1906 1949 44 2.3%
3950 1604 1641 37 2.3% 1765 1805 40 2.3% 1918 1962 44 2.3%
4000 1615 1652 37 2.3% 1777 1817 40 2.3% 1931 1975 44 2.3%
4050 1626 1662 37 2.3% 1788 1829 40 2.3% 1944 1988 44 2.3%
4100 1637 1673 37 2.2% 1800 1840 40 2.2% 1957 2001 44 2.2%
4150 1647 1684 37 2.3% 1812 1852 41 2.3% 1969 2013 44 2.3%
4200 1657 1695 38 2.3% 1823 1864 41 2.3% 1981 2026 45 2.3%
4250 1667 1705 38 2.3% 1834 1876 42 2.3% 1993 2039 46 2.3%
4300 1677 1716 39 2.3% 1845 1888 43 2.3% 2005 2052 46 2.3%
4350 1687 1726 39 2.3% 1856 1899 43 2.3% 2018 2064 47 2.3%
4400 1697 1736 39 2.3% 1867 1910 43 2.3% 2030 2076 47 2.3%
4450 1708 1747 39 2.3% 1878 1921 43 2.3% 2042 2088 47 2.3%
4500 1718 1757 39 2.3% 1889 1932 43 2.3% 2054 2100 47 2.3%
4550 1728 1767 39 2.3% 1901 1943 43 2.3% 2066 2113 47 2.3%
4600 1737 1777 39 2.3% 1911 1955 43 2.3% 2078 2125 47 2.3%
4650 1742 1787 45 2.6% 1916 1966 50 2.6% 2083 2137 54 2.6%
4700 1746 1797 51 2.9% 1921 1977 56 2.9% 2088 2149 61 2.9%
4750 1750 1807 57 3.3% 1925 1988 63 3.3% 2093 2161 68 3.3%
4800 1754 1817 63 3.6% 1930 1999 69 3.6% 2098 2173 75 3.6%
4850 1759 1824 65 3.7% 1935 2006 72 3.7% 2103 2181 78 3.7%
4900 1763 1828 65 3.7% 1939 2011 72 3.7% 2108 2186 78 3.7%
4950 1767 1833 65 3.7% 1944 2016 72 3.7% 2113 2191 78 3.7%
5000 1772 1837 65 3.7% 1949 2020 72 3.7% 2118 2196 78 3.7%
5050 1776 1841 65 3.7% 1953 2025 72 3.7% 2123 2201 78 3.7%
5100 1781 1845 64 3.6% 1960 2030 70 3.6% 2130 2206 76 3.6%
5150 1789 1850 61 3.4% 1968 2034 67 3.4% 2139 2211 72 3.4%
5200 1797 1854 57 3.2% 1976 2039 63 3.2% 2148 2217 68 3.2%
5250 1804 1858 54 3.0% 1985 2044 59 3.0% 2157 2222 64 3.0%
5300 1812 1862 50 2.8% 1993 2049 55 2.8% 2167 2227 60 2.8%
5350 1820 1868 48 2.7% 2002 2055 53 2.7% 2176 2234 58 2.7%
5400 1827 1876 48 2.6% 2010 2063 53 2.6% 2185 2243 58 2.6%
5450 1835 1883 48 2.6% 2018 2072 53 2.6% 2194 2252 58 2.6%
5500 1843 1891 48 2.6% 2027 2080 53 2.6% 2203 2261 58 2.6%
5550 1850 1899 48 2.6% 2035 2089 53 2.6% 2212 2270 58 2.6%
5600 1858 1906 48 2.6% 2044 2097 53 2.6% 2222 2279 58 2.6%
5650 1866 1914 48 2.6% 2052 2105 53 2.6% 2231 2289 58 2.6%
5700 1873 1922 48 2.6% 2061 2114 53 2.6% 2240 2298 58 2.6%
5750 1881 1929 48 2.6% 2069 2122 53 2.6% 2249 2307 58 2.6%
5800 1889 1937 48 2.6% 2077 2131 53 2.6% 2258 2316 58 2.6%
5850 1897 1945 48 2.5% 2087 2139 52 2.5% 2268 2325 57 2.5%
5900 1906 1952 47 2.5% 2096 2148 51 2.5% 2278 2334 56 2.5%
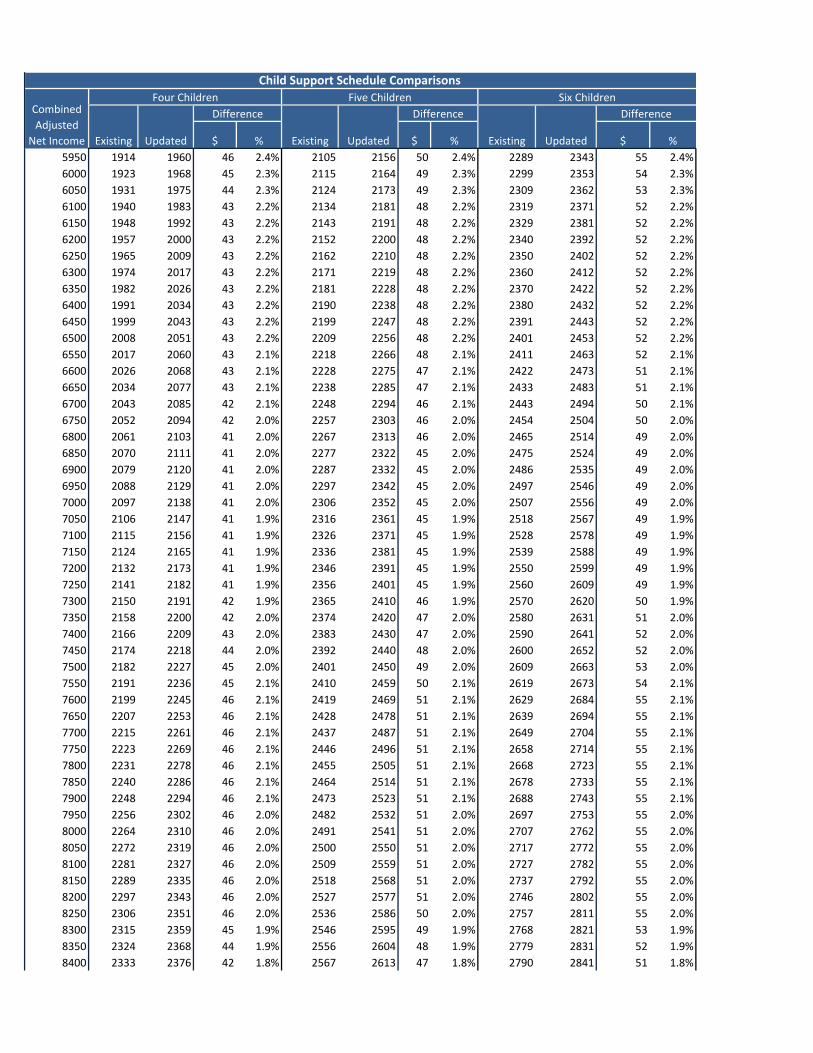
$ % $ % $ %
Difference
Existing Updated
Difference
Child Support Schedule Comparisons
Combined
Adjusted
Net Income
Four Children Five Children Six Children
Existing Updated
Difference
Existing Updated
5950 1914 1960 46 2.4% 2105 2156 50 2.4% 2289 2343 55 2.4%
6000 1923 1968 45 2.3% 2115 2164 49 2.3% 2299 2353 54 2.3%
6050 1931 1975 44 2.3% 2124 2173 49 2.3% 2309 2362 53 2.3%
6100 1940 1983 43 2.2% 2134 2181 48 2.2% 2319 2371 52 2.2%
6150 1948 1992 43 2.2% 2143 2191 48 2.2% 2329 2381 52 2.2%
6200 1957 2000 43 2.2% 2152 2200 48 2.2% 2340 2392 52 2.2%
6250 1965 2009 43 2.2% 2162 2210 48 2.2% 2350 2402 52 2.2%
6300 1974 2017 43 2.2% 2171 2219 48 2.2% 2360 2412 52 2.2%
6350 1982 2026 43 2.2% 2181 2228 48 2.2% 2370 2422 52 2.2%
6400 1991 2034 43 2.2% 2190 2238 48 2.2% 2380 2432 52 2.2%
6450 1999 2043 43 2.2% 2199 2247 48 2.2% 2391 2443 52 2.2%
6500 2008 2051 43 2.2% 2209 2256 48 2.2% 2401 2453 52 2.2%
6550 2017 2060 43 2.1% 2218 2266 48 2.1% 2411 2463 52 2.1%
6600 2026 2068 43 2.1% 2228 2275 47 2.1% 2422 2473 51 2.1%
6650 2034 2077 43 2.1% 2238 2285 47 2.1% 2433 2483 51 2.1%
6700 2043 2085 42 2.1% 2248 2294 46 2.1% 2443 2494 50 2.1%
6750 2052 2094 42 2.0% 2257 2303 46 2.0% 2454 2504 50 2.0%
6800 2061 2103 41 2.0% 2267 2313 46 2.0% 2465 2514 49 2.0%
6850 2070 2111 41 2.0% 2277 2322 45 2.0% 2475 2524 49 2.0%
6900 2079 2120 41 2.0% 2287 2332 45 2.0% 2486 2535 49 2.0%
6950 2088 2129 41 2.0% 2297 2342 45 2.0% 2497 2546 49 2.0%
7000 2097 2138 41 2.0% 2306 2352 45 2.0% 2507 2556 49 2.0%
7050 2106 2147 41 1.9% 2316 2361 45 1.9% 2518 2567 49 1.9%
7100 2115 2156 41 1.9% 2326 2371 45 1.9% 2528 2578 49 1.9%
7150 2124 2165 41 1.9% 2336 2381 45 1.9% 2539 2588 49 1.9%
7200 2132 2173 41 1.9% 2346 2391 45 1.9% 2550 2599 49 1.9%
7250 2141 2182 41 1.9% 2356 2401 45 1.9% 2560 2609 49 1.9%
7300 2150 2191 42 1.9% 2365 2410 46 1.9% 2570 2620 50 1.9%
7350 2158 2200 42 2.0% 2374 2420 47 2.0% 2580 2631 51 2.0%
7400 2166 2209 43 2.0% 2383 2430 47 2.0% 2590 2641 52 2.0%
7450 2174 2218 44 2.0% 2392 2440 48 2.0% 2600 2652 52 2.0%
7500 2182 2227 45 2.0% 2401 2450 49 2.0% 2609 2663 53 2.0%
7550 2191 2236 45 2.1% 2410 2459 50 2.1% 2619 2673 54 2.1%
7600 2199 2245 46 2.1% 2419 2469 51 2.1% 2629 2684 55 2.1%
7650 2207 2253 46 2.1% 2428 2478 51 2.1% 2639 2694 55 2.1%
7700 2215 2261 46 2.1% 2437 2487 51 2.1% 2649 2704 55 2.1%
7750 2223 2269 46 2.1% 2446 2496 51 2.1% 2658 2714 55 2.1%
7800 2231 2278 46 2.1% 2455 2505 51 2.1% 2668 2723 55 2.1%
7850 2240 2286 46 2.1% 2464 2514 51 2.1% 2678 2733 55 2.1%
7900 2248 2294 46 2.1% 2473 2523 51 2.1% 2688 2743 55 2.1%
7950 2256 2302 46 2.0% 2482 2532 51 2.0% 2697 2753 55 2.0%
8000 2264 2310 46 2.0% 2491 2541 51 2.0% 2707 2762 55 2.0%
8050 2272 2319 46 2.0% 2500 2550 51 2.0% 2717 2772 55 2.0%
8100 2281 2327 46 2.0% 2509 2559 51 2.0% 2727 2782 55 2.0%
8150 2289 2335 46 2.0% 2518 2568 51 2.0% 2737 2792 55 2.0%
8200 2297 2343 46 2.0% 2527 2577 51 2.0% 2746 2802 55 2.0%
8250 2306 2351 46 2.0% 2536 2586 50 2.0% 2757 2811 55 2.0%
8300 2315 2359 45 1.9% 2546 2595 49 1.9% 2768 2821 53 1.9%
8350 2324 2368 44 1.9% 2556 2604 48 1.9% 2779 2831 52 1.9%
8400 2333 2376 42 1.8% 2567 2613 47 1.8% 2790 2841 51 1.8%

$ % $ % $ %
Difference
Existing Updated
Difference
Child Support Schedule Comparisons
Combined
Adjusted
Net Income
Four Children Five Children Six Children
Existing Updated
Difference
Existing Updated
8450 2343 2384 41 1.8% 2577 2622 46 1.8% 2801 2850 49 1.8%
8500 2352 2392 40 1.7% 2587 2631 44 1.7% 2812 2860 48 1.7%
8550 2361 2400 39 1.7% 2597 2640 43 1.7% 2823 2870 47 1.7%
8600 2370 2408 38 1.6% 2607 2649 42 1.6% 2834 2880 46 1.6%
8650 2379 2417 38 1.6% 2617 2659 41 1.6% 2845 2890 45 1.6%
8700 2389 2426 38 1.6% 2628 2669 41 1.6% 2856 2901 45 1.6%
8750 2398 2436 38 1.6% 2638 2679 41 1.6% 2867 2912 45 1.6%
8800 2407 2445 38 1.6% 2648 2689 41 1.6% 2878 2923 45 1.6%
8850 2416 2454 38 1.6% 2658 2699 41 1.6% 2889 2934 45 1.6%
8900 2426 2463 38 1.6% 2668 2710 41 1.6% 2900 2945 45 1.6%
8950 2435 2473 38 1.5% 2678 2720 41 1.5% 2911 2956 45 1.5%
9000 2444 2482 38 1.5% 2688 2730 41 1.5% 2922 2967 45 1.5%
9050 2453 2491 38 1.5% 2699 2740 41 1.5% 2933 2978 45 1.5%
9100 2463 2500 38 1.5% 2709 2750 41 1.5% 2944 2990 45 1.5%
9150 2472 2509 38 1.5% 2719 2760 41 1.5% 2956 3001 45 1.5%
9200 2480 2519 38 1.5% 2728 2771 42 1.5% 2966 3012 46 1.5%
9250 2485 2528 43 1.7% 2733 2781 48 1.7% 2971 3023 52 1.7%
9300 2489 2537 48 1.9% 2738 2791 53 1.9% 2976 3034 58 1.9%
9350 2493 2546 53 2.1% 2742 2801 59 2.1% 2981 3045 64 2.1%
9400 2497 2556 58 2.3% 2747 2811 64 2.3% 2986 3056 70 2.3%
9450 2501 2565 63 2.5% 2752 2821 70 2.5% 2991 3067 76 2.5%
9500 2506 2574 68 2.7% 2756 2831 75 2.7% 2996 3078 82 2.7%
9550 2510 2583 73 2.9% 2761 2842 81 2.9% 3001 3089 88 2.9%
9600 2514 2593 78 3.1% 2766 2852 86 3.1% 3006 3100 94 3.1%
9650 2518 2601 82 3.3% 2770 2861 91 3.3% 3011 3110 98 3.3%
9700 2523 2605 82 3.3% 2775 2866 91 3.3% 3016 3115 98 3.3%
9750 2527 2609 82 3.3% 2780 2870 91 3.3% 3021 3120 98 3.3%
9800 2531 2614 82 3.3% 2784 2875 91 3.3% 3027 3125 98 3.3%
9850 2535 2618 82 3.2% 2789 2880 91 3.2% 3032 3130 98 3.2%
9900 2540 2622 82 3.2% 2794 2884 91 3.2% 3037 3135 98 3.2%
9950 2544 2626 82 3.2% 2798 2889 91 3.2% 3042 3140 98 3.2%
10000 2548 2630 82 3.2% 2803 2894 91 3.2% 3047 3145 98 3.2%
10050 2552 2635 82 3.2% 2808 2898 91 3.2% 3052 3150 98 3.2%
10100 2557 2639 82 3.2% 2812 2903 91 3.2% 3057 3155 98 3.2%
10150 2561 2643 82 3.2% 2817 2908 91 3.2% 3062 3160 98 3.2%
10200 2567 2647 80 3.1% 2824 2912 88 3.1% 3070 3166 96 3.1%
10250 2574 2652 78 3.0% 2831 2917 86 3.0% 3078 3171 93 3.0%
10300 2581 2656 75 2.9% 2839 2922 83 2.9% 3086 3176 90 2.9%
10350 2587 2660 73 2.8% 2846 2926 80 2.8% 3094 3181 87 2.8%
10400 2594 2664 70 2.7% 2854 2931 77 2.7% 3102 3186 84 2.7%
10450 2601 2669 68 2.6% 2861 2936 74 2.6% 3110 3191 81 2.6%
10500 2608 2673 65 2.5% 2869 2940 72 2.5% 3118 3196 78 2.5%
10550 2615 2677 63 2.4% 2876 2945 69 2.4% 3126 3201 75 2.4%
10600 2621 2681 60 2.3% 2884 2950 66 2.3% 3134 3206 72 2.3%
10650 2628 2686 57 2.2% 2891 2954 63 2.2% 3143 3211 69 2.2%
10700 2635 2692 57 2.2% 2898 2961 63 2.2% 3151 3219 68 2.2%
10750 2642 2699 57 2.2% 2906 2969 63 2.2% 3159 3227 68 2.2%
10800 2649 2706 57 2.2% 2913 2976 63 2.2% 3167 3235 68 2.2%
10850 2655 2713 57 2.2% 2921 2984 63 2.2% 3175 3243 68 2.2%
10900 2662 2719 57 2.1% 2928 2991 63 2.1% 3183 3251 68 2.1%

$ % $ % $ %
Difference
Existing Updated
Difference
Child Support Schedule Comparisons
Combined
Adjusted
Net Income
Four Children Five Children Six Children
Existing Updated
Difference
Existing Updated
10950 2669 2726 57 2.1% 2936 2999 63 2.1% 3191 3260 68 2.1%
11000 2676 2733 57 2.1% 2943 3006 63 2.1% 3199 3268 68 2.1%
11050 2683 2740 57 2.1% 2951 3014 63 2.1% 3207 3276 68 2.1%
11100 2689 2746 57 2.1% 2958 3021 63 2.1% 3216 3284 68 2.1%
11150 2696 2753 57 2.1% 2966 3029 63 2.1% 3224 3292 68 2.1%
11200 2703 2760 57 2.1% 2973 3036 63 2.1% 3232 3300 68 2.1%
11250 2710 2767 57 2.1% 2981 3043 63 2.1% 3240 3308 68 2.1%
11300 2716 2774 57 2.1% 2988 3051 63 2.1% 3248 3316 68 2.1%
11350 2723 2780 57 2.1% 2996 3058 63 2.1% 3256 3324 68 2.1%
11400 2731 2787 56 2.1% 3004 3066 62 2.1% 3265 3333 67 2.1%
11450 2739 2794 55 2.0% 3013 3073 60 2.0% 3275 3341 66 2.0%
11500 2747 2801 53 1.9% 3022 3081 59 1.9% 3285 3349 64 1.9%
11550 2756 2808 52 1.9% 3031 3088 57 1.9% 3295 3357 62 1.9%
11600 2764 2814 50 1.8% 3040 3096 56 1.8% 3305 3365 60 1.8%
11650 2772 2821 49 1.8% 3049 3103 54 1.8% 3315 3373 59 1.8%
11700 2780 2828 48 1.7% 3058 3111 52 1.7% 3324 3381 57 1.7%
11750 2788 2835 46 1.7% 3067 3118 51 1.7% 3334 3389 55 1.7%
11800 2797 2841 45 1.6% 3076 3126 49 1.6% 3344 3398 53 1.6%
11850 2805 2848 43 1.5% 3085 3133 48 1.5% 3354 3406 52 1.5%
11900 2813 2855 42 1.5% 3094 3141 46 1.5% 3364 3414 50 1.5%
11950 2821 2863 41 1.5% 3104 3149 45 1.5% 3374 3423 49 1.5%
12000 2830 2871 41 1.5% 3113 3158 45 1.5% 3383 3433 49 1.5%
12050 2838 2879 41 1.5% 3122 3167 45 1.5% 3393 3442 49 1.5%
12100 2846 2887 41 1.4% 3131 3176 45 1.4% 3403 3452 49 1.4%
12150 2854 2895 41 1.4% 3140 3185 45 1.4% 3413 3462 49 1.4%
12200 2863 2904 41 1.4% 3149 3194 45 1.4% 3423 3472 49 1.4%
12250 2871 2912 41 1.4% 3158 3203 45 1.4% 3433 3482 49 1.4%
12300 2879 2920 41 1.4% 3167 3212 45 1.4% 3442 3492 49 1.4%
12350 2887 2928 41 1.4% 3176 3221 45 1.4% 3452 3501 49 1.4%
12400 2895 2937 41 1.4% 3185 3230 45 1.4% 3462 3511 49 1.4%
12450 2904 2945 41 1.4% 3194 3239 45 1.4% 3472 3521 49 1.4%
12500 2912 2953 41 1.4% 3203 3248 45 1.4% 3482 3531 49 1.4%
12550 2920 2961 41 1.4% 3212 3257 45 1.4% 3492 3541 49 1.4%
12600 2928 2969 41 1.4% 3221 3266 45 1.4% 3501 3551 49 1.4%
12650 2937 2978 41 1.4% 3230 3275 45 1.4% 3511 3560 49 1.4%
12700 2945 2986 41 1.4% 3239 3285 45 1.4% 3521 3570 49 1.4%
12750 2953 2994 41 1.4% 3248 3294 45 1.4% 3531 3580 49 1.4%
12800 2961 3002 41 1.4% 3257 3303 45 1.4% 3541 3590 49 1.4%
12850 2969 3011 41 1.4% 3266 3312 45 1.4% 3551 3600 49 1.4%
12900 2978 3019 41 1.4% 3275 3321 45 1.4% 3560 3610 49 1.4%
12950 2986 3027 41 1.4% 3285 3330 45 1.4% 3570 3619 49 1.4%
13000 2994 3035 41 1.4% 3294 3339 45 1.4% 3580 3629 49 1.4%
13050 3002 3044 41 1.4% 3303 3348 45 1.4% 3590 3639 49 1.4%
13100 3011 3052 41 1.4% 3312 3357 45 1.4% 3600 3649 49 1.4%
13150 3019 3060 41 1.4% 3321 3366 45 1.4% 3610 3659 49 1.4%
13200 3027 3068 41 1.4% 3330 3375 45 1.4% 3619 3669 49 1.4%
13250 3035 3076 41 1.4% 3339 3384 45 1.4% 3629 3678 49 1.4%
13300 3044 3085 41 1.4% 3348 3393 45 1.4% 3639 3688 49 1.4%
13350 3050 3093 43 1.4% 3355 3402 48 1.4% 3646 3698 52 1.4%
13400 3055 3101 46 1.5% 3361 3411 50 1.5% 3653 3708 55 1.5%

$ % $ % $ %
Difference
Existing Updated
Difference
Child Support Schedule Comparisons
Combined
Adjusted
Net Income
Four Children Five Children Six Children
Existing Updated
Difference
Existing Updated
13450 3061 3109 48 1.6% 3367 3420 53 1.6% 3660 3718 58 1.6%
13500 3067 3118 51 1.6% 3374 3429 56 1.6% 3667 3728 60 1.6%
13550 3073 3126 53 1.7% 3380 3438 58 1.7% 3674 3737 63 1.7%
13600 3079 3134 55 1.8% 3386 3447 61 1.8% 3681 3747 66 1.8%
13650 3084 3142 58 1.9% 3393 3456 64 1.9% 3688 3757 69 1.9%
13700 3090 3150 60 1.9% 3399 3465 66 1.9% 3695 3767 72 1.9%
13750 3096 3159 63 2.0% 3406 3475 69 2.0% 3702 3777 75 2.0%
13800 3102 3167 65 2.1% 3412 3484 72 2.1% 3709 3787 78 2.1%
13850 3108 3175 67 2.2% 3418 3493 74 2.2% 3716 3797 81 2.2%
13900 3113 3183 70 2.2% 3425 3502 77 2.2% 3723 3806 84 2.2%
13950 3119 3192 72 2.3% 3431 3511 80 2.3% 3730 3816 86 2.3%
14000 3125 3198 72 2.3% 3438 3517 80 2.3% 3737 3823 87 2.3%
14050 3131 3203 72 2.3% 3444 3524 80 2.3% 3744 3830 87 2.3%
14100 3137 3209 72 2.3% 3450 3530 80 2.3% 3751 3837 87 2.3%
14150 3143 3215 72 2.3% 3457 3536 80 2.3% 3758 3844 87 2.3%
14200 3148 3221 72 2.3% 3463 3543 80 2.3% 3764 3851 87 2.3%
14250 3154 3227 72 2.3% 3470 3549 80 2.3% 3771 3858 87 2.3%
14300 3160 3232 72 2.3% 3476 3556 80 2.3% 3778 3865 87 2.3%
14350 3166 3238 72 2.3% 3482 3562 80 2.3% 3785 3872 87 2.3%
14400 3172 3244 72 2.3% 3489 3568 80 2.3% 3792 3879 87 2.3%
14450 3177 3250 72 2.3% 3495 3575 80 2.3% 3799 3886 87 2.3%
14500 3183 3256 72 2.3% 3502 3581 80 2.3% 3806 3893 87 2.3%
14550 3189 3261 72 2.3% 3508 3588 80 2.3% 3813 3900 87 2.3%
14600 3195 3267 72 2.3% 3514 3594 80 2.3% 3820 3907 87 2.3%
14650 3201 3273 72 2.3% 3521 3600 80 2.3% 3827 3914 87 2.3%
14700 3206 3279 72 2.3% 3527 3607 80 2.3% 3834 3921 87 2.3%
14750 3212 3285 72 2.3% 3533 3613 80 2.3% 3841 3927 87 2.3%
14800 3218 3290 72 2.3% 3540 3620 80 2.3% 3848 3934 87 2.3%
14850 3224 3296 72 2.2% 3546 3626 80 2.2% 3855 3941 87 2.2%
14900 3230 3302 72 2.2% 3553 3632 80 2.2% 3862 3948 87 2.2%
14950 3235 3308 72 2.2% 3559 3639 80 2.2% 3869 3955 87 2.2%
15000 3241 3314 72 2.2% 3565 3645 80 2.2% 3876 3962 87 2.2%
15050 3247 3320 72 2.2% 3572 3651 80 2.2% 3883 3969 87 2.2%
15100 3253 3325 72 2.2% 3578 3658 80 2.2% 3890 3976 87 2.2%
15150 3259 3331 72 2.2% 3585 3664 80 2.2% 3896 3983 87 2.2%
15200 3265 3337 72 2.2% 3591 3671 80 2.2% 3903 3990 87 2.2%
15250 3270 3343 72 2.2% 3597 3677 80 2.2% 3910 3997 87 2.2%
15300 3276 3349 72 2.2% 3604 3683 80 2.2% 3917 4004 87 2.2%
15350 3282 3354 72 2.2% 3610 3690 80 2.2% 3924 4011 87 2.2%
15400 3288 3360 72 2.2% 3617 3696 80 2.2% 3931 4018 87 2.2%
15450 3294 3366 72 2.2% 3623 3703 80 2.2% 3938 4025 87 2.2%
15500 3299 3372 72 2.2% 3629 3709 80 2.2% 3945 4032 87 2.2%
15550 3305 3378 72 2.2% 3636 3715 80 2.2% 3952 4039 87 2.2%
15600 3311 3383 72 2.2% 3642 3722 80 2.2% 3959 4046 87 2.2%
15650 3317 3389 72 2.2% 3649 3728 80 2.2% 3966 4053 87 2.2%
15700 3323 3395 72 2.2% 3655 3735 80 2.2% 3973 4059 87 2.2%
15750 3328 3401 72 2.2% 3661 3741 80 2.2% 3980 4066 87 2.2%
15800 3334 3407 72 2.2% 3668 3747 80 2.2% 3987 4073 87 2.2%
15850 3340 3412 72 2.2% 3674 3754 80 2.2% 3994 4080 87 2.2%
15900 3346 3418 72 2.2% 3680 3760 80 2.2% 4001 4087 87 2.2%
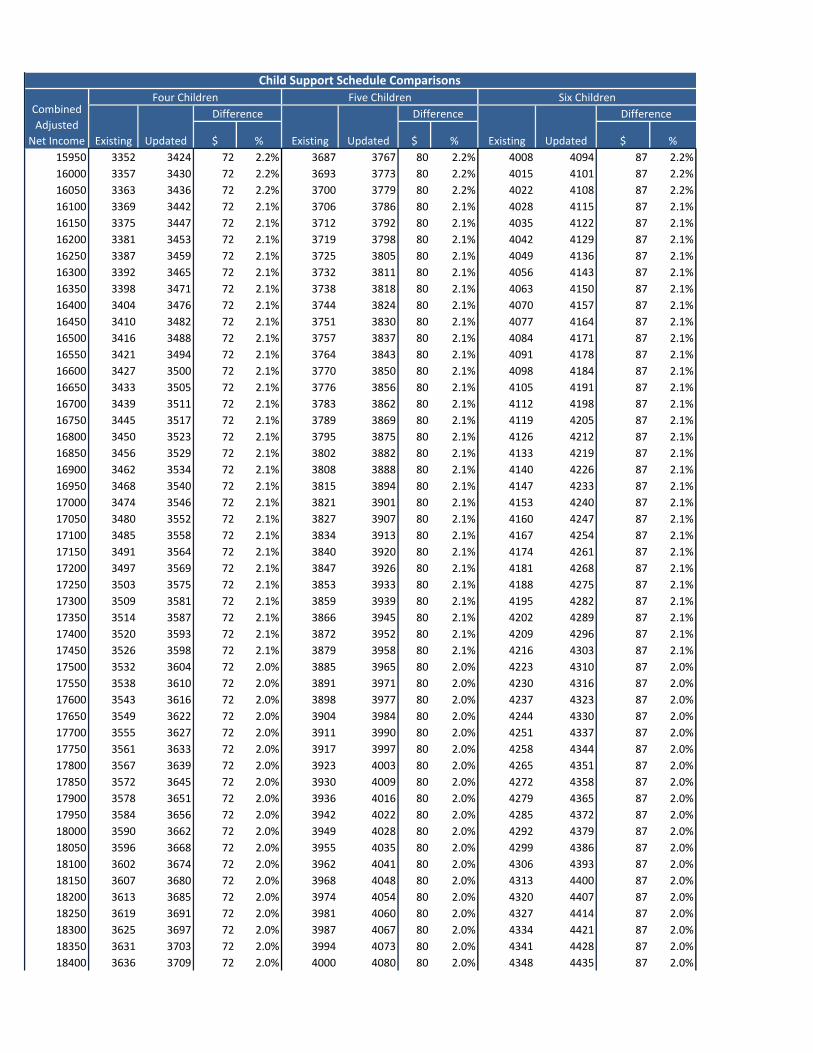
$ % $ % $ %
Difference
Existing Updated
Difference
Child Support Schedule Comparisons
Combined
Adjusted
Net Income
Four Children Five Children Six Children
Existing Updated
Difference
Existing Updated
15950 3352 3424 72 2.2% 3687 3767 80 2.2% 4008 4094 87 2.2%
16000 3357 3430 72 2.2% 3693 3773 80 2.2% 4015 4101 87 2.2%
16050 3363 3436 72 2.2% 3700 3779 80 2.2% 4022 4108 87 2.2%
16100 3369 3442 72 2.1% 3706 3786 80 2.1% 4028 4115 87 2.1%
16150 3375 3447 72 2.1% 3712 3792 80 2.1% 4035 4122 87 2.1%
16200 3381 3453 72 2.1% 3719 3798 80 2.1% 4042 4129 87 2.1%
16250 3387 3459 72 2.1% 3725 3805 80 2.1% 4049 4136 87 2.1%
16300 3392 3465 72 2.1% 3732 3811 80 2.1% 4056 4143 87 2.1%
16350 3398 3471 72 2.1% 3738 3818 80 2.1% 4063 4150 87 2.1%
16400 3404 3476 72 2.1% 3744 3824 80 2.1% 4070 4157 87 2.1%
16450 3410 3482 72 2.1% 3751 3830 80 2.1% 4077 4164 87 2.1%
16500 3416 3488 72 2.1% 3757 3837 80 2.1% 4084 4171 87 2.1%
16550 3421 3494 72 2.1% 3764 3843 80 2.1% 4091 4178 87 2.1%
16600 3427 3500 72 2.1% 3770 3850 80 2.1% 4098 4184 87 2.1%
16650 3433 3505 72 2.1% 3776 3856 80 2.1% 4105 4191 87 2.1%
16700 3439 3511 72 2.1% 3783 3862 80 2.1% 4112 4198 87 2.1%
16750 3445 3517 72 2.1% 3789 3869 80 2.1% 4119 4205 87 2.1%
16800 3450 3523 72 2.1% 3795 3875 80 2.1% 4126 4212 87 2.1%
16850 3456 3529 72 2.1% 3802 3882 80 2.1% 4133 4219 87 2.1%
16900 3462 3534 72 2.1% 3808 3888 80 2.1% 4140 4226 87 2.1%
16950 3468 3540 72 2.1% 3815 3894 80 2.1% 4147 4233 87 2.1%
17000 3474 3546 72 2.1% 3821 3901 80 2.1% 4153 4240 87 2.1%
17050 3480 3552 72 2.1% 3827 3907 80 2.1% 4160 4247 87 2.1%
17100 3485 3558 72 2.1% 3834 3913 80 2.1% 4167 4254 87 2.1%
17150 3491 3564 72 2.1% 3840 3920 80 2.1% 4174 4261 87 2.1%
17200 3497 3569 72 2.1% 3847 3926 80 2.1% 4181 4268 87 2.1%
17250 3503 3575 72 2.1% 3853 3933 80 2.1% 4188 4275 87 2.1%
17300 3509 3581 72 2.1% 3859 3939 80 2.1% 4195 4282 87 2.1%
17350 3514 3587 72 2.1% 3866 3945 80 2.1% 4202 4289 87 2.1%
17400 3520 3593 72 2.1% 3872 3952 80 2.1% 4209 4296 87 2.1%
17450 3526 3598 72 2.1% 3879 3958 80 2.1% 4216 4303 87 2.1%
17500 3532 3604 72 2.0% 3885 3965 80 2.0% 4223 4310 87 2.0%
17550 3538 3610 72 2.0% 3891 3971 80 2.0% 4230 4316 87 2.0%
17600 3543 3616 72 2.0% 3898 3977 80 2.0% 4237 4323 87 2.0%
17650 3549 3622 72 2.0% 3904 3984 80 2.0% 4244 4330 87 2.0%
17700 3555 3627 72 2.0% 3911 3990 80 2.0% 4251 4337 87 2.0%
17750 3561 3633 72 2.0% 3917 3997 80 2.0% 4258 4344 87 2.0%
17800 3567 3639 72 2.0% 3923 4003 80 2.0% 4265 4351 87 2.0%
17850 3572 3645 72 2.0% 3930 4009 80 2.0% 4272 4358 87 2.0%
17900 3578 3651 72 2.0% 3936 4016 80 2.0% 4279 4365 87 2.0%
17950 3584 3656 72 2.0% 3942 4022 80 2.0% 4285 4372 87 2.0%
18000 3590 3662 72 2.0% 3949 4028 80 2.0% 4292 4379 87 2.0%
18050 3596 3668 72 2.0% 3955 4035 80 2.0% 4299 4386 87 2.0%
18100 3602 3674 72 2.0% 3962 4041 80 2.0% 4306 4393 87 2.0%
18150 3607 3680 72 2.0% 3968 4048 80 2.0% 4313 4400 87 2.0%
18200 3613 3685 72 2.0% 3974 4054 80 2.0% 4320 4407 87 2.0%
18250 3619 3691 72 2.0% 3981 4060 80 2.0% 4327 4414 87 2.0%
18300 3625 3697 72 2.0% 3987 4067 80 2.0% 4334 4421 87 2.0%
18350 3631 3703 72 2.0% 3994 4073 80 2.0% 4341 4428 87 2.0%
18400 3636 3709 72 2.0% 4000 4080 80 2.0% 4348 4435 87 2.0%

$ % $ % $ %
Difference
Existing Updated
Difference
Child Support Schedule Comparisons
Combined
Adjusted
Net Income
Four Children Five Children Six Children
Existing Updated
Difference
Existing Updated
18450 3642 3715 72 2.0% 4006 4086 80 2.0% 4355 4441 87 2.0%
18500 3648 3720 72 2.0% 4013 4092 80 2.0% 4362 4448 87 2.0%
18550 3654 3726 72 2.0% 4019 4099 80 2.0% 4369 4455 87 2.0%
18600 3660 3732 72 2.0% 4026 4105 80 2.0% 4376 4462 87 2.0%
18650 3665 3738 72 2.0% 4032 4112 80 2.0% 4383 4469 87 2.0%
18700 3671 3744 72 2.0% 4038 4118 80 2.0% 4390 4476 87 2.0%
18750 3677 3749 72 2.0% 4045 4124 80 2.0% 4397 4483 87 2.0%
18800 3683 3755 72 2.0% 4051 4131 80 2.0% 4404 4490 87 2.0%
18850 3689 3761 72 2.0% 4058 4137 80 2.0% 4411 4497 87 2.0%
18900 3694 3767 72 2.0% 4064 4143 80 2.0% 4417 4504 87 2.0%
18950 3700 3773 72 2.0% 4070 4150 80 2.0% 4424 4511 87 2.0%
19000 3706 3778 72 2.0% 4077 4156 80 2.0% 4431 4518 87 2.0%
19050 3712 3784 72 1.9% 4083 4163 80 1.9% 4438 4525 87 1.9%
19100 3718 3790 72 1.9% 4089 4169 80 1.9% 4445 4532 87 1.9%
19150 3724 3796 72 1.9% 4096 4175 80 1.9% 4452 4539 86 1.9%
19200 3729 3802 72 1.9% 4102 4182 80 1.9% 4459 4546 86 1.9%
19250 3735 3807 72 1.9% 4109 4188 80 1.9% 4466 4553 86 1.9%
19300 3741 3813 72 1.9% 4115 4195 80 1.9% 4473 4560 86 1.9%
19350 3747 3819 72 1.9% 4121 4201 80 1.9% 4480 4566 86 1.9%
19400 3753 3825 72 1.9% 4128 4207 80 1.9% 4487 4573 86 1.9%
19450 3758 3831 72 1.9% 4134 4214 80 1.9% 4494 4580 86 1.9%
19500 3764 3837 72 1.9% 4141 4220 80 1.9% 4501 4587 86 1.9%
19550 3770 3842 72 1.9% 4147 4227 80 1.9% 4508 4594 86 1.9%
19600 3776 3848 72 1.9% 4153 4233 80 1.9% 4515 4601 86 1.9%
19650 3782 3854 72 1.9% 4160 4239 80 1.9% 4522 4608 86 1.9%
19700 3787 3860 72 1.9% 4166 4246 80 1.9% 4529 4615 86 1.9%
19750 3793 3866 72 1.9% 4173 4252 80 1.9% 4536 4622 86 1.9%
19800 3799 3871 72 1.9% 4179 4259 80 1.9% 4543 4629 86 1.9%
19850 3805 3877 72 1.9% 4185 4265 80 1.9% 4549 4636 86 1.9%
19900 3811 3883 72 1.9% 4192 4271 80 1.9% 4556 4643 86 1.9%
19950 3816 3889 72 1.9% 4198 4278 80 1.9% 4563 4650 86 1.9%
20000 3822 3895 72 1.9% 4205 4284 80 1.9% 4570 4657 86 1.9%
20050 3828 3900 72 1.9% 4211 4290 80 1.9% 4577 4664 86 1.9%
20100 3834 3906 72 1.9% 4217 4297 80 1.9% 4584 4671 86 1.9%
20150 3840 3912 72 1.9% 4224 4303 80 1.9% 4591 4678 86 1.9%
20200 3846 3918 72 1.9% 4230 4310 80 1.9% 4598 4685 86 1.9%
20250 3851 3924 72 1.9% 4236 4316 80 1.9% 4605 4692 86 1.9%
20300 3857 3929 72 1.9% 4243 4322 80 1.9% 4612 4698 86 1.9%
20350 3863 3935 72 1.9% 4249 4329 80 1.9% 4619 4705 86 1.9%
20400 3869 3941 72 1.9% 4256 4335 80 1.9% 4626 4712 86 1.9%
20450 3875 3947 72 1.9% 4262 4342 80 1.9% 4633 4719 86 1.9%
20500 3880 3953 72 1.9% 4268 4348 80 1.9% 4640 4726 86 1.9%
20550 3886 3959 72 1.9% 4275 4354 80 1.9% 4647 4733 86 1.9%
20600 3892 3964 72 1.9% 4281 4361 80 1.9% 4654 4740 86 1.9%
20650 3898 3970 72 1.9% 4288 4367 80 1.9% 4661 4747 86 1.9%
20700 3904 3976 72 1.9% 4294 4374 80 1.9% 4668 4754 86 1.9%
20750 3909 3982 72 1.8% 4300 4380 80 1.8% 4675 4761 86 1.8%
20800 3915 3988 72 1.8% 4307 4386 80 1.8% 4681 4768 86 1.8%
20850 3921 3993 72 1.8% 4313 4393 80 1.8% 4688 4775 86 1.8%
20900 3927 3999 72 1.8% 4320 4399 80 1.8% 4695 4782 86 1.8%
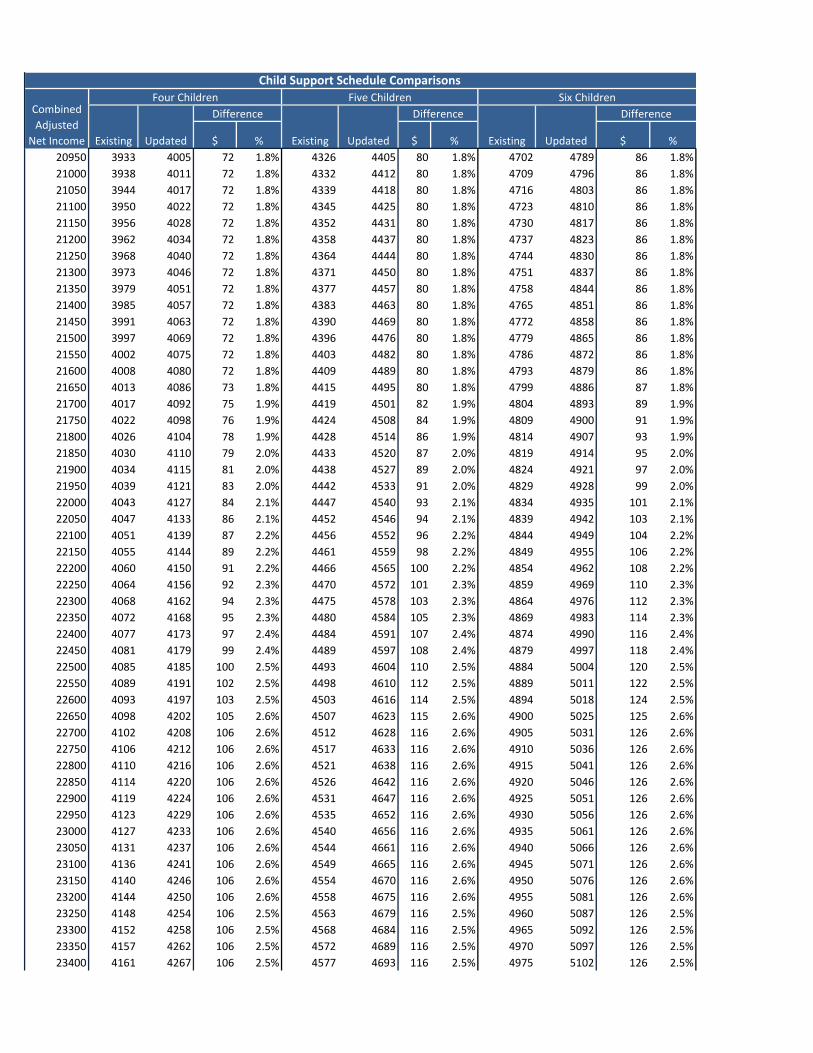
$ % $ % $ %
Difference
Existing Updated
Difference
Child Support Schedule Comparisons
Combined
Adjusted
Net Income
Four Children Five Children Six Children
Existing Updated
Difference
Existing Updated
20950 3933 4005 72 1.8% 4326 4405 80 1.8% 4702 4789 86 1.8%
21000 3938 4011 72 1.8% 4332 4412 80 1.8% 4709 4796 86 1.8%
21050 3944 4017 72 1.8% 4339 4418 80 1.8% 4716 4803 86 1.8%
21100 3950 4022 72 1.8% 4345 4425 80 1.8% 4723 4810 86 1.8%
21150 3956 4028 72 1.8% 4352 4431 80 1.8% 4730 4817 86 1.8%
21200 3962 4034 72 1.8% 4358 4437 80 1.8% 4737 4823 86 1.8%
21250 3968 4040 72 1.8% 4364 4444 80 1.8% 4744 4830 86 1.8%
21300 3973 4046 72 1.8% 4371 4450 80 1.8% 4751 4837 86 1.8%
21350 3979 4051 72 1.8% 4377 4457 80 1.8% 4758 4844 86 1.8%
21400 3985 4057 72 1.8% 4383 4463 80 1.8% 4765 4851 86 1.8%
21450 3991 4063 72 1.8% 4390 4469 80 1.8% 4772 4858 86 1.8%
21500 3997 4069 72 1.8% 4396 4476 80 1.8% 4779 4865 86 1.8%
21550 4002 4075 72 1.8% 4403 4482 80 1.8% 4786 4872 86 1.8%
21600 4008 4080 72 1.8% 4409 4489 80 1.8% 4793 4879 86 1.8%
21650 4013 4086 73 1.8% 4415 4495 80 1.8% 4799 4886 87 1.8%
21700 4017 4092 75 1.9% 4419 4501 82 1.9% 4804 4893 89 1.9%
21750 4022 4098 76 1.9% 4424 4508 84 1.9% 4809 4900 91 1.9%
21800 4026 4104 78 1.9% 4428 4514 86 1.9% 4814 4907 93 1.9%
21850 4030 4110 79 2.0% 4433 4520 87 2.0% 4819 4914 95 2.0%
21900 4034 4115 81 2.0% 4438 4527 89 2.0% 4824 4921 97 2.0%
21950 4039 4121 83 2.0% 4442 4533 91 2.0% 4829 4928 99 2.0%
22000 4043 4127 84 2.1% 4447 4540 93 2.1% 4834 4935 101 2.1%
22050 4047 4133 86 2.1% 4452 4546 94 2.1% 4839 4942 103 2.1%
22100 4051 4139 87 2.2% 4456 4552 96 2.2% 4844 4949 104 2.2%
22150 4055 4144 89 2.2% 4461 4559 98 2.2% 4849 4955 106 2.2%
22200 4060 4150 91 2.2% 4466 4565 100 2.2% 4854 4962 108 2.2%
22250 4064 4156 92 2.3% 4470 4572 101 2.3% 4859 4969 110 2.3%
22300 4068 4162 94 2.3% 4475 4578 103 2.3% 4864 4976 112 2.3%
22350 4072 4168 95 2.3% 4480 4584 105 2.3% 4869 4983 114 2.3%
22400 4077 4173 97 2.4% 4484 4591 107 2.4% 4874 4990 116 2.4%
22450 4081 4179 99 2.4% 4489 4597 108 2.4% 4879 4997 118 2.4%
22500 4085 4185 100 2.5% 4493 4604 110 2.5% 4884 5004 120 2.5%
22550 4089 4191 102 2.5% 4498 4610 112 2.5% 4889 5011 122 2.5%
22600 4093 4197 103 2.5% 4503 4616 114 2.5% 4894 5018 124 2.5%
22650 4098 4202 105 2.6% 4507 4623 115 2.6% 4900 5025 125 2.6%
22700 4102 4208 106 2.6% 4512 4628 116 2.6% 4905 5031 126 2.6%
22750 4106 4212 106 2.6% 4517 4633 116 2.6% 4910 5036 126 2.6%
22800 4110 4216 106 2.6% 4521 4638 116 2.6% 4915 5041 126 2.6%
22850 4114 4220 106 2.6% 4526 4642 116 2.6% 4920 5046 126 2.6%
22900 4119 4224 106 2.6% 4531 4647 116 2.6% 4925 5051 126 2.6%
22950 4123 4229 106 2.6% 4535 4652 116 2.6% 4930 5056 126 2.6%
23000 4127 4233 106 2.6% 4540 4656 116 2.6% 4935 5061 126 2.6%
23050 4131 4237 106 2.6% 4544 4661 116 2.6% 4940 5066 126 2.6%
23100 4136 4241 106 2.6% 4549 4665 116 2.6% 4945 5071 126 2.6%
23150 4140 4246 106 2.6% 4554 4670 116 2.6% 4950 5076 126 2.6%
23200 4144 4250 106 2.6% 4558 4675 116 2.6% 4955 5081 126 2.6%
23250 4148 4254 106 2.5% 4563 4679 116 2.5% 4960 5087 126 2.5%
23300 4152 4258 106 2.5% 4568 4684 116 2.5% 4965 5092 126 2.5%
23350 4157 4262 106 2.5% 4572 4689 116 2.5% 4970 5097 126 2.5%
23400 4161 4267 106 2.5% 4577 4693 116 2.5% 4975 5102 126 2.5%

$ % $ % $ %
Difference
Existing Updated
Difference
Child Support Schedule Comparisons
Combined
Adjusted
Net Income
Four Children Five Children Six Children
Existing Updated
Difference
Existing Updated
23450 4165 4271 106 2.5% 4582 4698 116 2.5% 4980 5107 126 2.5%
23500 4169 4275 106 2.5% 4586 4703 116 2.5% 4985 5112 126 2.5%
23550 4174 4279 106 2.5% 4591 4707 116 2.5% 4990 5117 126 2.5%
23600 4178 4284 106 2.5% 4596 4712 116 2.5% 4995 5122 126 2.5%
23650 4182 4288 106 2.5% 4600 4717 116 2.5% 5000 5127 126 2.5%
23700 4186 4292 106 2.5% 4605 4721 116 2.5% 5005 5132 126 2.5%
23750 4190 4296 106 2.5% 4609 4726 116 2.5% 5010 5137 126 2.5%
23800 4195 4300 106 2.5% 4614 4730 116 2.5% 5016 5142 126 2.5%
23850 4199 4305 106 2.5% 4619 4735 116 2.5% 5021 5147 126 2.5%
23900 4203 4309 106 2.5% 4623 4740 116 2.5% 5026 5152 126 2.5%
23950 4207 4313 106 2.5% 4628 4744 116 2.5% 5031 5157 126 2.5%
24000 4212 4317 106 2.5% 4633 4749 116 2.5% 5036 5162 126 2.5%
24050 4216 4322 106 2.5% 4637 4754 116 2.5% 5041 5167 126 2.5%
24100 4220 4326 106 2.5% 4642 4758 116 2.5% 5046 5172 126 2.5%
24150 4224 4330 106 2.5% 4647 4763 116 2.5% 5051 5177 126 2.5%
24200 4228 4334 106 2.5% 4651 4768 116 2.5% 5056 5182 126 2.5%
24250 4233 4338 106 2.5% 4656 4772 116 2.5% 5061 5187 126 2.5%
24300 4237 4343 106 2.5% 4661 4777 116 2.5% 5066 5192 126 2.5%
24350 4241 4347 106 2.5% 4665 4782 116 2.5% 5071 5198 126 2.5%
24400 4245 4351 106 2.5% 4670 4786 116 2.5% 5076 5203 126 2.5%
24450 4250 4355 106 2.5% 4674 4791 116 2.5% 5081 5208 126 2.5%
24500 4254 4359 106 2.5% 4679 4795 116 2.5% 5086 5213 126 2.5%
24550 4258 4364 106 2.5% 4684 4800 116 2.5% 5091 5218 126 2.5%
24600 4262 4368 106 2.5% 4688 4805 116 2.5% 5096 5223 126 2.5%
24650 4266 4372 106 2.5% 4693 4809 116 2.5% 5101 5228 126 2.5%
24700 4271 4376 106 2.5% 4698 4814 116 2.5% 5106 5233 126 2.5%
24750 4275 4381 106 2.5% 4702 4819 116 2.5% 5111 5238 126 2.5%
24800 4279 4385 106 2.5% 4707 4823 116 2.5% 5116 5243 126 2.5%
24850 4283 4389 106 2.5% 4712 4828 116 2.5% 5121 5248 126 2.5%
24900 4287 4393 106 2.5% 4716 4833 116 2.5% 5127 5253 126 2.5%
24950 4292 4397 106 2.5% 4721 4837 116 2.5% 5132 5258 126 2.5%
25000 4296 4402 106 2.5% 4726 4842 116 2.5% 5137 5263 126 2.5%
25050 4300 4406 106 2.5% 4730 4846 116 2.5% 5142 5268 126 2.5%
25100 4304 4410 106 2.5% 4735 4851 116 2.5% 5147 5273 126 2.5%
25150 4309 4414 106 2.5% 4739 4856 116 2.5% 5152 5278 126 2.5%
25200 4313 4419 106 2.5% 4744 4860 116 2.5% 5157 5283 126 2.5%
25250 4317 4423 106 2.4% 4749 4865 116 2.4% 5162 5288 126 2.4%
25300 4321 4427 106 2.4% 4753 4870 116 2.4% 5167 5293 126 2.4%
25350 4325 4431 106 2.4% 4758 4874 116 2.4% 5172 5298 126 2.4%
25400 4330 4435 106 2.4% 4763 4879 116 2.4% 5177 5303 126 2.4%
25450 4334 4440 106 2.4% 4767 4884 116 2.4% 5182 5308 126 2.4%
25500 4338 4444 106 2.4% 4772 4888 116 2.4% 5187 5314 126 2.4%
25550 4342 4448 106 2.4% 4777 4893 116 2.4% 5192 5319 126 2.4%
25600 4347 4452 106 2.4% 4781 4898 116 2.4% 5197 5324 126 2.4%
25650 4351 4457 106 2.4% 4786 4902 116 2.4% 5202 5329 126 2.4%
25700 4355 4461 106 2.4% 4790 4907 116 2.4% 5207 5334 126 2.4%
25750 4359 4465 106 2.4% 4795 4911 116 2.4% 5212 5339 126 2.4%
25800 4363 4469 106 2.4% 4800 4916 116 2.4% 5217 5344 126 2.4%
25850 4368 4473 106 2.4% 4804 4921 116 2.4% 5222 5349 126 2.4%
25900 4372 4478 106 2.4% 4809 4925 116 2.4% 5227 5354 126 2.4%
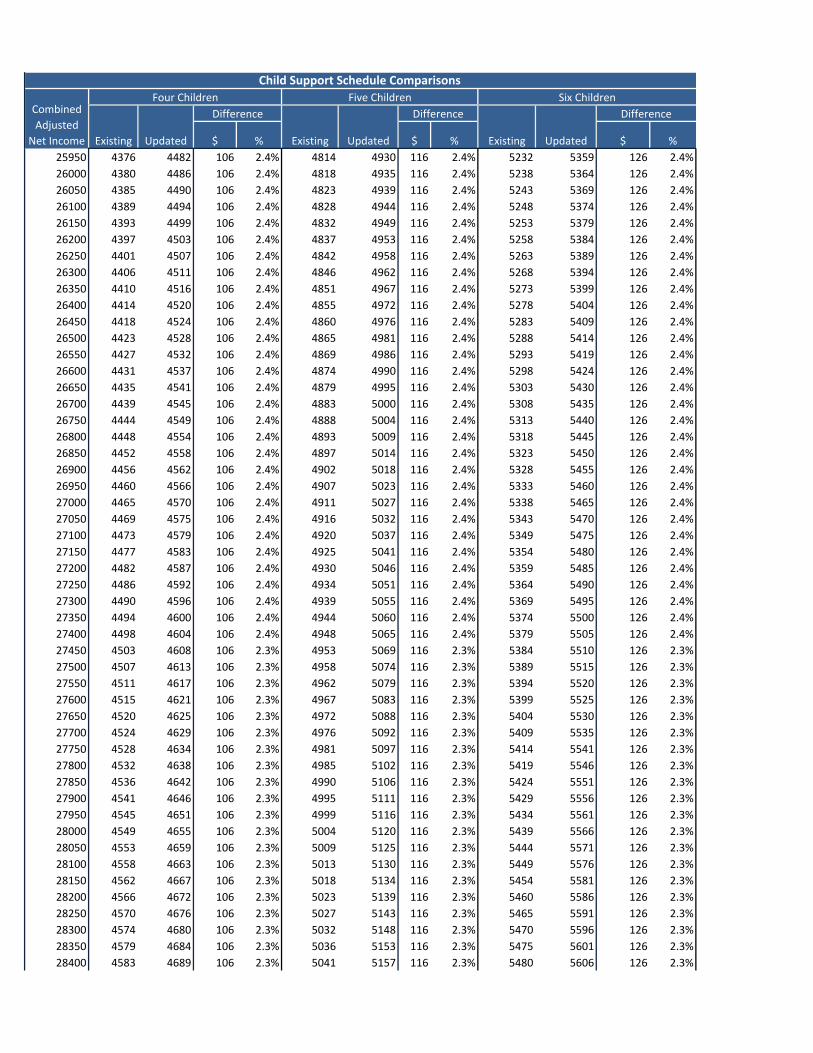
$ % $ % $ %
Difference
Existing Updated
Difference
Child Support Schedule Comparisons
Combined
Adjusted
Net Income
Four Children Five Children Six Children
Existing Updated
Difference
Existing Updated
25950 4376 4482 106 2.4% 4814 4930 116 2.4% 5232 5359 126 2.4%
26000 4380 4486 106 2.4% 4818 4935 116 2.4% 5238 5364 126 2.4%
26050 4385 4490 106 2.4% 4823 4939 116 2.4% 5243 5369 126 2.4%
26100 4389 4494 106 2.4% 4828 4944 116 2.4% 5248 5374 126 2.4%
26150 4393 4499 106 2.4% 4832 4949 116 2.4% 5253 5379 126 2.4%
26200 4397 4503 106 2.4% 4837 4953 116 2.4% 5258 5384 126 2.4%
26250 4401 4507 106 2.4% 4842 4958 116 2.4% 5263 5389 126 2.4%
26300 4406 4511 106 2.4% 4846 4962 116 2.4% 5268 5394 126 2.4%
26350 4410 4516 106 2.4% 4851 4967 116 2.4% 5273 5399 126 2.4%
26400 4414 4520 106 2.4% 4855 4972 116 2.4% 5278 5404 126 2.4%
26450 4418 4524 106 2.4% 4860 4976 116 2.4% 5283 5409 126 2.4%
26500 4423 4528 106 2.4% 4865 4981 116 2.4% 5288 5414 126 2.4%
26550 4427 4532 106 2.4% 4869 4986 116 2.4% 5293 5419 126 2.4%
26600 4431 4537 106 2.4% 4874 4990 116 2.4% 5298 5424 126 2.4%
26650 4435 4541 106 2.4% 4879 4995 116 2.4% 5303 5430 126 2.4%
26700 4439 4545 106 2.4% 4883 5000 116 2.4% 5308 5435 126 2.4%
26750 4444 4549 106 2.4% 4888 5004 116 2.4% 5313 5440 126 2.4%
26800 4448 4554 106 2.4% 4893 5009 116 2.4% 5318 5445 126 2.4%
26850 4452 4558 106 2.4% 4897 5014 116 2.4% 5323 5450 126 2.4%
26900 4456 4562 106 2.4% 4902 5018 116 2.4% 5328 5455 126 2.4%
26950 4460 4566 106 2.4% 4907 5023 116 2.4% 5333 5460 126 2.4%
27000 4465 4570 106 2.4% 4911 5027 116 2.4% 5338 5465 126 2.4%
27050 4469 4575 106 2.4% 4916 5032 116 2.4% 5343 5470 126 2.4%
27100 4473 4579 106 2.4% 4920 5037 116 2.4% 5349 5475 126 2.4%
27150 4477 4583 106 2.4% 4925 5041 116 2.4% 5354 5480 126 2.4%
27200 4482 4587 106 2.4% 4930 5046 116 2.4% 5359 5485 126 2.4%
27250 4486 4592 106 2.4% 4934 5051 116 2.4% 5364 5490 126 2.4%
27300 4490 4596 106 2.4% 4939 5055 116 2.4% 5369 5495 126 2.4%
27350 4494 4600 106 2.4% 4944 5060 116 2.4% 5374 5500 126 2.4%
27400 4498 4604 106 2.4% 4948 5065 116 2.4% 5379 5505 126 2.4%
27450 4503 4608 106 2.3% 4953 5069 116 2.3% 5384 5510 126 2.3%
27500 4507 4613 106 2.3% 4958 5074 116 2.3% 5389 5515 126 2.3%
27550 4511 4617 106 2.3% 4962 5079 116 2.3% 5394 5520 126 2.3%
27600 4515 4621 106 2.3% 4967 5083 116 2.3% 5399 5525 126 2.3%
27650 4520 4625 106 2.3% 4972 5088 116 2.3% 5404 5530 126 2.3%
27700 4524 4629 106 2.3% 4976 5092 116 2.3% 5409 5535 126 2.3%
27750 4528 4634 106 2.3% 4981 5097 116 2.3% 5414 5541 126 2.3%
27800 4532 4638 106 2.3% 4985 5102 116 2.3% 5419 5546 126 2.3%
27850 4536 4642 106 2.3% 4990 5106 116 2.3% 5424 5551 126 2.3%
27900 4541 4646 106 2.3% 4995 5111 116 2.3% 5429 5556 126 2.3%
27950 4545 4651 106 2.3% 4999 5116 116 2.3% 5434 5561 126 2.3%
28000 4549 4655 106 2.3% 5004 5120 116 2.3% 5439 5566 126 2.3%
28050 4553 4659 106 2.3% 5009 5125 116 2.3% 5444 5571 126 2.3%
28100 4558 4663 106 2.3% 5013 5130 116 2.3% 5449 5576 126 2.3%
28150 4562 4667 106 2.3% 5018 5134 116 2.3% 5454 5581 126 2.3%
28200 4566 4672 106 2.3% 5023 5139 116 2.3% 5460 5586 126 2.3%
28250 4570 4676 106 2.3% 5027 5143 116 2.3% 5465 5591 126 2.3%
28300 4574 4680 106 2.3% 5032 5148 116 2.3% 5470 5596 126 2.3%
28350 4579 4684 106 2.3% 5036 5153 116 2.3% 5475 5601 126 2.3%
28400 4583 4689 106 2.3% 5041 5157 116 2.3% 5480 5606 126 2.3%

$ % $ % $ %
Difference
Existing Updated
Difference
Child Support Schedule Comparisons
Combined
Adjusted
Net Income
Four Children Five Children Six Children
Existing Updated
Difference
Existing Updated
28450 4587 4693 106 2.3% 5046 5162 116 2.3% 5485 5611 126 2.3%
28500 4591 4697 106 2.3% 5050 5167 116 2.3% 5490 5616 126 2.3%
28550 4595 4701 106 2.3% 5055 5171 116 2.3% 5495 5621 126 2.3%
28600 4600 4705 106 2.3% 5060 5176 116 2.3% 5500 5626 126 2.3%
28650 4604 4710 106 2.3% 5064 5181 116 2.3% 5505 5631 126 2.3%
28700 4608 4714 106 2.3% 5069 5185 116 2.3% 5510 5636 126 2.3%
28750 4612 4718 106 2.3% 5074 5190 116 2.3% 5515 5641 126 2.3%
28800 4617 4722 106 2.3% 5078 5195 116 2.3% 5520 5646 126 2.3%
28850 4621 4727 106 2.3% 5083 5199 116 2.3% 5525 5651 126 2.3%
28900 4625 4731 106 2.3% 5088 5204 116 2.3% 5530 5657 126 2.3%
28950 4629 4735 106 2.3% 5092 5208 116 2.3% 5535 5662 126 2.3%
29000 4633 4739 106 2.3% 5097 5213 116 2.3% 5540 5667 126 2.3%
29050 4638 4743 106 2.3% 5101 5218 116 2.3% 5545 5672 126 2.3%
29100 4642 4748 106 2.3% 5106 5222 116 2.3% 5550 5677 126 2.3%
29150 4646 4752 106 2.3% 5111 5227 116 2.3% 5555 5682 126 2.3%
29200 4650 4756 106 2.3% 5115 5232 116 2.3% 5560 5687 126 2.3%
29250 4655 4760 106 2.3% 5120 5236 116 2.3% 5565 5692 126 2.3%
29300 4659 4764 106 2.3% 5125 5241 116 2.3% 5571 5697 126 2.3%
29350 4663 4769 106 2.3% 5129 5246 116 2.3% 5576 5702 126 2.3%
29400 4667 4773 106 2.3% 5134 5250 116 2.3% 5581 5707 126 2.3%
29450 4671 4777 106 2.3% 5139 5255 116 2.3% 5586 5712 126 2.3%
29500 4676 4781 106 2.3% 5143 5259 116 2.3% 5591 5717 126 2.3%
29550 4680 4786 106 2.3% 5148 5264 116 2.3% 5596 5722 126 2.3%
29600 4684 4790 106 2.3% 5153 5269 116 2.3% 5601 5727 126 2.3%
29650 4688 4794 106 2.3% 5157 5273 116 2.3% 5606 5732 126 2.3%
29700 4693 4798 106 2.3% 5162 5278 116 2.3% 5611 5737 126 2.3%
29750 4697 4802 106 2.3% 5166 5283 116 2.3% 5616 5742 126 2.3%
29800 4701 4807 106 2.2% 5171 5287 116 2.2% 5621 5747 126 2.2%
29850 4705 4811 106 2.2% 5176 5292 116 2.2% 5626 5752 126 2.2%
29900 4709 4815 106 2.2% 5180 5297 116 2.2% 5631 5757 126 2.2%
29950 4714 4819 106 2.2% 5185 5301 116 2.2% 5636 5762 126 2.2%
30000 4718 4824 106 2.2% 5190 5306 116 2.2% 5641 5768 126 2.2%
Bue shading indicates schedule amounts adjusted for the self‐support reserve (SSR)
* The schedule would start at $1,000 per month, above the updated SSR of $981/month
66 1.5% 72 1.5% 78 1.4%
72 2.1% 80 2.1% 86 2.1%
‐47 ‐72.3% ‐47 ‐72.3% ‐48 ‐72.3%
106 3.7% 116 3.7% 126 3.7%
Minimum Change
Maximum Change
Average Change
Median Change