“present financial crisis, global versus local framework” prof. mario pines 02 april 2009
TRANSCRIPT

“Present Financial Crisis, Global versus Local Framework”
Prof. Mario Pines
02 April 2009


WWW.PINES.IT
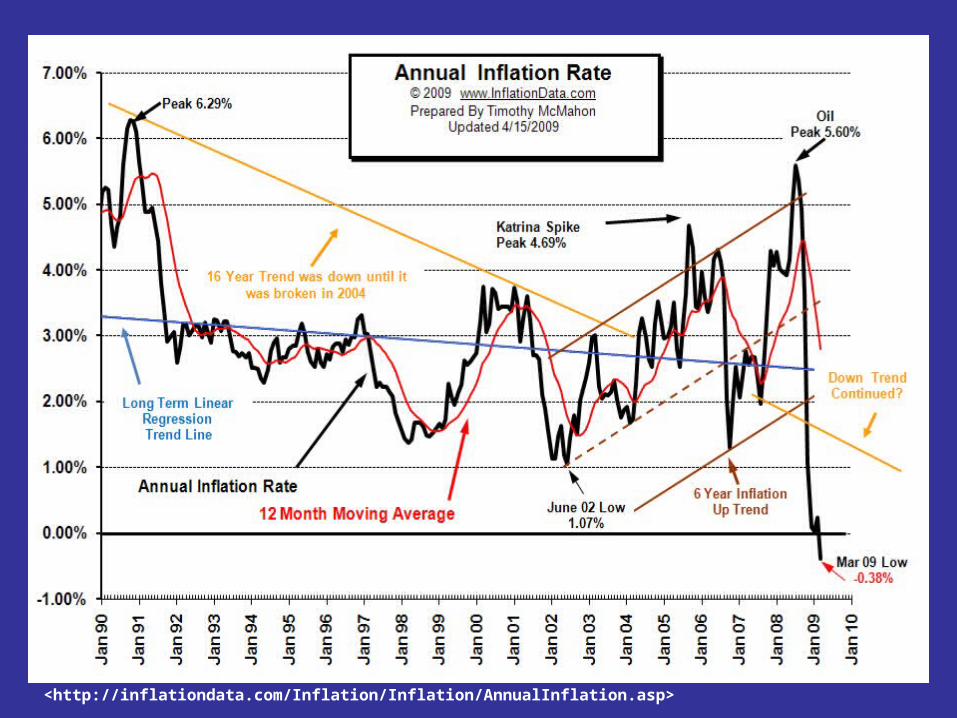
<http://inflationdata.com/Inflation/Inflation/AnnualInflation.asp>


WWW.PINES.IT

<http://www.wtrg.com/prices.htm>


WWW.PINES.IT

Banca Privata e Finambro 1974Bankhaus Herstatt in Cologne. 1974Franklin Square National Bank – Long Island, New York - 1974Penn Central Corporation – Pennsylvania 1978Banco Ambrosiano 1982 Continental Illinois National Bank and Trust Company (CINB) in May 1984, Drexel Burnham Lambert Group (DBLG) 1989Bank for Credit and Commerce International (BCCI) 1991Long-Term Capital Management (LTCM) 1994 Barings PLC 1995 Crédit Lyonnais' Paris 1996
Bipop-Carire 2001 Enron Corporation is an energy company based in Houston, Texas. 2001WorldCom (known as LDDS) and MCI Communications, MCI WorldCom WorldCom taking its final name on April 14, 2003 as part of the corporation's emergence from bankruptcy 2003
Since the collapse of fixed exchange rateAugust 1971

S&L crisis 1980 Japanese banking crisis 1990
December 1994 and early 1995 Mexico - Tequila Crisis Argentina,
Brazil, The Philippines,
Poland,1997 Thailand,
Indonesia Malaysia
October 1997, Korea August 1998, Russia declared a debt moratorium
January 1999, Brazil suffered an exchange rate crisis
Local crisis
WWW.PINES.IT

Glass-Steagall Act, passed on 16 June 1933
**************
Depositary Institution Deregulation and Monetary Control Act passed in 1980,
The Garn-St. Germain Depositary Institution Act deregulating The Savings and Loan industry in 1982, and the
GRAMM - LEACH - BLILEY ACT 1999
COMMODITY FUTURES MODERNIZATION ACT

***********
Lehman Brothers
Bear Stearns
Merrill Lynch
Morgan Stanley
Goldman Sachs
Investment Banks

Table 23
DERIVATIVE FINANCIAL INSTRUMENTS TRADED ON ORGANISED EXCHANGES BY INSTRUMENT AND LOCATION
FUTURES AMOUNTS OUTSTANDING TURNOVER
INSTRUMENTS / LOCATION
2003 2004 2005 2005 2004 2005 2005 2005 2005 2005
Dec. Dec. Sep. Dec. Year Year Q1 Q2 Q3 Q4
All markets . . . . 13,752.9 18,903.6 20,698.0 21,623.0 840,188.3 1,005,7754 240,719.8 269,914.1 249,847.4 245,293.9
Interest rate . . . . . 13,123.7 18,164.9 19,861.2 20,712.4 783,140.2 939,551.8 226,390.4 254,372.5 233,512.5 225,276.4
Currency . . . . . . . . 79.9 103.5 109.7 107.7 6,614.7 11,125.0 2,438.1 2,823.0 2,820.8 3,043.1
Equity index . . . . . 549.3 635.2 727.1 802.9 50,433.5 55,098.5 11,891.4 12,718.6 13,514.1 16,974.4
North America . 7,700.0 10,465.8 11,665.1 12,328.9 440,774.6 564,231.3 127,900.3 155,491.2 149,290.9 131,548.9
Interest rate . . . . . . 7,384.6 10,043.6 11,209.4 11,857.5 414,309.7 529,118.3 119,828.4 146,603.8 140,640.5 122,045.6
Currency . . . . . . . . . 64.9 91.5 93.0 90.8 6,080.9 10,257.1 2,260.5 2,621.7 2,580.9 2,794.0
Equity index . . . . . ..
250.4 330.7 362.7 380.7 20,384.0 24,855.9 5,811.4 6,265.7 6,069.4 6,709.3
Europe . . . . . . . . 4,363.2 5,972.4 6,155.5 6,283.6 336,632.1 380,612.4 99,725.3 101,207.0 83,797.6 95,882.5
Interest rate . . . . . . 4,200.2 5,756.1 5,908.9 6,049.4 322,977.6 362,066.8 95,731.1 96,912.8 79,012.2 90,410.8
Currency . . . . . . . . . 0.3 0.3 3.0 2.4 12.5 37.0 3.9 4.8 19.6 8.6
Equity index . . . . . . 162.7 215.9 243.6 231.8 13,642.1 18,508.6 3,990.3 4,289.4 4,765.8 5,463.1
Asia and Pacific 1,531.2 2,293.8 2,622.5 2,697.2 56,878.9 53,053.6 11,071.7 11,493.0 14,811.6 15,677.4
Interest rate . . . . . . 1,395.4 2,208.0 2,506.7 2,511.8 40,694.3 41,629.5 9,042.8 9,399.9 12,210.8 10,976.0
Currency . . . . . . . . . 3.4 3.7 4.8 4.3 107.2 133.7 29.6 33.6 35.3 35.3
Equity index . . . . . . 132.5 82.0 111.1 181.2 16,077.5 11,290.4 1,999.3 2,059.6 2,565.5 4,666.1
Other Markets . . 158.5 171.6 254.9 313.3 5,902.7 7,878.0 2,022.6 1,723.0 1,947.4 2,185.1
Interest rate . . . . . . 143.4 157.2 236.3 293.8 5,158.6 6,737.2 1,788.1 1,456.1 1,648.9 1,844.0
Currency . . . . . . . . . 11.3 7.9 8.9 10.2 414.1 697.2 144.1 162.9 185.0 205.2
(Notional principal in billions of US dollars)< http://www.bis.org/publ/qtrpdf/r_qa0603.pdf#page=108 >

THE BLUEPRINTS In June 2002, President Bush spoke in Atlanta to unveil a plan to increase minority homeownership.


FREDDI MAC


Currency composition of official foreign exchange reserves
'95
'96
'97
'98
'99
'00
'01
'02
'03
'04
'05
'06
'07
US dollar 59.0%
62.1%
65.2%
69.3%
70.9%
70.5%
70.7%
66.5%
65.8%
65.9%
66.4%
65.7%
63.9%
Euro 17.9%
18.8%
19.8%
24.2%
25.3%
24.9%
24.3%
25.2%
26.5%
German mark
15.8%
14.7%
14.5%
13.8%
Pound sterling
2.1%
2.7%
2.6%
2.7%
2.9%
2.8%
2.7%
2.9%
2.6%
3.3%
3.6%
4.2%
4.7%
Japanese yen
6.8%
6.7%
5.8%
6.2%
6.4%
6.3%
5.2%
4.5%
4.1%
3.9%
3.7%
3.2%
2.9%
French franc
2.4%
1.8%
1.4%
1.6%
Swiss franc
0.3%
0.2%
0.4%
0.3%
0.2%
0.3%
0.3%
0.4%
0.2%
0.2%
0.1%
0.2%
0.2%
Other 13.6%
11.7%
10.2%
6.1%
1.6%
1.4%
1.2%
1.4%
1.9%
1.8%
1.9%
1.5%
1.8%
Sources: 1995-1999, 2006-2007 IMF: Currency Composition of Official Foreign Exchange ReservesPDF (80 KB)Sources: 1999-2005, ECB: The Accumulation of Foreign ReservesPDF (816 KB) v • d • e

WWW:PINES:IT

http://www.ecb.int/stats/exchange/eurofxref/html/eurofxref-graph-usd.en.html
US$/€ Fonte ECB

Overall Teu Traffic: first 20 portsYear 2002 - Geographic Area
• Asia 84.951.148 65,89%• North Europe 22.448.422 17,41%• Nord America 14.381.242 11,15%• Middle East 4.194.264 3,25%• Mediterranean 2.954.571 2,29%
• Total 128.929.647 100%
http://www.ci-online.co.uk

Overall Teu Traffic: first 20 portsYear 2005 - Geographic Area
• Asia 140.497.155 75,46%• North Europe 23.869.606 12,82%• Nord America 14.194.442 7,62%• Middle East 7.619.222 4,10%• Mediterranean - - %
• Total 186.180.425 100%
http://www.ci-online.co.uk

Overall Teu Traffic: first 20 portsYear 2006 - Geographic Area
• Asia 148.365.970 71,27%• North Europe 30.020.396 14,42%• Nord America 20.853.024 10,02%• Middle East 8.923.465 4,29%• Mediterranean - - %
• Total 208.162.855 100%
http://www.ci-online.co.uk

Overall Teu Traffic: first 20 portsYear 2007 - Geographic Area
• Asia 170.334.729 72,24%• North Europe 33.759.457 14,32%• Nord America 21.045.404 8,93%• Middle East 10.653.026 4,52%• Mediterranean - - %
• Total 235.792.616 100%
http://www.ci-online.co.uk

Overall Teu Traffic: first 20 portsYear 2008 - Geographic Area
• Asia 187.317.049 80,84%• North Europe 30.063.736 12,97%• Nord America 14.337.801 6,19%• Middle East - -%• Mediterranean - - %
• Total 231.718.586 100%
http://www.ci-online.co.uk

Rank Country/Monetary Authority billion USD (end of month) change in year 2007
1 People's Republic of China $ 1905 (Sept) 1 +32.9%
2 Japan $ 997 (August) +8.7%
- Eurozone $ 555 (July) +16.6%
3 Russia $ 484.7 (November 06) 2 [1] +56.8%
4 Republic of China (Taiwan) $ 282 (August) [2] +2.7%
5 India $ 253 (Oct) 2 +64.4%
6 South Korea $ 212 (Oct) +9.7%
7 Brazil $ 205 (Aug 31) 3 +105.9%
8 Singapore $ 175 (July) +19.1%
9 Hong Kong $ 158 (August) +14.6%
10 Germany $ 137 (August) +20.3%
Monetary Authorities with the largest foreign reserves in 2008.

WWW.PINES.IT


12/11/02 http://www.pines.it12/11/02 http://www.pines.it

ECOFIN 4 October 2008

G20 14 October 2008

G20 2 April 2009

Jewish bankers were involved in the development of Persian industry and initiated a system of credit. The surviving records of two Jewish banking families are among the most revealing documents of the Persian period. These were the Jewish banking houses of "Murashu and Sons," and "Egibi and Sons".

1 cm = 100 anni 1 m = 10.000 anni 100 m = 1.000.000 anni <<http://www.nber.org/papers/w7375>>
X
A B C
