presentación de powerpoint · leading retail platform in latin america countries fashion and...
TRANSCRIPT

M a r c h | 2 0 1 9
Corporate Presentation

LEADING RETAIL PLATFORM IN LATIN AMERICA
COUNTRIES
FASHION AND
ELECTRONICS
SUPERM ARKETS HOM E
IM PROVEM ENT
FINANCIAL
SERVICES
M ARKETPLACE REAL
ESTATE
US$13.3bn12M 18Revenues
13.0%12M 18EBITDA margin
US$987 m12M18
NMV 1
70%
US$7.2bn
12M 18Gross Loan Book
5.4m
Act ive CMR Accounts with balance
504 stores
Three reta i l formats
US$1.1 bn12M 18 Digi ta l Channel
sales for f inancial
services
Source: Company filings
Note: Main figures as of December 2018. All dollar figures are calculated based on the observed exchange rate as of January 2nd, 2018 (694.77 CLP/US$). EBITDA calculated as
Operational income + Depreciation and Amortization; 1 NMV includes revenue generated through online channels for Department Stores in Chile, Peru, Argentina & Colombia; Home
Improvement in Chile, Peru, Argentina, Brazil & Uruguay; Supermarkets in Chile & Peru and Linio’s NMV; 2 As of December 2018; Digital channel sales for and Banco Falabella across
the region.
Online orders
annual growth 2
2
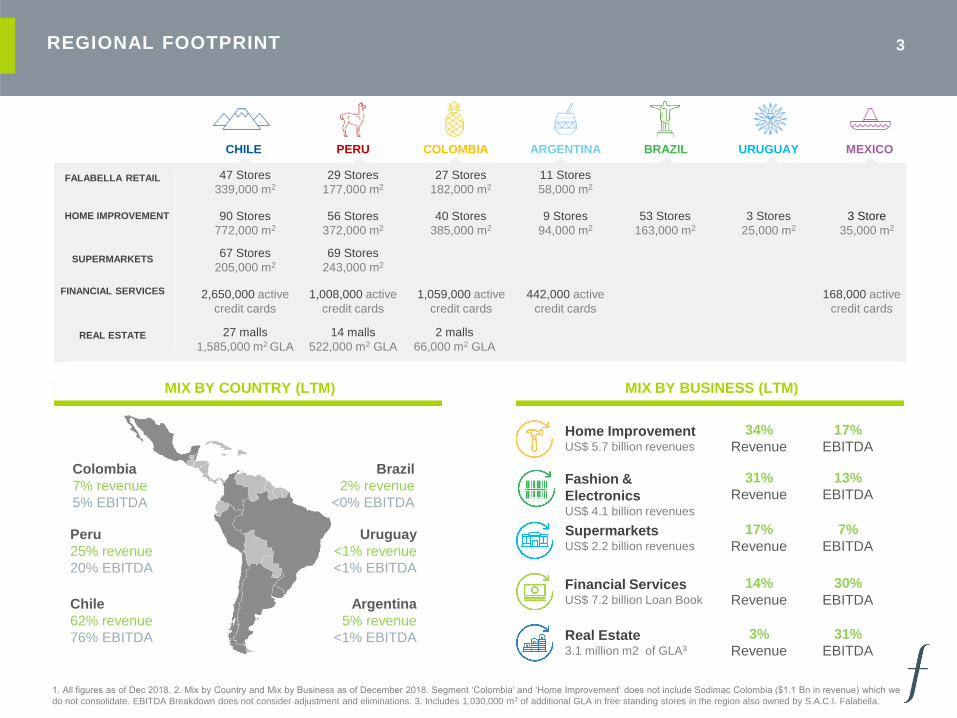
REGIONAL FOOTPRINT 3
47 Stores
339,000 m2
29 Stores
177,000 m2
27 Stores
182,000 m2
11 Stores
58,000 m2
90 Stores
772,000 m2
56 Stores
372,000 m2
40 Stores
385,000 m2
9 Stores
94,000 m2
53 Stores
163,000 m2
3 Stores
25,000 m2
3 Store
35,000 m2
67 Stores
205,000 m2
69 Stores
243,000 m2
2,650,000 active
credit cards
1,008,000 active
credit cards
1,059,000 active
credit cards
442,000 active
credit cards
27 malls
1,585,000 m2 GLA
14 malls
522,000 m2 GLA
2 malls
66,000 m2 GLA
168,000 active
credit cards
FALABELLA RETAIL
HOME IMPROVEMENT
SUPERMARKETS
FINANCIAL SERVICES
REAL ESTATE
Chile
62% revenue
76% EBITDA
Peru
25% revenue
20% EBITDA
Colombia
7% revenue
5% EBITDA
Argentina
5% revenue
<1% EBITDA
Uruguay
<1% revenue
<1% EBITDA
Brazil
2% revenue
<0% EBITDA
Fashion &
ElectronicsUS$ 4.1 billion revenues
Home ImprovementUS$ 5.7 billion revenues
SupermarketsUS$ 2.2 billion revenues
Financial ServicesUS$ 7.2 billion Loan Book
Real Estate3.1 million m2 of GLA3
31%
Revenue
13%
EBITDA
34%
Revenue
17%
EBITDA
17%
Revenue
7%
EBITDA
14%
Revenue
30%
EBITDA
3%
Revenue
31%
EBITDA
CHILE PERU COLOMBIA ARGENTINA BRAZIL URUGUAY MEXICO
1. All figures as of Dec 2018. 2. Mix by Country and Mix by Business as of December 2018. Segment ‘Colombia‘ and ‘Home Improvement‘ does not include Sodimac Colombia ($1.1 Bn in revenue) which we
do not consolidate. EBITDA Breakdown does not consider adjustment and eliminations. 3. Includes 1,030,000 m2 of additional GLA in free standing stores in the region also owned by S.A.C.I. Falabella.
MIX BY COUNTRY (LTM) MIX BY BUSINESS (LTM)

# 1
LEADERSHIP POSITION 4
4
Revenues MMUS$ Revenues MMUS$ Revenues MMUS$ CMR Accounts
2,239
926
571
413
3,189
898
1,171
218
235
1,123
1,077
2,644,000
982,000
1,021,000
463,000
27 Shopping Centers
GLA 1.6 million m2
14 Shopping Centers
GLA 0.5 million m2
1 Shopping Center
1. Revenues as of September 2018 LTM. Number of CMR accounts, malls and GLA as of September 2018. FX rates as of October 1st , 2018 (660,42 CLP/US$)
2. Sales LTM per square meter as of September 2018. FX rates as of October 1st, 2018 (660,42 CLP/US$). Tottus’ sales area excludes check out area, in order to compare with peer’s reported sales per
square meter.
Footprint
Home
Improvement
Fashion &
ElectronicsSupermarkets
Real
EstateFinancial
Services
MARKET POSITION 1
SALES LTM / M2 (US$) 2
# 1
# 1
# 1
# 1
# 1
# 1
# 2
# 4
# 4
# 3
# 1
# 1
# 1
# 1
# 1
1.7x
1.7x
1.1x
CHILE
PERU
COLOMBIA
ARGENTINA
BRAZIL
7.377
4.375 4.289 4.182
2.430
5.070 4.583 4.356
Falabella Comp. 1 Comp. 2 Sodimac Comp. 1 Tottus Comp. 1 Comp. 2

CONSTANTLY EVOLVING TO MEET OUR CUSTOMERS DEMANDS 5
1980
1990
1993-5
1998
1999
2001
2002
First Tottus
opened
in Peru
Falabella
launches CMR
Entry to
Argentina
and
Colombia
Falabella.com
launched
in Chile
Falabella
builds its
first shopping
center Mall
Plaza
Banco
Falabella
launched
in Chile
Sodimac.com
launched
in Chile
Falabella
acquires
Saga
1993-5
Organic Iniciatives
Mergers & Acquisitions
Falabella &
CMR enter
Colombia
Falabella.com
launched in
Argentina
2005
2006
Falabella
acquires
San
Francisco
in Chile
Falabella
& Sodimac
merge
2003
2004
2007
2008
Sodimac
acquires
Imperial in
Chile
Falabella
acquires
Casa Estrella
in Colombia
2013
2009
2010-
11
2013
2014
2015
Sodimac opens first
Homecenter stores
in Brazil and
Uruguay
Launch of
Móvil
FalabellaSodimac.com
launched
in Peru
Sodimac.com
launched
in Colombia
Tottus.com
launched in
Peru
Falabella.com
launched
in Colombia
Tottus.com
launched in
Chile
Launch of
Homy
Sodimac
acquires
Dicico in Brazil
Mall Plaza
acquires Mall
Las Americas
in Chile
2014Sodimac
acquires
Maestro
in Peru
Falabella &
Soriana form
partnership to
develop home
improvement
and financial
services in
Mexico
2016
2017
The first
Falabella-
Soriana credit
card was
issued in
Mexico
2018Falabella
announced
the
acquisition of
100% of Linio
and signed an
MOU to
develop and
operate IKEA

TRANSFORMING INTO A DIGITAL ECOSYSTEM LEVERAGING OUR UNMATCHED
INFRASTRUCTURE…
6

OUR STRATEGIC PRIORITIES
17.6%Visit social media
almost every day, over
80% visit 1-2 times per
month
Active internet users
(55.8% of total
population)
49%Internet users
growth in the
2012-2017 period
5%e-Commerce
penetration² vs 14.3%
global average³
3.07xe-Commerce market
size growth between
2012-2017
US$38bnLatin America’s
e-Commerce Market
Value
01.DIFERENTIATED VALUE
PROPOSITION
02.SCALING UP LOGISTICS
AND FULFILLMENT
03. FINANCING AND
PAYMENTS
04.DATA ANALYTICS
AND BUSINESS
INTELIGENCE
05.TECHNOLOGICAL
PLATFORM
DEVELOPMENT
Strategic
Priorities
7

PHYSICAL PRESENCE AND OPTIMIZATION OF OUR NETWORK OF STORES... 8
2018 Portfolio Optimization
Physical capabilities
1 new distribution center
1 distribution center remodelation
2 new shopping centers
1 shopping center sold
20 stores openings
7 stores closures
66 distribution and transfer centers
+1.300.000 m2 in distribution and transfer
centers
114 department stores
254 home improvement stores
136 supermarkets

FOCUS ON ENHANCING OUR OWN BRANDS’ PROPOSITION... 9
An exclusive offer with strong positioning,
D I F F E R E N T I AT I O N
A.
High quality / price relationship,
C O N V E N I E N T P R O P O S I T I O N
B.
Stronger margins
P R O F I T AB I L I T Y
C.
FASHION
HOME IMPROVEMENT
FOOD

Continuously adapting to meet emerging trends
Sustainability
IKEA business dimension
IKEA business
dimension
Opportunity to partner with a well-known home furnishings retailer with a strong private brand portfolio
Source: This is IKEA, October 2017
…FURTHER STRENGTHENED BY OUR PARTNERSHIP WITH IKEA 10
Focused on providing a democratic design, delivering quality products at affordable prices
Emphasis on the design, not the designer
PARTNERSHIP TO DEVELOP AND OPERATE STORES AND
ECOMMERCE IN CHILE, PERU & COLOMBIA
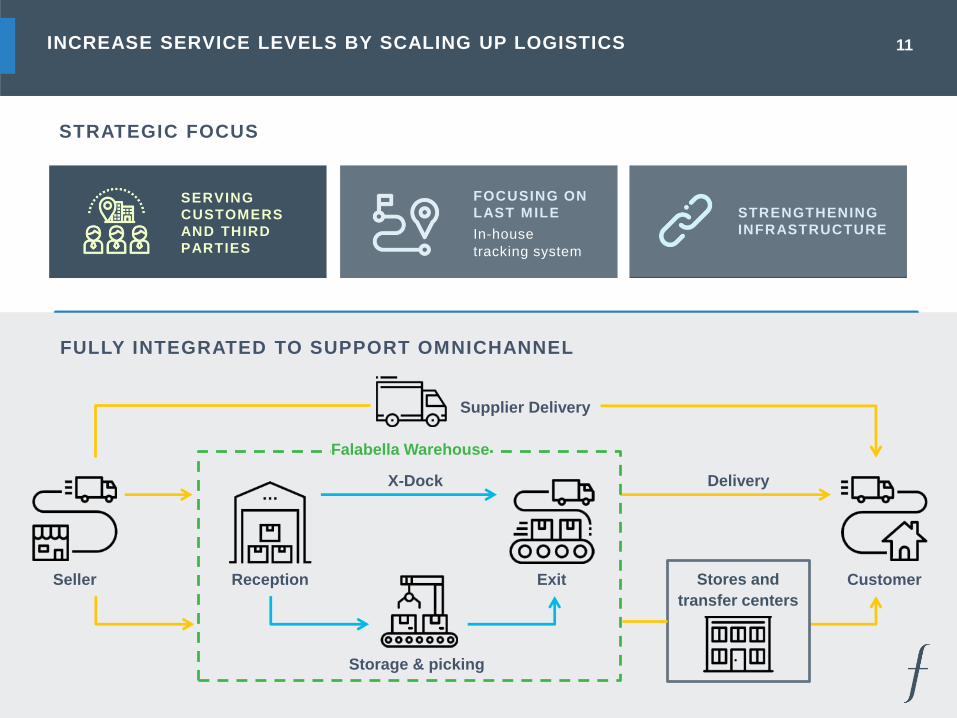
INCREASE SERVICE LEVELS BY SCALING UP LOGISTICS 11
STRATEGIC FOCUS
SERVING
CUSTOMERS
AND THIRD
PARTIES
FOCUSING ON
LAST MILE STRENGTHENING
INFRASTRUCTUREIn-house
tracking system
Seller Reception
Storage & picking
X-Dock
Exit
Delivery
Falabella Warehouse
Customer
Supplier Delivery
Stores and
transfer centers
FULLY INTEGRATED TO SUPPORT OMNICHANNEL

INTRODUCTION OF E-PAYMENTS SOLUTIONS
We seek to build an open platform with tools for our customers,
merchants and marketplace
FRAUD
MANAGEMENT
MERCHANT
FINANCING
TRANSACTION
TRACKING
PAYMENT
RECONCILIATION
ONE-CLICK
PAYMENTS
FINANCIAL
PRODUCTS
LOYALTY
PROGRAMS
INSURANCE
12

13LEVERAGE ON OUR CUSTOMER KNOWLEDGE UNDERPINNED BY THE
DEVELOPMENT OF BUSINESS INTELLIGENCE
+ 5 . 3 Mactive CMR
accountsw/balance
256Bank
branches
+ 2 7 M
Followerson socialnetworks
MEANS OF PAYMENT
HOW MUCH DOES THE CUSTOMER SPEND
WHAT DOES THE CUSTOMERLIKE
+ 3 2 4 Mtransactions in the retail business
+ 3 9 0 Mvisits to our shopping centersin the region
+ 5 0 0 M
WHEN DOESTHE CUSTOMER
PURCHASE
WHERE DOESTHE CUSTOMER
PURCHASE
WHAT DOESTHE CUSTOMER
BUY
visits on our websites
Source: Company Filings
Note: All main figures as of December 2017; except for million active CMR cards and bank branches, which are as of June 2018

FLEXIBLE AND SCALABLE TECHNOLOGICAL ARCHITECTURE 14
SUPPORTED BY A CYBERSECURITY FRAMEWORK THAT STRIVES TO
MEET THE HIGHEST GLOBAL STANDARDS

15
Key Financial Metrics

3.130
4.188 4.627
5.284 5.367
4.796
-
1.00 0
2.00 0
3.00 0
4.00 0
5.00 0
6.00 0
2013 2014 2015 2016 2017 2018
SOLID FINANCIAL PERFORMANCE, REFLECTED IN STRONG GROWTH AND
OUTSTANDING PROFITABILITY
16
R E V E N U E S ( U S $ M ) N O N B AN K I N G G R O S S
P R O F I T ( U S $ M ) 1
B AN K I N G G R O S S
P R O F I T ( U S $ M )
E B I T D A ( U S $ M ) N E T I N C O M E 2 ( U S $ M ) N E T D E B T ( U S $ M ) EBITDA MARGIN(%) NET INCOME MARGIN (%)
GROSS
MARGIN (%)
NET DEBT/EBITDA3
GROSS
MARGIN (%)
2.5x 3.1x 3.1x 3.4x 3.15x3.27x
CAGR 13’- 17’: 7.7%
CAGR 13’- 17’: 7.8% CAGR 13’- 17’: 3.5%
CAGR 13’- 17’: 11.3%
Source: Company filings
Note: All dollar figures are calculated based on the observed exchange rate as of January 2nd, 2018 (694,77 CLP/US$)1 Excludes financial operations;2 Considers Net income attributable to owners of the parent company3 Net debt / EBITDA without banking operations
VAR (%) CAGR 13’- 17’: 8.3%
9.58010.927
12.057 12.361 12.862 13.294
14,1%
10,3%
2,5%4,1% 3,4%
0,0%
5,0%
10,0%
15,0%
20,0%
25,0%
30,0%
2013 2014 2015 2016 2017 2018
3.375 3.883
4.329 4.434 4.748 4.881
35,2%35,5%
35,9% 35,9%
36,9%36,7%
2013 2014 2015 2016 2017 2018
1.296 1.461
1.603 1.657 1.751 1.733
13,5%
13,4%13,3%
13,4%
13,6%
13,0%
2013 2014 2015 2016 2017 2018
639 669 745
877
733 689
6,7%6,1% 6,2%
7,1%
5,7%5,2%
2013 2014 2015 2016 2017 2018
359
452 508 523
555 599
54,3%
56,8% 56,6%
52,7% 53,0%
55,3%
50,0 %
52,0 %
54,0 %
56,0 %
58,0 %
60,0 %
62,0 %
64,0 %
2013 2014 2015 2016 2017 2018
-
100
200
300
400
500
600
700

BALANCE SHEET 17
(Million of USD) Dec 17 Dec 18 (Million of USD) Dec 17 Dec 18
Cash & cash equivalents 334 507 Other current financial liabilities 1.201 1.425
Current trade & other receivables 2.829 2.950 Current trade & other payables 1.562 1.625
Inventories 1.782 2.030 Others 518 595
Others 318 459
Total Non-Banking Current Assets 5.263 5.946 Total Non-Banking Current Liabilities 3.282 3.645
Non-Current trade & other receivables 396 430 Other non-current financial liabilities 4.327 4.040
Goodwill 726 910 Others 949 1.012
PP&E & Investment properties 7.850 8.201
Others 1.016 1.218
Total Non-Banking Non-Current Assets 9.987 10.759 Total Non-Banking Non-Current Liab. 5.276 5.051
Total Non-Banking Operations Assets 15.251 16.705 Total Non-Banking Oper. Liabilities 8.558 8.697
Loans & accounts receivable from
clients 3.729 4.064 Total Banking Oper. Liabilities 4.464 5.540
Others 1.661 2.085 TOTAL LIABILITIES 13.022 14.237
Total Banking Operations Assets 5.390 6.149 Shareholders' Equity 7.619 8.618
TOTAL ASSETS 20.641 22.855 TOTAL EQUITY & LIABILITIES 20.641 22.855

57% 43%
Public Bonds Financial Institutions
CAPITAL STRUCTURE 18
N e t F i n a n c i a l D e b t / E b i t d a ( t i m e s )
w / o B a n k i n g O p e r a t i o n s
L e ve r a g e ( t i m e s )
w / o B a n k i n g O p e r a t i o n s
D e b t B y C r e d i t o r
w / o B a n k i n g O p e r a t i o n s
D e b t B y M a t u r i t y
w / o B a n k i n g O p e r a t i o n s
4.7 yearsDuration
US$ 5,264 MMFinancial Debt w/o Banks
Sep 2018
3.1
3.5
Dec 2018
Sep 2018
1.0
1.1
Dec 2018
26%
74%
Corto plazo Largo plazo

CAPITAL EXPENDITURE
ORGANIC INVESTMENT PLAN 2019 - 2022
Note: The investment plan includes 100% of expected capex for S.A.C.I. Falabella and subsidiaries, including Sodimac Colombia, Sodimac Mexico, CMR Mexico, which
the Company does not consolidate.
2
2019 2020 2021
12
23
26
23 23
2022
Store and Shopping Centers Openings Investment (US$ million)
2019 2020 2021 2022
1,0841,115
1,072929
US$ 4.2 bnInvestment over the next 4 years
37%IT and logistics
projects
29%Remodeling and
expansions
34%New stores &
shopping centers
95 Stores
5Shopping
Centers
19
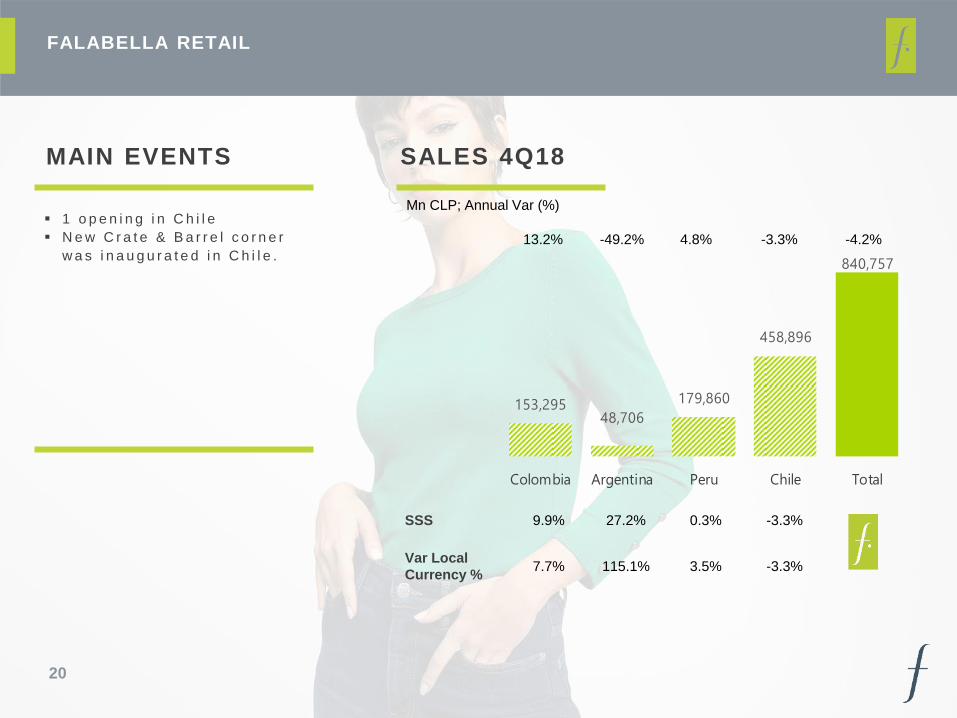
153,29548,706
179,860
458,896
840,757
Colombia Argentina Peru Chile Total
MAIN EVENTS
FALABELLA RETAIL
SALES 4Q18
SSS 9.9% 27.2% 0.3% -3.3%
Var Local
Currency %7.7% 115.1% 3.5% -3.3%
13.2% -49.2% 4.8% -3.3%
Mn CLP; Annual Var (%) 1 o p e n i n g i n C h i l e
N e w C r a t e & B a r r e l c o r n e r
w a s i n a u g u r a t e d i n C h i l e .
20
-4.2%

51,892
218,356
23,123
165,497
559,489
800,001
Brasil Colombia Argentina Peru Chile Total
2 o p e n i n g s i n M e x i c o
MAIN EVENTS
SODIMAC
SALES 4Q18
SSS 8.8% 7.7% 18.5% 3.7% -2.0%
Var Local
Currency %11.2% 11.2% 122.9% 5.4% 1.0%
0.7% 12.5% -50.4% 9.0% 1.0%
Mn CLP; Annual Var (%)
21
-0.5%

227,780 204,016
431,796
Peru Chile Total
MAIN EVENTS
TOTTUS
SALES 4Q18
SSS 3.5% -1.2%
Var Local
Currency %8.6% 0.8%
12.7% 0.8%
Mn CLP; Annual Var (%) 1 o p e n i n g C h i l e
1 H i p e r b o d e g a P r e c i o U n o ’
o p e n i n g P e r u
22
6.7%

25,865 30,291 81,165 87,767
4Q17 4Q18 12M17 12M18
C o n s o l i d a t i o n o f L i n i o s i n c e
A u g u s t 2 n d
MAIN EVENTS
LINIO
NMV 1
17.1% 8.1%
1 NMV corresponds to Net Merchandise Value. A measure of the total sum in Chilean pesos of all transactions made through Linio, net of VAT
Mn CLP; Annual Var (%)
23
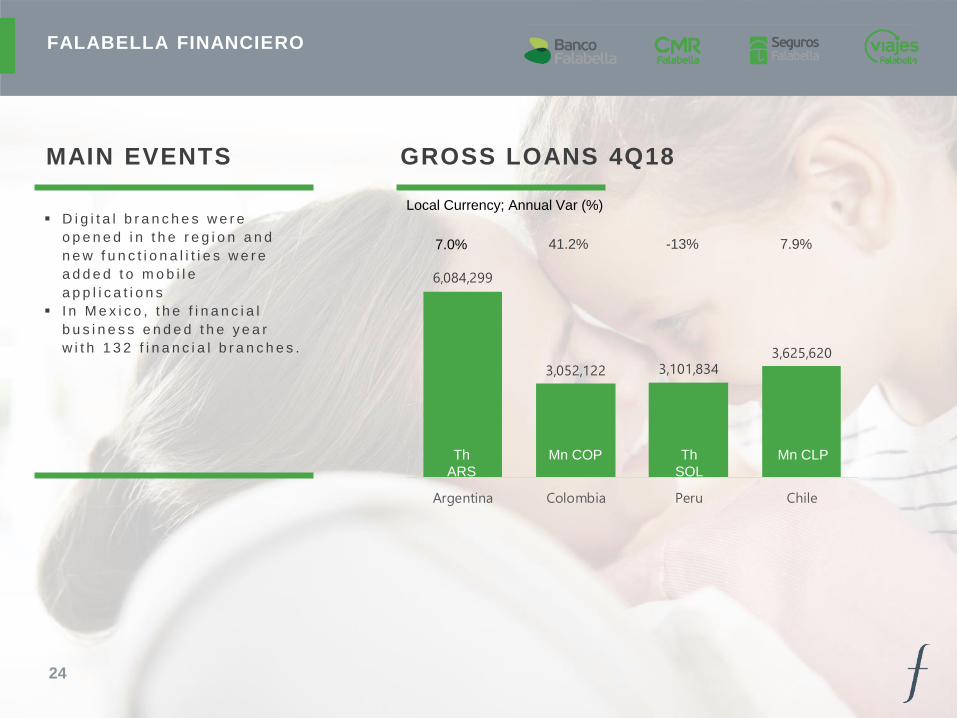
6,084,299
3,052,122 3,101,8343,625,620
Argentina Colombia Peru Chile
D i g i t a l b r a n c h e s w e r e
o p e n e d i n t h e r e g i o n a n d
n e w f u n c t i o n a l i t i e s w e r e
a d d e d t o m o b i l e
a p p l i c a t i o n s
I n M e x i c o , t h e f i n a n c i a l
b u s i n e s s e n d e d t h e y e a r
w i t h 1 3 2 f i n a n c i a l b r a n c h e s .
MAIN EVENTS
FALABELLA FINANCIERO
GROSS LOANS 4Q18
7.0%
Local Currency; Annual Var (%)
24
Th
ARS
Mn COP Th
SOL
Mn CLP
41.2% -13% 7.9%

61,376 70,209
222,408
251,563
78.8% 77.6% 79.3% 80.0%
4Q17 4Q18 12M17 12M18
MAIN EVENTS
REAL ESTATE
EBITDA PLAZA
Mn CLP; EBITDA Margin (%)
43Shopping Centers
3,20 MnM2 GLA between shopping
centers and free standing
25

investors.falabella.com
Andrea González, Head IR
Constanza Saver, IR Analyst
Pablo Muñoz, IR Analyst