presentación de powerpoint - actinver.comedisp/actinver059900.pdf · 3 chile: macroeconomic events...
TRANSCRIPT

July 25th 2016
MILA Weekly

2
Fuente: Bloomberg & Actinver
MILA - Andean Dashboard
Local Markets Index Performance (local currency) MSCI Regional Index Performance (US$)
Currencies Commodities
Index Value WoW MTD YTD
MILA
Chile IPSA 4.144 1,1% 3,7% 12,6%
Mexico MEXBOL 47.537 1,8% 3,4% 10,6%
Colombia COLCAP 9.873 -0,7% 1,1% 15,5%
Peru S&P/BVL 14.778 2,5% 6,6% 50,0%
Argentina MAR 15.078 0,8% 5,8% 20,4%
Brasil BOVESPA 57.002 2,6% 10,6% 31,5%
Index Value WoW MTD YTD
Chile MXCL Index 1.512 0,9% 4,7% 18,3%
Mexico MXMX Index 5.393 1,0% 2,4% 2,5%
Colombia MXCO Index 569 -0,7% 0,8% 25,8%
Perú MXPE Index 1.254 2,5% 4,0% 54,4%
Argentina MXAR Index 2.783 -2,0% 1,0% 17,1%
Brazil MXBR Index 1.610 2,2% 7,6% 55,3%
LATAM MXLA Index 2.392 1,6% 5,4% 30,7%
Currency Value WoW MTD YTD
Chile Chilean Peso 650 -0,3% -1,9% -8,1%
Mexico Mexican Peso 18,55 -0,3% 1,5% 7,8%
Colombia Colombian Peso 2951 0,9% 1,0% -7,1%
Peru Peruvian Sol 3,32 1,4% 1,1% -2,7%
Argentina Argentine Peso 14,91 -0,2% -0,9% 15,3%
Brazil Brasilian Real 3,26 -0,8% 1,3% -17,9%
Value WoW MTD YTD
Cooper US$ c/lb 224 0,1% 1,8% 3,9%
Gold US$/oz 1323 -1,1% 0,1% 24,7%
Soybean US$/bu 988 -6,5% -14,3% 12,0%
Coffee US$ c/lb 141,9 -3,8% -2,6% 7,1%
Oil WTI US$/bbl 43,5 -5,4% -10,0% 17,4%
Thermal Coal NwCtl US$/ton 63,9 -0,7% 10,2% 37,9%
Jet Fuel 54 US$/gal 1,22 -2,7% -12,7% 18,2%

3
Chile: Macroeconomic Events and Corporate News
Last Week Current Week
Corporate News and Major Events
• Latam Airlines called an extraordinary meeting to vote on the sale of a 10% stake in Latam to Qatar Airways via a $613m capital increase, for Aug. 18.
• SQM informed that the sustainability of the Salar de Atacama will be safeguard by a joint effort with Rockwood Lithium. SQM agreed to halt complaints
against Rockwood’s environmental approval for expansion in the salt flats.
• Colbun announced that Nehuenco 2, a 398 MW gas turbine combined-cycle power station will resume operations on September 25th .
• It concluded the 30-day first subscription period of Entel´s capital increase process at the price of $5,400 pesos. Entel’s Board may decide to offer the
unsubscribed shares to registered holders that subscribed their rights in the first subscription period and indicated their intention to subscribe additional rights.
• Jobless rate in the Santiago Metropolitan Region increased to 7.6% from 6.5% a year earlier, Universidad de Chile survey shows. Unemployment highest
in construction, 11.5%, personal and home services, 7.9% and commerce and transport, 7.2%.
Date Event Period Survey Actual Prior
Jul-29 Manufacturing Production YoY Jun -0.3% -- 2.1%
Jul-29 Retail Sales YoY Jun 2.9% -- 0.6%
Jul-29 Industrial Production YoY Jun 0.0% -- -2.0%
Jul-29 Unemployment Rate Jun 6.9% -- 6.8%
Date Event Period Survey Actual Prior
Jul-22 PPI MoM Jun -- -1.0% -0.4%

4
Source: Bloomberg & Actinver
Performance in Local Currency
Chile Equities Monitor: IPSA, PE ratio, Advancers & Decliners
Chilean Equities – IPSA Index LTM IPSA Index - 12-mth forward looking PE Ratio
Top Advancers & Decliners IPSA WoW Top Advancers & Decliners IPSA YTD
7x
9x
11x
13x
15x
17x
19x
21x
23x
Feb-07 Feb-08 Feb-09 Feb-10 Feb-11 Feb-12 Feb-13 Feb-14 Feb-15 Feb-163.400
3.500
3.600
3.700
3.800
3.900
4.000
4.100
4.200
Jul-15 Sept-15 Nov-15 Ene-16 Mar-16 May-16
-10,0% -8,0% -6,0% -4,0% -2,0% 0,0% 2,0% 4,0% 6,0% 8,0% 10,0%
VAPORES
SQM-B
SECURITY
ENERSIS AMERICAS
COPEC
COLBUN
SALFACORP
ANDINA-B
SM SAAM
ENTEL
-20% -10% 0% 10% 20% 30% 40% 50% 60%
VAPORES
CMPC
GASCO
CCU
SONDA
SALFACORP
EMBONOR-B
CAP
RIPLEY
LATAM AIRLINES

5
Source: Bloomberg & Actinver
Performance in Local Currency
Chile Equities Monitor: IPSA – Performance and Stock Valuations
Price Mk Cap Price/Book Div Yield %
Jul-22 Weekly MTD YTD US$ mn 2014 2015 2016e 2014 2015 2016e LTM
AES GENER $327 1,0% 1,0% 5,3% $4.221 24,3x 14,0x 20,1x 1,9x 7,9 11,9 9,2 5,7
AGUAS-A $404 1,7% 6,5% 17,6% $3.874 18,2x 17,2x 18,4x 3,7x 19,4 20,9 20,3 5,2
ANDINA-B $2.579 5,3% 9,4% 24,7% $3.514 21,5x 22,7x 25,2x 2,9x 8,4 10,6 11,1 2,7
ANTARCHILE $6.300 1,4% 4,1% -1,9% $4.420 10,8x 13,4x - 0,7x 8,1 5,3 - 2,9
BANMEDICA $1.225 1,2% 2,1% 22,2% $1.515 18,1x 18,0x - 3,7x 24,6 17,6 - 1,6
BCI $29.894 0,1% 4,5% 17,0% $5.586 9,5x 9,0x 10,4x 1,6x 19,0 16,5 15,2 3,3
SANTANDER CHILE $33,6 1,4% 5,2% 11,5% $9.726 10,4x 13,3x 12,8x 2,2x 21,1 16,4 17,4 5,3
CAP $2.487 -0,4% 10,2% 46,4% $571 11,9x 167,8x - 0,3x 3,0 0,1 -0,2 1,9
CENCOSUD $1.828 3,0% -3,2% 33,6% $7.990 22,9x 17,3x 17,3x 1,3x 4,5 5,8 6,9 4,2
BANCO DE CHILE $73,0 1,9% 5,2% 8,1% $11.272 11,3x 12,4x 13,2x 2,6x 23,3 20,4 19,8 4,5
CCU $7.488 0,2% -3,3% -2,4% $4.254 17,7x 23,9x 19,5x 2,6x 11,7 11,4 12,8 2,2
CMPC $1.403 0,7% 1,9% -7,6% $5.393 45,4x - 16,3x 0,7x 1,7 0,0 3,9 1,0
COLBUN $165 3,6% 3,0% -0,1% $4.454 58,7x 20,4x 14,9x 1,3x 2,4 5,9 6,7 2,4
CONCHATORO $1.085 3,4% 3,8% 4,2% $1.246 20,6x 15,9x 14,1x 1,7x 9,7 11,0 11,3 2,5
COPEC $6.044 -1,6% 3,8% 0,4% $12.079 17,1x 20,6x 20,1x 1,3x 8,8 5,8 6,0 1,9
ECL $1.223 2,1% 8,4% 32,1% $1.980 17,3x 15,3x 9,4x 1,0x 5,0 5,4 11,7 4,9
EMBONOR-B $1.335 2,3% 10,3% 36,5% $945 20,6x 18,6x 16,8x 2,1x 7,1 8,4 10,2 3,8
ENDESA AMERICAS $313 -0,7% 2,6% - $3.942 - - 11,6x 2,1x - - 18,4 3,0
ENDESA CHILE $592 1,2% -3,2% 2,4% $7.464 - - 14,3x 3,2x - - 10,3 2,5
ENERSIS AMERICAS $115,3 -1,7% 1,7% 20,8% $8.701 - - 10,4x 1,6x - - 10,9 4,0
ENERSIS CHILE $77,5 0,6% -0,1% - $5.846 - - 9,5x 1,5x - - 15,0 2,7
ENTEL $6.595 8,2% 10,0% 6,5% $3.055 25,5x - 34,5x 1,6x 5,9 -0,1 4,9 -
FALABELLA $4.876 1,8% -3,4% 9,1% $18.250 21,3x 21,1x 21,9x 3,1x 13,5 13,9 13,9 1,6
FORUS $2.221 1,0% 11,1% 29,1% $883 17,4x 13,7x 19,2x 3,2x 23,5 18,9 15,3 2,3
GASCO $1.680 0,0% -2,6% -2,9% $434 16,4x 16,4x - 1,5x 9,9 9,7 - 6,3
GN CHILE $3.495 0,0% 1,4% - - - - - - 1,0
IAM $1.111 -0,3% 5,3% 18,1% $1.708 16,0x 15,8x 16,5x 1,8x 10,2 10,9 - 5,7
ILC $7.600 2,7% 4,7% 9,6% $1.168 10,6x 10,2x 2,3x 1,1x 14,1 14,0 48,5 5,5
ITAUCORP $5,80 3,1% 3,2% 7,3% $4.567 10,9x 9,5x 10,7x 1,7x 15,7 17,0 10,8 5,3
LATAM AIRLINES $5.770 2,1% 31,7% 55,0% $4.840 - - 64,7x 1,5x -2,5 -7,7 3,2 -
PARAUCO $1.425 1,9% 6,4% 31,7% $1.949 16,5x 15,3x 20,6x 1,7x 9,1 9,2 7,9 2,1
QUINENCO $1.285 0,0% 0,0% 4,7% $3.285 6,3x 21,5x - 0,7x 12,1 3,2 - 1,8
RIPLEY $414 1,8% 26,0% 47,5% $1.234 12,8x - 14,0x 1,1x 5,5 -5,9 6,7 2,8
SALFACORP $490 4,8% 18,9% 34,9% $339 9,3x 7,4x 9,1x 0,7x 6,9 6,9 7,0 3,1
SECURITY $219 -2,3% 2,0% 19,3% $1.099 11,4x 9,6x - 1,2x 11,7 11,8 - 5,1
SK $852 1,3% 0,3% 3,9% $1.408 12,4x 9,4x 10,1x 1,2x 11,2 11,4 8,2 4,3
SM CHILE-B $197 1,2% 4,3% 7,4% $3.987 17,7x 21,5x - 2,1x 10,8 8,7 - 1,7
SM SAAM $52 7,7% 6,1% 21,6% $778 12,3x 8,9x 8,0x 1,1x 8,5 9,6 7,6 4,6
SONDA $1.220 2,0% 0,4% -1,9% $1.634 26,5x 25,5x 18,5x 2,3x 9,6 9,3 12,0 2,0
SQM-B $16.265 -3,1% -0,7% 26,1% $7.072 21,6x 23,1x 22,0x 2,8x 13,2 9,1 12,3 4,1
VAPORES $12,23 -8,7% -7,3% -10,7% $577 2,5x - 9,4x 0,3x 20,6 -0,7 - -
VSPT $6,75 1,6% 0,9% 14,3% $415 10,5x 9,7x - 1,3x 9,8 12,7 - 6,8
WATTS $1.315 2,8% 6,9% 28,1% $637 14,0x 14,2x - 2,3x 13,7 12,9 - 2,8
Performance P/E ROE %
6
Source: Bloomberg & Actinver
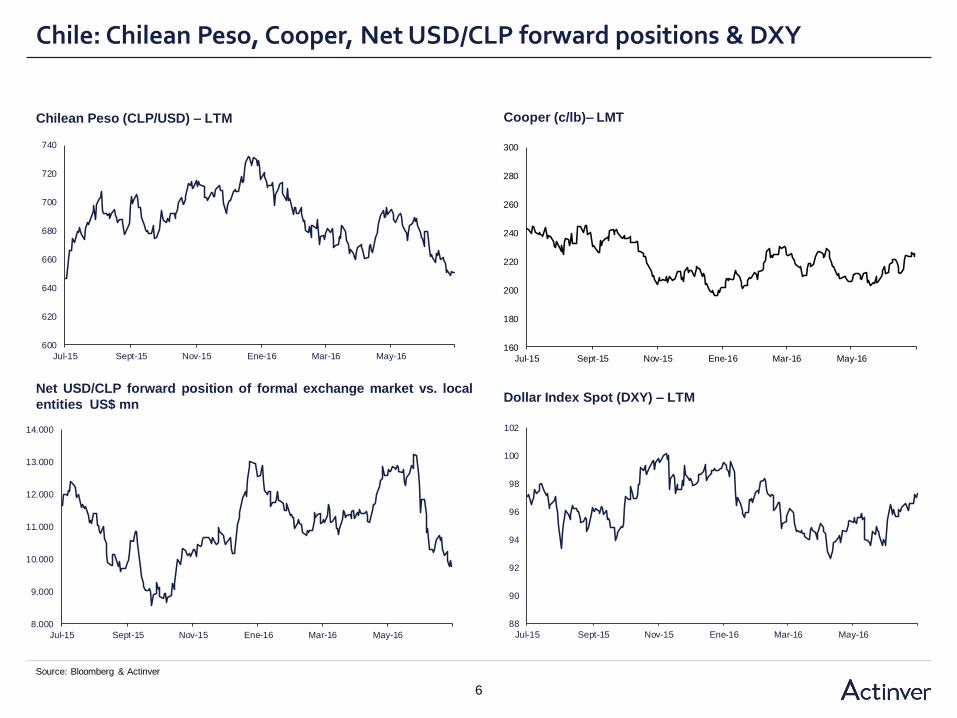
Chile: Chilean Peso, Cooper, Net USD/CLP forward positions & DXY
Chilean Peso (CLP/USD) – LTM Cooper (c/lb)– LMT
Net USD/CLP forward position of formal exchange market vs. local
entities US$ mnDollar Index Spot (DXY) – LTM
600
620
640
660
680
700
720
740
Jul-15 Sept-15 Nov-15 Ene-16 Mar-16 May-16160
180
200
220
240
260
280
300
Jul-15 Sept-15 Nov-15 Ene-16 Mar-16 May-16
88
90
92
94
96
98
100
102
Jul-15 Sept-15 Nov-15 Ene-16 Mar-16 May-168.000
9.000
10.000
11.000
12.000
13.000
14.000
Jul-15 Sept-15 Nov-15 Ene-16 Mar-16 May-16

7
Source: Bloomberg & Actinver
Chile: Nominal & Real Rates, Inflation & Economic Activity
Nominal Rates /Central Bank Bonds & Monetary Policy Rate (TPM) Real Rates /Central Bank Bonds & Monetary
Headline & Core Inflation (ex food./Energy) IMACEC (GDP Proxy)
-4
-2
0
2
4
6
8
10
12
2006 2007 2008 2009 2010 2011 2012 2013 2014 2015
CPI y/y
Core Inflation SAE (ex food & energy) y/y
-6
-4
-2
0
2
4
6
8
10
12
14
2006 2007 2008 2009 2010 2011 2012 2013 2014 2015
0,0
1,0
2,0
3,0
4,0
5,0
6,0
7,0
2011 2012 2013 2014 2015
BCP pesos 5 years
BCP pesos 10 years
TPM
0,0
0,5
1,0
1,5
2,0
2,5
3,0
3,5
2011 2012 2013 2014 2015
BCU 5 years
BCU 10 years

8
Source: Bloomberg & Actinver
Colombia Equities Monitor: COLCAP, PE ratio, Advancers & Decliners
Colombian Equities– COLCAP Index LTM COLCAP Index - 12-mth forward looking PE Ratio
Top Advancers & Decliners COLCAP WoW Top Advancers & Decliners COLCAP YTD
10x
12x
14x
16x
18x
20x
22x
2011 2012 2013 2014 20157.000
7.500
8.000
8.500
9.000
9.500
10.000
10.500
Jul-15 Sept-15 Nov-15 Ene-16 Mar-16 May-16
-4% -3% -2% -1% 0% 1% 2% 3%
AVIANCA HLDG
CANACOL
CEMEX LATAM HLDG
CEMARGOS-COMUN
CORFICOL
GRUPOSURA-PF
CONCONCRETO
AVAL-PF
ISA
AVAL-COMUN
0% 10% 20% 30% 40% 50% 60% 70%
BANCO DE BOGOTA
CORFICOL
CONCONCRETO
EMP ENER BOGOTA
EXITO
DAVIVIENDA
ISA
AVIANCA HLDG
CELSIA
CANACOL

9
Source: Bloomberg & Actinver
Performance in Local Currency
Colombia Equities Monitor: COLCAP – Performance and Stock Valuations
Price Mk Cap Price/Book Div Yield %
Jul-22 Weekly MTD YTD US$ mn 2014 2015 2016e 2014 2015 2016e LTM
AVAL-COMUN $1.195 2,1% 3,0% 12,5% $8.813 15,3x 10,4x - 1,8x 12,5 15,7 - 4,9
AVAL-PF $1.195 1,7% 1,3% 12,5% $8.813 15,3x 10,4x 12,9x - 12,5 15,7 14,8 4,9
AVIANCA HLDG $2.380 -2,9% 6,3% 42,1% $793 11,8x - 7,7x 0,6x 10,1 -10,3 6,6 2,1
BANCO DE BOGOTA $58.500 -0,2% 0,0% 0,6% $6.563 13,2x 8,1x - 1,4x 13,6 17,9 14,5 4,5
BANCOLOMBIA-COMUN $24.200 0,0% 1,7% 17,5% $7.955 9,3x 6,9x 9,5x 1,2x 16,9 15,3 12,7 3,5
BANCOLOMBIA-PF $26.160 0,5% 2,7% 23,2% $7.955 9,3x 6,9x 10,3x 1,3x 16,9 15,3 12,7 3,3
BVC $18,5 -1,6% 2,8% 14,2% $116 11,8x 13,0x - 3,6x 30,9 21,9 - 4,8
CANACOL $9.490 -2,4% -3,2% 58,2% $551 70,6x - - - 2,5 -31,0 - -
CELSIA $3.885 -0,8% 0,9% 44,6% $952 20,4x - - 0,9x 6,4 -6,1 - 3,1
CEMARGOS-COMUN $11.700,0 -2,2% -1,8% 22,0% $5.372 40,8x 24,3x 28,2x 2,0x 4,6 7,1 6,2 1,6
CEMARGOS-PF $10.980 -0,7% -0,2% 18,7% $5.372 40,8x 24,3x 23,4x - 4,6 7,1 6,8 2,0
CEMEX LATAM HLDG $12.400 -2,2% -1,6% 20,4% $2.411 13,7x 18,9x 14,4x 1,8x 19,6 7,3 11,5 -
CONCONCRETO $1.115 1,4% -0,9% 4,5% $419 21,3x 9,0x - 0,8x 5,8 8,7 - 2,3
CORFICOL $37.980 -2,1% -0,3% 1,0% $2.860 14,4x 15,8x - - 13,0 18,9 - 1,6
DAVIVIENDA $27.000 0,5% 0,4% 26,0% $4.136 10,9x 6,7x 8,7x 1,4x 15,5 16,7 14,6 1,6
ECOPETROL $1.360 -2,9% -2,5% 22,5% $19.555 14,2x - 20,5x 1,3x 12,8 -20,4 4,8 -
EMP ENER BOGOTA $1.790 -0,8% 0,3% 8,4% $5.601 16,0x 13,3x 15,3x 1,6x 11,4 11,8 11,6 4,2
EMP TELECOM BOGOTA $595 -0,7% 1,4% 14,6% $715 - - - 1,0x -1,5 -3,5 -1,2 19,1
EXITO $14.560 0,6% 3,8% 11,6% $2.227 23,9x 9,0x 14,9x 0,9x 6,7 8,9 4,5 4,3
G. ARGOS-COMUN $19.140 -1,8% 3,9% 19,5% $4.992 26,2x 37,7x 26,3x 1,1x 4,4 2,4 4,0 1,4
G. ARGOS-PF $18.300,0 -0,9% 3,1% 21,2% $4.992 26,2x 37,7x - 1,0x 4,4 2,4 - 1,5
GRUPOSURA-COMUN $39.900 0,6% 4,2% 12,4% $7.347 13,6x 15,9x 14,0x 1,0x 7,8 5,6 6,0 1,1
GRUPOSURA-PF $39.200 0,9% 4,3% 13,3% $7.347 13,6x 15,9x - - 7,8 5,6 - 1,1
ISA $9.190 1,7% 4,4% 26,5% $3.276 13,5x 10,1x 15,0x 1,3x 8,1 10,4 8,4 3,1
NUTRESA $25.600 -0,6% 2,2% 14,5% $3.857 29,2x 20,8x 26,8x 1,4x 5,5 6,2 5,8 1,9
Performance P/E ROE %

10
Source: Bloomberg & Actinver
Peru Equities Monitor: S&P BVL, PE ratio, Advancers & Decliners
Peruvian Equites– S&P/BVL LTM S&P/BVL Index - 12-mth forward looking PE Ratio
Top Advancers & Decliners S&P BV LIMA WoW Top Advancers & Decliners S&P BV LIMA YTD
0x
5x
10x
15x
20x
25x
30x
35x
2013 2014 2015 2016
9.000
10.000
11.000
12.000
13.000
14.000
15.000
Jul-15 Sept-15 Nov-15 Ene-16 Mar-16 May-16
-10% -5% 0% 5% 10% 15%
CERRO VERDE
FERREYCORP
RELAPASA
MINSUR
EL BROCAL
EDELNOR
EDEGEL
INV. CENTENARIO
ALICORP
TREVALI MINING
-50% 0% 50% 100% 150% 200% 250% 300%
AUSTRAL
SOUTHERN COPPER
MINERA IRL
INV. CENTENARIO
ENGIE ENERGIA PERU
GRAÑA Y MONTERO
MINSUR
BUENAVENTURA
ATACOCHA
VOLCAN

11
Source: Bloomberg & Actinver
Performance in Local Currency
Peru Equities Monitor: S&P BVL – Performance and Stock Valuations
Price Mk Cap Price/Book Div Yield %
Jul-22 Weekly MTD YTD US$ mn 2014 2015 2016e 2014 2015 2016e LTM
ACEROS AREQUIPA-COM $0,74 0,0% 5,7% 57,4% $236 8,3x 3,1x - 0,5x 4,2 5,2 - 3,5
ACEROS AREQUIPA-INV $0,63 -3,1% 5,0% 140,5% $236 8,3x 3,1x - 0,4x 4,2 5,2 - 4,2
ALICORP $7,15 10,0% 10,9% 24,3% $1.597 29,3x 30,1x 18,6x 2,7x 9,9 7,5 13,1 0,8
ATACOCHA $0,33 0,9% 17,4% 226,7% $83 - - - 1,6x -2,8 -38,6 -32,3 -
AUSTRAL $1,38 0,0% 10,4% -15,3% $99 - - - 0,7x -9,2 -0,7 - -
BACKUS $14,37 0,1% 3,2% 16,3% $5.630 1,7x 1,4x - 1,0x 53,2 66,1 - 6,2
BUENAVENTURA $12,70 0,4% 6,7% 206,0% $2.894 - - 24,7x - -2,2 -10,0 2,7 -
CASA GRANDE $6,70 -2,9% 15,5% 103,5% $149 11,1x 2,9x - 0,4x 4,6 7,5 - 6,3
CERRO VERDE $19,70 -5,3% 6,4% 35,9% $1.918 22,2x 152,5x 18,5x 1,5x 8,5 0,7 9,3 -
CONTINENTAL $3,62 -1,6% 7,7% 58,6% $4.649 10,7x 7,2x - 2,7x 25,3 23,5 - 3,9
CREDICORP $162,0 3,8% 5,1% 68,2% $12.048 15,1x 8,0x 12,8x - 17,9 20,6 19,6 1,4
EDEGEL $3,07 7,3% 19,0% 14,2% $2.062 15,1x 14,5x 14,6x 2,8x 21,6 18,7 20,0 2,5
EDELNOR $5,85 4,5% 5,0% 21,8% $1.059 12,1x 9,5x - 2,4x 23,1 22,2 - 3,4
EL BROCAL $6,20 -3,1% 10,7% 34,9% $232 11,3x - - 0,7x 6,4 -20,3 -6,7 -
ENGIE ENERGIA PERU $8,50 1,9% 1,2% 6,5% $1.519 14,8x 7,9x 10,7x 1,7x 18,7 20,8 21,4 3,6
FERREYCORP $1,60 -4,2% 2,6% 24,7% $506 17,2x 7,9x 6,1x 0,9x 6,0 10,2 14,4 5,5
GRAÑA Y MONTERO $5,00 0,0% 7,8% 156,5% $904 15,2x 13,6x 14,3x 1,2x 11,7 3,6 7,2 0,9
IFS $30,15 -2,7% 0,5% - $1.050 10,2x 6,6x 10,9x 2,4x 23,8 30,4 23,2 4,3
INRETAIL $17,87 -0,7% 7,7% 27,6% $516 48,3x 31,8x 22,9x 1,9x 3,9 4,9 7,9 -
INV. CENTENARIO $5,50 7,8% 7,8% 2,0% $324 6,9x 3,7x - 0,7x 14,7 20,4 - 7,3
LUZ DEL SUR $11,22 3,1% 6,8% - $1.544 12,3x 9,6x - 2,8x 24,5 24,3 - 5,0
MILPO $2,25 -0,9% 5,1% 44,0% $867 7,1x 10,9x 14,1x 1,4x 17,1 7,2 10,2 1,9
MINERA IRL $0,05 0,0% 0,0% 0,0% - - - 1,4x - -45,0 -15,1 - -
MINSUR $1,30 -3,7% 10,2% 160,0% $1.044 20,3x - 10,0x 1,0x 5,1 -40,1 4,0 -
PACASMAYO $6,09 1,0% 3,7% 21,8% $990 14,5x 12,0x 16,3x 1,7x 10,2 11,9 9,5 4,6
PANORO MINERALS $0,15 4,3% 8,1% 84,8% $9 - - - - -4,7 -7,5 -3,6 -
POMALCA $0,21 -0,5% -8,7% 7,2% $22 - 53,1x - 0,1x -0,9 0,2 - -
RELAPASA $0,26 -4,1% 8,9% 123,5% $247 - 2,1x - 0,5x -17,9 4,1 - -
SOUTHERN COPPER $26,2 -0,6% -2,1% -0,7% $20.975 15,3x 27,5x 26,8x 3,8x 23,0 14,0 14,5 0,8
TREVALI MINING $0,68 13,3% 58,1% 91,5% $54 - - 24,9x - -2,0 -4,3 3,3 -
UNACEM $2,77 2,6% 9,5% 65,3% $1.303 15,0x 38,6x 11,1x 1,2x 8,6 1,9 12,8 1,9
VOLCAN $0,66 -2,5% 12,1% 254,8% $896 17,3x - 15,3x 0,8x 3,8 -5,4 4,3 2,0
Performance P/E ROE %

12
Source: Bloomberg & Actinver
Argentina Equities Monitor: MAR, PE ratio, Advancers & Decliners
Argentine Equities– MAR Index LTM MAR Index - 12-mth forward looking PE Ratio
Top Advancers & Decliners MAR WoW Top Advancers & Decliners MAR YTD
7.000
8.000
9.000
10.000
11.000
12.000
13.000
14.000
15.000
16.000
Jul-15 Sept-15 Nov-15 Ene-16 Mar-16 May-16
0x
2x
4x
6x
8x
10x
12x
14x
16x
18x
2011 2012 2013 2014 2015
-10% -5% 0% 5% 10% 15%
SAN MIGUEL
GF GALICIA
PAMPA ENERGIA
CONSULTATIO
BANCO MACRO
BANCO FRANCES
COME
EDENOR
ALUAR
SIDERAR
-50% 0% 50% 100% 150% 200%
COME
TRANSENER
ALUAR
SIDERAR
EDENOR
YPF
PAMPA ENERGIA
BANCO MACRO
SAN MIGUEL
MIRGOR

13
Source: Bloomberg & Actinver
Performance in Local Currency
Argentina Equities Monitor: MAR – Performance and Stock Valuations
Price Mk Cap Price/Book Div Yield %
Jul-22 Weekly MTD YTD US$ mn 2014 2015 2016e 2014 2015 2016e LTM
ALUAR $10,50 9,9% 9,4% -10,6% $1.843 13,4x 17,6x - 3,8x 14,6 19,0 - 0,5
BANCO MACRO $116 -1,6% 3,6% 45,7% $4.278 8,0x 6,6x 11,8x 3,8x 31,8 44,3 32,9 0,3
BANCO FRANCES $106 0,4% 2,8% 18,8% $3.770 8,5x 9,2x 12,5x 3,8x 32,4 38,8 31,2 2,3
COME $3,10 3,3% 5,8% -13,4% $273 0,9x 1,0x - 0,3x 25,3 36,1 - -
CONSULTATIO $41 -2,0% 13,3% 24,1% $1.004 9,0x 5,1x - 2,9x 41,3 52,7 - 0,9
EDENOR $13 3,9% 0,4% 6,0% $738 - 8,7x 17,5x 8,5x -211,8 84,5 33,0 -
GF GALICIA $46,1 -3,3% -0,1% 25,6% $4.074 6,9x 7,9x 11,0x 3,8x 34,1 42,1 33,5 0,3
MIRGOR $1.548 -1,0% 14,0% 186,3% $575 6,7x 4,4x - 6,8x 18,3 57,0 - 0,1
MOLINOS $105,5 -1,4% 26,3% 27,1% $1.496 12,8x 13,5x - 8,4x 39,6 55,4 - -
PAMPA ENERGIA $16,6 -2,4% 1,5% 43,1% $1.808 7,5x 4,8x 11,1x 3,7x 26,6 45,5 36,5 -
SAN MIGUEL $93,8 -6,6% 16,6% 93,6% $325 5,1x 6,4x - 5,9x 29,6 33,4 - 0,1
SIDERAR $8,45 12,1% 13,1% 4,9% $2.212 5,0x 15,1x - 1,6x 28,4 10,8 - 5,0
TELECOM ARG. $57,5 -0,9% 2,4% 26,8% $3.752 11,4x 9,2x 12,8x 3,1x 26,8 27,8 22,9 1,3
TRANSENER $7,22 0,3% 2,7% -12,7% $200 9,8x 50,1x 20,6x 5,7x 24,5 10,9 16,0 -
YPF $284 -1,0% -1,0% 30,1% $8.038 13,2x 13,4x 10,4x 0,8x 13,0 5,3 7,5 0,8
Performance P/E ROE %

14
Source: Bloomberg & Actinver
Currencies
Mexican Peso (MXN/USD) – LTM Colombian Peso (COP/USD) – LTM
Peruvian Sol (PEN/USD) – LTM Argentine Peso (ARP/USD) – LTM
14
15
16
17
18
19
20
Jul-15 Sept-15 Nov-15 Ene-16 Mar-16 May-162.000
2.200
2.400
2.600
2.800
3.000
3.200
3.400
3.600
Jul-15 Sept-15 Nov-15 Ene-16 Mar-16 May-16
3,0
3,1
3,2
3,3
3,4
3,5
3,6
Jul-15 Sept-15 Nov-15 Ene-16 Mar-16 May-168
9
10
11
12
13
14
15
16
17
Jul-15 Sept-15 Nov-15 Ene-16 Mar-16 May-16

15
Source: Bloomberg & Actinver
CDS Spreads
CDS Chile (5 years) – LTM CDS Colombia (5 years) – LTM
CDS Peru (5 years) – LTM CDS Mexico (5 years) – LTM
0
20
40
60
80
100
120
140
160
Jul-15 Sept-15 Nov-15 Ene-16 Mar-16 May-16
0
100
200
300
400
Jul-15 Sept-15 Nov-15 Ene-16 Mar-16 May-16
0
50
100
150
200
250
Jul-15 Sept-15 Nov-15 Ene-16 Mar-16 May-16
0
50
100
150
200
250
Jul-15 Sept-15 Nov-15 Ene-16 Mar-16 May-16
