presentation by yannick degeilh ece 590 i seminar university of illinois at champaign-urbana...
TRANSCRIPT

presentation by
Yannick Degeilh
ECE 590 I SeminarUniversity of Illinois at Champaign-Urbana
November 26th, 2012 1
STOCHASTIC SIMULATION OF POWER
SYSTEMS WITH INTEGRATED
RENEWABLE AND STORAGE
RESOURCES

KEY OBJECTIVES
Construct a comprehensive simulation approach to emulate the behavior of power systems with integrated storage and renewable energy resources in a competitive environment
Develop models for the resources and the loads that capture their salient characteristics –variability and uncertainty, with spatial and temporal dependencies – as well as their interactions over the grid and in the markets
Demonstrate the simulation approach capabilities with a number of case studies that assess the impacts of storage and renewable resource integration on the power system variable effects
2

3
US RENEWABLE PORTFOLIO STANDARDS
Source: www.dsireusa.org, November 2012
29 states,+ Washington DC and 2 territories,have
Renewable Portfolio Standards
(8 states and 2 territories have
renewable portfolio goals).

THE CHANGING ENVIRONMENT
There is a growing worldwide interest in integrating renewable resources, as well as storage resources, into the grid to displace costly and polluting fossil-fuel-fired generation
The objective of such integration is to push the creation of sustainable paths to meet the nation’s energy needs and to veer it towards energy independence
The context within which this progress unrolls is in the restructured, competitive electricity industry and the advances in the implementation of the Smart Grid
4

SALIENT CHARACTERISTICS OF SOLAR AND WIND POWER OUTPUTS
Highly time-dependent nature:
variability characteristics
intermittency effects
seasonal dependence
Spatially correlated
Inherently uncertain and difficult to characterize
analytically
Predictable with limited accuracy
Come with limited controllability/dispatchability 5

6
PV POWER OUTPUT OF 1 - MW CdTe ARRAY IN GERMANY
kW
1000
0
samples collected on a 5 – minute basis
5:00
6:00
7:00 8:
009:
0010
:00
11:0
012
:00
13:0
014
:00
15:0
016
:00
17:0
018
:00
19:0
020
:00
900
800
700
600
500
400
300
200
100

PV OUTPUT AND LOAD
Sources: ERCOT and NREL
10
20
30
40
50
load
(G
W )
24 48 72 96 120 144 1680
100
200
300
PV
ou
tpu
t (M
W )
time (h)
500
400
7

CAISO DAILY WIND POWER PATTERNS IN MARCH 2005
Source: CAISO
MW700
600
500
400
300
200
100
0
hour8
Source: CAISO

ONTARIO DAILY WIND POWER OUTPUT
MW700
600
500
400
300
200
100
0
hour9Source: IESO

MISALIGNMENT OF WIND POWER OUTPUT AND LOAD
0
50
100
150
200
250
win
d po
wer
ou
tpu
t (M
W)
24 48 72 96 120 144 168 3000
4000
5000
6000
7000
8000
load
(M
W)
hour
wind power
load
10

ISSUES IN INTEGRATING WIND AND SOLAR RESOURCES
Misalignment of the wind power outputs with the
load implies that the wind speeds are rarely ade-
quate at times when needed to supply the loads
While morning and mid-day solar power outputs
are aligned with the loads, their quick decline after
sunset occurs when the loads are still high
The risk of spilling wind due to inadequate loads at
night and the challenges of managing base-loaded
unit shut down for short periods during low-load
hours is a major problem11

TAKING ADVANTAGE OF INTEGRATED STORAGE RESOURCES
In order to take advantage of the increased flexi-
bility imparted by the grid-integrated storage
devices, we developed appropriate models,
methodologies and tools
The resulting approach has applications to:
planning and investment analysis;
policy analysis;
operations; and
market performance12

UTILITY - SCALE STORAGE CHARACTERISTICS
A storage unit may act as either a generating unit; or a load; or is idle – neither as a load nor as a generator
Storage unit operations are driven by the other
resources and so storage is a highly time-dependent resource storage operations are uncertain due to its
dependence on other uncertain resources Exploitation of arbitrage opportunities in the
determination of storage operations is critical 13

14
UTILITY - SCALE STORAGE APPLICATION
MW
storage resource discharging
during peak hours
storage resource charging
during low-load hours
0 12 24

15
WIND/STORAGE SYMBIOTIC INTERACTIONS
MW
hours
unit i - 1
unit i
unit i - 2
…
base-loaded units
unit i + 1unit i + 2unit i + 3
units are
loaded in
order of
increasing
prices of unit
production
energy discharged during peak hours
energy charged during low-load hours
daily load shape
modified daily load shape by wind
0 12 24
chargingunits
displaced units

16
THE NEED FOR A NEW SIMULATION APPROACH
The detailed simulation of integrated storage, wind,
solar and active demand response resources re-
quires the representation of the time–dependent
operational actions in line with the market results
Uncertainties in the loads, wind and solar outputs
and conventional unit available capacities requires
their explicit representation together with their
time–varying nature

17
NEED TO EXPLICITLY REPRESENT
The loads and their associated uncertainty
The resources and their associated uncertainty:
conventional generators
utility-scale storage units
renewable resources
The spatial and temporal correlations among the
resources at the various sites and the loads
The impacts of the grid constraints
The hourly day-ahead markets (DAMs)

18
THRUST OF THE APPROACH
We develop a comprehensive, computationally
efficient Monte Carlo simulation approach to emulate
the behavior of the power system with integrated
storage and renewable energy resources We model the system load and the resources by
discrete-time stochastic processes We deploy the storage scheduler to utilize arbitrage
opportunities in the storage unit operations We emulate the transmission-constrained hourly day-
ahead markets (DAMs) to determine the power
system operations in a competitive environment

19
THRUST OF THE APPROACH
We construct appropriate c.d.f. approximations to
evaluate the expected system variable effects
Metrics we evaluate include:
nodal electricity prices (LMPs)
generation by resource and revenues
congestion rents
CO 2 emissions
LOLP and EUE system reliability indices

20
KEY CONTRIBUTIONS
Development of a new simulation tool appropriate
to address today’s power industry challenges
Salient features include:
quantification of the power system expected
variable effects – economics, reliability and
environmental impacts – in each sub-period
computationally tractable for practical systems

21
STUDY CONTRIBUTIONS
detailed stochastic models of the time–varying
resources and loads allow the representation of
spatial and temporal correlations
storage scheduler for optimized storage
operation to exploit arbitrage opportunities
representation of the transmission–constrained
market outcomes
flexibility in the representation of the market
environment / policies

22
THE TIME DIMENSION IN SIMULATION STUDIES
We decompose a multi-year study period into T
non-overlapping simulation periods
We specify the simulation periods in such a way
that no changes in the resource mix, unit commit-
ment, the transmission grid and the policy environ-
ment occur during each simulation period; such
changes may occur in subsequent periods
. . .time
study period
period tperiod 1 period T. . . . . .

23
THE SUBPERIODS: THE SMALLEST INDECOMPOSABLE UNITS OF TIME
We introduce sub-periods to explicitly represent
the time dependence of the side-by-side power
system and market operations
We use hourly sub-periods in the simulation and no
phenomena of shorter duration are represented
. . .period 1 period T. . . . . .period t
sub-period 1 sub-period Hsub-period h. . . . . .time
study period

24
THE SIMULATION APPROACH: KEY ASSUMPTIONS
The system is in the “steady state” for each sub-
period and we ignore shorter duration phenomena
The behavior of each market participant is
independent of that of the other participants and
no participant engages in strategic behavior
The grid is lossless and the DC power flow conditions
hold over the entire study period

25
PROPOSED SIMULATION APPROACH: CONCEPTUAL STRUCTURE
“dri
ver”
sto
chas
tic
pro
cess
es
renewable power outputs
conventional generator available capacities
loads
storage schedule
market
clearing
procedure
(DCOPF)
congestion rents
CO 2
emissions
storage operations
. . .
“ou
tcom
e” s
toch
asti
c pr
oces
ses
LMPs

26
CONCEPTUAL REPRESENTATION OF A SINGLE SIMULATION RUN

27
QUANTIFICATION OF SYSTEM VARIABLE EFFECTS
We use the approximations to the joint c.d.f.s of
the market outcome stochastic processes to compute
the expected values of the system variable effects
in each sub-period
In this way, we evaluate all the figures of merit of
interest, including expected electricity payments,
expected energy supplied by each resource,
reliability indices and expected emissions

28
TO ENSURE NUMERICAL TRACTABILITY
We introduce various schemes that reduce the
computing burden and provide tractability
Key implementational aspects:
selection of a group of representative weeks
variance reduction techniques: stratification,
control variates and common random numbers
warm-start of the linear program solver
parallelization of simulation runs

29
TYPICAL APPLICATIONS
Resource planning studies
Production costing issues
Transmission utilization issues
Environmental assessments
Reliability analysis
Investment analysis

30
CASE STUDIES
29

31
MOTIVATION
We present case studies aimed at illustrating the
various capabilities of the simulation approach
and relevant to the integration of storage and
renewable resources
We perform sensitivity studies to investigate
several aspects of storage integration into the
grid, notably its impact in a system with
deepening wind penetration, its siting, and to
what extent storage and renewable resources
may replace conventional generation

32
CASE STUDIES
We present 3 sets of representative case studies:
case study set I: impacts of an integrated
utility-scale storage unit under a deepening
wind penetration scenario
case study set II: siting of 4 energy storage
units and the impacts on transmission usage
case study set III: substitution of conventional
generation resources by a combination of
storage and wind energy resources

33
CASE STUDY SET I: DEEPENING WIND PENETRATION
The objective of this study is to perform a wind
penetration sensitivity analysis and to quantify the
enhanced ability to harness wind resources with
the addition of a storage energy resource
We evaluate the key metrics for variable effect
assessment, including wholesale purchase
payments, reliability indices and CO 2 emissions

34
THE STUDY TEST SYSTEM: A MODIFIED IEEE 118-BUS SYSTEM
Annual peak load: 8,090.3 MW
Conventional generation resource mix: 9,714 MW
4 wind farms located in the Midwest with total
nameplate capacity in multiples of 680 MW
A storage unit with 400 MW capacity, 5,000 MWh
storage capability and 89 % round-trip efficiency
Unit commitment uses a 15 % reserves margin provi-
ded by conventional units and the storage resources

35
casetotal installed wind
nameplate capacity in MW
base 0
A 680
B 1,360
C 2,040
D 2,720
SENSITIVITY CASES IN STUDY SET I

36
CASE D: AVERAGE HOURLY STORAGE UTILIZATION
hou
rly
sto
rage
ch
arge
/dis
char
ge
capa
city
in
MW
load
0 24 48 72 96 120 144 168- 400
- 300
- 200
- 100
0
100
200
300
400
hour
4.5
5.0
5.5
6.0
6.5
7.0
7.5
8.0
8.5
load
in
GW

37
NODE 80 AVERAGE HOURLY LMPs
LM
P i
n $
/MW
h
hour
base case
case A
case B
case D
case C
0 24 48 72 96 120 144 1680
5
10
15
20
25
30
35
40
45
50with storage without storage

38
0 20 40 60 80 1000
5
10
15
20
25
30
35
40
45
50
NODE 80 AVERAGE HOURLY LMP DURATION CURVE
LM
P i
n $
/MW
h
% of hours in the week
with storage without storage
base case
case A
case B
case D
case C

39
EXPECTED WHOLESALE PURCHASE PAYMENTS
thou
san
d $
base
case ca
se A
case
Bca
se C
case
D100
110
120
130
140
150
160
170
180
- 5.
1 %
- 9.
1 %
- 17
.9 %
- 25
.2 %
- 31
.1 %
- 15
.4 %
- 24
.4 %
- 31
.2 %
- 36
.9 %
with storagewithout storage

40
EXPECTED CO 2 EMISSIONS
base
case
case
Aca
se B
case
C
- 5.
6 %
- 10
.5 %
- 14
.5 %
- 17
.5 %
- 6.
0 %
- 11
.8 %
- 16
.4 %
- 19
.8 %
0.70
0.75
0.80
0.85
0.90
0.95
1.00
1.05
+ 0
.3 %
thou
san
d m
etri
c to
ns
case
D
with storagewithout storage

41
ANNUAL RELIABILITY INDICES
EUE
base
case
case
Aca
se B
case
Cca
se D
6.24
0
1.04
2.08
3.12
4.16
5.20
base
case ca
se A
case
Bca
se C
case
D0
2
4
6
8
10
12
x 10-4
- 37
.5 %
- 50
.0 %
- 65
.6 %
- 80
.1 %
- 43
.8 %
- 56
.3 %
- 67
.1 %
- 71
.9 %
- 87
.5 %
- 42
.5 %
- 73
.9 %
- 80
.2 %
- 64
.1 %
- 55
.1 %
- 90
.0 %
- 82
.4 %
- 73
.5 %
- 94
.3 %
14
LOLP
with storagewithout storage with storagewithout storage
MWh

42
CASE STUDY SET II: STORAGE UNIT SITING
The objective of this study is to perform a sensiti-
vity analysis on the siting of 4 storage units in the
system and assess its impacts on transmission
usage and on the economics at the most heavily
loaded bus in the network
We quantify the expected LMPs at the load center
at node 59 and the total congestion rents

43
TEST SYSTEM OF THE STUDY: A MODIFIED IEEE 118-BUS SYSTEM
Annual peak load: 8,090.3 MW
Conventional generation resource mix: 9,714 MW
4 wind farms located in the Midwest with total
nameplate capacity 2,720 MW
4 identical utility-scale storage units, each having
200 MW capacity, 5,000 MWh storage capability and
89% round-trip efficiency
Reserves margin is set at 15 % and is provided by
conventional and storage resources

44
STORAGE SITING ON THE MODIFIEDIEEE 118 – BUS TEST SYSTEM
15
14
13
12
117
16
1
2
3
4
11
5 6
7
8
9
10
17
30
113
31
29
28
27
32
114 115
18 19
33
34
37
20
21
22
23
25
26
35
36
38
39
40 41 42
43
44
45
4647
48
49
52
53
54
50 51
57 58
56
55
60
59
61
62
64
63
65
66
67
6869
24
72
70
71
73
74
75 118
76
77
78
116
79
81
80
82
83
84
85
86
97
96
98
88
95 94
89 92
90
91
93
99
102 101
100
103
104
105
106
107
108
109
110
111 112
87
0.95 pu
1.00 pu1.00 pu
1.00 pu
1.00 pu
1.00 pu 0.99 pu
1.00 pu
1.00 pu
1.01 pu
1.00 pu
1.00 pu
1.00 pu
1.00 pu
1.00 pu
1.05 pu
1.00 pu0.97 pu
0.99 pu
1.00 pu
1.00 pu 0.96 pu
0.97 pu
1.00 pu1.00 pu
1.01 pu
1.05 pu
1.00 pu
1.00 pu
1.00 pu
1.00 pu
1.00 pu
0.97 pu0.96 pu
1.00 pu
0.97 pu
1.00 pu
1.00 pu
1.00 pu
0.98 pu 1.00 pu
0.98 pu
0.99 pu 0.99 pu
0.98 pu
1.00 pu
1.00 pu
0.96 pu
0.98 pu
1.03 pu
1.00 pu
1.00 pu
1.00 pu
1.00 pu
1.00 pu
1.00 pu
1.00 pu
0.94 pu
1.01 pu
1.00 pu
0.99 pu
1.00 pu
1.00 pu
1.00 pu
1.00 pu
1.00 pu
1.01 pu
1.00 pu
1.00 pu
1.00 pu
1.02 pu
1.00 pu
1.00 pu
0.98 pu1.00 pu0.97 pu
0.95 pu 0.95 pu
1.00 pu
1.00 pu
1.00 pu
1.00 pu
1.05 pu
1.00 pu
1.00 pu
1.00 pu
1.00 pu
1.00 pu
1.00 pu 1.00 pu 1.01 pu
1.00 pu
1.00 pu 1.00 pu
1.00 pu
0.99 pu
0.99 pu
0.98 pu
1.00 pu 1.00 pu1.01 pu
0.97 pu
0.99 pu
1.00 pu
1.00 pu
1.00 pu
1.00 pu
0.98 pu
0.95 pu
0.98 pu0.98 pu
0.97 pu
1.00 pu
1.00 pu
0.96 pu
1.00 pu
0.95 pu
51 MW
27 Mvar
39 MW
10 Mvar
30 MW
12 Mvar
-9 MW
0 Mvar
70.00 MW
23.00 Mvar
0 MW
0 Mvar
52 MW
22 Mvar
85 MW
0 Mvar
47 MW
10 Mvar
19 MW
2 Mvar
-28 MW
0 Mvar
25 MW
10 Mvar
34 MW
16 Mvar
14 MW
1 Mvar
20 MW
8 Mvar 9 Mvar
20 MW
450 MW
0 Mvar
24 MW
4 Mvar
43 MW
27 Mvar
7 MW
0 Mvar
-6 MW
0 Mvar
3 Mvar
11 MW
7 Mvar
17 MW
23 Mvar
59 MW
0 MW
0 Mvar
62 MW
13 Mvar
-9 MW
0 Mvar
3 Mvar
8 MW
7 Mvar
22 MW
314 MW
0 Mvar
0 Mvar
220 MW
10 MW
5 Mvar
8 Mvar
14 MW
18 MW
3 Mvar
0 MW
0 Mvar
60 MW
34 Mvar
0 MW
0 Mvar
45 MW
25 Mvar
33 MW
9 Mvar
0 MW
0 Mvar 30 Mvar
90 MW
23 MW
9 Mvar
27 MW
11 Mvar
-25 Mvar
59 MW
26 Mvar
0 MW
0 Mvar
13 Mvar
0 Mvar
0 MW
31 MW
17 Mvar
0 Mvar
-13 MW
0 Mvar
-6 MW
-12 MW
0 Mvar
47 MW
11 Mvar
68 MW
27 Mvar
0 MW
0 Mvar
11 Mvar 66 MW
20 Mvar
0 Mvar
0 MW
34 MW
0 Mvar
10 Mvar
19 MW
0 Mvar
28 MW
10 Mvar
22 Mvar
53 MW
10 Mvar
15 Mvar 11 Mvar
20 MW
7 Mvar
18 MW
10 Mvar 8 Mvar
16 MW
15 Mvar
33 MW
36 Mvar
68 MW
0 Mvar
0 MW
4 MW
0 Mvar
10 Mvar
21 MW
0 Mvar
0 MW
15 Mvar
24 MW
10 Mvar
48 MW
0 Mvar
607 MW
7 Mvar
11 MW
10 Mvar
20 MW
10 Mvar
0 Mvar
0 MW
20 Mvar
27 Mvar
54 MW
0 MW
0 Mvar
61 MW
28 Mvar
-184 MW
0 Mvar
0 Mvar
391 MW
87 MW
30 Mvar
204 MW
0 Mvar
5 Mvar
18 MW
11 Mvar
23 MW
23 Mvar
37 MW
0 Mvar
-59 MW
10 Mvar
37 MW
23 Mvar
20 MW
0 Mvar
0 Mvar
48 MW
32 Mvar
113 MW
0 Mvar
0 MW
18 Mvar
84 MW
12 MW
3 Mvar
12 MW
3 Mvar
17 MW
4 Mvar
17 MW
8 Mvar
18 Mvar
39 MW
392 MW
0 Mvar
7 Mvar
28 MW
32 Mvar
39 MW
20 Mvar
71 MW
26 Mvar
26 Mvar
130 MW
0 Mvar
477 MW
15 MW
9 Mvar
34 MW
8 Mvar
-42 MW
0 Mvar
15 Mvar
38 MW
42 MW
31 Mvar
30 MW
16 Mvar
12 MW
7 Mvar
78 MW
42 Mvar
-85 MW
0 Mvar
-10 MW
0 Mvar
65 MW
10 Mvar
5 MW
3 Mvar
22 MW
15 Mvar
23 MW
16 Mvar
40 MW
0 Mvar
0 Mvar
0 MW
25 Mvar
38 MW 0 Mvar
252 MW
37 MW
18 Mvar
77 MW
14 Mvar
0 MW
0 Mvar
160 MW
0 Mvar
78 MW
3 Mvar
155 MW
113 Mvar
277 MW
113 Mvar
0 Mvar
0 MW 63 MW
22 Mvar
13 Mvar
25 MW
-43 MW
0 Mvar
36 MW
0 Mvar
30 Mvar
39 MW
6 Mvar
8 MW
3 Mvar
2 MW
1 Mvar
19 Mvar 0 Mvar
0 MW
26 Mvar
31 MW
-22 MW
0 Mvar
12 Mvar
28 MW
5 Mvar
16 Mvar
43 MW
-40 Mvar
0 Mvar
W
W
W
W
storage siting region
most heavily loaded bus at node 59
43

45
case siting of the storage units
base no storage units
S0 at the principal load center
S1 1 node away
S2 2 nodes away
S3 3 nodes away
SENSITIVITY CASES IN STUDY SET II
each case has 2,720 MW nameplate wind capacity
46
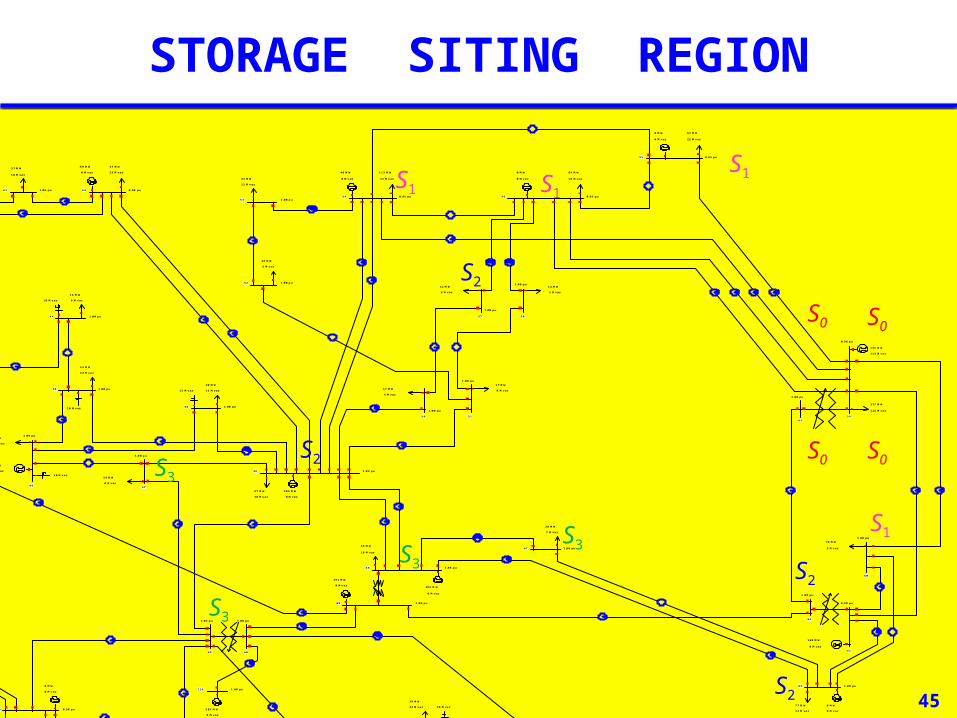
STORAGE SITING REGION
38
39
40 41 42
43
44
45
4647
48
49
52
5354
50 51
57 58
56
55
60
59
61
62
64
63
65
66
67
6869
72
70
71
73
78
116
79
1.00 pu
1.00 pu
1.00 pu
A
MVA
A
MVA
A
MVA
0.99 pu
0.98 pu
1.00 pu
A
MVA
0.98 pu
1.03 pu
1.00 pu
1.00 pu
A
MVA
A
MVA
A
MVA
A
MVA
1.00 pu
1.00 pu
1.00 pu
A
MVA
A
MVA
1.00 pu
A
MVA
A
MVA
A
MVA
A
MVA
A
MVA
A
MVA
A
MVA
A
MVA
1.00 pu
1.00 pu
1.00 pu
A
MVA
A
MVA
A
MVA
1.02 pu
A
MVA
A
MVA
1.00 pu
A
MVA
A
MVA
1.00 pu
0.98 pu
A
MVA
A
MVA
A
MVA
1.00 pu0.97 pu
A
MVA
A
MVA
0.95 pu
A
MVA
0.95 pu
A
MVA
A
MVA
A
MVA
A
MVA
1.00 pu
1.00 pu
A
MVA
A
MVA
A
MVA
A
MVA
A
MVA
A
MVA
1.00 pu
1.00 pu
A
MVA
A
MVA
A
MVA
1.05 pu
A
MVA
1.00 pu
A
MVA
A
MVA
1.00 pu
1.00 pu
A
MVA
A
MVA
0.99 pu
1.00 pu
A
MVA
A
MVA
1.00 pu
A
MVA
1.00 pu
A
MVA
A
MVA
A
MVA
1.00 pu
0.98 pu
A
MVA
A
MVA
A
MVA
A
MVA
A
MVA
0.95 pu
A
MVA
A
MVA
A
MVA
27 MW
11 Mvar
-25 Mvar
0 Mvar
-6 MW
-12 MW
0 Mvar
68 MW
27 Mvar 11 Mvar 66 MW
20 Mvar
0 Mvar
0 MW
34 MW
0 Mvar
10 Mvar
19 MW
0 Mvar
28 MW
10 Mvar
22 Mvar
53 MW
10 Mvar
15 Mvar 11 Mvar
20 MW
7 Mvar
18 MW
10 Mvar 8 Mvar
16 MW
68 MW 0 MW
-184 MW
0 Mvar
0 Mvar
391 MW
87 MW
30 Mvar
204 MW
0 Mvar
5 Mvar
18 MW
11 Mvar
23 MW
23 Mvar
37 MW
0 Mvar
-59 MW
10 Mvar
37 MW
23 Mvar
20 MW
0 Mvar
0 Mvar
48 MW
32 Mvar
113 MW
0 Mvar
0 MW
18 Mvar
84 MW
12 MW
3 Mvar
12 MW
3 Mvar
17 MW
4 Mvar
17 MW
8 Mvar
18 Mvar
39 MW
392 MW
0 Mvar
7 Mvar
28 MW
32 Mvar
39 MW
20 Mvar 77 MW
14 Mvar
0 MW
0 Mvar
160 MW
0 Mvar
78 MW
3 Mvar
155 MW
113 Mvar
277 MW
113 Mvar
0 Mvar
0 MW 63 MW
22 Mvar
S0 S0
S0 S0
S1S1
S1
S1
S2
S2
S2
S2
S3S3
S3
S3
45

47
NODE 59 EXPECTED HOURLY LMPs
0
20
40
60
0 24 48 72 96 120 144 1684
5
6
7
8
9
10
LM
P i
n $
/MW
h
hour
load
in G
W
0 24 48 72 96 120 144 1680
10
20
30
40
50
60
LM
P in
$/M
Wh
number of hours in the week
base case
case S0
case S1
case S2
case S3base case
case S0
case S1
case S2 case S3

48
EXPECTED HOURLY CONGESTION RENTS
0
10
20
30
40
50
60
0 24 48 72 96 120 144 1684
5
6
7
8
9
10
con
gest
ion
ren
ts in
thou
san
d $
hour
load
in
GW
0 24 48 72 96 120 144 1680
10
20
30
40
50
60
con
gest
ion
ren
ts in
thou
san
d $
number of hours in the week
base case
case S0
case S1
case S2
case S3
base case
case S0
case S1
case S2
case S3

49
TRANSMISSION PATH CONGESTION AND ITS REENFORCEMENT
38
39
40 41 42
43
44
45
4647
48
49
52
5354
50 51
57 58
56
55
60
59
61
62
64
63
65
66
67
6869
72
70
71
73
78
116
79
1.00 pu
1.00 pu
1.00 pu
A
MVA
A
MVA
A
MVA
0.99 pu
0.98 pu
1.00 pu
A
MVA
0.98 pu
1.03 pu
1.00 pu
1.00 pu
A
MVA
A
MVA
A
MVA
A
MVA
1.00 pu
1.00 pu
1.00 pu
A
MVA
A
MVA
1.00 pu
A
MVA
A
MVA
A
MVA
A
MVA
A
MVA
A
MVA
A
MVA
A
MVA
1.00 pu
1.00 pu
1.00 pu
A
MVA
A
MVA
A
MVA
1.02 pu
A
MVA
A
MVA
1.00 pu
A
MVA
A
MVA
1.00 pu
0.98 pu
A
MVA
A
MVA
A
MVA
1.00 pu0.97 pu
A
MVA
A
MVA
0.95 pu
A
MVA
0.95 pu
A
MVA
A
MVA
A
MVA
A
MVA
1.00 pu
1.00 pu
A
MVA
A
MVA
A
MVA
A
MVA
A
MVA
A
MVA
1.00 pu
1.00 pu
A
MVA
A
MVA
A
MVA
1.05 pu
A
MVA
1.00 pu
A
MVA
A
MVA
1.00 pu
1.00 pu
A
MVA
A
MVA
0.99 pu
1.00 pu
A
MVA
A
MVA
1.00 pu
A
MVA
1.00 pu
A
MVA
A
MVA
A
MVA
1.00 pu
0.98 pu
A
MVA
A
MVA
A
MVA
A
MVA
A
MVA
0.95 pu
A
MVA
A
MVA
A
MVA
27 MW
11 Mvar
-25 Mvar
0 Mvar
-6 MW
-12 MW
0 Mvar
68 MW
27 Mvar 11 Mvar 66 MW
20 Mvar
0 Mvar
0 MW
34 MW
0 Mvar
10 Mvar
19 MW
0 Mvar
28 MW
10 Mvar
22 Mvar
53 MW
10 Mvar
15 Mvar 11 Mvar
20 MW
7 Mvar
18 MW
10 Mvar 8 Mvar
16 MW
68 MW 0 MW
-184 MW
0 Mvar
0 Mvar
391 MW
87 MW
30 Mvar
204 MW
0 Mvar
5 Mvar
18 MW
11 Mvar
23 MW
23 Mvar
37 MW
0 Mvar
-59 MW
10 Mvar
37 MW
23 Mvar
20 MW
0 Mvar
0 Mvar
48 MW
32 Mvar
113 MW
0 Mvar
0 MW
18 Mvar
84 MW
12 MW
3 Mvar
12 MW
3 Mvar
17 MW
4 Mvar
17 MW
8 Mvar
18 Mvar
39 MW
392 MW
0 Mvar
7 Mvar
28 MW
32 Mvar
39 MW
20 Mvar 77 MW
14 Mvar
0 MW
0 Mvar
160 MW
0 Mvar
78 MW
3 Mvar
155 MW
113 Mvar
277 MW
113 Mvar
0 Mvar
0 MW 63 MW
22 Mvar
S0 S0
S0 S0
S2
S2
2 x 400MW nuclear plants
most heavily loaded bus at node 59
48

50
PRE – PATH – REENFORCEMENT NODE 59 AVERAGE HOURLY LMPs
0
20
40
60
0 24 48 72 96 120 144 1684
5
6
7
8
9
10
LM
P i
n $
/MW
h
hour
load
in G
W
0 24 48 72 96 120 144 1680
10
20
30
40
50
60
LM
P in
$/M
Wh
number of hours in the week
base case
case S0
case S1
case S2
case S3base case
case S0
case S1
case S2case S3

51
POST – PATH – REENFORCEMENT NODE 59 AVERAGE HOURLY LMPs
0 24 48 72 96 120 144 1680
10
20
30
40
50
4
5
6
7
8
9
hour
load
in G
W
LM
P in
$/M
Wh
0 24 48 72 96 120 144 1680
10
20
30
40
50
60
LM
P in
$/M
Wh
number of hours in the week
base case
case S0
case S1
case S2
case S3
60base case
case S0
case S1
case S2
case S3

52
PRE – PATH – REENFORCEMENT AVERAGE HOURLY CONGESTION RENTS
0
10
20
30
40
50
60
0 24 48 72 96 120 144 1684
5
6
7
8
9
10
con
gest
ion
ren
ts in
thou
san
d $
hour
load
in
GW
0 24 48 72 96 120 144 1680
10
20
30
40
50
60
con
gest
ion
ren
ts in
thou
san
d $
number of hours in the week
base case
case S0
case S1
case S2
case S3
base case
case S0
case S1
case S2
case S3

53
POST – PATH – REENFORCEMENT AVERAGE HOURLY CONGESTION RENTS
24 48 72 96 120 144 1680
500
1,000
1,500
2,000
2,500
3,000
3,500
con
gest
ion
ren
ts i
n $
load
in
GW
con
gest
ion
ren
ts i
n $
hour number of hours in the week
base case
case S0
case S1
case S2
case S3
24 48 72 96 120 144 1680
500
1,000
1,500
2,000
2,500
3,000
3,500
5000
6000
7000
8000
0
base case
case S0
case S1
case S2
case S3

54
STUDY SET III: SUBSTITUTION FOR THE CONVENTIONAL RESOURCES
The aim of this study is to quantify the extent, from
a purely reliability perspective, wind resources can
substitute for conventional generation capacity in a
power system with integrated storage resources
We deem storage units to be firm capacity and use
them to meet the desired reserves margin
As the wind resources are integrated, we decrease
progressively the system reserves margin, retire
conventional unit capacity and assess the impacts

55
THE STUDY TEST SYSTEM: A MODIFIED IEEE 118-BUS SYSTEM
Annual peak load: 8,090.3 MW
Conventional generation resource mix: 9,714 MW
4 wind farms located in the Midwest with total
nameplate capacity of 2,720 MW
4 units: each has a 100 MW capacity, 1,000 MWh
storage capability and 89 % round-trip efficiency
The unit commitment is performed to ensure the
desired reserves margin is attained from the
conventional and storage resources

56
SET IV SENSITIVITY CASES
case reserves margin in %
base (no wind, no storage resources) 15
R0 15
R1 14
R2 13
R3 12
R4 11
R5 10
R6 9
R7 8
R8 7

57
WEEKLY RELIABILITY INDICES vs. RESERVES MARGINS
reserves margin in %
EUE
7 8 9 10 11 12 13 14 150
0.1
0.2
0.3
0.4
0.5
0.6
0.7
wee
kly
LO
LP
con
trib
uti
on
LOLP
reserves margin in %7 8 9 10 12 14
0
0.0005
0.0010
0.0015
0.0020
0.0025
0.0030
0.0035
0.0040
11
wee
kly
EU
E c
ontr
ibu
tion
in M
Wh
base case base case
1513

58
MEAN HOURLY WHOLESALE PURCHASE PAYMENT IMPACTS
24 48 72 96 120 144 1680
50
100
150
200
250
300
350
400
base case
15%
14%
13%
12%
11%
10%
9%
8%
7%
wh
oles
ale
purc
has
e pa
ymen
ts in
thou
san
d $
hour

59
KEY FINDINGS OF THE ILLUSTRATIVE STUDIES
Deeper penetration of wind resources reduces
DAM LMPs, wholesale purchase payments, CO 2
emissions and improves system reliability
Storage works in synergy with wind to drive
wholesale purchase payments further down and
improve system reliability
Overall, CO 2 emissions are not significantly
affected by the integration of a storage unit

60
KEY FINDINGS OF THE CASE STUDIES
Storage siting significantly impacts the congestion
rents and the LMPs at certain nodes
In a system whose storage resources are used to
substitute for conventional generation to meet the
desired reserves margin requirements, large
amounts of wind capacity are required to replace
the retired conventional generation capacity: in the
case studies presented the 2,720 MW of wind can
substitute for about 300 MW of retired conventional
generation capacity – about 3.7 % of peak load

61
KEY FINDINGS OF THE CASE STUDIES
Absent storage units, with all other conditions
remaining unchanged, the 2,720 MW wind can
replace only about 220 MW of retired conventional
generation capacity – about 2.7 % of peak load
We attain significant reductions in wholesale
purchase payments – about 25 % – when storage
and wind resources substitute for conventional
resource capacity, at the same reliability level

62
SALIENT SIMULATION APPROACH CHARACTERISTICS
A practically-oriented approach to simulate large-
scale systems over longer-term periods
Comprehensive and versatile approach to quantify
the impacts of the integration of storage devices
into power systems with deepening penetration of
renewable resources
Demonstration of the capabilities of the proposed
approach to a broad range of planning, investment,
transmission utilization and policy analysis studies

63
CONCLUDING REMARKS
Storage and wind resources consistently pair
well together: they reduce wholesale purchase
dollars and improve system reliability; storage
seems to attenuate the “diminishing returns”
trend seen with deeper wind power penetration The location of a storage unit can have large local
impacts; siting requires case-by-case studies Wind resources can substitute for conventional
resources to a very limited extent, even in a
system with integrated storage resources