présentation eau 24 septembre 2009
TRANSCRIPT
« Water scarcity: what role for the investor ?»
OXFAM Cheuvreux SRI Forum « Access to Water »Paris, September 24th

From collective investor responsibility …
• Water scarcity and unequal distribution of resources
• Drinkable Water
• Water Pollution
• Climate Change
A global issue with many water-intricated ESG challenges

… to individual investor responsibility
• A focus on water scarcity– A problem for agriculture– A problem for the food industry
• 2 governance questions– What responsibility of the food industry in water scarcity ?– How much cost dams-related environmental and social
controversies ? (analysed with International Rivers)

Responsibility of the food industry: missing link
Indirect water consumptionProduct l / kg Product l / kg
1 000 (600-1 400)
Milk powder 3 000 (2 000 - 4 000)
9 000 (7 000-11 000)
Vegetable oils 7 000(3 000 - 20 000)
Cocoa 7 000 (5 000 -10 000)
Coffee 20 000(15 000 - 30 000)
Sources : Hoekstra, Inter Expansion

Responsibility of the food industry
• Indirect water consumption
(more on calculation)
Direct (M m3 / y) Indirect (M m3 / y)Danone 8 10 000Nestlé 157 40 000Unilever 61 15 370
• An emerging answer but still a lack of understanding• Unilever on tea : “it is not a problem, it is green water”• Danone on milk in Saudi Arabia or Mexico• Nestlé : 0,004% or 1% of total water consumption

Controversies regarding dams
• Facts– 60% dams projects in the world generate controversies on
impact and use– Average overcost is 60% of estimated cost– Environmental and social issues are hidden, not extra costs.
• Joint analysis Inter Expansion – International Rivers– Analysis of compliance of the 7 World Commission on Dams
conditions for a sample of 13 dams (International Rivers)– Each condition considered as a failure probability– Double use : double impact on overcost

Financial impacts regarding dams : what else ?
• Compliance analysis : 3 conditions satisfied at best• Financial impacts :
– 4 projects overcost of 100% or more– 7 projects overcost: 50 to 65%– 2 projects overcost : 25%More details
• Who pays the bill ?– Lenders : supranationals and more specifically AFD– Carbon markets : many projects have asked for CER– Future generations : with damned dams in crazy sites
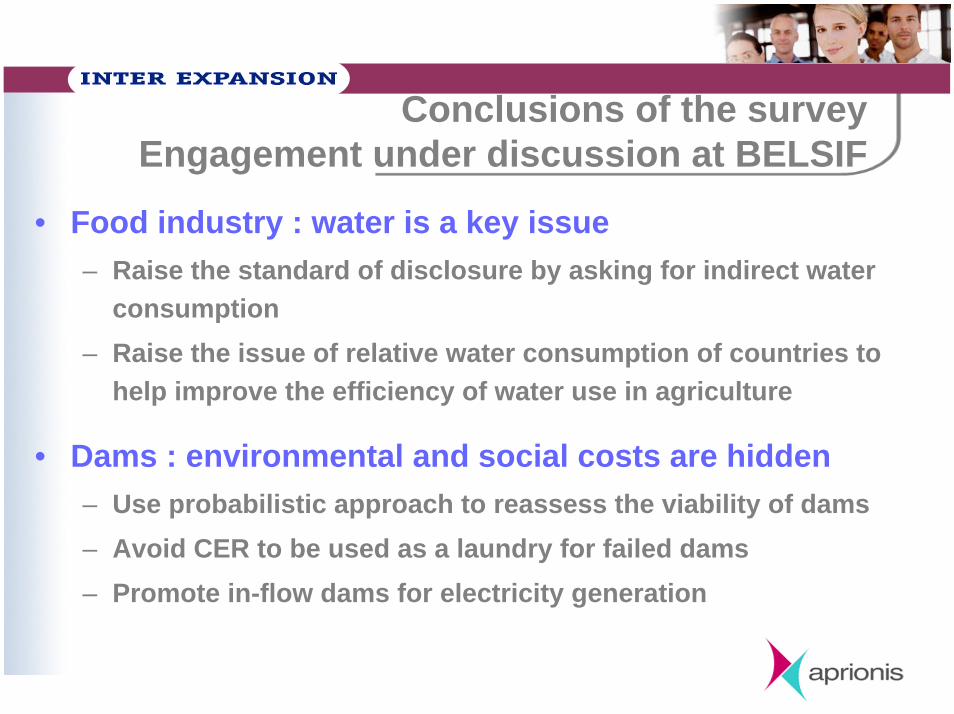
Conclusions of the surveyEngagement under discussion at BELSIF
• Food industry : water is a key issue– Raise the standard of disclosure by asking for indirect water
consumption– Raise the issue of relative water consumption of countries to
help improve the efficiency of water use in agriculture
• Dams : environmental and social costs are hidden– Use probabilistic approach to reassess the viability of dams– Avoid CER to be used as a laundry for failed dams– Promote in-flow dams for electricity generation

Thank You for your attention
Dr Grégory Schneider-MaunouryHead of SRI
APRIONIS – Inter ExpansionTél. : + 33 1 46 84 38 47E-mail : [email protected]
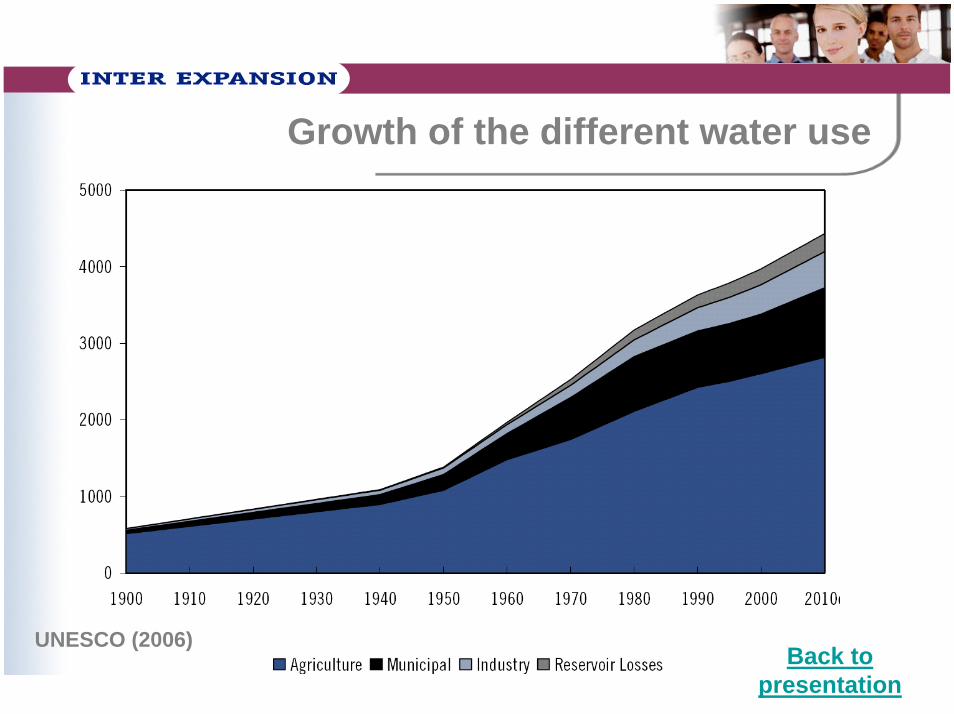
Growth of the different water use
Source: UNESCO
UNESCO (2006)Back to
presentation

Water scarcity : a moving area
« Thirsttriangle »
Rectangle of scarcity
Asiatic only problem ?
Asia
• 63% world population
• 36% freshwater resources
Percentage of population that will be in water scarcity
Less than 10%More than 40%
11 source : UN 2005

Water scarcity : unequality or waste ?
12IWMI, 2007
Back to presentation

Water consumption is dertermined by food and crop choices
Two key choices:Meat Consumption (vs. Fish) Water consuming export production (cotton)
Rockstrom & Barron, UNESCO, 2005
Back to presentation
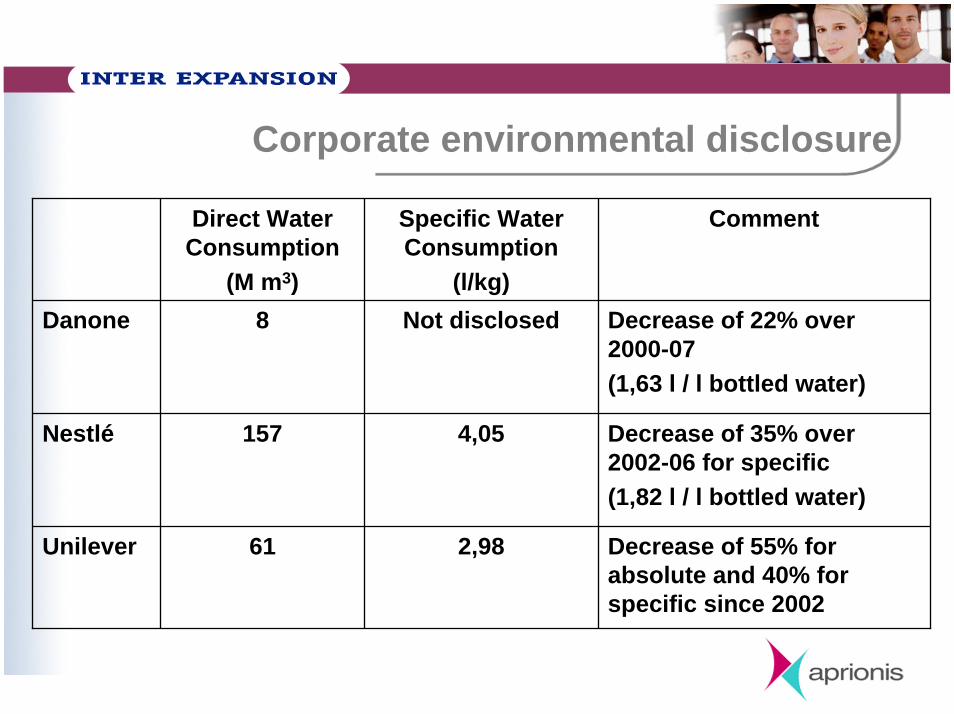
Corporate environmental disclosure
Direct Water Consumption
(M m3)
Specific Water Consumption
(l/kg)
Comment
Danone 8 Not disclosed Decrease of 22% over 2000-07(1,63 l / l bottled water)
Nestlé 157 4,05 Decrease of 35% over 2002-06 for specific(1,82 l / l bottled water)
Unilever 61 2,98 Decrease of 55% for absolute and 40% for specific since 2002

Some more financial data
Major raw materials (% sales)
Danone Milk : 16%
Nestlé Milk : 6%Coffee : 3%Cocoa : 2%
Unilever Palm oil : 6%Tea : 3%
Cocoa : 3%
This table enables to estimate the quantity of materials if not disclosedSource : Cheuvreux

Quantification of indirect consumption
Product l / kg Product l / kg
1 000 (600-1 400)
Milk powder 3 000 (2 000 - 4 000)
Tea 9 000 (7 000-11 000)
Vegetable oils 7 000(3 000 - 20 000)
Cocoa 7 000 (5 000 -10 000)
Coffee 20 000(15 000 - 30 000)
Sources : Hoekstra, Inter Expansion

Water risk exposure in the food industry
Water direct consumptionmillion m3 / yr
Water indirect consumptionmillion m3 / yr
Comment
Danone 8 10 000
700 l / € sales
Least exposed in absolute
Nestlé 157 40 000
600 l / € sales
The most transparent
Unilever 61 15 370
400 l / € sales
Least dependent on milk, with significant local initiatives
Back to presentation

Sample of the survey(with International Rivers)
Dam Country UtilityFinancing
body Power (MW)Nam Theun 2 Laos EDF
AESDANS
Tala PAEskomEskom
IPSEEPCAESEDF
XiaoXiSuezEDF
1088Changuinola 1 Panama
ADB, BMWB, USAID
-WB, Bhoutan
AFD, GTZAfrique du Sud
AFDJP Morgan
USAIDAFD
ChinaIADB …
222Jorethang Loop India 96Tala Bhutan 1022Mphanda Nkuwa Mozambique 1000Epupa Namibia 360Bujagali Uganda 200Gibe III Ethiopia 1870Urra Colombia 750Son La Vietnam 2400Xiaoxi China 136
AFD, GTZMadeira Brazil 3200Theun Hiboun Laos 280
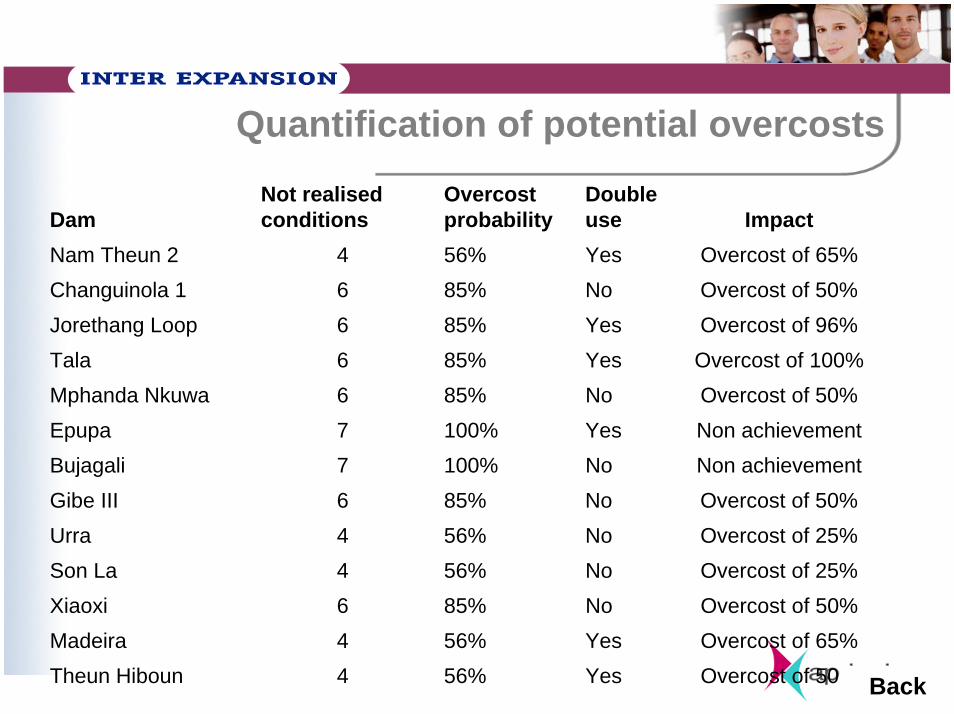
Quantification of potential overcosts
DamNot realisedconditions
Overcostprobability
Double use Impact
Nam Theun 2 4666677644644
Yes Overcost of 65%Changuinola 1
56%85%85%85%85%100%100%85%56%56%85%56%
No Overcost of 50%Jorethang Loop Yes Overcost of 96%Tala Yes Overcost of 100%Mphanda Nkuwa No Overcost of 50%Epupa Yes Non achievementBujagali No Non achievementGibe III No Overcost of 50%Urra No Overcost of 25%Son La No Overcost of 25%Xiaoxi No Overcost of 50%
56%Madeira Yes Overcost of 65%Theun Hiboun Yes Overcost of 50% Back
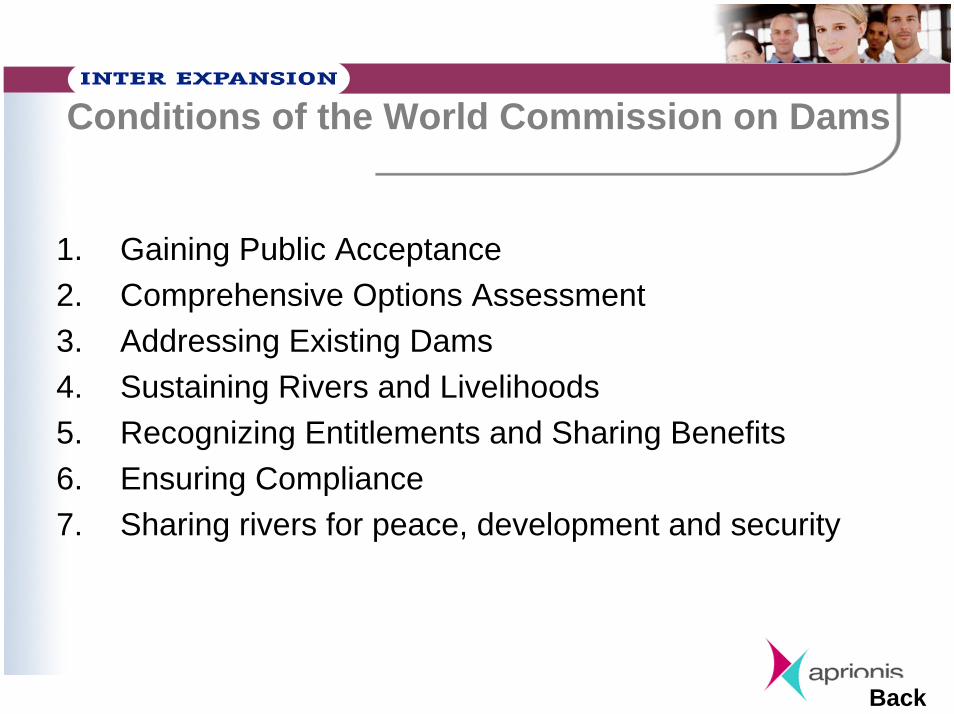
Conditions of the World Commission on Dams
1. Gaining Public Acceptance2. Comprehensive Options Assessment3. Addressing Existing Dams4. Sustaining Rivers and Livelihoods5. Recognizing Entitlements and Sharing Benefits6. Ensuring Compliance7. Sharing rivers for peace, development and security
Back