presentation - esri
TRANSCRIPT
April 26, 2013
Financial Results of Petróleos Mexicanos, Subsidiary Entities and Subsidiary Companies as of March 31, 20131
Fist Quarter
(Jan.-March.) 2012 2013 Variation 2013 Highlights
(Ps. Billion)
(U.S.$Billion)
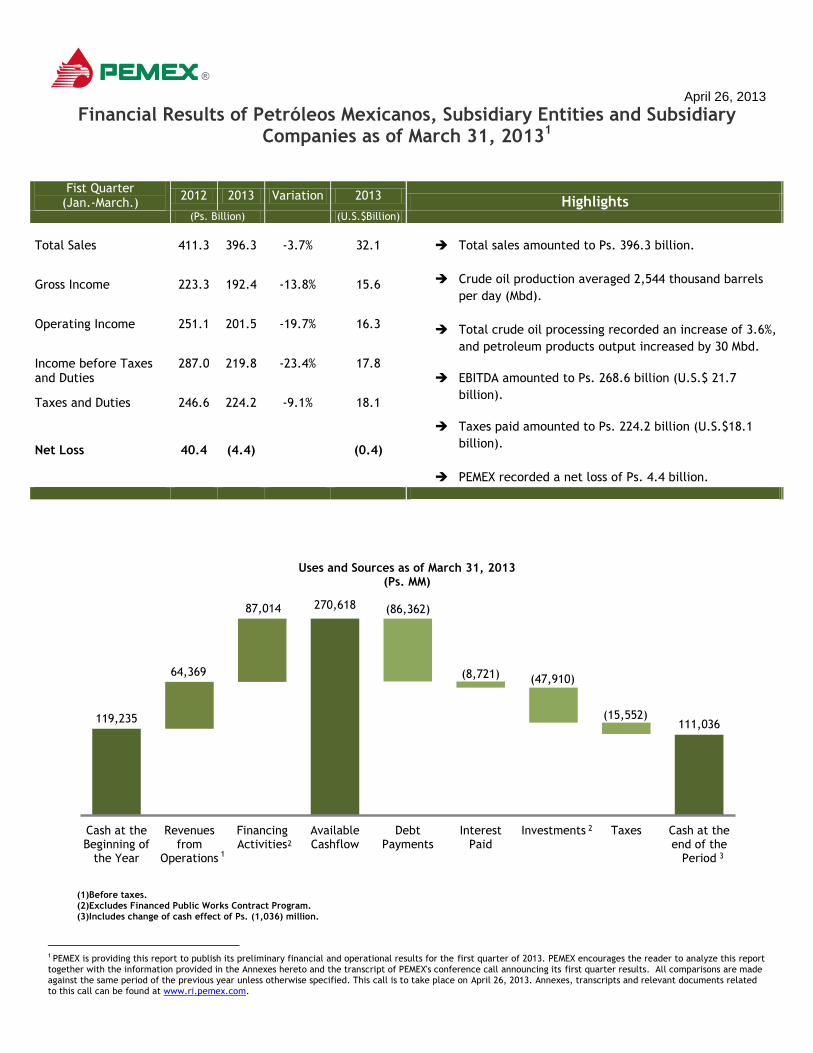
Total Sales 411.3 396.3 -3.7% 32.1 Total sales amounted to Ps. 396.3 billion.
Crude oil production averaged 2,544 thousand barrels
per day (Mbd).
Total crude oil processing recorded an increase of 3.6%,
and petroleum products output increased by 30 Mbd.
EBITDA amounted to Ps. 268.6 billion (U.S.$ 21.7
billion).
Taxes paid amounted to Ps. 224.2 billion (U.S.$18.1
billion).
PEMEX recorded a net loss of Ps. 4.4 billion.
Gross Income 223.3 192.4 -13.8% 15.6
Operating Income 251.1 201.5 -19.7% 16.3
Income before Taxes and Duties
287.0 219.8 -23.4% 17.8
Taxes and Duties 246.6 224.2 -9.1% 18.1
Net Loss 40.4 (4.4) (0.4)
Uses and Sources as of March 31, 2013 (Ps. MM)
(1)Before taxes. (2)Excludes Financed Public Works Contract Program. (3)Includes change of cash effect of Ps. (1,036) million.
1 PEMEX is providing this report to publish its preliminary financial and operational results for the first quarter of 2013. PEMEX encourages the reader to analyze this report together with the information provided in the Annexes hereto and the transcript of PEMEX's conference call announcing its first quarter results. All comparisons are made against the same period of the previous year unless otherwise specified. This call is to take place on April 26, 2013. Annexes, transcripts and relevant documents related to this call can be found at www.ri.pemex.com.
119,235
64,369
87,014 270,618
111,036
(86,362)
(8,721) (47,910)
(15,552)
Cash at theBeginning of
the Year
Revenuesfrom
Operations
FinancingActivities
AvailableCashflow
DebtPayments
InterestPaid
Investments Taxes Cash at theend of the
Period 3
2
2
1

PEMEX
PEMEX Results Report as of March 31, 2013 2 / 24 www.pemex.com

PEMEX
PEMEX Results Report as of March 31, 2013 3 / 24 www.pemex.com
74%
26%
Offshore Onshore
Operating Results
First quarter (Jan.-Mar.)
2012 2013 Change
Upstream
Total hydrocarbons (Mboed) 3,694 3,709 0.4% 15
Liquid hydrocarbons (Mbd) 2,586 2,582 -0.1% (4)
Crude oil (Mbd) 2,540 2,544 0.1% 4
Condensates (Mbd) 46 38 -16.1% (7)
Natural gas (MMcfd)(1) 6,380 6,463 1.3% 83
Downstream
Dry gas from plants (MMcfd)(2) 3,732 3,759 0.7% 27
Natural gas liquids (Mbd) 374 361 -3.5% (13)
Petroleum Products (Mbd)(3) 1,343 1,373 2.2% 30.0
Petrochemical Products (Mt) 1,269 1,178 -7.1% (90)
(1) Includes nitrogen.
PEMEX
Main Statistics of Production
(2) Does not include dry gas produced by Pemex-Refining and used as fuel by this
(3) Includes LPG from Pemex-Gas and Basic Petrochemicals; Pemex-Exploration and
Upstream
Crude Oil Production
Total crude oil production averaged 2,544 Mbd, an increase of 4 Mbd as compared to the first quarter of 2012. This increase was primarily due to a rise in production of light crude oil, as a result of an increase in production at the Kuil field at the Abkatún-Pol Chuc Asset in the Southwestern Marine Region, and at the Gasífero field at the Veracruz Asset of the Northern Region. Both of these fields began their production during the second half of 2012, and contributed 36 Mbd in average to total production during the first quarter of 2013. This increase was partially offset by:
a decrease in production of extra-light crude oil due to an increase in the fractional water flow at the Delta del Grijalva project in the Southern Region; and
a decrease in production of heavy crude oil due to scheduled maintenance at the production center Ku-S of the Ku-Maloob-Zaap Asset in the Northeastern Marine Region, an increase in the fractional water flow of wells, and a natural decline in production of fields in the Cantarell Asset of the Northeastern Marine Region.
Crude Oil Production (Mbd)
Crude Oil Production by Region 1Q13 (Mbd)
57% 56% 55% 54% 54%
31% 31% 32% 33% 33%
12% 13% 13% 13% 13%
2,540 2,545 2,546 2,561 2,544
1Q12 2Q12 3Q12 4Q12 1Q13
Heavy Light Extra-light
PEMEX
PEMEX Results Report as of March 31, 2013 4 / 24 www.pemex.com
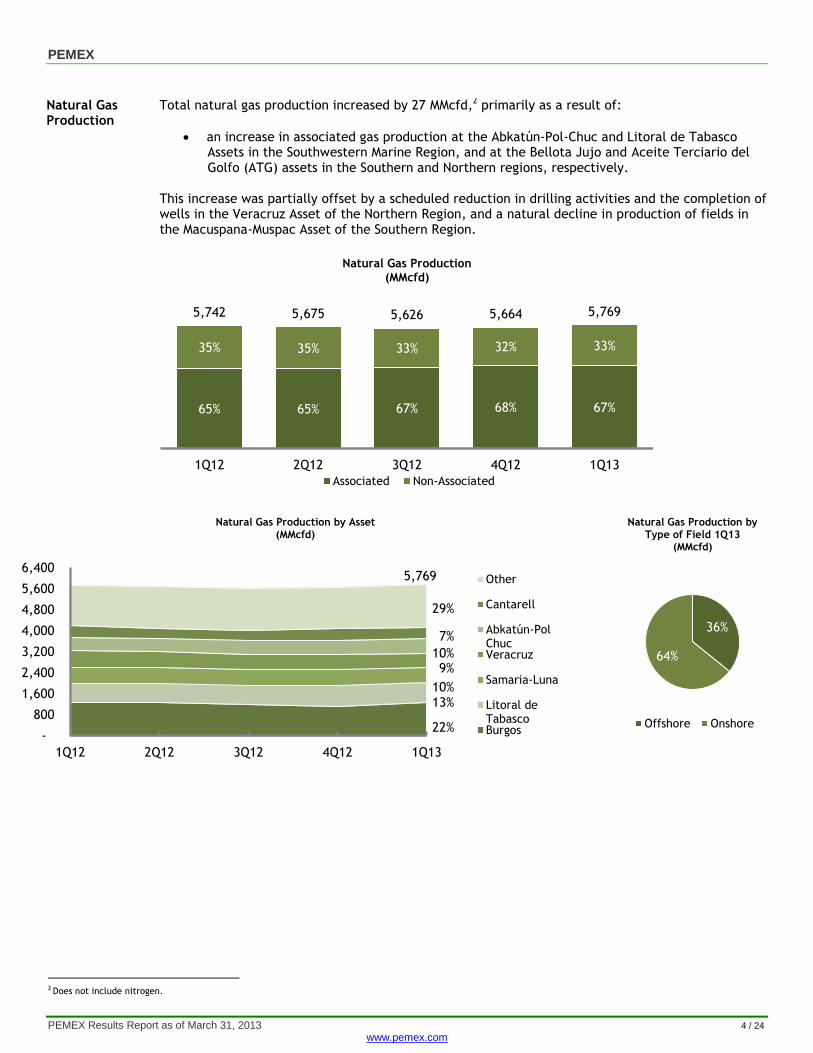
Natural Gas Production
Total natural gas production increased by 27 MMcfd,2 primarily as a result of:
an increase in associated gas production at the Abkatún-Pol-Chuc and Litoral de Tabasco Assets in the Southwestern Marine Region, and at the Bellota Jujo and Aceite Terciario del Golfo (ATG) assets in the Southern and Northern regions, respectively.
This increase was partially offset by a scheduled reduction in drilling activities and the completion of wells in the Veracruz Asset of the Northern Region, and a natural decline in production of fields in the Macuspana-Muspac Asset of the Southern Region.
Natural Gas Production (MMcfd)
Natural Gas Production by Asset (MMcfd)
Natural Gas Production by
Type of Field 1Q13 (MMcfd)
2 Does not include nitrogen.
65% 65% 67% 68% 67%
35% 35% 33% 32% 33%
5,742 5,675 5,626 5,664 5,769
1Q12 2Q12 3Q12 4Q12 1Q13
Associated Non-Associated
-
800
1,600
2,400
3,200
4,000
4,800
5,600
6,400
1Q12 2Q12 3Q12 4Q12 1Q13
Other
Cantarell
Abkatún-PolChucVeracruz
Samaria-Luna
Litoral deTabascoBurgos
29%
22%
13%
9%
7%
10%
10%
5,769
36%
64%
Offshore Onshore
PEMEX
PEMEX Results Report as of March 31, 2013 5 / 24 www.pemex.com
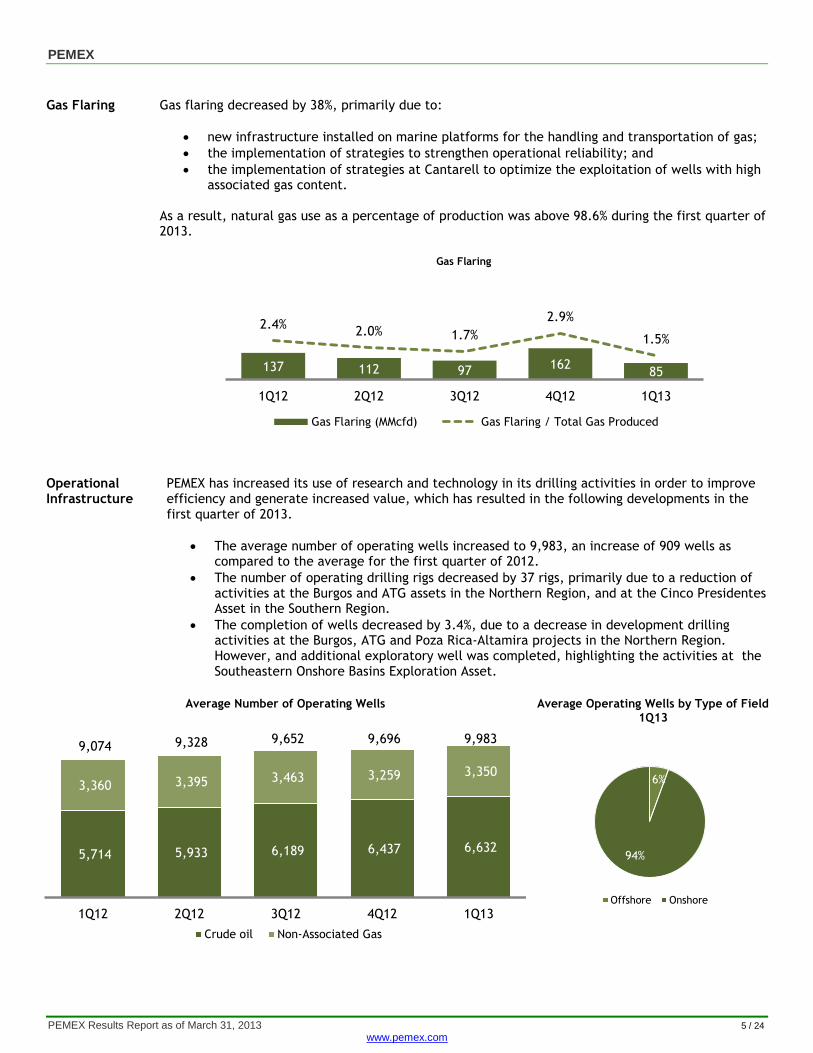
Gas Flaring Gas flaring decreased by 38%, primarily due to:
new infrastructure installed on marine platforms for the handling and transportation of gas;
the implementation of strategies to strengthen operational reliability; and
the implementation of strategies at Cantarell to optimize the exploitation of wells with high associated gas content.
As a result, natural gas use as a percentage of production was above 98.6% during the first quarter of 2013.
Gas Flaring
Operational Infrastructure
PEMEX has increased its use of research and technology in its drilling activities in order to improve efficiency and generate increased value, which has resulted in the following developments in the first quarter of 2013.
The average number of operating wells increased to 9,983, an increase of 909 wells as compared to the average for the first quarter of 2012.
The number of operating drilling rigs decreased by 37 rigs, primarily due to a reduction of activities at the Burgos and ATG assets in the Northern Region, and at the Cinco Presidentes Asset in the Southern Region.
The completion of wells decreased by 3.4%, due to a decrease in development drilling activities at the Burgos, ATG and Poza Rica-Altamira projects in the Northern Region. However, and additional exploratory well was completed, highlighting the activities at the Southeastern Onshore Basins Exploration Asset.
Average Number of Operating Wells Average Operating Wells by Type of Field 1Q13
137 112 97 162
85
2.4% 2.0% 1.7%
2.9%
1.5%
1Q12 2Q12 3Q12 4Q12 1Q13
Gas Flaring (MMcfd) Gas Flaring / Total Gas Produced
5,714 5,933 6,189 6,437 6,632
3,360 3,395 3,463 3,259 3,350
9,074 9,328 9,652 9,696 9,983
1Q12 2Q12 3Q12 4Q12 1Q13
Crude oil Non-Associated Gas
6%
94%
Offshore Onshore
PEMEX
PEMEX Results Report as of March 31, 2013 6 / 24 www.pemex.com
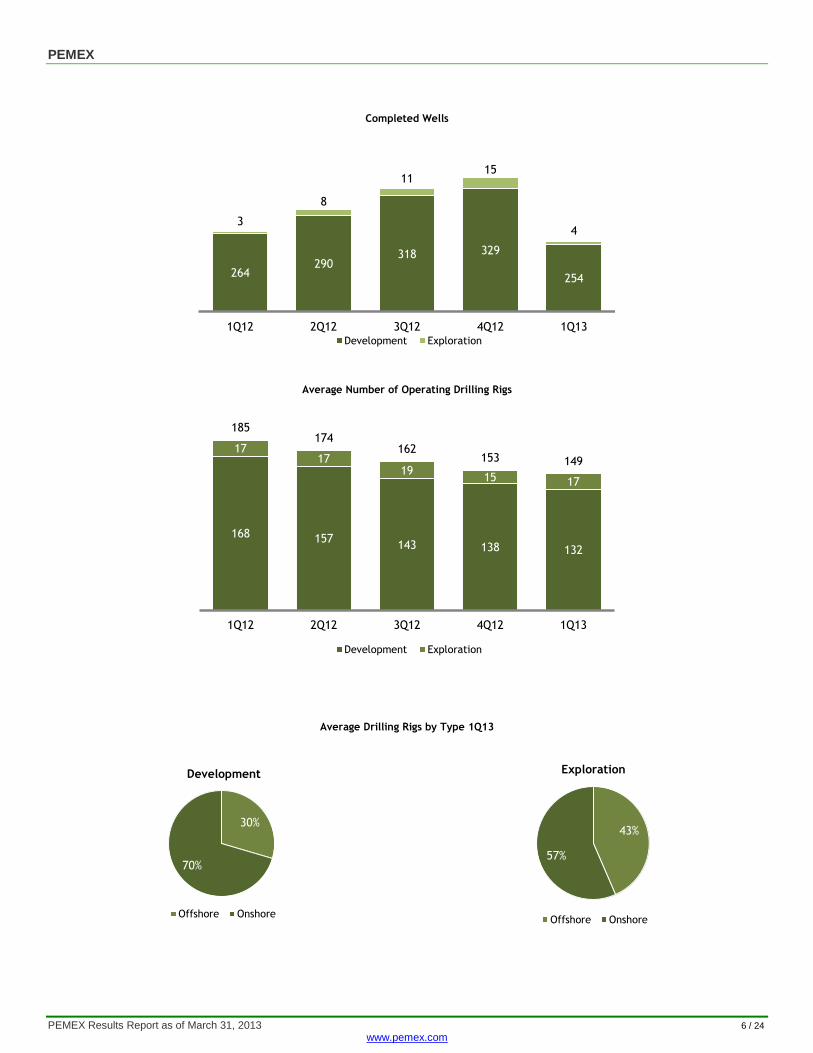
Completed Wells
Average Number of Operating Drilling Rigs
Average Drilling Rigs by Type 1Q13
264 290
318 329
254
3
8
11 15
4
1Q12 2Q12 3Q12 4Q12 1Q13Development Exploration
168 157 143 138 132
17 17
19 15 17
185 174
162 153 149
1Q12 2Q12 3Q12 4Q12 1Q13
Development Exploration
30%
70%
Development
Offshore Onshore
43%
57%
Exploration
Offshore Onshore
PEMEX
PEMEX Results Report as of March 31, 2013 7 / 24 www.pemex.com
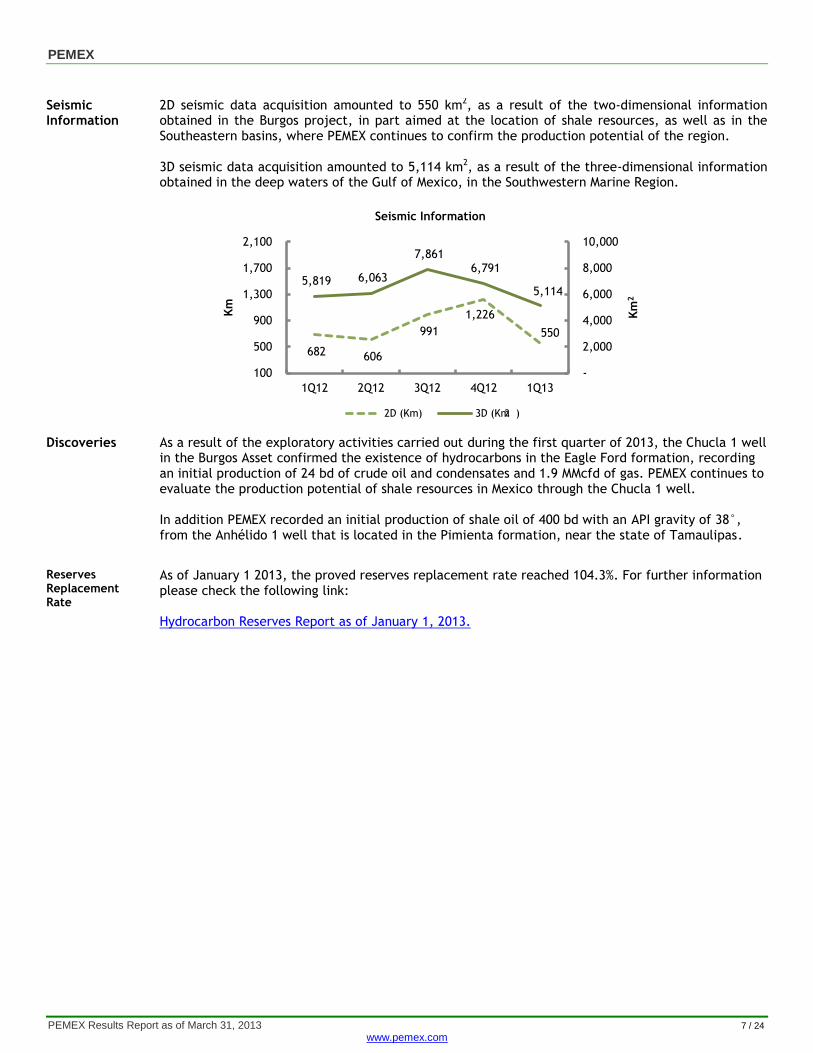
Seismic Information
2D seismic data acquisition amounted to 550 km2, as a result of the two-dimensional information obtained in the Burgos project, in part aimed at the location of shale resources, as well as in the Southeastern basins, where PEMEX continues to confirm the production potential of the region. 3D seismic data acquisition amounted to 5,114 km2, as a result of the three-dimensional information obtained in the deep waters of the Gulf of Mexico, in the Southwestern Marine Region.
Seismic Information
Discoveries As a result of the exploratory activities carried out during the first quarter of 2013, the Chucla 1 well in the Burgos Asset confirmed the existence of hydrocarbons in the Eagle Ford formation, recording an initial production of 24 bd of crude oil and condensates and 1.9 MMcfd of gas. PEMEX continues to evaluate the production potential of shale resources in Mexico through the Chucla 1 well. In addition PEMEX recorded an initial production of shale oil of 400 bd with an API gravity of 38°, from the Anhélido 1 well that is located in the Pimienta formation, near the state of Tamaulipas.
Reserves Replacement Rate
As of January 1 2013, the proved reserves replacement rate reached 104.3%. For further information please check the following link: Hydrocarbon Reserves Report as of January 1, 2013.
682 606
991
1,226
550
5,819 6,063
7,861 6,791
5,114
-
2,000
4,000
6,000
8,000
10,000
100
500
900
1,300
1,700
2,100
1Q12 2Q12 3Q12 4Q12 1Q13
Km
2
Km
2D (Km) 3D (Km )2
PEMEX
PEMEX Results Report as of March 31, 2013 2 / 24 www.pemex.com
Upstream Projects
Technical Agreement with Exxon Mobil
On April 3, 2013, Pemex-Exploration and Production signed a five-year technical collaboration agreement with Exxon Mobil. The objective of this agreement is to collaborate in research, science, technology and human resources training for the exploration, drilling, production, transportation and storage of hydrocarbons.
Migration of the Nejo Block into Integrated Contracts
As a result of the new contracting plans developed by PEMEX, on March 1, 2013, amendments to the Financed Public Works Contracts program (COPF) for the development of the Nejo block in the Burgos project became effective. These amendments relate to provisions included in the Exploration and Production Integrated Contracts, such as the bonus paid per production obtained and investment recovery.
The objective of these changes is to improve procurement conditions for PEMEX and for the contractor, Iberoamericana de Hidrocarburos, who will make an estimated investment of U.S.$400 million for the development of the aforementioned block.
PEMEX
PEMEX Results Report as of March 31, 2013 3 / 24 www.pemex.com
Downstream
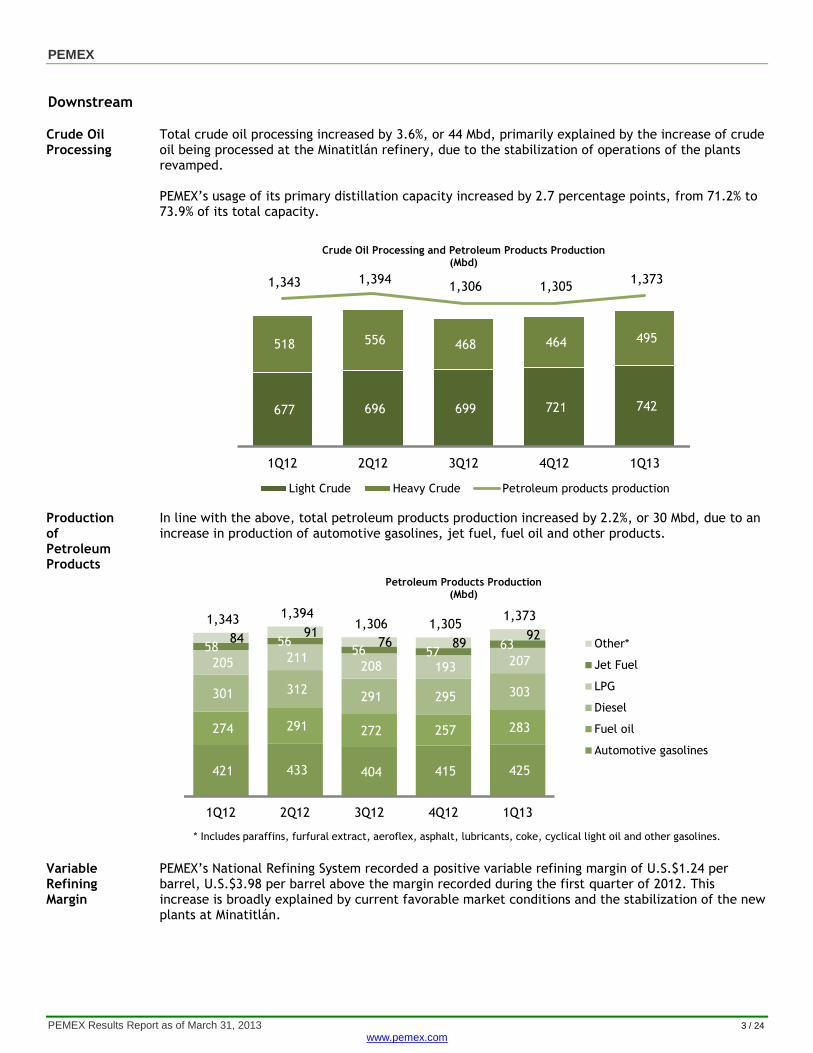
Crude Oil Processing
Total crude oil processing increased by 3.6%, or 44 Mbd, primarily explained by the increase of crude oil being processed at the Minatitlán refinery, due to the stabilization of operations of the plants revamped. PEMEX’s usage of its primary distillation capacity increased by 2.7 percentage points, from 71.2% to 73.9% of its total capacity.
Crude Oil Processing and Petroleum Products Production (Mbd)
Production of Petroleum Products
In line with the above, total petroleum products production increased by 2.2%, or 30 Mbd, due to an increase in production of automotive gasolines, jet fuel, fuel oil and other products.
Petroleum Products Production (Mbd)
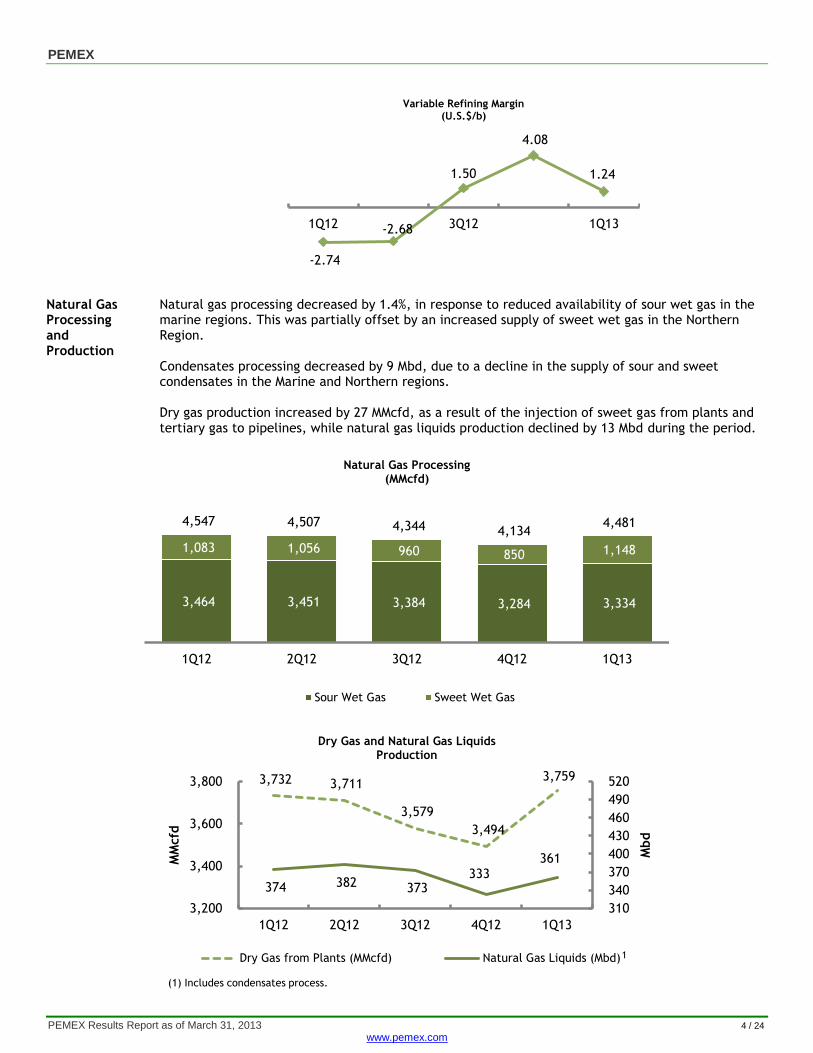
Variable Refining Margin
PEMEX’s National Refining System recorded a positive variable refining margin of U.S.$1.24 per barrel, U.S.$3.98 per barrel above the margin recorded during the first quarter of 2012. This increase is broadly explained by current favorable market conditions and the stabilization of the new plants at Minatitlán.
677 696 699 721 742
518 556 468 464 495
1,343 1,394 1,306 1,305
1,373
1Q12 2Q12 3Q12 4Q12 1Q13
Light Crude Heavy Crude Petroleum products production
421 433 404 415 425
274 291 272 257 283
301 312 291 295 303
205 211 208 193 207
58 56 56 57
63 84 91
76 89 92
1,343 1,394 1,306 1,305
1,373
1Q12 2Q12 3Q12 4Q12 1Q13
Other*
Jet Fuel
LPG
Diesel
Fuel oil
Automotive gasolines
* Includes paraffins, furfural extract, aeroflex, asphalt, lubricants, coke, cyclical light oil and other gasolines.
PEMEX
PEMEX Results Report as of March 31, 2013 4 / 24 www.pemex.com
Variable Refining Margin (U.S.$/b)
Natural Gas Processing and Production
Natural gas processing decreased by 1.4%, in response to reduced availability of sour wet gas in the marine regions. This was partially offset by an increased supply of sweet wet gas in the Northern Region. Condensates processing decreased by 9 Mbd, due to a decline in the supply of sour and sweet condensates in the Marine and Northern regions. Dry gas production increased by 27 MMcfd, as a result of the injection of sweet gas from plants and tertiary gas to pipelines, while natural gas liquids production declined by 13 Mbd during the period.
Natural Gas Processing
(MMcfd)
Dry Gas and Natural Gas Liquids
Production
-2.74
-2.68
1.50
4.08
1.24
1Q12 3Q12 1Q13
3,464 3,451 3,384 3,284 3,334
1,083 1,056 960 850 1,148
4,547 4,507 4,344 4,134 4,481
1Q12 2Q12 3Q12 4Q12 1Q13
Sour Wet Gas Sweet Wet Gas
3,732 3,711
3,579
3,494
3,759
374 382 373 333
361
310
340
370
400
430
460
490
520
3,200
3,400
3,600
3,800
1Q12 2Q12 3Q12 4Q12 1Q13
Mbd
MM
cfd
Dry Gas from Plants (MMcfd) Natural Gas Liquids (Mbd)
(1) Includes condensates process.
1

PEMEX
PEMEX Results Report as of March 31, 2013 5 / 24 www.pemex.com
Petrochemicals Production
The production of petrochemical products decreased by 7.1%, primarily due to the following:
production in the methane derivatives chain recorded a decrease of 1.8%, due to a decline in the demand for fertilizers;
production in the ethane derivatives chain decreased by 13.8% due to maintenance works; and
production of the propylene and derivatives chain decreased by 30.2% as a result of a temporary shutdown of operations of the acrylonitrile plant, due to limited availability of propylene.
This decrease was partially offset by:
an increase in production in the aromatics and derivatives chain due to the resumption of operations of plants involved in the production of aromatics, and to initial performance tests carried out at the CCR plant; and
a production increase in other petrochemicals, including amorphous and octane-based gasolines, due to a resumption of operations in the aromatics and derivatives chains.
Petrochemicals Production (Mt)
131 45 9 9 8
353 346 345 323 347
355 363
312 253
306
10 1
16 75
83
129 112
116 111 90
291 304
282 257 344
1,269 1,171
1,080 1,028
1,178
1Q12 2Q12 3Q12 4Q12 1Q13
Other*
Propylene and Derivatives
Aromatics and Derivatives
Ethane Derivatives
Methane Derivatives
Basic
*Includes muriatic acid, butadiene, polyethylene wax, petrochemical specialities, BTX liquids, hydrogen, isohexane, pyrolysis liquids, oxygen, CPDI, sulfur, isopropyl alcohol, amorphous gasoline, octane basis gasoline and heavy
PEMEX
PEMEX Results Report as of March 31, 2013 6 / 24 www.pemex.com
Downstream Projects
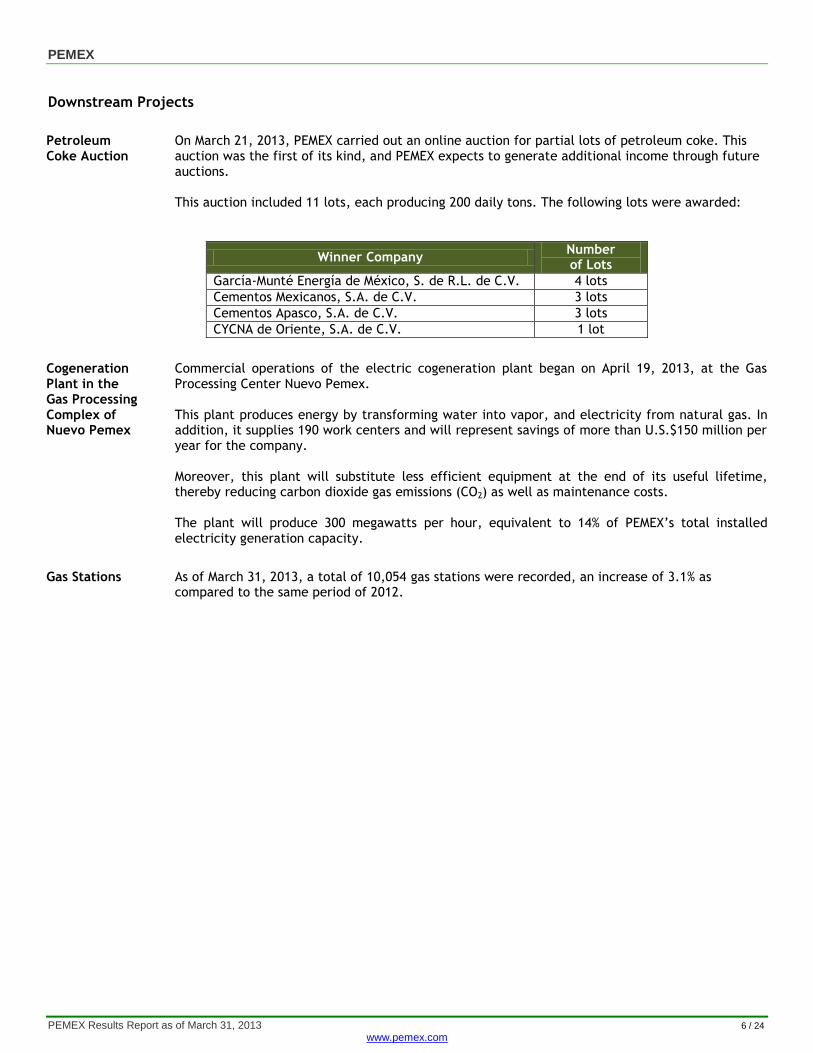
Petroleum Coke Auction
On March 21, 2013, PEMEX carried out an online auction for partial lots of petroleum coke. This auction was the first of its kind, and PEMEX expects to generate additional income through future auctions. This auction included 11 lots, each producing 200 daily tons. The following lots were awarded:
Winner Company Number of Lots
García-Munté Energía de México, S. de R.L. de C.V. 4 lots
Cementos Mexicanos, S.A. de C.V. 3 lots
Cementos Apasco, S.A. de C.V. 3 lots
CYCNA de Oriente, S.A. de C.V. 1 lot
Cogeneration Plant in the Gas Processing Complex of Nuevo Pemex
Commercial operations of the electric cogeneration plant began on April 19, 2013, at the Gas Processing Center Nuevo Pemex. This plant produces energy by transforming water into vapor, and electricity from natural gas. In addition, it supplies 190 work centers and will represent savings of more than U.S.$150 million per year for the company.
Moreover, this plant will substitute less efficient equipment at the end of its useful lifetime, thereby reducing carbon dioxide gas emissions (CO2) as well as maintenance costs.
The plant will produce 300 megawatts per hour, equivalent to 14% of PEMEX’s total installed electricity generation capacity.
Gas Stations As of March 31, 2013, a total of 10,054 gas stations were recorded, an increase of 3.1% as compared to the same period of 2012.

PEMEX
PEMEX Results Report as of March 31, 2013 7 / 24 www.pemex.com
Financial Results
First quarter (Jan.-Mar.)
2012 2013 Change 2013
(Ps. MM) (U.S.$MM)
Total sales 411,325 396,254 -3.7% (15,071) 32,073
Domestic sales 203,558 214,019 5.1% 10,460 17,323
Exports 206,092 180,000 -12.7% (26,092) 14,569
Services income 1,675 2,236 33.5% 561 181
Cost of sales 187,999 203,842 8.4% 15,843 16,499
Gross income 223,326 192,412 -13.8% (30,914) 15,574
General expenses 26,846 31,468 17.2% 4,623 2,547
Transportation and distribution expenses 6,525 7,583 16.2% 1,058 614
Administrative expenses 20,321 23,885 17.5% 3,565 1,933
Other revenues (expenses) 54,606 40,574 -25.7% (14,032) 3,284
IEPS accrued 55,439 34,486 -37.8% (20,954) 2,791
Other (834) 6,088 830.3% 6,922 493
Operating income (loss) 251,086 201,517 -19.7% (49,569) 16,311
Comprehensive financing result 35,733 18,507 -48.2% (17,227) 1,498
Profit (loss) sharing in non-consolidated
subsidiaries, affiliates and others 164 (238) -245.3% (402) (19)
Income before taxes and duties 286,983 219,786 -23.4% (67,197) 17,790
Taxes and duties 246,586 224,174 -9.1% (22,412) 18,145
Net income 40,397 (4,388) -110.9% (44,785) (355)
Other comprehensive result (8,575) (3,639) 57.6% 4,937 (295)
Comprehensive income (loss) 31,821 (8,027) -125.2% (39,848) (650)
PEMEX
Consolidated Income Statement
Sales Sales revenues decreased by 3.7% primarily as a result of:
a decrease of 2.5% in the volume of crude oil exports, due to a rise in domestic demand in
response to an increased refining capacity;
a decrease of 6% in the average price of the Mexican crude oil basket, from U.S.$111.42 per
barrel in the first quarter of 2012, to U.S.$104.72 per barrel in the same period of 2013;
a 3.8% appreciation of the Mexican peso against the U.S. dollar, equivalent to Ps.₵49.4, from
Ps. 12.8489 during the first quarter of 2012, to Ps. 12.3546 during the same period in 2013.
a decline of 3.6% in the price of regular gasoline in the U.S. Gulf of Mexico, from U.S.₵301.84
per gallon in the first quarter of 2012, to U.S.₵ 290.86 in the same quarter of 2013;
lower prices for domestic products sold were recorded, including fuel oil (10.2%), propylene (4.5%), jet fuel (4.6%) and asphalt (4.1%). Additionally, decreases in sales volumes of the following products were recorded: Magna gasoline (8.4%), diesel (2.6%), marine diesel (17.8%), fuel oil (9.6%), propylene (28.5%) and asphalt (39.3%); and
the previous was partially offset by higher prices for domestic products sold, including gasolines (Magna 12%, Premium 8.9%), diesel (11.7%) and industrial diesel (11.7%). Additionally, increases in sales volumes of Premium gasoline (49.8%) and industrial diesel (26.2%) were recorded.

PEMEX
PEMEX Results Report as of March 31, 2013 8 / 24 www.pemex.com
Sales Evolution (Ps. MM)
Exports (Ps. MM)
Crude Exports by Region
Domestic Sales (Ps. MM)
Domestic Sales of Petroleum Products
Operating Costs and Expenses
Costs of sales during the first quarter of 2013 increased by 8.4% primarily as a result of:
a 42.2% increase in the net cost of employee benefits during the period;
a 10% increase in personal services, as a result of adjustments made in our accounting processes for the recognition of future benefits;
a Ps. 6.6 billion increase in liabilities provisions from accrued services; and
an increase in costs due inventory variation, as a result of greater preservation and
maintenance expenses, as well as of other operating expenses.
This increase was partially offset by a 2.5% decrease in purchases for resale, due to lower prices of hydrocarbons, and a rise in the internal production of petroleum products. In addition, during the first quarter of 2013, general expenses, which are composed of distribution
411,325 396,254 10,460 (26,092) 561
1Q12 Domestic Sales Exports ServicesIncome
1Q13
-3.7%
163,587 144,400
19,929 18,854
22,575 16,747
206,092 180,000
1Q12 1Q13
Other
Petroleum Products
Crude Oil andCondensates
-12.7%
72%
15%
10%
3%
United States ofAmerica
Europe
Far East
Rest of the Americas
Total: 1,204 Mbd
182,337 191,449
12,004 14,929 9,218
7,641 203,558 214,019
1Q12 1Q13
PetrochemicalProducts
Dry Gas
PetroleumProducts
5.1%
43%
11%
22%
17%
3% 4%
Gasolines
Fuel oil
Diesel
LPG
Jet Fuel
Other
Total: 1,795 Mbd

PEMEX
PEMEX Results Report as of March 31, 2013 9 / 24 www.pemex.com
expenses and administrative expenses, increased by Ps. 4.6 billion, totaling Ps. 31.5 billion. In this context, distribution expenses increased by 16.2%, primarily due to:
a 41.1% increase in the net cost of employee benefits during the period; and
a 7.6% increase in personal services, as a result of adjustments made in our accounting processes for the recognition of future benefits.
Finally, administrative expenses increased by 17.5%, primarily due to:
a 21.7% increase in the net cost of employee benefits during the period; and
an 18% increase in personal services, as a result of adjustments made in our accounting processes for the recognition of future benefits.
This increase was partially offset by a 32.8% decrease in freight and insurance. During the first quarter of 2013, the net cost of employee benefits recorded under the cost of sales and under general expenses increased due to adjustments to the actuarial calculation method, specifically in the discount rate at the close of fiscal year 2012. This increase was partially offset by decreases of 7.2% in amortization expense, and 35.4% in the net cost of employee benefits during the period.
Other Revenues
Other revenues recorded a decrease of 25.7%, primarily as a result of a decrease in the accrued amount of IEPS3 credit.
Operating Costs and Expenses (Ps. MM)
3 IEPS means Impuesto Especial sobre Producción y Servicio (Special Tax on Production and Services).
214,845 235,311
15,843 4,623
1Q12 Cost of Sales General Expenses 1Q13
9.5%

PEMEX
PEMEX Results Report as of March 31, 2013 10 / 24 www.pemex.com
246,586
224,174
189,688
(22,540)
127 (34,486)
1Q12 HydrocarbonDuties
OtherTaxes
1Q13 IEPSCredit1Q13
TaxesPayable
1Q13
Comprehensive Financing Result
During the first quarter of 2013, the comprehensive financing result amounted to Ps. 18.5 billion, primarily due to the appreciation of the Mexican peso against the U.S. dollar, from Ps. 12.8489 per dollar in the first quarter of 2012, to Ps. 12.3546 in the same quarter of 2013.
Comprehensive Financing Result
(Ps. MM)
Taxes and Duties
During the first quarter of 2013, taxes and duties paid decreased 9.1%, or Ps. 22.4 billion, primarily a result of lower reference prices of the Mexican crude oil basket which decreased from U.S.$111.42 per barrel during the first quarter of 2012, to U.S.$104.72 per barrel during the same quarter of 2013.
Evolution of Taxes and Duties (Ps. MM)
Taxes and Duties (Ps. MM)
35,733
18,507
(5,423)
(11,804)
1Q12 Financial Income(Loss), net
ExchangeGain (Loss)
1Q13
203,993 186,098
27,969
26,643
14,624
11,432
246,586
224,174
1Q12 1Q13
Other Duties
Hydrocarbons Duty forthe Stabilization Fund
Ordinary HydrocarbonsDuty

PEMEX
PEMEX Results Report as of March 31, 2013 11 / 24 www.pemex.com
Net Income (Loss)
During the first quarter of 2013, PEMEX recorded a net loss of Ps. 4.4 billion as a result of a decline in sales revenues, an increase in costs and expenses, a decrease in the accrued amount of IEPS and a less favorable comprehensive financing result. This loss was partially offset by a decrease in taxes and duties paid.
Net Loss Evolution 1Q12 vs 1Q13
(Ps. MM)
40,397 (15,071)
(20,465)
(14,434)
(17,227) 22,412
(4,388)
1Q12 TotalSales
Cost of Salesand General
Expenses
OtherRevenues
CFR Taxes andDuties
1Q131
(1 ) Includes profit-sharing in non-consolidated subsidiaries, affiliates and others.of -Ps. 401.9 million.

PEMEX
PEMEX Results Report as of March 31, 2013 12 / 24 www.pemex.com
Consolidated Balance Sheet as of March 31, 2013
Consolidated Balance Sheet
As of Dec. 31, As of March 31,
2012 2013 Change 2013
(U.S.$MM)
Total assets 2,024,183 2,034,847 0.5% 10,664 164,704
Current assets 333,913 331,700 -0.7% (2,214) 26,848
Cash and cash equivalents 119,235 111,036 -6.9% (8,199) 8,987
Accounts, notes receivable and other 133,010 155,412 16.8% 22,402 12,579
Inventories 56,848 44,314 -22.0% (12,534) 3,587
of products 51,951 40,141 -22.7% (11,811) 3,249
of materials 4,896 4,173 -14.8% (723) 338
Derivative financial instruments 9,050 5,461 -39.7% (3,589) 442
Available-for-sale investments 15,771 15,477 -1.9% (294) 1,253
Investment in securities 17,252 15,182 -12.0% (2,070) 1,229
Property, plant and equipment 1,658,734 1,671,811 0.8% 13,077 135,319
Other assets 14,284 16,154 13.1% 1,871 1,308
Total liabilities 2,295,249 2,313,940 0.8% 18,691 187,294
Current liabilities 235,804 243,086 3.1% 7,282 19,676
Short-term debt 114,241 86,558 -24.2% (27,683) 7,006
Suppliers 61,513 80,051 30.1% 18,538 6,479
Accounts and accrued expenses payable 16,068 16,944 5.4% 875 1,371
Taxes and duties payable 43,981 59,533 35.4% 15,552 4,819
Long-term liabilities 2,059,445 2,070,854 0.6% 11,409 167,618
Long-term debt 672,618 665,980 -1.0% (6,638) 53,905
Reserve for sundry creditors and others 70,149 70,290 0.2% 141 5,689
Reserve for employee benefits 1,288,541 1,308,207 1.5% 19,666 105,888
Deferred taxes 28,138 26,377 -6.3% (1,761) 2,135
Total equity (271,066) (279,093) 3.0% (8,027) (22,590)
Total liabilities and equity 2,024,183 2,034,847 0.5% 10,664 164,704
PEMEX
(Ps. MM)
PEMEX
PEMEX Results Report as of March 31, 2013 13 / 24 www.pemex.com
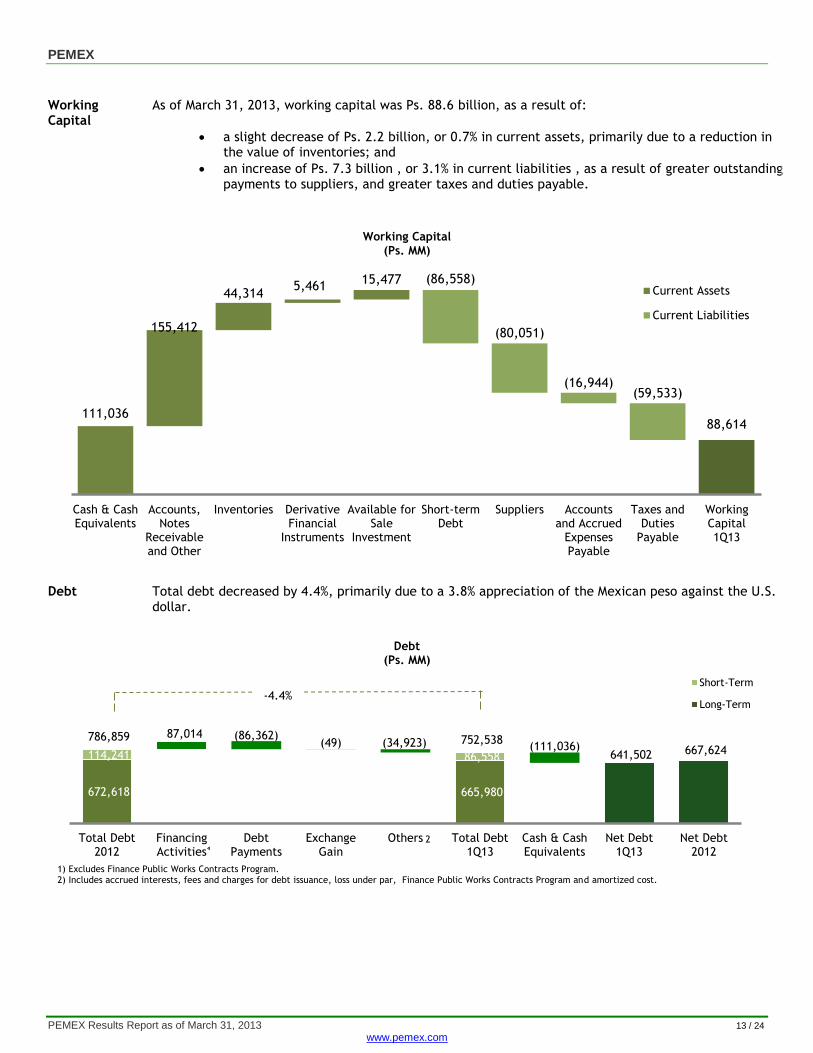
Working Capital
As of March 31, 2013, working capital was Ps. 88.6 billion, as a result of:
a slight decrease of Ps. 2.2 billion, or 0.7% in current assets, primarily due to a reduction in the value of inventories; and
an increase of Ps. 7.3 billion , or 3.1% in current liabilities , as a result of greater outstanding payments to suppliers, and greater taxes and duties payable.
Working Capital (Ps. MM)
Debt Total debt decreased by 4.4%, primarily due to a 3.8% appreciation of the Mexican peso against the U.S. dollar.
Debt (Ps. MM)
(86,558)
(80,051)
(16,944) (59,533)
111,036
155,412
44,314 5,461
15,477
88,614
Cash & CashEquivalents
Accounts,Notes
Receivableand Other
Inventories DerivativeFinancial
Instruments
Available forSale
Investment
Short-termDebt
Suppliers Accountsand Accrued
ExpensesPayable
Taxes andDuties
Payable
WorkingCapital1Q13
Current Assets
Current Liabilities
672,618 665,980
641,502 667,624
87,014 (86,362)
114,241 86,558 (49) (111,036)
786,859 752,538 (34,923)
Total Debt2012
FinancingActivities
DebtPayments
ExchangeGain
Others Total Debt1Q13
Cash & CashEquivalents
Net Debt1Q13
Net Debt2012
Short-Term
Long-Term-4.4%
1) Excludes Finance Public Works Contracts Program. 2) Includes accrued interests, fees and charges for debt issuance, loss under par, Finance Public Works Contracts Program and amortized cost.
1 2
PEMEX
PEMEX Results Report as of March 31, 2013 14 / 24 www.pemex.com
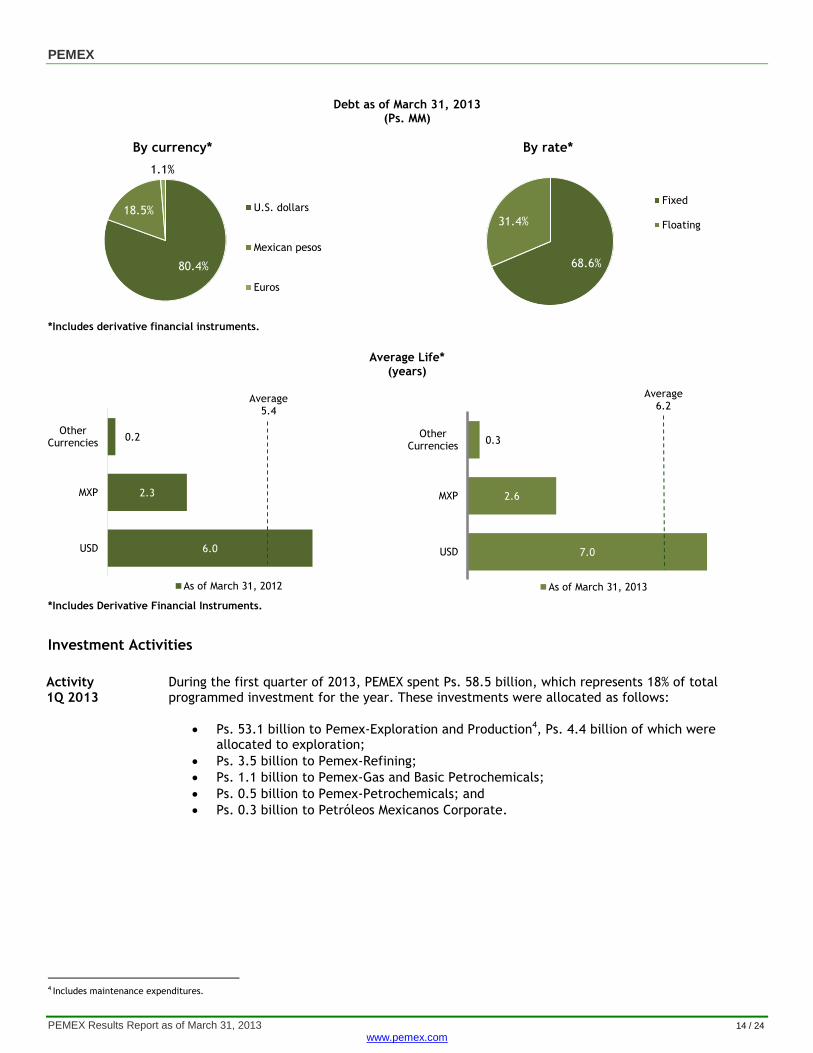
Debt as of March 31, 2013 (Ps. MM)
*Includes derivative financial instruments.
Average Life*
(years)
*Includes Derivative Financial Instruments. Investment Activities
Activity 1Q 2013
During the first quarter of 2013, PEMEX spent Ps. 58.5 billion, which represents 18% of total programmed investment for the year. These investments were allocated as follows:
Ps. 53.1 billion to Pemex-Exploration and Production4, Ps. 4.4 billion of which were allocated to exploration;
Ps. 3.5 billion to Pemex-Refining;
Ps. 1.1 billion to Pemex-Gas and Basic Petrochemicals;
Ps. 0.5 billion to Pemex-Petrochemicals; and
Ps. 0.3 billion to Petróleos Mexicanos Corporate.
4 Includes maintenance expenditures.
80.4%
18.5%
1.1%
By currency*
U.S. dollars
Mexican pesos
Euros
68.6%
31.4%
By rate*
Fixed
Floating
6.0
2.3
0.2
USD
MXP
OtherCurrencies
As of March 31, 2012
Average 5.4
7.0
2.6
0.3
USD
MXP
OtherCurrencies
As of March 31, 2013
Average 6.2
PEMEX
PEMEX Results Report as of March 31, 2013 15 / 24 www.pemex.com
Financing Activities
Capital Markets
On January 30, 2013, Petróleos Mexicanos issued U.S.$2.1 billion of its 3.50% Notes, due in 2023; U.S.$100.0 million of these notes were allocated in the Asian market.
On March 22, 2013, Petróleos Mexicanos reopened Ps. 2.5 billion of its Certificados Bursátiles (publicly traded notes) due 2017, at 28 days floating TIIE rate plus18 basis points.
The proceeds from these placements will be used to finance investment projects and for debt refinancing.
COPF
During the first quarter of 2013, Petróleos Mexicanos obtained U.S.$80.3 million through the COPF of Pemex-Exploration and Production. These contracts are used for the exploitation of natural gas fields in the Burgos basin.
Liquidity Management
As of March 31, 2013, Petróleos Mexicanos holds liquidity management credit lines for U.S.$2.5 billion and Ps. 10.0 billion, both of which are completely available to PEMEX.
PEMEX
PEMEX Results Report as of March 31, 2013 16 / 24 www.pemex.com
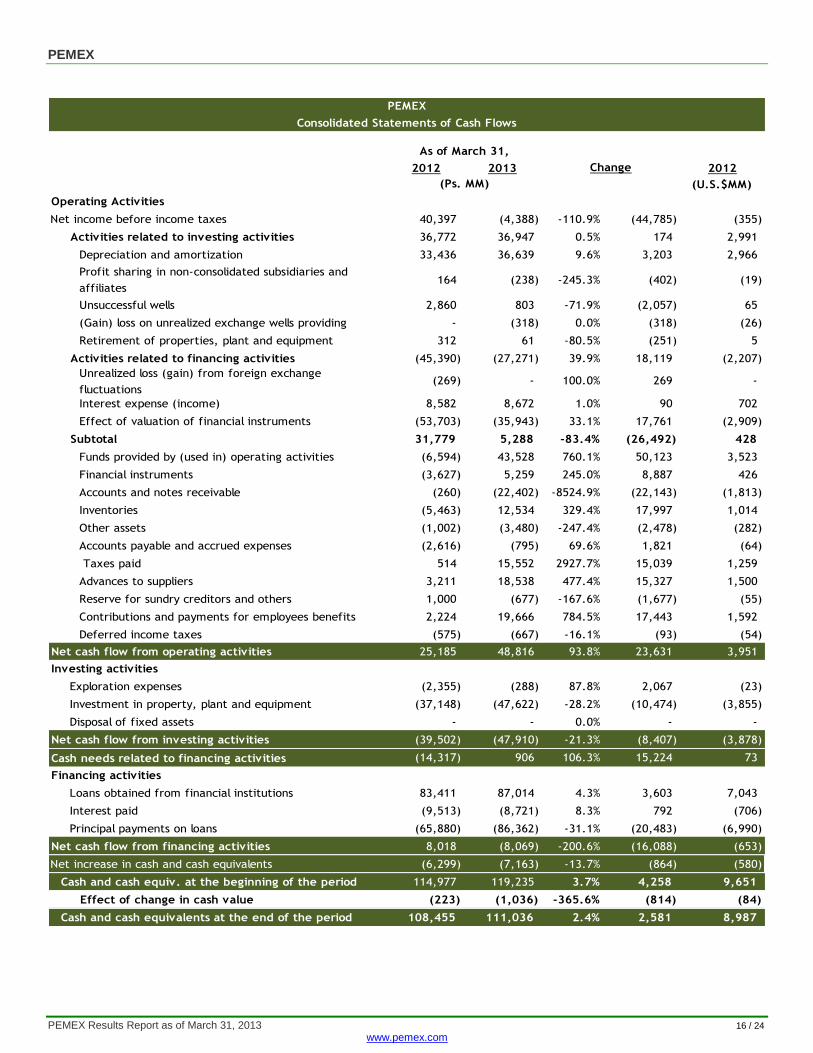
Consolidated Statements of Cash Flows
2012 2013 2012
(U.S.$MM)
Operating Activities
Net income before income taxes 40,397 (4,388) -110.9% (44,785) (355)
Activities related to investing activities 36,772 36,947 0.5% 174 2,991
Depreciation and amortization 33,436 36,639 9.6% 3,203 2,966
Profit sharing in non-consolidated subsidiaries and
affiliates164 (238) -245.3% (402) (19)
Unsuccessful wells 2,860 803 -71.9% (2,057) 65
(Gain) loss on unrealized exchange wells providing - (318) 0.0% (318) (26)
Retirement of properties, plant and equipment 312 61 -80.5% (251) 5
Activities related to financing activities (45,390) (27,271) 39.9% 18,119 (2,207)
Unrealized loss (gain) from foreign exchange
fluctuations(269) - 100.0% 269 -
Interest expense (income) 8,582 8,672 1.0% 90 702
Effect of valuation of financial instruments (53,703) (35,943) 33.1% 17,761 (2,909)
Subtotal 31,779 5,288 -83.4% (26,492) 428
Funds provided by (used in) operating activities (6,594) 43,528 760.1% 50,123 3,523
Financial instruments (3,627) 5,259 245.0% 8,887 426
Accounts and notes receivable (260) (22,402) -8524.9% (22,143) (1,813)
Inventories (5,463) 12,534 329.4% 17,997 1,014
Other assets (1,002) (3,480) -247.4% (2,478) (282)
Accounts payable and accrued expenses (2,616) (795) 69.6% 1,821 (64)
Taxes paid 514 15,552 2927.7% 15,039 1,259
Advances to suppliers 3,211 18,538 477.4% 15,327 1,500
Reserve for sundry creditors and others 1,000 (677) -167.6% (1,677) (55)
Contributions and payments for employees benefits 2,224 19,666 784.5% 17,443 1,592
Deferred income taxes (575) (667) -16.1% (93) (54)
Net cash flow from operating activities 25,185 48,816 93.8% 23,631 3,951
Investing activities
Exploration expenses (2,355) (288) 87.8% 2,067 (23)
Investment in property, plant and equipment (37,148) (47,622) -28.2% (10,474) (3,855)
Disposal of fixed assets - - 0.0% - -
Net cash flow from investing activities (39,502) (47,910) -21.3% (8,407) (3,878)
Cash needs related to financing activities (14,317) 906 106.3% 15,224 73
Financing activities
Loans obtained from financial institutions 83,411 87,014 4.3% 3,603 7,043
Interest paid (9,513) (8,721) 8.3% 792 (706)
Principal payments on loans (65,880) (86,362) -31.1% (20,483) (6,990)
Net cash flow from financing activities 8,018 (8,069) -200.6% (16,088) (653)
Net increase in cash and cash equivalents (6,299) (7,163) -13.7% (864) (580)
Cash and cash equiv. at the beginning of the period 114,977 119,235 3.7% 4,258 9,651
Effect of change in cash value (223) (1,036) -365.6% (814) (84)
Cash and cash equivalents at the end of the period 108,455 111,036 2.4% 2,581 8,987
Change
PEMEX
As of March 31,
(Ps. MM)
PEMEX
PEMEX Results Report as of March 31, 2013 17 / 24 www.pemex.com
Other Relevant Events
Recent Appointments
On February 26, 2013, the Ministry of Public Function announced the appointment of new heads of PEMEX’s Internal Control Body, its subsidiary entities, P.M.I. Comercio Internacional, S.A. de C.V. and the Mexican Petroleum Institute. Petróleos Mexicanos Antonio Domínguez Sagols - Head of the Internal Control Body Pemex Gas and Basic Petrochemicals Armando de Luna Ávila - Head of the Internal Control Body Pemex Refining Luis Alberto Ramos Padilla - Head of the Internal Control Body Pemex Exploration and Production Daniel Ramírez Ruiz - Head of the Internal Control Body Pemex Petrochemicals Alejandro Valencia López - Head of the Internal Control Body P.M.I. Comercio Internacional, S.A. DE C.V. Luis Fernández Tovar - Head of the Internal Control Body Mexican Petroleum Institute Alfredo Rivera Vázquez - Head of the Internal Control Body
Agreements with Asia
On April 8, 2013, Petróleos Mexicanos and China International United Petroleum & Chemicals Co., Ltd. (UNIPEC), a subsidiary of SINOPEC, entered into a collaboration agreement to strengthen commercial ties and enhance crude oil exports to China. On April 8, 2013, Petróleos Mexicanos signed non-binding memorandums of understanding with China National Petroleum Corporation (CNPC), a Chinese state-owned oil and gas company, and Xinxing Cathay International Group Co. Ltd. to cooperate on technical and scientific matters. On April 9, 2013, PEMEX signed a memorandum of understanding and collaboration with the Japanese company Mitsui Corporation, Ltd., to develop a gas pipeline that will import allow for the import of gas from the U.S. to Mexico. The gas pipeline project Tucson – Sásabe covers approximately 100 km and an estimated investment of U.S.$460 million.
Fleet Renewal In January, March and April, 2013, PEMEX received four tankers: the Centla, the Jaguaroundi, the Texistepec and the Rarámuri, which were constructed under the highest environmental and technological standards. These vessels reduce the age of PEMEX’s fleet, currently comprised of 19 tankers, and can each store up to 302 Mb, thereby increasing the fleet’s capacity.
PEMEX
PEMEX Results Report as of March 31, 2013 18 / 24 www.pemex.com
If you would like to be included in our distribution list, please access www.ri.pemex.com and then “Distribution List.” If you would like to contact us, please call or send an email to [email protected]. Telephone: (52 55) 1944 9700 Voice mail: (52 55) 1944 2500 ext. 59412
Follow us at @PEMEX_RI
Rolando Galindo [email protected] Carmina Moreno Arturo Limón Cristina Pérez [email protected] [email protected] cristina.perez @pemex.com Cristina Arista Ana Lourdes Benavides Alejandro López [email protected] [email protected] [email protected]
Variations Cumulative and quarterly variations are calculated comparing the period with the same one of the previous year; unless specified otherwise.
Rounding Numbers may not total due to rounding.
Financial Information Excluding budgetary and volumetric information, the financial information included in this report and the annexes hereto is based on unaudited consolidated financial statements prepared in accordance with the Normas de Información Financiera (Mexican Financial Reporting Standards, or FRS)-formerly Mexican GAAP- issued by the Consejo Mexicano para la
Investigación y Desarrollo de Normas de Información Financiera (the Mexican Board for Research and Development of Financial Reporting Standards, or the CINIF).
Based on FRS B-10 "Inflation effects," 2009 and 2012 amounts are expressed in nominal terms.
Based on FRS B-3 "Income Statement” and FRS C-10“Derivative Financial Instruments and Hedging Transactions,” the financial income and cost of the Comprehensive Financing Result include the effect of financial derivatives.
EBITDA is a non-U.S. GAAP and non-FRS measure issued by the CINIF. Budgetary information is based on standards from Mexican governmental accounting; therefore, it does not include information from the subsidiary companies of Petróleos Mexicanos. Foreign Exchange Conversions Convenience translations into U.S. dollars of amounts in Mexican pesos have been made at the established exchange rate, at March 31, 2013, of Ps. 12.3546 = U.S.$1.00. Such translations should not be construed as a representation that the Mexican peso amounts have been or could be converted into U.S. dollars at the foregoing or any other rate.
Fiscal Regime Since January 1, 2006, PEMEX has been subject to a new fiscal regime. Pemex-Exploration and Production’s (PEP) tax regime is governed by the Federal Duties Law, while the tax regimes of the other Subsidiary Entities continue to be governed by Mexico’s Income Tax Law. The most important duty paid by PEP is the Ordinary Hydrocarbons Duty (OHD), the tax base of which is a quasi operating profit. In addition to the payment of the OHD, PEP is required to pay other duties. Under PEMEX’s current fiscal regime, the Special Tax on Production and Services (IEPS) applicable to gasoline and diesel is regulated under the Federal Income Law. PEMEX is an intermediary between the Secretary of Finance and Public Credit (SHCP) and the final consumer; PEMEX retains the amount of IEPS and transfers it to the Federal Government. The IEPS rate is calculated as the difference between the retail or “final price,” and the “producer price.” The final prices of gasoline and diesel are established by the SHCP. PEMEX’s producer price is calculated in reference to that of an efficient refinery operating in the Gulf of Mexico. Since 2006, if the final price is lower than the producer price, the SHCP credits to PEMEX the difference among them. The IEPS credit amount is accrued, whereas the information generally presented by the SHCP is cash-flow. Hydrocarbon Reserves Pursuant to Article 10 of the Regulatory Law to Article 27 of the Political Constitution of the United Mexican States Concerning Petroleum Affairs, (i) PEMEX's reports evaluating hydrocarbon reserves shall be approved by the National Hydrocarbons Commission (NHC); and (ii) the Secretary of Energy will register and disclose Mexico's hydrocarbon reserves based on information provided by the NHC. As of the date of this report, this process is ongoing. As of January 1, 2012, the SEC changed its rules to permit oil and gas companies, in their filings with the SEC, to disclose not only proved reserves, but also probable reserves and possible reserves. In addition, we do not necessarily mean that the probable or possible reserves described herein meet the recoverability thresholds established by the SEC in its new definitions. Investors are urged to consider closely the disclosure in our Form 20-F and our annual report to the Mexican Banking and Securities Commission, available at http://www.pemex.com/.
Forward-looking statements This report contains forward-looking statements. We may also make written or oral forward-looking statements in our periodic reports to the CNBV and the SEC, in our annual reports, in our offering circulars and prospectuses, in press releases and other written materials and in oral statements made by our officers, directors or employees to third parties. We may include forward-looking statements that address, among other things, our: drilling and other exploration activities; import and export activities; and projected and targeted capital expenditures ; costs; commitments; revenues; liquidity, etc. Actual results could differ materially from those projected in such forward-looking statements as a result of various factors that may be beyond our control. These factors include, but are not limited to: changes in international crude oil and natural gas prices; effects on us from competition; limitations on our access to sources of financing on competitive terms; significant economic or political developments in Mexico; developments affecting the energy sector; and changes in our regulatory environment. Accordingly, you should not place undue reliance on these forward-looking statements. In any event, these statements speak only as of their dates, and we undertake no obligation to update or revise any of them, whether as a result of new information, future events or otherwise. These risks and uncertainties are more fully detailed in PEMEX’s most recent Form 20-F filing with the SEC (www.sec.gov), and the PEMEX prospectus filed with the CNBV and available through the Mexican Stock Exchange (www.bmv.com.mx). These factors could cause actual results to differ materially from those contained in any forward-looking statement. PEMEX PEMEX is Mexico’s national oil and gas company. Created in 1938, it is the exclusive producer of Mexico’s oil and gas resources. The operating subsidiary entities are Pemex-Exploration and Production, Pemex-Refining, Pemex-Gas and Basic Petrochemicals and Pemex-Petrochemicals. The principal subsidiary company is PMI Comercio Internacional, S.A. de C.V., Pemex’s international trading arm.