presentation q2 2017/18 · gross profit of 420 (373) msek •gross margin of 15.4% ... adv....
TRANSCRIPT

Presentation – Q2 2017/18April, 2018

Dustin at a glance
FINANCIAL REPORT Q2 2017/18
Net sales…sold online…250,000 hardware and software products…
Hardware
~89%
Online
~75%
…to B2B customers…across the Nordics…
Sweden
~51%
Finland
~17%
Denmark
~17%
Norway
~15%
Adjusted EBITA and margin
1.4 million orders
Dustin (B2B)
Dustin Home (B2C)
Clients
Hardware
Server
OS SaaS
Software
Financing CaaS
Services
Software and services
~11%
SMB
Public/Large
B2C
Full assortment
Replienishment IT
IT products
SEK 6,000
SEK 7,000
SEK 2,000
Customers Offering Avg. order
94%
6%
% net sales
0,000
2,000
4,000
6,000
8,000
10,000
SEK
million
4,0%
4,5%
5,0%
5,5%
6,0%
300
325
350
375
400
425
450
475
SEK
million
Offline
~25%
2
Refers to fiscal year 2016/17 Refers to fiscal year 2016/17
Refers to fiscal year 2016/17 Refers to fiscal year 2016/17

Q2 17/18 Continued margin improvement and robust performance in SMB
Financial Highlights
Net sales grew by 8.8% to 2,723 (2,503) MSEK
• Organic growth of 1.7% in constant currency, of which SMB 10.9%,
LCP -5.0% and B2C 10.8%
Gross profit of 420 (373) MSEK
• Gross margin of 15.4% (14.9%)
Adjusted EBITA of 143 (124) MSEK
• Adjusted EBITA margin of 5.3% (5.0%)
Items affecting comparability of 0.3 (-) MSEK
Earnings per share increased to 1.21 (0.99) SEK
Cash flow from operating activities of 15 (-55) MSEK
Net debt of 1,186 (812) MSEK
• Net debt/adjusted EBITDA of 2.5x (1.9x), slightly up from 2.3x at year
end 2016/17
Net sales and adjusted EBITA margin
2 503
2 723
5,0%5,3%
0%
2%
4%
6%
8%
10%
0
500
1 000
1 500
2 000
2 500
3 000
2016/17 2017/18
Adju
ste
d E
BIT
A m
arg
in
MS
EK
Net sales Adjusted EBITA margin
FINANCIAL REPORT Q2 2017/18
3

Net sales and segment margin
909
1 110
10,7%12,2%
0%
5%
10%
15%
20%
0
200
400
600
800
1 000
1 200
2016/17 2017/18
Segm
ent m
arg
in
MS
EK
Net sales Segment margin
Financial Development – SMB
Continued strong growth in the SMB segment
Net sales growth in SMB of 22.0% y/y
• Organic growth of 10.9% in constant currency
Segment result increased 39.8% to 136 (97) MSEK
• Segment margin improved to 12.2% (10.7%)
Strong online performance towards SMBs
• Robust sales performance, primarily in Sweden and Denmark
• IT-Hantverkarna divested as of December 5
Favorable product mix drives margin improvement
• A general improvement in the product mix in comparable units as
well as completed acquisitions drives margin development
• Positive margin contribution from higher private label product sales
• The customer base for SaaS configurations grew to 1,180 active
customers (670), corresponding to 37,863 users (16,427)
MSEKQ2
2017/18
Q2
2016/17
Organic
growth
Q1 y/y
growth
Net sales 1,110 909 10.9% 22.0%
Segment result 136 97 – 39.8%
Segment margin 12.2% 10.7% – –
FINANCIAL REPORT Q2 2017/18
4

Net sales and segment margin
1 441 1 444
7,4%6,5%
0%
5%
10%
15%
20%
0
250
500
750
1 000
1 250
1 500
2016/17 2017/18
Segm
ent m
arg
in
MS
EK
Net sales Segment margin
Financial Development – LCP
Selective approach towards lower margin contracts
• Net sales growth in LCP of 0.2% y/y
• Organic growth of -5.0% in constant currency
• Segment result decreased to 93 (106) MSEK
• Segment margin at 6.5% (7.4%)
• Selective approach to lower margin volume transactions
• More selective in lower margin volume transactions under certain
framework agreements for the public sector, particularly in Finland
and Denmark
• Strong sales to the public sector in Norway and positive trend for
large companies in all markets
• Pressure on margins
• Continued high share of sales under new framework agreements
with lower average margin
MSEKQ2
2017/18
Q2
2016/17
Organic
growth
Q2 y/y
growth
Net sales 1,444 1,441 -5.0% 0.2%
Segment result 93 106 – -12.0%
Segment margin 6.5% 7.4% – –
FINANCIAL REPORT Q2 2017/18
5

Net sales and segment margin
153 169
3,9%5,0%
0%
2%
4%
6%
8%
10%
12%
0
50
100
150
200
2016/17 2017/18
Segm
ent m
arg
in
MS
EK
Net sales Segment margin
Financial Development – B2C
Positive quarterly growth – focus on margin
Net sales growth in B2C of 10.6% y/y
• Organic growth of 10.8% in constant currency
Segment result improved to 8.4 (5.9) MSEK
• Segment margin at 5.0% (3.9%)
Complement segment representing around 6% of total sales
• Positive sales development in Finland and Denmark
• Strong sales in the consumer electronics and client accessories
product categories
Continued focus on margin
• Pricing discipline and flexible cost base
• Valuable segment to understand market trends and to get
access to consumer assortment
MSEKQ2
2017/18
Q2
2016/17
Organic
growth
Q1 y/y
growth
Net sales 169 153 10.8% 10.6%
Segment result 8.4 5.9 – 42.2%
Segment margin 5.0% 3.9% – –
FINANCIAL REPORT Q2 2017/18
6
Net Working Capital and Net debt
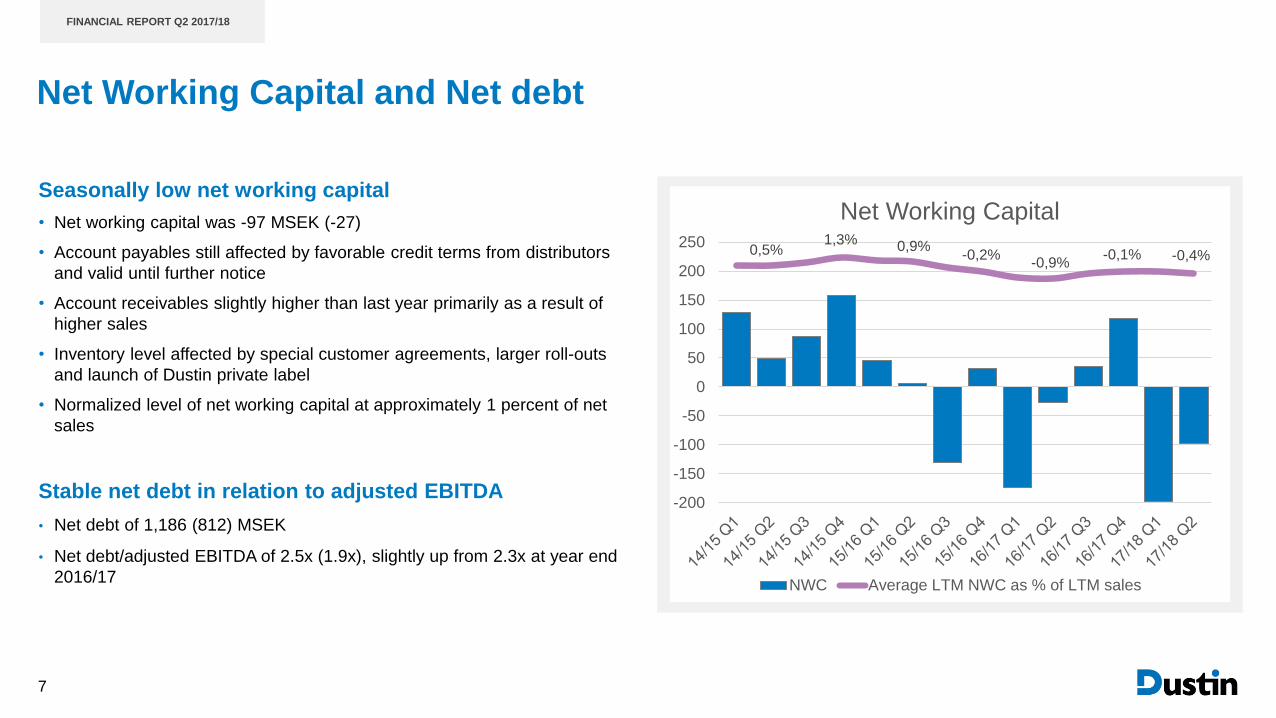
Seasonally low net working capital
• Net working capital was -97 MSEK (-27)
• Account payables still affected by favorable credit terms from distributors
and valid until further notice
• Account receivables slightly higher than last year primarily as a result of
higher sales
• Inventory level affected by special customer agreements, larger roll-outs
and launch of Dustin private label
• Normalized level of net working capital at approximately 1 percent of net
sales
Stable net debt in relation to adjusted EBITDA
• Net debt of 1,186 (812) MSEK
• Net debt/adjusted EBITDA of 2.5x (1.9x), slightly up from 2.3x at year end
2016/17
FINANCIAL REPORT Q2 2017/18
x
0,5%1,3% 0,9%
-0,2%-0,9%
-0,1% -0,4%
-200
-150
-100
-50
0
50
100
150
200
250
Net Working Capital
NWC Average LTM NWC as % of LTM sales
7
Cash flow and capex
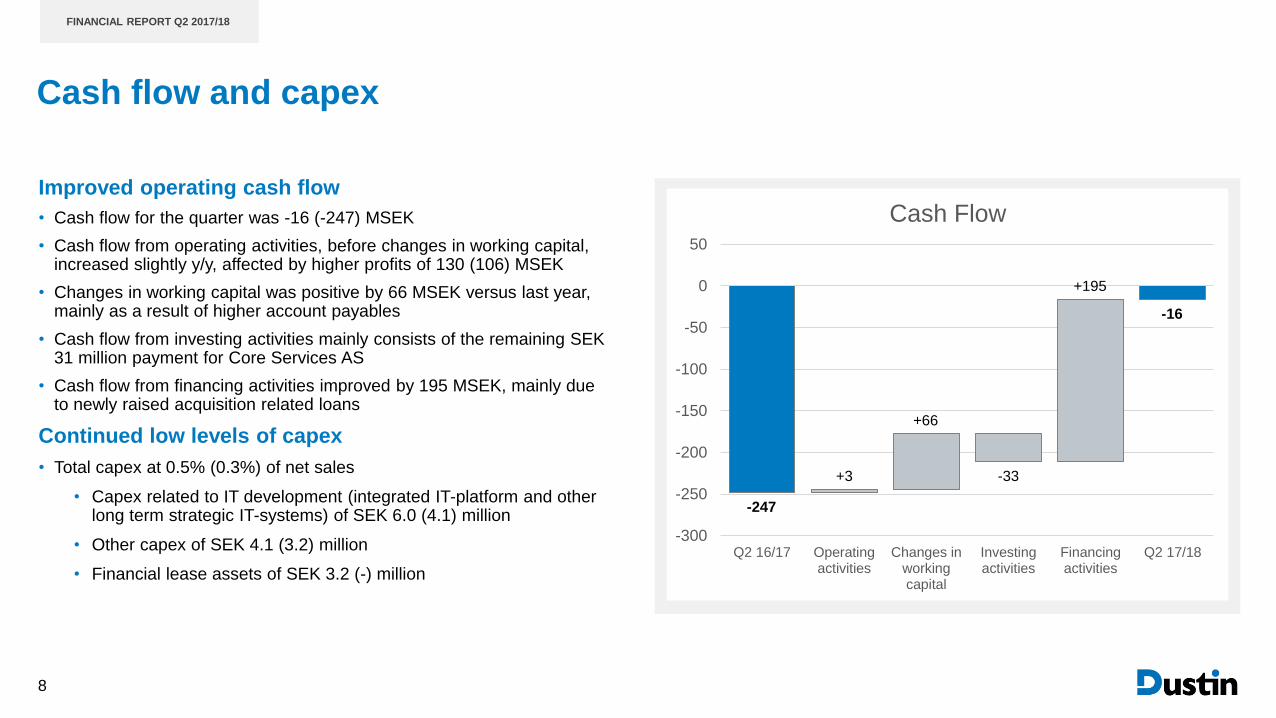
Improved operating cash flow
• Cash flow for the quarter was -16 (-247) MSEK
• Cash flow from operating activities, before changes in working capital, increased slightly y/y, affected by higher profits of 130 (106) MSEK
• Changes in working capital was positive by 66 MSEK versus last year, mainly as a result of higher account payables
• Cash flow from investing activities mainly consists of the remaining SEK 31 million payment for Core Services AS
• Cash flow from financing activities improved by 195 MSEK, mainly due to newly raised acquisition related loans
Continued low levels of capex
• Total capex at 0.5% (0.3%) of net sales
• Capex related to IT development (integrated IT-platform and other long term strategic IT-systems) of SEK 6.0 (4.1) million
• Other capex of SEK 4.1 (3.2) million
• Financial lease assets of SEK 3.2 (-) million
FINANCIAL REPORT Q2 2017/18
8
-300
-250
-200
-150
-100
-50
0
50
Q2 16/17 Operatingactivities
Changes inworkingcapital
Investingactivities
Financingactivities
Q2 17/18
Cash Flow
+195
+66
+3
-16
-33
-247
9
Extensive quarterly fluctuations in public sector contracts within LCP
Source: Dustin
LCP – reported quarterly growth
FINANCIAL REPORT Q2 2017/18
9
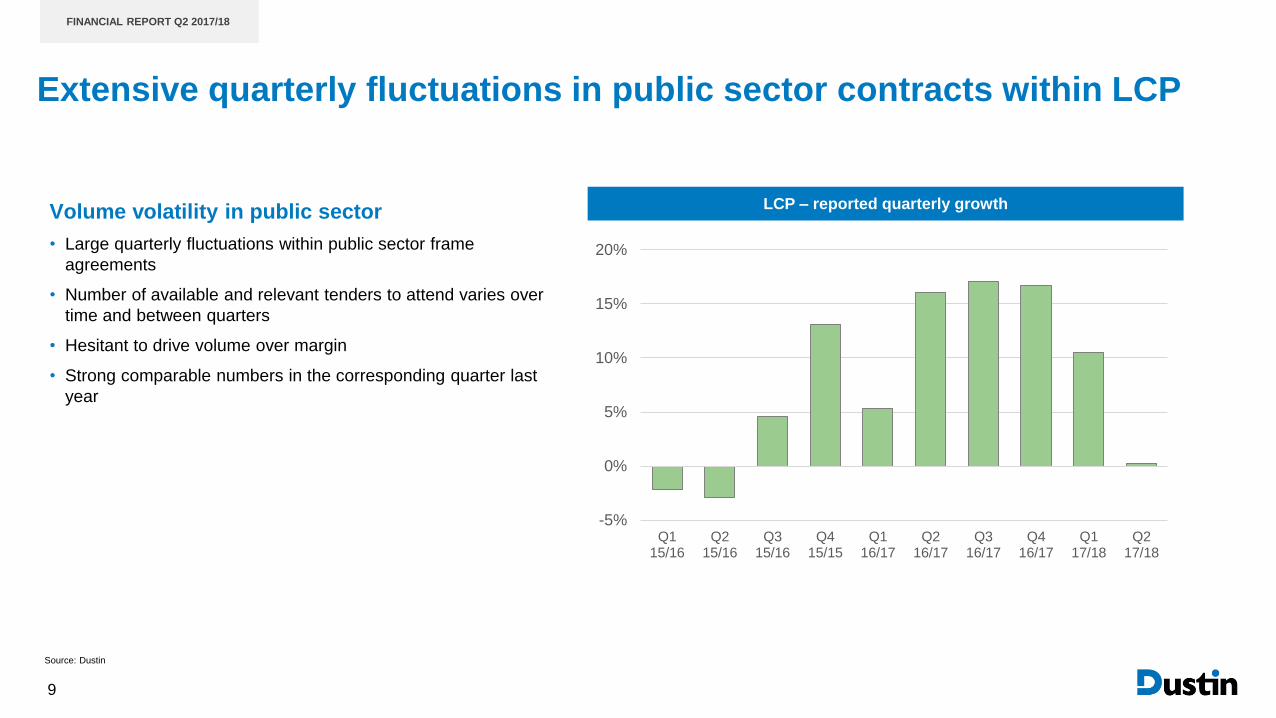
Volume volatility in public sector
• Large quarterly fluctuations within public sector frame
agreements
• Number of available and relevant tenders to attend varies over
time and between quarters
• Hesitant to drive volume over margin
• Strong comparable numbers in the corresponding quarter last
year
-5%
0%
5%
10%
15%
20%
Q115/16
Q215/16
Q315/16
Q415/15
Q116/17
Q216/17
Q316/17
Q416/17
Q117/18
Q217/18

FINANCIAL REPORT Q2 2017/18
10
Well defined levers will contribute to the margin journeyMargin journey potential FY21/22
Source: Dustin
Private label Value accretive M&A Managed services
Margin 16/17 Customer mix Private label Value accretive M&A Managed services Margin 21/22
~6%
4.6%
Customer mix
• SMB growing faster than LCP due
to our cost efficient online platform
to serve SMB customers and a
continued focus on SMB offerings
• Targeting 25% of sales in each of
the selected categories to reach
annual private label sales of 400
MSEK within 3 years with an
incremental EBITA margin of
around 10 percentage points on
average
• Target to raise share of advanced
products and services and recurring
revenue by adding 3-5 bolt-on
acquisitions annually
• Supporting customer journey by
driving both margin and loyalty
• Scalable platform aggregating a
wide portfolio of SaaS to the B2B
market
• Target to reach 10,000 customers
adding 300 MSEK in sales within 3
years enabling 20-50% gross margin
on incremental SaaS sales and
attached services
0.1-0.3%
0.2-0.4%
0.6-0.8%
0.3-0.5%
11
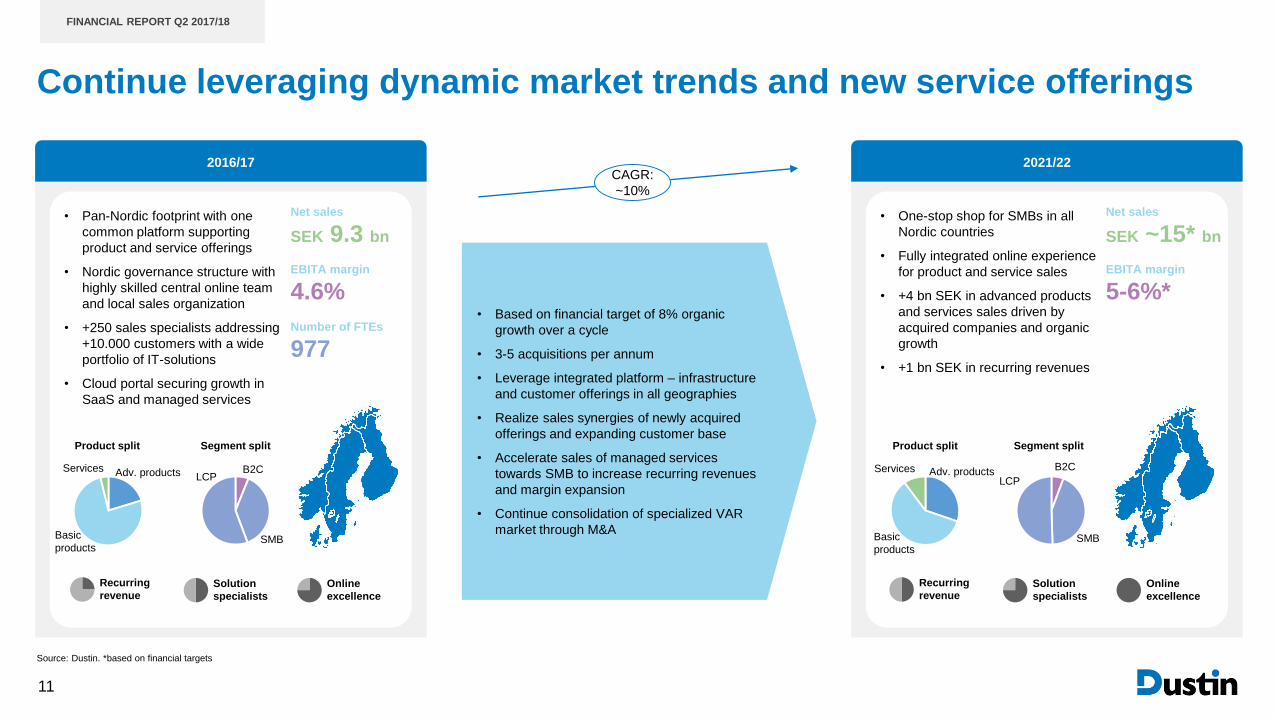
2016/17
Continue leveraging dynamic market trends and new service offerings
• Pan-Nordic footprint with one
common platform supporting
product and service offerings
• Nordic governance structure with
highly skilled central online team
and local sales organization
• +250 sales specialists addressing
+10.000 customers with a wide
portfolio of IT-solutions
• Cloud portal securing growth in
SaaS and managed services
Net sales
SEK 9.3 bn
EBITA margin
4.6%
Number of FTEs
977
B2C
SMB
LCPAdv. products
Basic
products
Services
Recurring
revenueSolution
specialists
Online
excellence
Segment splitProduct split
2021/22
• One-stop shop for SMBs in all
Nordic countries
• Fully integrated online experience
for product and service sales
• +4 bn SEK in advanced products
and services sales driven by
acquired companies and organic
growth
• +1 bn SEK in recurring revenues
Net sales
SEK ~15* bn
EBITA margin
5-6%*• Based on financial target of 8% organic
growth over a cycle
• 3-5 acquisitions per annum
• Leverage integrated platform – infrastructure
and customer offerings in all geographies
• Realize sales synergies of newly acquired
offerings and expanding customer base
• Accelerate sales of managed services
towards SMB to increase recurring revenues
and margin expansion
• Continue consolidation of specialized VAR
market through M&A
Recurring
revenueSolution
specialists
Online
excellence
CAGR:
~10%
Segment splitProduct split
B2C
SMB
LCPAdv. products
Basic
products
Services
Source: Dustin. *based on financial targets
FINANCIAL REPORT Q2 2017/18

Summary
Margin improvement and robust performance in SMB
Net sales increased by 8.8%
• Organic net sales growth of 1.7% in constant currency
• Robust growth in SMB and B2C, while volume volatility within LCP burdens
total growth
Gross margin at 15.4% (14.9%)
• Positively affected by a more favorable product mix primarily as a result of
completed acquisitions in the past quarters
Adjusted EBITA margin of 5.3% (5.0%)
• Positively impacted by a higher gross margin, a more favorable mix between
segments and increased sales of private label products.
Earnings per share increased to 1.21 (0.99) SEK
FINANCIAL REPORT Q 2016/17
12

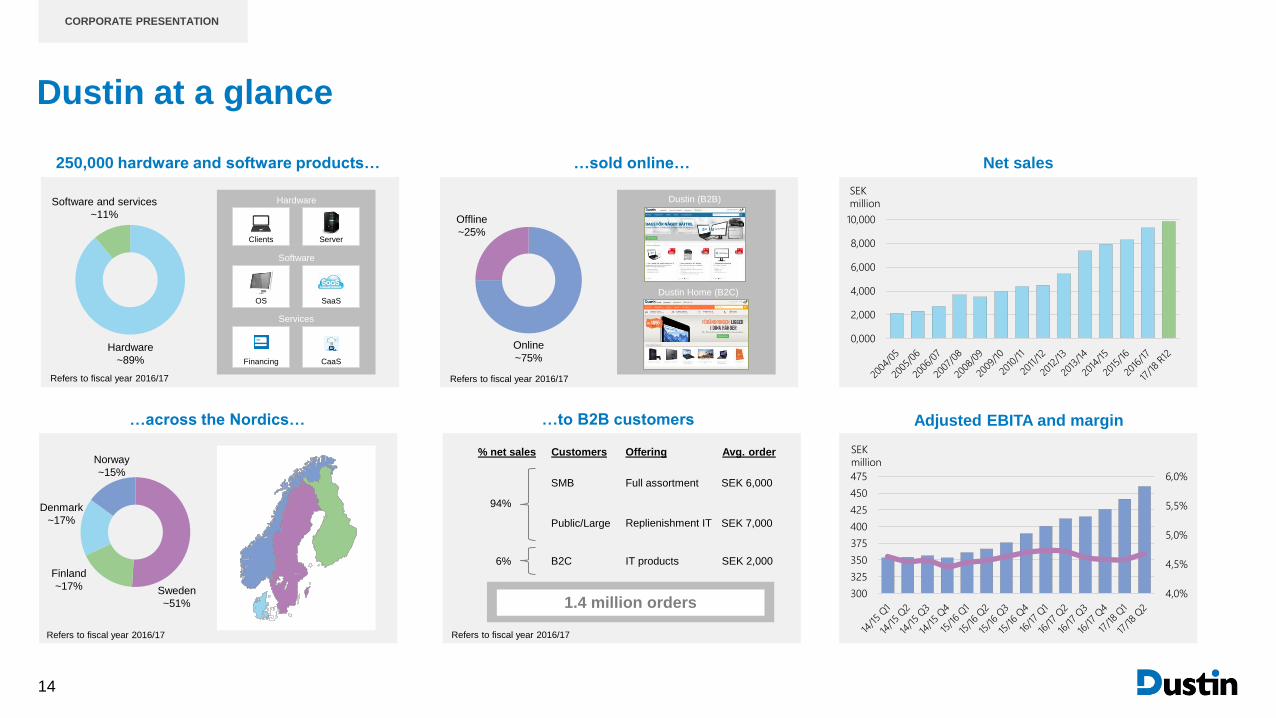
Dustin at a glance
CORPORATE PRESENTATION
Net sales…sold online…250,000 hardware and software products…
Hardware
~89%
Online
~75%
…to B2B customers…across the Nordics…
Sweden
~51%
Finland
~17%
Denmark
~17%
Norway
~15%
Adjusted EBITA and margin
1.4 million orders
Dustin (B2B)
Dustin Home (B2C)
Clients
Hardware
Server
OS SaaS
Software
Financing CaaS
Services
Software and services
~11%
SMB
Public/Large
B2C
Full assortment
Replienishment IT
IT products
SEK 6,000
SEK 7,000
SEK 2,000
Customers Offering Avg. order
94%
6%
% net sales
0,000
2,000
4,000
6,000
8,000
10,000
SEK
million
4,0%
4,5%
5,0%
5,5%
6,0%
300
325
350
375
400
425
450
475
SEK
million
Offline
~25%
14
Refers to fiscal year 2016/17 Refers to fiscal year 2016/17
Refers to fiscal year 2016/17 Refers to fiscal year 2016/17

High growth position in a large market
Large and fragmented addressable market Key trends driving Dustin’s underlying growth
Channel shift from offline
to online
Growth pockets within advanced
products and services
Higher growth for smaller
companies
*Compound Annual Growth Rate
Note: Market data based on calendar year. The addressable market refers to hardware sales to the B2B segment and selected parts of software and
services to the customer group small and medium enterprises.
Source: Dustin estimates based on market data from IDC and market analysis from a senior advisor.
CORPORATE PRESENTATION
15

16
Dustin has a strong position in the value chain
A LARGE NUMBER OF SUPPLIERS… ...NEED AGGREGATOR TO INTERACT WITH... …A LARGE NUMBER OF CUSTOMERS
Distribution to customers that are difficult to serve
>100k loyal B2B customers
Unique partner for campaigns / product launches
Value proposition to OEMs and distributors
Significant scale
Long term experience
Market leading brand
High barriers to entry
Wide product and service offering
High IT knowledge
Fast and reliable delivery
Value proposition to customers
SMB
Public/
Large
corporations
Consumers
~100k
customers
~5k
customers
~350k
customers
Dustin’scustomer base2)
Software
~1.200 brands1)
Hardware
Distributors
1) Purchased from ~350 suppliers (OEMs or distributors). 2) Defined as customers that have made at least one purchase during last 18 months. For consumers, the unique identifier is account number rather than personal identification number.
CORPORATE PRESENTATION
16

Unique position combining cost efficiency with high service level
Hig
hLow
Degre
e o
f valu
e a
dded s
erv
ice
HighLow Cost efficiency
Small and medium
sized businesses
Consumers
Large
corporations
Small IT
infrastructure
and service
companies
Product-near services
Integrated solutions
Strong brand name
Fast delivery
On-site services
Strategic IT consultancy
ERP implementation
Non-IT related consumer products
Wide offering of ~200k IT products
Dustin’s focus areas
Non SMB related services
High IT knowledge
Illustrative
Efficient execution Central functionsHigh online shareScale
Atea
Komplett
Verkkokauppa
24% 21%13% 11% 11%1)
Caperio Atea Verkkokauppa Komplett Dustin
SG
&A
as %
of
ne
t sa
les (
20
13
)
Caperio
1) 2014. Refer to the financial year ended 31 August. 2014.
Source: Annual reports. industry analysis and management analysis.
CORPORATE PRESENTATION
17

Multi-channel approach to drive growth and margins
ONLINE
SALES
OUTBOUND
SALES
CONSULTATIVE
SALES
Three tiered
sales model Medium AdvancedBasic
Customer needs
Online
~75%of net sales
Offline
~25% of net sales
Server
Clients Software
Stand-alone services
and solutions
Advanced products
Basic products
Cloud solutions MPS1)
Financing
Hig
he
r g
ross m
arg
in
Product
portfolio Medium AdvancedBasic
Customer needs
SaaS
CORPORATE PRESENTATION
18

Financial targets
Financial targets Historical performance
Dustin’s target is to achieve average annual organic net sales growth
amounting to 8 percent over an economic cycle
In addition, Dustin targets to grow through acquisitions
Dustin’s target is to increase adjusted EBITA margin over time and in
the medium term achieve 5–6 percent adjusted EBITA margin
Dustin´s capital structure shall provide a high degree of financial
flexibility and allow for acquisitions
Dustin targets to have a net debt, over time, amounting to a multiple of
2–3 times adjusted EBITDA for the last twelve months
Dustin’s target is to pay a dividend corresponding to more than 70
percent of net profit
The dividend shall take into account acquisitions, the company’s
financial position, cash flow and future growth opportunities
Period: 2012/13 – 2016/17
Average: ~8% organic growth per year
Period: 2012/13 – 2016/17
Average: 4.6%
Period: 2016/17
Actual: 2.3x adjusted EBITDA
Period: 2016/17
Actual: 87% of adj. net profit, corresponding
to SEK 2.80 per share
Net sales
growth
Profitability
Capital
structure
Dividend
policy
8% organic growth
Average per year over a
cycle
5–6%
Adj. EBITA
margin
2.0–3.0x
Net debt to adj.
EBITDA
>70%
Pay-out ratio
CORPORATE PRESENTATION
19

20
2016/17
Continue leveraging dynamic market trends and new service offerings
• Pan-Nordic footprint with one
common platform supporting
product and service offerings
• Nordic governance structure with
highly skilled central online team
and local sales organization
• +250 sales specialists addressing
+10.000 customers with a wide
portfolio of IT-solutions
• Cloud portal securing growth in
SaaS and managed services
Net sales
SEK 9.3 bn
EBITA margin
4.6%
Number of FTEs
977
B2C
SMB
LCPAdv. products
Basic
products
Services
Recurring
revenueSolution
specialists
Online
excellence
Segment splitProduct split
2021/22
• One-stop shop for SMBs in all
Nordic countries
• Fully integrated online experience
for product and service sales
• +4 bn SEK in advanced products
and services sales driven by
acquired companies and organic
growth
• +1 bn SEK in recurring revenues
Net sales
SEK ~15* bn
EBITA margin
5-6%*• Based on financial target of 8% organic
growth over a cycle
• 3-5 acquisitions per annum
• Leverage integrated platform – infrastructure
and customer offerings in all geographies
• Realize sales synergies of newly acquired
offerings and expanding customer base
• Accelerate sales of managed services
towards SMB to increase recurring revenues
and margin expansion
• Continue consolidation of specialized VAR
market through M&A
Recurring
revenueSolution
specialists
Online
excellence
CAGR:
~10%
Segment splitProduct split
B2C
SMB
LCPAdv. products
Basic
products
Services
Source: Dustin. *based on financial targets
CORPORATE PRESENTATION

21
Well defined levers will contribute to the margin journeyMargin journey potential FY21/22
Source: Dustin
Private label Value accretive M&A Managed services
Margin 16/17 Customer mix Private label Value accretive M&A Managed services Margin 21/22
~6%
4.6%
Customer mix
• SMB growing faster than LCP due
to our cost efficient online platform
to serve SMB customers and a
continued focus on SMB offerings
• Targeting 25% of sales in each of
the selected categories to reach
annual private label sales of 400
MSEK within 3 years with an
incremental EBITA margin of
around 10 percentage points on
average
• Target to raise share of advanced
products and services and recurring
revenue by adding 3-5 bolt-on
acquisitions annually
• Supporting customer journey by
driving both margin and loyalty
• Scalable platform aggregating a
wide portfolio of SaaS to the B2B
market
• Target to reach 10,000 customers
adding 300 MSEK in sales within 3
years enabling 20-50% gross margin
on incremental SaaS sales and
attached services
0.1-0.3%
0.2-0.4%
0.6-0.8%
0.3-0.5%
CORPORATE PRESENTATION

22
Higher share of recurring revenue increases loyalty and marginRecurring revenue potential FY21/22
Source: Dustin. Note: Recurring revenue is defined as services which are automatically renewed and billed on a regular basis where Dustin plays an active part in the delivery/handling. Warranties, financing and traditional software agreements (e.g
OVS) are not included
Recurring revenue FY16/17 Current run-rate Organic growth Value accretive M&A Recurring revenue FY21/22
~1,000 MSEK
147 MSEK
Organic growth Value accretive M&ACurrent run-rate
• Acquisition of IKT, Purity and Saldab in
FY16/17
• Acquisition of Norriq ICS, Core Services
and JML System in Q1 17/18
• Recurring revenues will exceed growth of
ordinary business due to market dynamics
• Increased investments in managed
services
• Further acquisitions will be focused in
areas with recurring revenue as a standard
~100 MSEK
~300 MSEK
~500 MSEK
CORPORATE PRESENTATION
22

23
Dustin’s Cloud Platform - The one-stop-shop targeting SMBs
Scalable platform aggregating a wide portfolio of SaaS to the Nordic B2B market
Launch being Microsoft centric due to strong legacy and cloud services brand recognition
Fast growth within Dustin’s SMB customer base and significant cross-selling opportunities
SaaS bundled with in-house Dustin solutions. e.g. Office 365 migration and Helpdesk
Ease of use to order and manage subscriptions
Dustin’s multi-channel sales model ideal to convert and migrate transactional HW customers
Increasing share of high-margin recurring revenue
SMB
Public/
Large
corporations
Consumers
~100k
customers
~5k
customers
~350k
customers
Dustin’scustomer base
0,000
0,200
0,400
0,600
0,800
1,000
1,200
1,400
0,000
10,000
20,000
30,000
40,000
Q4 15/16 Q1 16/17 Q2 16/17 Q3 16/17 Q4 16/17 Q1 17/18 Q2 17/18
Seats and customers
Number of seats Number of customers
23
CORPORATE PRESENTATION
24
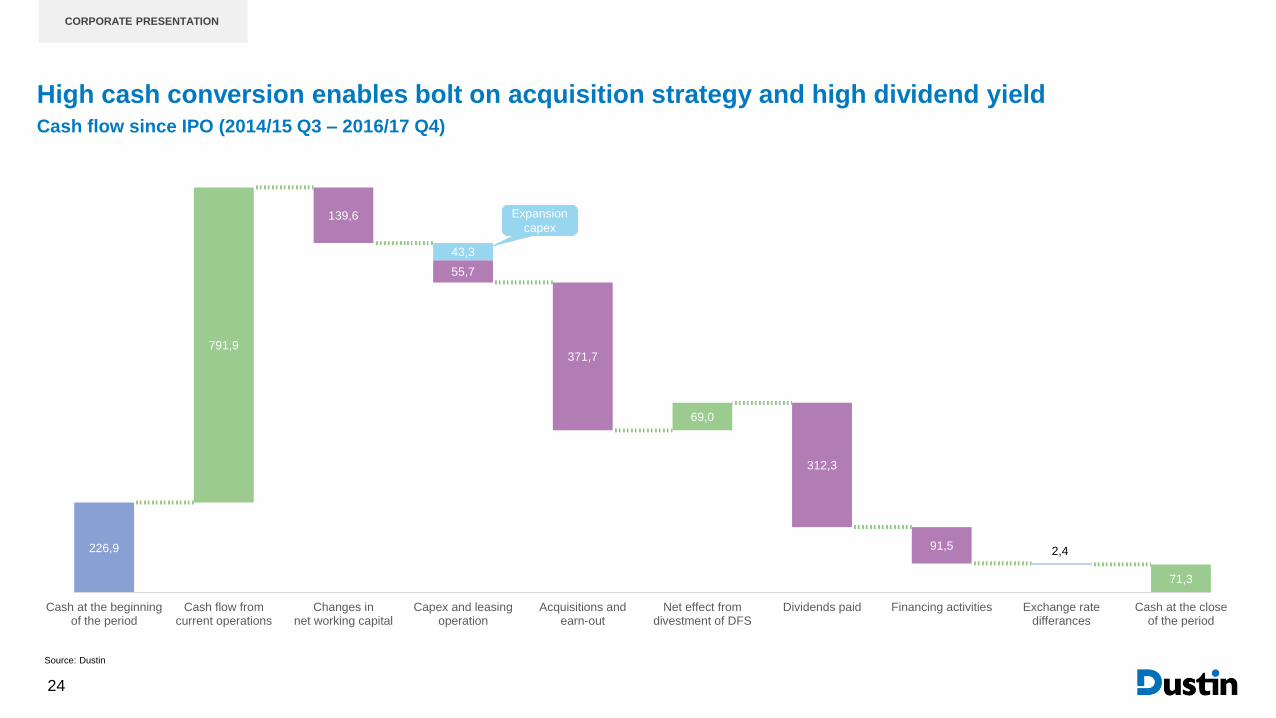
High cash conversion enables bolt on acquisition strategy and high dividend yieldCash flow since IPO (2014/15 Q3 – 2016/17 Q4)
Source: Dustin
226,9
791,9
139,6
55,7
371,7
69,0
312,3
91,5 2,4
71,3
43,3
Cash at the beginningof the period
Cash flow fromcurrent operations
Changes innet working capital
Capex and leasingoperation
Acquisitions andearn-out
Net effect fromdivestment of DFS
Dividends paid Financing activities Exchange ratedifferances
Cash at the closeof the period
Expansion
capex
CORPORATE PRESENTATION
24

Summary of the Second Quarter Results
MSEK Q2 2017/18 Q2 2016/17 Rolling 12 months FY 2016/17
Net sales 2,723 2,503 9,834 9,306
Reported net sales growth 8.8% 11.9% 12.7% 12.1%
Organic net sales growth 1.7% 8.7% 7.2% 8.6%
Items affecting comparability 0.3 - -8.1 -7.3
Adjusted EBITDA 147 127 475 438
Adjusted EBITA 143 124 460 426
- Adjusted EBITA margin 5.3% 5.0% 4.7% 4.6%
Central costs as % of Net sales -3.5% -3.4% -3.6% -3.6%
Net debt 920 576 920 998
Net debt / Adjusted EBITDA - - 2.5x 2.3x
Net working capital -97 -27 -97 118
Return on equity - - 18.0% 16.1%
Earnings per share (SEK) 1.21 0.99 3.46 3.14
Equity per share (SEK) 19.14 18.27 19.14 19.50
Cash flow from operating activities per share (SEK) 0.19 -0.72 5.67 2.80
Dividend per share (SEK) – – - 2.80
APPENDIX
26

27
Historical development shows quarterly fluctuations difficult to explain with previous segments
Source: Dustin
Q1 16/17 Q2 16/17 Q3 16/17 Q4 16/17 Q1 17/18 Q2 17/18
SMB
Net sales 893.2 909.2 897.2 831.1 1,059.8 1,109.6
Segment result 97.6 97.0 92.3 90.6 121.8 135.7
Segment margin % 10.9% 10.7% 10.3% 10.9% 11.5% 12.2%
LCP
Net sales 1,219.8 1,440.7 1,228.0 1,296.1 1,348.4 1,444.1
Segment result 88.9 106.1 83.9 76.5 88.8 93.4
Segment margin % 7.3% 7.4% 6.8% 5.9% 6.6% 6.5%
B2B
Net sales 2,113.0 2,349.9 2,125.3 2,127.2 - -
Segment result 186.5 203.1 176.2 167.1 - -
Segment margin % 8.8% 8.6% 8.3% 7.9% - -
B2C
Net sales 170.6 153.0 132.0 135.2 183.5 169.2
Segment result 5.5 5.9 4.9 8.1 7.9 8.4
Segment margin % 3.3% 3.9% 3.7% 6.0% 4.3% 5.0%
Total
Net sales 2,283.6 2,502.9 2,257.4 2,262.4 2,591.8 2,722.9
Central cost -76.2 -84.9 -86.8 -83.3 -87.5 -94.4
-3.3% -3.4% -3.8% -3.7% -3.4% -3.5%
EBITA 115.8 124.1 94.3 91.9 130.9 143.1
SMB – quarterly development
LCP – quarterly development
New
segm
ents
report
ed
APPENDIX
728,8 736,7 769,2
646,4
822,6 828,4 797,7
695,3
893,2 909,2 897,2831,1
1059,81109,6
12,9% 12,4%
3,7%
7,6%8,6% 9,8%
12,5%
19,5%18,7%
22,0%
Q114/15
Q214/15
Q314/15
Q414/15
Q115/16
Q215/16
Q315/16
Q415/16
Q116/17
Q216/17
Q316/17
Q416/17
Q117/18
Q217/18
Net sales Growth
1184,71278,9
1002,8 981,9
1158,31241,3
1048,6 1110,91219,8
1440,7
12281296,1 1348,4
1444,1
-2,2% -2,9%
4,6%13,1%
5,3%
16,1% 17,1%16,7%
10,5%
0,2%
Q114/15
Q214/15
Q314/15
Q414/15
Q115/16
Q215/16
Q315/16
Q415/16
Q116/17
Q216/17
Q316/17
Q416/17
Q117/18
Q217/18
Net sales Growth
27