presentation to department of finance - travelodge uk · this presentation has been prepared by...
TRANSCRIPT

Travelodge Goldman Sachs 2016 EMEA Leveraged Finance Conference
Release: 27 September 2016

2
Additional
Colours
Chart 7
Chart 8, Map
Chart 9
Chart 10
Colour 11
Colour 12
Colour 13
Colour 14
Colour 15
Colour 16
230-230-230
Body Text in Arial
Background
Headings, Heading Lines, Bullet Points
Table Rows
Text Boxes, Table Rows
Table Highlight
Lines and Axis
Chart 1
Chart 2
Chart 3
Chart 4
Chart 5
Chart 6
149-179-215
127-127-127
30-62-123
255-255-255
0-0-0
107-148-52
209-4-61
128-100-162
204-206-215
30-62-123
79-129-189
234-240-247
230-224-236
95-95-95
179-162-199
22-46-92
50-87-132
226-239-209
254-197-213
195-235-255
Main Colours
198-213-241
149-179-215
2
Disclaimer You must read the following before continuing
This presentation has been prepared by Thame and London Limited, TVL Finance plc and Travelodge Hotels Limited (collectively, “the “Company”) solely for informational purposes. For the purposes of this
disclaimer, the presentation that follows shall mean and include the slides that follow, the oral presentation of the slides by the Company or any person on their behalf, any question and answer session that
follows the oral presentation, hard copies of this document and any materials distributed in connection with the presentation. By attending the meeting at which the presentation is made, dialling into the
teleconference during which the presentation is made or reading the presentation, you will be deemed to have agreed to all of the restrictions that apply with regard to the presentation and acknowledged that
you understand the legal and regulatory sanctions attached to the misuse, disclosure or improper circulation of the presentation. The Company does not make any representation or warranty or other
assurance, express or implied, that this document or the information contained herein or the assumptions on which they are based are accurate, complete, adequate, fair, reasonable or up to date and they
should not be relied upon as such. The Company does not accept any liability for any direct, indirect or consequential loss or damage suffered by any person as a result of relying on all or any part of this
document and any liability is expressly disclaimed.
The Company has included non-IFRS financial measures in this presentation. These measurements may not be comparable to those of other companies. Reference to these non-IFRS financial measures
should be considered in addition to IFRS financial measures, but should not be considered a substitute for results that are presented in accordance with IFRS.
The information contained in this presentation has not been subject to any independent audit or review. A significant portion of the information contained in this document, including all market data and trend
information, is based on estimates or expectations of the Company, and there can be no assurance that these estimates or expectations are or will prove to be accurate. Our internal estimates have not been
verified by an external expert, and we cannot guarantee that a third party using different methods to assemble, analyse or compute market information and data would obtain or generate the same results. We
have not verified the accuracy of such information, data or predictions contained in this report that were taken or derived from industry publications, public documents of our competitors or other external
sources. Further, our competitors may define our and their markets differently than we do. In addition, past performance of the Company is not indicative of future performance. The future performance of the
Company will depend on numerous factors which are subject to uncertainty.
Certain statements contained in this document that are not statements of historical fact, including, without limitation, any statements preceded by, followed by or including the words “will,” “targets,” “believes,”
“expects,” “aims,” “intends,” “may,” “anticipates,” “would,” “could” or similar expressions or the negative thereof, constitute forward-looking statements, notwithstanding that such statements are not specifically
identified. In addition, certain statements may be contained in press releases, and in oral and written statements made by or with the approval of the Company that are not statements of historical
fact and constitute forward-looking statements. Examples of forward-looking statements include, but are not limited to: (i) statements about future financial and operating results; (ii) statements of strategic
objectives, business prospects, future financial condition, budgets, potential synergies to be derived from acquisitions, projected levels of production, projected costs and projected levels of revenues and
profits of the Company or its management or board of directors; (iii) statements of future economic performance; and (iv) statements of assumptions underlying such statements.
Forward-looking statements are not guarantees of future performance and involve certain risks, uncertainties and assumptions which are difficult to predict and outside of the control of the management of the
Company. Therefore, actual outcomes and results may differ materially from what is expressed or forecasted in such forward-looking statements. We have based these assumptions on information currently
available to us, if any one or more of these assumptions turn out to be incorrect, actual market results may differ from those predicted. While we do not know what impact any such differences may have on our
business, if there are such differences, our future results of operations and financial condition, and the market price of the notes, could be materially adversely affected. You should not place undue reliance on
these forward-looking statements. All subsequent written and oral forward-looking statements attributable to the Company or any person acting on its behalf are expressly qualified in their entirety by the
cautionary statements referenced above. Forward-looking statements speak only as of the date on which such statements are made. The Company expressly disclaims any obligation or undertaking to
disseminate any updates or revisions to any forward-looking statement to reflect events or circumstances after the date on which such statement is made, or to reflect the occurrence of unanticipated events.
We have included other operating information in this presentation, some of which we refer to as “key performance indicators.” We believe that it is useful to include this operating information as we use it for
internal performance analysis, and the presentation by our business divisions of these measures facilitates comparability with other companies in our industry, although our measures may not be comparable
with similar measurements presented by other companies. Such operating information should not be considered in isolation or construed as a substitute for measures prepared in accordance with IFRS.
The presentation does not constitute or form part of, and should not be construed as, an offer to sell or issue, or the solicitation of an offer to purchase, subscribe to or acquire the Company or the Company’s
securities, or an inducement to enter into investment activity in any jurisdiction in which such offer, solicitation, inducement or sale would be unlawful prior to registration, exemption from registration or
qualification under the securities laws of such jurisdiction. No part of this presentation, nor the fact of its distribution, should form the basis of, or be relied on in connection with, any contract or commitment or
investment decision whatsoever. This presentation is not for publication, release or distribution in any jurisdiction where to do so would constitute a violation of the relevant laws of such jurisdiction nor should it
be taken or transmitted into such jurisdiction.

3
Additional
Colours
Chart 7
Chart 8, Map
Chart 9
Chart 10
Colour 11
Colour 12
Colour 13
Colour 14
Colour 15
Colour 16
230-230-230
Body Text in Arial
Background
Headings, Heading Lines, Bullet Points
Table Rows
Text Boxes, Table Rows
Table Highlight
Lines and Axis
Chart 1
Chart 2
Chart 3
Chart 4
Chart 5
Chart 6
149-179-215
127-127-127
30-62-123
255-255-255
0-0-0
107-148-52
209-4-61
128-100-162
204-206-215
30-62-123
79-129-189
234-240-247
230-224-236
95-95-95
179-162-199
22-46-92
50-87-132
226-239-209
254-197-213
195-235-255
Main Colours
198-213-241
149-179-215
3
Today’s Speakers
Peter Gowers
Travelodge - Chief Executive
Joined Travelodge in 2013
Hotel and leisure experience with IHG plc as Chief Executive Asia-Pacific and Group Chief Marketing Officer
Real Estate experience as Chief Executive of Safestore Holdings plc, the UK’s largest self storage operator
Jo Boydell
Travelodge - Chief Financial Officer
Joined Travelodge in 2013
Hotel and leisure experience from senior roles at Hilton Group, EMI Group and Ladbrokes
Retail turnaround experience as Finance Director at JGLCC Camera Company (Jessops)

4
Additional
Colours
Chart 7
Chart 8, Map
Chart 9
Chart 10
Colour 11
Colour 12
Colour 13
Colour 14
Colour 15
Colour 16
230-230-230
Body Text in Arial
Background
Headings, Heading Lines, Bullet Points
Table Rows
Text Boxes, Table Rows
Table Highlight
Lines and Axis
Chart 1
Chart 2
Chart 3
Chart 4
Chart 5
Chart 6
149-179-215
127-127-127
30-62-123
255-255-255
0-0-0
107-148-52
209-4-61
128-100-162
204-206-215
30-62-123
79-129-189
234-240-247
230-224-236
95-95-95
179-162-199
22-46-92
50-87-132
226-239-209
254-197-213
195-235-255
Main Colours
198-213-241
149-179-215
4
Agenda
1 Travelodge at a Glance 5
2 H1 Financial Update 14
3 Summary and Outlook 22
4 Q&A

5
Additional
Colours
Chart 7
Chart 8, Map
Chart 9
Chart 10
Colour 11
Colour 12
Colour 13
Colour 14
Colour 15
Colour 16
230-230-230
Body Text in Arial
Background
Headings, Heading Lines, Bullet Points
Table Rows
Text Boxes, Table Rows
Table Highlight
Lines and Axis
Chart 1
Chart 2
Chart 3
Chart 4
Chart 5
Chart 6
149-179-215
127-127-127
30-62-123
255-255-255
0-0-0
107-148-52
209-4-61
128-100-162
204-206-215
30-62-123
79-129-189
234-240-247
230-224-236
95-95-95
179-162-199
22-46-92
50-87-132
226-239-209
254-197-213
195-235-255
Main Colours
198-213-241
149-179-215
Travelodge at a Glance

6
Additional
Colours
Chart 7
Chart 8, Map
Chart 9
Chart 10
Colour 11
Colour 12
Colour 13
Colour 14
Colour 15
Colour 16
230-230-230
Body Text in Arial
Background
Headings, Heading Lines, Bullet Points
Table Rows
Text Boxes, Table Rows
Table Highlight
Lines and Axis
Chart 1
Chart 2
Chart 3
Chart 4
Chart 5
Chart 6
149-179-215
127-127-127
30-62-123
255-255-255
0-0-0
107-148-52
209-4-61
128-100-162
204-206-215
30-62-123
79-129-189
234-240-247
230-224-236
95-95-95
179-162-199
22-46-92
50-87-132
226-239-209
254-197-213
195-235-255
Main Colours
198-213-241
149-179-215
6
Company Overview
Who We Are
UK’s second largest hotel brand based on number of hotels and rooms
Positioned in the attractive value segment with 534 hotels and serving
18m business and leisure customers
Well invested modernised hotel portfolio
Well balanced approximately even business / leisure customer split
Almost 90% booking direct, with 79% through own websites
Low upfront capex leasehold model
EBITDAR with or
without IFRS rent
charges?
EBITDAR + Rent
Cover + EBITDAR
Margin increase
1. Occupancy, ADR and RevPAR for Travelodge UK leased Hotels only.
2. Represents the ratio of EBITDAR to net external rent payable.
3. Includes 13 hotels (647 rooms) operated under management contracts.
4. Operations in Ireland under a master franchise.
Key Statistics (FY 2015)
Hotels (H1 2016) 534
Rooms (H1 2016) 39,997
Occupancy¹ 76.5%
ADR¹ £50.2
RevPAR¹ £38.4
Revenue £559.6m
EBITDAR £261.6m
EBITDA £105.1m
Rent Cover2 1.7x
Where We Are (H1 2016)
United Kingdom International
London
Regions3
Spain
Ireland4
65 Hotels
8,396 Rooms
21.0% of total
Rooms
452 Hotels
30,081 Rooms
75.2% of total
Rooms
5 Hotels
621 Rooms
1.6% of total
Rooms
12 Hotels
899 Rooms
2.2% of total
Rooms

7
Additional
Colours
Chart 7
Chart 8, Map
Chart 9
Chart 10
Colour 11
Colour 12
Colour 13
Colour 14
Colour 15
Colour 16
230-230-230
Body Text in Arial
Background
Headings, Heading Lines, Bullet Points
Table Rows
Text Boxes, Table Rows
Table Highlight
Lines and Axis
Chart 1
Chart 2
Chart 3
Chart 4
Chart 5
Chart 6
149-179-215
127-127-127
30-62-123
255-255-255
0-0-0
107-148-52
209-4-61
128-100-162
204-206-215
30-62-123
79-129-189
234-240-247
230-224-236
95-95-95
179-162-199
22-46-92
50-87-132
226-239-209
254-197-213
195-235-255
Main Colours
198-213-241
149-179-215
7
Operational Improvements and Powerful Direct Distribution Model Drive Strong
Financial Performance
Key Credit Highlights
1
2
3
4
5
Strong Market Dynamics for Growth in Value Hotel Sector
Strong Market Position with High Brand Recognition, Scale and Extensive, Diversified
Network of Hotels
Well-invested Portfolio with Strong Quality Levels
Growing and High Quality Rooms Pipeline
Tight Cost Control and Low Upfront Capex Leasehold Model Drive Strong Profitability
and Cashflows
7
6
Experienced Management Team with a Track Record of Delivering Operational and
Financial Improvements

8
Additional
Colours
Chart 7
Chart 8, Map
Chart 9
Chart 10
Colour 11
Colour 12
Colour 13
Colour 14
Colour 15
Colour 16
230-230-230
Body Text in Arial
Background
Headings, Heading Lines, Bullet Points
Table Rows
Text Boxes, Table Rows
Table Highlight
Lines and Axis
Chart 1
Chart 2
Chart 3
Chart 4
Chart 5
Chart 6
149-179-215
127-127-127
30-62-123
255-255-255
0-0-0
107-148-52
209-4-61
128-100-162
204-206-215
30-62-123
79-129-189
234-240-247
230-224-236
95-95-95
179-162-199
22-46-92
50-87-132
226-239-209
254-197-213
195-235-255
Main Colours
198-213-241
149-179-215
Strong Market Dynamics for Growth in Value Hotel Sector
The Value Segment Shows Resilience Through the Cycle1… …and Still has Room to Grow2
Source: STR, Melvin Gold, Company Information
1. Brokers notes and published Premier Inn Reports - 2002 based on fiscal year ended Feb-2003 etc. Premier Inn 2015 RevPAR estimated based on total RevPAR growth rate of 3.6%
for 50 weeks to 11-Feb-2016 per Whitbread trading update.
2. Based on data from Melvin Gold Consulting as of December 2014.
1
19%
24%
33%
UK France US
% o
f B
ud
ge
t R
oo
ms
+5%
+14%
STR 2015:
US MS&E (june)= 30%
UK MS&E (dec?)= 39%
KPMG Jun-2012:
France MS&E= 28%
90
100
110
120
130
140
150
160
2002 2003 2004 2005 2006 2007 2008 2009 2010 2011 2012 2013 2014 2015
Ind
ex
(2
00
2 R
evP
AR
= 1
00
)
Indexed RevPAR (Indexed on 2002 RevPAR)
Premier Inn Total STR market

9
Additional
Colours
Chart 7
Chart 8, Map
Chart 9
Chart 10
Colour 11
Colour 12
Colour 13
Colour 14
Colour 15
Colour 16
230-230-230
Body Text in Arial
Background
Headings, Heading Lines, Bullet Points
Table Rows
Text Boxes, Table Rows
Table Highlight
Lines and Axis
Chart 1
Chart 2
Chart 3
Chart 4
Chart 5
Chart 6
149-179-215
127-127-127
30-62-123
255-255-255
0-0-0
107-148-52
209-4-61
128-100-162
204-206-215
30-62-123
79-129-189
234-240-247
230-224-236
95-95-95
179-162-199
22-46-92
50-87-132
226-239-209
254-197-213
195-235-255
Main Colours
198-213-241
149-179-215
Strong Market Position with High Brand Recognition, Scale
and Extensive, Diversified Network of Hotels
Source: Company information as at 30-Jun-2016, TripAdvisor
1. As at August 2016, measured by the YouGov brand tracking survey.
…with Rising Customer Satisfaction
2
First value hotel brand to launch in the UK (founded 1985)
Travelodge = quality + locations + value
Great quality product for a great price
Values – Honest, welcoming, reliable, hassle-free, efficient
Personality – Friendly, positive, approachable, capable
A
Strong and Improving Brand…
Clear brand positioning based on unbeatable value B
Over 90% awareness among the UK population¹ C

10
Additional
Colours
Chart 7
Chart 8, Map
Chart 9
Chart 10
Colour 11
Colour 12
Colour 13
Colour 14
Colour 15
Colour 16
230-230-230
Body Text in Arial
Background
Headings, Heading Lines, Bullet Points
Table Rows
Text Boxes, Table Rows
Table Highlight
Lines and Axis
Chart 1
Chart 2
Chart 3
Chart 4
Chart 5
Chart 6
149-179-215
127-127-127
30-62-123
255-255-255
0-0-0
107-148-52
209-4-61
128-100-162
204-206-215
30-62-123
79-129-189
234-240-247
230-224-236
95-95-95
179-162-199
22-46-92
50-87-132
226-239-209
254-197-213
195-235-255
Main Colours
198-213-241
149-179-215
10
Underinvested Estate Transformed With c.£100m Investment in New Look and Feel
Before After
Well-invested Portfolio with Strong Quality Levels 3
TripAdvisor Scores Have Considerably Improved
# Hotels Rated 4* or Greater

11
Additional
Colours
Chart 7
Chart 8, Map
Chart 9
Chart 10
Colour 11
Colour 12
Colour 13
Colour 14
Colour 15
Colour 16
230-230-230
Body Text in Arial
Background
Headings, Heading Lines, Bullet Points
Table Rows
Text Boxes, Table Rows
Table Highlight
Lines and Axis
Chart 1
Chart 2
Chart 3
Chart 4
Chart 5
Chart 6
149-179-215
127-127-127
30-62-123
255-255-255
0-0-0
107-148-52
209-4-61
128-100-162
204-206-215
30-62-123
79-129-189
234-240-247
230-224-236
95-95-95
179-162-199
22-46-92
50-87-132
226-239-209
254-197-213
195-235-255
Main Colours
198-213-241
149-179-215
Direct88%
Indirect12%
Powerful Distribution System… …Drives Almost 90% Bookings Direct
Powerful Direct Distribution Model 4
Large scale brand recognition
Major UK advertising presence
Mobile app launched Apr-2015 has reached over 275k downloads to
date
Approximately 1 million visits per week to travelodge.co.uk sites with on
average, a booking every 3 seconds
Direct salesforce targets corporate key accounts, mid-market
corporates and travel management businesses
Outsourced call centre handles calls for complex bookings and
corporate support for c. 8% of bookings
Nearly 79% of all bookings go via travelodge.co.uk platform (consumer
and corporate versions of the website)
Domestic OTA < 3% LTM June 2016
Direct Includes
Travelodge.co.uk
Corporate Direct
Call Centre
Walk-ins
Groups
Indirect Includes
GDS / Direct Connect
Travel Trade
OTA
LTM June 2016 Accommodation Sales

12
Additional
Colours
Chart 7
Chart 8, Map
Chart 9
Chart 10
Colour 11
Colour 12
Colour 13
Colour 14
Colour 15
Colour 16
230-230-230
Body Text in Arial
Background
Headings, Heading Lines, Bullet Points
Table Rows
Text Boxes, Table Rows
Table Highlight
Lines and Axis
Chart 1
Chart 2
Chart 3
Chart 4
Chart 5
Chart 6
149-179-215
127-127-127
30-62-123
255-255-255
0-0-0
107-148-52
209-4-61
128-100-162
204-206-215
30-62-123
79-129-189
234-240-247
230-224-236
95-95-95
179-162-199
22-46-92
50-87-132
226-239-209
254-197-213
195-235-255
Main Colours
198-213-241
149-179-215
12
Low Upfront Capex Leasehold Model 5
Development Model
Travelodge identifies site
and puts out RFP to
developers
Developer builds to
Travelodge specs
and incurs full cost
of construction
Travelodge
confirms
requirements met
and signs lease
Developer sells to
high quality
institutional or
private buyer
Travelodge begins
operations and
pays ongoing
maintenance capex
Long-term leases, typically 25 years, though can be 35 years or occasionally longer in London and
key city centres
Typically standard 5-yearly, inflation based (UK RPI or CPI), upwards only rent reviews (some with
caps and collars)
Average remaining lease term c. 19 years (excluding renewal rights)
Majority with favourable extension rights
Allows us to expand our portfolio with low upfront capital expenditure, with the vast majority of up
front construction and fit out costs funded by the freehold owner or developer

13
Additional
Colours
Chart 7
Chart 8, Map
Chart 9
Chart 10
Colour 11
Colour 12
Colour 13
Colour 14
Colour 15
Colour 16
230-230-230
Body Text in Arial
Background
Headings, Heading Lines, Bullet Points
Table Rows
Text Boxes, Table Rows
Table Highlight
Lines and Axis
Chart 1
Chart 2
Chart 3
Chart 4
Chart 5
Chart 6
149-179-215
127-127-127
30-62-123
255-255-255
0-0-0
107-148-52
209-4-61
128-100-162
204-206-215
30-62-123
79-129-189
234-240-247
230-224-236
95-95-95
179-162-199
22-46-92
50-87-132
226-239-209
254-197-213
195-235-255
Main Colours
198-213-241
149-179-215
13
New Hotel Openings – Increasing Focus on City Centre Business Market
13 hotels already opened so far this year
On track to open 19 new hotels in 2016
15 hotels currently on-site being constructed
London
Wembley Oxford
Abingdon Road
London
Greenwich Egham
Growing and High Quality Rooms Pipeline 6

14
Additional
Colours
Chart 7
Chart 8, Map
Chart 9
Chart 10
Colour 11
Colour 12
Colour 13
Colour 14
Colour 15
Colour 16
230-230-230
Body Text in Arial
Background
Headings, Heading Lines, Bullet Points
Table Rows
Text Boxes, Table Rows
Table Highlight
Lines and Axis
Chart 1
Chart 2
Chart 3
Chart 4
Chart 5
Chart 6
149-179-215
127-127-127
30-62-123
255-255-255
0-0-0
107-148-52
209-4-61
128-100-162
204-206-215
30-62-123
79-129-189
234-240-247
230-224-236
95-95-95
179-162-199
22-46-92
50-87-132
226-239-209
254-197-213
195-235-255
Main Colours
198-213-241
149-179-215
H1 Financial Update
15
Additional
Colours
Chart 7
Chart 8, Map
Chart 9
Chart 10
Colour 11
Colour 12
Colour 13
Colour 14
Colour 15
Colour 16
230-230-230
Body Text in Arial
Background
Headings, Heading Lines, Bullet Points
Table Rows
Text Boxes, Table Rows
Table Highlight
Lines and Axis
Chart 1
Chart 2
Chart 3
Chart 4
Chart 5
Chart 6
149-179-215
127-127-127
30-62-123
255-255-255
0-0-0
107-148-52
209-4-61
128-100-162
204-206-215
30-62-123
79-129-189
234-240-247
230-224-236
95-95-95
179-162-199
22-46-92
50-87-132
226-239-209
254-197-213
195-235-255
Main Colours
198-213-241
149-179-215
15
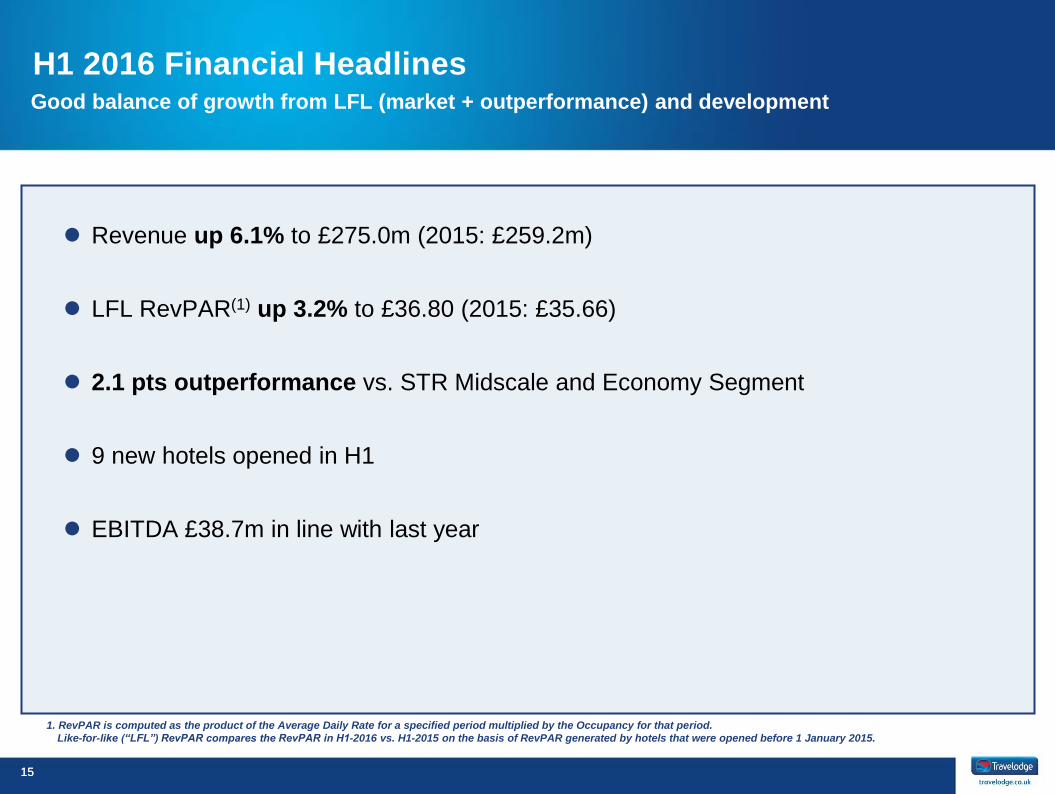
H1 2016 Financial Headlines Good balance of growth from LFL (market + outperformance) and development
Revenue up 6.1% to £275.0m (2015: £259.2m)
LFL RevPAR(1) up 3.2% to £36.80 (2015: £35.66)
2.1 pts outperformance vs. STR Midscale and Economy Segment
9 new hotels opened in H1
EBITDA £38.7m in line with last year
1. RevPAR is computed as the product of the Average Daily Rate for a specified period multiplied by the Occupancy for that period.
Like-for-like (“LFL”) RevPAR compares the RevPAR in H1-2016 vs. H1-2015 on the basis of RevPAR generated by hotels that were opened before 1 January 2015.

16
Additional
Colours
Chart 7
Chart 8, Map
Chart 9
Chart 10
Colour 11
Colour 12
Colour 13
Colour 14
Colour 15
Colour 16
230-230-230
Body Text in Arial
Background
Headings, Heading Lines, Bullet Points
Table Rows
Text Boxes, Table Rows
Table Highlight
Lines and Axis
Chart 1
Chart 2
Chart 3
Chart 4
Chart 5
Chart 6
149-179-215
127-127-127
30-62-123
255-255-255
0-0-0
107-148-52
209-4-61
128-100-162
204-206-215
30-62-123
79-129-189
234-240-247
230-224-236
95-95-95
179-162-199
22-46-92
50-87-132
226-239-209
254-197-213
195-235-255
Main Colours
198-213-241
149-179-215
16
Continued Progress on Our Strategic Objectives
Development:
Extend UK Network
250 potential locations identified
Maintain leasehold growth in London and Regions
Principally new-build hotels opened under lease
Distinctive Brand:
Raise Quality
Image
Best for Business:
Win Share in a
Growing Market
Win the Web: Grow
Direct Digital Sales
Price is Right:
Optimise Rate and
Occupancy
Moments of Truth:
Drive Consistency
Detailed customer feedback drives action
Standardised work processes
Targeted training
National advertising presence
Quality brand partners e.g. Sleepezee Royal Warrant Beds
Focus on ‘businesses on a budget’
Direct national accounts team
Business account card
New website from April 2016
Continue to drive app downloads
Strong paid and unpaid search presence
Airline style yield management system (IDeaS)
Central pricing team
Analytics-driven pricing strategy
H1 Progress
New advertising campaign
driving business customer
growth
Upgraded desktop and
mobile websites
New breakfast offer with
record levels of F&B sales
Enhanced revenue
management
New hotel manager
training launched
Continued growth in
development pipeline
Further business customer growth fuelled by quality and yield initiatives

17
Additional
Colours
Chart 7
Chart 8, Map
Chart 9
Chart 10
Colour 11
Colour 12
Colour 13
Colour 14
Colour 15
Colour 16
230-230-230
Body Text in Arial
Background
Headings, Heading Lines, Bullet Points
Table Rows
Text Boxes, Table Rows
Table Highlight
Lines and Axis
Chart 1
Chart 2
Chart 3
Chart 4
Chart 5
Chart 6
149-179-215
127-127-127
30-62-123
255-255-255
0-0-0
107-148-52
209-4-61
128-100-162
204-206-215
30-62-123
79-129-189
234-240-247
230-224-236
95-95-95
179-162-199
22-46-92
50-87-132
226-239-209
254-197-213
195-235-255
Main Colours
198-213-241
149-179-215
17
New hotels Increasing focus on city centre and business locations
London Raynes Park South West London, 86 rooms, bar café
Glasgow Queen Street City centre, 171 rooms, bar café
London Finsbury Park North Central London, 104 rooms, bar café
London Belvedere South East London, 52 rooms, vending
Milton Keynes The Hub Business district, 159 rooms, bar café
Bicester Retail outlet mall, 53 rooms, vending

18
Additional
Colours
Chart 7
Chart 8, Map
Chart 9
Chart 10
Colour 11
Colour 12
Colour 13
Colour 14
Colour 15
Colour 16
230-230-230
Body Text in Arial
Background
Headings, Heading Lines, Bullet Points
Table Rows
Text Boxes, Table Rows
Table Highlight
Lines and Axis
Chart 1
Chart 2
Chart 3
Chart 4
Chart 5
Chart 6
149-179-215
127-127-127
30-62-123
255-255-255
0-0-0
107-148-52
209-4-61
128-100-162
204-206-215
30-62-123
79-129-189
234-240-247
230-224-236
95-95-95
179-162-199
22-46-92
50-87-132
226-239-209
254-197-213
195-235-255
Main Colours
198-213-241
149-179-215
18
Strong H1 2016 Operating Metrics Continued RevPAR growth and market outperformance
LFL1 RevPAR (£)2
LFL1 Occupancy (%)2 LFL1 ADR (£)2
Strong RevPAR Growth Driven by ADR Increase and Steady Occupancy
1. RevPAR is computed as the product of the Average Daily Rate for a specified period multiplied by the Occupancy for that period. Like-for-like (LFL) RevPAR compares the RevPAR in
H1-2016 vs. H1-2015 on the basis of RevPAR generated by hotels that were opened before 1 January 2015.
2. Occupancy, ADR and RevPAR for UK leased estate only.
H1-2016 vs. H1-2015
RevPAR vs. Market:
outperformance vs. the MS&E
segment growth rate in H1-2016 by
approximately 2.1% points
RevPAR: like-for-like UK RevPAR
growth of 3.2%
Occupancy: occupancy remained
stable at c.74%
ADR: continued improvement
increasing by 4.0% vs. H1-2015
H1-16 RevPAR Growth Outperformance

19
Additional
Colours
Chart 7
Chart 8, Map
Chart 9
Chart 10
Colour 11
Colour 12
Colour 13
Colour 14
Colour 15
Colour 16
230-230-230
Body Text in Arial
Background
Headings, Heading Lines, Bullet Points
Table Rows
Text Boxes, Table Rows
Table Highlight
Lines and Axis
Chart 1
Chart 2
Chart 3
Chart 4
Chart 5
Chart 6
149-179-215
127-127-127
30-62-123
255-255-255
0-0-0
107-148-52
209-4-61
128-100-162
204-206-215
30-62-123
79-129-189
234-240-247
230-224-236
95-95-95
179-162-199
22-46-92
50-87-132
226-239-209
254-197-213
195-235-255
Main Colours
198-213-241
149-179-215
19
Strong H1 2016 Underlying Financial Performance Good sales growth with EBITDA impacted by one-off rent review and NLW
Revenue (£m) EBITDA (£m)
Financial Performance Has Remained Strong
H1-2016 vs. H1-2015
Revenue increase of 6.1%/£15.8m was primarily due to:
o Like-for-like UK RevPAR growth of 3.2%
o Annualisation and maturity of the 12 new hotels added in the 2015
o Opening of 9 new hotels in the period
o International growth 25.9%/£0.9m
EBITDA was driven by:
o Benefits of higher revenue
o Increased rent expense from the one-off CVA category 2 rent reset of approximately £1.6m
o Impact of national living wage from 1 April 2016

20
Additional
Colours
Chart 7
Chart 8, Map
Chart 9
Chart 10
Colour 11
Colour 12
Colour 13
Colour 14
Colour 15
Colour 16
230-230-230
Body Text in Arial
Background
Headings, Heading Lines, Bullet Points
Table Rows
Text Boxes, Table Rows
Table Highlight
Lines and Axis
Chart 1
Chart 2
Chart 3
Chart 4
Chart 5
Chart 6
149-179-215
127-127-127
30-62-123
255-255-255
0-0-0
107-148-52
209-4-61
128-100-162
204-206-215
30-62-123
79-129-189
234-240-247
230-224-236
95-95-95
179-162-199
22-46-92
50-87-132
226-239-209
254-197-213
195-235-255
Main Colours
198-213-241
149-179-215
20
1. LTM EBITDA is calculated adding the H1-2016 EBITDA (£38.7m) and subtracting the H1-2015 EBITDA (£38.8m) to the 2015 Reported EBITDA of £105.1m. Net debt is net of cash and
cash equivalents.
Net Debt and Leverage H1 2016 Good liquidity and solid financial ratios
Debt (£m) Liquidity
Cash on Balance Sheet: £82m
Revolving Credit Facility: £50m (unutilised)
Letter of Credit Facility: £30m (£17.5m utilised)
Financial Ratios
Net Senior Secured Debt / LTM EBITDA1 = 2.9x
Net Third Party Debt / LTM EBITDA1 = 3.2x
£m H1-2016
Cash and Cash Equivalents 81.9
Senior Secured Notes 390.0
Finance Leases 31.6
Total Third Pary Indebtedness 421.6

21
Additional
Colours
Chart 7
Chart 8, Map
Chart 9
Chart 10
Colour 11
Colour 12
Colour 13
Colour 14
Colour 15
Colour 16
230-230-230
Body Text in Arial
Background
Headings, Heading Lines, Bullet Points
Table Rows
Text Boxes, Table Rows
Table Highlight
Lines and Axis
Chart 1
Chart 2
Chart 3
Chart 4
Chart 5
Chart 6
149-179-215
127-127-127
30-62-123
255-255-255
0-0-0
107-148-52
209-4-61
128-100-162
204-206-215
30-62-123
79-129-189
234-240-247
230-224-236
95-95-95
179-162-199
22-46-92
50-87-132
226-239-209
254-197-213
195-235-255
Main Colours
198-213-241
149-179-215
Summary and Outlook

22
Additional
Colours
Chart 7
Chart 8, Map
Chart 9
Chart 10
Colour 11
Colour 12
Colour 13
Colour 14
Colour 15
Colour 16
230-230-230
Body Text in Arial
Background
Headings, Heading Lines, Bullet Points
Table Rows
Text Boxes, Table Rows
Table Highlight
Lines and Axis
Chart 1
Chart 2
Chart 3
Chart 4
Chart 5
Chart 6
149-179-215
127-127-127
30-62-123
255-255-255
0-0-0
107-148-52
209-4-61
128-100-162
204-206-215
30-62-123
79-129-189
234-240-247
230-224-236
95-95-95
179-162-199
22-46-92
50-87-132
226-239-209
254-197-213
195-235-255
Main Colours
198-213-241
149-179-215
22
Summary and Outlook
Continued RevPAR growth and market outperformance
Good progress on strategic initiatives
On track for 19 new hotel openings in 2016
Second half trading so far is similar to H1
Brexit leads to cautious market outlook – but remain fundamentally well positioned
Continued market outperformance and growth from development

23
Additional
Colours
Chart 7
Chart 8, Map
Chart 9
Chart 10
Colour 11
Colour 12
Colour 13
Colour 14
Colour 15
Colour 16
230-230-230
Body Text in Arial
Background
Headings, Heading Lines, Bullet Points
Table Rows
Text Boxes, Table Rows
Table Highlight
Lines and Axis
Chart 1
Chart 2
Chart 3
Chart 4
Chart 5
Chart 6
149-179-215
127-127-127
30-62-123
255-255-255
0-0-0
107-148-52
209-4-61
128-100-162
204-206-215
30-62-123
79-129-189
234-240-247
230-224-236
95-95-95
179-162-199
22-46-92
50-87-132
226-239-209
254-197-213
195-235-255
Main Colours
198-213-241
149-179-215
23
Q&A