presentation to investors - avivasa pop.: 52m workforce: 25m pension participants ... looking to...
TRANSCRIPT

Presentation to
Investors
November 2014
Strictly Private and Confidential

Transaction Summary
2
● Initial Public Offering (IPO)
● Listing of ordinary shares on Borsa IstanbulOffer Type and Listing
● AvivaSA Emeklilik Ve HayatIssuer
● Secondary proceeds (up to 20% of share capital including greenshoe)
● Greenshoe of up to 15% base offering sizeOffering Size
● No proceeds to the company; all proceeds will be paid to the selling shareholdersUse of Proceeds
● Placement outside the United States and Turkey under Regulation S
● Placement to qualified institutional buyers in the United States under Rule 144A
● Public offering in Turkey
Distribution
● Company and selling Shareholders are not allowed to sell any extra share for 180 days following the offering
● Selling Shareholders are not allowed to sell any share below offering price for 365 days following offeringLock-Up
● Joint Global Coordinators and Bookrunners: Citi, HSBC
● Domestic Coordinator and Co-Bookrunner: AK InvestmentSyndicate
● Aviva Plc
● Sabancı HoldingSelling Shareholders
● 7th November 2014Pricing Date
● TL41-49 per lot of 100 shares
● Implied market capitalisation: TL1,467m-1,753m
● Implied IPO size: TL289m-345m
Price range
Highly-experienced Team at the Forefront of Industry Development with Long Term Commitment to AvivaSA
3
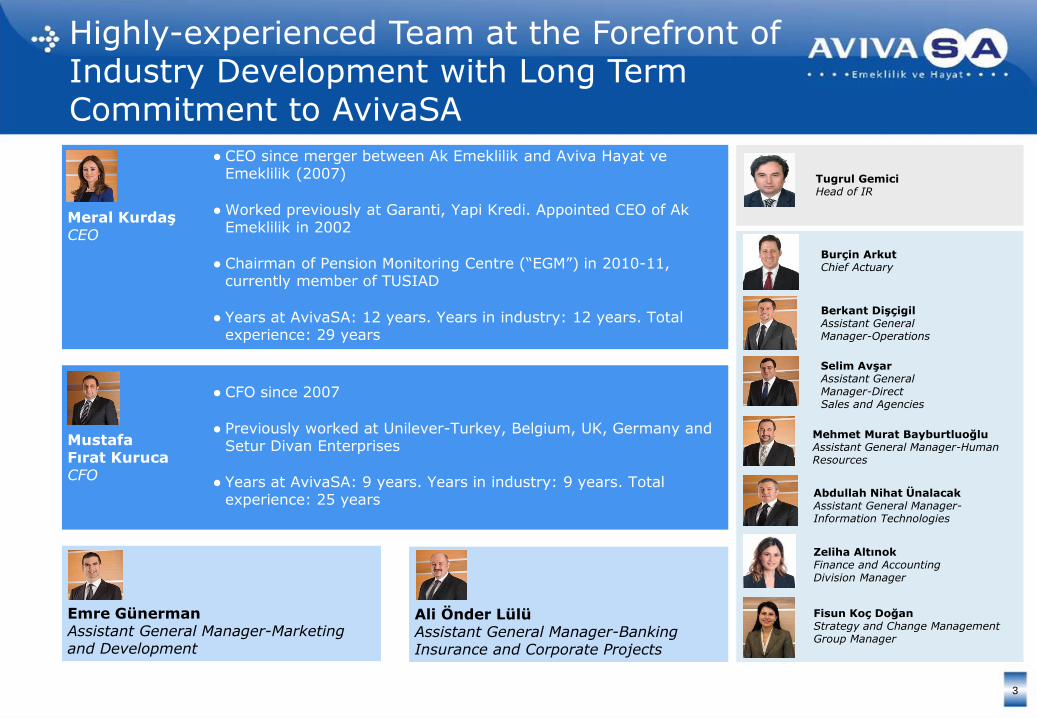
● CFO since 2007
● Previously worked at Unilever-Turkey, Belgium, UK, Germany and Setur Divan Enterprises
● Years at AvivaSA: 9 years. Years in industry: 9 years. Total experience: 25 years
● CEO since merger between Ak Emeklilik and Aviva Hayat ve Emeklilik (2007)
● Worked previously at Garanti, Yapi Kredi. Appointed CEO of Ak Emeklilik in 2002
● Chairman of Pension Monitoring Centre (“EGM”) in 2010-11, currently member of TUSIAD
● Years at AvivaSA: 12 years. Years in industry: 12 years. Total experience: 29 years
Meral KurdaşCEO
Mustafa Fırat KurucaCFO
Tugrul GemiciHead of IR
Selim AvşarAssistant General Manager-Direct Sales and Agencies
Burçin ArkutChief Actuary
Berkant DişçigilAssistant General Manager-Operations
Mehmet Murat BayburtluoğluAssistant General Manager-Human Resources
Abdullah Nihat ÜnalacakAssistant General Manager-Information Technologies
Emre GünermanAssistant General Manager-Marketing and Development
Ali Önder LülüAssistant General Manager-Banking Insurance and Corporate Projects
Zeliha AltınokFinance and Accounting Division Manager
Fisun Koç DoğanStrategy and Change ManagementGroup Manager

4
AvivaSA at a Glance
1.674
1.341
994
992
968
Ziraat
Bankasi
Akbank
Garanti
Yapi Kredi
Unique Positioning and Attractive Business Model
5
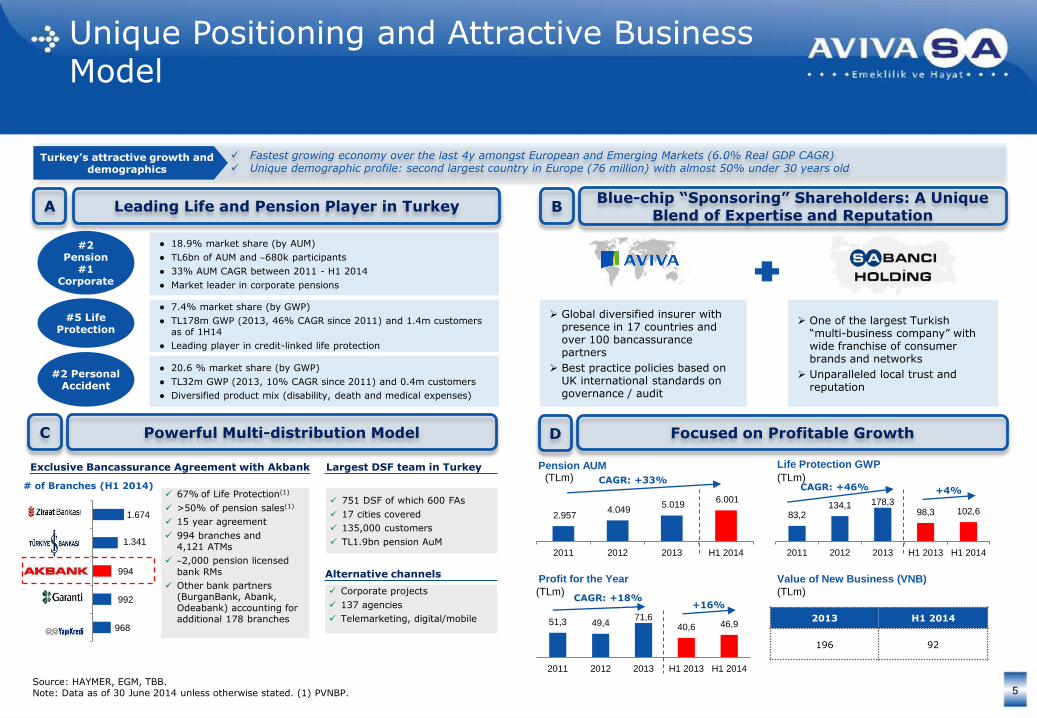
● 18.9% market share (by AUM)
● TL6bn of AUM and 680k participants
● 33% AUM CAGR between 2011 - H1 2014
● Market leader in corporate pensions
#2 Pension
#1 Corporate
● 20.6 % market share (by GWP)
● TL32m GWP (2013, 10% CAGR since 2011) and 0.4m customers
● Diversified product mix (disability, death and medical expenses)
#2 Personal Accident
● 7.4% market share (by GWP)
● TL178m GWP (2013, 46% CAGR since 2011) and 1.4m customers as of 1H14
● Leading player in credit-linked life protection
#5 Life Protection
Exclusive Bancassurance Agreement with Akbank
67% of Life Protection(1)
>50% of pension sales(1)
15 year agreement
994 branches and 4,121 ATMs
2,000 pension licensed
bank RMs
Other bank partners (BurganBank, Abank, Odeabank) accounting for additional 178 branches
Pension AUM
2.957 4.049
5.019 6.001
2011 2012 2013 H1 2014
CAGR: +33%CAGR: +46%
CAGR: +18%
51,3 49,471,6
40,6 46,9
2011 2012 2013 H1 2013 H1 2014
Profit for the Year
Life Protection GWP
83,2134,1 178,3
98,3 102,6
2011 2012 2013 H1 2013 H1 2014
Value of New Business (VNB)
Powerful Multi-distribution Model
(TLm)
Fastest growing economy over the last 4y amongst European and Emerging Markets (6.0% Real GDP CAGR) Unique demographic profile: second largest country in Europe (76 million) with almost 50% under 30 years old
Turkey’s attractive growth and demographics
Largest DSF team in Turkey
Alternative channels
Corporate projects
137 agencies
Telemarketing, digital/mobile
751 DSF of which 600 FAs
17 cities covered
135,000 customers
TL1.9bn pension AuM
Leading Life and Pension Player in TurkeyA
C
(TLm)
(TLm)
(TLm)
# of Branches (H1 2014)
Source: HAYMER, EGM, TBB.Note: Data as of 30 June 2014 unless otherwise stated. (1) PVNBP.
2013 H1 2014
196 92
+4%
+16%
Global diversified insurer with presence in 17 countries and over 100 bancassurance partners
Best practice policies based on UK international standards on governance / audit
One of the largest Turkish “multi-business company” with wide franchise of consumer brands and networks
Unparalleled local trust and reputation
Blue-chip “Sponsoring” Shareholders: A Unique Blend of Expertise and Reputation
Focused on Profitable Growth
B
D
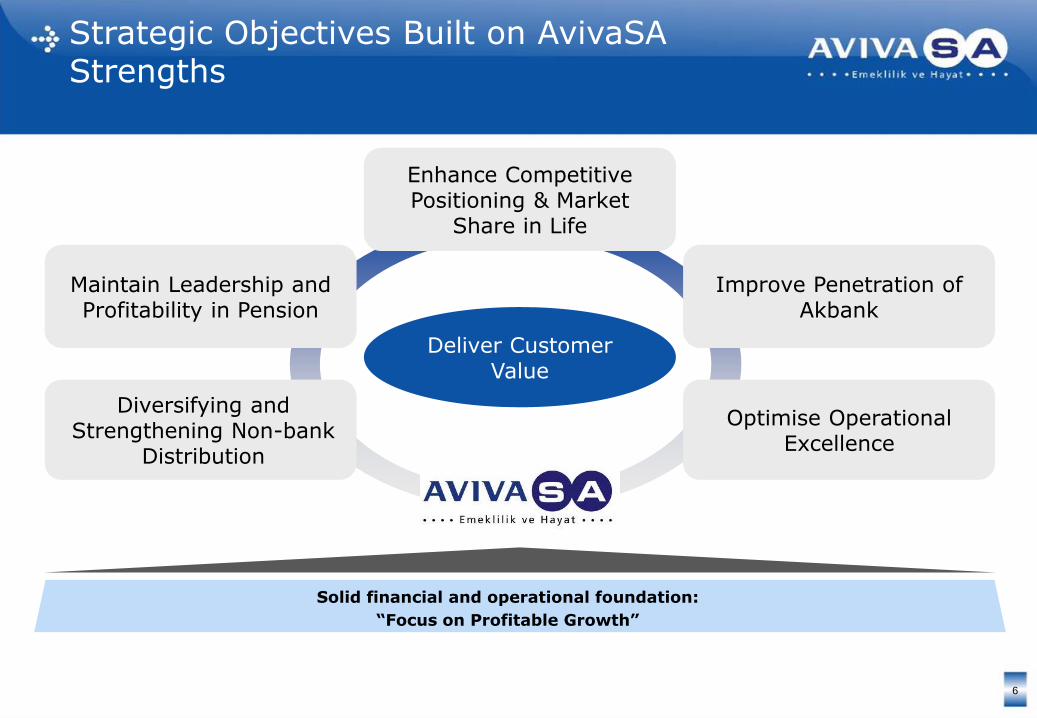
Strategic Objectives Built on AvivaSAStrengths
6
Maintain Leadership and Profitability in Pension
Enhance Competitive Positioning & Market
Share in Life
Improve Penetration of Akbank
Diversifying and Strengthening Non-bank
Distribution
Deliver Customer Value
Optimise Operational Excellence
Solid financial and operational foundation:
“Focus on Profitable Growth”

Solid Sales Culture through a Multidistribution Platform to Expand Scale and Penetration in Pension and Life
7
Distribution Platform At a GlanceA Multichannel Distribution Strategy
Long-term exclusive
partnership with
Akbank
Largest direct sales
force in the sector
#1 in employer-
sponsored group
pension contracts by
market share
Direct sales force (DSF)
# FAs: 600 (covering 17 cities)
# Customers: c.135,000
Total PVNBP: 367m (22%)
Telemarketing
Total PVNBP: 3m (0.2%)
Agencies
# Agencies: 137
Total PVNBP: 217m (13%)
Corporate
# Corporate Sales Team: 26
# Contracts: c.87,000 (>1,000 clients)
Total PVNBP: 103m (6%)
Bancassurance
# Branches (# Akbank): 1,172 (994)
Akbank sales coaches: 360
Total PVNBP: 1,016m (60%)
Key Distribution Channels
Source: Data as of H1 2014.
15 years
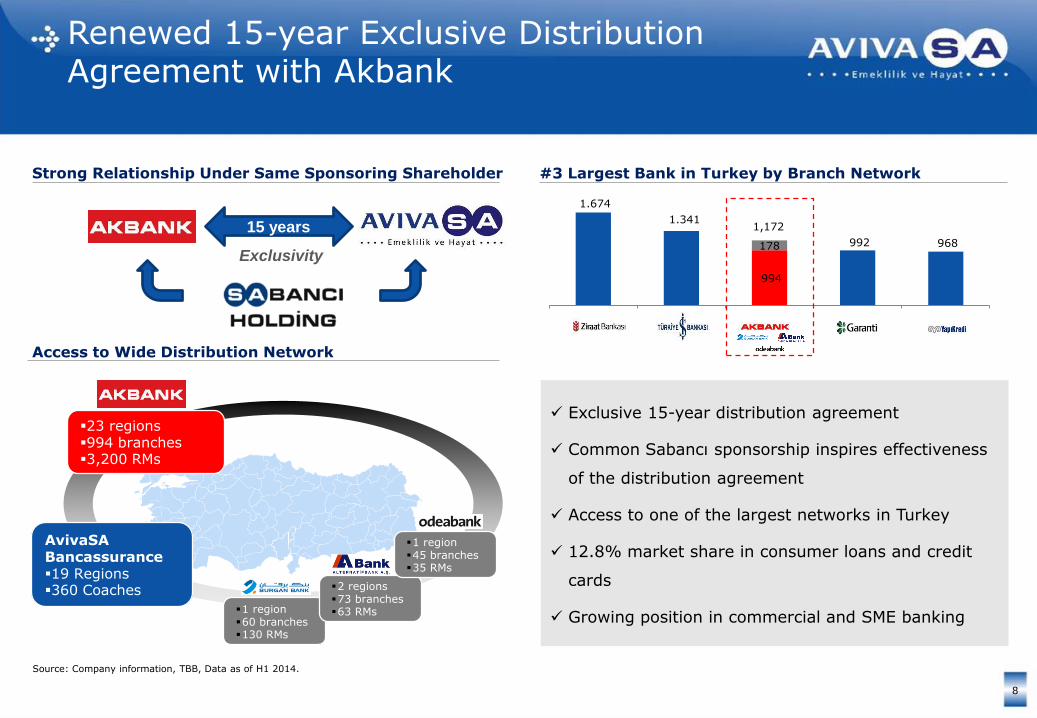
Renewed 15-year Exclusive Distribution Agreement with Akbank
8
Exclusive 15-year distribution agreement
Common Sabancı sponsorship inspires effectiveness
of the distribution agreement
Access to one of the largest networks in Turkey
12.8% market share in consumer loans and credit
cards
Growing position in commercial and SME banking
Kastemonu
Istanbul
Izmir
Aydin
MuglaHakkari
23 regions994 branches3,200 RMs
AvivaSA Bancassurance19 Regions360 Coaches
1 region60 branches130 RMs
2 regions73 branches63 RMs
1 region45 branches35 RMs
Strong Relationship Under Same Sponsoring Shareholder
Access to Wide Distribution Network
#3 Largest Bank in Turkey by Branch Network
968 992
994
1.341
1.674
178
Yapi KrediGarantiAkbankBankasiZiraat
Source: Company information, TBB, Data as of H1 2014.
Exclusivity
1,172

Overview Governance Structure
Top tier governance
principles
Well-balanced and
experienced board with
domestic and international
expertise
2 INEDs to be appointed
post-IPO
Operational
Risk & Reputation
Committee
Executive
CommitteeALCO
Product
Committee
Regulatory
CommitteeDisciplinary
Committee
AvivaSA Board
Board Level
Committees
Management
Committees
Functional
Sub-Committees
David McMillan
(Board Vice-Chairman) Excellent corporate
governance framework
established at the creation
of the JV in 2007Board
Risk
Committee
Audit
Committee
Advisory
Operations
Committee
Remuneration
Committee
Corporate
Governance
Committee
Excellent Corporate Governance Since 2007
9
Haluk Dincer
(Board Chairman)

Solid Financial Foundations and Historical Track Record of Value Creation
10
Pension net Contributions
Total GWP
TL859m
TL233m
36%
25%
Total AUM TL5,019m 30%
2013CAGR/Δ (11-13)
Investment Income & Other
TL32m 12%
Profit for the Year TL72m 18%
Solvency 237% 19%(2)
Growth in volumes and underlying technical profitability driving financial strength and value creation for Shareholders
Expense Ratio(1) 13% (5pp)
ROE 28% 3pp
VNB TL196m n.m.
Total Technical Profit
TL195m 18%
● Top line volumes of both pension and life growing at rapid pace in the past 3 years
● Pension contributions driving business to profitable scale
● Increasing penetration of life driven by Akbank partnership
● Steady increase thanks to pension scalability and life segments
● Steady fall in cost ratio from 18% in 2011 to 13% as efficiency improves
● Healthy growth in investment income with not much volatility
● Track-record of profitable growth
● One of the leaders in sector ROE at 28% with an average of 25.5% over 2011-H1 2014
● Strong capitalisation with capital-light product model
● Consistent dividend paid
● Double digit growth of VNB over the last years
● MCEV of 955 TLm in 2013
Note: Segmental reporting data (1) General expenses, as % of insurance GWP and pension contributions. (2) Growth of AvivaSA absolute value of Required Capital.

A Compelling Investment Case of Value Creation through Profitable Growth
11
Investing in the growth trajectory of the Turkish life & pension sector through one of the leading and highly profitable life & pension players in Turkey
Renewed bancassurance contract and multi-distribution platform
Management team & Governance
5Value creation & profitable growth
7
Growth story in Turkish Life & Pension
1
Brand Power leadership and scale in Life & Pension
3Blue-chip “sponsoring” shareholders
2
Operating flexibility and scalable model
6
4
12
Leading Fast Growing Pension and Life Franchise
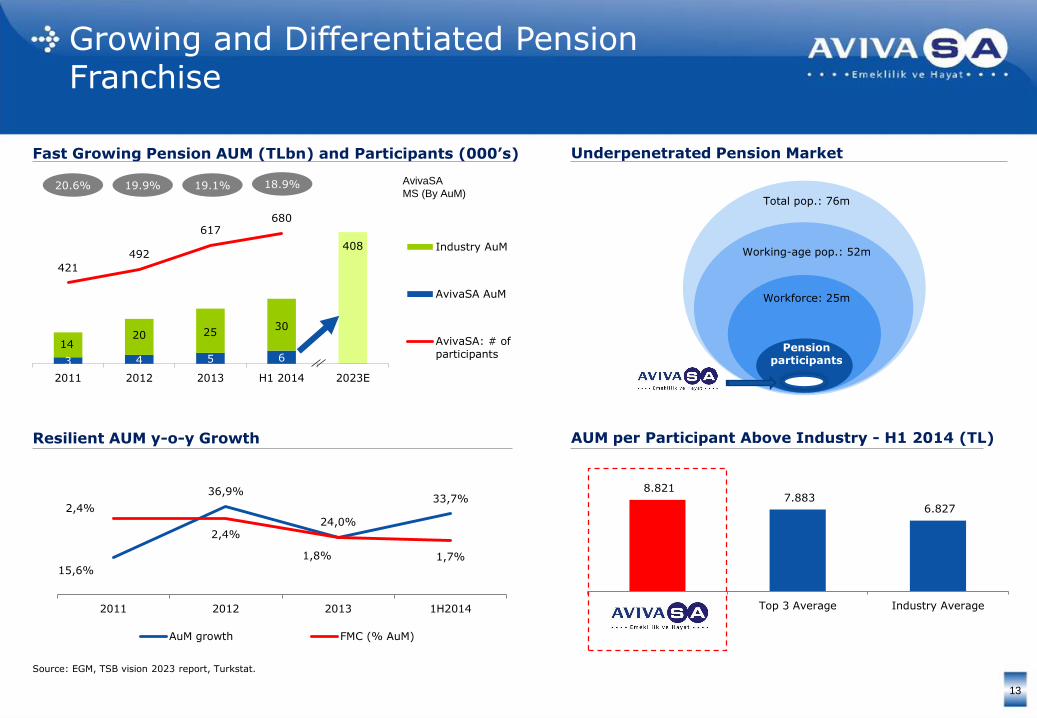
Growing and Differentiated Pension Franchise
13
AvivaSA
MS (By AuM)
3 4 5 6
1420 25
30
408
421
492
617 680
2011 2012 2013 H1 2014 2023E
Industry AuM
AvivaSA AuM
AvivaSA: # ofparticipants
20.6% 19.9% 19.1% 18.9%
Fast Growing Pension AUM (TLbn) and Participants (000’s)
Total pop.: 76m
Working-age pop.: 52m
Workforce: 25m
Pension participants
Underpenetrated Pension Market
Resilient AUM y-o-y Growth
15,6%
36,9%
24,0%
33,7%2,4%
2,4%
1,8% 1,7%
2011 2012 2013 1H2014
AuM growth FMC (% AuM)
AUM per Participant Above Industry - H1 2014 (TL)
Source: EGM, TSB vision 2023 report, Turkstat.
8.821 7.883
6.827
AvivaSA Top 3 Average Industry Average

Robust Strategy to Accelerate Scale Expansion
14
● The proportion of individual pension products is stable at around 80% of the total pension product portfolio sold by AvivaSA
● Lapse and collection rates(2) are significantly improving over last 3 years
Focus on Volumes, Value and Persistency
Strong sale
incentives and
culture
Wide multi-
channel
franchise
Innovative
customer
segmentationSuperior service
and return
Scale 1.9942.354
3.0693.485
138
195
245
265
267
448
539
572
2.399
2.997
3.853
4.322
2011 2012 2013 1H2014
Group (employee contribution) Group (employer contribution) Individual
Pension Invested Amount(1) (TLm)
CAGR: +27%
Delivering AvivaSA Scale Strategy in Pension
Note: (1) Pension Invested amount is calculated as cumulative contributions net of all fees charged on contributions. (2) Based on information sourced from the operating system of the company and presented on an indicative only basis.

Pension Retention and Persistency at the Forefront of our Strategy
15
Collection Rate(1) (%) Total Monthly Exit Rate(1) (Lapse + Maturity) (%)
64,8%
63,6%
68,9% 68,8%
68,1%
2011 2012 2013 H1 2013 H1 2014
1,1%1,2%
0,9%1,0% 1,0%
0,1%
0,1% 0,2%
2011 2012 2013 H1 2013 H1 2014
Source: Company information, IFRS and segmental reporting. Note: (1) Based on information sourced from the operating system of the company and presented on an indicative only basis.
Lapse Rate Maturity Rate
• Successful campaigns and actions to improve collection rates
• Increase persistency through enhancements to customer service offering (e.g. more refined customer segmentation and further
channel integration with CRM infrastructure support)

83,2
134,1
178,3
102,6
2011 2012 2013 1H2014
#5 in Life Protection - GWP (H1 2014)
Top 10 Life Insurance Company in Turkey Looking to Achieve its Natural Market Share
16
Looking to Achieve Natural Market Share, (TLm)
67%
24%
3%5% 1%
Bancassurance
Direct sales
Corporate
Agencies
Telemarketing
Life Mix by Distribution Channels (PVNBP, 1H 2014)
S State owned
4,9%
5,0%
5,3%
6,8%
7,1%
7,4%
8,0%
10,3%
12,1%
21,6%
Vakif
BNP Paribas Emeklilik
Deniz-Metlife
Halk
Finans
AvivaSA
Anadolu
Allianz
Garanti
ZiraatS
S
S
Sources: TBB, HAYMER, TSB, Company information
• In addition to market share upside, AvivaSA will benefit from Life Protection Credit-Linked growth prospects, which are expected to reach TL16bn by 2023E (17% CAGR)
CAGR: +46%
11.4% 13.0% 12.8% n/a
3.5% 5.6% 5.8% n/aCredit linked m.s.
Akbank m.s.
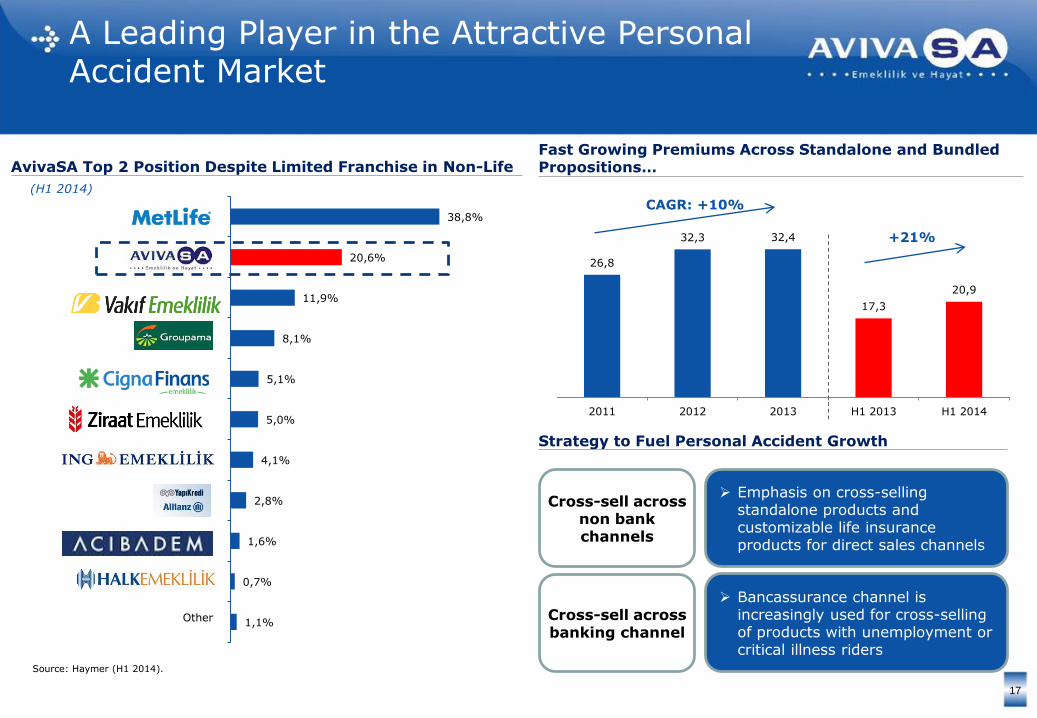
A Leading Player in the Attractive Personal Accident Market
17
Source: Haymer (H1 2014).
AvivaSA Top 2 Position Despite Limited Franchise in Non-Life
1,1%
0,7%
1,6%
2,8%
4,1%
5,0%
5,1%
8,1%
11,9%
20,6%
38,8%
Other
(H1 2014)
Fast Growing Premiums Across Standalone and Bundled Propositions…
26,8
32,3 32,4
17,3
20,9
2011 2012 2013 H1 2013 H1 2014
CAGR: +10%
+21%
Strategy to Fuel Personal Accident Growth
Emphasis on cross-selling standalone products and customizable life insurance products for direct sales channels
Cross-sell across non bank channels
Bancassurance channel is increasingly used for cross-selling of products with unemployment or critical illness riders
Cross-sell across banking channel

Focus on Execution Excellence to Deliver Efficiency
18
New Flexible IT System
Sales Productivity and Cost Efficiency
Process Efficiency
Digital Capabilities
Customer Relationship Management
Employee Engagement
High Level of Compliance
Best-in-class Financial Reporting Framework Focus on
Execution Excellence
Commissioned to improve IT systems’ capacity to adapt to regulatory changesProject
Metamorphosis
Bancassurance transformation program to improve sales performance, technological integration, strategic coordination
Project Next
19
Robust Financial Performance

A Story of Solid Profitable Growth
20
Robust and Growing Profitability y-o-y (TLm, %) Shareholders’ Equity and Solvency Ratio (TLm, %)
214,0
242,1
271,7
244,5
296,1
2011 2012 2013 H1 2013 H1 2014
51,3 49,4
71,6
40,646,9
2011 2012 2013 H1 2013 H1 2014
27% 22% 28%
CAGR: +18%
ROE
CAGR: +13%
+16%
Technical Profit After G&A (TLm, %)
32,3
44,751,3
28,337,7
2011 2012 2013 H1 2013 H1 2014
+33%
CAGR: +26%
+21%
17% 17%
Source: Company information, IFRS and segmental reporting.
314% 291% 237%
Solvency Ratio
226%
Steady increase in shareholders’ equity (+21% YoY) reflects active management of capitalization to fund business growth
Capital-light business, with strong solvency position, which benefits from AvivaSA’s measured approach to risk and new product introduction
AvivaSA’s profitability has been robust and growing YoY. The plateau in 2012 was essentially driven by market conditions leading to reduce investment income; the underlying operating business remained solid in that year
Solid and Resilient Technical Profitability with Operating Leverage Potential
21
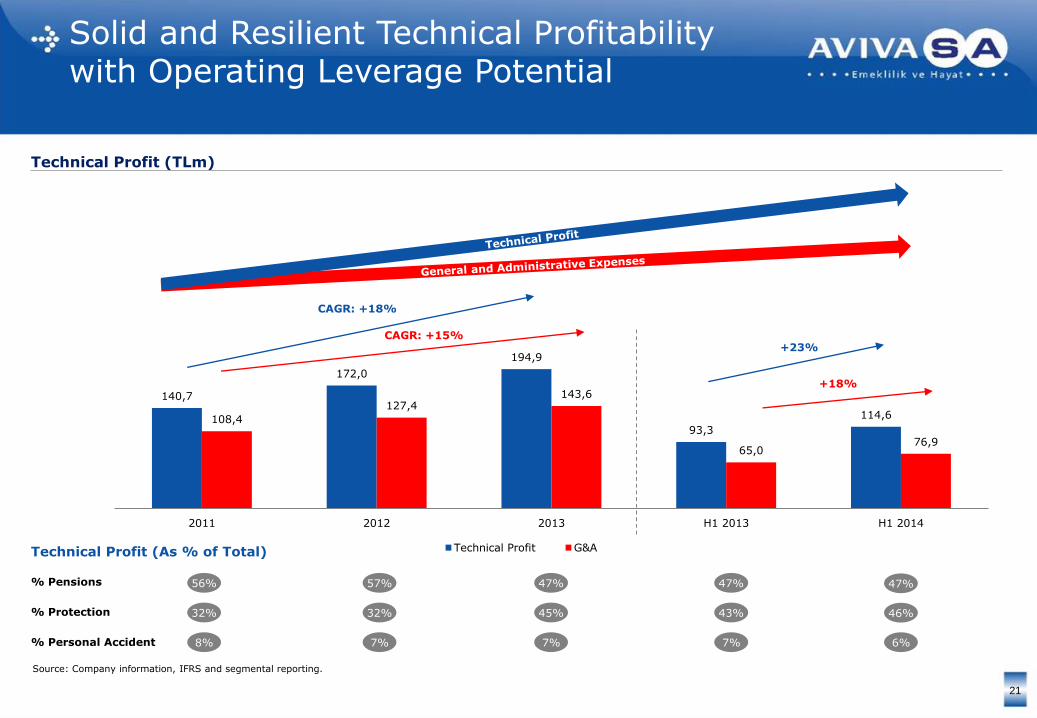
Technical Profit (TLm)
% Pensions
% Protection
% Personal Accident
47%56% 57% 47% 47%
46%32% 32% 45% 43%
6%8% 7% 7% 7%
140,7
172,0
194,9
93,3
114,6108,4
127,4143,6
65,076,9
2011 2012 2013 H1 2013 H1 2014
Technical Profit G&A
CAGR: +18%
+23%
+18%
CAGR: +15%
Technical Profit (As % of Total)
Source: Company information, IFRS and segmental reporting.

Summary of P&L from Segmental Reporting
22
(TLm) 2011 2012 2013 CAGRH1
2013H1
2014YoY
Pension Technical Profit 78.5 98.8 91.8 +8.1% 43.8 54.1 +23.5%
Life Protection Technical Profit 45.3 54.3 86.8 +38.4% 39.9 52.6 +31.8%
Life Savings Technical Profit 5.5 7.5 2.4 (33.9%) 2.9 1.5 (48.3%)
Personal Accident Technical Profit
11.5 11.4 13.9 +9.9% 6.6 6.4 (3.2%)
Total Technical Profit 140.7 172.0 194.9 +17.7% 93.3 114.6 +22.8%
General and Administrative Expenses
(108.4) (127.4) (143.6) +15.1% (65.0) (76.9) +18.3%
Total Technical Profit afterG&A Expenses
32.3 44.7 51.3 +26.0% 28.3 37.7 +33.2%
Total Investment Income & Other
29.8 20.6 39.8 +15.6% 19.3 22.8 +18.1%
Profit Before Taxes 62.1 65.2 91.1 +21.1% 47.6 60.5 +27.1%
Profit for the Period 51.3 49.4 71.6 +18.1% 40.6 46.9 +15.5%
Source: Company information, IFRS and segmental reporting.
73,7 77,692,1
45,1 48,6
11,214,2
22,2
9,212,3
6,57,7
6,8
1,71,7
6,57,5
9,3
4,35,0
12,5
21,8
16,3
6,3
12,4
110,4
128,9
146,6
66,6
80,0
2011 2012 2013 H1 2013 H1 2014
Personnel Expenses Outsourced Expenses & IT
Advertising & Marketing Travelling & Transport
Other
Proactive Management of Expense Base
23
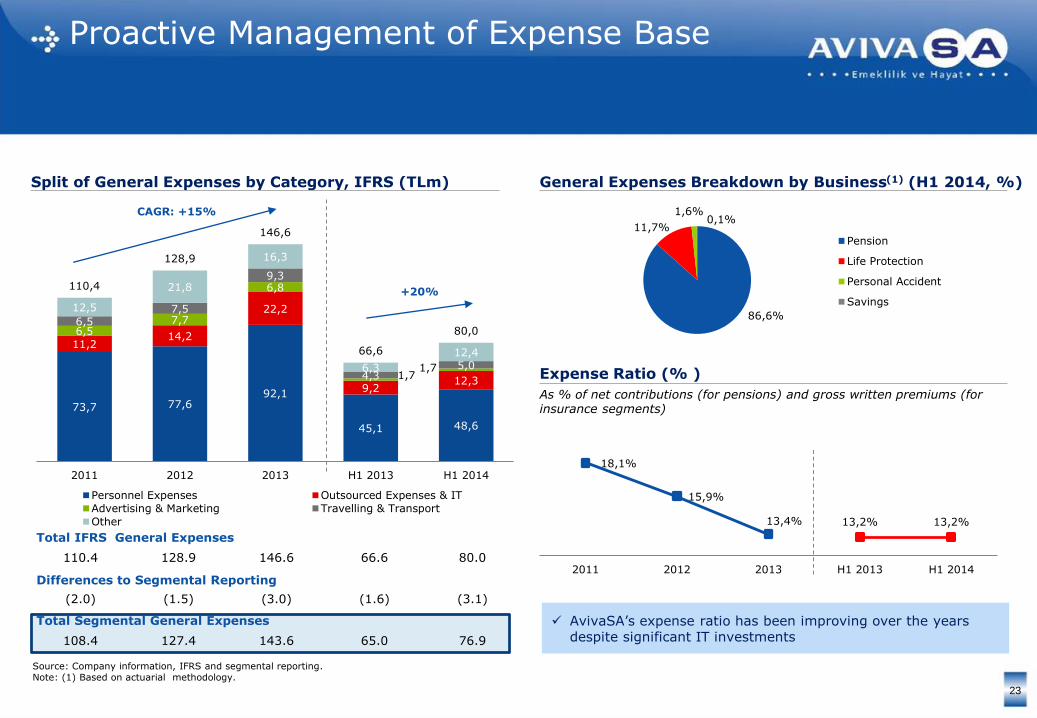
Split of General Expenses by Category, IFRS (TLm) General Expenses Breakdown by Business(1) (H1 2014, %)
CAGR: +15%
+20%
Total IFRS General Expenses
110.4 128.9 146.6 66.6 80.0
Differences to Segmental Reporting
(2.0) (1.5) (3.0) (1.6) (3.1)
Total Segmental General Expenses
108.4 127.4 143.6 65.0 76.9
Source: Company information, IFRS and segmental reporting.Note: (1) Based on actuarial methodology.
Expense Ratio (% )
18,1%
15,9%
13,4% 13,2% 13,2%
2011 2012 2013 H1 2013 H1 2014
As % of net contributions (for pensions) and gross written premiums (for insurance segments)
AvivaSA’s expense ratio has been improving over the years despite significant IT investments
86,6%
11,7%
1,6%0,1%
Pension
Life Protection
Personal Accident
Savings

Pension – Reaching Profitability through Scale
24
Inforce Profit New Business Strain
Cash Profit IFRS Profit
Illustrative IFRS / Cash Profit BreakevenPension Adjusted Technical Profit (IFRS, TLmn)
2013 H1 2014
Pensions
Technical Profit 91.8 54.1
General and Administrative Expenses
(120.2) (66.7)
Adjusted Technical Profit (28.4) (12.6)
● IFRS adjusted technical profit based on management estimates
● Methodology relying upon MCEV, VNB reporting processes
● Given nature of business most G&A allocated to pensions in order to support growth of business
Source: Company information, IFRS and segmental reporting.Note: Methodology consists in (1) Review the nature and usage of each direct expense item and allocate into a specific segment (2) Allocate residual expenses according to management’s best estimate.

45,3
54,3
86,8
39,9
52,6
64,3%
55,0%
58,5%55,4%
63,9%
2011 2012 2013 H1 2013 H1 2014
Technical Profit Margin
Life Protection – Sustainable, Resilient and Profitable Growth Model Fuelled by Bancassurance
25
Technical Profit & Margin(1)(TLm, %)
(Excluding Life Savings)
Claims, Surrender and Commission Ratios (%)
(Excluding Life Savings)
Source: Company information, IFRS and segmental reporting. Note: (1) Technical Margin calculated as Technical Profit over NEP.
CAGR: +38%
+32%19,8%
18,5%14,8%
16,2%
14,5%17,6%
25,0%
20,7%21,8%
19,1%
0,5%
2,2%
7,2% 8,3%
3,6%
2011 2012 2013 H1 2013 H1 2014
Claims Ratio Commission Ratio Surrender Ratio

157,5 161,5
91,5 102,3
590,7
701,6
1,2
1,9
10,3
13,1
103,8
117,0 955.1
1.097,5
2013 H1 2014
Net Worth VIF Group Pension VIF Individual Pension
VIF Life Savings VIF Personal Accident VIF Life Protection
Column1
Market Consistent Embedded Valuea Long-term Valuation Metric
26
MCEV (TLm)
86%Pensions
14%Life
86%Pensions
14%Life
+15%
Key Considerations
Source: Company information.
AvivaSA is pioneering the disclosure of EV in Turkey; nevertheless, it is a widely used valuation basis in Europe and Asia
MCEV is an agreed set of DCF calculations that value both the capital of the firm and the value of the business already written but does not include the value of future New Business
VNB is a measure of the economic value of the profits expected to emerge from new business written in the period where these expected profits are capitalised back to the reporting date
AvivaSA has calculated and used MCEV metrics for years: (i) reported in Aviva accounts since 2008 (including 2007 restatements); (ii) KPI on business by channel and product line; and (iii) integral to business decisions
Towers Watson has been substantially involved in the application of market consistent valuation techniques and the MCEV Principles for insurance companies, and has reviewed the MCEV numbers included in the prospectus

Drivers of Sustainable MCEV Growth – HY14 Analysis of Earnings
27
Source: Company information.
797,6
936,0
105,4
113,1
52,1
+49.5
+2.3 0,0 +24.6
(26.1)
MCEV as at31 December
2013
ExpectedExistingBusiness
Contribution
Value of NewBusiness
OperatingVariances
Op.Assumption
Change
EconomicVariances
CapitalMovements -
Dividend
MCEV as at30 June 2014
Value In-force Required Capital Free Surplus
+92.1
48.4
MCEV Reconciliation (TLm)
955.1
1,097.5
Comments
MCEV growth is mainly driven by VNB, a typical characteristic of an emerging market company
The expected existing business contribution represents the unwinding of the reference rate on the opening MCEV and reflects management’s expectation of the earnings on this business which is contributing about a third of the growth of the MCEV
Positive pensions persistency experience with slight positive expense and mortality variances are offset by negative lapse variances arising from higher than expected lapses of the long-term credit-linked life protection business
AvivaSA’s MCEV is relatively neutral to any change in interest rates due to fee nature of pensions business and underwriting margins released from life protection business
Any capital movements, such as dividends are allowed to get to the closing MCEV balance sheet
40%
50%
10%
2013 H1 2014 2013 H1 2014 2013 H1 2014 2013 H1 2014
90%
8%2%
Active Management of VNB to Steer Profitable Growth
28
Source: Company information and segmental reporting. Note: Percentages represent the proportion as Product Mix.
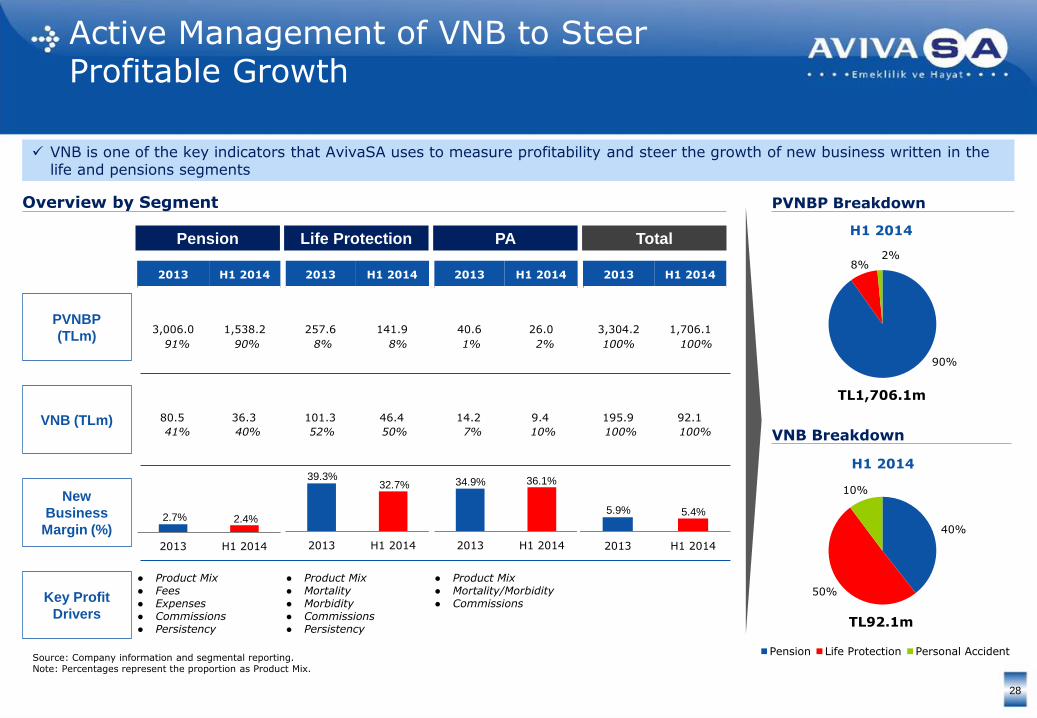
VNB is one of the key indicators that AvivaSA uses to measure profitability and steer the growth of new business written in the life and pensions segments
Overview by Segment
PVNBP
(TLm)
2013 H1 2014
3,006.0 1,538.2
2013 H1 2014
257.6 141.9
2013 H1 2014
40.6 26.0
2013 H1 2014
3,304.2 1,706.1
VNB (TLm)
New
Business
Margin (%)
Key Profit
Drivers
80.5 36.3 101.3 46.4 14.2 9.4 195.9 92.1
41% 52% 7% 100%40% 50% 10% 100%
PVNBP Breakdown
TL1,706.1m
VNB Breakdown
TL92.1m
H1 2014
Pension Life Protection Personal Accident
2.7% 2.4%
39.3%32.7% 34.9% 36.1%
5.9% 5.4%
H1 2014
91% 90% 8% 8% 1% 2% 100% 100%
Pension Life Protection PA Total
● Product Mix● Fees● Expenses● Commissions● Persistency
● Product Mix● Mortality● Morbidity● Commissions● Persistency
● Product Mix● Mortality/Morbidity● Commissions

Embedded Value Sensitivities
29
Source: Company data.(1) Expected to kick-in at 2016
MC
EV
Sensitivities (TLm)
VN
B
(1)
(49)
56
29
2 7
(6)
3
(16)
18
(30)
(56)
64
33
2 7
(7)
3
(21)
21
(35)
Lapse rates +10% Lapse rates -10%
Maintenance
expenses -10%
Assurance
mortality/morbidity
-5%
Premium Collection
+10%
Premium Collection
-10%
Required capital at
the Solvency I level
Market interest
rates +1%
Market interest
rates -1%
Pension fund
management fees -
10bps
Premium Collection
+10%
Premium Collection
-10%
(14)
16
11
2
8
(8)
1
(4)
5
(8)(6)
7 5
1 4
(4)
1
(2)
2
(4)
2013 1H 2014

Key Investment Highlights
30
High growth, profitable company in an underpenetrated market
Competitive advantage as an established market leader
Industry shaper with platform to capture development
Motivated experienced team with a track record of success and innovation
Cutting edge actuarial disclosure, governance and controls in the Turkish market
Blue Chip supportive key shareholders
Leading Turkish Pensions and Life investment
+
+
+
+
+
+
=

31
Appendix – Business Section
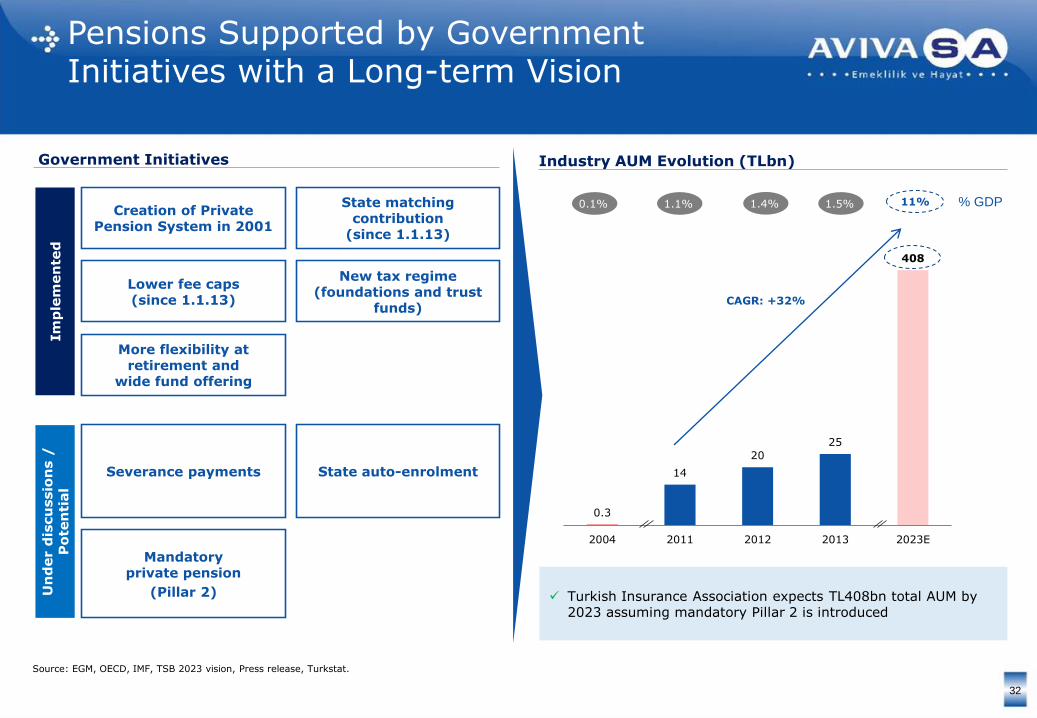
0.3
14
20
25
408
2004 2011 2012 2013 2023E
Pensions Supported by Government Initiatives with a Long-term Vision
32
0.1% 1.1% 1.4% 1.5% 11% % GDP
Turkish Insurance Association expects TL408bn total AUM by 2023 assuming mandatory Pillar 2 is introduced
Industry AUM Evolution (TLbn)
CAGR: +32%
Source: EGM, OECD, IMF, TSB 2023 vision, Press release, Turkstat.
Creation of Private Pension System in 2001
Im
ple
men
ted
State matching contribution
(since 1.1.13)
Lower fee caps (since 1.1.13)
New tax regime(foundations and trust
funds)
More flexibility at retirement and
wide fund offering
Severance payments
Un
der d
iscu
ssio
ns /
P
ote
nti
al
State auto-enrolment
Mandatory private pension
(Pillar 2)
Government Initiatives
A Supportive Pension Legislation in Evolution for the Benefit of Long-term Sustainable Growth
33
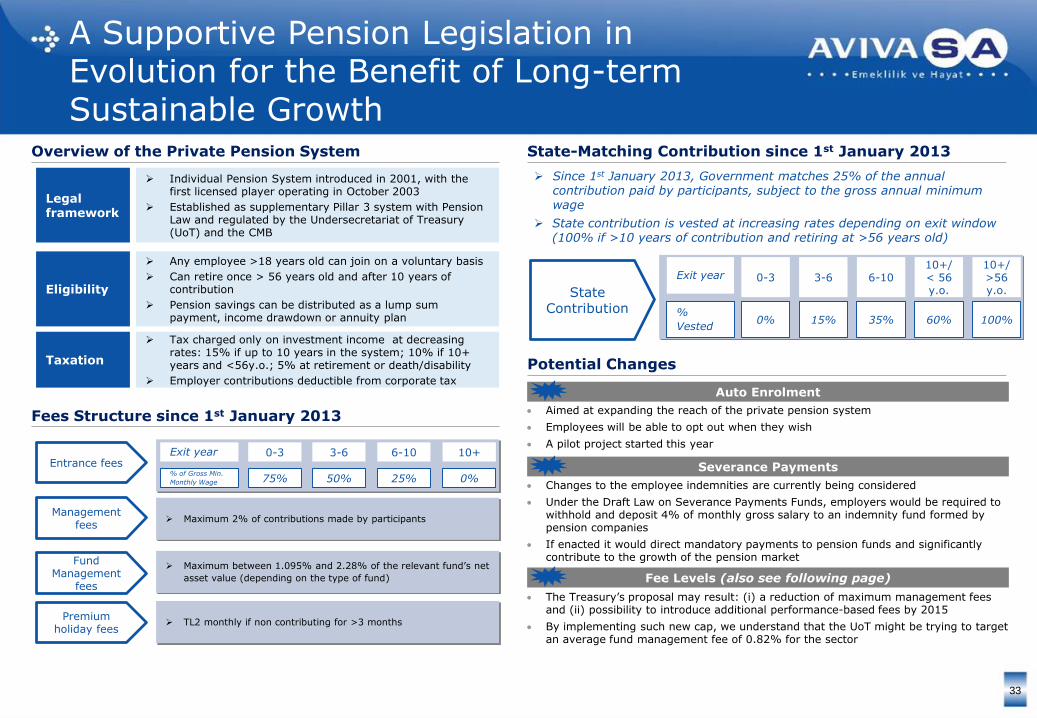
Overview of the Private Pension System State-Matching Contribution since 1st January 2013
Since 1st January 2013, Government matches 25% of the annual contribution paid by participants, subject to the gross annual minimum wage
State contribution is vested at increasing rates depending on exit window (100% if >10 years of contribution and retiring at >56 years old)
Aimed at expanding the reach of the private pension system
Employees will be able to opt out when they wish
A pilot project started this year
Potential Changes
Fees Structure since 1st January 2013
Auto Enrolment
Severance Payments
Changes to the employee indemnities are currently being considered
Under the Draft Law on Severance Payments Funds, employers would be required to withhold and deposit 4% of monthly gross salary to an indemnity fund formed by pension companies
If enacted it would direct mandatory payments to pension funds and significantly contribute to the growth of the pension market
The Treasury’s proposal may result: (i) a reduction of maximum management fees and (ii) possibility to introduce additional performance-based fees by 2015
By implementing such new cap, we understand that the UoT might be trying to target an average fund management fee of 0.82% for the sector
Fee Levels (also see following page)
Legal framework
Individual Pension System introduced in 2001, with the first licensed player operating in October 2003
Established as supplementary Pillar 3 system with Pension Law and regulated by the Undersecretariat of Treasury (UoT) and the CMB
Eligibility
Any employee >18 years old can join on a voluntary basis
Can retire once > 56 years old and after 10 years of contribution
Pension savings can be distributed as a lump sum payment, income drawdown or annuity plan
Entrance fees
Management fees
Fund Management
fees
Premium holiday fees
Taxation
Tax charged only on investment income at decreasing rates: 15% if up to 10 years in the system; 10% if 10+ years and <56y.o.; 5% at retirement or death/disability
Employer contributions deductible from corporate tax
75% 50% 25% 0%
0-3 3-6 6-10 10+
% of Gross Min.
Monthly Wage
Exit year
Maximum 2% of contributions made by participants
Maximum between 1.095% and 2.28% of the relevant fund’s net
asset value (depending on the type of fund)
TL2 monthly if non contributing for >3 months
State Contribution
0% 15% 35% 60%
0-3 3-6 6-1010+/ < 56 y.o.
%
Vested
Exit year10+/ >56 y.o.
100%

State contribution confirmed to continue
Regulatory Environment Evolves, Supporting Growth and Persistency
34
Up to 2012 From January 2013 From 2015 onwards
Potential implementation of new proposal
New fees on fund performance
New cap reduction on fund management fees
Not able to quantify nor measure likelihood of implementation
Note: For more information see Appendix.
Private pension system launched as voluntary, fully funded and defined-contribution plans
Retirement age at 56
Funds are managed by separate asset management companies
Main
Fees
Entry
Mgmt
Fund Mgmt
Framework
Incentives
Max limit is ½ gross monthly min. wage
Max 8% contributions
Max: 3.65% annual NAV
Tax incentives
New draft regulation currently discussed with the industry could introduce performance-based fees and new reduction of fund management fee caps
New regulations to spur participation and persistency: State contribution and lower fee caps
New draft regulations proposed in April ‘14 and has been under industry consultation since
25% matching contribution from the Government (subject to vesting period)
Tax charged based on vesting period
Max limit is 0% to 75% of gross monthly min. wage depending on exit years
Max 2%
Max: 1.09% annual for money market / 1.91% for fixed income / 2.28% for equity

35
Fast Growing Underpenetrated and Protection Driven Life Insurance Market Distributed via Bancassurance…
Life Insurance Sector is Significantly Less Developed vs. Other Countries
3,4%
1,7%
1,6%
1,4%
0,3%
0,2%
0,1%
EU27average
CzechRepublic
Poland
Hungary
Romania
Turkey
Russia
Life Insurance Penetration Ratios (GWP as % of GDP, 2013) Market Life and Personal Accident Insurance GWP (TLbn)
79%
8%
8%
4%
Bancassurance
Agents/brokers
Direct sales
Other channels
Market Distribution Channels Life Insurance GWP (2013)
Large Majority of Life Insurance in Turkey Driven by Credit-linked Life, Mainly Sold Via Bancassurance
Under-penetrated life insurance sector poised to benefit from expected growth in credit markets and GDP: Turkish Insurance Association expects higher penetration by 2023, with life GWP growth at a CAGR of 17% to reach an estimated TL16bn by 2023
Most life insurance production is related to term protection through bancassurance channel
Term life policies are distributed mainly through bank channel, while personal accident offering is mainly cross-sold at branches
Endowment and other life saving products have become less popular in past few years due to the growing popularity of pensions
Underpenetrated banking market supports the long term cycle of loan growth resulting in continued expansion of credit life protection and bancassurance dominance
Vs. Turkey
17.0x
8.5x
8.0x
7.0x
1.5x
0.5x
1,82 1,84
2,48
0,42 0,49
0,55
0,40 0,34
0,32
0,11 0,14
0,18
2,75 2,80
3,53
2011 2012 2013
Personal accident
Life savings
Life protection - NonCredit linked
Life protection - Creditlinked
66% 65%
70%
Total CAGR: +13%
Highlights
Source: HAYMER, Swiss Re, TSB 2023 vision.
2023E Life
Protection GWP:
TL16bnCL CAGR: +17%
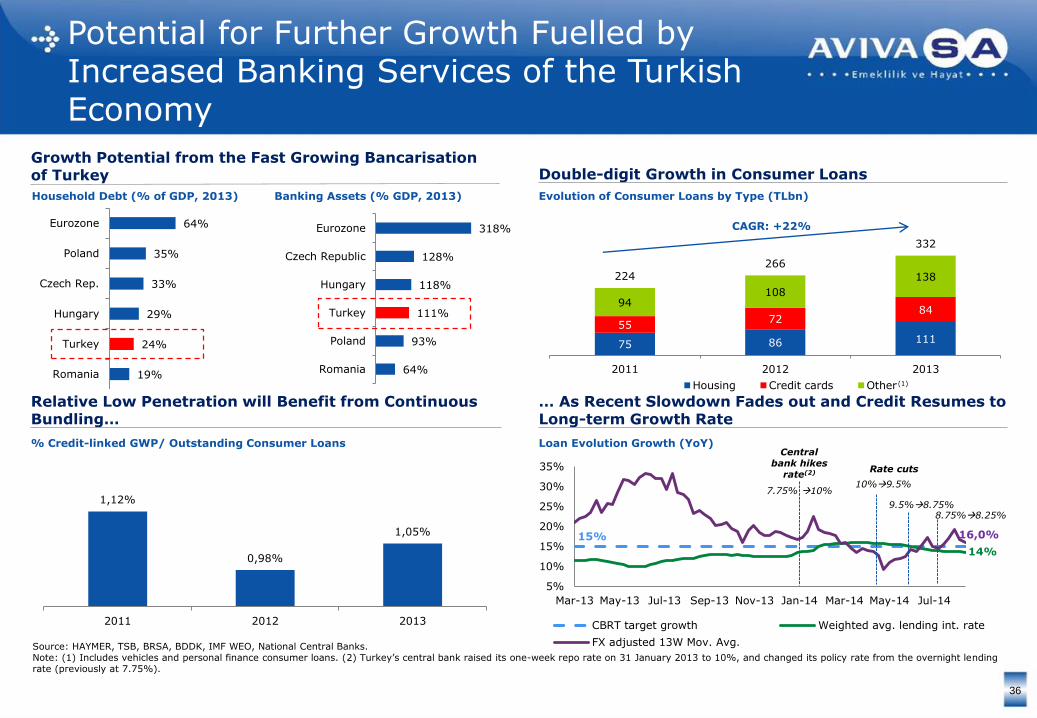
15%
14%
16,0%
5%
10%
15%
20%
25%
30%
35%
Mar-13 May-13 Jul-13 Sep-13 Nov-13 Jan-14 Mar-14 May-14 Jul-14
CBRT target growth Weighted avg. lending int. rate
FX adjusted 13W Mov. Avg.
Potential for Further Growth Fuelled by Increased Banking Services of the Turkish Economy
36
Growth Potential from the Fast Growing Bancarisation of Turkey Double-digit Growth in Consumer Loans
Evolution of Consumer Loans by Type (TLbn)
1,12%
0,98%
1,05%
2011 2012 2013
Central bank hikes
rate(2) Rate cuts
7.75% 10%10%9.5%
9.5%8.75%8.75%8.25%
75 86 111
5572
8494
108
138224266
332
2011 2012 2013
Housing Credit cards Other
CAGR: +22%
Relative Low Penetration will Benefit from Continuous Bundling…
% Credit-linked GWP/ Outstanding Consumer Loans Loan Evolution Growth (YoY)
… As Recent Slowdown Fades out and Credit Resumes to Long-term Growth Rate
Household Debt (% of GDP, 2013) Banking Assets (% GDP, 2013)
19%
24%
29%
33%
35%
64%
Romania
Turkey
Hungary
Czech Rep.
Poland
Eurozone
64%
93%
111%
118%
128%
318%
Romania
Poland
Turkey
Hungary
Czech Republic
Eurozone
Source: HAYMER, TSB, BRSA, BDDK, IMF WEO, National Central Banks.Note: (1) Includes vehicles and personal finance consumer loans. (2) Turkey’s central bank raised its one-week repo rate on 31 January 2013 to 10%, and changed its policy rate from the overnight lending rate (previously at 7.75%).
(1)

17%
83%
Life Non Life
Products Products
Development of a Growing PA Market Offering Attractive Product Alternative to Customers
37
Life Insurers
111 138 181
552 531
707
663 670
887
2011 2012 2013
Life Non-life
CAGR: +16%
20%
80%
Life Non Life
20%
15%
64%
1%
Alternative dist. AgenciesBank Broker
2%
49%43%
6%
Alternative dist. AgenciesBank Broker
… But Where Life Underwriters are Playing a Growing Role…
GWP Distribution by Life and Non-Life Insurers
… And Where Future Success Will Depend on Brand, Product Innovation and Cross-selling Distribution Capabilities
Distribution Mix by GWP (1H2014)
Non Life Insurers
2011 2013
Growing PA Market Dominated by Non-life Players…
GWP (TLm)
Distribution Mix by GWP (1H 2014)
• Products with riders:
Accidental death
Disability
Accident medical
reimbursement
Hospital cash
Common carrier
• Products with riders: Accidental death Accident medical
reimbursement Hospital cash
• Bus seats mandatory PA insurance
• Passenger accident insurance
Source: HAYMER, TSB, BRSA, BDDK.

38
Appendix – Financial Section

Pension – Summary P&L
39
Pension Technical Profit (TLm)
2011 2012 2013 CAGRH1
2013H1
2014YoY
Fund ManagementIncome(1) 57.5 74.6 69.0 +9.5% 32.6 40.1 +23.0%
Management Fee(2) 28.3 32.0 17.9 (20.5%) 7.8 14.5 +85.9%
Entrance Fee Income(3) 15.8 20.0 30.4 +38.7% 14.3 17.2 +20.3%
Other Income/(Expenses)
(4.4) (5.4) (5.8) +14.8% (3.0) (3.7) +23.3%
Net Commission Expenses (of which)
(18.7) (22.4) (19.6) +2.4% (7.8) (14.1) +80.8%
- Commission Ex. (31.0) (29.1) (56.6) +35.1% (24.3) (33.7) +38.7%
- DAC 12.3 6.7 37.0 +73.4% 16.5 19.7 +19.3%
Technical Profit 78.5 98.8 91.8 +8.1% 43.8 54.1 +23.5%
Key Profit Drivers
● Pension volume (Contribution and AUM)
● Lapses and Retention
● Pension Fee Structure (entry fee, management fee, fund management charge)
● Commission Expenses / DAC
Source: Company information, IFRS and segmental reporting.Note: (1) Net of AK asset charges. (2) Charge including premium holiday. (3) Including deferred entry fee.
Technical profit development reflects the solid potential of the pension market as well as the effect of the new pension regulations effective 1 January 2013

Life Protection – Summary P&L
40
Life Protection Technical Profit (TLm)
2011 2012 2013 CAGRH1
2013H1
2014YoY
Gross Written Premiums
83.2 134.1 178.3 +46.4% 98.3 102.6 +4.4%
Earned Premiums 70.4 98.6 148.3 +45.1% 72.1 82.3 +14.2%
Total Claims (14.4) (20.5) (32.7) +50.9% (17.7) (14.8) (16.0%)
Claims Ratio(excluding Surrender Ratio)
19.8% 18.5% 14.8% n.m. 16.2% 14.5% n.m.
Commission Expenses
(11.2) (22.7) (27.8) +57.7% (14.1) (14.4) +2.3%
Commission Ratio 17.6% 25.0% 20.7% n.m. 21.8% 19.1% n.m.
Other Income/(Expense), Net
0.4 (1.1) (1.0) n.m. (0.4) (0.5) +10.6%
Technical Profit 45.3 54.3 86.8 +38.4% 39.9 52.6 +31.8%
Technical Margin 64.3% 55.0% 58.5% n.m. 55.4% 63.9% n.m.
Key Profit Drivers
● NEP volumes
● Death and Benefits claims
● Surrender levels
● Commission Expenses
(Excluding Life Savings)
Source: Company information, IFRS and segmental reporting.
Overall life protection technical profit is positive due to the high technical profitability of the product coupled with cost efficient operating model, and this is valid throughout all periods under review

2011 2012 2013 CAGR H1 2013 H1 2014 PoP
Gross Written Premiums 38.5 31.1 22.2 (24.0%) 12.0 8.6 (28.1%)
Earned Premiums 109.1 121.1 142.8 +14.4% 79.2 51.0 (35.6%)
Total Claims (103.8) (113.5) (140.4) +16.3% (76.2) (49.4) (35.2%)
Claims Ratio 95.1% 93.7% 98.3% n.m. 96.3% 96.8% n.m.
Commission Expenses 0.2 (0.0) 0.0 n.m. (0.0) (0.0) n.m.
Commission Ratio 0.2% 0.0% 0.0% n.m. 0.0% 0.0% n.m.
Other Income/(Expense), Net
Technical Profit 5.5 7.5 2.4 (33.9%) 2.9 1.5 (47.1%)
Technical Margin 5.0% 6.2% 1.7% n.m. 3.7% 2.9% n.m.
Savings - Summary P&L
41
Life Savings Technical Profit (TLm)
As life savings is a small run-off portfolio limited costs are allocated to this segment leading to small adjusted technical profit / (loss) throughout periods under review
Source: Company information, IFRS and segmental reporting.
2011 2012 2013 CAGRH1
2013H1
2014YoY
Gross Written Premiums
26.8 32.3 32.4 +10.0% 17.3 20.9 +21.0%
Earned Premiums 29.1 29.6 32.1 +5.0% 16.0 16.2 +1.4%
Total Claims (5.0) (4.9) (3.2) (19.8%) (2.0) (2.4) +17.8%
Claims Ratio 17.2% 16.6% 10.0% n.m. 12.6% 14.6% n.m.
Commission Expenses
(12.6) (13.2) (14.8) +8.2% (7.4) (7.4) +0.6%
Commission Ratio 43.5% 44.7% 46.1% n.m. 45.9% 45.7% n.m.
Other Income/(Expense), Net
(0.0) (0.0) (0.2) n.m. 0.0 0.0 n.m.
Technical Profit 11.5 11.4 13.9 +10.3% 6.6 6.4 (3.2%)
Technical Margin 39.4% 38.7% 43.4% n.m. 41.4% 39.6% n.m.
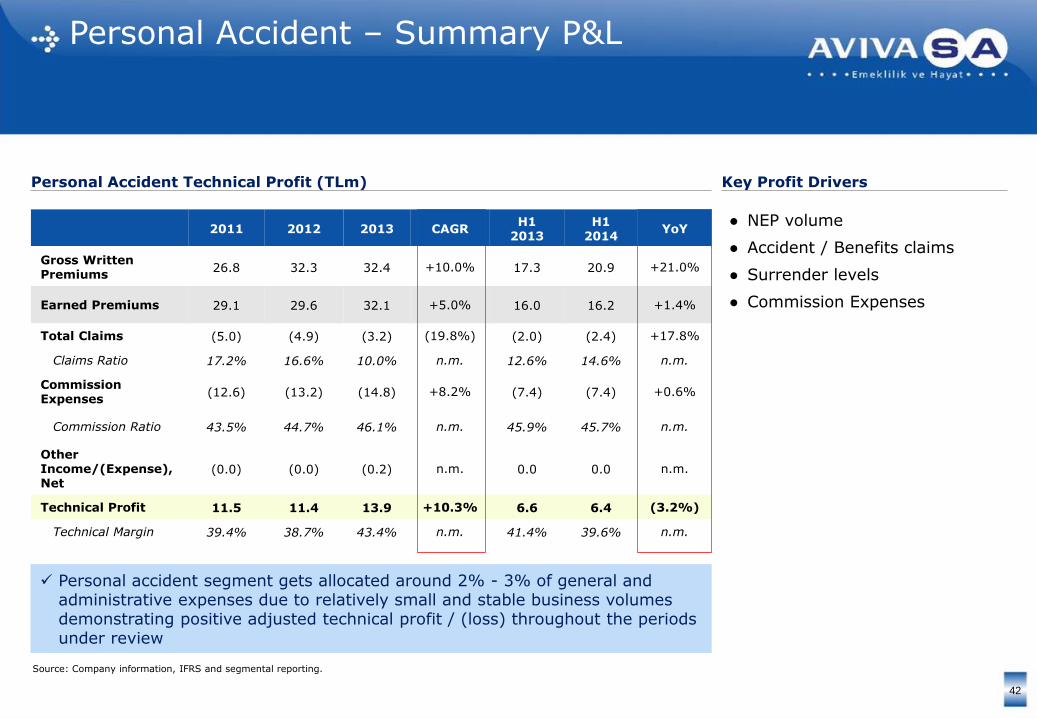
Personal Accident – Summary P&L
42
Personal Accident Technical Profit (TLm) Key Profit Drivers
● NEP volume
● Accident / Benefits claims
● Surrender levels
● Commission Expenses
Personal accident segment gets allocated around 2% - 3% of general and administrative expenses due to relatively small and stable business volumes demonstrating positive adjusted technical profit / (loss) throughout the periods under review
Source: Company information, IFRS and segmental reporting.

Consolidated Income Statement
43
(TLm) 2011 2012 2013 CAGR H1 2013 H1 2014 YoY
Income
Gross Written Premiums 148.4 197.5 232.9 +25.3% 127.5 132.1 +3.6%
Premium Ceded to Reinsurers (7.0) (9.3) (8.9) +13.1% (5.9) (5.4) (8.7%)
Premium Written Net of Reinsurance 141.5 188.3 224.0 +25.8% 121.6 126.8 +4.2%
Net Change in Provision for Unearned Premiums Reserves 0.9 (10.2) (1.8) n.m. (7.3) (9.2) +26.6%
Net Premiums Earned 142.3 178.1 222.2 +25.0% 114.3 117.5 +2.8%
Net Change in Mathematical Reserves 66.3 71.1 101.0 +23.4% 53.0 32.0 (39.6%)
Income Generated from Pension Business 111.0 135.6 127.8 +7.3% 59.9 77.0 +28.5%
Investment and Other Income/(Expense), Net 26.0 24.9 32.4 +11.6% 17.1 23.1 +35.1%
Commission Income 1.3 2.0 2.4 +49.7% 1.8 1.4 (16.3%)
Foreign Exchange Gain, Net 5.0 – 9.2 +35.3% 3.2 0.7 (77.4%)
Other Income, Net 0.3 – – n.m. – – n.m.
Total Income 352.3 411.8 495.5 +18.6% 249.1 251.7 +1.0%
Expenses
Claims Paid and Change in Outstanding Claims Provisions (123.2) (138.9) (176.3) +19.7% (96.0) (66.7) (30.5%)
General and Administrative Expenses (110.4) (128.9) (146.6) +15.2% (66.6) (80.0) +20.1%
Pension Expenses Including Commission (32.1) (37.7) (35.7) +5.5% (15.9) (21.2) +33.0%
Commission Expenses – (2.8) – n.m. (22.6) (22.9) +1.1%
Foreign Exchange Loss, Net (24.5) (37.1) (44.6) +35.0% – – n.m.
Other Income/(Expense), Net – (1.1) (1.1) n.m. (0.4) (0.5) +16.9%
Total Expenses (290.2) (346.5) (404.4) +18.1% (201.5) (191.2) (5.1%)
Profit Before Taxes 62.1 65.2 91.1 +21.1% 47.6 60.5 +27.1%
Income Tax Expense (10.8) (15.9) (19.5) +34.3% (7.0) (13.7) +94.2%
Profit for the Period 51.3 49.4 71.6 +18.2% 40.6 46.9 +15.5%
Source: Company information, IFRS and segmental reporting.

Solid Balance Sheet
44
2011 2012 2013 CAGR H1 2014
Equity 214.0 242.1 271.7 12.7% 296.1
Cash and cash equivalents 268.1 299.2 314.5 8.3% 354.5
Financial assets 423.4 409.5 346.0 (9.6%) 327.2
Other assets 111.2 138.8 202.2 34.9% 252.8
Total assets 802.7 847.5 862.7 3.7% 934.5
Insurance contract liabilities 474.9 472.5 410.4 (7.0%) 419.9
Other liabilities 113.8 133.0 180.5 25.9% 218.5
Balance Sheet (TLm)
● Shareholders’ Equity has continuously increased over time primarily due to higher yearly income and increased retained earnings due to accumulation of profits not subject to distribution
● Other Assets are mostly composed of DAC
● Insurance contract liabilities as of June 30, 2014 were TL 420.0 million, the significant majority of which comprised life mathematical reserves for life savings products. The increase over the years was primarily due to increasing unearned premium reserves
● The increase in cash and cash equivalents over the periods under review was primarily due to attractive deposit rates for TL time deposits
● Financial assets as of June 2014, December 2013, 2012 and 2011 were TL 327m, TL346.0m, TL 409.5m and TL 423.4m respectively
– The decrease over this period was primarily due to policyholders' financial assets decreasing with respect to surrenders and maturities in the run-off life savings business
Source: Company information, IFRS reporting.

4,8 5,8 5,8 6,5
35,4
42,2 50,0
52,1
9,3
12,0
14,4 16,9
2011 2012 2013 1H14
Non-Life Life Pension
Calculation of net assets to cover solvency margin
December 31 June 30
2011 2012 2013 2014
Total regulatory capital(Statutory Reporting)
155.2 174.8 166.3 170.6
Intangible assets - - - -
Deferred tax asset - - - -
AvivaSA net assets 155.2 174.8 166.3 170.6
AvivaSA RequiredCapital
49.5 60.0 70.3 75.4
AvivaSA guarantee fund
16.5 20.0 23.4 25.1
Surplus of net assets in excess of Required Capital
105.8 114.9 96.0 95.2
Surplus of net assets in excess of guarantee fund
138.7 154.8 142.9 145.5
Top tier solvency ratios driven by a measured approach to risk and new product introductions, which affords the business scope and flexibility pursuing growth options and / or returning cash to shareholders
Capital-Light Business Model with Strong Solvency Position
Regulatory Capital Requirement Required Capital (TLm)
237% 226%314% 291%Solvency Ratio
CAGR: +18%
B
A
A/B
49.4
60.0
70.3
75.4
45
Source: Company information.
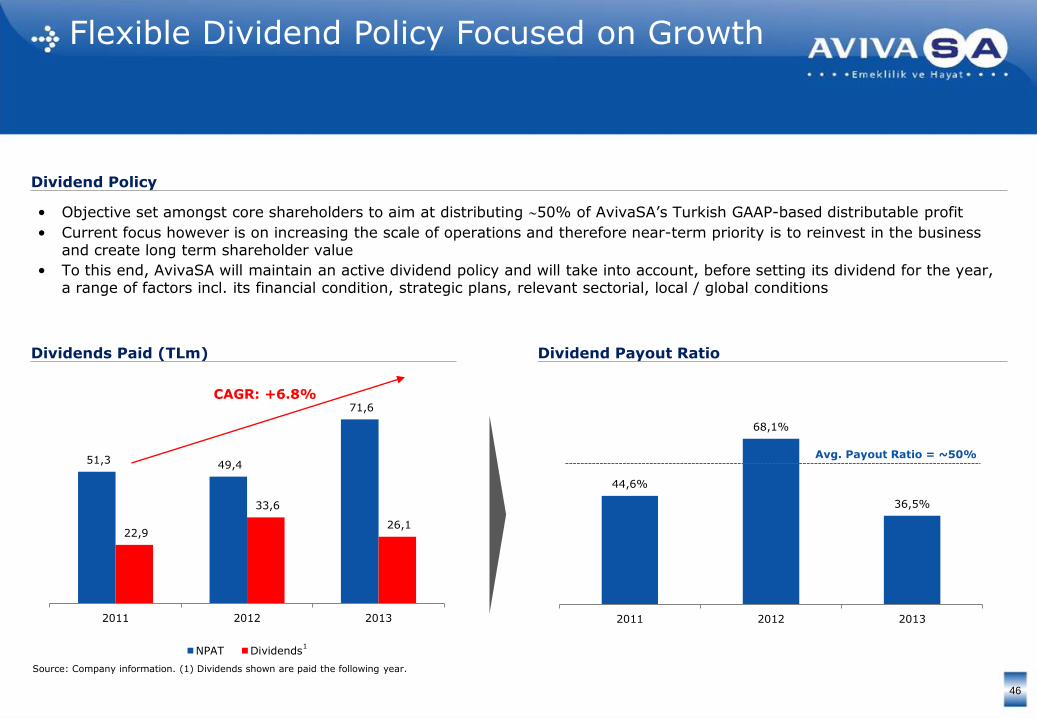
51,3 49,4
71,6
22,9
33,6
26,1
2011 2012 2013
NPAT Dividends
44,6%
68,1%
36,5%
2011 2012 2013
• Objective set amongst core shareholders to aim at distributing 50% of AvivaSA’s Turkish GAAP-based distributable profit
• Current focus however is on increasing the scale of operations and therefore near-term priority is to reinvest in the business and create long term shareholder value
• To this end, AvivaSA will maintain an active dividend policy and will take into account, before setting its dividend for the year, a range of factors incl. its financial condition, strategic plans, relevant sectorial, local / global conditions
CAGR: +6.8%
Avg. Payout Ratio = ~50%
Flexible Dividend Policy Focused on Growth
Dividend Policy
Dividends Paid (TLm) Dividend Payout Ratio
46
Source: Company information. (1) Dividends shown are paid the following year.
1
Summary KPIs
47
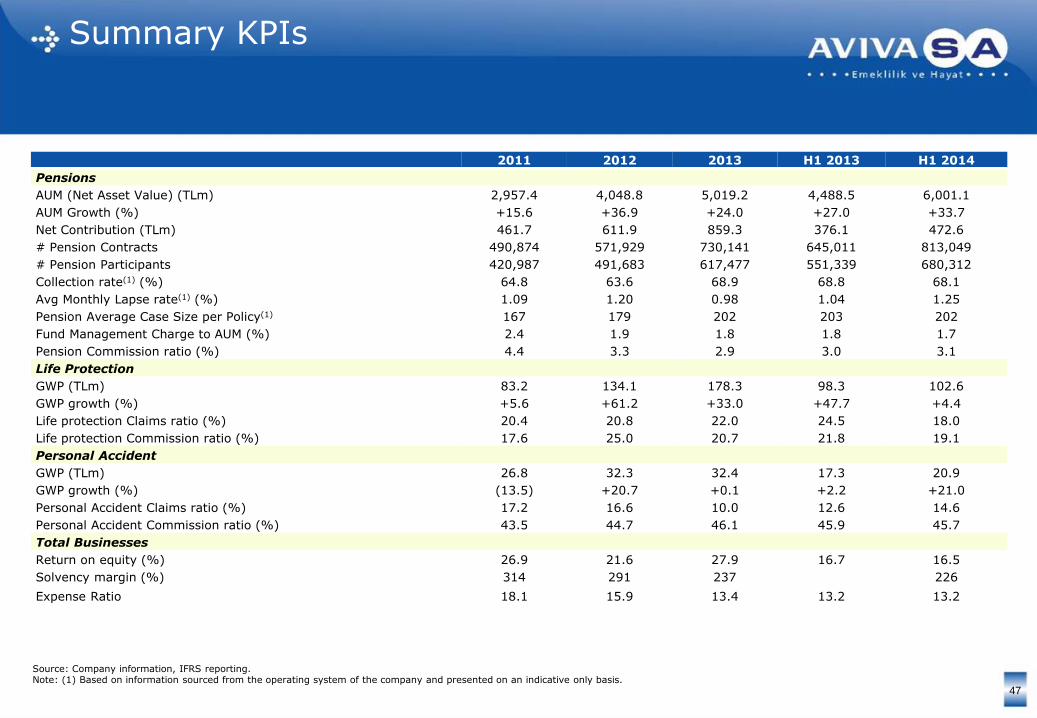
2011 2012 2013 H1 2013 H1 2014
Pensions
AUM (Net Asset Value) (TLm) 2,957.4 4,048.8 5,019.2 4,488.5 6,001.1
AUM Growth (%) +15.6 +36.9 +24.0 +27.0 +33.7
Net Contribution (TLm) 461.7 611.9 859.3 376.1 472.6
# Pension Contracts 490,874 571,929 730,141 645,011 813,049
# Pension Participants 420,987 491,683 617,477 551,339 680,312
Collection rate(1) (%) 64.8 63.6 68.9 68.8 68.1
Avg Monthly Lapse rate(1) (%) 1.09 1.20 0.98 1.04 1.25
Pension Average Case Size per Policy(1) 167 179 202 203 202
Fund Management Charge to AUM (%) 2.4 1.9 1.8 1.8 1.7
Pension Commission ratio (%) 4.4 3.3 2.9 3.0 3.1
Life Protection
GWP (TLm) 83.2 134.1 178.3 98.3 102.6
GWP growth (%) +5.6 +61.2 +33.0 +47.7 +4.4
Life protection Claims ratio (%) 20.4 20.8 22.0 24.5 18.0
Life protection Commission ratio (%) 17.6 25.0 20.7 21.8 19.1
Personal Accident
GWP (TLm) 26.8 32.3 32.4 17.3 20.9
GWP growth (%) (13.5) +20.7 +0.1 +2.2 +21.0
Personal Accident Claims ratio (%) 17.2 16.6 10.0 12.6 14.6
Personal Accident Commission ratio (%) 43.5 44.7 46.1 45.9 45.7
Total Businesses
Return on equity (%) 26.9 21.6 27.9 16.7 16.5
Solvency margin (%) 314 291 237 226
Expense Ratio 18.1 15.9 13.4 13.2 13.2
Note: (1) Based on information sourced from the operating system of the company and presented on an indicative only basis.Source: Company information, IFRS reporting.

48
Reconciliation between IFRS vs. Statutory Profit for the Year
IFRS vs. Statutory Profit for the Year (TLm) Profit for the Year Reconciliation (TLm)
51,349,4
71,6
46,9
32,0
38,8
30,7
26,6
2011 2012 2013 H1 2014
IFRS Statutory
2011 2012 2013 CAGR H1 2014
IFRS Profit for the Year
51.3 49.4 71.6 +18.2% 46.9
Equalisation Reserve write-off
(1.6) (2.1) (2.7) +29.9% -0.3
Deferred Tax 4.4 2.1 11.8 +63.8% 5.1
Change in Deferred Asset Costs
(22.1) (10.6) (49.9) +50.3% (25.1)
Statutory Profit for the Year
32 38.8 30.7 (2.0%) 26.6
Total Difference 19.3 10.6 40.9 n.m. 20.3
Source: Company information.

MCEV– Net Worth Reconciliation
49
Net Worth Reconciliation (TLm)
2013 H1 2014
IFRS Shareholders’ Equity 271.7 296.1
IFRS deferred acquisition costs (107.2) (127.3)
Difference in Technical Provisions Between IFRSand MCEV
(7.1) (7.3)
MCEV Shareholders’Net Worth
157.5 161.5

Consolidated Income Statement 3Q 2014 update
50
(TLm) H1 2014 3Q 2014
Income
Gross Written Premiums 132.1 195.0
Premium Ceded to Reinsurers (5.4) (6.9)
Premium Written Net of Reinsurance 126.8 188.1
Net Change in Provision for Unearned Premiums Reserves (9.2) (9.9)
Net Premiums Earned 117.5 178.2
Net Change in Mathematical Reserves 32.0 53.9
Income Generated from Pension Business 77.0 119.5
Investment and Other Income/(Expense), Net 23.1 31.9
Commission Income 1.4 1.9
Foreign Exchange Gain, Net 0.7 3.4
Other Income, Net – -
Total Income 251.7 388.9
Expenses
Claims Paid and Change in Outstanding Claims Provisions (66.7) (109.4)
General and Administrative Expenses (80.0) (121.6)
Pension Expenses Including Commission (21.2) (34.3)
Commission Expenses (22.9) (35.0)
Foreign Exchange Loss, Net – –
Other Income/(Expense), Net (0.5) (0.6)
Total Expenses (191.2) (300.9)
Profit Before Taxes 60.5 87.9
Income Tax Expense (13.7) (19.2)
Profit for the Period 46.9 68.8 Source: Company information, IFRS reporting.
Consolidated Balance Sheet3Q 2014 update
51
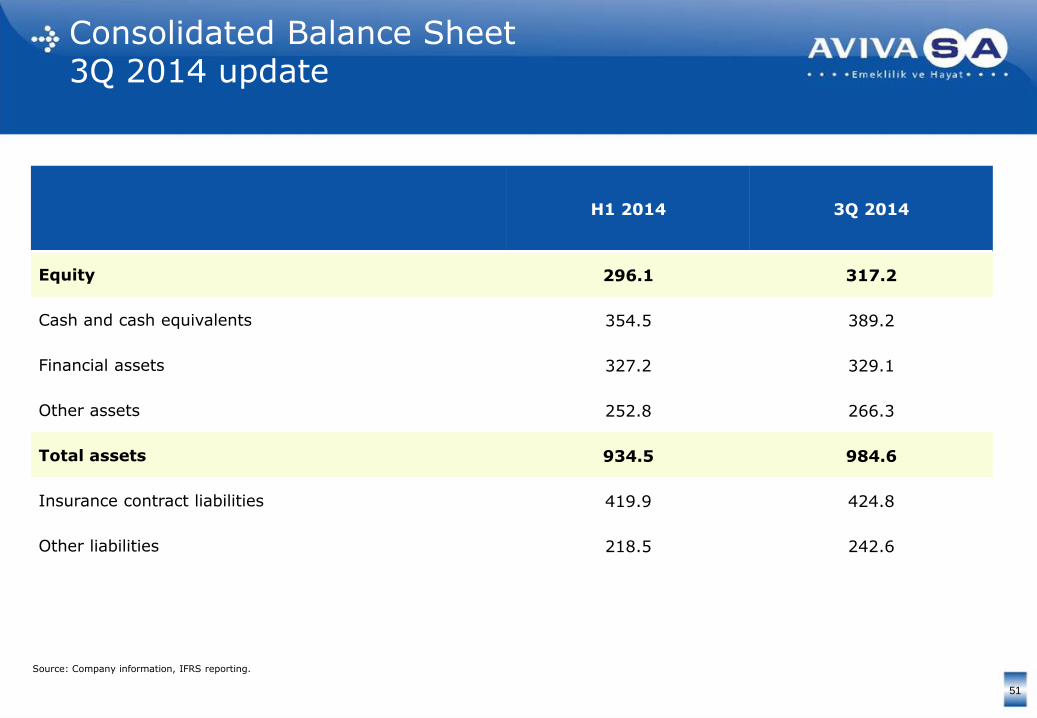
H1 2014 3Q 2014
Equity 296.1 317.2
Cash and cash equivalents 354.5 389.2
Financial assets 327.2 329.1
Other assets 252.8 266.3
Total assets 934.5 984.6
Insurance contract liabilities 419.9 424.8
Other liabilities 218.5 242.6
Source: Company information, IFRS reporting.

Disclaimer
52
The information in this presentation has been prepared by AvivaSA Emeklilik ve Hayat A.Ş. (the “Company” or “AvivaSA”) solely for use at a presentation concerning the Company, its proposed listing on the Borsa İstanbul and the proposed offering (the “Offering”) of ordinary shares of the Company (the “Shares”) by Aviva Europe SE (“Aviva”) and Hacı Ömer Sabancı Holding A.Ş. (“Sabancı”). This presentation and its contents are strictly confidential, are intended only for use by the attendee for information purposes only and may not be reproduced in any form or further distributed to any other person (whether or not a Relevant Person as defined below) or published, in whole or in part, for any purpose. Failure to comply with this restriction and the followingrestrictions may constitute a violation of applicable securities laws.
This presentation does not constitute or form part of, and should not be construed as, an offer to sell, or the solicitation or invitation of any offer to buy or subscribe for, or otherwise acquire, any securities of the Company or an inducement to enter into investment activity. No part of this presentation, nor the fact of its distribution, should form the basis of, or be relied on in connection with, any contract or commitment or investment decision whatsoever. Any purchase of the Shares in the Offering should be made solely on the basis of the information contained in the Turkish language prospectus for the Turkish retail and institutional investors to be published in respect to the Offering within the Republic of Turkey (the “Turkish Prospectus”) or the final offering circular for institutional investors to be prepared in connection with the Offering outside the Republic of Turkey (the “Offering Circular”), as applicable. Copies of the Turkish Prospectus and the Offering Circular will, following publication, be available from the Company’s registered office.
This presentation is the sole responsibility of the Company. The information contained in this presentation does not purport to be comprehensive and has not been independently verified. The information contained herein is for discussion purposes only and does not purport to contain all information that may be required to evaluate the Company and/or its business, financial position or future performance. The information and opinions contained in this document are provided only as at the date of the presentation and are subject to change without notice. Some of the information is still in draft form and will be finalised or completed only at the time of publication by the Company of the Turkish Prospectus or the final Offering Circular, as applicable, in connection with the Offering. No representation, warranty or undertaking, expressed or implied, is or will be made by the Company, Citigroup Global Markets Limited (“Citigroup”), HSBC Bank plc (“HSBC”), Ak Yatırım Menkul Değerler A.Ş. (“Ak Yatırım”) or their respective affiliates, advisors or representatives or any other person as to, and no reliance should be placed on, the fairness, accuracy, completeness or correctness of the information or the opinions contained in this presentation (or whether any information has been omitted from this presentation). The Company, to the extent permitted by law, and each of Citigroup, HSBC, Ak Yatırım and its or their respective directors, officers, employees, affiliates, advisors or representatives disclaims all liability whatsoever (in negligence or otherwise) for any loss however arising, directly or indirectly, from any use of this presentation or its contents or otherwise arising in connection with this presentation.
To the extent available, the industry, market and competitive position data contained in this presentation come from official or third party sources. Third party industry publications, studies and surveys generally state that the data contained therein have been obtained from sources believed to be reliable, but that there is no guarantee of the accuracy or completeness of such data. While the Company believes that each of these publications, studies and surveys has been prepared by a reputable source, the Companyhas not independently verified the data contained therein. In addition, certain of the industry, market and competitive position data contained in this presentation come from the Company’s own internal research and estimates based on the knowledge and experience of the Company’s management in the markets in which the Company operates. While the Company believes that such research and estimates are reasonable and reliable, they, and their underlying methodology and assumptions, have not been verified by any independent source for accuracy or completeness and are subject to change without notice. Accordingly, undue reliance should not be placed on any of the industry, market or competitive position data contained in this presentation.
This presentation and any materials distributed in connection with this presentation are not directed to, or intended for distribution to or use by, any person or entity that is a citizen or resident or located in any locality, state, country or other jurisdiction where such distribution, publication, availability or use would be contrary to law or regulation or which would require any registration or licensing within such jurisdiction.
The Shares have not been and will not be registered under the U.S. Securities Act of 1933, as amended (the “Securities Act”), or the laws of any state, territory or other jurisdiction (including the District of Columbia) of the United States, and may not be offered or sold within the United States, absent registration or pursuant to an exemption from, or in a transaction not subject to, the registration requirements of the Securities Act and applicable laws of any state, territory or other jurisdiction of the United States. AvivaSA does not intend to register any portion of the offering in the United States or conduct a public offering of securities in the United States.
Neither this presentation nor any part of it may be taken or transmitted in or into Australia, Canada, Japan or Saudi Arabia or distributed, directly or indirectly, in or into Australia, Canada, Japan or Saudi Arabia. Any failure to comply with these restrictions may constitute a violation of Australian, Canadian, Japanese or Saudi Arabian securities laws. The Shares have not been and will not be registered under the applicable securities laws of Australia, Canada, Japan or Saudi Arabia and, subject to certain exceptions, may not be offered or sold within Australia, Canada, Japan or Saudi Arabia.
The offer and distribution of this presentation and other information in connection with the proposed listing and the Offering in certain jurisdictions may be restricted by law and persons into whose possession this presentation or any document or other information referred to herein comes should inform themselves about and observe any such restrictions. Any failure to comply with these restrictions may constitute a violation of the securities laws of any such jurisdiction.
This presentation is made to and directed only at the limited number of invitees who: (A) if in the United States (as defined in Regulation S under the Securities Act), are “qualified institutional buyers” as defined in Rule 144A under the Securities Act, (B) if in the European Economic Area, are persons who are “qualified investors” within the meaning of Article 2(1)(e) of the Prospectus Directive (Directive 2003/71/EC), as amended (“Qualified Investors”); (C) if in the United Kingdom, are persons (i) having professional experience in matters relating to investments so as to qualify them as “investment professionals” under Article 19(5) of the Financial Services and Markets Act 2000 (Financial Promotion) Order 2005 (the “Order”); and (ii) falling within Article 49(2)(a) to (d) of the Order or persons to whom it may otherwise be lawfully communicated; and/or (D) are other persons to whom it may otherwise lawfully be communicated (all such persons referred to in (A), (B), (C), and (D) together being “Relevant Persons”). Nothing in this presentation constitutes investment advice and any recommendations that may be contained herein have not been based upon a consideration of the investment objectives, financial situation or particular needs of any specific recipient. Persons other than Relevant Persons should not rely on or act upon this presentation or any of its contents and must return it immediately to the Company. Any investment or investment activity to which this communication relates is available only to Relevant Persons and will be engaged in only with Relevant Persons.
This presentation includes “forward-looking statements”. These statements contain the words “anticipate”, “will”, “believe”, “intend”, “estimate”, “expect” and words of similar meaning. All statements other than statements of historical fact included in this presentation, including, without limitation, those regarding the Company’s financial position, prospects, growth, business strategy, plans and objectives of management for future operations (including statements relating to new routes, number of aircraft, availability of financing, customer offerings, passenger and utilisation statistics and objectives relating to the Company’s products and services) are forward-looking statements. Such forward-looking statements involve known and unknown risks, uncertainties and other important factors, including, without limitation, the risks and uncertainties to be set forth in the Turkish Prospectus and the Offering Circular, that could cause the actual results, performance or achievements of the Company to be materially different from future results, performance or achievements expressed or implied by such forward-looking statements. Such forward-looking statements are based on numerous assumptions regarding the Company’s present and future business strategies and the environment in which the Company will operate in the future. These forward-looking statements speak only as at the date of this presentation. The Company cautions you that forward-looking statements are not guarantees of future performance and that its actual financial position, prospects, growth, business strategy, plans and objectives of management for future operations may differ materially from those made in or suggested by the forward-looking statements contained in this presentation. In addition, even if the Company’s financial position, prospects, growth, business strategy, plans and objectives of management for future operations are consistent with the forward-looking statements contained in this presentation, those results or developments may not be indicative of results or developments in any future period. The Company does not undertake and expressly disclaims any obligation to review or confirm or to release publicly any updates or revisions to any forward-looking statements contained herein to reflect any change in the Company’s expectations with regard thereto or any events that occur or conditions or circumstances that arise after the date of this presentation.
As of the date of this presentation, the Turkish Prospectus has not been approved under the Turkish Capital Markets Law No 6362. Neither the Turkish Prospectus nor the Offering have been or will be registered with, approved by or notified to any authorities outside the Republic of Turkey (including in any European Economic Area Member State, based on Directive 2003/71/EC of the European Parliament, as amended, and of the Council of 4 November 2003 on the prospectus to be published when securities are offered to the public or admitted to trading). Any offered securities may not be offered or sold outside the territory of the Republic of Turkey unless such offer or sale could be legally made in such jurisdiction without the need to fulfil any additional requirements.
In any European Economic Area Member State that has implemented Directive 2003/71/EC, as amended (together with any applicable implementing measures in any Member State, the “Prospectus Directive”), this presentation is not a prospectus for purposes of the Prospectus Directive.
Each of Citi, HSBC and Ak Yatırım are acting exclusively for the Company, Aviva and Sabancı and no one else in connection with the Offering and will not be responsible to anyone other than the Company, Aviva and Sabancı for providing the protections afforded to their respective clients or for providing advice in connection with the Offering.
By attending this presentation or by reading the presentation slides, you agree to be bound by the foregoing limitations and restrictions and, in particular, will be deemed to have represented, warranted and undertaken that: (i) you have read and agree to comply with the contents of this disclaimer including, without limitation, the obligation to keep this presentation and its contents confidential; (ii) you are a Relevant Person (as defined above); and (iii) you will be solely responsible for your own assessment of the Company and its business, financial position and future performance and will make any investment decision solely on the basis of the final Turkish Prospectus or the final Offering Circular, as applicable.
• • • • by your side • • • •