presentation to the legislature on alabama’s financial...
TRANSCRIPT

PRESENTATION TO THE LEGISLATURE ON ALABAMA’S FINANCIAL CONDITION
Kirk Fulford Deputy Director – Fiscal DivisionLegislative Services Agency
January 9, 2018
www.lsa.state.al.us
(334) 242-7950

OVERVIEW
Alabama Economic Condition
Appropriation of State Funds for FY 2018
Status of the Education Trust Fund and the State General Fund for FY 2017 and FY 2018
Outlook for the Education Trust Fund and the State General Fund for FY 2019
General Funding Issues
2

THE GREAT RECESSION
According to NBER, began December 2007 and ended in June 2009 (18 months) – the longest of any recession since World War II
Worst recession since the Great Depression of the 1930s
The U.S. economy shrank in five quarters, including four quarters in a row
U.S. unemployment rates (Source: U.S. Bureau of Labor Statistics):
December 2007 – 5% (at or below this % for previous 30 months)
June 2009 – 9.5% (peaked at 10% after recession ended in October 2009)
Total U.S. Job Losses During Recession – 7.5 million
Stock market decline that began in August 2007 cost U.S. households roughly $16 trillion of net worth
3
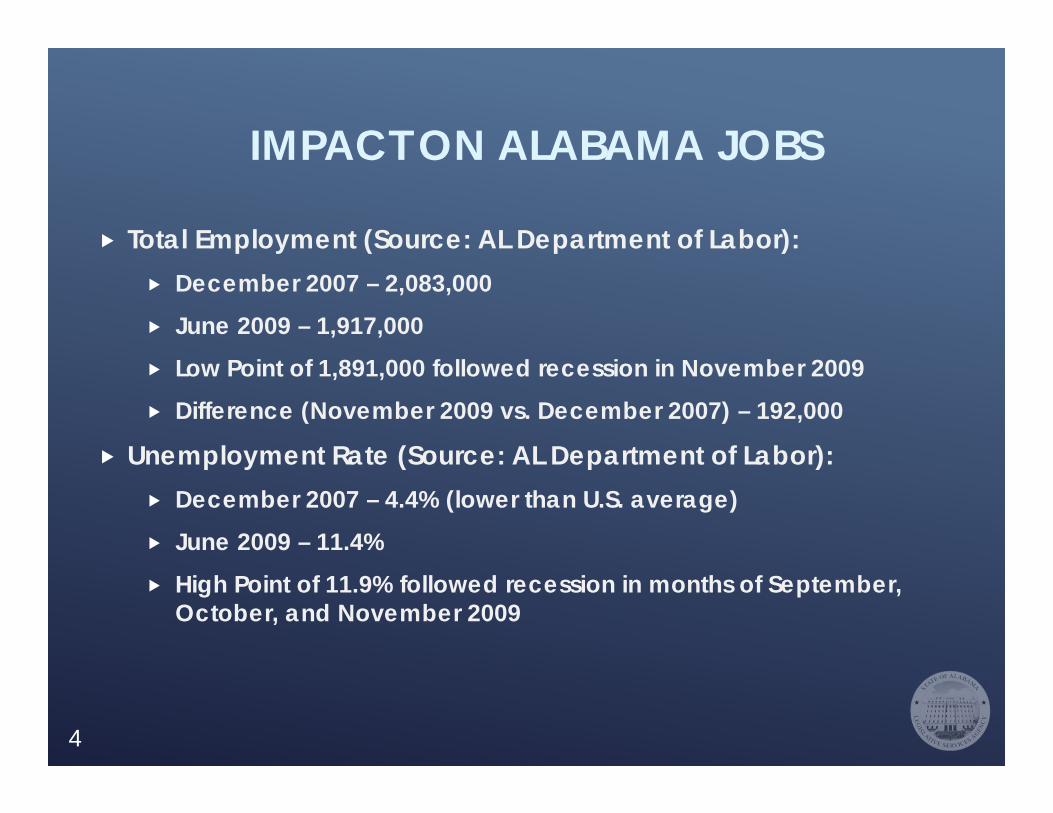
IMPACT ON ALABAMA JOBS
Total Employment (Source: AL Department of Labor): December 2007 – 2,083,000 June 2009 – 1,917,000 Low Point of 1,891,000 followed recession in November 2009 Difference (November 2009 vs. December 2007) – 192,000
Unemployment Rate (Source: AL Department of Labor): December 2007 – 4.4% (lower than U.S. average) June 2009 – 11.4% High Point of 11.9% followed recession in months of September,
October, and November 2009
4

IMPACT ON ALABAMA INCOMES Total Personal Income (Source: U.S. Bureau of Economic Analysis):
Average annual % increase between 2001 recession and 2007 recession – 5.3%
2007 – $152.2 billion (5.0% increase over 2006)
2008 – $157.7 billion (3.6% increase over 2007)
2009 – $155.5 billion (1.4% decrease from 2008)
Average annual % increase since Great Recession – 2.8%
Total Wages and Salaries (Source: U.S. Bureau of Economic Analysis):
Average annual % increase between 2001 recession and 2007 recession – 4.7%
2007 – $77.2 billion (4.7% increase over 2006)
2008 – $79.1 billion (2.4% increase over 2007)
2009 – $76.3 billion (3.5% decrease from 2008)
Average annual % increase since Great Recession ended – 2.5%5

IMPACT ON MAJOR STATE REVENUES
INCOME TAXES Gross individual taxes
FY 2008 – $3.61 billion FY 2009 – $3.32 billion FY 2010 – $3.21 billion Difference FY 2010 vs.
FY 2008 = -$400 million Did not exceed FY 2008
collection level until FY 2013
SALES TAXES Gross sales taxes
FY 2008 – $2.03 billion FY 2009 – $1.83 billion FY 2010 – $1.85 billion Difference FY 2009 vs.
FY 2008 = -$200 million Did not exceed FY 2008
collection level until FY 2014
6

CURRENT ALABAMA CONDITION
Unemployment Rate (Source: AL Department of Labor, seasonally adjusted figures):
November 2017 – 3.5% (new record low) and below the national rate of 4.1%
November 2016 – 6.2%
Roughly 76,000 unemployed persons in November 2017 (new record low) compared to roughly 136,000 in November 2016
Total Employment (Source: AL Department of Labor):
Gain of 30,500 jobs over the past year
Gains in construction, manufacturing, leisure and hospitality, education and health services, among others
Alabama individual income tax withholding payments for FY 2017 were up by 4.14%
Average growth over the last 6 months – 6.47%
7

APPROPRIATION OF STATE FUNDS

APPROPRIATION OF ALL STATE FUNDS FY 2018 (AS ENACTED)
General Fund = $1.85 Billion
Education Trust Fund = $6.42 Billion
Other State Funds = $3.60 Billion
Total State Funds = $11.87 Billion
9

Mental Health
$319.1 M2.7%
Human Resources$268.1 M
2.3%
Corrections$494.1 M
4.2%
Education$6.2 B52.6%
Medicaid$1.8 B15.4%
Transportation$722.5 M
6.1%
Public Health
$107.3 M0.9%
All Other$1.9 B15.9%
Total State Funds:$11.9 Billion
APPROPRIATION OF ALL STATE FUNDSFY 2018 (AS ENACTED)
10

Education Trust Fund (ETF)

EDUCATION TRUST FUND REVENUE SOURCES - FY 2017
Sales Tax$1.8 B28.7%
Use Taxes$165.1 M
2.6%
Income Tax$3.9 B61.5%
Utility Tax$388.0 M
6.1%
Other$70.1 M
1.1%
Total Receipts:$6.3 Billion
12

GROWTH IN ETF RECURRING REVENUES SINCE FY 1998
-15%
-10%
-5%
0%
5%
10%
15%19
9819
9920
0020
0120
0220
0320
0420
0520
0620
0720
0820
0920
1020
1120
1220
1320
1420
1520
1620
17
FY 2009-11.52%
FY 2010-.46%
FY 20081.52%
13

ETF PRORATION SINCE 1992
FY 1992: 3.0%
FY 2001: 6.2%
FY 2003: 4.4% (Reduced to 0% after transfer of approximately $180 million from Rainy Day Account/PPA)
FY 2008: 6.5% (Reduced to 0% after transfer of approximately $439 million from PPA)
FY 2009: 18.0% (Reduced to 11% after transfer of approximately $437 million from Rainy Day Account)
FY 2010: 9.5%
FY 2011: 3.0%
14

CONDITION OF THE ETFFY 2017 AND FY 2018
ActualFY 2017
EstimatedFY 2018 Difference
Beginning Balance 5,041,468 6,919,305 1,877,837
Regular Receipts (FY 2018 reflects Fiscal Division revised estimates) 6,327,327,215 6,516,000,000 188,672,785
TOTAL AVAILABLE (beginning balance plus regular receipts) 6,332,368,683 6,522,919,305 190,550,622
TOTAL ETF EXPENDITURES (FY 2018 as of 12/31/2017) 6,332,041,468 6,419,124,473 87,083,005
ENDING BALANCE BEFORE REVERSIONS AND ADJUSTMENTS 327,215 103,794,832 103,467,517
Reversions and Adjustments 6,592,090
DISTRIBUTION OF ENDING BALANCE BEFORE REVERSIONS AND ADJUSTMENTS
Budget Stabilization Fund 63,320,415 63,320,415Advancement and Technology Fund 40,474,417 40,474,417
15

BUDGET STABILIZATION FUND Established by the ETF Rolling Reserve Act
A portion of any revenues deposited into the ETF in excess of the fiscal year appropriation cap for the immediately preceding fiscal year is transferred to the Budget Stabilization Fund
For FY 2015, up to 2% of the previous year’s ETF appropriations ($118,305,984)
Thereafter, up to 1% of the previous year’s ETF appropriations ($59,595,211 in FY 2016, no transfer in FY 2017) until the fund reaches 7.5% of the previous year’s ETF appropriations
Total current balance of approximately $179 million
Amounts in the Budget Stabilization Fund may be withdrawn only to prevent proration in the ETF
16

ADVANCEMENT AND TECHNOLOGY FUND
Also, established by the ETF Rolling Reserve Act
Any funds remaining after the transfer to the Budget Stabilization Fund are transferred to the Advancement and Technology Fund
For FY 2016, the transfer was $56,386,922
No transfer for FY 2017
17

ADVANCEMENT AND TECHNOLOGY FUND Funds must be appropriated through an independent
supplemental appropriation bill for:
repairs and deferred maintenance of facilities;
for classroom instructional support;
for insuring facilities;
for transportation; and
for the acquisition or purchase of educational technology and equipment
The annual appropriation of these funds is divided between the public schools and institutions of higher education in accordance with the percentage split between these two sectors of education
The supplemental appropriation bill to appropriate these funds did not pass during the 2017 Regular Session
18

Appropriation of Education Trust FundFY 2018
All Other5.78%
K-12 Program68.83%
University Education
19.65%Community
College Education
5.74%
Total ETF:$6.42 billion
The SplitK-12: 73.05%
Higher Education: 26.95%
19

ETF ROLLING RESERVE ACTFY 2019 CAP
FY 2017 Net Recurring Revenues $6,327,327,215
PLUS:Average growth for the 14 highest years out of the last 15 (4.25%) $268,911,407
New recurring revenue measures -24,320,000PACT appropriation for FY 2019 $61,539,000
FY 2019 ETF Appropriations Cap $6,633,457,622
ETF Appropriations for FY 2018 $6,417,000,027
Cap Difference: FY 2019 vs. FY 2018 $216,457,595
20

CONDITION OF THE ETFFY 2018 AND FY 2019
Estimated FY 2018
Estimated FY 2019 Difference
Beginning Balance 6,919,305 -6,919,305
Regular Receipts (Reflects Fiscal Division estimates) 6,516,000,000 6,720,000,000 197,000,000
TOTAL AVAILABLE (beginning balance plus regular receipts) 6,522,919,305 6,720,000,000 197,080,695
TOTAL ETF EXPENDITURES 6,419,124,473 6,633,457,622 214,333,149
ENDING BALANCE BEFORE REVERSIONS AND ADJUSTMENTS 103,794,832 86,542,378 -17,252,454
ESTIMATED DISTRIBUTION OF ENDING BALANCEBudget Stabilization Fund 63,320,415 64,191,245 870,830Advancement and Technology Fund 40,474,417 22,351,133 -18,123,284
21

ESTIMATED COST OF A 1% PAY INCREASE FOR EDUCATION EMPLOYEES
Entity Amount
K-12 Local Boards (certificated) $28,181,000
K-12 Local Boards (support) $8,446,000
Total $36,627,000
Other K-12 Agencies $638,500
Postsecondary Institutions $3,710,000
Grand Total $40,975,500
22

ETF FUNDING ISSUES FOR FY 2019
PEEHIP has requested an employer rate of $800 per active employee per month for FY 2019 – the same rate as in FY 2018
TRS employer rates recommended by the actuary were 12.41% for Tier I and 11.35% for Tier II, both slight increases from FY 2018
Total additional employer costs - $12.0 Million, of which an estimated 59% would be paid from ETF appropriations
Total additional ETF cost - $7.1 Million
23

FEDERAL TAX CUTS AND JOBS ACTINDIVIDUAL CORPORATE
For tax years 2018 through 2025:
Rates and brackets modified with most tax rates being reduced
Increased estate and gift tax exemption
Standard deduction increased
Personal and dependent exemption eliminated
Limitation on the deduction for state and local taxes and home mortgage interest
Established a flat 21% tax rate, rather than previous graduated rates ranging from 15% to 35%
Alternative Minimum Tax repealed
Increased Section 179 expensing limits for qualifying property
Temporary 100% first year bonus depreciation for qualifying property
24

State General Fund (SGF)

Oil and Gas Severance Taxes
$33.9 M1.8%
Lease Tax$77.3 M
4.0% Property Tax$154.4 M
8.0%
Corporation Taxes$75.5 M
3.9%
Alcoholic Beverage Taxes
$100.6 M5.2%
Alabama Trust Fund Transfer$98.0 M
5.1%
Cigarette Tax$163.3 M
8.5%Court Costs$61.9 M
3.2%
Sales Tax$103.6 M
5.4%
Use Tax$225.2 M
11.7%
Insurance Co. Taxes$319.8 M
16.7%
One-Time Receipts$87.7 M
4.6%
All Other $418.6 M
21.8%Total Receipts:
$1.92 Billion
STATE GENERAL FUNDREVENUE SOURCES - FY 2017
26

STATE GENERAL FUND REGULAR RECEIPTS, 3-YEAR HISTORY
FY 2015 FY 2016 FY 2017
Alcoholic Beverage Control Board Taxes and Profits 99,255,047 100,816,514 100,623,508
Ad Valorem Tax –2.5 Mills
146,459,174 150,853,517 154,429,888
Alabama Trust Fund Regular Distributions
100,933,482 103,310,045 98,040,084
Cigarette Tax 99,351,497 164,746,858 163,313,105
Corporation Taxes –Regular
65,351,352 56,831,934 75,499,764
Court Costs –Judicial Article 63,574,968 61,282,678 61,860,771
Insurance Premium and License Taxes
283,264,436 293,534,706 319,814,875
Leasing and Rental Tax
78,440,761 76,634,471 77,297,544
Lodgings Tax 43,984,070 46,869,544 49,851,286
Sales Tax on Autos 89,091,956 97,844,307 102,230,663
Use Taxes 92,235,264 197,691,644 228,384,170
All Other 689,370,703 494,910,617 488,488,114
Grand Total 1,851,312,710 1,845,326,835 1,919,833,77227

Medicaid38.0%
Legislative1.7%Mental Health
5.9%Judicial
6.5%
Human Resources
3.3%
Corrections22.4%
Public Health 1.7%
Law Enforcement
2.6%
All Other17.9% Total SGF:
$1.85 Billion
APPROPRIATION OF STATE GENERAL FUNDFY 2018 (AS ENACTED)
28

STATE GENERAL FUND GROWTH:CORRECTIONS AND MEDICAID SHARE
32.9%
41.2%
57.4%
59.7% 60.2% 60.3%
$0
$200
$400
$600
$800
$1,000
$1,200
$1,400
$1,600
$1,800
$2,000
1994 2004 2014 2016 2017 2018
Mill
ions
Medicaid Corrections Other SGF
29

CONDITION OF THE SGFFY 2017 AND FY 2018
ActualFY 2017
Estimated FY 2018 Difference
BEGINNING BALANCE 63,817,402 143,022,892 79,205,490Regular Receipts 1,837,328,771 1,886,995,000 49,666,229Agency Transfers 32,505,000 28,005,000 -4,500,000BP Settlement Funds 50,000,000 -50,000,000TOTAL RECEIPTS (FY 2018 reflects revised Fiscal Division estimates) 1,919,833,771 1,915,000,000 -4,833,771
TOTAL AVAILABLE (beginning balance plus total receipts) 1,983,651,173 2,058,022,892 74,371,719Appropriations (as of 12/31/2017) 1,854,466,022 1,871,610,460 17,144,438Reversions Reappropriated (as of 12/31/2017)
48,549,920 56,958,524 8,408,604
TOTAL APPROPRIATIONS AND OBLIGATIONS 1,903,015,942 1,928,568,983 25,553,041Reversions and Adjustments -62,387,661 62,387,661TOTAL ENDING BALANCE 143,022,892 129,453,909 -13,568,983
30
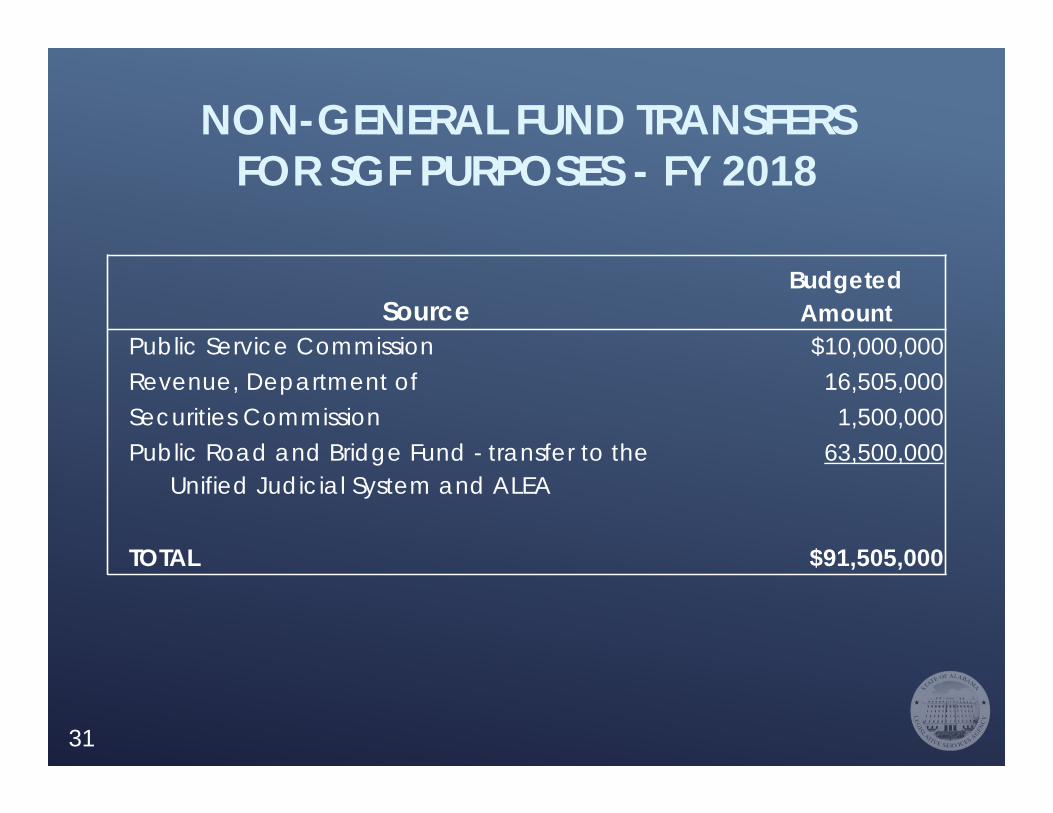
SourceBudgeted Amount
Public Service Commission $10,000,000Revenue, Department of 16,505,000Securities Commission 1,500,000Public Road and Bridge Fund - transfer to the
Unified Judicial System and ALEA63,500,000
TOTAL $91,505,000
NON-GENERAL FUND TRANSFERSFOR SGF PURPOSES - FY 2018
31

CONDITION OF THE SGFFY 2018 AND FY 2019
EstimatedFY 2018
EstimatedFY 2019 Difference
BEGINNING BALANCE 143,022,892 129,453,909 -13,568,983
Regular Receipts 1,886,995,000 1,923,995,000 37,000,000Agency Transfers 28,005,000 28,005,000TOTAL RECEIPTS (Fiscal Division estimates) 1,915,000,000 1,952,000,000 37,000,000
TOTAL AVAILABLE (beginning balance plus total receipts) 2,058,022,892 2,081,453,909 23,431,017Appropriations (as of 12/31/2017) 1,871,610,460
Reversions Reappropriated (as of 12/31/2017) 56,958,524TOTAL APPROPRIATIONS AND OBLIGATIONS 1,928,568,983ESTIMATED ENDING BALANCE 129,453,909
32

ESTIMATED COST OF A 1% PAY INCREASE FOR STATE EMPLOYEES
Total Cost of 1% pay raise:
$18.4 Million
State General Fund share of 1% pay raise:
$4.8 Million
33

FY 2019 SGF FUNDING ISSUES
FY 2019 SGF Requested Budget Increases Over FY 2018 Enacted (from Budget Hearings):
Medicaid - $55.5 Million
Law Enforcement Agency (ALEA) - $5.9 Million
Public Health - $57.2 Million ($53.5 Million for CHIP)
Corrections - $30 Million Supplemental for FY 2018 and an additional $50 million for FY 2019
Mental Health - $13.2 Million
FY 2019 Total of $181.8 Million more than budgeted in FY 2018
34

OTHER FUNDING ISSUES ERS employer rates recommended by the actuary were 14.51% for Tier I and 14.14%
for Tier II, both slight increases from FY 2018
Total additional employer costs - $9.8 Million, of which an estimated 26% would be paid from SGF appropriations
Total additional SGF cost - $2.6 Million
Children’s Health Insurance Program (CHIP)
A provision of the ACA authorized an additional 23% of federal matching funds to states through FY 2019; however, funds were only appropriated through FY 2017
FY 2018 – currently operating using FY 2017 federal funding (FY 2018 and future allocations have not been authorized)
Recent Congressional proposals have included the current 23% increase in the CHIP federal matching percentage (FMAP) for FY 2018 and FY 2019 and a phase down to begin in FY 2020
If this proposal is enacted, in FY 2020, the Department of Public Health will need approximately $25.5 million and the Medicaid Agency will need approximately $13 million in additional State General Fund dollars for a total of $38.5 million
35

OTHER FUNDING ISSUES
Medicaid
Requested increase in FY 2019 is $757 million ($55 million over FY 2018) but lower than expected due to carryforward
At this time, the expected need in FY 2020 is $810 million ($53 million more than the 2019 request) plus inflation and any unknown federal mandates
Corrections Lawsuit
Class action lawsuit filed by the Southern Poverty Law Center (SPLC) and the Alabama Disability Advocacy Program (ADAP) brought on behalf of inmates who allege medical, mental health, and ADA claims
Federal court ruled in June 2017 that mental health care was inadequate and ordered the state to come up with a long-term plan to address complaints
36

LSA WEBSITE
Website: www.lsa.state.al.us
About the LSA and each of the divisions
Fiscal Division
Special Reports
Alabama’s Financial Condition
Publications
Tax Expenditures
Tax Guide
Budget Fact Book
Appropriations Information
ETF and SGF Comparison Spreadsheets37

Q&A
38