presentation to
TRANSCRIPT

1
PRESENTATION TO:
Don A. d’Adesky
Managing Director
561-981-3690
RaymondJames-TheAmericasGroup.com

2
In September 2015, Raymond James’ Practice
Intelligence was named a winner in
WealthManagement.com’s inaugural
Industry Awards.
In May 2015, The Raymond James Equity
Research department received a total of 15
awards in the 2015 StarMine Analyst Awards,
ranking the firm third among all brokers in
cumulative StarMine awards for the U.S. over
the past three and five years.
In January 2015, M&A Advisor named the
Raymond James Investment Banking practice
“Investment Banking Firm of the Year” in
addition to three “Deal of the Year” awards at
the M&A Advisor Turnaround Awards.
Approximately 6,600
financial advisors
Over 2,700 locations
(United States, Canada
and abroad)
More than 2.7 million
client accounts
Approximately $480
billion in total client
assets
RAYMOND JAMES AT A GLANCE
As of 9/30/2015. Investing involves risk, and investors may incur a profit or a loss. Past performance is not an indication of future results. The information provided is for informational purposes only and is not a solicitation to buy or sell Raymond
James Financial stock. The M&A Advisor Turnaround Awards represent the best of the distressed investing and reorganization industry in 2014. Nominations were judged by an independent jury of industry experts The StarMine Analyst awards
are based on calendar-year performance of recommendations and estimates on companies that are based in the U.S., Europe and Asia. StarMine, a Thomson Reuters company, objectively measures the performance of analysts based on the
returns of their buy/sell recommendations and the accuracy of their earnings estimates. Criteria for the WealthManagement.com’s Practice Management award include quantitative measures—such as scope, scale, adoption, usage, feature set,
advisor survey scores, etc.—along with qualitative measures such as innovation, creativity, new methods of delivery, etc. ©2015 Raymond James & Associates, Inc., member New York Stock Exchange/SIPC ©2015 Raymond James Financial
Services, Inc., member FINRA/SIPC Investment products are: not deposits, not FDIC/NCUA insured, not insured by any government agency, not bank guaranteed, subject to risk and may lose value. 15-BDMKT-1993
Fiscal 2015 Total Revenue – By Primary Segments
Raymond James has delivered 111 consecutive quarters of profitability. We credit much of this performance to the firm’s client-first perspective
and adherence to its founding core values of professional integrity, advisor independence, and a conservative, long-term approach to
investing.
BY THE
NUMBERS
STRENGTH AND STABILITY
Diluted Earnings Per Share – Trailing 10 Years
HONORS AND ACCOLADES

3

5
Background
• Proprietary Online Portfolio Management System,
Introduced in Fall 1999
• CMO/Structured Cashflows Calculated by Intex®,
Prepayment Model Speeds Provided by Yieldbook®
• Free Access to RAYMOND JAMES® Clients
• Reviewed and Utilized by Various Regulatory Entities
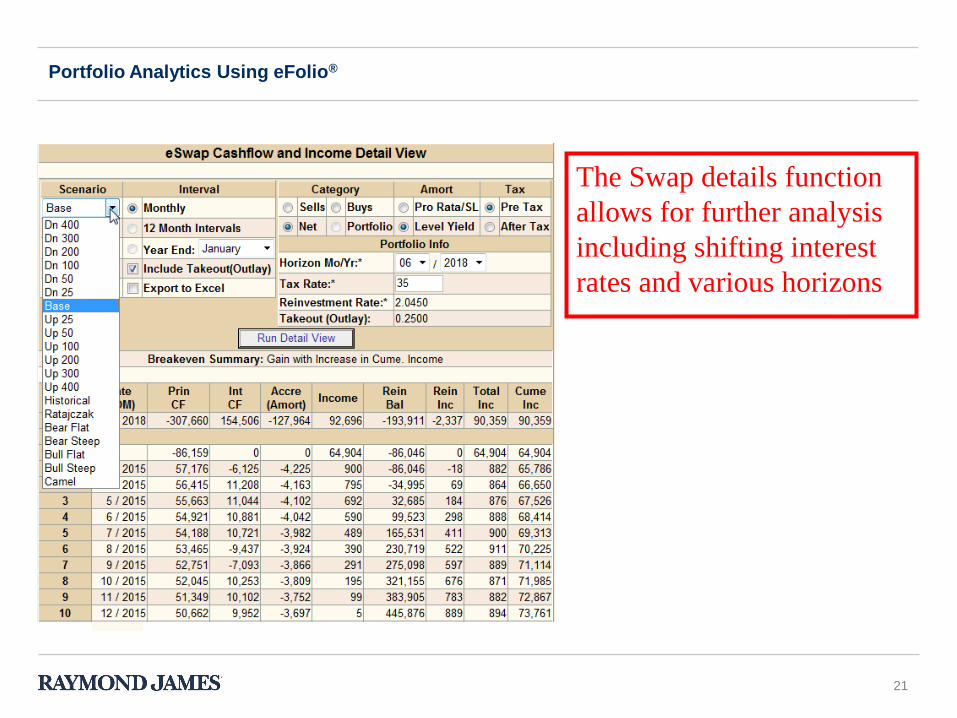
Portfolio Analytics Using eFolio®

6
User Statistics
• 9,431 Enrolled Users
• 6,399 Portfolios
• $2,599,214,473,144 in Current Par
• $406,190,728 Average Portfolio
• Over 70,000 Individual Calculations Performed Daily
Portfolio Analytics Using eFolio®

7
Portfolio Analytics Using eFolio®
Interactive View of Portfolio Characteristics

8
Portfolio Interest Rate Sensitivity & Projected Cashflows
Portfolio Analytics Using eFolio®
9
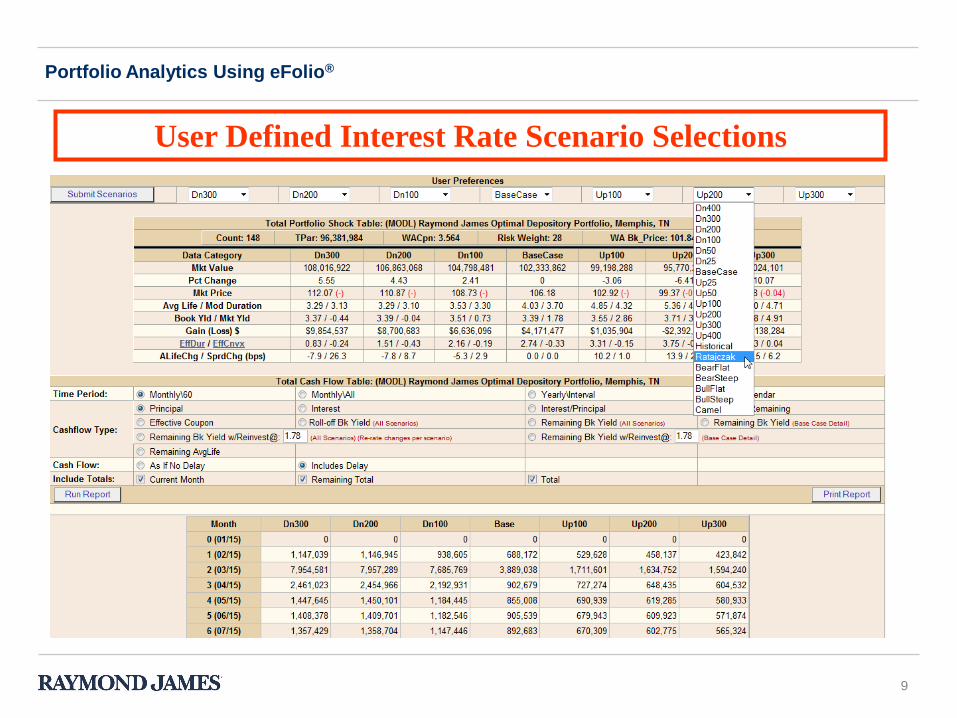
User Defined Interest Rate Scenario Selections
Portfolio Analytics Using eFolio®

10
Portfolio Analytics Using eFolio®
Interest Rate Sensitivity & Cashflows

11
Single Bond Analytics
• Single Bond Analytics
– Allows the capability to analyze securities on demand based on user
defined criteria (price, speed and/or interest rate assumptions, etc.)
Portfolio Analytics Using eFolio®
12
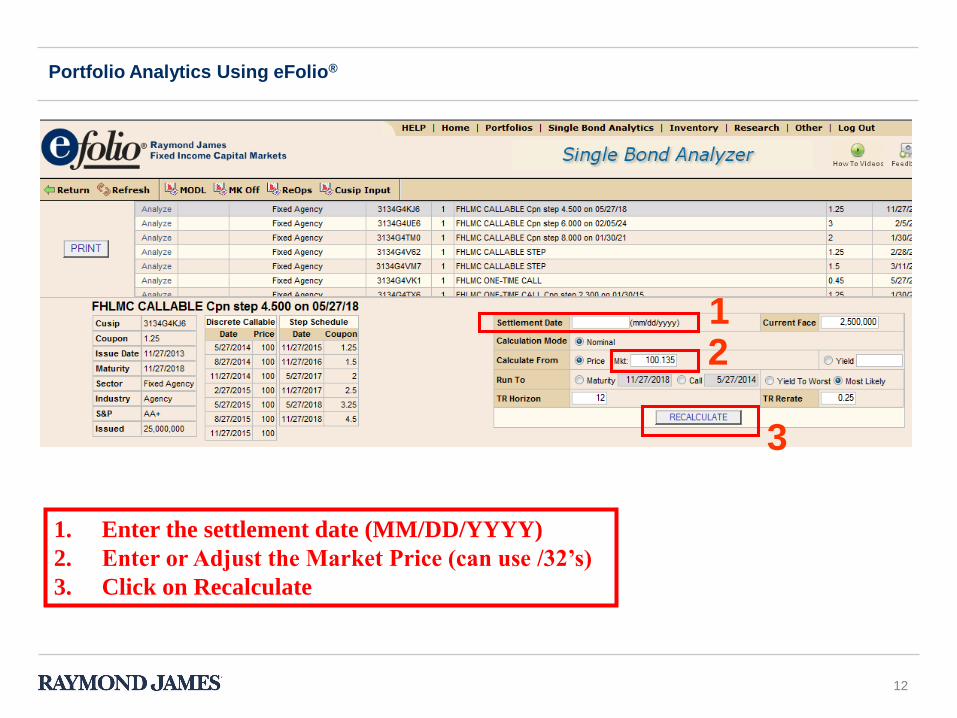
1. Enter the settlement date (MM/DD/YYYY)
2. Enter or Adjust the Market Price (can use /32’s)
3. Click on Recalculate
Portfolio Analytics Using eFolio®
112
3

13
Portfolio Analytics Using eFolio®
Click to view
shocked
data environments

14
eSwap Capabilities
• eSwap Functions:
– Ability to utilize individual settlement dates for each
security
– User has the ability to specify custom prepayment
estimates for each mortgage-related security
– One-click ability to include/exclude securities to evaluate
different strategies
Portfolio Analytics Using eFolio®

15
Portfolio Analytics Using eFolio®
eSwap – Pre-Purchase Compliance

16
Portfolio Analytics Using eFolio®

17
Portfolio Analytics Using eFolio®

18
In one step, the user modifies any information needed and chooses
calculation models and other optional details. When setup is complete,
the entire swap is calculated and results displayed.
Portfolio Analytics Using eFolio®

19
When the calculations are completed, the screen refreshes and displays
the results of the simulation
Portfolio Analytics Using eFolio®
20
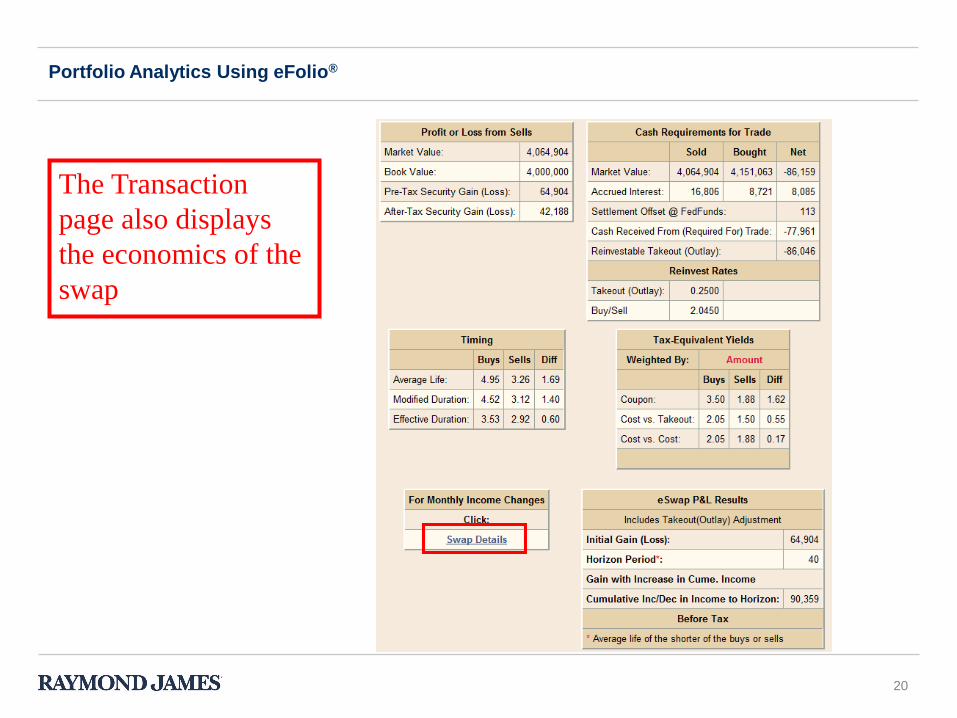
The Transaction
page also displays
the economics of the
swap
Portfolio Analytics Using eFolio®
21
The Swap details function
allows for further analysis
including shifting interest
rates and various horizons
Portfolio Analytics Using eFolio®

22
Once a swap is simulated, the user can view the impact of the transaction
to the overall portfolio
Portfolio Analytics Using eFolio®
23
DISCLAIMERS AND DISCLOSURES
The information contained herein is based on sources considered to be reliable but is not represented to be complete
and its accuracy is not guaranteed. The opinions expressed herein reflect the judgment of the author at this date and are
subject to change without notice and are not a complete analysis of every material fact respecting any company, industry
or security Raymond James & Associates, Inc. and affiliates and their officers, directors, shareholders and employees
and members of their families may make investments in a company or securities mentioned herein before, after or
concurrently with the publication of this report. Raymond James & Associates, Inc. may from time to time perform or
seek to perform investment banking or other services for, or solicit investment banking or other services from any
company, person or entities mentioned herein. Neither the information nor any opinion expressed herein constitutes a
solicitation for the purchase or sale of any security. Raymond James & Associates, Inc. makes no representation as to
the legal, tax, credit, or accounting treatment of any transactions mentioned herein, or any other effects such
transactions may have on you and your affiliates or any other parties to such transactions and their respective affiliates.
You should consult with your own advisors as to such matters.