presents - 1e-index · presents ©2000 amp/ppi /randolph craft advanced management & planning...
TRANSCRIPT

PACIFIC PLANNING INSTITUTE
WWW.PLANINPARADISE.COM
93 B PUAKO BEACH DRIVE, SUITE 100 KAMUELA, HAWAII' 96743PH 808 882-4092 E-MAIL [email protected]
presents
©2000 AMP/PPI /Randolph Craft
ADVANCED MANAGEMENT & PLANNING
THE PACIFIC PLANNING INSTITUTE
QUALITY TEAM MANAGEMENT
dba
PACIFIC PLANNING INSTITUTE QTM ©2000 RANDOLPH L. CRAFT 2
Vision
America was founded on a work ethic and a set of definite principles. These principles
demanded loyalty, teamwork, and a commitment to the excellence available at the time.
Early Americans succeeded in mastering both the agricultural and the industrial
"revolutions." Early Americans demonstrated to the world that commitment to a
vision, to technological advancement, and to teamwork does produce extraordinary
results.
The 1980’s have unveiled major economic shifts in world trading. This has a been a result
of high-speed communication and rapid technological acceleration. A paradigm shift in
business philosophy, socioeconomic opportunity, and trade is an emerging trend for the
90’s — and our future! We are growing aware of our changing global economic and
ecological climate. This change is linked primarily to education and training. The
discipline to strive for excellence is paramount in a quest to provide superb business
leadership.
This paradigm shift, “The Contextual Revolution” has arrived. It is being implemented in
many organizations worldwide. We describe this contextual revolution as a "synergistic"
combination of business disciplines and values. These values include teamwork, product
quality, excellent customer service, and the need to satisfy human relationships
through effective communication. All the while, we must maintain support for the
ecological balance of our "spaceship earth" — the source of livelihood for all life as we
know it.
Over the next several years we all have the opportunity to rise to the call of this
"Contextual Revolution." The benefits for those who participate will include high
dividends both personally and financially. The time for participation is, and has been for
a long time, now.
Pacific Planning Institute has prepared, for nearly a decade, for the changes that now
find themselves manifest.
The mission of Pacific Planning Institute is to promote and facilitate teamwork in all of
life's endeavors, to encourage individuals to maximize their ever increasing potential, to
co-create working environments that foster all forms of excellence as the operating
standard, and to make the workplace a contributing and positive part of life — to
improve the quality of people's lives through their work.
CONTENTS
VISION ................................................................................................................ 2
INTRODUCTION & OVERVIEW
QTM QUALITY TEAM MANAGEMENT ............................................................... 4
QUALITY PROGRAMS ...................................................................................... 5
TEAM - THE TECHNOLOGY OF TEAM BUILDING .................................................... 7
MANAGEMENT - STRATEGIC AND OPERATIONAL PLANNING AND MANAGEMENT ............ 8
A TYPICAL QTM INSTALLATION PROCESS: ....................................................... 10
BENEFITS ................................................................................................... 12
QUALITY PROGRAMS
A BRIEF INTRODUCTION TO STATISTICAL QUALITY CONTROL .............................. 14
INTRODUCTION TO THE DEMING QUALITY MANAGEMENT PROGRAM ................... 18
THE DEMING MANAGEMENT METHOD ........................................................... 19
THE FOURTEEN POINTS: .............................................................................. 20
THE SEVEN DEADLY DISEASES: ..................................................................... 21
QUALITY = PROFITABILITY (GRAPHIC)................................................ 22
FOUNDATION FOR MANAGEMENT OF QUALITY IN THE WESTERN WORLD .............. 23
THE DEMING MANAGEMENT METHOD BY MARY WALTON ................................. 23
FAULTY PRACTICE ........................................................................................ 30
BETTER PRACTICE ....................................................................................... 31
TEAM BUILDING
TEAM BUILDING INTRODUCTION .................................................................... 32
MANAGING MOMENTUM ............................................................................... 33
THE HUMAN SIDE OF JAPANESE ENTERPRISE BY HIROSHI TANAKA ....................... 35
QTM SEMINAR CHARTS (GRAPHICS) .............................................................. 41
PLANNING & MANAGEMENT
STRATEGIC ALIGNMENT AND PLANNING ........................................................... 45
SUMMARY .................................................................................................. 57
THE CHALLENGE ........................................................................................ 59

PACIFIC PLANNING INSTITUTE QTM ©2000 RANDOLPH L. CRAFT 4
Being competitive in today’s global market-
place takes more than delivery of a quality
product — on time and on budget. We must
now develop and create a work environment
of a higher quality. This new work environ-
ment will transform the human experience of
work and the role that work plays in life. Joy,
enthusiasm, pride of ownership, partnership,
teamwork, and fun are all part of this new
work environment and experience. It is made
possible by a well implemented program of
continuous quality improvement and a quest
for excellence.
QTM, Quality Team Management, improvesthe quality of people’s lives through theirwork.
• Quality programs increase market share,
increase profit, and decrease costs. Quality
programs continually educate and improve
the quality of the work experience for all.
• Team building improves productivity and
morale. Team building improves the quality
of the work experience through healthy com-
petition, acknowledgement, and fun.
• Planning and management skills add to the
bottom line through efficiency. Thirty year
studies reveal a 15 to 25% savings on all
resources used by projects that are well
planned and managed. Those resources are
materials, money, time, and the various hu-
man energies used to complete any task.
QTM, Quality Team Management, is a systemthat improves the creation and delivery ofproduct and service.
QTM, Quality Team Management, changes at-titudes about the process of work. QTM canassist American business in regaining a moreeffective position in the global marketplace.
QTM, Quality Team Management, is a uniquesystem and philosophy of business. QTM syn-ergistically integrates sound and proven man-agement technologies into a new and excitingbusiness management system. These compo-nents are:
1. Statistical Quality Control procedures and
methodology co-created developed by Dr.
W. Edwards Deming. These technologies
have been used by Japanese and German
industry since the end of World War II.
The Deming Quality Award is the most
prestigious industrial award in the world.
2. The accumulated technology of team build-
ing including the process of human values
fulfillment and the science of linguistics.
3. Planning & Management systems, PERT -
Planning Evaluation & Review Technique,
developed by the Navy and Lockheed Air-
craft in the late 1950s for the Polaris Missile
program and used by NASA and major
project managers and contractors today.
Each of these components on their own pro-
duce outstanding results for their users. Used
in concert, including consideration of the in-
tended product, process, and personal values,
these components add to each other such that
the final product is much more than the sum of
the parts - the definition of Synergy. It works.
QUALITY TEAM MANAGEMENT

PACIFIC PLANNING INSTITUTE QTM ©2000 RANDOLPH L. CRAFT 5
If it doesn'tadd value,it's waste.
Peopleworktogetherbetter whenthey canspeak thesamelanguage.
COMPONENT 1 - QUALITY PROGRAMS
• OPERATIONAL DEFINITIONS
People work together better when theycan speak the same language.
Language is one of the doors to intellec-tual experience and distinctions. Differ-ent words mean different things to differ-ent people. “Picnic” to one person is“Wine, good food, sunshine, and thou”while to someone else “Picnic” meansrain, mud, and poison ivy. The internalrepresentations that a person has for aword depends upon the personal experi-ences associated with that word.
Most environments, including businessesand industries, have a “short hand” lan-guage for common concepts, products,and procedures as well as a number ofcommon words and phrases that are usedin the process of communication withinthat environment. In most business or-ganizations that have not formulated andpublished a set of operational definitionsfor their commonly used words andphrases, there exists as many differentdefinitions as there are people.
Creating the list of common words andphrases used in the target environment isthe first step. The best process for creat-ing this list is creating process charts forthe functions of the various divisions, de-partments, and/or products of the busi-ness. (Process charts will be discussedlater in this outline)
After the words and phrases are listed anddefinitions created, we ask the followingquestions:
1. What is the criteria to be applied?
2. How will the criteria be satisfied?
3. How will we interpret the results ofthe test?
4. Are all the terms in the operationaldefinitions clearly defined?
Example — Waste: (Operational defini-tion from Toyota)
— Anything other than the minimumamount of equipment, materials, parts,space, and worker's time which are abso-lutely essential to add value to the prod-uct.
IF IT DOESN'T ADD VALUE, IT'S WASTE.
• Toyota's Seven Areas of Waste
1. Waste from over production.
2. Waste from waiting time.
3. Transportation waste.
4. Processing waste.
5. Inventory waste.
6. Waste of motion.
7. Waste from product defects.
8. Waste of under-utilization of peopleskills and capabilities (Note: not onToyota's list; however it is implicit intheir management actions.)
The basic method to improve a system isto work co-operatively on:
1. how to measure each process
2. how to reduce variation and/or time(simplify, combine, or eliminate).
In 1988, Toyota's employee "suggestionprogram" generated over a million sug-gestions on how to remove waste. Over90% of these suggestions were adopted.
Creating operational definitions is the firststep in a classical quality control process.

PACIFIC PLANNING INSTITUTE QTM ©2000 RANDOLPH L. CRAFT 6
How mighta houselook ifinstead ofblueprintsthe con-tractor wasgiven awrittendescrip-tionof what thehouseshould looklike?
• PROCESS CHARTING
Process Charting can be thought of asmap making.
If we want to get from one place to an-other, either we know the way or we haveto find out how to get there. There arefour basic ways we will do this:
• We can ask directions from someonewho knows and try to rememberwhat s/he said.
• We can ask directions from someonewho knows and write the directions(job description).
• We can ask directions from someonewho knows and draw a map.
• We can look at a professionally mademap or have one drawn.
Another example of process charting isblueprints for building. How might ahouse look if instead of blueprints thecontractor was given a written descriptionof what the house should look like?
A process chart (PERT chart or flow chart)is created by finding out what the destina-tion (goal) is, finding out what all of thecheck points (milestone events) are alongthe way, how much time and fuel (re-sources) will be used between the desig-nated checkpoints, and who will be thedriver from point to point (responsibili-ties). Anyone who has seen John Maddendraw his X’s & O’s on the screen during afootball game has seen a process chart.
Creating a chart diagram of a businessprocess makes it clear to all exactly whatthat process is. The process of creatingthe chart diagram is where and whenmost of the key words to be used in theoperational definitions will surface. Theprocess chart is the skeleton upon whichthe management of the process can beplaced.
• QUALITY ATTRIBUTES
The quality attributes of a product, proc-ess, or a project are the defined elementsfrom which quality measurements can betaken. The QTM system looks for qualityattributes in three areas:
1. Product
Quality attributes of product are the physi-cally measurable criteria (size, diameter,thickness, etc.) that must be present forthe item to be accepted. This is the tradi-tional use of statistical quality control pro-cess found in manufacturing and relatedindustries.
2. Process
Quality attributes of process are the crite-ria defined and established by the peopleinvolved in the process of completing anytask (on time, ease of communication,efficient, etc.) Process attributes are moreinterpretational, deal with the quality ofthe “feel” of the process, and is moreappropriate in the service industries.
3. Values
Applying Deming statistical quality con-trol methodology to the measurement ofhuman values fulfillment on the job formsa foundation for the QTM system intowhich most people easily enroll. System-atic and regular attention to the values ofthe people involved in the process orproduct being monitored is one of theelements that gives QTM its unique posi-tion as a management system. It is thiselement that provides the personal depththat is absent in most business manage-ment available today.

PACIFIC PLANNING INSTITUTE QTM ©2000 RANDOLPH L. CRAFT 7
• TEAM - THE TECHNOLOGY OF TEAM
BUILDING
The word team is used often in the worldof business as an important element yetthere is little formal training available inmost business educational process. QTMteam building starts with some of thebasics that we find get left out of mostbusiness team building:
1. For someone to want to be on a team,there has to be a game that the poten-tial team member wants to play.
2. There must be some form of “super-bowl” that the team members want to“win” if the team is to go beyond thenorm.
3. There must be planned and budgetedteam events for review and evalua-tion as well as celebration and ac-knowledgement if team momentumis to be built and maintained.
4. The personal values of the individualteam members are known, acknowl-edged, and respected by all teammembers.
To these basics, we add team building“instruments” and psychological and lin-guistic technology from leading institu-tions and established leaders in their re-spective fields.
• QTM VALUES INVENTORY
“When our values are clear, our choicesare easy.”
The QTM values inventory is an instru-ment to measure the existing businessconditions for values fulfillment. The fre-quency of samplings is dependent uponthe specific situation to which the processis applied.
Following are the basic activities in theQTM Values Inventory:
1. Group or individual values inventoryw/ current perception of company -10 highest priorities:a. countb. averages etc.
2. Individual values inventory form to befilled out each cycle. Brief explana-tion for each entry. Detailed explana-tion for extreme ratings.
3. Quality control charts.
BENEFITS:
• Knowledge of individual
• Composite perception of company
• Compare to culture statements of com-pany
• Composite of existing values residentin company
• Attributes for control measurements
• Enhanced performance of people
Forsomeone towant to beon a team,there has tobe a gamethat peoplewant toplay.
“When ourvalues areclear, ourchoices areeasy.”

PACIFIC PLANNING INSTITUTE QTM ©2000 RANDOLPH L. CRAFT 8
• MANAGEMENT - STRATEGIC AND OPERATIONAL
PLANNING AND MANAGEMENT
QTM planning and management systemsare based upon classical PERT (ProjectEvaluation & Review Technique) technol-ogy developed in the late 1950’s by theNavy and Lockheed Aircraft for the Polarismissile program. The QTM planning sys-tem adds modern linguistic communica-tion technology and current personal com-puter programs to classical PERT meth-ods. The result is a planning and manage-ment system that is easy to implementand appropriate for most current circum-stances.
In this age of technology and service, it's afact that there are less than 100 profes-sional operational planning firms listed inall the Yellow Pages in the United States.There is a growing trend towards plan-ning awareness marked by growing num-bers of articles in business publicationsand new computer planning software. Butpurchasing planning software does notmake one a planner any more that buyinga piano makes one a piano player. Plan-ning is a science that requires study, train-ing, and practice.
In a recent study designed to determinethe most important management needsfacing private companies, 550 executivesresponded that when they do turn tooutside professional groups, an accoun-tant is the primary business advisor. Nextare bankers and attorneys.
But for state-of-the-art planning, one ofthe most important aspects of business,they don't look outside! In the rare caseswhen they do look to outside help, theylook to an accountant. An accountant isusually – an accountant – not a planner!
The projectteamcomestogether ona plan thatis, by groupcon-sensus,realisticand attain-able.
There areless than100 pro-fessionaloper-ationalplanningfirms listedin all theYellowPages inthe UnitedStates.
Unlike computer software, QTM planningstarts by literally creating the final mo-ment of success -- the project's comple-tion. Then through modern linguistictechnology, we recreate exactly what ittook to get there.
Unlike software, it's more like soft sell toyour management team and/or employ-ees. Everyone is involved before weintroduce our unique computer gener-ated models -- the "blueprints" of how to"build" your project per plan, on time, andwithin budget.
PACIFIC PLANNING INSTITUTE QTM ©2000 RANDOLPH L. CRAFT 9
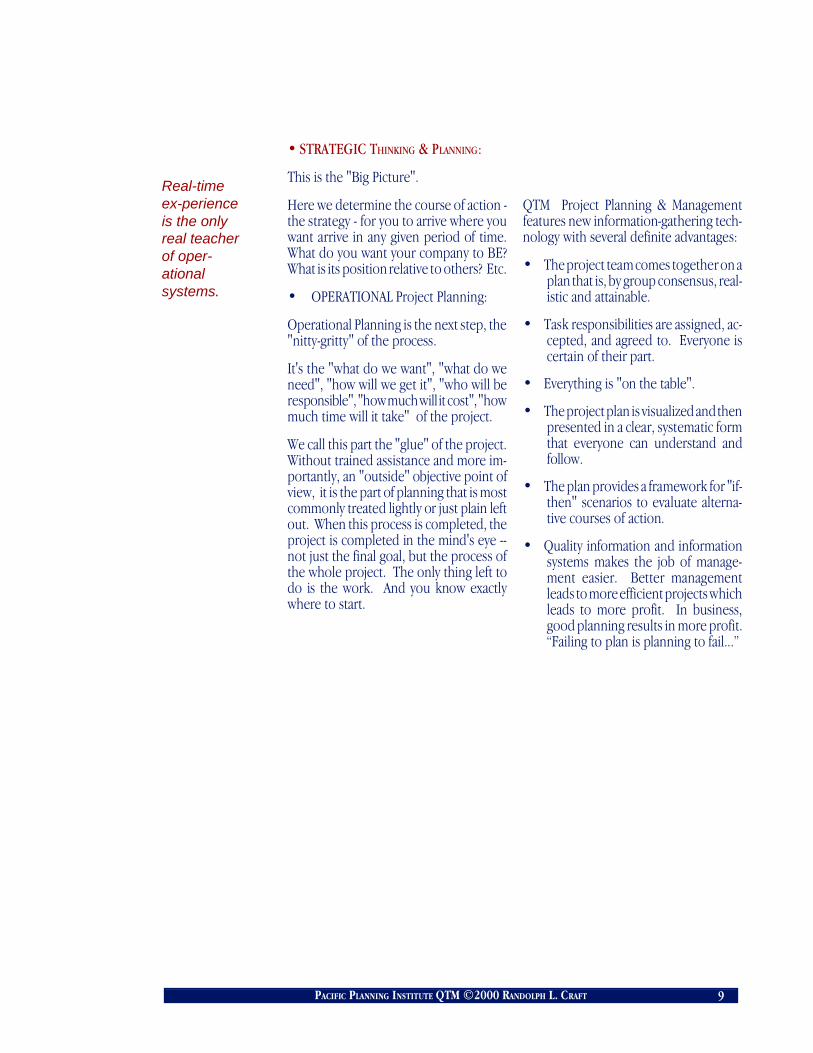
• STRATEGIC THINKING & PLANNING:
This is the "Big Picture".
Here we determine the course of action -the strategy - for you to arrive where youwant arrive in any given period of time.What do you want your company to BE?What is its position relative to others? Etc.
• OPERATIONAL Project Planning:
Operational Planning is the next step, the"nitty-gritty" of the process.
It's the "what do we want", "what do weneed", "how will we get it", "who will beresponsible", "how much will it cost", "howmuch time will it take" of the project.
We call this part the "glue" of the project.Without trained assistance and more im-portantly, an "outside" objective point ofview, it is the part of planning that is mostcommonly treated lightly or just plain leftout. When this process is completed, theproject is completed in the mind's eye --not just the final goal, but the process ofthe whole project. The only thing left todo is the work. And you know exactlywhere to start.
QTM Project Planning & Managementfeatures new information-gathering tech-nology with several definite advantages:
• The project team comes together on aplan that is, by group consensus, real-istic and attainable.
• Task responsibilities are assigned, ac-cepted, and agreed to. Everyone iscertain of their part.
• Everything is "on the table".
• The project plan is visualized and thenpresented in a clear, systematic formthat everyone can understand andfollow.
• The plan provides a framework for "if-then" scenarios to evaluate alterna-tive courses of action.
• Quality information and informationsystems makes the job of manage-ment easier. Better managementleads to more efficient projects whichleads to more profit. In business,good planning results in more profit.“Failing to plan is planning to fail...”
Real-timeex-perienceis the onlyreal teacherof oper-ationalsystems.
PACIFIC PLANNING INSTITUTE QTM ©2000 RANDOLPH L. CRAFT 10
Qualitycontrolsystems andcharts workbest whenused by thepeople doingthe work.
There arethree com-ponents toongoingcoopera-tionand teammo-mentum:
5.Ongoing QTM program
Real-time experience is the only realteacher of operational systems. The on-going QTM program allows for the moni-tored tracking of the various project flowcharts that are implemented as the pro-gram grows. This gives the assigned teamleaders and project managers the oppor-tunity to have expert advice to guide themwhile learning the systems. The ongoingprogram also creates the “frequency ofinteraction” that is necessary to obtaincooperation with the various people thatwill interface with the QTM systems.
• Monitor / update project(s)department(s) QTM process flowchart(s)
Process charts become antiquated anddiminish in value if they are not used ascurrent project tools. Periodical updatingkeeps the value of the plan alive and theproject on track.
Ongoing educational program:
The Deming Management Method has asone of its foundations continual educa-tion of all people in the company. Themore knowledge that is invested in acompany’s people, the better educatedthose people are and the better the com-pany becomes.
On-the-job training is listed by Dr. Dem-ing as one of the seven deadly diseases ofbusiness. A policy of on-the-job trainingcreates a continual dilution of formal jobrequirements towards the last person’sinterpretations of that job.
Formal job training and formal job relatededucation is the solution to the problem.
The QTM ongoing educational series ar-ranges for and/or conducts the appropri-ate educational programs necessary tomeet the needs of the organization.
A TYPICAL QTM INSTALLATION PROCESS:
1. Commitment to QTM program• Determination of “flag ship” arena for
QTM implementation• Inventory of desired changes (generic)• Establish performance criteria• Development of specific staged QTM
implementation program & proposal
2. Contract• Develop/up date/restate company pur-
pose/mission statement• Company values inventory• Assignment of “flagship” project or com-
pany department for QTM integration• Announcement to company/depart-
ment of commitment to QTM program
3. Company/department Introduc-tion
• Introduction/enrollment of company/department key persons
• Company/department workshop(s) tointroduce QTM
4. QTM department implementation• Project/department process flowchart• Assignment/development of project/
department team & team leaders• Team/team leader workshop(s)/
training(s) - QTM process• Development of project/department
process flowchart(s)• Development of project/process op-
erational definitions• Project/department Quality/Team at-
tributes development• Development of project/department
process quality attributes• Development of project/department
team building requirements• Team member values inventory• Monitoring Systems
PACIFIC PLANNING INSTITUTE QTM ©2000 RANDOLPH L. CRAFT 11
QUALITY
Quality control systems and charts workbest when used by the people doing thework. Therefore continuing education inthe area of quality control is one of thesubjects of ongoing education.
The quality educational series includes:
• The language of quality attributes -oerational definitions
• Charting - Process, Fishbone, Control,Flow, Logic, and more
• Shewhart/Deming statistical qualitycotrol basic philosophy and history
• The importance of human values inthe workplace and their measure-ment.
TEAM
Team/Teamwork. What is it? How is itdefined? How can it be measured? Howcan it be created? What breaks it down?
In the teamwork portion of QTM ongoingeducation, we look at the components ofcooperation, the integration of individualand group values, the study of synergy,and the dynamics of the element of fun inthe workplace. People are introduced tomany sources of formal team buildingexercises and measurement devices.
The QTM Values Inventory takes place inthis series.
MANAGEMENT
“The Essence of Planning” teaches thecomponents of planning:
• Milestone Events
• Activities
• Resource loading and leveling
• Timelines
• Responsibilities
• Project cash flow
• Management linguistics
• Flowcharting
• PERT charts
• Leadership
ONGOING TEAM BUILDING EXERCISES & ACTIVITIES
There are three components to ongoingcooperation and team momentum:
1. Brightness of the future - the vision orgoal
2. Frequency of interaction - getting to-gether as often as possible or appro-priate
3. Realistic consequence - the not-so-bright consequence of failing to workwell together
The ongoing team building exercises &activities satisfies the conditions for coop-eration while providing the participantswith a wealth of new instruments andinformation about team building and lead-ership.

PACIFIC PLANNING INSTITUTE QTM ©2000 RANDOLPH L. CRAFT 12
BENEFITS
QUALITY
Quality programs increase market share, increase
profit, and decrease costs while educating the
worker and improving the quality of the work
experience for all.
TEAM
Team building improves productivity and com-
petitiveness while improving the quality of the
work experience through healthy competition,
acknowledgement, and fun.
MANAGEMENT
Improving the planning and management skills
adds to the bottom line through efficiency. Thirty
year studies reveal a 15 to 25% savings on all
resources used by projects that are well planned
and managed. Those resources are materials,
money, time, and the various human energies
used to complete any task.
QTM, QUALITY TEAM MANAGEMENT, IMPROVES THE
QUALITY OF PEOPLE’S LIVES THROUGH THEIR WORK.
QUALITY TEAM MANAGEMENT
QUALITY PROGRAMS

PACIFIC PLANNING INSTITUTE QTM ©2000 RANDOLPH L. CRAFT 14
QTMdefinesQuality as“theabsence ofvariation inanyproductionprocess.”
The twingoals ofincreasedproductivityandvirtuallyuniformdelivery ofproduct/service canbe attainedwith today’stechnologyandmethod-ology
A BRIEF INTRODUCTION TO STATISTICAL QUALITY CONTROL
One axiom has been apparent from the begin-ning of man’s efforts to make things. Thataxiom is: NO TWO THINGS ARE ALIKE; THEYWILL ALWAYS VARY. Any one who has evertried to work with supposedly identical itemswill eventually come to this discovery.
Recognition of variation is not enough. Some-thing must be done about variation if compo-nents are to work together properly. Exactlywhat can and should be done about variationis the question that the study of statisticalquality control attempts to answer.
If the managers and employees of a companywork together to implement the philosophyof operation outlined in the QTM qualitysystems, the twin goals of increased produc-tivity and virtually uniform delivery of prod-uct/service can be attained with today’s tech-nology and methodology.
QTM quality systems were developed from astudy of statistical quality control methodsand procedures created by Walter Shewhartin the 1920’s, and expanded and implementedby W. Edwards Deming in the second half ofthe 20th century. Dr. Deming is given creditfor the founding business principles thatvaulted Japan into international economicdominance in the last 20 years.
QTM defines Quality as “the absence of vari-ation in production process.” A state of virtu-ally uniform product/service and/or servicedelivery can only be achieved through thecareful study of the sources of variation in aprocess, and through action by managementto reduce, or eliminate entirely, sources ofextraneous or excessive variation.
Management’s daily task must be to learn asmuch as possible about the sources of varia-tion affecting the product/service, and thento take the necessary steps to reduce thevariation. Unless this is done, the old method
of inspect and sort, rework and resort, willguarantee a lack of progress, low productivity,and an increasingly noncompetitive position.
The study of variation yields a basic discovery:WHILE EVERY PROCESS DISPLAYS VARI-ATION, SOME PROCESSES DISPLAY CON-TROLLED VARIATION, AND OTHERS DIS-PLAY UNCONTROLLED VARIATION.
Controlled variation is characterized by stableand consistent patterns of variation over time.Dr. Deming called this form of variation Com-mon Causes. Common Causes of variation ina production process are causes of variationthat exist because of the production system orthe way that system is managed. They ariseout of the process, or out of the way theprocess is organized and operated. Becausethey are part of the system, they are theresponsibility of those who control the sys-tem: the managers, and specifically, the toplevel of management. Common causes of vari-ation can only be removed through action bymanagement.
Uncontrolled variation is characterized by apattern of variation that changes over time.Dr. Deming called this form of variation Spe-cial Causes. Special Causes of variation arecauses that are localized in nature. They arenot part of the overall system, and should beconsidered as abnormalities. Often they willbe specific to a certain operator, a certainmachine, or a certain batch of material.
There are two basic ways to improve theprocess of production.
When a process displays controlled variation(displaying common causes), it should bethought of as stable and consistent. Thevariation present in the process consists onlyof that which is inherent in the process itself.Therefore, to reduce the variation, the pro-cess itself must be changed.

PACIFIC PLANNING INSTITUTE QTM ©2000 RANDOLPH L. CRAFT 15
When a process displays uncontrolled vari-ation (displays special causes), it is changingfrom time to time. It is both inconsistent andunstable. This instability creates excessivevariation that has nothing to do with the waythe process was intended to operate. There-fore, the way to improve this process is by theidentification and removal of the assignablecauses.
Notice that these two approaches to processimprovement are fundamentally different.
As philosophical guides for production, theengineering concept of variation and theShewhart/Deming concept of variation havenothing in common. They have different ob-jectives and different results. The engineeringconcept of variation has the object of meetingspecifications. This naturally results in prod-uct/services that vary as much as possible,because anything within “specs” is consid-ered “good enough.” In contrast, the object ofthe Shewhart/Deming concept is process con-sistency, and this naturally results in product/services and services that are as consistent aspossible. Therefore, it makes no sense to tryto reconcile these two concepts of variation.Management must adopt one or the other asa guiding principle: conformance to specifica-tions, or continuous process improvement.Dr. Deming states it this way, “It is goodmanagement to reduce the variation of anyquality characteristic (say thickness, or mea-sure of performance), whether this character-istic be in a state of control or not, and evenwhen few or no defects are being produced.Zero defects is not good enough.”
Management has been trying the engineeringconcept since the beginning of the industrialrevolution. After almost 200 years, the goalhas not been met. The legacy of focusingsolely upon conformance to specificationshas been a lack of progress. There is noreason to believe that it will be different in thefuture.
The Japanese experience has proven the ef-fectiveness of continuous process improve-ment. Conformance to specifications hasbecome no more than a benchmark on thepath of continuous improvement.
As long as management has the conformanceto specifications as its goal, it will be unable toreach that goal. If the actions of managementsignals that meeting specifications is satisfac-tory, the product/service will invariably fallshort. Total conformance to specificationscomes only by aiming at continuous processimprovement. Thus, it is only when manage-ment supports, in both work and deed, thegoal of continuous improvement, that it willbegin to see increases in both quality andproductivity.
CONTROL CHARTS
If continuous process improvement is thegoal, how is progress to be measured? Theproduction of 100% conforming product/ser-vice is one benchmark. Achieving a state ofstatistical control for the process is another.Neither of these achievements is permanent.Both are subject to reversal. Taken together,these process characteristics identify fourpossibilities that apply to every productionprocess:
1. The Ideal State
A process in the ideal state is producing 100%conforming product/service and is in statisti-cal control. The ideal state satisfies four con-ditions:
1. The process must be inherently stableover time.
2. The manufacturer must operate the pro-cess in a stable and consistent manner.The operating conditions cannot be se-lected or changed arbitrarily.
3. The process average must be set andmaintained at the proper level.
4. The natural tolerance of the process mustbe less than the specified tolerance for theproduct/service.
There aretwo basicways toimprove theprocess ofproduction.
As long asmanage-ment hastheconform-ance tospecifi-cations asits goal, itwill beunable toreach thatgoal.
"Zerodefects isnot goodenough.”
PACIFIC PLANNING INSTITUTE QTM ©2000 RANDOLPH L. CRAFT 16
The only way that a producer can know thatthese four conditions apply to his/her pro-cess, and the only way that s/he can maintainthese conditions day after day, is by the use ofprocess control charts. Moreover, once aprocess is in the Ideal State, the continued useof control charts will naturally result in con-tinuing process improvement. This will leadto ever more uniform product/service, whichwill yield lower costs and greater productivity.
2. The Threshold State
A process in the threshold state will be instatistical control, but it will be producingsome nonconforming product/service. Thetraditional solution of 100% inspection is notsatisfactory because it is always imperfect. Aslong as any nonconforming product/service isproduced, some will always be delivered.Screening only reduces the amount of non-conforming product/service delivered. It can-not eliminate it entirely.
If nonconformity occurs because the pro-ducer is unable to set the process averageproperly, then a relatively simple procedurebased upon the principles of statistical infer-ence may be all that is needed. On the otherhand, if the nonconformity occurs becausethe natural variation in the process exceedsthe specified tolerance, the producer musteither change the specifications or changethe process variation. If the producer decidesto try to reduce the process variation, s/he willhave to remove some of the common causesof variation from the process. This means thats/he will have to modify the process itself.
Process control charts are the means by whichthese changes can be measured. They helpthe producer achieve a stable and consistentprocess, and help in moving the process fromthe Threshold State to the Ideal State.
3. The Brink of Chaos
Processes in the Brink of Chaos state are outof statistical control even though they areproducing 100% conforming product/service.
Most people find this combination hard toimagine because they are accustomed to think-ing that any process which makes 100% con-forming product/service is okay. This statewill not last indefinitely. The process is out ofstatistic control (you wouldn’t know it unlessyou were using control charts). The problemwith any process that is out of control is thatit is subject to the effects of assignable causes.The producer will suddenly discover that s/heis in trouble, yet s/he will have no idea of hows/he got there, and no idea of how to get out.
The assignable causes “control” what the proc-ess will produce by determining when theprocess average or process dispersion willchange. Thus, there is no way to predict whatsuch a process will yield tomorrow, or nextweek, or even in the next hour. The changefrom 100% conforming product/service tosome nonconforming product/service cancome at any time, without the slightest warn-ing. When this change occurs the process willbe in the State of Chaos.
4. State of Chaos
The State of Chaos exists when a process isout of control and is producing nonconform-ing product/service. The lack of control meansthat the producer is confronted with a chang-ing level of nonconformity in the product/service stream. A producer in this state knowsthat s/he has a problem, but usually does notknow what to do to correct it. Moreover,efforts to correct the problem are ultimatelyfrustrated by the random changes in the proc-ess. No matter what is tried, nothing worksfor long because the process is always chang-ing. As a result, s/he finally despairs of everoperating the process rationally, and beginsto speak in terms of “magic” and “art.”
Ifcontinuousprocessimprove-ment is thegoal, howis progressto bemeasured?
Processcontrolcharts arethe meansby whichthesechangescan bemeasured.
Thecontinueduse ofcontrolcharts willnaturallyresult incontinuingprocessimprove-ment.
PACIFIC PLANNING INSTITUTE QTM ©2000 RANDOLPH L. CRAFT 17
Entropy
All processes belong to one of these fourstates. Processes do not always remain in onestate. It is possible for a process to move fromone state to another. In fact there is a univer-sal force acting on every process that willcause it to move in a certain direction. Thatforce is entropy. Entropy continually actsupon all processes to cause deterioration anddecay, wear and tear, breakdowns and fail-ures.
Entropy is relentless. Every process will natu-rally and inevitably migrate toward the Stateof Chaos. The only way this migration can beovercome is by continually repairing the ef-fects of entropy. This means that the effectsfor a given process must be known beforethey can be repaired.
On the other hand, it is very difficult to repairsomething when one is unaware of it. But ifthe effects of entropy are not repaired, it willcome to dominate the process, and force itinexorably toward the State of Chaos.
Commitment to Quality Programs
A dual problem confronts every producer.The effects of entropy and the presence ofassignable causes must be identified. Forwhile entropy forces a process toward theState of Chaos, the presence of assignablecauses creates a barrier to process improve-ment.
The only way a producer can ever meet thedual objectives of overcoming this barrier andcounteracting the effects of entropy is by theuse of process control charts. No other toolwill consistently and reliably provide the nec-essary information in a clear and understand-able form.
Therefore, any process operated without thebenefit of process control charts is ultimatelydoomed to operate in the State of Chaos.
Many people are able to describe what asample average represents, and some, ifpressed, could even interpret a sample me-dian. But this is usually the limit. People beginto get confused when asked to interpret ameasure of dispersion, and for most, the com-bined use of averages and standard deviationsto describe the behavior of data is nothing lessthan a mystery.
The study of probability theory is a disciplinein its own right. It requires a solid backgroundin mathematics, and can only be masteredwith much study. While an understanding ofprobability theory is necessary for the devel-opment of statistical techniques, and is help-ful in understanding how to apply the tech-niques in unusual situations, it is not a re-quirement for those who simply seek to usethe techniques. For most of these individuals,an intuitive understanding of probability willusually suffice.
QTM quality process uses the simple founda-tional elements of statistical control in a syn-ergetic concert with basic elements of projectmanagement and team building to render aneffective, easy to learn and use system ofadvanced business management practices.
When thischangeoccurs theprocess willbe in theState ofChaos.
- andbegins tospeak interms of“magic”and “art.”
Anyprocessoperatedwithout thebenefit ofprocesscontrolcharts isultimatelydoomed tooperate inthe State ofChaos.

PACIFIC PLANNING INSTITUTE QTM ©2000 RANDOLPH L. CRAFT 18
Why isWesternindustry onthedecline?
Everyonedoing hisbest is notthe answer.Everyoneis doing hisbest.
THE DEMING MANAGEMENT METHOD
INTRODUCTION TO THE DEMING QUALITY MANAGEMENT PROGRAM
Why is Western industry on the decline? Whyhas the balance of trade of the United States ofAmerica deteriorated year by year for twentyyears? The deficit in export of manufacturedgoods is worse than the overall figures indi-cate, as export of agricultural products hasbeen on the increase. We have people; wehave natural resources, experience. Why thedecline?
The cause of the decline is that managementhave walked off the job of management, striv-ing instead for dividends and goods perfor-mance of the price of the company’s stock. Abetter way to serve stockholders would be tostay in business with constant improvementof quality of product and of service, thus todecrease costs, capture markets, provide jobs,and increase dividends.
In the decade after the War [the SecondWorld War], the rest of the world was devas-tated. North America was the only source ofmanufactured products that the rest of theworld needed. Almost any system of manage-ment will do well in a seller’s market. Successin business in North America was confusedwith ability to manage.
Management in America (not all) have movedinto what I call retroactive management: fo-cus on the end-product–look at reports onsales, inventory, quality in and quality out, theannual appraisal of people; start the statisticalcontrol of quality and QC-Circles for opera-tions, unfortunately, detached from manage-ment’s responsibility; apply management bythe numbers, management by MBO. [Man-agement By Objective], work standards. Thefollies of the systems of management thatthrived in the expanding market that followedthe War are now all too obvious. They mustnow be blasted out, new construction com-menced. Patchwork will not suffice.
Everyone doing his best is not the answer.Everyone is doing his best. It is necessary thatpeople understand the reason for the trans-formation that is necessary for survival. More-over, there must be consistency of under-standing and of effort. There is no substitutefor knowledge.
A conjurer may pull a rabbit out of a hat, but hecannot pull quality out of a hat.
The biggest problem that most any companyin the Western world faces is not its competi-tors, nor the Japanese. The biggest problemsare self-inflicted, created right at home bymanagement that are off course in the com-petitive world of today.
Recognition of the distinction between a stablesystem and an unstable one is vital for man-agement. The responsibility for improvementof a stable system rests totally on the manage-ment. A stable system is one whose perform-ance is predictable. It is reached by removal,one by one, of special causes of trouble, bestdetected by statistical signals.
Understanding of a stable system discloseddevastation of people wrought by the annualappraisal of performance, futility of manage-ment by the numbers, management by MBO.A numerical goal that lies beyond the boundsof capability of a system will not be reachedexcept at the expense of some other activity inthe company, thus in the end, raising totalcost to the defeat of the company.
Teamwork in a company, except for puttingout fires, is impossible under the existingannual appraisal of performance. Everybody,once the fire is conquered, goes back to hisown life preserver, not to miss a raise in pay.
W. Edwards Deming
Washington D.C. / March, 10, 1986

PACIFIC PLANNING INSTITUTE QTM ©2000 RANDOLPH L. CRAFT 19
“He thatstarts withstatisticalmethodsalone willnot be herein threeyears.”
"whatmanage-ment canaccomplishusing theFourteenPoints “issoenormouscomparedto what yougetotherwise.”
THE DEMING MANAGEMENT METHOD
An Introduction to the Fourteen Points, the Seven Deadly Diseases, and Some Obstacles
There are those in his audience, Dr. Dem-ing realizes, who have come to learn solelyabout the statistical methods he taughtduring World War II and later to the Japa-nese. But, as he realized when those meth-ods evaporated from American industryduring the postwar period, statistical meth-ods are not enough. As he so often saystoday, “He that starts with statistical meth-ods alone will not be here in three years.”
As a statistician, Dr. Deming’s lifelongmission has been to seek sources of im-provement. Given the failure of statisticalmethods to endure, he pondered whatmight have caused that failure and how toavoid it in the future. He gradually con-cluded that what was needed was a bed-rock philosophy of management, withwhich statistical methods were consistent.He was ready with new principles to teachwhen the Japanese called him in 1950.And he continued to refine and enlargeupon them for the next three decades.
He has christened these “the FourteenPoints.” There were not, Dr. Deming says,always fourteen. When he first put them inwriting twenty years ago, there were tenor fewer. In his work with Japanese com-panies, problems were absent that hewould encounter only later in this coun-try. It was not necessary to counsel theJapanese to ‘drive out fear,’ as in PointNine, for example. Everyone was eager towork together for the recovery of thenation, and the employer was regardednot with suspicion but as a benefactor.
Employer and employee were “all onefamily,” as the relationship is often de-scribed. By the same token, his admoni-tion in Point Twelve to “remove barriers topride of workmanship” was not necessaryin Japan. “If anybody had some ideas onimprovement, there was nothing in theworld to stop him. He had everybody onhis side trying. It was not uphill work–batting your head against the wall to bringabout improvement. There was no fear ofimprovement,” Dr. Deming remembers.
It was in America that he became aware ofthe tyranny of fear, of barriers, of quotasand sloganeering. Their existence was re-flected in his Fourteen Points. A few yearslater came an extension– a “later awaken-ing,” as he calls the “Seven Deadly Dis-eases.” Dr. Deming is continuously hon-ing these principles. “I learn,” he says.“May not I learn?” For years, Point Sevenwas a mandate to “institute supervision.”He has decided of late that “leadership” isa better word.
The Deadly Diseases have recently beenrevamped–new ones have been addedand others dropped into a lesser statusinto a new category, Obstacles.” ThePoints, Diseases, and Obstacles constitutea broad prescription for reform. Each com-pany must work out its own adaptation,suitable to its corporate culture. It is nevereasy. But, Dr. Deming says, "what man-agement can accomplish using the Four-teen Points “is so enormous compared towhat you get otherwise.”

PACIFIC PLANNING INSTITUTE QTM ©2000 RANDOLPH L. CRAFT 20
The Fourteen Points:
1. Create constancy of purpose for im-provement of product and service. Dr.Deming suggests a radical new definition of acompany’s role. Rather than making money,it is to stay in business and provide jobsthrough innovation, research, constant im-provement, and maintenance.
2. Adopt the new philosophy. Americansare too tolerant of poor workmanship andsullen service. We need a new religion inwhich mistakes and negativism are unaccept-able.
3. Cease dependence on mass inspec-tion. American firms typically inspect a prod-uct as it comes off the line or at major stages.Defective products are either thrown out orreworked; both are unnecessarily expensive.In effect, a company is paying workers tomake defects and then to correct them. Qual-ity comes not from inspection but from im-provement of the process. With instructions,workers can be enlisted in this improvement.
4. End the practice of awarding busi-ness on price tag alone. Purchasing de-partments customarily operate on orders toseek the lowest-priced vendor. Frequently,this leads to supplies of low quality. Instead,they should seek the best quality and work toachieve it with a single supplier for any oneitem in a long-term relationship.
5. Improve constantly and forever thesystem of production and service. Im-provement is not a one-time effort. Manage-ment is obligated to continually look for waysto reduce waste and improve quality.
6. Institute training. Too often, workershave learned their job from another workerwho was never trained properly. They areforced to follow unintelligible instructions.They can’t do their jobs because no one tellsthem how.
7. Institute leadership, The job of a super-visor is not to tell people what to do or topunish them but to lead. Leading consists ofhelping people do a better job and of learningby objective methods who is in need of indi-vidual help.
8. Drive out fear. Many employees areafraid to ask questions or to take a position,even when they do not understand what thejob is or what is right or wrong. People willcontinue to do things the wrong way, or to notdo them at all. The economic loss from fear isappalling. It is necessary for better quality andproductivity that people feel secure.
9. Break down barriers between staffareas. Often staff areas–departments, units,whatever–are competing with each other orhave goals that conflict. They do not work asa team so they can solve or foresee problems.Worse, one department’s goals may causetrouble for another.
10. Eliminate slogans, exhortations, andtargets for the work force. These neverhelped anybody do a good job. Let people putup their own slogans.
11. Eliminate numerical quotas. Quotastake account only of numbers, not quality ormethods. They are usually a guarantee ofinefficiency and high cost. A person, to hold ajob, meets a quota at any cost, without regardto damage to the company.
12. Remove barriers to pride of work-manship. People are eager to do a good joband distressed when they can’t. Too often,misguided supervisors, faulty equipment, anddefective materials stand in their way. Thesebarriers must be removed.
13. Institute a rigorous program of edu-cation and retraining. Both managementand the work force will have to be educated inthe new methods, including teamwork andstatistical techniques.
14. Take action to accomplish the trans-formation. It will take a special top manage-ment team with a plan of action to carry outthe quality mission. Workers can’t do it ontheir own, nor can managers. A critical mass ofpeople in the company must understand theFourteen Points, the Seven Deadly Diseases,and the Obstacles.

PACIFIC PLANNING INSTITUTE QTM ©2000 RANDOLPH L. CRAFT 21
THE SEVEN DEADLY DISEASES:
1. Lack of constancy of purpose. A company that iswithout constancy of purpose has no long-range plansfor staying in business. Management is insecure, and soare employees.
2. Emphasis on short-term profits. Looking to increasethe quarterly dividend undermines quality and produc-tivity.
3. Evaluation by performance, merit rating, or an-nual review of performance. The effects of these aredevastating–teamwork is destroyed, rivalry is nurtured.Performance ratings build fear, and leave people bitter,despondent, and beaten. They also encourage mobilityof management.
4. Mobility of management. Job-hopping managersnever understand the companies that they work for andare never there long enough to follow through on long-term changes that are necessary for quality and produc-tivity.
5. Running a company on visible figures alone. Themost important figures are unknown and unknowable–the multiplier effect of a happy customer, for example.
Diseases 6 and 7 are pertinent only to the United States:
6. Excessive medical costs.
7. Excessive costs of warranty, fueled by lawyersthat work on contingency fee.
In addition to the Diseases, Dr. Deming identifies a lessercategory of Obstacles that thwart productivity. Theseinclude: neglect of long-range planning; relying on tech-nology to solve problems; seeking examples to followrather than developing solutions; excuses such as “Ourproblems are different,” and others.

PACIFIC PLANNING INSTITUTE QTM ©2000 RANDOLPH L. CRAFT 22
Market share and profitability are drivenmore by quality and service (caring) thanby price. As the Strategic Planning Insti-tute of Cambridge, Massachusetts, pointsout:
Businesses with superior quality and ser-vice (perceived by the customer as beingin the top quintal) average a ROI (Returnon Investment) of thirty-two per cent anda ROS (Return on Sales) of thirteen percent. Businesses deemed inferior in qual-ity and service (bottom quintal) average a
ROI of twelve percent and a ROS of fivepercent.
Figure 2. Effect of relative quality on re-turn on investment and return on sale(Source PIMs data base).
Note: The top quintal for quality and serv-ice has a ROI that is 2.7 times and a ROSthat is 2.4 times greater than companies inthe bottom quintal
Caring about quality and service is caringabout bottom line profits.
QUALITY = PROFITABILITY
Inferior 20 40 60 80 Superior0
10
20
30
40%
Relative Quality(percentile)
ROIROS

PACIFIC PLANNING INSTITUTE QTM ©2000 RANDOLPH L. CRAFT 23
FOUNDATION FOR MANAGEMENT OF QUALITY IN THE WESTERN WORLD
THE DEMING MANAGEMENT METHOD
BY MARY WALTON
Where are we? How are we doing? Let us thinkabout the U.S., or about all North America, notjust about our own selves, nor just about ourcompany, nor about our own community.How is the U.S. doing in respect to balance oftrade? The answer is that we are not doingwell.
North America has contributed much to newknowledge and to applications of knowledge.The U.S., by efficient product and naturalresources, beginning around 1920 and fordecades, put manufactured products in thehands of millions of people the world overthat could not otherwise have had them. Ourquality was good enough to create appetitefor our goods and services.
For a decade after World War II, North Americawas the only part of the world that couldproduce manufactured goods to full capacity.The rest of the industrial world lay in ruinsfrom the War. They were our customers, will-ing buyers. Gold flowed into Fort Knox.
1975
76 77 78 79 80 81 82 83 84 85 86 87 88
50
0
-100
-150
-200
-50
Year
DEPARTMENT OF COMMERCE AND BUREAU OF THE CENSUS
-122
-134
-155
-170
-137
U.S. BALANCE OF TRADE(MERCHANDISE)
Everyone expected the good times to con-tinue and to wax better and better. It is easy tomanage a business in an expanding market,and to be hopeful. In contrast with expecta-tions, we find, on looking back, that we havebeen on an economic decline for three de-cades. It is easy to date an earthquake, but nota decline.
What happened? It is hard to believe thatanything is different now than in 1950. Thechange has been gradual, not visible week toweek. We can only see the decline by lookingback. A cat is unaware that dusk has settledupon the earth, but the cat in total darkness isas helpless as any of us.
Some industries are doing better than ever.There are more automobiles in the U.S. thanever before, and more travel by air. Do suchfigures mean decline or advance? An answerwould have to take into account that in 1958we had inter-city trains. There was a choice,air or train. Now, we have only limited trainservice, air or automobile; go by air or byautomobile.

PACIFIC PLANNING INSTITUTE QTM ©2000 RANDOLPH L. CRAFT 24
There was, until a few years ago, a favorablebalance of trade in agricultural products -wheat, cotton, soybeans, to name a few - butno longer. Imports of agricultural productshave overtaken exports, and as someone inone of my seminars pointed out, if we couldput illicit drugs into the accounting, our defi-cit in agricultural products would show upworse than the published figures.
One of our best exports, one that brings indollars, is materials for war. We could greatlyexpand this income but for moral reasons.American aircraft have about 70% of the worldmarket, and bring in huge amounts of dollars.Another big earner of dollars is scrap metal.We can’t use it, so we sell it. Close on to it isscrap cardboard and paper. Timber brings indollars. Timber is important, renewable. Equip-ment for construction is an important export,so I understand. American movies, a service,bring in dollars. Banking and other serviceswere at one time important, but no longer.The biggest U.S. bank is today far down the listof biggest banks in the world. Banking is nowimportant in America mostly for losses on badloans. (As an aside, quality in banking mightbe improved.)
We ship out, for dollars, iron ore, partiallyrefined, aluminum, nickel, copper, coal, allnon-renewable. Scrap metal is non-renew-able.
Have we been living on fat? We have beenwasting our natural resources, and worse, aswe shall see, destroying our people. We needthem.
Our problem is quality. Around 1958, Japa-nese goods started to flow in. The price wasgood, and the quality was good, not like theshoddy quality that came from Japan beforethe War and just after; cheap, but worth theprice. Preference for imported items - some atleast - gradually climbed and became a threatto North American industry.
Were Americans caught napping? Are we stillnapping? Our problem is quality. Can’t wemake quality? Of course, and some Americanproducts are superior. We are thankful forthem. Unfortunately, some good Americanproducts have little appeal beyond our bor-ders, good paper clips, for example.
It will not suffice to have customers that aremerely satisfied. A satisfied customer mayswitch. Why not? He might come out betterfor the switch.
What a company required to get ahead is loyalcustomers, the customer that comes backwaits in line, and brings a friend with him.
What state of company is in the best positionto improve quality? The answer is that a com-pany that is doing well, future assured, is inexcellent position to improve quality and serv-ice, thus to contribute to the economic condi-tion itself and of all of us, and has the greatestobligation to improve. A monopoly is in thebest position to improve year by year, and hasthe greatest obligation.
A look at some of the usual suggestions forquality. There is widespread interest in qual-ity. Suppose that we were to conduct nextTuesday a national referendum:
Are you in favor of quality? (Be honest in youranswer.) Yes ___ No___
The results would show, I believe, an ava-lanche in favor of quality. Moreover, unfortu-nately, almost everybody has the answer onhow to achieve it. Just read Letters to theEditor, speeches, books. It seems so simple.Here are some of the answers offered, allinsufficient, some negative in results.
• Automation
• New Machinery
• Computers
• Gadgets
PACIFIC PLANNING INSTITUTE QTM ©2000 RANDOLPH L. CRAFT 25
• Hard work
• Best efforts
• Make everybody accountable
• M.B.O., management by objective,man-agement by the numbers, actually tamper-ing.
• M.B.R., management by results
• Merit system (actually, destroyer ofpeople)
• Incentive pay. Pay for performance.
• Work standards (quotas, time standards)
• They double the cost of production bethey for manufacturing or for service (bank,telephone company).
• They rob people of pride of workman-ship, the emphasis being on numbers, noton quality.
• They are a barrier to improvement.
• Just in time
• Zero defects
• Meet specifications
• Motivate people
Some remarks. The fallacies of all the sugges-tions listed above will be obvious from subse-quent pages of the text. Every one of themducks the responsibility of management. Theyrequire only skills, not knowledge about man-agement.
If the reader could follow me around in myconsultations, he would perceive that muchautomation and much new machinery is asource of poor quality and high cost, helpingto put us out of business. Much of it, if itperforms as intended, is built for twice thecapacity that is needed. Some of it is poorlydesigned, such as: make> inspect> makeinspect> make inspect> ..., where inspec-tion may not be economically the best proce-dure. (See Ch. 15 in OUT OF THE CRISIS.)
Moreover, the apparatus for inspection usu-ally gives more trouble than the apparatus formake.
Too often, the financial people in a companymerely beat down costs on the thought thatany cost is too high. Why do they write checksfor machinery that violates good practice?They could make genuine contributions toour economy by learning the new philosophyand by joining in to help to accomplish thechanges that must take place.
The biggest losses, as we shall see, are un-known and unknowable, not even under sus-picion.
Just in time, along with low inventory, is good,of course. Unfortunately, efforts usually startat the wrong end. The place to start is withprocesses and movements of materials used.Once processes and movements are in statis-tical control, the plant manager will knowhow much of this and that he will need by 3o’clock tomorrow. Quantity and quality willbe predictable.
Zero defects, meet specifications, incomingand outgoing, are not good enough. Of course,we wish not to violate specifications, but tomeet specifications is not enough. The piecesin an assembly must work together. Assem-blies must work together. I may refer to page476 in the book, OUT OF THE CRISIS.
Principle 3 . Tests of components in stagesof development can not provide (a) as-surance that they will work togethersatisfactorily as a system in service; nor(b) the average run between failures ofthe system; nor (c) the type and cost ofmaintenance that will be required inservice.

PACIFIC PLANNING INSTITUTE QTM ©2000 RANDOLPH L. CRAFT 26
Knowledge about the Taguchi loss function isnecessary for management. Which quality-characteristic is most critical? It is manage-ment’s job to discover which quality-charac-teristic is most critical, conquer it, then tomove on to the next one.
Wrong way. The President of a company putquality in the hands of his plant manager. Theresults in time became obvious and embar-rassing. Quality went down, as was predict-able. A plant manager can not possibly knowwhat quality is, and even if he did, he could donothing about it. He is helpless. He can onlytry to do his job, and to conform to specifica-tions.
The President of a company wrote that: Ourpeople in the plants are responsible for theirown product and for its quality.
They are not. They can only try to do theirjobs. Their product and its quality are theresponsibility of the man that wrote the ar-ticle, the President of the company.
The management of a company put this slo-gan in the hands of all employees:
"The operator is responsible for the quality ofour products. The inspector shares this re-sponsibility."
Again, the operator is not responsible for thequality of his product. Moreover, responsibil-ity divided between operator and inspectorassures mistakes and trouble. The manage-ment got rid of their responsibility by handingit over to people that are helpless to defineand improve quality. Another example: a groupof consultants in management advertised thus:Computerized quality information systemsprovide the vital link between high technol-ogy and effective decision making.
A company advertised that the future belongs
to him that invests in it, and went ahead andspent $45,000,000 for new machinery. Most ofit turned out to be a binge into high costs andlow quality, but the management were obvi-ously willing to invest in the future.
Why do the above suggestions fall short? Alittle ingredient that I call profound knowl-edge is missing from all the above sugges-tions. There is no substitute for knowledge.We shall soon come to suggestions for themissing ingredient, profound knowledge.Some of them (merit pay, for example) areeven strongly negative. Hard work and bestefforts will by themselves not produce qualitynor a market.
Where is quality made? The answer is, in thetop management. The quality of the output ofa company can not be better than the qualitydirected at the top.
The people in the plants and in service organi-zations can only produce at best the design ofproduct and service prescribed and designedby management.
Job security and jobs are dependent onmanagement’s foresight to deliver productand service that will entice customers andbuild a market.
Profound knowledge. Hard work and bestefforts, put forth without guidance of pro-found knowledge, may well be at the root ofour ruination. There is no substitute for knowl-edge. What is profound knowledge? An at-tempt to supply some answers as of this datefollow.
PROFOUND KNOWLEDGE
1. Knowledge for study of variation. Vari-ation there will always be, between people,output in service and of product. What isthe variation trying to tell us?

PACIFIC PLANNING INSTITUTE QTM ©2000 RANDOLPH L. CRAFT 27
2. Knowledge of variation helps us to un-derstand the losses from tampering. Thereare two mistakes.
(a) Treating a fault, complaint, mistake,accident, as if it came from a special causewhen actually it came from commoncauses.
(b) The converse.
3. Knowledge of procedures aimed at mini-mum economic loss from these two mis-takes. (Shewhart control charts.)
4. Knowledge about interaction of forces.Effect of the system on the performance ofpeople. Dependence, inter-dependencebetween people, groups, divisions, com-panies, countries.
5. Losses from demands that lie beyond thecapability of the system (e.g., M.B.O.).
6. Knowledge about loss functions, in par-ticular the Taguchi loss function. Whichquality-characteristic is most critical formanagement to work on?
7. Knowledge about the production of chaosand loss that results from successive appli-cation of random forces that may individu-ally be unimportant. Examples:
•Worker training worker.
•Executives working together on policywithout guidance of profound knowledge.
•Committees and government agenciesworking without guidance of profoundknowledge.
8. Losses from competition for share ofmarket. Losses from barriers to trade.
9. Some knowledge about the theory ofextreme values.
10. Some knowledge about the statisticaltheory of failure.
11. Theory of knowledge:
a. Any plan, however simple, requiresprediction.
b. There is no knowledge without theory.
c. There is no knowledge without predic-tion.
d. Experience teaches nothing unlessstudied with the aid of theory.
e. An example teaches nothing unlessstudied with the aid of theory.
f. Operational definitions: communica-tion.
g. No number of examples establishes atheory.
h. There is no true value of anything.
i. There is no such thing as a fact. Any twopeople have different ideasabout what to record about what hap-pened.
12. Knowledge of psychology. Intrinsic mo-tivation (for innovation, for improvement,for joy in work, for joy in learning).
Intrinsic motivation (humiliating, a day’spay for a day’s work).
Over justification: reward for an act orachievement that brought happiness tothe doer, for the sheer pleasure of doing it.The result of reward is to throttle repeti-tion. He will never do it again.
13. People learn in different ways, and atdifferent speeds.
14. Necessity for transformation (govern-ment, industry, education) to leadershipwithin the company; elimination of com-petition, ranking people, grades in school,and prizes for athletics in school.
15. Knowledge about the psychology ofchange.
Effects of present system of management.
The accompanying diagram shows some ofthe present norms of management, and theireffects. What they do is to squeeze out from anindividual, over his life-time, his innate intrin-

PACIFIC PLANNING INSTITUTE QTM ©2000 RANDOLPH L. CRAFT 28
sic motivation, self-esteem, dignity, and buildinto him fear, self defense, extrinsic motiva-tion. We have been destroying our people,from toddlers on through the university, andon the job.
Transformation is required in government,industry, education. Management is a stablestate. Transformation is required to move outof the present state. The transformation re-quired will be a change of state, metamorpho-sis, not mere patchwork on the present sys-tem of management. We must of course solveproblems and stamp out fires as they occur,but these activities do not change the system.
The transformation will take us into a newsystem of reward. We must restore the indi-vidual, and do so in the complexities of inter-action with the rest of the world. The transfor-mation will release the power of human re-source contained in intrinsic motivation. Inplace of competition for high rating, highgrades, to be No. 1, there will be cooperationon problems of common interest betweenpeople, divisions, companies, government,
countries. The result will in time be greaterinnovation, applied science, technology, ex-pansion of market, greater service, greatermaterial reward for everyone. There will bejoy in work, joy in learning. Anyone that en-joys his work is a pleasure to work with.Everyone will win; no loser.
The diagram that follows portrays the effecton the individual from the prevailing systemof reward. The transformation set forth in thispaper will year by year build up the bottomand shrink the upper half.
The function of government will be to assistbusiness, not to harass business.
These forces create fear, self-defense, compe-tition, humiliation. Competition for highestgrade in school. Play to win, not for fun.Learning and joy in learning are smothered.Beaten, humiliated, he drops out of school;turns to selling drugs; jail. On the job, strivefor high rating. Extrinsic motivation (a day’spay for a day’s work) crowds out intrinsicmotivation, self-esteem, dignity, joy in work.
Gradual ruination over the life span of the individual from theprevailing system of reward in education, industry, andgovernment.
The forces shown smother year by yearthe intrincic motivation, self esteem,dignity, that one is born with. They robpeople of joy in work, and joy in learning.He that enjoys his work is a joy to workwith.
LifeBegins
LifeEnds
These forces create fear, self defense, competition, humiliation.Competition for highest grade in school. Play to win not for
fun. Learning and joy in learning are smothered. Beaten,humiliated, he drops out of school; turns to selling
drugs; jail. On the job, strive for high rating.Extrinsic motivation (a day’s pay for a
day’s work) crowds out intrinsicmotivation, self esteem,
Dignity, joy in work.

PACIFIC PLANNING INSTITUTE QTM ©2000 RANDOLPH L. CRAFT 29
The forces shown smother year by year theintrinsic motivation, self-esteem, dignity, thatone is born with. They rob people of joy inwork, and joy in learning. He that enjoys hiswork is a joy to work with.
Gradual ruination over the life span of theindividual from the prevailing system of re-ward in education, industry, and government.
Leadership. In place of judgment of people,rating them, putting them into slots (out-standing, excellent, on down to unsatisfac-tory), there will be leadership. The aim ofleadership is to help people, to improve theservice and profits of a company.
SOME ATTRIBUTES OF A LEADER
1. He understands how the work of his groupfits into the aims of company. The purposeof this group is to support these aims.
2. He works in cooperation with precedingstages and with following stages towardoptimization of the efforts of all stages.
3. He tries to create for everybody interestand challenge, and joy in work. He tries tooptimize the education, skills, and abili-ties of everyone, and helps everyone toimprove. Improvement and innovation arehis aim.
4. He is coach and counsel, not a judge.
5. His source of power is:
A. Formal
B. Knowledge
C. Personality
A successful leader develops 2 and 3;does not rely on No. 1. He has neverthe-less obligation to use No. 1, as this sourceof power enables him to change the sys-tem - equipment, material, methods - toreduce variation in output. (Dr. RobertKlekamp.)
6. He uses plots of points and statisticalcalculation with knowledge of variation,to try to understand the performance ofhimself and of his people. One aim is to tryto learn how he himself can improve hisleadership. Another aim is to learn who, ifanybody, is outside the system. Simple re-arrangement of the work might be theanswer. Transfer to another job may re-quire prudence and fact, as the man to betransferred may interpret this as one wayto get rid of him.
7. He works to improve the system that heand his people work in.
8. He creates trust. Creates freedom andinnovation. He is aware that creation oftrust requires that he take a risk (Carlisle &Parker, BEYOND NEGOTIATION, Wiley1989).
9. He does not expect perfection.
10. He listens and learns without passingjudgment on him that he listens to.
11. He understands the benefits of coopera-tion and the ills of competition (Alfie Kohn,NO CONTEST, Houghton Mifflin, 1986).
Works to improvethe system
This member of thegroup is in need of
special help.
These people must not beranked.

PACIFIC PLANNING INSTITUTE QTM ©2000 RANDOLPH L. CRAFT 30
The most important figures for manage-ment are unknowable.
It was Dr. Lloyd S. Nelson who years agoremarked that the most important figures formanagement are unknown and unknowable.We could add that figures for most importantlosses and gains are not even under suspicion.
Examples:
1. The merit system, putting people intoslots, a lazy way out: actually, destroyer ofpeople.
2. Failure to understand leadership.
3. Worker training worker.
4. Executives working with best efforts, try-ing to improve quality, the market, andprofit, but working without guidance ofprofound knowledge.
5. Tampering
6. Failure to optimize efforts of people anddivisions within the company, accepting,instead, suboptimization - everyone tryingto maximize the profits of his own division- and consequent losses.
7. Failure of customers and suppliers towork together for ever greater and greatersatisfaction of quality, lower costs, every-body wins.
8. Gains in quality and productivity through-out the rest of the company from improve-ment in one stage.
FAULTY PRACTICE
Reactive: skills only required, not theory ofmanagement. M.B.R. (management by re-sults). Mind not required.
Management of outcome, too late; tamper-ing; failure to distinguish between specialcauses and common causes. Immediate ac-tion on:
• Costs
• Complaints from customers
• Poor quality, in or out
• Accidents
• Emergency breakdowns
• Absenteeism
The so-called merit system - actually, destroyerof people.
Incentive pay for the individual. Pay based onperformance. The incentive is numbers, notquality. Result: back-fire, loss.
PRR, problem report and resolution. Actually,this system of management by results is tam-pering, making things worse.
Work standards (quotas, time standards).They:
1. Double costs.
2. Rob people of pride of workmanship.
3. Are a barrier to improvement of a proc-ess.
4. Shut off any possibility to obtain data touse for improvement of output. This is sobecause the figures on production areforced.
(Do it, I don’t care how you do it. Just do it.)
A company will of course have aims; likewisean individual will have aims. But the aim shouldbe improvement of the system, not a number.
There are of course facts of life. Example: if wedon’t decrease faulty product by 5% by theend of the year, we shall not be here. This isnot M.B.O.

PACIFIC PLANNING INSTITUTE QTM ©2000 RANDOLPH L. CRAFT 31
BETTER PRACTICE
Theory of management required.
Work on the system to reduce failure at thesource. Costs are not causes. Likewise forcomplaints from customers, poor quality, ac-cidents, emergency breakdown, absence.Avoid tampering. Instead, distinguish by ap-propriate techniques between special causesand common causes.
Change the system of reward from ruggedindividualism - I win, you lose - to coopera-tion, everybody wins. Institute leadership.
Put all people on regular systems of pay.Provide leadership.
Study the system. Practice methods by whichto minimize the net economic loss from thetwo mistakes:
1. Ascribe any fault, complaint, mistake, ac-cident, to a special cause when in fact itcame from common causes.
2. Provide leadership. Everyone is entitledto pride of workmanship. Wherever workstandards have been replaced by compe-tent leadership, quality and productivityhave gone up, and people on the job arehappier.
A better way is to improve the system to getbetter results in the future. One will only getwhat the system will deliver. Any attempt tobeat the system will cause loss.
What should a school of business teach? Theanswer is, I believe, that a school of businessought to teach profound knowledge. A schoolof business has the obligation to prepare stu-dents for the future, not for the past. Asconstituted, most schools of business teachstudents how business is conducted, and howto perpetuate the present system of manage-ment. Most of the time that students spend ina school of business today is to learn skills. Aschool of business has an obligation to pre-pare students to lead the transformation thatwill help our balance of trade and our economy.

PACIFIC PLANNING INSTITUTE QTM ©2000 RANDOLPH L. CRAFT 32
QUALITY TEAM MANAGEMENT
TEAM BUILDING

PACIFIC PLANNING INSTITUTE QTM ©2000 RANDOLPH L. CRAFT 33
Thesequalities,thoughseeminglycommon-sensical, arehard toachieve andeven moredifficult tomaintain.
Teammembers willuse thisunder-standing toworktogethertowardgreater teameffectivenessand growth.
“TO HAVE AN OPPORTUNITY TO PRECIPITATE ALIGNMENT ON A TEAM THAT THEN IMPROVES RESULTS IS ONE
OF THE NICER EXPERIENCES IN LIFE.” — R. CRAFT
Team Building Introduction
Ever since the early 1950s, with the ad-vent of the human relations movement, theconcepts of team and teamwork have sur-vived as one of the foundations of manage-ment. The concept of managing a team hastranscended the human relations and humanresource movements, systems thinking, par-ticipative management, employee involve-ment, quality of work life, and all the othertheories and practices so popular at one timeor another during the last thirty years.
Although the need for team develop-ment was identified some time ago, the con-cept of team building has changed through-out the years. Team building developed pri-marily out of research into the areas of groupdynamics, social psychology, and laboratorytraining groups (T-groups) that were popularin the 1960s. These fields focused on socialinteraction and interpersonal relationships.As these theories and practices were appliedto organizations, the focus slowly changedfrom concern for social interaction (process)to achieving specific results (task). Modernteam-building efforts usually include concen-tration on both how team members relate andhow work is completed. Thus, task and pro-cess receive equal attention.
Through the process of team building, ateam will analyze and build a better under-standing of the dynamics that exist amongteam members and the impact these dynam-ics have on task accomplishment. Team mem-bers will use this understanding to work to-gether toward greater team effectiveness andgrowth.
Team effectiveness, however, can be anambiguous concept as the parameters of whateffectiveness is change with the task at handand with the characteristics of individual teammembers. From an ideal perspective, an effec-
tive team is one that is efficient, productive,and cohesive. Its work is consistently superiorin terms of both quality and quantity. Theteam members are competent and knowl-edgeable in the way they carry out their du-ties. Problems and conflicts within the teamare addressed quickly and professionally. Thequality of decisions made by the team is high,and all members have a sense of satisfaction inthe work they accomplish. The team is con-stantly learning and growing - adapting itself,as necessary, to changing requirements andmultiple goals.
These qualities, though seeminglycommonsensical, are hard to achieve andeven more difficult to maintain. They runcounter to many of our society’s values andhabits. “Teamwork is the quintessential con-tradiction of a society grounded in individualachievement.” This basic dichotomy is one ofthe primary reasons that team building hasreceived so much attention in recent years.
As many case histories attest, team build-ing works. Among other things, it helpsworkgroup members to build upon theirstrengths and take better advantage of oppor-tunities. It encourages members to strengthentheir weaknesses and manage their problemstogether. In so doing, it promotes better un-derstanding between individuals - a criticalfactor in the success of any organization.
The first step in team building is to for-mally engage in the process. It is with thisoperating philosophy and discipline that TeamTechnology has endeavored over the pastdecade to install the concept of “team workwithin businesses”. All companies are unique,therefore installation of custom designed teamprograms are essential in order to maintainthe distinct individual character of the com-pany. However, the basic elements of team-work never change.

PACIFIC PLANNING INSTITUTE QTM ©2000 RANDOLPH L. CRAFT 34
Alignment of the team to the core valuesand direction of a company is a critical compo-nent of success and can make or break aproject. Additional principles of teamworkthat must be integrated into organizations tofacilitate the optimal team platform include:
• Teams must be aligned to a commongoal.
• Each team member’s full participation isessential to the overall success of theproject.
• Team members must be treated as familyand actively supported throughout theproject.
• Striving for excellence must be the oper-ating standard.
• Commitment and loyalty to the teamand project are mandatory.
• When the team wins so do each of theplayers.
Team Technology has developed manystrategies for the integration and implemen-tation of teamwork. We can assist your com-pany in developing a custom team buildingstrategy for the future.
TOM PETERS
PACIFIC BUSINESS NEWS MARCH 1, 1990
Managing Momentum
Whether it’s a football season or a fac-tory’s fiscal year, we all give a nod to theimportance of momentum. “They lost theirmomentum after the turnover.” “They’re on aroll.” Etc.
Other than acknowledging momentum’svalue, what do we do about it? Usually noth-ing. After all, momentum is one of those softwords - important, even critical, but squishywhen you get up close.
Some people don’t buy that cop-out, andI’m one of them. I think that most qualityprograms, for instance, fall far short of theirpotential principally because managementneglects to manage momentum . Hence my“demand”: that you (1) consider momentumto be a “hard” word, not a “soft” one; and (2)think “manage” whenever you think “momen-tum.” In short, sustaining momentum is sub-ject to the same discipline as annual budget-ing.
Some get the point. Milliken & Co., theSouth Carolina-based textile maker and win-ner of the 1989 Malcolm Baldrige NationalQuality Award, does a lot right - but nothingbetter than managing momentum. For years,it has used local (factory, division) and corpo-rate “sharing rallies” (“fabulous bragging ses-sions,” as company president Tom Malonecalls them) to sustain enthusiasm.
Domino’s Pizza Distribution (the dough,topping and equipment provider to Domino’sfranchisees) has a year-round “Olympics” pro-cess, which likewise spotlights and nudgesforward its quality program.
While he was at Paul Revere Life Insur-ance Cos., service quality guru Pat Townsendinitiated a similar campaign, called Quality HasA Value. And at the stellar floor-cleaning, equip-ment maker, Tenant, the annual Zero Defects

PACIFIC PLANNING INSTITUTE QTM ©2000 RANDOLPH L. CRAFT 35
Day and the buildup thereto has played aleading role in maintaining momentum.
ALL FOUR FIRMS think that sustaining mo-mentum is amenable to hard-nosed thought,meticulous planning and painstaking execu-tion. Here are some common elements tothose four programs and a host of others I’verun across.
1. Structured competitions and a blow-outcelebration. All of the best “momentumprograms” feature a big-bang celebration -e.g., the finals of Domino’s Olympics, andday-long celebrations for everyone at Ten-ant and Paul Revere. These annual galasdramatically spotlight progress. The goalis to “create lots of winners, no losers.”
2. Variety. New team plans each year’s bigevents at Tenant and Domino’s, and it’s abig deal to get the nod as manager of theaffair. Competitions, goals, prizes andvenue change each year.
3. Semispontaneous celebrations. The big,structured celebration is important. Infor-mal, spur-of-the-moment recognition iseven more vital. It must be spontaneous tobe effective. But you must also make these“unplanned” events habitual. One starhotel manager, for example, religiouslysends out at least 100 thank-you notes toemployees every month; each act is spon-taneous, but he disciplines himself to keepscore.
4. Small is much more important than big.Momentum is the product of lots of smallsins, not a few big ones. Rewards for bigwins are easy. Ferreting out and then cel-ebrating the little tries, successful or not, istougher to do - but much more important.
5. God (as always) is in the details. Townsendinitiated a program at Paul Revere to givea free cafeteria lunch to randomly selectedemployees - if they were wearing their
Quality Has Value pins the day their nameswere drawn. (Wearing the pins, he felt,was a sign of momentum.) Women werebadly under-represented among the win-ners. Why? The pin, fine for men, wouldpuncture a woman’s silk blouse or dress.Pin redesign was the answer. Quality pro-gram momentum hinges at least as muchon unearthing such “minor” problems ason statistical-process-control training.
6. Momentum quarterback. I’m all in favorof quality VPs. But the momentum pro-gram needs a powerful quarterback, too.This “soft stuff” - worrying about pin de-sign - doesn’t happen by accident. It needsan energetic, respected champion.
7. Plan it! If there is no written MomentumPlan (that’s what I urge you to call it), thenthere won’t be much momentum gener-ated.
8. Quality may be free, but momentum isn’t.Domino’s program costs a small fortune -cash and time devoted to preliminary andfinal competitions. Be prepared to coughup some bucks if you’re serious.
9. Attitude, as usual, reveals all. RogerMilliken, a quiet soul, gets a genuine kickout of his firm’s sharing rallies. So do DonVlcek at Domino’s, Roger Hale at Tenant.If the top dogs won’t participate regularly,and can’t bring themselves to get enthusi-astic about a little victory by a little team ina little operation far away from home,you’ve got a real problem.
Taken together, which they must be,these nine elements will move you a long waytoward “hardening” momentum - the singlemost important missing link in most qualityprograms.
1. Structuredcompetitionsand a blow-out celebra-tion.2. Variety.3. Semis-pontaneouscelebrations.4. Small ismuch moreimportantthan big.5. God (asalways) is inthe details.6. Momen-tum quarter-back.7. Plan it!8. Qualitymay be free,but momen-tum isn’t.9. Attitude,as usual,reveals all.Momentum -the singlemostimportantmissing linkin mostqualityprograms.
PACIFIC PLANNING INSTITUTE QTM ©2000 RANDOLPH L. CRAFT 36
Theircompany isaworthwhile,humanisticplace.
Thecompanyexists for thebenefit ofsociety
THE HUMAN SIDE OF JAPANESE ENTERPRISE
HIROSHI TANAKA
1988ASICS - Anima Sana In Corpore Sano , ‘a
sound mind in a sound body’ - was KihachiroOnitsuka’s dream for the youth of Japan; nowit is his dream for mankind. Through hisbusiness endeavor, Onitsuka took the firststep to actualize this dream nearly forty yearsago. He was thirty years old, a survivor of thePacific War. Three years with a newly formedcompany had exposed him to the widespreadcorruption of postwar Japan. If his countrywas to rise from the physical devastation,economic ruin, and spiritual deflation the warhad inflicted, its young people needed hopesand dreams; they needed jobs. Onitsuka sawin the manufacture of sports shoes the oppor-tunity to provide both.
He established his company with twoemployees, a desk and a telephone. It was oneof a few hundred minute business establish-ments involved in the rubber footwear busi-ness in Kobe. Today, ASICS’ (Tiger) productsare known globally, and include, as well asfootwear for most sports, a wide variety ofsports equipment and apparel - over 200,000items in all.
Onitsuka acted on his dream and actual-ized it. The backbone of his corporate successhas been the consistent application of hiscorporate ideology that the company existsfor the benefit of society - consumers, em-ployees, shareholders, and all those affectedby the corporation’s existence. He formu-lated his ideas through his experience of per-sonal hardship. ASICS’ evolution is KihachiroOnitsuka’s life itself.
Onitsuka’s Speech
Theories and Practices of Japanese Manage-ment
"I am honored to be speaking to you thisevening on the topic of Japanese manage-ment.
Before I go into detail on my own methodsused in ASICS, I would like to touch briefly onthe background that has caused the Japanesestyle of management to become such a popu-lar subject these days.
As you know, Japan had a very late start inits drive towards modernization, yet within afairly short period of time it has emerged asone of the advanced industrial nations.
After defeat in World War II, Japan was able toarise from incomparable ruins to achieve amiraculous recovery. Through technologicalco-operation with the United States and Eu-rope, together with a large, young labor force,Japanese industry sustained a period of highgrowth from 1950 to 1973.
Then, in 1973, the beginning of the oilcrisis affected numerous countries, and Japanalone was able to regain her balance quicklyenough to sustain favorable economic condi-tions.
This ability to adapt quickly to changingcircumstances had led a number of people towonder if it might be the style of managementthat is the cause and, if this is the case, thesepeople feel that Japanese managerial meth-ods should be examined more closely.
I believe that it is necessary to under-stand the fundamental differences betweenthe structure of Japanese companies and thatof American and European companies. Thesedifferences, I believe, lie in the history, phi-losophy and customs that make up the soci-ety in which companies mature.
Japanese companies in general are runon the theory that all the employees share acommon bond, in a clan fashion. A term thatdescribes this situation is gemeinschaft, or‘community’. The employees of a Japanesecompany are expected to share the company’s

PACIFIC PLANNING INSTITUTE QTM ©2000 RANDOLPH L. CRAFT 37
goals and share its profits and losses. The tiesthat bind an employee to the company aremuch deeper than simply a paycheck. With-out signing a contract, a new employee isguaranteed employment until retirement, sen-iority-based wages and promotions, social wel-fare and other fringe benefits.
The company also instills in its employ-ees the understanding that their new com-pany is a worthwhile, humanistic place. Ex-cept in rare circumstances, an employee willnot be fired, and so the new employees arebetter able to accept lower starting wages andstrive to create an atmosphere conducive toproductive work. Towards this end, white-collar and blue-collar workers work togetherin enterprise unions to promote ‘coexistenceand co-prosperity’ within this familiar struc-ture.
In contrast, American and European com-panies are run on the basis of turning a profit.The term for this is gesellschaft or ‘corpora-tion’. The importance of individualistic valuesnecessitates the use of specific contracts to tiethe employee to the company.
Under this gesellschaft system, workersare seen as commodities in the form of man-power rather than as human beings. Compa-nies try to procure labor as cheaply as pos-sible. On the other hand, the workers dividethemselves up into lateral unions, dependingon their specific craft or industry, and attemptto sell their skills for as much as possible. Herethe emphasis is not on what company peoplework for, but rather what type of work theydo.
This is just a simple explanation of someof the ways that Japanese companies differfrom American and European ones. Both typeshave strengths and weaknesses, so it is notpossible to judge which is superior.
Since entering the prolonged slow-growth period, the gaps between the variousJapanese companies have become more pro-nounced. Many small and medium-sized en-terprises are now facing bankruptcy becauseof the intensification of competition in themarket-place. The Japanese companies thathave been given high ratings, in general, haveadopted the Japanese style of management astheir basic framework and have added to itparts of American theories of expertise. Bycreating an innovative form of management,these companies have been able to retain thestrengths of the purely Japanese style of man-agement, supplemented by the Americansystem’s strengths. These companies havebeen able to adapt to and cope with thechanging circumstances.
My company has been very fortunate inits successful development. At this point, Iwould like to take the opportunity to presentmy managerial methods to you.
I established Onitsuka Corporation,ASICS’ forerunner, in 1949, and struggledbitterly for ten years before I was finally able toexhibit clearly the style of management thatenabled our company to grow and prosper.
The purpose of our top management isto identify and explain to our employees ourcompany goals, establish and maintain com-mon bonds among all our employees, andmake our company the central point for theattainment of our goals.
The goals that have been set for ourmanagement are as follows:
1. Rather than simply promoting sport, wewant to become the type of manufacturer thatcan offer good-quality, low-priced, safe sport-ing goods that will be beneficial in raisingoutstanding citizens for our community.
We wantto ensurethat ourcompanyhas theproperatmosphereconduciveto ourstaff’swell-beingandproductivity.
Workersand topmanage-ment musthave adeepsense ofconfidencein eachother.

PACIFIC PLANNING INSTITUTE QTM ©2000 RANDOLPH L. CRAFT 38
2. We want to ensure that our company hasthe proper atmosphere conducive to our staff’swell-being and productivity. For this endthere must be continual and close co-opera-tion between our top management and staff -in other words a gemeinschaft approach - sothat we can cope readily with the changes insociety, continue to serve our community andin this way make an honest profit.
I would like to explain this point in moredetail.
(a) There are three factors, or strengths, thatwork together in a company: top manage-ment, employees and shareholders.
These strengths form the vertices of anequal-sided triangle, and cannot functionin competition with each other. Workersand top management must have a deepsense of confidence in each other. Thefuture of the workers is tied directly to thesuccess of the company, and therefore it isimperative that the individual reflects thecompany goals and guidelines.
After ten years doing business, I voluntar-ily reduced my private holdings of com-pany shares from 100 per cent to 30 percent. Of that 70 per cent, 50 per cent wasdistributed to my employees at no cost,and the other 20 per cent was sold at a fairmarket value to my employees. This wasdone to ensure better co-operation withtop management, because these stock-holding employees would now be work-ing both as laborers and as ‘capitalists’.
(b) In order to promote greater motivationamong the workers, we initiated a systemthat emphasizes human esteem by pro-moting motivation and technical capabili-ties. To give credence to this idea, we didaway with preferential treatment for bloodrelatives and university graduates, and in-stead instituted an open in-house educa-tion system of examinations that allows
motivated staff to advance through theranks at an accelerated speed, dependingon their initiative and ability.
(c) In order to establish a fair system of profitdistribution we introduced a bonus allot-ment program.
(d) Top management and workers must worktogether to ensure that the lines of com-munication are kept open. To achieve thisgoal we have established a friendship club,which organizes social activities to bringworkers and management together.
(e) Through these various systems the work-ers are united with the top management ina community of common desires and con-cerns - reflecting the gemeinschaft system- and this, in turn, has led to more prosper-ous expansion.
(f) Furthermore, we opened our companyshares to our affiliated companies andkept them fully informed about corporateoperations. While doing so, we also madeclear the associated responsibilities andobligations attached to such a relation-ship. In this way we were able to protectour mutual dependence and form a co-operative system for ‘coexistence and co-prosperity’.
Now, having explained the second goalof our management, namely ensuring closecontact between staff and top management, Iwould like to turn to the third goal. This is toprovide a good environment for the surround-ing community by fighting pollution, raisingmorale, paying taxes, contributing to devel-opment of the community, and being able tocoexist in a socially responsible manner.
I also set three rules for myself to obey sothat my management theories could actuallybe put into practice.
The first rule is that there must be abso-lutely no misrepresentation by the top man-
Weinitiated asystemthatemphasizeshumanesteem
Theremust beabsolutelynomisrepresen-tation bythe topmanage-ment.
PACIFIC PLANNING INSTITUTE QTM ©2000 RANDOLPH L. CRAFT 39
agement. We have set up a ‘glass pane’ ap-proach where it is clearly seen that decisionsare impartial, where achievements are an-nounced within the company, and where wedo not lie about the company’s situation. Ourstaff must be aware of the true situation sothat they will respond to our needs.
The second rule is that the top manage-rial staff must constantly practice direct, per-sonal contact with their subordinates. By us-ing a bottom-to-top approach to decisionmaking, all managerial staff will feel that theyare making a valuable contribution to thecompany, and will be able to understand thefull weight of their responsibilities and thelevel of their authority. In other words, thetop management must have strong network-ing skills.
The third rule is that there must not beany conflict between or any overlapping ofbusiness and personal matters. Since ownershave absolute authority, they have a tendencyto use company finances to pursue their ownprivate interests. Also, they might hire anincompetent relative over someone who ismuch more capable.
If you follow the ‘glass pane’ approach tomanagement it will be much simpler for man-agers to avoid abusing their power and pursu-ing their private interests. The employees willbe more motivated because they can see read-ily that they will be rewarded for good work,and that bonuses and promotions are open toall on the basis of merit. In this way, we atASICS have been able to correct some of thenegative aspects of a seniority based wage andpromotion system.
I would now like to summarize my ideas.We have established a gemeinschaft systemwhere labor, shareholders and managementform a perfect triangle. The introduction ofemployee shares gave our company a broader
perspective so that we came to think of our-selves as a public institution for the commu-nity’s benefit, rather than simply as a family-type operation. Responsibility and authorityhave been passed down to lower manage-ment in order to encourage greater involve-ment, and our in-house education systemrewards individuals who exhibit initiative andability. Through this system of modified capi-talism, we have been successful in increasingmotivation and institutionalizing this innova-tive form of management.
I must also add that it is necessary for topmanagement to undergo continual personaldevelopment to expand their horizons. Thecompany’s development depends on the qual-ity of the time that the top personnel devoteto the company.
Finally, I would like to raise five pointsthat I have found to be relevant from the pointof view of top-level management.
1. You must have a code of ethics. You musthave good interpersonal skills, but be-yond that you must be able to executedecisions promptly and decisively. Thismeans that you must understand our ob-ligations to society and not be tempted toconfuse business and personal interests.
2. You must have foresight and highly crea-tive powers. You must be able to look atthe present situation and see beyond towhat kind of developments will occur. Atop-level manager should neither imitatenor fall behind others, nor should he ex-pect others to do his dirty work.
3. You must have a sense of frontier spiritand determination. Winning means gain-ing the upper hand. In order to producefor the company you must have the type ofpersonality that is hungry, willing to takerisks and continually trying to open upnew territory.
You musthave acode ofethics.
Think ofothersbeforeyourself,and in thisway youwillaccumulatevirtue.
PACIFIC PLANNING INSTITUTE QTM ©2000 RANDOLPH L. CRAFT 40
4. You must have the ability to handle lead-ership. This means being able to soothehurt feelings, to convince your customers,staff and management that your decisionis the correct one, and then to implementyour decision. Constant communicationallows your staff to feel confident in you,and in turn, trusted by you.
5. Think of others before yourself, and inthis way you will accumulate virtue. Thinkfirst of your duty towards your communityand fellow workers, and then think ofyourself lastly. If you work to help othersyou will find that you are helping yourselfat the same time. You should strive tobecome the type of person in whom oth-ers can put their faith.
As the president of ASICS, I deal dailywith people who practice the foregoing phi-losophy. I hope that each member of ourcompany has a full understanding of his rolein its success, and that ASICS will become avery exciting place where we can use thissense of solidarity to work towards our ownhappiness as we serve our community.
I sincerely hope that some of what I havepresented will be of some use to you. Thankyou for your kind attention.
•
Matsushita’s Comments of Onitsuka’s Man-agement Philosophy
In 1979, Konosuke Matsushita foundedthe Matsushita School of Government andManagement to prepare top university gradu-ates to become the business and governmentpersonnel who will lead Japan into the twenty-first century. The major components of thefive-year program are: fundamental philo-sophical inquiry, moral education, develop-ment of an international perspective, and prac-tical training. The program includes field case
studies at Japanese corporations whose pros-perity is rooted in a solid corporate philoso-phy. ASICS is one such corporation, KenjiYoshida, a graduate of Osaka University whoenrolled as a Matsushita student in the firstyear the school opened, spent some time atASICS in 1983. Later, he and KonosukeMatsushita discussed Onitsuka’s managementstyle.
Matsushita observed that the main rea-son why ASICS has grown to its present statusis that, from the outset, Onitsuka has neverconsidered that his company belongs exclu-sively to himself. He as always managed thecompany as a public institution. Matsushita,too, has always considered his business to bea public, not a private, matter:
Because I started my business with justmy wife and my wife’s brother, I understandhow easy it is for the manager/owner of asmall company to think that the company ishis to do with as he pleases. There is a ten-dency to think only about one’s own income.Employees, customers, business associatesall become secondary. This is one of the pit-falls of managing a small or middle-sized busi-ness.
In order to demonstrate to his employ-ees that the company did not belong solely toits owner, after his company numbered tenemployees, Matsushita set up an accountingsystem showing how much money was to beused by himself, and how much was to remainwith the company. Sales, company expendi-tures and profits were clearly delineated andthe books opened to the employees. Theemployees were skeptical. At that time, shortlybefore the outbreak of World War II, mostsmall business owners did not have a clearidea of company earnings and they wouldcustomarily take whatever they needed fortheir own use from company funds. Clear

PACIFIC PLANNING INSTITUTE QTM ©2000 RANDOLPH L. CRAFT 41
records were seldom kept and employeesremained in the dark about company finances.
With Matsushita’s system, company earn-ings and expenditure were reported monthly.This made employees aware of the way inwhich their work related to corporate incomeand fostered a growing eagerness on theirpart to do their best for the company.
Matsushita believes that:
Distinguishing between private and pub-lic is the foundation of any business. Whetheryou employ only yourself or tens of thousandsof people, so long as you are making use ofsocietal resources in the form of people, ma-terial and money, then you are engaged in apublic, not a private, task. As long as a corpo-ration exists in harmony with society it willgrow and develop. If it doesn’t it will recede.This is true regardless of the size of the corpo-ration.
Matsushita finds many similarities be-tween Onitsuka’s management style and hisown. In each corporation, management, em-ployees and affiliated firms are unmeikyodatai , that is, they are interdependententities with a common fate. Matsushita em-phasizes that this term does not refer to attrib-utes such as friendliness and harmony. Rather,it refers to ‘the integration of the mission ofthe corporation as a public tool, and themission of the employees to carry out theirassigned tasks. In other words, the synthesisof each employee’s commitment to fulfillinghis mission leads to fulfillment of the corpo-rate mission.’
Matsushita stresses that, in order toachieve unmei kyodatai , the manager mustnot be preoccupied with his own immediatebenefit. Instead, he must identify and clarifythe corporate mission. Likewise, employeesmust understand, comply with, and respect
the corporate mission and work together withmanagement to actualize it. If there is to betrust and confidence between employees andmanagement, it must be reflected in actions.This is how Onitsuka has always run his corpo-ration.

PACIFIC PLANNING INSTITUTE QTM ©2000 RANDOLPH L. CRAFT 42
“The Long Road is the Short Road”
ProjectCompletion
Project without a ClearlyDefined Plan:"Failing to plan is planning to fail."A change in a planning meetingtakes an eraser. In the field, ittakes a checkbook.
The Common Perception:The Direct Route to ProjectCompletion.Ready, Fire!, Aim... Things willwork out.
Buildingfoundation andinfrastructure
• A Well Planned Project:• Aligned Management• Quality criteria established• On Time• On Budget• In Control
ProjectStart
Phase 7:New and final proformaestablished andongoing projectjustification.
Phase 6:Project completion,over-budget and latedelivery of product.Dissatisfied client.
Phase 5:Overtime, mad-scrambling, and thewriting of checksbecomes the order ofthe day.
Phase 4:Acknowledgement ofimproper planning.Management beginsselection of recoverypath.•Lack of Quality•Financial Loss•Overtime•Cost Overruns•Penalties•Lost Credibility•Lack of Confidence•No Certainty ofCompletion
Phase 3:Looking for solutions,fingerpointing andlaying blame begins.
Phase 2:Project reality sets in.Questions begin tosurface.
Phase1:Enthusiasm runs theproject. There seemsto be no apparentproblems.
The seven steps ofa project cycle
without aclearly defined plan:
• Lack of Quality• Financial Loss• Overtime, Cost Overruns• Penalties• Lost Credibility• Lack of Confidence• No Certainty of Completion

PACIFIC PLANNING INSTITUTE QTM ©2000 RANDOLPH L. CRAFT 43
Retirement
BuildCompany Merge
Company
BalanceBusiness
and Lifestyle
Future
In the beginning of projects,excitement & enthusiasmjoin vague completiondescriptions. Truedifferences in individualgoals are not perceivable atthis time.
As clarity of differing goalsbecomes visible andcommunicated throughwork and the passing oftime, structural tensionincreases.
As differing goals are pursued ,differences in individual goalsare now apparent. Teamconcept and spirit dropsrapidly. People stop caring.
Future
Future
Future
MinorStructuralTension
MajorStructuralTension
IncreasedStructuralTension
TheManagement
Team
Structural Tension
QTMQuality Team Management
(Chart used in QTM workshops to explain the loss of project momentum due to non-alignment in the planning stages)
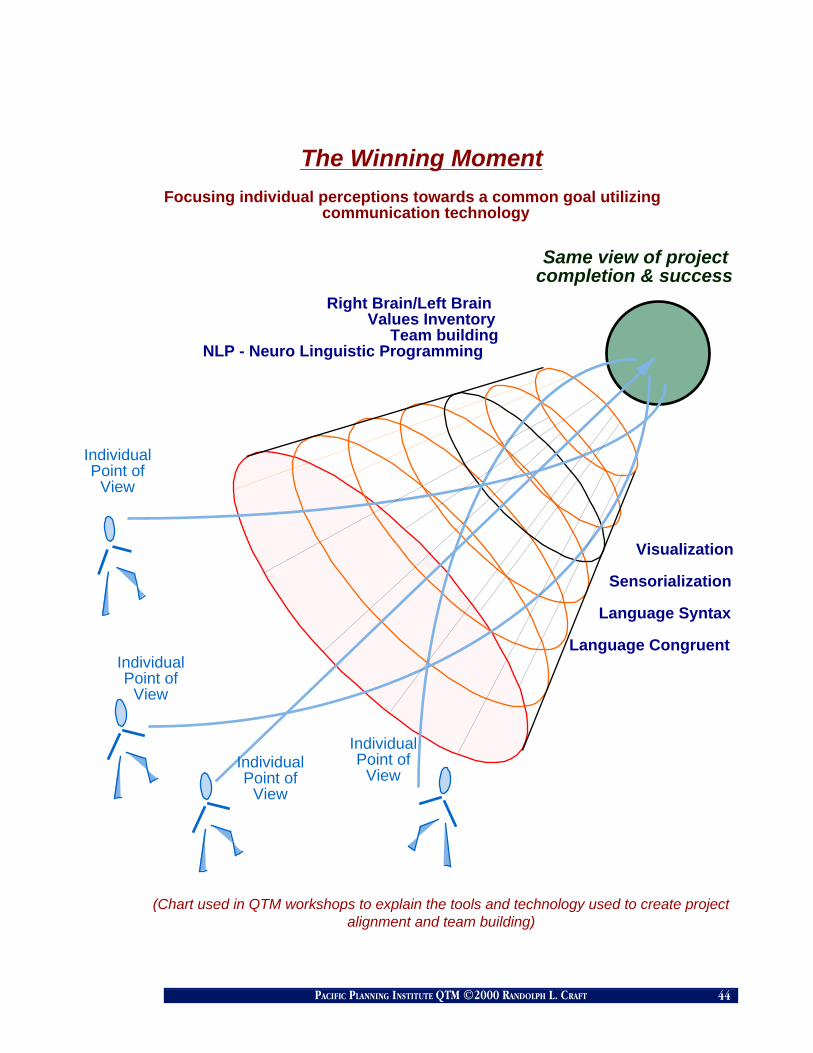
PACIFIC PLANNING INSTITUTE QTM ©2000 RANDOLPH L. CRAFT 44
IndividualPoint of
View
Visualization
Sensorialization
Language Syntax
Language Congruent
Right Brain/Left BrainValues Inventory
Team buildingNLP - Neuro Linguistic Programming
The Winning Moment
Focusing individual perceptions towards a common goal utilizingcommunication technology
Same view of projectcompletion & success
IndividualPoint of
View
IndividualPoint of
View
IndividualPoint of
View
(Chart used in QTM workshops to explain the tools and technology used to create projectalignment and team building)
PACIFIC PLANNING INSTITUTE QTM ©2000 RANDOLPH L. CRAFT 45
QUALITY TEAM MANAGEMENT
PLANNING & MANAGEMENT

PACIFIC PLANNING INSTITUTE QTM ©2000 RANDOLPH L. CRAFT 46
STRATEGIC ALIGNMENT & PLANNING
Successful completion of a goal or project is predicated on clarity,intention, integrity, resources, alignment of the team and a game planwhich clearly defines the strategy for completion.
We work closely with your project team to facilitate alignment of theplayers to the stated goal. We create, as a group, a project logic diagramthat all members agree to. Resource and budget considerations areapplied to the formula and all information is entered into a network-based management diagram. The team then reviews and critiquesvarious project analyses. The project only begins when the final edit iscomplete and all vendors, sub-contractors, consultants, managers,workers, and other players who can effect the successful completionof the project sign off and commit to their responsibilities.
Results are the name of the game...therefore careful monitoring andupdating of schedules is essential. The project manager must berelentless in the pursuit of accurate information and changes in fieldconditions. The project analysis software reports enhance your abilityto react and modify schedules and are one of the keys to completingprojects on time and on budget.
People conceptualize, plan, initiate and complete projects. People arethe critical resource and must be treated with the utmost respect.Celebrations and acknowledgment events are therefore built into thebudget and play a major role in successful project completion. Totalteamwork and commitment determines the level of excellence bywhich a project will be judged now and in the future.
PACIFIC PLANNING INSTITUTE is prepared for excellence. We offer thatavailability to you and your team.
“The journey is the reward.”

PACIFIC PLANNING INSTITUTE QTM ©2000 RANDOLPH L. CRAFT 47
QUALITY EVALUATION..... On Time..... Within Budget..... Prompt Payments..... # Changes..... Redundant Work..........
BeginQTM
Project
Secure clientcommitmentto implementproject QTMPlanning &
Managementsystems
Identifyprojectwithclient
Est. ProjectManagement
goals andteam
membersfunctions
1Commitment
2Project
Definition
Communicateall availableinformation
to allproject
participants
“Mind Map”process w/
projectPrinciples.Results:
“End Items,”Allignment,
BasicActivities,Project
Commitment
3Preliminary
Planning Meetings
DevelopOutlines
forsecondphase ofmeetingsdistribute
&schedule
Establish Teamwork Criteriasystems, and activities
Establish Quality Criteriasystems, and activities
DevelopProjectlogic &activities
w/ projectprincipals.
Identifyall sub-projects
Load Resourcesinto Network
4Planning Meetings
DevelopComputer
CPMPERT
Network
DetailResourceLoading,If-Then
Analysis,Fine
Tuning &Revisions
5QTM Network
Creation
ProjectTeam
Review &Resopnsibility
Sign-Off.Commitment
to ProjectPlan
CommenceProject.
ImplementShort-Term
Schedules
ProjectCompletion
6Presentation& Sign-Off
7Plan theWork...Work
the Plan
8Completion
Team TechnologyQTM QualPERT® Network
QUALITY EVALUATION..... Team Commitment..... Quality Commitment..... Planning/Mgt. Commitment..... # Meetings..... # Contract Revisions..... Redundant Work..........
QUALITY EVALUATION..... Client Acceptance..... # Meetings..... # Changes..... Redundant Work..........
QUALITY EVALUATION..... Timely & attended meetings..... Prepared Team members..... Complete Information..... # Meetings..... Redundant Work..........
QUALITY EVALUATION..... One-Time Sign-Off..... Prompt Payment..... # Meetings..... # Changes..... Redundant Work..........
NEED TO START:• Purpose/Mission Stmts.• Needs Assessment• Project Scope• Intended Outcomes• Intended depth of P.M. system• QTM Presentation NEED TO START:
• Complete Information• Preliminary Layout

PACIFIC PLANNING INSTITUTE QTM ©2000 RANDOLPH L. CRAFT 48
The QTM Project Process
1. GAIN COMMITMENT FROM MANAGEMENT
Prior to a QTM Planning & Management installation, management commits theessential resources for the implementation of the process. These resources typicallyinclude:
1. Commitment to the program from top management.
2. The time to compile the required information.
3. Appropriate authority to manage effectively.
Commitment to these efforts will insure a fully functioning project managementsystem. This system will consistently deliver a 10 - 20% savings in all project expendi-tures while creating client confidence.
2. IDENTIFY / ASSIGN
• IDENTIFY PROJECT
After identifying a project, the first step is to clarify project scope and intended results.Identifying the intended results in measurable terms creates:
1. Criteria upon which the success of a project can be measured
2. Definitive goals
3. A project framework from which the basic resource requirements can be determined
BeginQTM
Project
Secure clientcommitmentto implementproject QTMPlanning &
Managementsystems
Identifyprojectwithclient
Est. ProjectManagement
goals andteam
membersfunctions
1Commitment
2Project
Definition
Communicateall availableinformation
to allproject
participants
“Mind Map”process w/
projectPrinciples.Results:
“End Items,”Allignment,
BasicActivities,Project
Commitment
3Preliminary
Planning Meetings
DevelopOutlines
forsecondphase ofmeetingsdistribute
&schedule
Establish Teamwork Criteriasystems, and activities
Establish Quality Criteriasystems, and activities
DevelopProjectlogic &activities
w/ projectprincipals.
Identifyall sub-projects
Load Resourcesinto Network
4Planning Meetings
DevelopComputer
CPMPERT
Network
DetailResourceLoading,If-Then
Analysis,Fine
Tuning &Revisions
5QTM Network
Creation
ProjectTeam
Review &Resopnsibility
Sign-Off.Commitment
to ProjectPlan
CommenceProject.
ImplementShort-Term
Schedules
ProjectCompletion
6Presentation& Sign-Off
7Plan theWork...Work
the Plan
8Completion

PACIFIC PLANNING INSTITUTE QTM ©2000 RANDOLPH L. CRAFT 49
• ESTABLISH PROJECT MANAGEMENT CRITERIA AND GOALS/ ASSIGN PROJECT TEAM
A project management system tracks all resources, schedules, budgets, and more. Not allprojects require the complete and detailed tracking that is available. Project managementcriteria sets the prerequisites for design of the management system and the selection of peoplerequired to achieve the stated project management goals.
Whether the management team consists of 1 or 100, it is important to establish strong teamswith defined responsibilities and authorities. In order to achieve maximum results, the goalsand values of the individual team members must be consistent with the overall goals and valuesof the project.
3. COMMUNICATION OF MEETING REQUIREMENTS FOR PROJECT PERSONNEL
It is critical for the various project leaders to acquire accurate information regarding eachcomponent of the project. This information is assembled and distributed to all projectparticipants before the planning meetings begin.
Planning meeting #1
Development of "Mind Map" - establishment of project “End Items.”
The purpose of this session is to identify and critique all the major components of the projectand identify the resources required. As a team we will identify the “milestone events” anddiscuss the critical components of the project and their potential impact. It is through thisskillfully guided process that each team member has the opportunity to begin interacting withother members. Properly facilitated, this process leaves each project management teammember with a common “view” of the entire project as well as securing a preliminary level ofalignment to the project’s completion.
BeginQTM
Project
Secure clientcommitmentto implementproject QTMPlanning &
Managementsystems
Identifyprojectwithclient
Est. ProjectManagement
goals andteam
membersfunctions
1Commitment
2Project
Definition
Communicateall availableinformation
to allproject
participants
“Mind Map”process w/
projectPrinciples.Results:
“End Items,”Allignment,
BasicActivities,Project
Commitment
3Preliminary
Planning Meetings
DevelopOutlines
forsecondphase ofmeetingsdistribute
&schedule
Establish Teamwork Criteriasystems, and activities
Establish Quality Criteriasystems, and activities
DevelopProjectlogic &activities
w/ projectprincipals.
Identifyall sub-projects
Load Resourcesinto Network
4Planning Meetings
DevelopComputer
CPMPERT
Network
DetailResourceLoading,If-Then
Analysis,Fine
Tuning &Revisions
5QTM Network
Creation
ProjectTeam
Review &Resopnsibility
Sign-Off.Commitment
to ProjectPlan
CommenceProject.
ImplementShort-Term
Schedules
ProjectCompletion
6Presentation& Sign-Off
7Plan theWork...Work
the Plan
8Completion

PACIFIC PLANNING INSTITUTE QTM ©2000 RANDOLPH L. CRAFT 50
4. DETAIL
•DEVELOPMENT OF PROJECT OUTLINE
The information gathered in the Mind Map planning meeting[s] is placed in a computer “ideapro-cessor” program to generate outlines, charts, and presentation materials. This informationis distributed to all project team members for their critique, commentary, and preparation forthe next set of meetings.
•DEVELOPMENT OF PROJECT LOGIC DIAGRAM
In modern project planning and management, milestone events are represented on a presen-tation board in a graphic manner and linked together according to the interdependencies thatone task or event might have on another. A “road map” of the project is created that graphicallydisplays the project’s logical flow from one task or group of tasks to another. The result is adiagram similar to a set of blueprints that a building contractor uses to build a structure.Blueprints show a contractor what materials and resources to use and their relationship to eachother. QTM logic charts tell a manager about activities, events - and much more.
Working Drawings
Pau
1/18/89
1/18/89
0
Design Demolition Plan
12/20/88
1/11/89
5
Ned
20Coordinate purchase contracts [ongoing]
1/12/89
3/20/89
20
Adm. Asst.
Solicit Contract Bids - Negotiate contracts
1/18/89
2/1/89
10
Paul
Obtain proper building permits
1/18/89
2/15/89
20
Ned
Approval from Consolodated and Owners
1/18/89
2/1/89
5
Contract for Demolition
12/28/88
1/18/89
5
Paul
Obtain Demolition Permit
12/28/88
1/18/89
5
Ned
Prep job site for new work
1/5/89
2/1/89
10
Demolition Cont
Begin Construction
2/1/89
2/1/89
0
Approval Process #3
2/1/89
2/1/89
0
$ Owners
Provide Job site supervision / Contract administration
2/1/89
4/26/89
60
Paul
Construction Process
2/1/89
4/26/89
60
Contractors #1
Coordinate final installation
3/9/89
4/24/89
5
Judy
Final walk-through
3/16/89
4/26/89
2
Judy
East West Project
Complete
4/26/89
4/26/89
0Approval
Process #4 Final
Payment to Designer
4/26/89
4/26/89
0
$ Owner
BeginQTM
Project
Secure clientcommitmentto implementproject QTMPlanning &
Managementsystems
Identifyprojectwithclient
Est. ProjectManagement
goals andteam
membersfunctions
1Commitment
2Project
Definition
Communicateall availableinformation
to allproject
participants
“Mind Map”process w/
projectPrinciples.Results:
“End Items,”Allignment,
BasicActivities,Project
Commitment
3Preliminary
Planning Meetings
DevelopOutlines
forsecondphase ofmeetingsdistribute
&schedule
Establish Teamwork Criteriasystems, and activities
Establish Quality Criteriasystems, and activities
DevelopProjectlogic &activities
w/ projectprincipals.
Identifyall sub-projects
Load Resourcesinto Network
4Planning Meetings
DevelopComputer
CPMPERT
Network
DetailResourceLoading,If-Then
Analysis,Fine
Tuning &Revisions
5QTM Network
Creation
ProjectTeam
Review &Resopnsibility
Sign-Off.Commitment
to ProjectPlan
CommenceProject.
ImplementShort-Term
Schedules
ProjectCompletion
6Presentation& Sign-Off
7Plan theWork...Work
the Plan
8Completion

PACIFIC PLANNING INSTITUTE QTM ©2000 RANDOLPH L. CRAFT 51
•RESOURCE LOADING
At the same time that the logic chart is being created, “Resource Loading” information is beinggathered. Resources are the time, materials, money, people, machinery, etc. that a projectrequires. In the “End Items - Milestone Event” and logic meetings, the primary discussions areabout the intended results of the project. Resource loading asks “What needs to be done?”,“Who will do it?”, “How long will it take?”, “How much will it cost?”, “Is there a deadline?”.Contingency planning involves “What will we do if we have problems with this event?”discussions. In a skillfully-led resource loading meeting, all participants “see” the projectunfold in their mind’s eye and “discover” details that are left out in normal circumstances.
Resource Name Cost/Day # Available Calendar Name Accrual Method
Architect 0.00 1.00 Project Calendar Multiple
Berghell Associates 0.00 1.00 Project Calendar Multiple
Civil Engineer 0.00 1.00 Project Calendar Multiple
Electrical Engineer 0.00 1.00 Project Calendar Multiple
General Contractor 0.00 1.00 Project Calendar Multiple
Mechanical Engineer 0.00 1.00 Project Calendar Multiple
Structural Engineer 0.00 1.00 Project Calendar Multiple
Utility Companies 0.00 1.00 Project Calendar Multiple
RESOURCE COST ENTRY FORM
Name Fixed Cost Fixed Income
Begin Project 0.00 0.00
Preliminary Architectural & Structural Design 0.00 0.00
Electrical Working Drawings 0.00 0.00
Mechanical Working Drawings 0.00 0.00
Plumbing Working Drawings 0.00 0.00
Architectural Working Drawings 0.00 0.00
Preliminary Civil Drawings 0.00 0.00
Preliminary Utility Drawings 0.00 0.00
Structural Steel Working Drawings 0.00 0.00
Civil Working Drawings 0.00 0.00
Utilities Working Drawings 0.00 0.00
Civil & Utilities Plan Check 0.00 0.00
Complete Structural Working Drawings 0.00 0.00
Receive Structural Steel Bids 0.00 0.00
Review Steel Bids and Issue Sub-contract 0.00 0.00
Correct & Re-Submit for Grading Permit 0.00 0.00
TASK COST ENTRY FORM

PACIFIC PLANNING INSTITUTE QTM ©2000 RANDOLPH L. CRAFT 52
• CREATE AND DEVELOP TEAM BUILDING CRITERIA & IMPLEMENTATION PLAN
While the logic chart is being created, “Team Building” information is being gathered.
Team Building is one of the most valuable disciplines in the business world. Most projects andbusinesses are concerned with the bottom line and have few if any resources available for teambuilding. Yet, at the heart of most business successes is the concept of "team."
Team building is a science and a skill developed from study, practice, and commitment. TeamTechnology, in the QTM planning and management system, makes use of proven team buildingprocedures.
• CREATE AND DEVELOP QUALITY CRITERIA & IMPLEMENTATION PLAN
While the logic chart is being created, “Quality” information is being gathered.
Quality is defined as "the elimination of variation in any productive process" (Deming).
Like team building, developing quality is an exacting science with highly-defined practices andprocedures that have been amply proven internationally over the past thirty years. A QTMplanning and management program defines and implements the appropriate quality practicesand procedures.
BeginQTM
Project
Secure clientcommitmentto implementproject QTMPlanning &
Managementsystems
Identifyprojectwithclient
Est. ProjectManagement
goals andteam
membersfunctions
1Commitment
2Project
Definition
Communicateall availableinformation
to allproject
participants
“Mind Map”process w/
projectPrinciples.Results:
“End Items,”Allignment,
BasicActivities,Project
Commitment
3Preliminary
Planning Meetings
DevelopOutlines
forsecondphase ofmeetingsdistribute
&schedule
Establish Teamwork Criteriasystems, and activities
Establish Quality Criteriasystems, and activities
DevelopProjectlogic &activities
w/ projectprincipals.
Identifyall sub-projects
Load Resourcesinto Network
4Planning Meetings
DevelopComputer
CPMPERT
Network
DetailResourceLoading,If-Then
Analysis,Fine
Tuning &Revisions
5QTM Network
Creation
ProjectTeam
Review &Resopnsibility
Sign-Off.Commitment
to ProjectPlan
CommenceProject.
ImplementShort-Term
Schedules
ProjectCompletion
6Presentation& Sign-Off
7Plan theWork...Work
the Plan
8Completion

PACIFIC PLANNING INSTITUTE QTM ©2000 RANDOLPH L. CRAFT 53
5.• COMPUTER IMPLEMENTATION OF PERT/CPM COMPUTER NETWORK AND ANALYSIS OF PROJECT
The necessary information has now been gathered to develop a comprehensive CPM/PERTnetwork that will act as a project management blueprint. After the network has been built,computer analysis of the information offers many advantages to the management team. Forinstance, all resources can be checked against their availability to assure maximum resourceutilization. This analysis also warns of overtime or overwork of valued resources. Projectoperational cash flows can be compared in simulations that can be performed to determine thebest use of available funds.
Following is a sample of some of the documents derived from a comprehensive CPM/PERTnetwork and a description of the document’s use:
RESOURCE TIMELINE - THE SCHEDULE OF EVERY RESOURCE ON THE PROJECT
12/31/87 3/31/88 6/30/88 9/29/88 12/29/88
ArchitectPreliminary Architectural & Structural Design
Architectural Working Drawings
Integrate Consultant Working Drawings
Berghell AssociatesReview Preliminary Cost Estimate
Civil EngineerPreliminary Civil Drawings
Civil Working Drawings
Electrical EngineerElectrical Working Drawings
General Contractor Receive Structural Steel Bids
Review Steel Bids and Issue Sub-contract
BeginQTM
Project
Secure clientcommitmentto implementproject QTMPlanning &
Managementsystems
Identifyprojectwithclient
Est. ProjectManagement
goals andteam
membersfunctions
1Commitment
2Project
Definition
Communicateall availableinformation
to allproject
participants
“Mind Map”process w/
projectPrinciples.Results:
“End Items,”Allignment,
BasicActivities,Project
Commitment
3Preliminary
Planning Meetings
DevelopOutlines
forsecondphase ofmeetingsdistribute
&schedule
Establish Teamwork Criteriasystems, and activities
Establish Quality Criteriasystems, and activities
DevelopProjectlogic &activities
w/ projectprincipals.
Identifyall sub-projects
Load Resourcesinto Network
4Planning Meetings
DevelopComputer
CPMPERT
Network
DetailResourceLoading,If-Then
Analysis,Fine
Tuning &Revisions
5QTM Network
Creation
ProjectTeam
Review &Resopnsibility
Sign-Off.Commitment
to ProjectPlan
CommenceProject.
ImplementShort-Term
Schedules
ProjectCompletion
6Presentation& Sign-Off
7Plan theWork...Work
the Plan
8Completion

PACIFIC PLANNING INSTITUTE QTM ©2000 RANDOLPH L. CRAFT 54
Starting Plan Costs Plan Income Actual Costs Actual Income Ending Plan Cumulative Actual Cumulative
1/1/90 2080.00 0.00 0.00 0.00 2/1/90 -2080.00 0.00
2/1/90 15100.00 0.00 0.00 0.00 3/1/90 -17180.00 0.00
3/1/90 415650.00 0.00 0.00 0.00 4/1/90 -432830.00 0.00
4/1/90 110950.00 0.00 0.00 0.00 5/1/90 -543780.00 0.00
5/1/90 438300.00 0.00 0.00 0.00 6/1/90 -982080.00 0.00
6/1/90 18750.00 0.00 0.00 0.00 7/1/90 -1000830.00 0.00
7/1/90 49600.00 0.00 0.00 0.00 8/1/90 -1050430.00 0.00
8/1/90 23300.00 0.00 0.00 0.00 9/1/90 -1073730.00 0.00
9/1/90 48200.00 0.00 0.00 0.00 10/1/90 -1121930.00 0.00
10/1/90 53700.00 0.00 0.00 0.00 11/1/90 -1175630.00 0.00
11/1/90 13500.00 0.00 0.00 0.00 12/1/90 -1189130.00 0.00
12/1/90 0.00 0.00 0.00 0.00 1/1/91 -1189130.00 0.00
1/1/91 0.00 0.00 0.00 0.00 2/1/91 -1189130.00 0.00
2/1/91 0.00 0.00 0.00 0.00 3/1/91 -1189130.00 0.00
3/1/91 5000.00 0.00 0.00 0.00 4/1/91 -1194130.00 0.00
Cash Flow tableCash Flow table
A project cash flow table is available when the task and resource cost have been entered.
There are many other sophisticated forms of project information available from a computer-generated QTM operationalplanning and management program.
12/23/89 1/6/90 1/20/90 2/3/90 2/17/90 3/3/90
0.00
0.50
1.00
1.50
2.00
PatrickPatrick
Resource Histograms show the use of each resource on the project. Resources that are over-utilized or under-utilized caneasily be spotted with this tool. The computer will also level resource utilization in the event of resource schedulingconflicts.

PACIFIC PLANNING INSTITUTE QTM ©2000 RANDOLPH L. CRAFT 55
6.• PROJECT TEAM REVIEW & SIGN OFF
This is the final step of the planning process. All project team members sign off and agree thatthe logic, resources, and project completion frames are acceptable. This creates a sense ofresponsibility on the part of all participants involved. Each signer sees the project as a whole,the project’s task and event dependencies, and acknowledges his/her part.
This process is a mini-project completion. The whole team, by developing a QTM planning andmanagement program, have created and completed the project in their mind’s eye. They haveworked together discussing potential problems and solutions, and have worked together indecision-making situations. In the past decade, we have discovered that what happens in theplanning meetings is what usually happens when the plan is being implemented . “At theplanning table, a change requires an eraser - in the field, it requires a checkbook...”- David Owens.
7.• IMPLEMENTATION
“Plan the work. Work the plan...” “If you don’t know where you are going, you’ll never knowif you are lost...” “A project without a plan is like a ship without a captain - no real problems aslong as the water is deep and the weather is calm...” “Failing to plan is like planning to fail...”
This is when all of the previous planning work starts paying off. Project management teammembers to experience de'je vu from time to time because they have gone over some of thescenarios that come up in the project in their mind’s eye during the planning sessions.
A plan measures and records change. It is on the actual plan that the events of the project arerecorded. These real-time events are then measured against the plan to see how accurate theplanning assumptions were. People get a chance to remember what they were thinking in theplanning session, and to see how it measures up to reality. This accelerates the learning curvein gaining experience on the job. As new information is generated, the plan extrapolates newschedules and cash flows created by unexpected circumstances.
A good plan becomes “Action Central” of the project. People rally to discuss the progress andmake and record decisions for the future. A good plan graphically lets everyone know theproject status, who is (and isn’t) doing what, and what needs to be done. It becomes theproject’s assistant manager by leveling resources, generating reports for management, creatingnew schedules as required, and communicating project progress to all involved.
BeginQTM
Project
Secure clientcommitmentto implementproject QTMPlanning &
Managementsystems
Identifyprojectwithclient
Est. ProjectManagement
goals andteam
membersfunctions
1Commitment
2Project
Definition
Communicateall availableinformation
to allproject
participants
“Mind Map”process w/
projectPrinciples.Results:
“End Items,”Allignment,
BasicActivities,Project
Commitment
3Preliminary
Planning Meetings
DevelopOutlines
forsecondphase ofmeetingsdistribute
&schedule
Establish Teamwork Criteriasystems, and activities
Establish Quality Criteriasystems, and activities
DevelopProjectlogic &activities
w/ projectprincipals.
Identifyall sub-projects
Load Resourcesinto Network
4Planning Meetings
DevelopComputer
CPMPERT
Network
DetailResourceLoading,If-Then
Analysis,Fine
Tuning &Revisions
5QTM Network
Creation
ProjectTeam
Review &Resopnsibility
Sign-Off.Commitment
to ProjectPlan
CommenceProject.
ImplementShort-Term
Schedules
ProjectCompletion
6Presentation& Sign-Off
7Plan theWork...Work
the Plan
8Completion

PACIFIC PLANNING INSTITUTE QTM ©2000 RANDOLPH L. CRAFT 56
• PROJECT COMPLETION
By the time the project is complete, all information has been stored within the project’sdocuments. It becomes an excellent tool for plan-to-actual analysis, historical refer-ence, and a great reference tool for the future.
Another valuable use of the planning process is finding out if a project is feasible. Mostentrepreneurs will have a plan done before committing major resources to an idea. Theplan’s documents are excellent presentation tools for securing funding for newprojects.
The successful completion of a well-planned project represents a major commitmenton the part of all project team members. Enjoy the success.
BeginQTM
Project
Secure clientcommitmentto implementproject QTMPlanning &
Managementsystems
Identifyprojectwithclient
Est. ProjectManagement
goals andteam
membersfunctions
1Commitment
2Project
Definition
Communicateall availableinformation
to allproject
participants
“Mind Map”process w/
projectPrinciples.Results:
“End Items,”Allignment,
BasicActivities,Project
Commitment
3Preliminary
Planning Meetings
DevelopOutlines
forsecondphase ofmeetingsdistribute
&schedule
Establish Teamwork Criteriasystems, and activities
Establish Quality Criteriasystems, and activities
DevelopProjectlogic &activities
w/ projectprincipals.
Identifyall sub-projects
Load Resourcesinto Network
4Planning Meetings
DevelopComputer
CPMPERT
Network
DetailResourceLoading,If-Then
Analysis,Fine
Tuning &Revisions
5QTM Network
Creation
ProjectTeam
Review &Resopnsibility
Sign-Off.Commitment
to ProjectPlan
CommenceProject.
ImplementShort-Term
Schedules
ProjectCompletion
6Presentation& Sign-Off
7Plan theWork...Work
the Plan
8Completion

PACIFIC PLANNING INSTITUTE QTM ©2000 RANDOLPH L. CRAFT 57
QUALITY TEAM MANAGEMENT
SUMMARY

PACIFIC PLANNING INSTITUTE QTM ©2000 RANDOLPH L. CRAFT 58
QTM ,Quality TeamManagement,improves thequality ofpeople’s livesthrough theirwork.
SUMMARY
As we have mentioned before, competentuse of any one of the QTM componentsyields improved results in all endeavors.Skillfully combined, these three indepen-dent disciplines add synergistically to eachother when implemented as one overallsystem.
•QUALITY
Quality programs increase market share,increase profit, and decrease costs whileeducating the worker and improving thework experience for all involved.
•TEAM
Team building increases productivity andcompetitiveness while upgrading the workexperience through healthy competition,acknowledgment, and fun.
•MANAGEMENT
Planning and management skills add tothe bottom line through efficiency. Thirtyyear studies reveal a 15 to 25% savings onall resources used by projects that arewell planned and managed. Those re-sources are materials, money, time, andthe various human energies used to com-plete any task.
"Modern business tools for changingtimes." Its true...
QTM makes good sense and is goodbusiness. It works.
And... QTM was designed for and goesbeyond just improving tangible outputand "bottem line" results in business. QTMaddresses itself to the relationship thatpeople have with their work and the rela-tionship that work has with life. QTM wasand is influenced by and personally con-tributed to by such great contemporaryfuturists and thinkers as Dr. R. Buckmin-ster Fuller and Dr. W. Edwards Deming.Larry Wilson, Antony Robbins, Tom Pe-ters, Alvin Toffler, and Ken Blanchard area few of the others who have participatedthrough personal work or interaction. TheQTM system was well researched and de-signed for the future that has arived.
PACIFIC PLANNING INSTITUTE believes that a"quality" experience in the workplace isfundamental to the production of a "qual-ity" product or service. QTM was de-signed to improve the performance of anyendeavor, and bring the American spiritback into the workplace.
QTM, or any of its individual components,is only for those who are serious aboutand comitted to long-term successful busi-ness endeavours and willing to invest in,and demonstrate that commitment.
QTM, Quality Team Management, im-proves the quality of people’s lives throughtheir work.

PACIFIC PLANNING INSTITUTE QTM ©2000 RANDOLPH L. CRAFT 59
THE PPI CHALLENGE
eing competitive in today's growing
global market will require substantially
more than merely the delivery of prod-
ucts and services...
on time and within budget..
We must develop and create "quality"
work environments that transform the
human experience in the work place.
Joy, enthusiasm, pride of ownership, part-
nership, teamwork and an endless quest
for excellence are a few of the goals.
Identifying individual human values and
fostering the creation of working envi-
ronments and working systems that en-
able these values to be respected are
paramount and a prerequisite in our quest
as a nation to demonstrate global leader-
ship for the twenty first century.
“ The journey is the reward ”
RANDOLPH CRAFT
PACIFIC PLANNING INSTITUTE
B

PACIFIC PLANNING INSTITUTE QTM ©2000 RANDOLPH L. CRAFT 60