preserving and creating shareholder value - rio tinto · 29 february 2016 highlightsbmo global...
TRANSCRIPT

29 February 2016 Highlights Performance Outlook Financial targets BMO Global Metals & Mining Conference 2016
Preserving and creating shareholder value Alan Davies, chief executive, Diamonds & Minerals

©2016, Rio Tinto, All Rights Reserved
Cautionary statements
This presentation has been prepared by Rio Tinto plc and Rio Tinto Limited (“Rio Tinto”). By accessing/attending this presentation you acknowledge that you have read and
understood the following statement.
Forward-looking statements
This document contains certain forward-looking statements with respect to the financial condition, results of operations and business of the Rio Tinto Group. These statements are
forward-looking statements within the meaning of Section 27A of the US Securities Act of 1933, and Section 21E of the US Securit ies Exchange Act of 1934. The words “intend”,
“aim”, “project”, “anticipate”, “estimate”, “plan”, “believes”, “expects”, “may”, “should”, “will”, “target”, “set to” or similar expressions, commonly identify such forward-looking
statements.
Examples of forward-looking statements include those regarding estimated ore reserves, anticipated production or construction dates, costs, outputs and productive lives of assets
or similar factors. Forward-looking statements involve known and unknown risks, uncertainties, assumptions and other factors set forth in this presentation.
For example, future ore reserves will be based in part on market prices that may vary significantly from current levels. These may materially affect the timing and feasibility of
particular developments. Other factors include the ability to produce and transport products profitably, demand for our products, changes to the assumptions regarding the
recoverable value of our tangible and intangible assets, the effect of foreign currency exchange rates on market prices and operating costs, and activities by governmental
authorities, such as changes in taxation or regulation, and political uncertainty.
In light of these risks, uncertainties and assumptions, actual results could be materially different from projected future results expressed or implied by these forward-looking
statements which speak only as to the date of this presentation. Except as required by applicable regulations or by law, the Rio Tinto Group does not undertake any obligation to
publicly update or revise any forward-looking statements, whether as a result of new information or future events. The Group cannot guarantee that its forward-looking statements
will not differ materially from actual results. In this presentation all figures are US dollars unless stated otherwise.
Disclaimer
Neither this presentation, nor the question and answer session, nor any part thereof, may be recorded, transcribed, distributed, published or reproduced in any form, except as
permitted by Rio Tinto. By accessing/ attending this presentation, you agree with the foregoing and, upon request, you will promptly return any records or transcripts at the
presentation without retaining any copies.
This presentation contains a number of non-IFRS financial measures. Rio Tinto management considers these to be key financial performance indicators of the business and they
are defined and/or reconciled in Rio Tinto’s annual results press release and/or Annual report.
Reference to consensus figures are not based on Rio Tinto’s own opinions, estimates or forecasts and are compiled and published without comment from, or endorsement or
verification by, Rio Tinto. The consensus figures do not necessarily reflect guidance provided from time to time by Rio Tinto where given in relation to equivalent metrics, which to
the extent available can be found on the Rio Tinto website.
By referencing consensus figures, Rio Tinto does not imply that it endorses, confirms or expresses a view on the consensus figures. The consensus figures are provided for
informational purposes only and are not intended to, nor do they, constitute investment advice or any solicitation to buy, hold or sell securities or other financial instruments. No
warranty or representation, either express or implied, is made by Rio Tinto or its affiliates, or their respective directors, officers and employees, in relation to the accuracy,
completeness or achievability of the consensus figures and, to the fullest extent permitted by law, no responsibility or liability is accepted by any of those persons in respect of those
matters. Rio Tinto assumes no obligation to update, revise or supplement the consensus figures to reflect circumstances existing after the date hereof.
2

©2016, Rio Tinto, All Rights Reserved
All injury frequency rates Per 200,000 hours worked
3
Safety and our values are fundamental
Accountability
Respect
Integrity
Teamwork
• Relentless pursuit of shareholder value
• Disciplined decision-making
• For the environment and communities
• For health, safety and wellbeing
• Transparency in what we do
• Fairness, honesty and openness
• Long-term partnerships
• Continuous improvement 0.0
0.2
0.4
0.6
0.8
1.0
1.2
1.4
1.6
1.8
2.0
03 04 05 06 07 08 09 10 11 12 13 14 15

©2016, Rio Tinto, All Rights Reserved
4
Continued delivery of our promises in 2015
Underlying earnings of $4.5 billion
Net cash from operating activities of $9.4 billion
Reduced costs by $1.3 billion and working capital by $1.5 billion
Reduced capex spend to $4.7 billion
Returned $6.1 billion of cash to shareholders
Strong balance sheet with net debt of $13.8 billion
Full year 2015 dividend of 215 cents per share

©2016, Rio Tinto, All Rights Reserved
Reduced costs
Decreased capex
Operating, exploration & evaluation cost reductions achieved by 31 December 2015 vs 2012 base Total capital expenditure in each year
Recycling capital
via divestments
Released working capital
Divestments announced or completed
since January 2013
Working capital cash release achieved on 31 December
2015 vs 2012 base
2013 2014 2015 Total savings
0.6
1.5
1.5 3.6
17.6
13.0
8.2
4.7
2012 2013 2014 2015
~4
5
Rio Tinto has taken decisive early action…
$4.7bn
2013 2014 2015 Total savings
3.3
1.5
1.3 6.2

©2016, Rio Tinto, All Rights Reserved
22.1
18.1
12.5
14.5 13.7 13.8
SBB
28%
25%
19%
21% 21%
24%
Jun-13 Dec-13 Dec-14 Pro formaDec-14*
Jun-15 Dec-15
Dividends
6
…which has enabled returns to shareholders, strengthened the balance sheet…
3.3
3.7
4.1
2.0
13.1
2013 2014 2015 Total
Share buy-backs
Shareholder returns
US$ billion
Net debt and gearing ratio1
US$ billion
6.1
1 Gearing ratio = net debt/ (net debt + book equity).
* Post 2015 $2 billion share buy-back.
Gearing ratio Net debt
8.3

©2016, Rio Tinto, All Rights Reserved
… and maintained 34% Group EBITDA margins 7
Iron Ore
• Pilbara operating FOB EBITDA margins
of 60%
• Cash flows from operations of $6,061m
and free cash flow of $4,335m
• Underlying earnings of $3,952m
Aluminium
• Integrated operating EBITDA margins
of 31%
• Cash flows from operations of $2,413m
and free cash flow of $817m
• Underlying earnings of $1,118m
Copper & Coal
• Copper operating EBITDA margins of
34% and 18% in Coal
• Cash flows from operations of $1,775m
and free cash flow of $1,008m
• Underlying earnings of $274m
Diamonds & Minerals
• Operating FOB EBITDA margins of 29%
• Cash flows from operations of $1,010m
and free cash flow of $554m
• Underlying earnings of $189m

©2016, Rio Tinto, All Rights Reserved
Full year dividend maintained year-on-year 8
• Final dividend of 107.5 cents per
share declared by the board
− To be paid in April 2016
• Total full year 2015 dividend
declared of 215 cents per share
− In pounds, equates to 6%
increase
− In Australian dollars, equates to
16% increase
107.5
107.5 215 215
FY 2014 2015 interim 2015 final FY 2015
Dividends declared per share
US cents

©2016, Rio Tinto, All Rights Reserved
2015 1 Oct 2015 to date
FX
USD Index(1)
Co
mm
od
itie
s
Index(2)
Brent Oil
Copper
Iron ore
Eq
uit
y MSCI Global
MSCI Emerging
Markets
9
There has been a significant deterioration in the macro environment…
Developed economies
Prices up to close of business on 9 February 2016. (1) Bloomberg index comparing USD to a basket of 10 global currencies.
(2) Thomson Reuters CRB Commodity Index. Source: Bloomberg
9.3%
(23.4%)
(35.0%)
(25.3%)
(38.9%)
(2.7%)
(17.0%)
(0.1%)
(18.7%)
(36.4%)
(11.5%)
(18.4%)
(6.3%)
(8.5%)

©2016, Rio Tinto, All Rights Reserved
9,305
3,791
4,540
2,007 359 132
833 120
(7,695)
(185)
(336)
0
2,000
4,000
6,000
8,000
10,000
2014underlyingearnings
Price Exchangerates
Energy Inflation Flexed 2014 earnings
Volumes Cash costreductions
Exploration& evaluation(excludingdisposals &writedowns)
Tax andother
2015underlyingearnings
10
Prices reduced earnings by over 80%, partially offset by exchange, energy and management actions
Underlying earnings 2014 vs 2015 US$ million (post tax)
Total cost reductions
of $953m post-tax or
$1,336m pre-tax

©2016, Rio Tinto, All Rights Reserved
• Macro, market and commodity
weakness
• Reduces outlook for near-term cash
flows
• Dividends sustainability determined
by earnings and cash flows
• Further pre-emptive action required
− Maintains strength of the business
− Foundation of sustainable
shareholder value creation
2015 underlying earnings flexed for iron ore prices US$ billion
11
Current uncertainty reduces outlook for near-term cash flows
1 2015 underlying earnings flexed using Rio Tinto’s published earnings sensitivity for iron ore based on consensus analyst estimates published on Rio Tinto’s website on 1
February 2016. See disclaimer on slide 2.
4.5
2.7
2015
underlying
earnings
2015
dividends
4.1
(1.8)
2015 earnings
flexed for 2016
consensus iron
ore prices1

©2016, Rio Tinto, All Rights Reserved
…so further pre-emptive actions are required to protect shareholder value
12
Operating and
commercial excellence
Capital allocation
discipline
Reduce costs
$1 billion in 2016 and a further
$1 billion in 2017
Additional capex reductions
over 2016 and 2017 against
previous guidance
Operating, exploration & evaluation cost reductions compared to 2015 base
Previous capex guidance of $5 billion in 2016 and $7
billion in 2017
by
$2bn by
$3bn

©2016, Rio Tinto, All Rights Reserved
13
New dividend policy and capital allocation commitment
• Progressive policy replaced with new
dividend policy
• Balance between interim and final to be
weighted towards the final dividend
• New capital allocation commitment
− Balance between cash returns and
investment
− Target total cash returns to
shareholders of 40%-60% of
underlying earnings through the
cycle
• Intention for 2016 full year dividend of
not less than 110 US cents per share
At the end of each financial period, the board will
determine an appropriate total level of ordinary
dividend per share, taking into account the
results for the financial year, the outlook for our
major commodities, the board’s view of the long-
term growth prospects of the business and the
Company’s objective of maintaining a strong
balance sheet. The intention is that the balance
between the interim and final dividend is
weighted to the final dividend.
The board expects total cash returns to
shareholders over the longer term to be in a
range of 40-60% of underlying earnings in
aggregate, through the cycle.
The board is committed to maintaining an
appropriate balance between cash returns to
shareholders and investment in the business,
with the intention of maximising shareholder
value. Acknowledging the cyclical nature of the
industry, in periods of strong earnings and cash
generation, it is the board’s intention to
supplement the ordinary dividends with
additional returns to shareholders.
©2016, Rio Tinto, All Rights Reserved
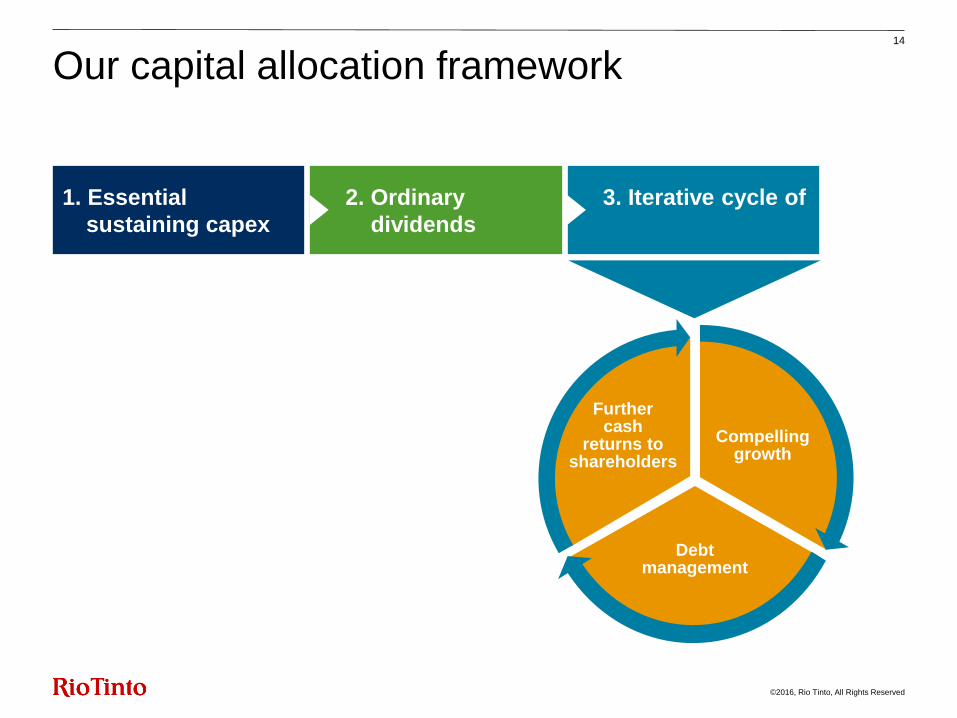
3. Iterative cycle of
2. Ordinary
dividends
14
Our capital allocation framework
Compelling growth
Further cash
returns to shareholders
Debt management
1. Essential
sustaining capex

©2016, Rio Tinto, All Rights Reserved
2012 2013 2014 2015
Sustaining Growth
15
Track record of balanced capital allocation
Demonstrable capital discipline US$ billion
Leads to more balanced allocation Capital to cash returns to shareholders (Percentage)
14% 20%
31% 37% 7%
19%
79% 80% 69% 44%
2012 2013 2014 2015
Dividends Share buy-backs Capital expenditure
17.6
13.0
8.2
4.7
21%
56%

©2016, Rio Tinto, All Rights Reserved
16
Preserving and creating shareholder value
World-class portfolio
Sustainable
shareholder
returns Capital
allocation discipline
Balance sheet
strength
Quality growth
Free
cash flow
generation
Operating and
commercial excellence

29 February 2016 Highlights Performance Outlook Financial targets BMO Global Metals & Mining Conference 2016
Appendix

©2016, Rio Tinto, All Rights Reserved
18
Net earnings
US$m
2015 underlying earnings 4,540
Impairments (1,802)
Losses/gains on disposals 48
Exchange losses on
debt and derivatives (3,282)
Increased closure provision
for legacy operations (233)
Restructuring costs and
global headcount reductions (258)
Other 121
2015 net earnings/(loss) (866)

©2016, Rio Tinto, All Rights Reserved
2,923
1,410
1,616
402 60
212 118
(1,958)
(17) (82)
(42)
0
1,000
2,000
3,000
H1 2015underlyingearnings
Price Exchangerates
Energy Inflation H1 2015flexed
earnings
Volumes Cash costreductions
Exploration&
evaluation(excludingdisposals &writedowns)
Tax andother
H2 2015underlyingearnings
19
Exchange rates, lower energy costs and volumes partially offset impact of lower prices
Underlying earnings H1 2015 vs H2 2015 US$ million (post tax)

©2016, Rio Tinto, All Rights Reserved
20
Weaker prices significantly reduced underlying earnings in 2015
Underlying earnings 2014 vs 2015 US$ million (post tax)
9,305
(7,695)
0
2,000
4,000
6,000
8,000
10,000
2014underlyingearnings
Price
(37) (52) (79) (128) (136) (141) (164)
(548)
(855)
(5,555)

©2016, Rio Tinto, All Rights Reserved
9,305
3,791 2,007 359
132
(7,695)
(185)
0
2,000
4,000
6,000
8,000
10,000
2014underlyingearnings
Price Exchangerates
Energy Inflation Flexed2014
underlyingearnings
Volumes
21
… partly offset by favourable exchange rates, lower energy costs and higher volumes
Underlying earnings 2014 vs 2015 US$ million (post tax)
398
81 39 25
(20) (26) (89)
(276)

©2016, Rio Tinto, All Rights Reserved
1,366
244
377
(1,499)
Openingbalance
31 Dec. 2014
Non-cash Cash Closing balance31 Dec. 2015
658
841
Price Non-price
$1.5 billion of cash released from working capital 22
Working capital balance reconciliation US$ million
Net decrease of $1,122m

©2016, Rio Tinto, All Rights Reserved
22.1
18.1
12.5
14.5 13.7 13.8
SBB
28%
25%
19%
21% 21%
24%
Jun-13 Dec-13 Dec-14 Pro formaDec-14*
Jun-15 Dec-15
• $2 billion share buy-back completed
funded from 2014 cash flows
• Net debt levels almost flat half-on-
half in 2015, despite buy-back
• $9.4 billion of cash on hand as at 31
December 2015
• Targeting 20-30% gearing ratio
through the cycle
− Net gearing impacted by exchange
movements and impairments
− Remains in lower half of target
gearing range
• Strong balance sheet remains a
competitive advantage
Net debt and gearing ratio1
US$ billion
1 Gearing ratio = net debt/ (net debt + book equity). * Post 2015 $2 billion share buy-back.
23
Low net debt levels keep gearing ratio at the lower end of our guidance range
Gearing ratio Net debt

©2016, Rio Tinto, All Rights Reserved
24
Pilbara: our low-cost advantage has been sustained over many years
• 2015 cash unit cost of $14.90/t (24%
lower than $19.50/t in 2014)
• Maintain consistently attractive FOB
EBITDA margins (60% in 2015)
• Average realised FOB price of
$48.40 per wet metric tonne
($52.60/dry metric tonne)
• Pilbara infrastructure project
completed in H1 2015
• Expect global shipments of
~350Mt/a in 2016
Pilbara cash unit cost US$ per tonne
20.4
18.7
16.2
13.8
H1 2014 H2 2014 H1 2015 H2 2015

©2016, Rio Tinto, All Rights Reserved
25
Iron Ore: increased volumes and cost reductions delivered against lower prices
Underlying earnings 2014 vs 2015 US$ million (post tax)
8,107
3,506 3,952
772 230 398
314
(5,541)
(62) (266)
0
2,000
4,000
6,000
8,000
10,000
2014underlyingearnings
Price Exchangerates
Energy Inflation Flexed2014
earnings
Volumes Cash costreductions
Tax & other 2015underlyingearnings
• Global shipments of 336.6 million tonnes was 11% higher than in 2014 following completion of the brownfield developments and
expanded infrastructure in the Pilbara, enabling a drawdown of inventories, as well as improvements at Iron Ore Company of
Canada.
• Pilbara FOB EBITDA margins of 60% achieved in 2015 (68% in 2014) despite a 43% decline in average 62% Fe index prices
compared to 2014.
• Pilbara cash unit costs to $14.90 per tonne in 2015, compared with $19.50 per tonne in 2014.
• Total cost reductions delivered in 2015 of $428 million pre-tax, through productivity improvements and lower contractor costs.
Total pre-tax Iron Ore cost savings delivered since 2012 are now to $1,138 million.
• Pilbara iron ore revenues includes $918 million of freight in 2015 compared to $1,312 million in 2014, following significant
declines in freight rates period on period.

©2016, Rio Tinto, All Rights Reserved
The world’s best aluminium business
Clear focused strategy: Bauxite and first quartile smelters are key pillars
26
Alumina Aluminium Bauxite
Industry-leading bauxite position
Bauxite production +4%, with
+14% in 3rd party sales to 26.6
million tonnes
Achieved FOB EBITDA margins
of 51% in 2015
Market-paced growth
starts with Amrun
Provides competitive security
of supply for our first cost
quartile smelter portfolio
Improved financial performance
in 2015 but more to do
Alumina production +4%,
reflecting continued consistent
performance across Rio
Tinto’s refineries
Sector-leading primary metal
2015 EBITDA margin of 23%
Average cost position in the 11th
percentile of industry cost curve
~80% of power from low-
carbon sources
Focused on cash generation

©2016, Rio Tinto, All Rights Reserved
• Average LME prices decreased 11% year on year. While physical delivery market premiums fell back from their highs in early
2015, value-added product premia continued to be robust, averaging $251 per tonne in 2015. The average realised price per
tonne averaged $2,058 in 2015 (2014: $2,395).
• Favourable currency movements in Canada and Australia increased underlying earnings by $661 million, partially offsetting the
price impact of $958 million.
• Total 2015 cost savings were $326 million pre-tax. These were achieved through reduced raw material costs, increased
productivity and lower labour costs, taking total pre-tax Aluminium cost savings delivered since 2012 to $1,132 million.
• Integrated operations EBITDA margins increased to 31% in 2015, compared to 29% in 2014. This performance and reduced
working capital delivered strong operating cash flows of $2.4 billion and more than $800 million of free cash flow.
• The modernised and expanded Kitimat smelter poured first hot metal in 2015 and the ramp up towards 420,000 tonne nameplate
capacity is expected in early 2016.
• Bauxite revenues includes $205 million of freight in 2015 ($256 million in 2014).
27
Aluminium: exchange rates and cost improvements almost completely offset lower prices
Underlying earnings 2014 vs 2015 US$ million (post tax)
1,248
910 1,118
661 11 25 239
(958)
(52) (7) (49)
0
1,000
2,000
2014underlyingearnings
Price Exchangerates
Energy Inflation Flexed2014
earnings
Volumes Cash costreductions
Exploration& evaluation
Tax & other 2015underlyingearnings

©2016, Rio Tinto, All Rights Reserved
28
Delivering increased copper volumes through growing existing mines
H2 2015: KUC third party concentrate tolling
2016/2017: KUC volumes to recover following de-weighting/ de-watering of east wall
H1 2015: New 152kt per day concentrator commissioned at Escondida
2017: Commissioning of desalination plant
H2 2015: Higher grade areas exploited in the mine plan for Oyu Tolgoi open pit
2020+: First production from Oyu Tolgoi underground1
2016/2017: Metal share expected from Grasberg, with continued investment in underground2
2021+: Step-change in Grasberg participation to 40% of all production3
1 Earliest date of first production based on Turquoise Hill Resources Limited Oyu Tolgoi 2014 Technical Report published October 2014. 2 See Freeport-McMoRan’s Fourth Quarter 2015 Earnings Conference Call Presentation dated
January 26, 2016 (available on the Freeport-McMoRan website) for sales guidance and our Chartbook for current guidance on metal strip thresholds. 3 Rio Tinto shares in 40% of all metal above the metal strip and will benefit from 40% of all
metal produced from 2022 onwards.
Oyu Tolgoi
Grasberg
Escondida
Kennecott Utah Copper

©2016, Rio Tinto, All Rights Reserved
29
Copper & Coal: cost savings and exchange rates partially offset lower prices
Underlying earnings 2014 vs 2015 US$ million (post tax)
• The Copper & Coal group’s underlying earnings of $274 million, 67% lower than 2014, were heavily impacted by lower prices.
These were partly offset by the delivery of further cash cost savings, favourable exchange rates and energy costs. Lower
volumes were principally driven by Rio Tinto Kennecott, where efforts remained focused on de-weighting and de-watering the
east pit wall.
• Pre-tax cost reductions delivered in 2015 were $214 million bringing total pre-tax cost savings delivered by Copper & Coal since
2012 to $1,934 million.
• Despite the challenging market environment all Copper & Coal operations were free cash flow positive, contributing over $1
billion in free cash flows to the Group. Net cash generated from operating activities was $1.8 billion in 2015.
• To optimise smelter utilisation, Kennecott tolled 414 thousand tonnes of third party concentrate in 2015.
• At 31 December 2015, the Group had an estimated 252 million pounds of copper sales that were provisionally priced at 217 cents
per pound. The final price of these sales will be determined during the first half of 2016. This compares with 331 million pounds of
open shipments at 31 December 2014, provisionally priced at 288 cents per pound.
831
248 274
267 110 157
85
(934)
(26)
(201)
(15)
-250
0
250
500
750
1,000
2014underlyingearnings
Price Exchangerates
Energy Inflation Flexed2014
underlyingearnings
Volumes Cash costreductions
Exploration&
evaluation
Tax & other 2015underlyingearnings

©2016, Rio Tinto, All Rights Reserved
30
Diamonds & Minerals: delivering strong margins
Well positioned for consumer-driven growth
Borates Titanium Dioxide Diamonds
42% EBITDA margins
Production up 25% with
higher volumes from the
Argyle underground
A21 pipe project at
Diavik advancing as
planned
34% FOB EBITDA
margins
Demand for borates has
been stable globally
Continued to optimise
the MDDK process plant
29% FOB EBITDA
margins
Softer market conditions
as industry absorbs
feedstock inventories
Three of 13 furnaces
currently taken offline
33% FOB EBITDA
margins in salt
Uranium market
continues to suffer from
higher inventories
ERA mining stockpiles
and rehabilitating
Ranger mine
Salt & Uranium

©2016, Rio Tinto, All Rights Reserved
31
Diamonds & Minerals: favourable exchange and cost reductions partially offset lower prices and volumes
Underlying earnings 2014 vs 2015 US$ million (post tax)
269 295
189
266 5
3
52
(200)
(45)
(99) (62)
0
100
200
300
400
2014underlyingearnings
Price Exchangerates
Energy Inflation Flexed 2014earnings
Volumes Cash costreductions
Exploration&
evaluation
Tax & other 2015underlyingearnings
• Underlying earnings of $189 million were 30% lower than 2014, primarily driven by lower sales volumes following the decision to
optimise production to align with market demand.
• Volume reductions impacted cash costs which are calculated on a unit cash cost of production despite the fact absolute cash
costs were $832 million lower than in 2014 (including a $342 million benefit from exchange rate movements).
• Strong operating cash flows of over $1 billion made a free cash flow contribution to the Group of over $500 million.
• The Argyle underground mine continued to ramp up throughout 2015.
• On 26 June 2015, Rio Tinto announced the sale of its interest in the Murowa diamond mine in Zimbabwe.
• The $350 million development of the A21 kimberlite pipe at Diavik (Rio Tinto share $210 million), which will provide an important
source of incremental supply to maintain existing production levels, is currently proceeding as planned.
• Revenues included $279 million of freight in 2015 (2014: $343 million).

©2016, Rio Tinto, All Rights Reserved
• Other operations includes the Gove alumina refinery and RT Marine. The reduction in net loss reflects lower spend at
both Gove and RT Marine.
• Exploration costs were largely in line with last year, excluding losses on divestments in 2015.
• Other includes savings across central functions.
Other movements in underlying earnings 32
Underlying earnings impact
Energy & Inflation Volumes
Cash Costs
Epl'n eval'n
Epl'n eval'n 2014 disp
Non Cash
Interest, tax & other 2015 US$ million 2014
FX/ price
Other operations (240) (51) 3 9 2 - - 16 173 (88)
Central Exploration (net) (156) 17 - - - (10) 10 - (1) (140)
Interest (161) - - - - - - - (228) (389)
Other (593) 13 - - 118 - - 24 62 (376)
Total (1,150) (21) 3 9 120 (10) 10 40 6 (993)
©2016, Rio Tinto, All Rights Reserved
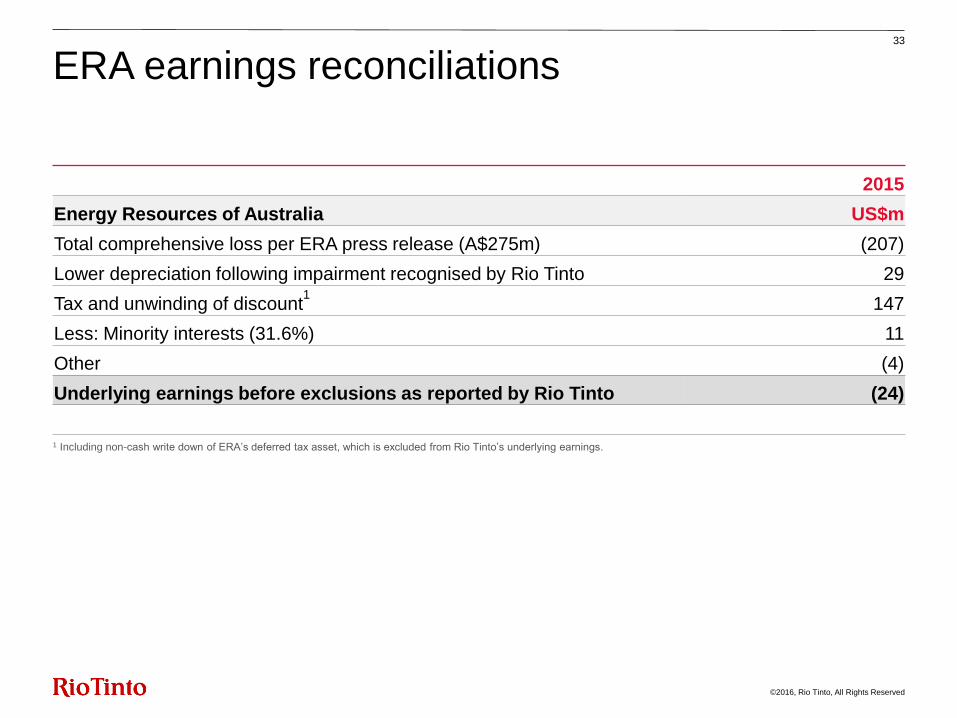
33
ERA earnings reconciliations
2015
Energy Resources of Australia US$m
Total comprehensive loss per ERA press release (A$275m) (207)
Lower depreciation following impairment recognised by Rio Tinto
29
Tax and unwinding of discount1 147
Less: Minority interests (31.6%) 11
Other (4)
Underlying earnings before exclusions as reported by Rio Tinto (24)
1 Including non-cash write down of ERA’s deferred tax asset, which is excluded from Rio Tinto’s underlying earnings.

©2016, Rio Tinto, All Rights Reserved
34
Modelling earnings
Note: The sensitivities give the estimated effect on underlying earnings assuming that each individual price or exchange rate moved in isolation. The relationship between currencies and commodity prices is a complex one and movements in exchange rates can affect movements in commodity prices and vice versa. The exchange rate sensitivities include the effect on operating costs but exclude the effect of revaluation of foreign currency working capital.
Earnings sensitivity
2015 average price/
rate
($m) impact on FY 2015 underlying earnings of 10%
price/rate change
Copper 249c/lb 213
Aluminium $1,661/t 416
Gold $1,160/oz 39
Iron ore (62% Fe FOB) $50/dmt 843
Coking coal (benchmark) $102/t 60
Thermal coal (average spot) $62/t 114
A$ 75USc 651
C$ 78USc 211
Oil $52/bbl 65