press and analyst meeting q2/2017 - vinh...
TRANSCRIPT

07/21/017
PRESS AND ANALYST
MEETING Q2/2017

Contents
Sales Report Q2/2017
Financial Results Q2/2017
Outlook for 2H2017
Q&A
2
1. Sales report Q2/2017
3

1. SALES REPORT Q2/2017 | MARKET SHARE
Accounts for 16% share of Vietnam pangasius exports, sustaining the leading
position
4
Vinh Hoan Group16%
Hung Vuong Group11%
Hung Ca Group8%
Biển Đông8%
Nam Việt Group5%
IDI5%
Đại Thành Group3%
Gò Đàng Group
3%
Trường Giang3%
Cadovimex II3%
190 công ty khác35%
Top 10 Vietnam pangasius exporters 1H2017
Source: Vietnam Customs
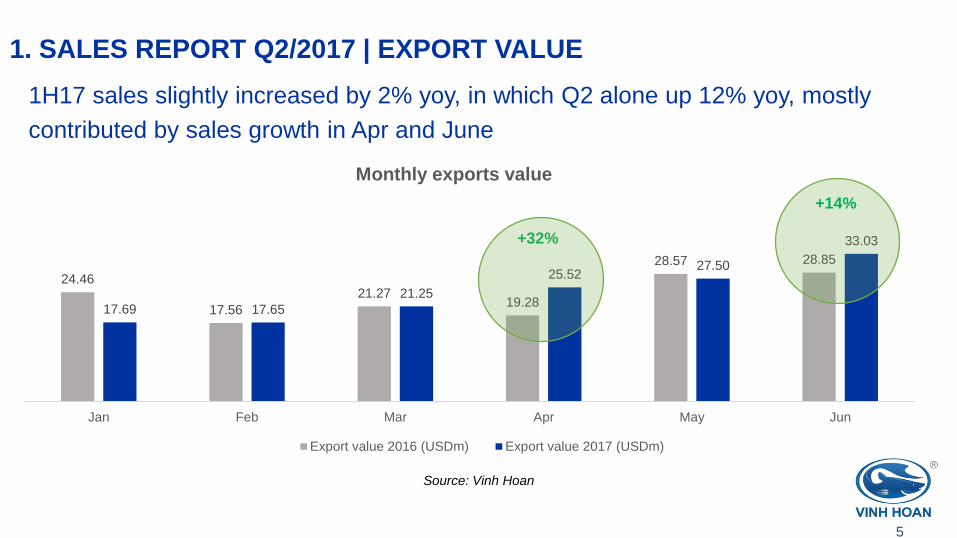
1. SALES REPORT Q2/2017 | EXPORT VALUE
1H17 sales slightly increased by 2% yoy, in which Q2 alone up 12% yoy, mostly
contributed by sales growth in Apr and June
5
Source: Vinh Hoan
24.46
17.56
21.2719.28
28.57 28.85
17.69 17.65
21.25
25.5227.50
33.03
Jan Feb Mar Apr May Jun
Monthly exports value
Export value 2016 (USDm) Export value 2017 (USDm)
+32%
+14%
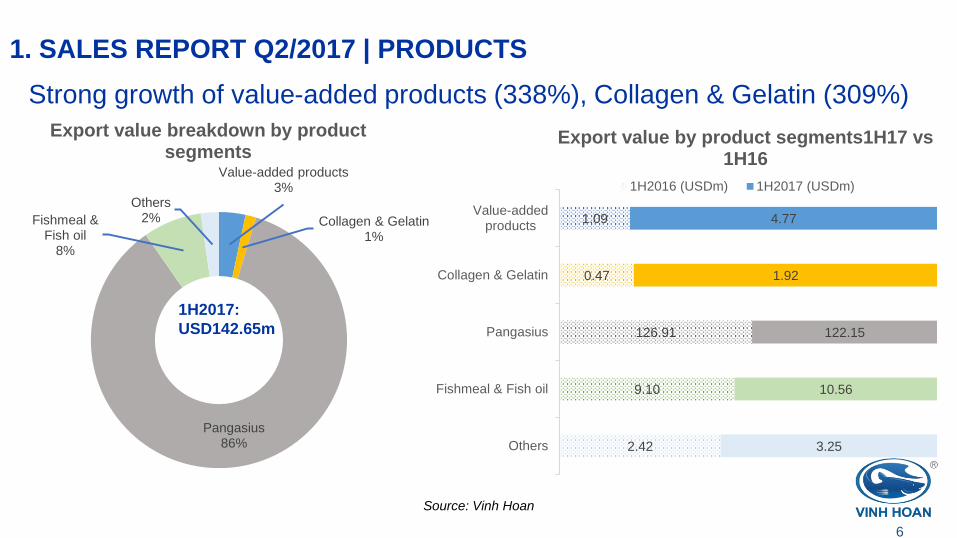
1. SALES REPORT Q2/2017 | PRODUCTS
Strong growth of value-added products (338%), Collagen & Gelatin (309%)
6
Value-added products3%
Collagen & Gelatin1%
Pangasius86%
Fishmeal & Fish oil
8%
Others2%
Export value breakdown by product segments
1H2017:
USD142.65m
1.09
0.47
126.91
9.10
2.42
4.77
1.92
122.15
10.56
3.25
Value-addedproducts
Collagen & Gelatin
Pangasius
Fishmeal & Fish oil
Others
Export value by product segments1H17 vs 1H16
1H2016 (USDm) 1H2017 (USDm)
Source: Vinh Hoan
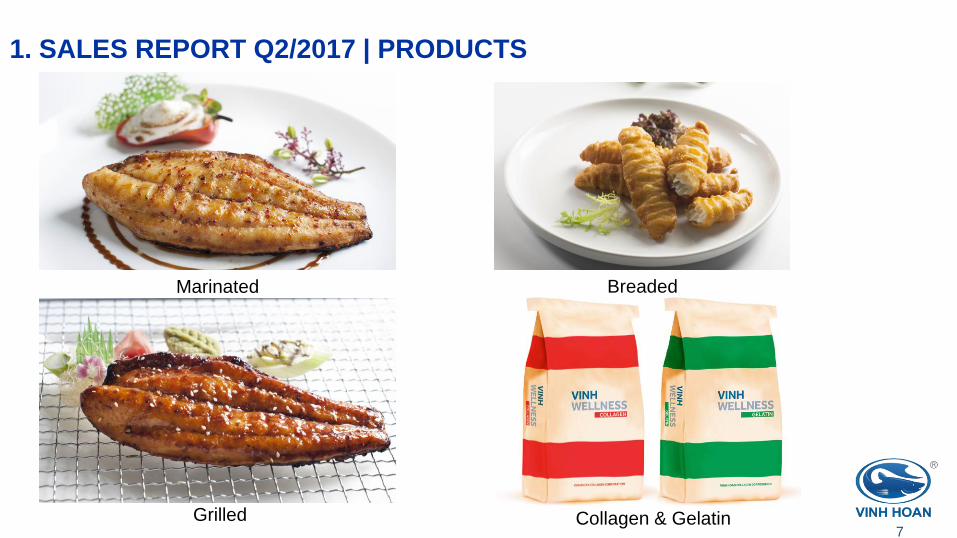
1. SALES REPORT Q2/2017 | PRODUCTS
7Collagen & Gelatin
Breaded
Grilled
Marinated
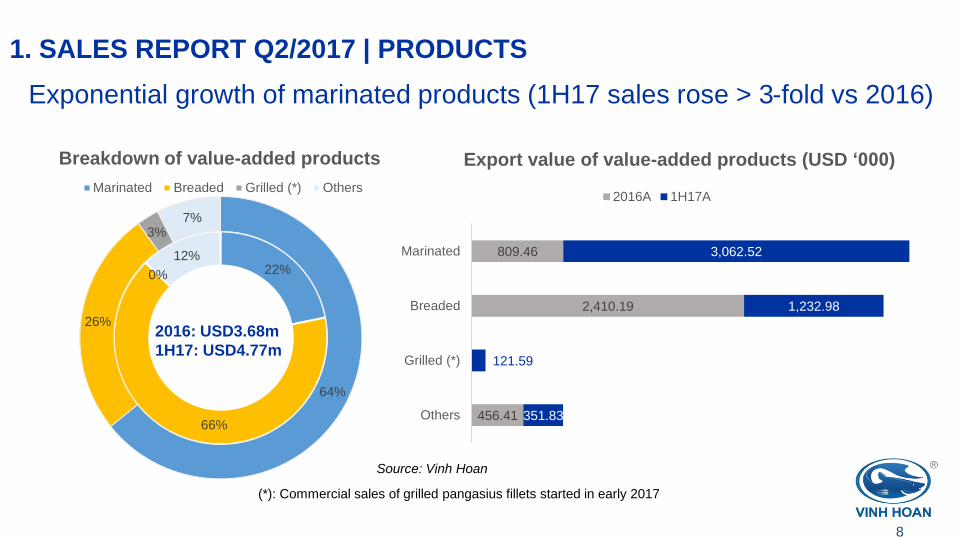
1. SALES REPORT Q2/2017 | PRODUCTS
Exponential growth of marinated products (1H17 sales rose > 3-fold vs 2016)
8
Source: Vinh Hoan
809.46
2,410.19
456.41
3,062.52
1,232.98
121.59
351.83
Marinated
Breaded
Grilled (*)
Others
Export value of value-added products (USD ‘000)
2016A 1H17A
(*): Commercial sales of grilled pangasius fillets started in early 2017
22%
66%
0%
12%
64%
26%
3%7%
Breakdown of value-added products
Marinated Breaded Grilled (*) Others
2016: USD3.68m
1H17: USD4.77m

1. SALES REPORT Q2/2017 | PRODUCTS
Collagen and gelatin surged by 338% yoy, gaining more new customers and
markets in 1H17
9
China
Developed broad network
of new customersIndia
Finished import
procedures
Gelatin sales grew fast
with many big customers
Europe
Stable purchases from
existing customers but slow
growth in market
development
Japan
Sales grew strong and
reached many prospects
South Korea
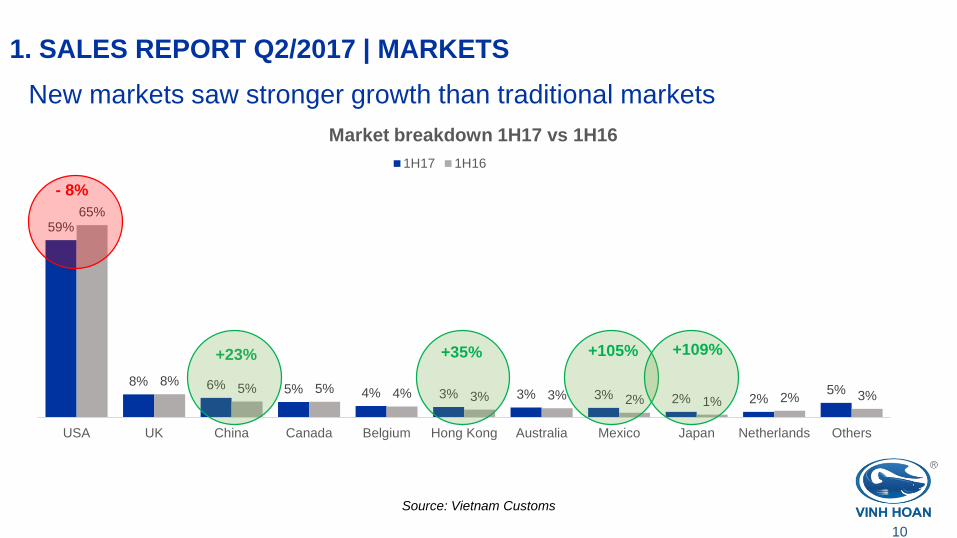
1. SALES REPORT Q2/2017 | MARKETS
New markets saw stronger growth than traditional markets
10
59%
8% 6% 5% 4% 3% 3% 3% 2% 2%5%
65%
8%5% 5% 4% 3% 3% 2% 1% 2% 3%
USA UK China Canada Belgium Hong Kong Australia Mexico Japan Netherlands Others
Market breakdown 1H17 vs 1H16
1H17 1H16
- 8%
+23% +35% +105% +109%
Source: Vietnam Customs

2. Financial results Q2/2017
11

2. FINANCIAL RESULTS Q2/2017 | CONSOLIDATED P&L
12
1H2017 1H2016 Change (%)
(VND bn)
Net Revenue 3,970 3,681 8%
Cost of Goods Sold -3,430 -3,076 12%
Gross Profit 540 605 -11%
Gros Margin (%) 14% 16%
Financial Income 24 28 -14%
Financial Expenses -48 -56 -14%
Selling, General and Administrative Expenses -221 -197 12%
Operating Profit, EBIT 296 382 -23%
Other profit (losses) -4 -1 406%
Pre-tax Profit 292 381 -23%
After-tax Profit 235 325 -28%
Earnings before interest, Tax, Depreciation and
Amortization (EBITDA)421 478 -12%
EBITDA Margin (%) 11% 13%
Net Profit Margin (%) 6% 9%

3. Outlook 2H2017
13
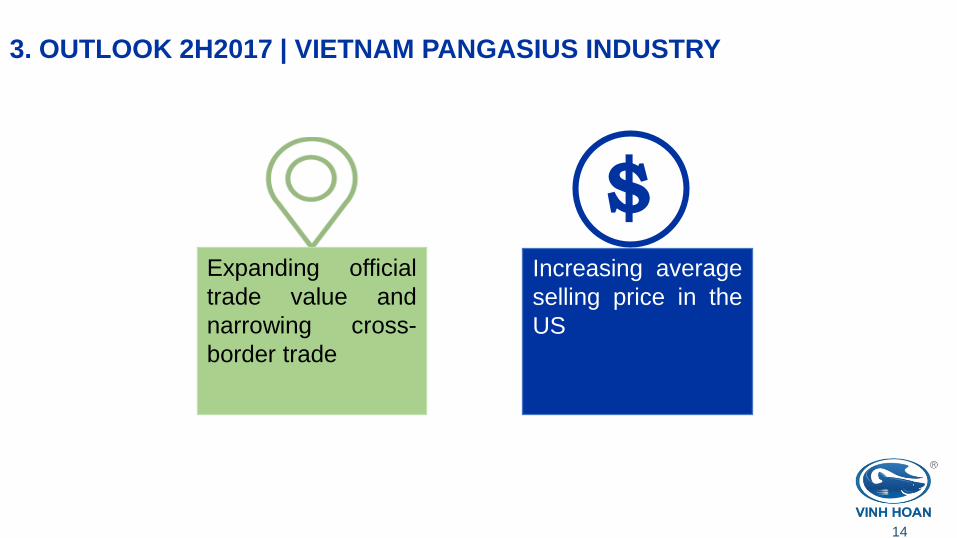
3. OUTLOOK 2H2017 | VIETNAM PANGASIUS INDUSTRY
14
Expanding official
trade value and
narrowing cross-
border trade
Increasing average
selling price in the
US
$
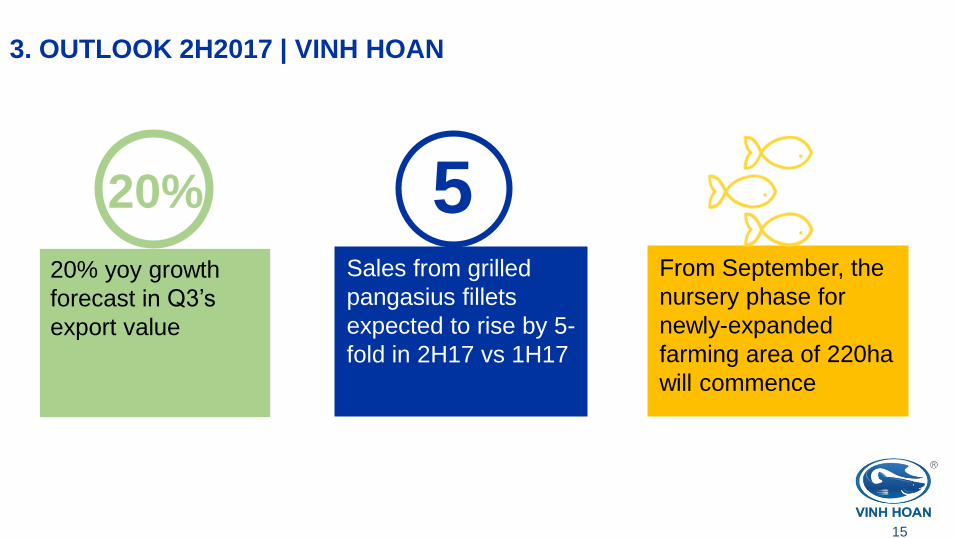
3. OUTLOOK 2H2017 | VINH HOAN
15
Sales from grilled
pangasius fillets
expected to rise by 5-
fold in 2H17 vs 1H17
From September, the
nursery phase for
newly-expanded
farming area of 220ha
will commence
20% yoy growth
forecast in Q3’s
export value
20% 5

4. Q&A
16
For further information, contact us at: [email protected]
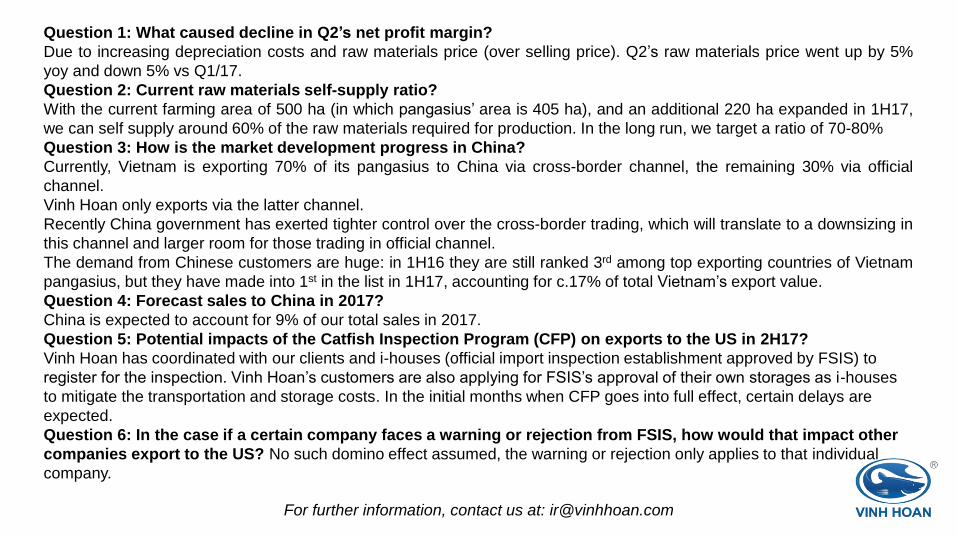
Question 1: What caused decline in Q2’s net profit margin?
Due to increasing depreciation costs and raw materials price (over selling price). Q2’s raw materials price went up by 5%
yoy and down 5% vs Q1/17.
Question 2: Current raw materials self-supply ratio?
With the current farming area of 500 ha (in which pangasius’ area is 405 ha), and an additional 220 ha expanded in 1H17,
we can self supply around 60% of the raw materials required for production. In the long run, we target a ratio of 70-80%
Question 3: How is the market development progress in China?
Currently, Vietnam is exporting 70% of its pangasius to China via cross-border channel, the remaining 30% via official
channel.
Vinh Hoan only exports via the latter channel.
Recently China government has exerted tighter control over the cross-border trading, which will translate to a downsizing in
this channel and larger room for those trading in official channel.
The demand from Chinese customers are huge: in 1H16 they are still ranked 3rd among top exporting countries of Vietnam
pangasius, but they have made into 1st in the list in 1H17, accounting for c.17% of total Vietnam’s export value.
Question 4: Forecast sales to China in 2017?
China is expected to account for 9% of our total sales in 2017.
Question 5: Potential impacts of the Catfish Inspection Program (CFP) on exports to the US in 2H17?
Vinh Hoan has coordinated with our clients and i-houses (official import inspection establishment approved by FSIS) to
register for the inspection. Vinh Hoan’s customers are also applying for FSIS’s approval of their own storages as i-houses
to mitigate the transportation and storage costs. In the initial months when CFP goes into full effect, certain delays are
expected.
Question 6: In the case if a certain company faces a warning or rejection from FSIS, how would that impact other
companies export to the US? No such domino effect assumed, the warning or rejection only applies to that individual
company.
For further information, contact us at: [email protected]
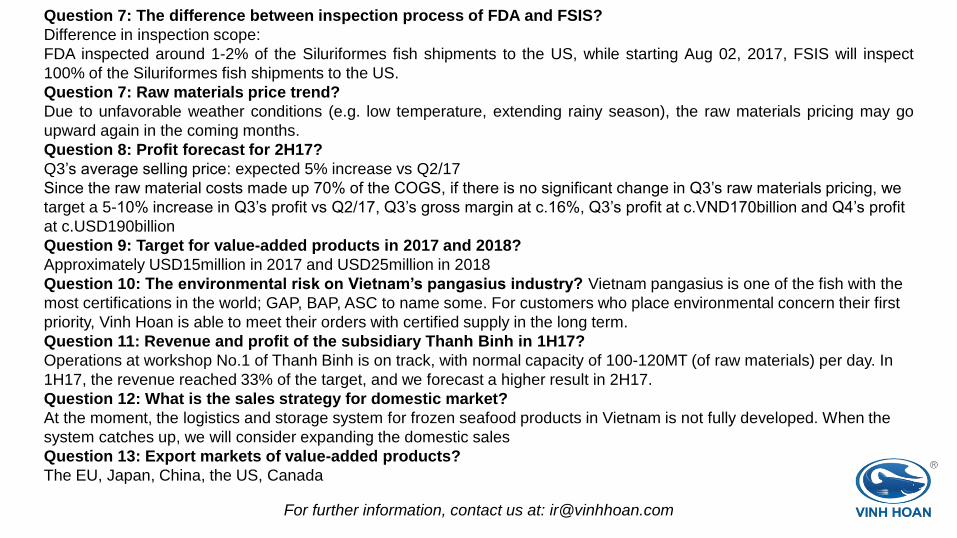
Question 7: The difference between inspection process of FDA and FSIS?
Difference in inspection scope:
FDA inspected around 1-2% of the Siluriformes fish shipments to the US, while starting Aug 02, 2017, FSIS will inspect
100% of the Siluriformes fish shipments to the US.
Question 7: Raw materials price trend?
Due to unfavorable weather conditions (e.g. low temperature, extending rainy season), the raw materials pricing may go
upward again in the coming months.
Question 8: Profit forecast for 2H17?
Q3’s average selling price: expected 5% increase vs Q2/17
Since the raw material costs made up 70% of the COGS, if there is no significant change in Q3’s raw materials pricing, we
target a 5-10% increase in Q3’s profit vs Q2/17, Q3’s gross margin at c.16%, Q3’s profit at c.VND170billion and Q4’s profit
at c.USD190billion
Question 9: Target for value-added products in 2017 and 2018?
Approximately USD15million in 2017 and USD25million in 2018
Question 10: The environmental risk on Vietnam’s pangasius industry? Vietnam pangasius is one of the fish with the
most certifications in the world; GAP, BAP, ASC to name some. For customers who place environmental concern their first
priority, Vinh Hoan is able to meet their orders with certified supply in the long term.
Question 11: Revenue and profit of the subsidiary Thanh Binh in 1H17?
Operations at workshop No.1 of Thanh Binh is on track, with normal capacity of 100-120MT (of raw materials) per day. In
1H17, the revenue reached 33% of the target, and we forecast a higher result in 2H17.
Question 12: What is the sales strategy for domestic market?
At the moment, the logistics and storage system for frozen seafood products in Vietnam is not fully developed. When the
system catches up, we will consider expanding the domestic sales
Question 13: Export markets of value-added products?
The EU, Japan, China, the US, Canada

For further information, contact us at: [email protected]
Disclaimer:All information and responses implying forecast or prediction for future events/data in this material is subject to Vinh Hoan’s opinion and only serve as
a reference source. It should not be taken as an investment recommendation. Vinh Hoan will not be held responsible in any way for investment
decision made based on our forecast/prediction presented in this material.
Thank you