press conference august 15, 2016 rio media center
TRANSCRIPT

SOCIAL PROGRESS
IMPERATIVE
SOCIAL PROGRESS INDEX
Social Progress Index #socialprogress
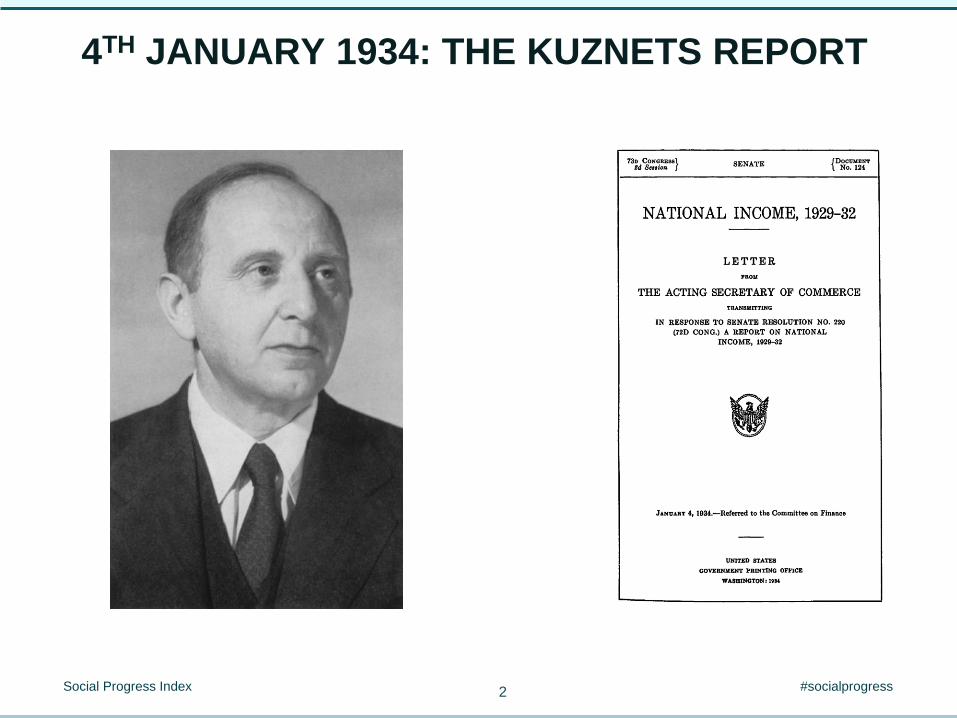
4TH JANUARY 1934: THE KUZNETS REPORT
2
Simon Kuznets
The welfare of a nation can scarcely
be inferred from a measurement of
national income

Social Progress Index #socialprogress
KUZNETS’ WARNING
3
Digitized for FRASER
http://fraser.stlouisfed.org/
Federal Reserve Bank of St. Louis
“The welfare of a
nation can, therefore,
scarcely be inferred
from a measurement
of national income as
defined above.”

Social Progress Index #socialprogress 4

Social Progress Index #socialprogress
SOCIAL PROGRESS INDEX DESIGN PRINCIPLES

Social Progress Index #socialprogress 6
Nutrition and Basic Medical Care
Water and Sanitation
Shelter
Personal Safety
Access to Basic Knowledge
Access to Information and
Communication
Health and Wellness
Environmental Quality
Personal Rights
Personal Freedom and Choice
Tolerance and Inclusion
Access to Advanced Education
Opportunity Foundations of
Wellbeing Basic Human Needs
Social Progress Index
Framework

Social Progress Index #socialprogress 7
Basic Human Needs Opportunity
Nutrition and Basic Medical
Care Undernourishment
Depth of food deficit
Maternal mortality rate
Child mortality rate
Deaths from infectious diseases
Water and Sanitation Access to piped water
Rural access to improved water source
Access to improved sanitation facilities
Shelter Availability of affordable housing
Access to electricity
Quality of electric supply
Household air pollution attributable deaths
Personal Safety Homicide rate
Level of violent crime
Perceived criminality
Political terror
Traffic deaths
Access to Basic Knowledge Adult literacy rate
Primary school enrollment
Lower secondary school enrollment
Upper secondary school enrollment
Gender parity in secondary enrollment
Access to Information and
Communications Mobile telephone subscriptions
Internet users
Press Freedom Index
Health and Wellness Life expectancy at 60
Premature deaths from non-communicable
diseases
Obesity rate
Suicide rate
Environmental Quality Outdoor air pollution attributable deaths
Wastewater treatment
Greenhouse gas emissions
Biodiversity and habitat
Personal Rights Political rights
Freedom of speech
Freedom of assembly/association
Freedom of movement
Private property rights
Personal Freedom and Choice Freedom over life choices
Freedom of religion
Early marriage
Satisfied demand for contraception
Corruption
Tolerance and Inclusion Tolerance for immigrants
Tolerance for homosexuals
Discrimination and violence against
minorities
Religious tolerance
Community safety net
Access to Advanced Education Years of tertiary schooling
Women’s average years in school
Inequality in the attainment of education
Globally ranked universities
Percentage of tertiary students enrolled in
globally ranked universities
Social Progress Index Complete Framework
Foundations of Wellbeing

Social Progress Index #socialprogress
INDICATOR DATA SOURCES
Hard
data
Expert
analysis
Survey
data

Social Progress Index #socialprogress
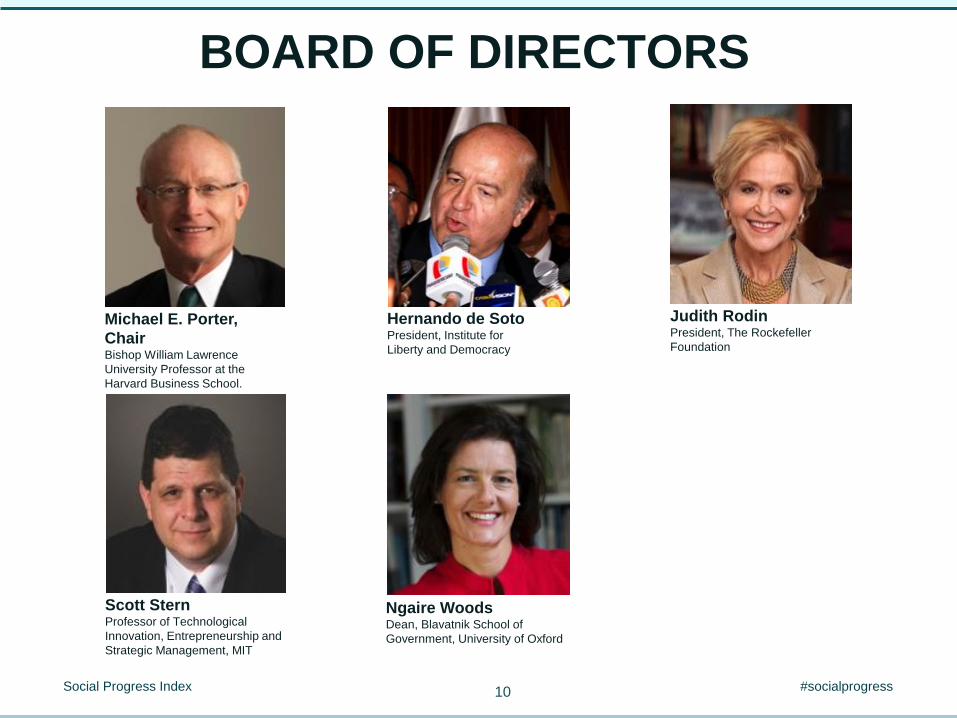
BOARD OF DIRECTORS
9
Brizio Biondi-Morra
Chair Avina Foundation and
Avina Americas
Sally Osberg President, CEO of the Skoll
Foundation
Álvaro Rodríguez Arregui Co-founder and Managing Partner
of IGNIA Partners, LLC
Roberto Artavia Loría
Vice Chair President of VIVA Trust
Matthew Bishop The Economist
David Cruickshank Deloitte
Social Progress Index #socialprogress
BOARD OF DIRECTORS
10
Scott Stern Professor of Technological
Innovation, Entrepreneurship and
Strategic Management, MIT
Judith Rodin President, The Rockefeller
Foundation
Michael E. Porter,
Chair Bishop William Lawrence
University Professor at the
Harvard Business School.
Hernando de Soto President, Institute for
Liberty and Democracy
Ngaire Woods Dean, Blavatnik School of
Government, University of Oxford

WHAT DOES THE SOCIAL
PROGRESS INDEX TELL US
ABOUT COUNTRIES?

Rank Country Score Rank Country Score Rank Country Score Rank Country Score
1 Finland 90.09 35 Hungary 76.88 69
Bosnia and
Herzegovina 65.84 103 Lesotho 52.39
2 Canada 89.49 36 Latvia 76.19 70 Dominican Republic 65.65 104 Iraq 52.28
3 Denmark 89.39 37 Israel 75.32 71 Jordan 65.43 105 Rwanda 51.91
4 Australia 89.13 38 Argentina 75.2 72 Bolivia 64.73 106 Swaziland 51.76
5 Switzerland 88.87 39
United Arab
Emirates 73.69 72 Moldova 64.73 107 Uganda 50.69
6 Sweden 88.8 40 Mauritius 73.24 74 Lebanon 64.42 108 Benin 50.03
7 Norway 88.7 41 Panama 73.02 75 Russia 64.19 109 Tanzania 49.99
8 Netherlands 88.65 42 Romania 72.23 76 Kazakhstan 63.86 110 Myanmar 49.84
9 United Kingdom 88.58 43 Bulgaria 72.14 77 Azerbaijan 63.75 111 Congo, Republic of 49.74
10 Iceland 88.45 44 Jamaica 71.94 78 Nicaragua 63.03 112 Burkina Faso 49.34
10 New Zealand 88.45 45 Kuwait 71.84 79 Kyrgyzstan 62.91 113 Pakistan 49.13
12 Ireland 87.94 46 Brazil 71.7 80 Mongolia 62.8 114 Zimbabwe 49.11
13 Austria 86.6 47 Serbia 71.55 81 Venezuela 62.6 115 Togo 49.03
14 Japan 86.54 48 Colombia 70.84 82 Indonesia 62.27 116 Côte d'Ivoire 48.97
15 Germany 86.42 49 Peru 70.09 83 Sri Lanka 62.21 117 Mozambique 47.96
16 Belgium 86.19 50 Malaysia 70.08 84 China 62.1 118 Cameroon 47.22
17 Spain 85.88 51 Mexico 70.02 85 Namibia 62.01 119 Nigeria 46.49
18 France 84.79 52 Albania 69.78 86 Morocco 61.92 120 Djibouti 46.3
19 United States 84.62 53 Ecuador 69.56 87 Guatemala 61.68 121 Mali 46.24
20 Slovenia 84.27 54 Georgia 69.17 88 Algeria 61.18 122 Mauritania 46.08
21 Portugal 83.88 55 Montenegro 68.17 89 Egypt 60.74 123 Madagascar 45.91
22 Czech Republic 82.8 56 Tunisia 68 90 Honduras 60.64 124 Liberia 45.07
23 Estonia 82.62 57 Macedonia 67.88 91 Uzbekistan 60.49 125 Sierra Leone 44.22
24 Italy 82.49 58 Turkey 67.82 92 Ghana 60.37 126 Ethiopia 43.5
25 Chile 82.12 59 South Africa 67.6 93 Iran 59.45 127 Yemen 41.76
26
Korea, Republic
of 80.92 60 Paraguay 67.44 94 Tajikistan 58.78 128 Guinea 41.66
27 Cyprus 80.75 61 Thailand 67.43 95 Nepal 57.4 129 Niger 41.63
28 Costa Rica 80.12 62 Botswana 67.03 96 Senegal 55.64 130 Angola 39.7
29 Uruguay 80.12 63 Ukraine 66.43 97 Cambodia 54.28 131 Chad 36.38
30 Poland 79.76 64 El Salvador 66.36 98 India 53.92 132 Afghanistan 35.89
31 Slovakia 78.96 65 Saudi Arabia 66.3 99 Kenya 53.72 133
Central African
Republic 30.03
32 Greece 78.27 66 Belarus 66.18 100 Malawi 53.44
33 Croatia 77.68 67 Armenia 66.05 101 Bangladesh 52.73
34 Lithuania 76.94 68 Philippines 65.92 102 Laos 52.54
Very high social progress High social progress Upper middle social progress Lower middle social progress Low social progress Very low social progress
SOCIAL PROGRESS INDEX 2016 RESULTS

Rank Country Score Rank Country Score Rank Country Score Rank Country Score
1 Finland 90.09 35 Hungary 76.88 69 Bosnia and Herzegovina 65.84 103 Lesotho 52.39
2 Canada 89.49 36 Latvia 76.19 70 Dominican Republic 65.65 104 Iraq 52.28
3 Denmark 89.39 37 Israel 75.32 71 Jordan 65.43 105 Rwanda 51.91
4 Australia 89.13 38 Argentina 75.2 72 Bolivia 64.73 106 Swaziland 51.76
5 Switzerland 88.87 39 United Arab Emirates 73.69 72 Moldova 64.73 107 Uganda 50.69
6 Sweden 88.8 40 Mauritius 73.24 74 Lebanon 64.42 108 Benin 50.03
7 Norway 88.7 41 Panama 73.02 75 Russia 64.19 109 Tanzania 49.99
8 Netherlands 88.65 42 Romania 72.23 76 Kazakhstan 63.86 110 Myanmar 49.84
9 United Kingdom 88.58 43 Bulgaria 72.14 77 Azerbaijan 63.75 111 Congo, Republic of 49.74
10 Iceland 88.45 44 Jamaica 71.94 78 Nicaragua 63.03 112 Burkina Faso 49.34
10 New Zealand 88.45 45 Kuwait 71.84 79 Kyrgyzstan 62.91 113 Pakistan 49.13
12 Ireland 87.94 46 Brazil 71.7 80 Mongolia 62.8 114 Zimbabwe 49.11
13 Austria 86.6 47 Serbia 71.55 81 Venezuela 62.6 115 Togo 49.03
14 Japan 86.54 48 Colombia 70.84 82 Indonesia 62.27 116 Côte d'Ivoire 48.97
15 Germany 86.42 49 Peru 70.09 83 Sri Lanka 62.21 117 Mozambique 47.96
16 Belgium 86.19 50 Malaysia 70.08 84 China 62.1 118 Cameroon 47.22
17 Spain 85.88 51 Mexico 70.02 85 Namibia 62.01 119 Nigeria 46.49
18 France 84.79 52 Albania 69.78 86 Morocco 61.92 120 Djibouti 46.3
19 United States 84.62 53 Ecuador 69.56 87 Guatemala 61.68 121 Mali 46.24
20 Slovenia 84.27 54 Georgia 69.17 88 Algeria 61.18 122 Mauritania 46.08
21 Portugal 83.88 55 Montenegro 68.17 89 Egypt 60.74 123 Madagascar 45.91
22 Czech Republic 82.8 56 Tunisia 68 90 Honduras 60.64 124 Liberia 45.07
23 Estonia 82.62 57 Macedonia 67.88 91 Uzbekistan 60.49 125 Sierra Leone 44.22
24 Italy 82.49 58 Turkey 67.82 92 Ghana 60.37 126 Ethiopia 43.5
25 Chile 82.12 59 South Africa 67.6 93 Iran 59.45 127 Yemen 41.76
26 Korea, Republic of 80.92 60 Paraguay 67.44 94 Tajikistan 58.78 128 Guinea 41.66
27 Cyprus 80.75 61 Thailand 67.43 95 Nepal 57.4 129 Niger 41.63
28 Costa Rica 80.12 62 Botswana 67.03 96 Senegal 55.64 130 Angola 39.7
29 Uruguay 80.12 63 Ukraine 66.43 97 Cambodia 54.28 131 Chad 36.38
30 Poland 79.76 64 El Salvador 66.36 98 India 53.92 132 Afghanistan 35.89
31 Slovakia 78.96 65 Saudi Arabia 66.3 99 Kenya 53.72 133 Central African Republic 30.03
32 Greece 78.27 66 Belarus 66.18 100 Malawi 53.44
33 Croatia 77.68 67 Armenia 66.05 101 Bangladesh 52.73
34 Lithuania 76.94 68 Philippines 65.92 102 Laos 52.54
Very high social progress High social progress Upper middle social progress Lower middle social progress Low social progress Very low social progress
SOCIAL PROGRESS INDEX 2016 RESULTS

Social Progress Index #socialprogress
SOCIAL PROGRESS INDEX 2016 RESULTS
14

Social Progress Index #socialprogress
SOCIAL PROGRESS DOES INCREASE WITH GDP PER CAPITA
BUT ECONOMIC GROWTH IS NOT THE WHOLE STORY
19

Social Progress Index #socialprogress
SOCIAL PROGRESS DOES INCREASE WITH GDP PER CAPITA
BUT ECONOMIC GROWTH IS NOT THE WHOLE STORY
19
Costa Rica
GDP: $14,232
SPI: 80.12
South Korea
GDP: $33,629
SPI: 80.92

Social Progress Index #socialprogress
SOCIAL PROGRESS DOES INCREASE WITH GDP PER CAPITA
BUT ECONOMIC GROWTH IS NOT THE WHOLE STORY
19
Brazil
GDP: $15,110
SPI: 71.70
Kuwait
GDP: $69,878
SPI: 71.84

Social Progress Index #socialprogress 18

PARTNER NETWORK:
MEASUREMENT TO ACTION

Social Progress Index #socialprogress

Social Progress Index #socialprogress 21

Social Progress Index #socialprogress
CASE STUDY: SOCIAL PROGRESS INDEX
FOR THE BRAZILIAN AMAZON
22
Objective: Measure levels of
social progress in an area of
1.2 million square kilometers of
highly dense forest – home to
more than 24 million Brazilians
living in an ecosystem of global
importance.
Goal: Empower local actors to
enhance the policy dialogue
with local, relevant metrics on
social wellbeing. Invite
collaborative intervention in the
social and environmental
targets identified as priority.

Social Progress Index #socialprogress
LIFE IN THE AMAZON VASTLY DIFFERENT THAN THE
REST OF BRAZIL
23
MAJOR FINDINGS INCLUDE:
• Maternal mortality rate is 298.21 per
100,000 people.
• Child mortality rate is 27.8 per 100,000
people.
• Infectious diseases (malaria, HIV,
dengue and tuberculosis) kill 49.5 per
100,000 people.
• 80% of these populations have no
clean water to drink.
• Nearly 30% of people age 15+ living in
these municipalities are illiterate.
Partners:

Social Progress Index #socialprogress
SOCIAL PROGRESS: THE OPPORTUNITY
24
• The Social Progress Index provides a rigorous understanding of the relationship between economic performance and social progress.
• It helps prioritization by identifying communities’ most pressing areas for improvement, absolutely and relatively.
• It creates a common language across government, business, and civil society to foster collaboration.
• The Social Progress Index framework can be applied at different scales, offering a granular understanding down to the community level.