pressure maintenance in oil production pipelines
TRANSCRIPT

1 | P a g e
PRESSURE MAINTENANCE IN OIL PRODUCTION
PIPELINES:
EQUIPMENT AND SIMULATION
A Thesis
By
Dalamagka Dimitra
Presented to
The Faculty of the Department of Mineral Resources Engineering
Technical University of Crete
In partial Fulfillment of the Requirements for the Degree
MASTER OF SCIENCE IN PETROLEUM ENGINEERING
June 2017

2 | P a g e
TECHNICAL UNIVERSITY OF CRETE
DEPARTMENT OF MINERAL RESOURCES ENGINEERING
The undersigned hereby certify that they have read and recommend to the Faculty of
Mineral Resources Engineering for acceptance a thesis entitled “Pressure
maintenance in oil production pipelines: equipment and simulation" by Dimitra
Dalamagka in partial fulfillment of the requirements for the degree of Master of
Science.
Date: 20-06-2017
Chair of Committee,
Dr. Varotsis
Committee Members,
Dr. Gaganis
Dr.Marinakis
Head of Department,
Dr. Pasadakis

3 | P a g e
Acknowledgements
I would like to thank Dr Dimitrios Marinakis for supervising my thesis and guiding me
through its implementation, as well as all the professors of the MSc program for their
efforts to inspire, teach and guide the students. It was an honor for me to be taught
from Dr Gaganis, Dr Kelessidis, Dr Marinakis, Dr Pasadakis and Dr Varotsis (the queue
is only alphabetical).
I would like to thank especially Dr Pasadakis for fighting to make this program even
better for the students. Without his efforts, his persistence, his respect for science and
his truly kind love for his students this program maybe would not exist. He is a
wonderful person and professor.
I am deeply grateful for the assistance, the patience and the advices of Mr. Dietrich
Müller-Link, Director Project Development Oil & Gas at ITT Bornemann GmbH. I want
officially to thank him for responding to all of my questions about multiphase pumps
and for sharing his knowledge and his experience with me.
I would like to thank my family and my friends for their support and care through all my
academic years. My parents were always the best example for fighting and working
hard.
And last but not least for sure, I would like to thank my Josesito for believing in me
more than me. His support, his existence and his wonderful personality are a living
miracle for me.

4 | P a g e
Abstract
The oil production in every well will ultimately decline after some production period and
“intense” treatment of the reservoir, the well and/or the surface flowlines will be
necessary to maintain the production at an economically viable rate. The oil recovery
methods are distinguished in three major categories: primary, secondary and
enhanced oil recovery. From the aforementioned categories, only the second involves
intervention to the midstream facilities. Pressure maintenance of the multiphase
production fluids in the flowlines is a technique, which can be easily implemented in
existing installations.
It may be implemented either by reducing the pressure with surface chokes and orifice
plates or by boosting the pressure with new equipment (pumps and compressors).
Two primary factors of the pressure maintenance have to be studied in detail and
closely monitored: the flow assurance in the pipeline and the proper sizing and
selection of the pressure boosting equipment (pumps and compressors).
In this study, a research is conducted on multiphase flow assurance issues and
particularly the ones associated with the pressure boosting techniques. Several means
of pressure control exist, for example changing the opening frequency and duration of
flow valves and surface chokes and installation of orifice plates, but this study focuses
on the application of multiphase pumps in line with the production flowlines both
onshore and offshore (not inside the well). All major types of production multiphase
pumps are presented in detail, together with their operational characteristics.
At the last part of the thesis, the performance of a multiphase pump in an oilfield is
simulated in order to demonstrate the utility of such novel systems in the oil midstream
sector.

5 | P a g e
Contents Acknowledgements ................................................................................................... 3
Abstract ..................................................................................................................... 4
1. Pressure maintenance in Oil and Gas Midstream Facilities ................................ 8
1.1. Midstream operations .................................................................................. 8
1.2. Trends and facts in Oil and Gas (O&G) industry ......................................... 9
1.3. Pressure maintenance ................................................................................ 9
2. Multiphase flow ................................................................................................ 10
2.1. Horizontal Multiphase Flow patterns.......................................................... 11
2.1.1. Two phase flow: Gas-Liquid ............................................................... 12
2.1.2. Two phase flow: Oil-Water ................................................................. 16
2.1.3. Two phase flow: Liquid-Solids ............................................................ 23
2.1.4. Three phase flow: Gas-Oil-Water ....................................................... 25
2.1.5. Three phase flow: Gas-Liquid-Solids .................................................. 27
2.2. Multiphase horizontal flow considerations ................................................. 28
2.3. Effect of design parameters ...................................................................... 30
3. Modeling of multiphase flow in pipelines........................................................... 32
3.1. Multiphase flow modeling approaches ....................................................... 32
3.2. Multiphase flow design parameters ........................................................... 33
3.3. Pressure drop in pipelines ......................................................................... 37
3.3.1. Frictional pressure losses................................................................... 38
3.3.2. Frictional pressure losses for the flow through equipment .................. 39
3.3.3. Pressure losses due to elevational changes....................................... 39
4. Multiphase Flow Assurance.............................................................................. 40
4.1. Multiphase Flow assurance challenges ..................................................... 40
4.2. Blockages ................................................................................................. 41
4.2.1. Waxes ................................................................................................ 41
4.2.2. Asphaltenes ....................................................................................... 43
4.2.2.1. Scales ............................................................................................ 45

6 | P a g e
4.2.2.2. Gas hydrates .................................................................................. 47
4.2.3. Operational ........................................................................................ 49
4.2.3.1. Liquid slugging ............................................................................... 49
4.2.3.2. Pressure maintenance .................................................................... 51
4.3. Integrity ..................................................................................................... 53
4.3.1. Corrosion ........................................................................................... 53
4.3.2. Erosion ............................................................................................... 55
4.3.3. Cavitation ........................................................................................... 58
4.3.4. Water hammer/Hydraulic Shock ......................................................... 58
5. Conventional midstream production boosting system ....................................... 60
5.1. Conventional production system description ............................................. 60
5.2. Other midstream production boosting systems .......................................... 62
5.2.1. Subsea dry gas compression ............................................................. 62
5.2.2. Multiphase Flow Turbines .................................................................. 64
5.2.3. Multiphase Pumping Systems ................................................................ 64
6. Surface Jet pumps/Ejectors/Eductors (SJP) ..................................................... 65
7. Multiphase pumping systems ........................................................................... 75
7.1.1. Selection criteria for the enhanced recovery method .......................... 76
7.1.2. Multiphase pumping industrial status ................................................. 77
7.1.3. Types of multiphase pumps ............................................................... 78
7.1.4. Application of multiphase boosting systems ....................................... 78
7.1.5. Benefits of multiphase pumping ......................................................... 80
7.2. Helico-axial pumps (Rotodynamic Centrifugal type) .................................. 82
7.3. Positive Displacement Pumps (PDP type) ................................................. 86
7.3.1. Twin Screw Pumps (TSP) .................................................................. 87
7.3.2. Single Screw/Progressive Cavity Pumps (PCP) ................................. 90
8. Multiphase pumps performance and selection ................................................. 93
8.1. Performance characteristics ...................................................................... 93
8.2. Multiphase Pump selection ..................................................................... 100

7 | P a g e
8.3. Helico-axial Pumps (Rotodynamic) ......................................................... 107
8.4. Single and Twin Screw Pumps ................................................................ 111
8.5. Performance issues in multiphase pumps ............................................... 117
8.5.1. Cavitation ......................................................................................... 117
8.5.2. Priming ............................................................................................. 119
8.5.3. Gas locking ...................................................................................... 121
8.6. Multiphase pumps operation in series and in parallel .............................. 122
8.7. Comparison of multiphase pumps ........................................................... 122
9. Simulation and Results ................................................................................... 126
9.1. Simulation ............................................................................................... 126
9.2. Conclusions ............................................................................................ 133
10. References ................................................................................................. 135

8 | P a g e
1. Pressure maintenance in Oil and Gas Midstream Facilities
1.1. Midstream operations
The midstream operations include the transportation, distribution and storage of crude
oil and natural gas products.
Transportation and distribution are referred to the systems and means that are used
to enable the transport of the effluents from the surface production sites to processing
facilities and gathering stations. For the transportation are used pipelines, in order to
transfer crude oil and natural gas.
Gathering stations are facilities where separation processes take place and large oil
storage tanks are installed. The effluents from different wells are gathered in the tanks
through pipelines, often referred as flowlines. In gathering stations are installed the
pumping or compressor stations, in order to boost the flow to the main flowlines.
Figure 1: Oil and natural gas value chain [1].
The pipelines are distinguished in the following categories:
Crude oil and natural gas gathering lines (flowlines)
They are used to transport the effluents from the wellheads and manifolds to the
gathering stations. They can transfer either single or multiphase mixture. The use of
multiphase flow gathering lines is not used often in the oil and gas industry.
The complexity of the multiphase flow dictates very careful design and sizing of the
pipelines. But since the pipeline system is appropriately designed, the field operations
are minimised and the project’s cost eventually.
Crude main lines
Natural gas transmission lines
Local distribution lines

9 | P a g e
1.2. Trends and facts in Oil and Gas (O&G) industry
According to experts the future challenges referred to the production facilities in the oil
and gas industry, are the following:
Minimum expectations for the discovery of big new fields.
According to the exploratory data for the possible oil and gas reserves that have been
conducted so far, only a few large oil and gas fields are expected to be discovered.
The number of offshore production facilities will increase by far.
It is claimed that more than 25% of the oil fields and 15% of the gas fields around the
world will be subsea and many of them located in deep water [2].
Multiphase flow transport techniques will develop.
The use of multiphase pipelines and multiphase boosting systems provides the
advantage of full exploitation of the existing fields.
1% recovery factor increase needed for an additional 2-year oil and gas supply [3]
More than 70% of the current world oil production is from matured fields. Almost
50% of the oil reserves are from 30 big mature fields [4].
The definition of “mature field” is not clearly declared and many times there is confusion
about it. For some professionals as a mature field is considered the one that has
reached its peak production and its production has started to decline [3].
1.3. Pressure maintenance
The oil production enhancement may be achieved in many different ways. The primary,
the secondary and the enhanced oil recovery mechanisms are the three major
categories of this kind of techniques. Pressure maintenance is referred to the change
of the pressure drive downstream of the wellhead in order to maintain the production
flow rates. This can be achieved by controlling the opening and closing times of the
surface chokes or by interfering with the midstream facilities by boosting the pressure
downstream of the wellhead with surface/seabed pumps. The application of artificial
oil recovery techniques is imposed by the necessity to increase the oil production and
to increase the recovery rate from already producing fields.
Pump-lifted production is commonly used because it serves some of the above-
mentioned trends while the integration cost is low. The pumps that are usually used
are divided in single phase and multiphase pumps, depending on the number of
phases they are able to handle. The application of multiphase pumps remains a
challenging and perspective technique in order to achieve pressure maintenance in
midstream facilities.

10 | P a g e
2. Multiphase flow
In the Oil and Gas (O&G) industry multiphase flow exists inside the wellbores and the
pipelines (vertical, horizontal and nearly horizontal multiphase flow).
Single phase flow description is implemented through the characterization of the flow
regime as laminar or turbulent, concerning the pressure and velocity distribution of the
fluid along space and as steady, semi-steady or unsteady state, concerning the
pressure and velocity distribution of the fluid along time.
Multiphase flow is described through the flow patterns that categorize the flow
according to the distribution of the phases. The types of multiphase flow that may
appear in the pipelines of the O&G industry are:
Two-phase flow, between gas and liquid.
Two-phase flow type is observed as gas bubbles developed in the liquid flow or as
liquid droplets developed in the gas flow. It is described through the flow regime maps.
Two-phase flow, between liquid and liquid.
It is referred to the multiphase flow between oil and water which is met in crude oil
pipelines very often. Water exists in the flow after some years of oil production. Up to
this point, the water cut is an important factor that will influence the decision for the
design of surface facilities as well as the decision about continuing the production.
Water is also used in pipelines in order to transport high viscosity oil. In this case, water
is creating an annular film in the walls of the pipelines acting like a lubricant for the oil
flow [5].
Three-phase flow, between gas and two different liquids or between two fluids
and solid particles.
Usually, it is referred to Gas, Oil and Water flow (gas-liquid-liquid) or to a flow in which
one of the G-O-W phases are replaced by solids. The solid particles that may exist in
the flow usually are not considered as a different phase, because they enter the flow
with a low mass rate and with a high velocity so that they leave from the examined
control volume quickly. The existence of sand is taken into consideration only for the
establishment of flow assurance (confrontation of erosion problems and sand build-
up). Instead of using flow maps for the visualization of the three-phase flow, a three
phase diagram is used (Figure 2). This illustrates the different flow regimes that may
occur in a three-phase flow as combinations of the interactions between two phases.

11 | P a g e
Figure 2: Three phase diagram for multiphase flow in horizontal pipes. [5]
The three phase diagram axes correspond to the normalized superficial velocity of
each phase (X≡water normalized superficial velocity, Y≡oil normalized superficial
velocity, Z≡gas normalized superficial velocity). The normalization is over the
summation of the superficial velocities of all phases contributing to the flow.
2.1. Horizontal Multiphase Flow patterns
Main categories of multiphase flow in horizontal pipes
The horizontal multiphase flow is distinguished in the three main categories [6]:
Segregated flow (smooth stratified and wavy stratified flow), where the different
phases flow separately in layers,
Intermittent flow (elongated bubble and slug flow), where the flow of each
phase is interrupted from the other phases,
Distributive flow (annular and dispersed bubble flow), where the different
phases appear in the flow without following any order.
The distinction between the different flow patterns can be done semi-quantitatively by
using the flow pattern maps and quantitatively by using complex mechanistic models.
In the flow pattern maps, the distinction between the different patterns is done
according to the superficial velocity of the phases.
Flow maps
The flow maps present the different flow regimes according to the fluctuations of gas
and liquid superficial velocities. The superficial velocities are expressed in terms of gas
and liquid influx respectively. The influx represents the volume of each phase that
𝑣𝑆𝐺𝑣𝑆𝐺 + 𝑣𝑆𝑊 + 𝑣𝑆𝑂
𝑣𝑆𝑂𝑣𝑆𝐺 + 𝑣𝑆𝑊 + 𝑣𝑆𝑂
𝑣𝑆𝑊𝑣𝑆𝐺 + 𝑣𝑆𝑊 + 𝑣𝑆𝑂
Gas-Water flow
Gas-Oil flow
Oil-Water flow

12 | P a g e
passes through a specific pipeline segment for a specific period of time. The flow map
in Figure 3 shows the different flow patterns and the typical superficial velocities where
each pattern is developed.
Gas and Liquid influxes respectively: G
G
p
QG
A
LL
p
QG
A
Gas and Liquid superficial velocities respectively: SG Gv G LSL
Gv
Fluid coefficients:
1/3
2/3
1,147 L
L
0.463 L G
Where:
σ: surface tension [dyn/cm]
μ: viscosity [cp]
Flow maps interpretation
In flow maps, the y-axis represents the superficial velocity of the lighter phase (Gas for
Gas-Liquid flow and Oil for Liquid-Liquid flow) and the x-axis the superficial velocity of
the denser phase (Oil for Gas-Liquid flow and Water for Liquid-Liquid flow).
Because of the complex phenomena that occur in multiphase flow, the determination
of the boundaries between the different flow regimes is not always accurate. In order
to visualize the different flow regimes in the same map, the interpretation of the flow
map can be done considering that the pipe diameter is stable and the only parameter
that changes is the volumetric flow rate and consequently the superficial velocity of
one of the multiple phases.
More specifically the flow maps can be interpreted following the direction of increasing
or decreasing the superficial velocity of only one phase. So the interpretation of the
transition between the different flow regimes can occur by moving either from right to
left, considering almost stable the superficial velocity of the lighter phase that is
represented in the y-axis or from bottom to top, considering almost stable the
superficial velocity of the denser phase that is represented in the x-axis.
2.1.1. Two phase flow: Gas-Liquid
As previously mentioned the multiphase flow maps are a theoretical estimation of the
occurring flow regimes in a pipeline. Every flow map corresponds to specific fluids
flowing in a pipeline with specific diameter and inclination. Unfortunately, they cannot
be generalized for all types of flow regimes, so they are not accurate for the estimation
of the flow regime for all the possible flow situations. All the scientific efforts have

13 | P a g e
concluded that the existence of a general flow map is possible for the distinction
between the three basic flow categories: segregated, intermittent and distributed [6].
The axes are dimensionless parameters that are affected by flow properties. However,
these maps are not accurate for the discrimination of flow regimes between the
stratified and annular flow, which is essential for multiphase flow modelling. The Baker
modified flow map is suggested from operating companies as the most accurate for
the distinction and prediction of slug and annular flow [7].
Figure 3: Baker modified plot - Flow pattern map for horizontal pipes. [8]
Stratified/Smooth flow
The flow of the different phases is fully developed, meaning that the phases are
completely separated. It is characterized by relatively small flow rates of all the fluids.
Is the type of flow that is mostly met in the entrance of pipes. The order of the observed
flowing phases in the pipeline follows the gravitational properties of the flow. The
denser phases flow along the bottom of the pipe and the lighter phases along the top
of the pipe. As a result on the top of the pipe is observed the gas phase, the oil phase
in the middle and the water phase is met at the bottom, where the solids are also
concentrated. Stratified flow is observed when both gas and liquid phases have small
velocities and the flow is thoroughly segregated.
Stratified Wavy flow
While the fluids are flowing under the conditions of stratified flow, if the velocity of the
gas phase increases, the result will be the transition of the smooth stratified flow to the
wavy stratified flow. In this type of flow, waves are created in the liquid surface, as a
result of the flow transition, indicating the increasing gas kinetic energy. Due to
adhesion and shear stress induced to the liquid surface by the gas, the liquid that exists

14 | P a g e
in the gas-liquid interface drifts away provoking the increase of the liquid velocity. If the
gas velocity increases more, the flow will become annular. Together with the
development of waves, the liquid that exists in the gas-liquid interface is drifted away;
forming liquid droplets that bounce to the gas stream. Wavy flow is observed usually
in gas condensate effluents because the volume fraction of gas is bigger than the
liquids.
Dispersed Bubble flow
This flow is inherent with high turbulence at high gas and liquid flow rates. The gas is
dispersed among the liquid flow, in the form of small bubbles. The size of the bubbles
is very small and depends on the gas flow rate. Due to gravity, the bubbles tend to
concentrate on the top of the flow.
Annular/Mist flow
When the gas flow rate is high while the liquid flow rate is moderate, the flow presents
initially waves, as when the flow is characterized stratified wavy. As the gas velocity
increases more, the height of the waves increases. Then and since the liquid flow rate
has not changed, the area that is occupied by the liquid will be decreased. Finally, the
liquid phase may concentrate around the pipeline’s walls, creating an internal annular
ring. This is created because the fluids’ velocity is decreasing in the vertical axis while
going towards the walls. At the level where the gas velocity is no longer higher than
the liquid velocity, starts the annular liquid layer. More liquid is concentrated on the
bottom of the pipeline due to gravity. Annular flow is mostly observed in gas
condensate effluents because the volume fraction of gas is bigger than the liquids.
Slug flow
Is the type of flow that indicates the transition from stratified to intermittent flow. It is
occurring when moderate liquid and gas flow rates are observed. According to some
scientific suggestions [6] in case that under stratified wavy flow the gas velocity
increases so that the waves’ height to overcome the pipe centreline, an intermittent
flow will develop. The liquid will be entrapped in big continuous areas flowing in-
between of the gas phase. The liquid areas are flowing like liquid plugs along the pipe.
Their size may be similar to the pipe diameter and usually, they are called “Taylor
bubbles”.
The different types of slugs that may appear are the following:
Hydrodynamic slugs: When the gas flow rate is large and the gas phase flows
with a much greater velocity than the liquid phase, waves are showing up to the surface

15 | P a g e
of the flow. The two different phases have different velocities and this appears as a
flow disturbance in the boundary of liquid and gas interface. This phenomenon is also
described as Kelvin-Helmoltz instability. This wavy flow is reinforced by the increasing
gas velocity and may lead to the creation of areas occupied with liquid, which look like
liquid slugs.
Hydrodynamic slugging is not included to the flow assurance problems, but it acts as
an indicator of the transition to a different flow pattern. The slugs appear with high
frequency.
Riser-based/Severe slugging: When the multiphase flow in horizontal or slightly
inclined pipelines meets the risers, its direction changes and it is moving upwards. At
the points of the pipeline, where it changes direction, slugs may be created.
Terrain generated slugs: Many pipelines change direction along their path and the
flowing fluids have to face different elevation levels. Then arise the same issues as
when the pipeline change direction so that to meet the risers. This type of slugs
appears with the same way of the riser/severe slugs. Its duration is long.
Pigging/ramp-up slugs: The pigging procedure involves the cleaning of the
pipeline from solid depositions on the walls (waxes, etc.). During the procedure, the
pig is forcing the liquid remaining in the pipe to move and to form slugs.
Elongated Bubble/Plug flow
At low gas and moderate liquid flow rates, the gas phase creates a layer interrupted
by liquid droplets. Because of the much higher liquid velocities than the gas velocities,
the gas tends to get mixed with the liquid. This type of flow is usually met when the
reservoir fluid has low Gas-Oil-Ratio (GOR) or high GOR and it is operated at high
pressures.
Figure 4: Typical flow patterns for multiphase flow in horizontal pipes. [5]

16 | P a g e
The transition from one pattern to another is gradually done. Generally the bubbles of
smaller size coalescent and they form slugs. The size of the bubbles is always
suspended by the pressure. The transition velocity is controlled by the frequency of
bubble coalescence, liquid loading and flooding phenomena.
In Figure 5 is presented the generalized flow map that Taitel & Dukler suggest.
Figure 5: Taitel & Dukler plot – Generalized flow pattern map for horizontal pipes. [6]
Transition criterion SS -> SW flow: The transition between the smooth stratified (SS)
and the wavy stratified (SW) flow occurs when the gas phase velocity overcomes the
wave’s propagation velocity. (Curve CCA)
Transition criterion Segregated -> Intermittent flow: According to some scientific
notifications [6] the hold-up threshold for flow transition between segregated and
intermittent is 1
2
Lh
D (Curve ABCA)
Transition criterion Intermittent -> Distributed flow: The transition between intermittent
and distributed flows occurs when the forces that are induced due to the turbulent
fluctuations overcome the hydrostatic pressure forces and displace the gas from the
top level of the pipeline [6] (Curve DD)
2.1.2. Two phase flow: Oil-Water
In this type of flow the densities, volume fractions and the viscosities of the liquids, the
temperature and the existence of impurities in the flow are the major parameters that
affect the flow patterns that may appear.
The modelling of this type of flow is difficult and so far is based on many empirical
considerations. Phase inversion and emulsification are the major phenomena that
make this multiphase flow complex. In order to describe this type of flow, the

17 | P a g e
parameters that are needed are the determination of the continuous and the non-
continuous (or dispersed) phase, the variation of mixture viscosity μm with the holdup
and the extent of emulsification [9].
As dispersed or non-continuous or internal phase is defined the one that is formed in
droplets and dispersed in the other phase, while the continuous or external phase is
defined as the one in which the droplets are suspended [10].
Phase inversion
Each flow pattern may have different appearances as indicated in Figure 6 below. This
is caused by the phase inversion phenomenon. This phenomenon is describing the
alternation of the continuous and the dispersed phase between oil and water phases.
The conditions under which phase inversion occurs are not accurately defined [5].
However, when the volume fraction of the non-continuous phase starts to increase,
this phase will start to disperse in the continuous flow of the other phase. The non-
continuous phase may form droplets in the interface and as its volume fraction keeps
increasing the droplets may coalescent and form a continuous layer. This is how the
continuous phase is inverted to the dispersed phase and the opposite.
In the left side of Figure 6 is visualized the creation of a water-in-oil dispersion. The
continuous phase of pure oil is disturbed by water droplets, which gradually increase
in size as the volume fraction of water increase. At the inversion point, the continuous
phase of oil has become the non-continuous phase. In the right side of Figure 6 is
visualized the creation of an oil-in-water dispersion with the same way.
Figure 6: Phase inversion for oil-water dispersion flow. [11]
In order for this flow alteration to occur the average flow velocity vm has to be high, in
order to provide the appropriate mixing of the fluids before and after the phenomenon
[5]. Also, the distinction between the continuous and the dispersed or non-continuous
phase is easier to be done when at least one of the liquids has high superficial velocity

18 | P a g e
because In this case the phase inversion will occur and the flow regime will have
become definite.
Another parameter that affects the phase inversion phenomenon is the oil viscosity.
The higher is the viscosity of oil the more it tends to form the non-continuous phase.
For this reason, when the flow contains high viscous oil, the phase inversion occurs
even for low water cut [9].
The inversion point refers to the combination of volume fractions of each phase, above
which phase inversion will occur resulting to the alternation of the dispersed phase to
continuous phase [9]. As phase inversion criterion is considered a critical water fraction
(water cut), which is calculated according to different correlations that have been
proposed. When the water cut exceeds this critical value, phase inversion will occur.
In general, emulsions exhibit Newtonian behaviour when the water cut is less than
40% approximately, meaning that when the mixture’s viscosity increases, the shearing
stress also increases and that the mixture’s viscosity is constant for a given
temperature. When the water cut increases more than 40%, the mixture starts to
behave as a Non-Newtonian fluid, meaning that its viscosity is not constant for a given
temperature, because it depends on the shearing rate. In this case, the viscosity
increases when the shear stress decreases [10].
Phase inversion consequences
When the inversion is referring to the establishment of the more viscous phase as the
continuous phase, this results in the increase of mixture viscosity, because the
mixture viscosity is considered equal to the viscosity of the continuous phase. Since
the viscosity is highly affecting the frictional pressure losses in the flow, it will also result
in the increase of pressure drop in the pipeline.
Emulsions
In the Liquid-Liquid flow, the fluids can be assumed to create emulsions when the
droplets of the non-continuous phase are very small. As emulsion is considered the
flow that consists of two immiscible fluids and one of them is dispersed in the other. In
this case, the flow can be considered as homogeneous. In the oil industry water-in-oil
emulsions are more common; therefore the oil-in-water emulsions are sometimes
referred to as "reverse" emulsions [10].
The problem in the modelling of the emulsions arises when the emulsions become
unstable and they separate into the original phases after a time period of flowing.
Instability may occur when the mixing procedure becomes less sufficient due to the
reduction in the superficial velocities of the fluids. In order to overcome this, surfactants

19 | P a g e
are added to the flow. These are substances that have the ability to prevent the
separation and demulsification of the flow.
If the concentration and the superficial velocity of the water phase become very high,
emulsions behave as non-Newtonian pseudoplastic fluids and as a result, their
viscosity decreases with the increase of shear rate.
General flow map
The different flow regimes that appear in the Liquid-Liquid flow depend on the
viscosities and the densities of the phases that constitute the flow as well as on which
is the continuous and the non-continuous phase. The distinction between continuous
and non-continuous phase is based on the phase fractions and the coalescence of its
molecules. The continuous phase will be the one that occupies more space without
any or with the fewer discontinuities in the flow. The transition between the flow
regimes is based on the occurrence of phase inversion phenomena.
In Figure 7 is presented the general flow map for Liquid-Liquid flow. The axes are
scaled logarithmically for better illustration and they represent the superficial oil velocity
in the y-axis and the superficial water velocity in the x-axis. The oil’s kinematic viscosity
is considered to be μo=0.065Pas. The dotted line distinguishes the two different flow
occasions according to the nature of the continuous and the non-continuous phase.
The interpretation of the flow map is the following:
Water-In-Oil flow: The continuous phase is oil and the non-continuous phase is water.
The different flow patterns that may appear are the three on the left side of the map.
The water phase is intermingled in the oil phase and the extent of its dispersion
depends on the superficial velocity of the oil. For a specific superficial velocity (specific
volumetric flow rate and pipeline diameter) of the water phase (non-continuous phase),
as the oil volumetric flow rate decreases, the water phase spreads more in the oil
phase by creating water slugs, tending to become the continuous phase.
Oil-In-Water flow: The continuous phase is water. The possible flow patterns that
appear are the four on the right side of the flow map. Considering a specific superficial
velocity of water (continuous phase), as the oil volumetric flow rate increases for a
given pipeline diameter, meaning that the superficial velocity of the water phase will
increase, the oil will coalescent gradually and create slugs, tending to become the
continuous phase.

20 | P a g e
Figure 7: Generalized flow map for Oil-Water flow in horizontal pipelines. [5]
Stratified Smooth/with Globules/with Mixing Layer flow
Stratified Smooth flow is observed for low mixture velocities. The liquid with the greater
density will flow on the bottom of the pipeline due to gravity and the different phases
are totally segregated. When the densities are very different the flow can be assumed
to be similar to the multiphase Gas-Liquid flow [5].
The effects of phase inversion phenomenon in stratified flow are presented in Figure
8. The transition to the continuous phase to the dispersed phase and the inverse is
gradually occurring. Specifically, in this figure the continuous phase is oil and the
discontinuous phase is water. Initially, as indicated in Figure 8a, both phases; oil and
water, coexist in continuous layers when their velocities are both low. If the volumetric
and mass flow rate of the discontinuous phase (water) starts increasing, the result will
be the creation of water droplets that gradually will disperse in the continuous oil phase.
Depending on the velocity and the concentration of the water phase the flow pattern
may become similar to one of the patterns that are presented in Figure 8b to 8h.
When the oil-water interface is no more smooth because the increase in the oil or water
volumetric flow rate has caused the abruption of flow with the formation of water or oil
droplets respectively, the flow is characterized Stratified with Globules, because of the
droplets formation (Figures 8c and 8d).
As the volumetric flow rates keep increasing, the dispersion extends to the whole flow
and the flow is characterized as Stratified with Mixing Layer (Figures 8e and 8f).

21 | P a g e
Figure 8: Different patterns of stratified Oil-Water flow in horizontal pipelines. [5]
The appearance of stratified Oil-Water flow can be estimated by the calculation of
Eötvös number. It is a dimensionless measure that indicates how much different are
the densities of the liquids that appear in the flow. Very small values of the Eötvös
number (Eo<<1) indicate that the liquids have very similar densities and the possibility
of stratified flow is negligible.
Eötvös number:
2
8
w o
o
ow
g DE
Where:
ow : the interfacial shear stress in the interface of oil-water
When the densities are quite similar the flow regimes become independent of
inclination angle and stratified flow cannot exist [5].
Annular/Mist flow
Annular flow is connected with a high superficial velocity of one of the phases and
moderate superficial velocity for the other one. In Figure 9 are presented the different
annular flow regimes that may appear depending on which phase is the continuous
and which one is the non-continuous. The phase with the greater superficial velocity
will flow in the core of the pipeline, while the other one will create an annular film
(Figures 9a and 9b). In case that the volumetric flow rate of the slow liquid increases it
will start being dispersed in the continuous core flow of the fast liquid (Figures 9c to

22 | P a g e
9e). There is no restriction in which fluid will be the dispersed one, but this depends on
the volumetric flow rate and the volume fraction.
Figure 9: Different patterns of annular Oil-Water flow. [5]
Elongated Bubble/Plug flow
The occurrence of plugs in the flow is connected with moderate volumetric flow rates
of one phase while the other has a high volumetric flow rate. In Figure 10a the oil plugs
are created due to the oil droplets coalescence that happens as a result of the
increased oil volumetric flow rate. The opposite phenomena happen for the water slugs
in Figure 10b.
Figure 10: Different patterns of plug Oil-Water flow. [5]
Slug flow
The occurrence of slugs in the flow is connected with moderate volumetric flow rates
of both phases. In Figure 11a the oil slug is created due to the oil droplets coalescence
that happens as a result of the increased oil volumetric flow rate. The opposite
phenomena happen for the water slugs in Figure 11b.
Figure 11: Different patterns of slug Oil-Water flow. [5]
(a) (b)
(a) (b)
23 | P a g e
Dispersed flow
In dispersed flow the phase with higher superficial velocity will be the continuous phase
while the “slower” fluid will be dispersed in forms of bubbles. There are water-in-oil
(w/o) and oil-in-water (o/w) dispersions.
2.1.3. Two phase flow: Liquid-Solids
In oil & gas industry solids appear very often in the pipelines and they create slurries;
mixtures with oil or water that flow in the pipeline. The solids may be:
Sand that is mixed with the reservoir effluents,
Proppants, which usually contain sand, that was inserted in the wells for fracturing
purposes,
Solids that originate from hydrocarbon blockages such as hydrates, waxes,
asphaltenes and scales,
Corrosion particles that have been detached from the interior of the pipelines’ walls
The sand particles that are observed in oil & gas industry are usually coarse-grained
up to a few millimetres. Due to their magnitude, they are characterized as settling
slurries. Their characteristic is that the solid particles tend to accumulate at the bottom
of the pipe [12]. The flow patterns that are observed in Liquid-Solids flow are dictated
by the gravity rules, while the surface tension is negligible. Depending on how sufficient
is the mixing, the flow may be characterized as homogeneous or heterogeneous.
Two different models have been developed in order to describe the Liquid-Solid flow:
the Two Layer model and the Three Layer model. The Two Layer model cannot
describe the movement of the upper layer of a stationary solids’ bed when low mixture
velocities occur, which is observed in real applications [13]. So, the theory of three
layers existence is more realistic and the flow patterns of this type of flow will be
described according to this in the following paragraphs.
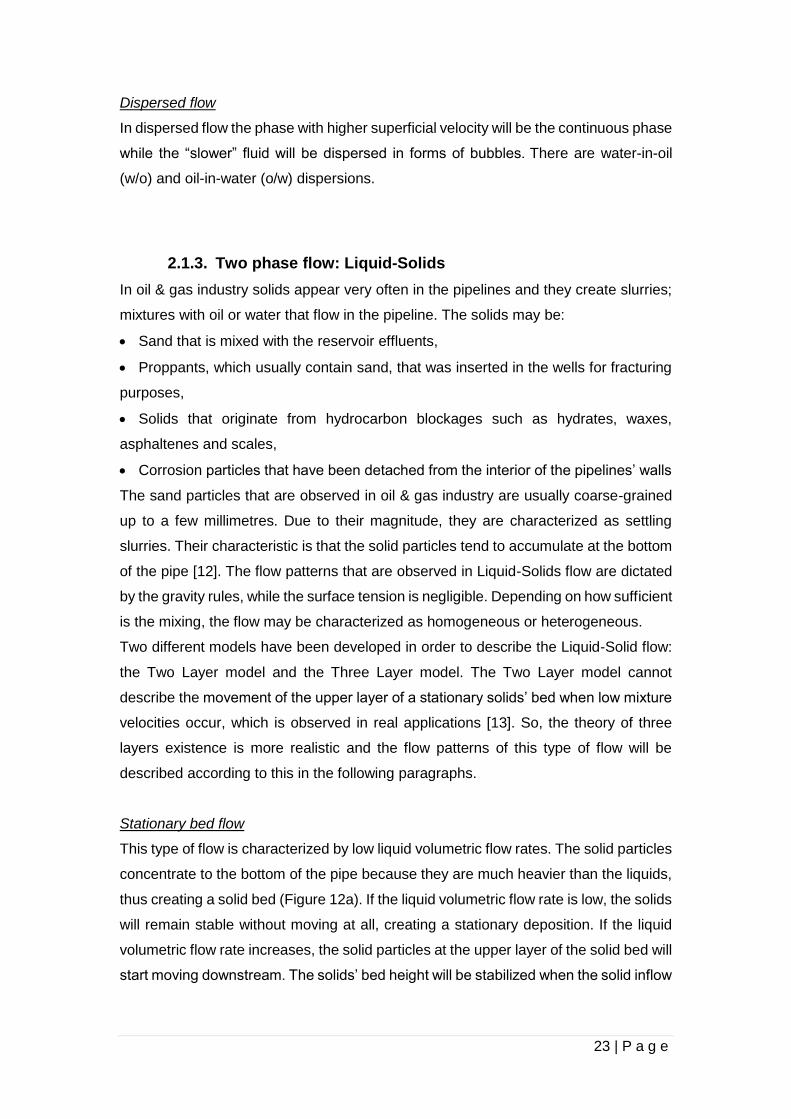
Stationary bed flow
This type of flow is characterized by low liquid volumetric flow rates. The solid particles
concentrate to the bottom of the pipe because they are much heavier than the liquids,
thus creating a solid bed (Figure 12a). If the liquid volumetric flow rate is low, the solids
will remain stable without moving at all, creating a stationary deposition. If the liquid
volumetric flow rate increases, the solid particles at the upper layer of the solid bed will
start moving downstream. The solids’ bed height will be stabilized when the solid inflow

24 | P a g e
rate becomes equal to the downstream transportation rate of the solids that are moving
on the bed’s upper layer [7].
Moving dunes flow
If the liquid volumetric flow rate increases further, the solid particles will create dunes,
which move downstream (Figure 12b). This phenomenon is also known as “saltation”.
Scouring/Moving bed flow
The liquid volumetric flow rate is increased even more than in the case of moving
dunes flow and the decomposition of dunes starts. More specifically the particles on
the upper parts of the dunes are drifted away by the liquid flow but new upstream
particles replace them (Figure 12c). Finally, the solid deposits on the bottom of the
pipe create a moving bed.
Heterogeneous Dispersed flow
When the liquid flow rates become high enough, the solid particles disperse in the flow.
The bottom of the pipeline is free of concentrated particles because they are all drifted
by the inflow and disperse in the liquid stream (Figure 12d). This flow pattern may be
distinguished in two types, depending on the homogeneity of the flow:
- Pseudo homogeneous dispersed flow, where the solid particles distribution in the
liquid flow can be assumed to be almost uniform and
- Heterogeneous dispersed flow, where the concentration of the solid particles is
increased as moving downwards the pipeline’s cross section.
Figure 12: Flow patterns for Liquid-Solids flow. [7]

25 | P a g e
2.1.4. Three phase flow: Gas-Oil-Water
When more than two phases exist in the flow, the final flow pattern is a result of the
impacts of gravity, velocity and shear stresses that connect the different phases of the
flow. The final flow regime will be a mishmash of the regimes that appear in two-phase
flows and the flow will have many similarities with the patterns that appear in two-phase
flows between gas-liquid and liquid-liquid.
Figure 13: Stratified Gas-Oil-water flow. [5]
The stratification order of phases will follow the gravity rules; the water will flow at the
bottom of the pipeline because it is the denser, the gas will flow at the top because it
is the lighter and the oil which is intermittent in terms of density, will flow in-between
the other two fluids (Figure 13).
An important characteristic of this three-phase flow is the definition of the pressure. In
gas-oil-water multiphase flow, the pressure that characterizes the flow is the one that
is imposed on the surface of the gas and the uppermost liquid layer, which is the oil
[5].
Stratified/Smooth flow
As in other types of multiphase flow, the stratified flow of Gas-Oil-Water is observed
when all the phases flow with low velocities. The flow is thoroughly segregated
according to the gravity’s rules (Figure 15a).
Plug flow
It is characterized by low gas superficial velocity and moderate liquid superficial
velocities. The gas concentrates in big areas (plugs) on the top of the flow. The plugs
are created as a result of the liquid wavy movement. No gas bubbles have been
dispersed in the liquid flow yet (Figure 15b).

26 | P a g e
Slug flow
It is characterized by moderate liquid superficial velocities and moderate gas
superficial velocities, which are higher than the ones observed for plug flow. Due to
the contribution of many liquids, the slug flow of Gas-Oil-Water is more complex and
so is the computational interpretation of it. Two different flow regimes may appear
depending on the grade of the mix between the phases.
- In case of complete mix of oil and water, they can be considered as a single
liquid with properties that correspond to their mixture.
- In case of completely separated phases, without any mixture appearance, the
flow pattern will show discontinuities and waves. The gas will disperse in the liquids
forming bubbles and Taylor bubbles may appear. The liquids may be considered as
two stratified layers with bubbles in the liquid slug for calculation purposes [14] (Figures
14 and 15c).
In Figure 14 a liquid slug with length ℓS and a Taylor bubble with length ℓT are illustrated.
Figure 14: Slug Gas-Oil-Water flow with stratified liquid layers. [5]
Annular/Mist flow
In case of high gas volumetric flow rate and high gas content (as in gas condensate
fluids) but with moderate liquids superficial velocities, the gas will concentrate in the
middle of the pipeline while the liquids will concentrate at the walls of the pipeline,
creating a liquid annulus (Figure 15e). The liquids (Oil and Water) may be assumed to
be well mixed and to behave as an emulsion or dispersion [5].
Dispersed flow
In case of high volumetric flow rate of one of the liquid phases and of the gas phase,
the gas will be formed in bubbles and flow dispersed in the liquid phases. The liquids
flow can be evaluated as a two phase Liquid-Liquid flow, with gas bubbles. The liquid
of high velocity will occupy the central part of the pipeline cross section.
Taylor bubble
Slug body
Liquid film

27 | P a g e
Figure 15: Flow patterns for horizontal Gas-Oil-Water flow. [15]
2.1.5. Three phase flow: Gas-Liquid-Solids
The flow patterns that are observed in Gas-Liquid-Solids flow are dictated by the
gravity rules. The flow regimes that appear are similar to those that appear in two
phase Liquid-Solids flow because in both types of flow the solids are the heaviest
phase and they remain at the bottom of the pipeline and they are in contact with the
liquid phase.
Plug flow
In case of plug flow the gas volumetric flow rate is low and the liquid volumetric flow
rate is moderate. The gas does not affect the solid particles which are deposited in the
bottom of the pipeline due to gravity. If the gas velocity increases more, the gas
bubbles may extend and affect a greater part of the pipeline’s cross section, so that
the solid particles may start to move downstream [7] (Figure 16a).
Slug flow
In case that the gas and the liquid volumetric flow rate are moderate, slugs will be
created according to the mechanisms that were explained in the two phase Gas-Liquid
flow. The solid particles may be transferred in the slugs if the velocity of the liquid slug
(b)
(a)
(d)
(e)
(c)

28 | P a g e
is high enough to drift away particles that have deposited in the bottom of the pipeline
(Figure 16b).
Low hold up wavy flow
In case of wet gas pipelines, where low liquid hold up is observed, the bigger part of
the pipeline is occupied by gas. The liquid is forming a thin film on the bottom part of
the pipeline, where solid particles are also concentrated.
The solids may be dispersed in the liquid film or may be accumulated on the lower
layers creating a wet solid bed [7] (Figure 16c).
Annular flow
In case of annular flow high gas and liquid volumetric flow rates are observed. As a
result of the high superficial velocities in the mixture, the solid particles may disperse
in both liquid and gas phases [7] (Figure 16d).
Figure 16: Flow patterns for horizontal Gas-Liquid-Solids flow. [7]
2.2. Multiphase horizontal flow considerations
As mentioned above the modelling and prediction of multiphase flow in horizontal
pipelines is complex, which makes the flow assurance issues also complex.
The Multiphase compositional triangle is commonly used for the prediction of the flow
regime (Figure 17). Each one of the three sides indicates the volume fraction of each
phase and corresponds to a two-phase flow, while each one of the three vertices
corresponds to a single phase flow of water, oil or gas. The area of the triangle

29 | P a g e
corresponds to a three-phase flow and each point presents a unique mixture with a
specific concentration of each phase. The transition region indicates the phase
inversion region. The triangle as all the flow maps is generated and referred to a
specific mixture flowing to a pipeline of specific diameter and inclination, under specific
temperature and pressure conditions.
Figure 17: Gas-Oil-Water flow compositional triangle [16].
Since the Gas-Oil-Water flow is commonly met in manifolds and wellheads the three
phase triangle is a useful generalization of this type of multiphase flow. In brief it shows
the following:
- Mixtures with high gas volume fraction exhibit a flow where the oil and water
phases are dispersed in the gas phase.
- Slugs of liquid may be created in mixtures with moderate or low gas fraction.
The slugs will contain oil or water, depending on their fractions. In case of high water
fraction, water will be the continuous phase; while oil will be dispersed or will create
slugs and the gas will form bubbles.
Difficulties in multiphase flow modeling
Generalization of flow maps for multiphase flow
Discrimination of the boundaries of the different flow regimes for Liquid-Liquid flow.
Conditions under which phase inversion occurs in Liquid-Liquid flow.
Prediction and modeling of emulsions behavior as non-Newtonian fluids.
Problems that may arise in horizontal multiphase flow and affect flow assurance
Increase of mixture’s viscosity and frictional pressure losses, due to phase inversion
between oil and water,

30 | P a g e
Instabilities in flow, due to transformation of the mixture to Non Newtonian, when
water cut exceeds around 40%,
Instabilities in flow, due to large pressure fluctuations that may be caused by liquid
slugs,
Internal corrosion of the pipelines’ walls, due to slugs formation,
Flow blockages that may be created by stationary bed solid depositions on the bottom
of the pipeline,
Non uniform heat transfer in the pipes’ walls due to the formation of solid bed layer,
2.3. Effect of design parameters
The flow regimes of multiphase flow that appear in flowlines are of major importance
for their design. The engineers prefer to design themso that to encourage the
development of wavy stratified flow in the pipelines because in this type of flow the
slippage is reduced and the liquid hold up phenomena are eliminated [17]. In the case
of intermittent flow, the pressure fluctuations that are created due to slug formation
must be avoided. On the other hand annulus and bubble flow is developed under
special occasions of high velocity of gas and liquid phase respectively, so they are
rarely met. So the transition from stratified to intermittent flow is the major aspect when
designing facilities with a multiphase flow.
The flow patterns that appear in the pipeline depending on the following characteristics
of the flow:
Velocities (in terms of flow rates) of the different fluids that constitute the
multiphase flow. Fluids with higher volumetric flow rates tend to occupy a bigger part
of the pipe’s cross section area. Depending on the magnitude of their superficial
velocity, they may create slugs or core flows where the other phases are dispersed in
them. In the case of vertical flow, liquid loading phenomena may occur.
Viscosity affects mostly the liquid-liquid flows. For gas-liquid flows, the difference
in the viscosities of the fluids is very big. In the case of water-oil flows the oil is the
lighter component and will be dispersed in form of droplets along the water continuous
flow. If the oil volumetric flow rate increases, the flow pattern will be inversed (phase
inversion phenomenon).
Surface tension, because it is correlated with viscosity,
Density of the liquid and gas phase,
Pressure. If the pressure in the pipeline is high, the expected velocities of the fluids
will be less than the ones that would be expected in case of regimes with lower

31 | P a g e
pressure. This results to expedite the transition between the different flow regimes and
the transition boundaries are shifted to lower velocities.
Orientation and Inclination of the pipeline.
In pipelines that have a downward inclination the gravity accelerates the flow resulting
in greater velocities. So in downward inclined pipelines the transition boundaries occur
for higher velocities than in horizontal pipelines. Also the intermittent flow region is
shrinked for downward inclined pipelines, because the transition boundary between
the dispersed and intermittent flow is not influenced by the pipeline’s inclination.
Pipe diameter
The pipe diameter affects the superficial velocity of each phase. The volumetric flow
rate is directly dependent on the velocity of the fluid and on the cross sectional area of
the flow. Consequently any change in the pipeline diameter, while the volumetric flow
rate remains the same, results in the change of the fluid velocities and the shift of the
transition boundaries in the flow maps. More specifically when the pipe diameter
increases, the fluid velocities will move to bigger values. The differences are more
intense for more than 30cm increase in pipe diameters [6].
The transition boundaries between SS - SW flow (Smooth Stratified and Stratified
Wavy) and the boundaries between I – AD flow (intermittent and Annular Dispersed)
are not affected by any change in the pipeline diameter.
Content of the liquid phases.
The percentage of the liquid phases in the flow determines the density of the flow. In
case that it is high, liquid loading phenomena may occur.
Table 1: Typical velocities of two phase flow.

32 | P a g e
3. Modeling of multiphase flow in pipelines
3.1. Multiphase flow modeling approaches
Multiphase flow can be described by the three main fluid mechanics and
thermodynamics theorems: conservation of mass, momentum and energy.
The modelling of multiphase flow is an issue under investigation since 1950’s when
the first observations and efforts were implemented in order to predict the multiphase
flow behaviour.
One of the first approaches was the non-slip approach according to which multiphase
flow is considered homogeneous and no slippage occurs between the different
phases. This approach contains high uncertainty and the results are inaccurate, so
later were used correlations for the liquid hold-up in order to describe more precisely
the slippage phenomena between the different phases [18]. For more realistic results
are used a combination of two fluids model and empirical correlations for the liquid
hold up, namely mechanistic models.
Homogeneous Flow Model - Non slip approach
The flow is considered to be a homogenous mixture of gas and liquid, where no
interaction between the two phases is taken into consideration. The equations of single
phase flow are used for the configuration of the flow.
The multiphase flow can be considered homogeneous for annular and bubbly flow
since the velocity of the fluid entering the pipeline is almost the same with the velocity
of the flow.
But in cases that the gas velocity is low, as it occurs in stratified and plug flow regimes
when the velocity starts increasing, the void fraction will also start increasing, so it
cannot be considered as a homogeneous flow.
The main disadvantage of this method is that the pressure drop that is calculated is
lower than the real because the liquid volume is considered lower than the real [18].
Empirical correlations
The empirical correlations that are related with multiphase flow can be distinguished
to three categories according to the physical approach for modeling:
A. Non slippage correlations
The main consideration for these correlations is that the flow consists of more than one
phases but there is no interaction and slippage between them, so the flow is
considered homogeneous. Both gas and liquid velocities are the same and the
mixture’s density is calculated based on the input gas over liquid ratio (GLR).

33 | P a g e
The most well-known correlations of this category are the following: Poettmann &
Carpenter, Baxendell &Thomas and Fancher & Brown.
B. Slippage correlations without flow pattern consideration
These correlations take into account the slippage occurrence between the different
phases, but the flow is considered to be homogeneous. So they do not differentiate
between the different flow patterns that appear in a multiphase flow, but they are used
for all of them. The most well-known correlations of this category are the following:
Hagedorn & Brown, Gray and Asheim.
C. Slippage correlations with flow pattern consideration
These correlations take into account the slippage occurrence between the different
phases and the type of flow pattern that is established. The most well-known
correlations of this category are the following: Duns & Ros, Orkiszewski, Aziz et all.,
Beggs & Brill and Mukherjee & Brill.
The correlations of Beggs & Brill and Mukherjee & Brill can be used for many different
flow inclination angles, but all the other correlations are used only for vertical flows.
One –Dimensional Two-Fluids Model – Mechanistic model
It is a combination of empirical correlations and two fluids modelling. According to this
approach, the flow of each phase is examined separately as well as the influence of
the flow of each phase to the others. The two phases have different velocities but they
are interfering with the interfacial forces. With the mechanistic models are predicted
the flow patterns that appear in the multiphase flow and then is calculated the pressure
gradient according to the corresponding correlation for the suitable flow pattern.
The most well-known mechanistic models are the following: Ansari et al and Hasan &
Kabir for upward vertical flow.
3.2. Multiphase flow design parameters
Some basic design parameters for the description, simulation and prediction of
multiphase flow are the following:
Two phase mass flow rate
The total mass flow rate of the multiphase flow is considered to be the summation of
the mass flow rates of the liquid and the gas phase:
L Gm m m
Lm : mass flow rate of the liquid phase,

34 | P a g e
Gm : mass flow rate of the gas phase
Two phase volumetric flow rate
The total volumetric flow rate of the multiphase flow is considered to be the summation
of the volumetric flow rates of the liquid and the gas phase:
GG
G
mQ
LL
L
mQ
L GQ Q Q
Where:
QL: the volumetric flow rate of the liquid phase,
QG: the volumetric flow rate of the gas phase,
ρL: density of the liquid phase,
ρG: density of the gas phase,
Total mass flux of the multiphase flow
When the flow properties of a multiphase flow in a pipeline are examined it is of great
importance to take into consideration the mass influx. It represents the mass flow rate
of the flow that passes through a specific cross sectional area of the pipeline. The
mass influx is usually used in computational fluid simulation of the multiphase phase:
mG
A
Quality/Dryness fraction
The dryness factor is the percentage of the mass flow rate of the gas phase over the
total mass flow rate:
G G
G L
m mx
m m m
Volumetric quality
The volumetric quality is the percentage of the volumetric flow rate of the gas phase
over the total volumetric flow rate:
G G
L G
Q Q
Q Q Q
1
1 11
G
G L G
L
x v
x v x v x
x
Superficial liquid and gas velocity
Superficial velocity is the velocity which each phase would have if the flow was single
phase, so that each specific phase would occupy entirely the cross sectional area
(reduced velocities over the cross sectional area of the pipe).

35 | P a g e
LASL
p
Qv
A
GASG
p
Qv
A
Where:
LAQ : actual flow rate of the liquid phase at pipeline conditions [ft3/s]
GAQ : actual flow rate of the gas phase at pipeline conditions [ft3/s]
pA : cross sectional area of the pipe [ft2]
Average liquid and gas velocity
The average velocity of each phase represents the volumetric flow rate of each phase
that occupies a specific part of the cross sectional area of the pipeline.
G G SGG
G G p G
Q Q vv
A H A H
1 1
L L SLL
L G p G
Q Q vv
A H A H
Two phase flow velocity
The velocity of the flow consisting of two or more phases depends on the volumetric
flow rate of each phase as it is indicated from the following equations:
mm
p
Qv
A
1
N
m Sk
k
v v
1
N
m kA
k
Q Q
Where:
mQ : actual total fluid multiphase flow rate [ft3/s]
k: refers to the different phases that consist the flow
Void/Area/Volume fraction and Liquid Hold up
The volume fraction represents the part of a cross sectional area of the pipeline that is
occupied by each phase. It can be also expressed as the percentage of the volumetric
flow rate of the each phase over the total volumetric flow rate. In literature usually the
liquid volume fraction is referred as liquid hold up. However the proportion of liquid
phase’s volume in a specific cross sectional area of the pipeline, is indicative of the
volumetric flow rate of the liquid phase and hence it’s velocity.
SL L Lv v H SG G Gv v H 100%L GH H G
G L
AVF
A A
Where:
VF: void fraction
Lv : the actual velocity of the liquid phase [ft/s]

36 | P a g e
Gv : the actual velocity of the gas phase [ft/s]
LH : the hold-up fraction of the liquid phase [%]
GH : the hold-up fraction of the gas phase [%]
SLv : superficial velocity of the liquid phase [ft/s]
SGv : superficial velocity of the gas phase [ft/s]
Consequently the hold-up is a major parameter on the design of the multiphase flow
in pipelines. More specifically the hold-up is connected with the following:
a) The dominating flow pattern,
b) Pressure drop through the pipeline,
c) Slugcatcher design
Slippage and hold-up
Slippage describes the phenomenon of the slipping of the two phases between each
other. This happens because the gas phase travels with higher velocity in the flow than
the liquid phase.
The slippage and hold up for each phase are correlated through the actual and the
superficial velocities of each phase and they affect the design of the pipelines.
In case that the gas and liquid phase are flowing with the same velocity, then no
slippage occurs between the phases.
Non slip liquid hold-up is called the fraction of the liquid phase that occupies the
cross sectional area of the pipe when no slippage conditions occur.
SLL
m
v
v
Where:
L : the non slip liquid hold-up fraction [%]
mv : two phase flow (mixture) velocity [ft/s]
Slip ratio is another factor that is used to characterize the multiphase phase flow
regime. It represents the ratio of the average velocity of the gas phase over the
corresponding of the liquid phase.
G
L
vs
v

37 | P a g e
When no slippage conditions (homogeneous flow), s=1.
3.3. Pressure drop in pipelines
Along the pipeline the pressure declines due to restrictions, geometry and the non ideal
flow. The total pressure drop along the pipeline is a contribution of the friction pressure
losses, the hydrostatic pressure drop when elevation changes occur and the change
in the kinetic energy of the fluids. All these factors are presented with the following
equation:
t f h ap p p p
tp : total pressure drop/losses,
ap : pressure drop/losses due to the fluids’ acceleration,
hp : hydrostatic pressure drop/losses due to elevation changes,
fp : frictional pressure drop/losses due to the viscosity of the fluids.
The total pressure losses can be estimated using correlations that have been
developed, like the one that is proposed by Lockhart and Martinelli (1949). They
consider the total pressure drop as a proportion of the contribution of the liquid over
gas phase and assuming a correction factor depending on the type of flow regime.
2
t Gp p bX
L
G
pX
p
Where α and b are coefficients and their values depend on the occurring flow regime.
The factor X is considered as the two phase flow frictional multiplier.
Table 2: Values for the coefficients of the Lockart and Martinelli correlation.
vG >>vL SLIPPAGE LIQUID AND GAS HOLD UP HL >>L
vG vL SLIPPAGE LIQUID AND GAS HOLD UP HL L

38 | P a g e
3.3.1. Frictional pressure losses
No slippage
When the no slippage conditions are met, meaning that the mixture is considered
homogeneous and the gaseous and liquid phases are moving with the same velocity,
the pressure drop due to friction is expressed by the following equation:
2
,2
ns mf ns ns
L vp f
D
L SL G SGns
m
v v
v
Where:
fns: the friction factor for non-slip multiphase flow
L: length of the pipeline
D: diameter of the pipeline
ρns: fluid density for non-slip multiphase flow
The friction factor fns when no slippage occurs between the different phases derives
graphically from the Darcy-Weisbach diagrams, using the Reynolds number that is
calculated within the following equation:
Re m ns
ns
v D
Where:
μns: the viscosity of the flow under no slip conditions
Slippage
When the flow cannot be considered as homogeneous and as a result slippage occurs
between the different phases, the friction pressure losses are higher than in case of
no slippage. The additional pressure losses are induced by the development of shear
stresses on the phases’ interface and by the energy consumption by flow mechanisms.
In this case the pressure drop due to friction is expressed by the following equation:
2
,2
ns mf s s
L vp f
D
s s nsf m f
Where:
fs: the friction factor for multiphase flow when slippage occurs,
ms: coefficient empirically derived

39 | P a g e
3.3.2. Frictional pressure losses for the flow through equipment
As the flow passes through the pipelines it meets equipment and geometry changes
that influence the pressure distribution, because they induce pressure losses. The
pressure drop is calculated according to the following equation:
2
,2
mm
f eq
vp K
ef LK
D
(in terms of pressure drop)
2
2
mvh K
g
(in terms of head loss)
Where:
K: the friction loss coefficient, which is obtained from experimental data or calculated,
taking into consideration the equivalent pipe length Le
f: the friction (Darcy-Weisbach) factor
g: acceleration of gravity
Δh: the head loss [m]
Table 3: Typical values of the pressure loss coefficient for different types of fittings.
3.3.3. Pressure losses due to elevational changes
The pipelines may be designed to change direction either in order to follow the terrain’s
elevation or in order to reach the facilities on an offshore platform or FPSO, in case of
risers. In any case of inclined pipelines the hydrostatic pressure downstream will be
less than upstream, due to hydrostatic pressure losses. The hydrostatic pressure
losses are calculated within the following equation:
sinh sp g L s L L G GH H
Where θ: inclination angle and ρs: density of multiphase mixture under slippage
conditions

40 | P a g e
4. Multiphase Flow Assurance
The most important parameters related to the flow in the pipelines are the following:
Noise suppression
Noise is generated from vibrations induced to the pipelines from the disturbances in
the flow that are propagating as pressure waves. It’s the result of the interaction
between the fluid and the pipeline walls.
Drag reduction
Drag forces may be reduced by reducing the pipe diameter, smoothing the walls of the
pipes, using surfactants.
Water-oil flow
Slug control
Multiphase flow simulation
Flow assurance
Flow assurance in the O&G industry is related to the issues arising from the
establishment of the beneficial flow of effluents in pipelines, in terms of financial profit
and flow preservation. Concerning the flow of oil and gas effluents arriving at the
wellhead through the flow lines that will guide them to the separation installations, the
engineering science has to deal with the optimum way of fluid transport.
Things are more complicated when the flow refers to the more than one phases. In this
case, the physical interaction between the phases may create blockages in the flow.
Also the physical conditions (pressure and temperature) of the environment
surrounding the pipelines strongly affect the effluents properties. The adverse effects
in the flow lead to severe production losses with financially catastrophic
consequences.
Flow assurance is of major importance for the downstream and midstream facilities in
the following cases:
Subsea deep water reservoirs where the temperature is very low and the
pressure is very high,
Onshore reservoirs with very low ambient temperatures (northern countries),
Flowlines exposed in extreme temperature fluctuations
4.1. Multiphase Flow assurance challenges
When the exploitation project reaches the stage of midstream facilities design and it
has been decided that the effluents will be transported under multiphase flow, many
design parameters have to be specified so that to accomplish the establishment of flow

41 | P a g e
assurance. The flow assurance challenges that arise during the multiphase flow refer
to the prevention of blockages in the flow, corrosion, erosion problems, avoidance of
extended pressure surges, managing of slugs and the appearance of cavitation in the
pipeline wall, while ensuring sufficient capacity.
4.2. Blockages
4.2.1. Waxes
Deposits formation
Paraffins are groups of hydrocarbons with high carbon numbers in their chemical
structure, which are soluted in oil. Waxes belong to the paraffins’ group and they are
linear hydrocarbons with more than 16 carbon atoms [19]. They are solid deposits
coming from the solidification of the paraffinic hydrocarbons’ molecules.
The solid deposits are distinguished in macrocrystalline (or paraffinic) and
microcrystalline waxes. Macrocrystalline waxes are long-chain saturated
hydrocarbons formed by paraffinic molecules (C18 to C36). Microcrystalline waxes are
formed by naphthenic molecules (C30 to C60).
Microcrystalline waxes have higher melting points than the macrocrystalline waxes
because the heavier carbon molecules that they contain are connected with strong
chemical bonds and more heat is needed in order to break the intermolecular bonds.
The formation of waxes is strongly connected to:
Low temperatures: Wax deposits are formed when the temperature of the pipe’s
wall is lower than the Wax Appearance Temperature (WAT), which is different for each
hydrocarbon mixture. For temperatures lower than the WAT, paraffins start to
crystallize on the wall. The temperature difference between the effluent’s WAT and the
pipe’s surface is more important than that between the flow temperature and the pipe’s
surface. The magnitude of this difference and the rate of cooling affect the deposits
structure. When the cooling is rapid the wax crystals have small sizes. Also, when the
temperature difference is large, the crystals are not formed uniformly because of the
different melting points and the final structure may contain cavities full of oil [20].
Low flow rate: When the volumetric flow rate is high, the turbulence drifts away from
the wax crystals and they do not agglomerate or deposit. Under these conditions the
possibility of waxes deposition is low. In order the particles to deposit, they have to be
cohesive enough to attach on the pipe's surface. The opposite happens when the flow
rate is low and the flow is considered laminar [20].

42 | P a g e
Pipe’s internal surface properties: the wax deposition on the internal surface of the
pipes is hindered when the surface is wetted by oil, because of lack of free surface in
order to develop. Also surfaces with high roughness are friendly environments for
waxes deposition [20].
Fluid composition: waxes formation is determined by the existence of heavy
compounds in the oil. Light and volatile oils will not face wax problems.
Wax formation may occur under the following flow and field operations:
Restrictions: the effluents expand when passing through restrictions, resulting to
the temperature’s reduction [19]. \
Artificial gas lift: artificial lift is applied in wells with low flow rate. In this case the oil
needs more time to reach the wellhead and in the meanwhile its temperature is getting
lower.
Dissolved gas liberation and evaporation of the lighter components: as the light
components of the oil evaporate the heavy components become less soluble. The oil
becomes heavy which means that it has higher concentration in molecules that in the
appropriate conditions may form waxes.
Effects of wax deposition
The formation of waxes is altering the flow behavior of the crude oil, which starts to
demonstrate non Newtonian characteristics.
The problems that are created are the following [20]:
Increase of oil viscosity: more viscous oils exhibit higher pressure drops due to
increased friction pressure losses. This will decrease the pipe’s capacity, resulting to
higher pumping demands.
Increase of yield stresses that are applied when restarting the flow after a shut
down: after a shut down the oil has rested and cooled down, so becomes more
viscous. If waxes have been developed, its viscosity will be increased and the initial
pressure that has to be imposed in order to restart the production has to be bigger.
Depositions of wax crystallites at the internal walls of flowlines, tubings,
wellheads, tank bottoms and process equipment: Macrocrystalline waxes increase
the paraffin content of the oil that is guided to production facilities and transport
operations [19]. Microcrystalline waxes create problems in storage facilities, because
they accumulate in tanks, where they form sludges that remain in the bottom.
Prevention/Reduction techniques

43 | P a g e
Paraffin waxes can either be prevented or removed [19]. The methods that are used
in order to prevent and to remove the wax deposits are the following:
Pigging: When they have been formed in the flow, they can be removed by
implementing techniques as pigging. With pigging the pipelines are cleaned by the
waxes that are formed in the walls, by “scratching” them.
Injection of solvents: they increase the solubility of deposits and re-dilute them.
As solvents are commonly used xylene and mixtures of xylene, toluene and
naphthalene [20].
Injection of chemical inhibitors: there are surfactants that either inhibit the wax
deposition on the surfaces or inhibit the wax crystal growth (chemicals and
biochemicals) [20].
Control the temperature at values greater than the WAT. Insulation of the
associated equipment is a common prevention action.
4.2.2. Asphaltenes
Deposits formation
Asphaltenes are one of the four compound groups that constitute oil (Saturates,
Aromatics, Resins, Asphaltenes). They are defined as the oil compounds that are
insoluble in n-pentane or n-hexane (light alkanes), but soluble in toluene or benzene
[5].They have the biggest molecular weight than the other oil compounds. They are
large, highly polar components made up of condensed aromatic and naphthenic rings,
which also contain heteroatoms such as nitrogen (N), sulfur (S) and oxygen (O). Pure
asphaltenes are black, nonvolatile powders. [21]
The asphaltene molecules suspended the solution due to the co-existence of resins
(oil compounds with low molecular weight and heteroatoms N, S, O) in the fluid. In
case that the resins fraction reduces below the limit, the asphaltenes molecules form
groups of long molecular chains, which are called micelles. The micelles appear in the
fluid as solid depositions i.e. asphaltenes’ precipitation [22].
The precipitation depends on the oil’s composition, temperature and pressure regime.
For pressures up to the bubble point, the precipitation increases and becomes
maximum at the bubble point, for pressures greater than the bubble point pressure,
precipitation is decreasing. This occurs because for pressures above the bubble point
the flow is single phase (only liquid), no gas is released and no changes in composition
are happening, so the asphaltenes remain soluted in the fluid and do not create
deposits [23].

44 | P a g e
Asphaltenes deposition may appear in production wells, flow lines and storage
facilities. The possibility of asphaltenes deposition is higher under the following
conditions:
Acidization of the wells: it results in coagulation of the asphaltenes and
impediment of production, due to chemical reactions that affect the micelles [24].
CO2 flooding of the well: the CO2 reacts with the fluid’s molecules and as a result
asphaltenes start to create agglomerates.
Turbulence in the flow: the occurrence of turbulence induces the development of
big shear stresses. This affects the oil’s composition because it may provoke the
breakage of the chemical bonds of some of its molecules. In this case the asphaltenes
are affected and destabilized, which results to the increase of their deposition.
Hydraulic equipment: the existence of hydraulic equipment such as valves and
chokes reinforces the deposition of asphaltenes because they induce more turbulence
in the flow.
Well tubing: in case of metal corrosion in the tubing, the oxidized metal reacts with
the fluid’s molecules resulting to the destabilization of the asphaltenes and they start
to create depositions.
Formation rock: in the reservoir it is possible to occur asphaltenes deposition.
During depletion the pressure is reduced and this may cause precipitation.
Effects of asphaltenes deposition
Problems arise when the depositions cause the reduction of the cross sectional area
of the pipelines. Therefore the effective flowing area is reduced and the oil production
is either reduced or completely jammed.
Prevention/Reduction techniques
The prevention of the asphaltenes deposition is a complex problem for which no
specific remediation method has been found yet, due to the difficulty in determining
the chemical structure of the deposits. Some of the commonly employed methods to
prevent and to reduce the asphaltenes deposition are the following [24]:
Xylene mixtures are applied as solvents and wash the affected equipment,
Injection of chemicals additives as aromatic fatty sulfates and aromatic amines.
Control the pressure and temperature of the flow so that to avoid the formation
of asphaltenes depositions. If it is possible the pressure should be retained at values
below the bubble point, only in case that this doesn’t affect the production.

45 | P a g e
Cleaning the pipelines and the wells where asphaltenes deposits appear by
applying pigging.
4.2.2.1. Scales
Scales are crystalline deposits consisting mostly by inorganic salts like barium sulphate
(BaSO4), strontium sulphate (SrSO4), calcium carbonate (CaCO3) while they may also
contain organic molecules like naftenates [5]. Their crystalline structure derives from
chemical reactions in the production water.
There are two categories of scales: sulphate and carbonate scales:
Sulphate scales are formed due to chemical reactions between reservoir effluents
and brines (sea water or formation water).
Carbonate scales are formed when the pressure reduces enough or when the pH
of the effluents mixture increases [5].
Generally the reason for scales formation is the supersaturation of fluids in minerals,
which may happen due to mixing of incompatible brines or change of flow pressure
and temperature. The majority of the minerals become less soluble, when temperature
or pressure decrease and this results to the deposition of the insoluble salts. Exeption
is the calcium carbonate for which solubility in water decreases when temperature
increases.
Also when pressure decreases, the CO2 that is contained in the water starts to
evaporate, causing pH increase (i.e. decrease of acidity), which also leads to the
formation of carbonate scales [25].
In Figure 18 are presented the possible locations in an oilfield, where scales may
occur. More specifically the possibility of scale deposition is higher under the following
conditions:
Gathering flow lines: surface horizontal or near horizontal pipelines transfer
effluents that arrive from different wells. Each effluent has different brine composition
and their mixing may result into scale formation due to chemical reactions between the
minerals of the different brines [5]. Also the flow temperature decreases because of
the heat transfer from the fluids to the environment.
Water flooded wells: in case of injecting sea water, the minerals of the sea water
may react with the minerals of formation water and form sulphate scales [5]. Also as
the sea water is flowing towards the reservoir, its pressure and temperature increase
and the deposition of calcium carbonates is possible.

46 | P a g e
Depleted wells: after some years of exploitation the water cut will start to increase.
If water injection will be selected as an artificial production lift, the formation water will
reacts with the injected water, as previously described for the water flooded wells.
Wells under normal production: during oil production the pressure and
temperature decline. This results to the evaporation of CO2 that is contained in the
formation water, which decreases flow acidity and may result to the deposition of
carbonate scales.
Figure 18: Scale formation occurrence during different oil field’s operations [26]
Effects of scales deposition
The major problems that scale deposits create are the following:
Formation damage (near the wellbore): in this case scales result in the decrease of
permeability and increase of the skin factor.
Blockages in:
o perforations or gravel packs
o restrict/block flow lines: in these cases scales create a film that
surrounds the pipe walls peripherally.
o safety valve & choke failure
Corrosion underneath the deposits
Some scales are significantly radioactive (NORM)
Suspended scale particles can create the following problems:
Plug of the formation & filtration equipment
Reduce oil/water separator efficiency

47 | P a g e
Reduction techniques
Scales prevention is not an easy task, although it is a pressing issue, because of the
increasing use of water flooding as a secondary oil recovery method in many oilfields
[26]. Most scale reduction techniques are referred to their detection and elimination.
Their removal can be achieved by applying mechanical techniques as pigging or by
injecting chemical and acid inhibitors. Also periodical chemical tests of the produced
water should be conducted in order to detect any scales formation tendency. More
specifically:
Inhibitors injection: Their removal can be achieved by injecting either
polyphosphate crystals or liquid phosphonate inhibitors in the formation when hydraulic
fracturing operations are conducted.
Sonic tools: they create high-frequency pressure pulses that remove the
deposits [25].
Pigging: deposits removal with mechanical methods can be achieved by using
positive displacement motors and mill, hydraulic impact hammers, blasting techniques
for injecting water or chemical washes in the damaged equipment [25].
4.2.2.2. Gas hydrates
Formation conditions
Hydrates are solidified gas molecules, entrapped in water cells that are formed under
ambient temperatures close to the freezing water point and high pressures [5]. This
results to the formation of structures of rigid and solid water molecules with entrapped
gas molecules.
The possibility of hydrates formation is most likely to occur in the operation facilities
during:
Shut down operations: after shutting down the production, the temperature in the
pipelines drops because of the heat transfer to the environment. If the temperature
reaches the water hydrate equilibrium value, formation is possible.
Subsea operations: in subsea environments the ambient temperature decreases
from the water surface towards the seabed. Under so low temperatures that are close
to the freezing water point, the formation of hydrates is very possible.
Once gas hydrates are formatted they can create blockages in the flow and reduction
of the effective cross sectional area of the pipeline and thus to the reduction of
production and in case of severe blockage to the destruction of the pipeline.

48 | P a g e
Prevention techniques
In order to avoid hydrates formation, the flow must be characterized by high
temperatures (>20oC for a natural gas mixture). In Figure 19 are presented the
conditions of hydrates formation for a natural gas mixture.
Figure 19: Typical mixture hydrate curve for a natural gas mixture [5].
Many prevention methods have been developed:
Temperature control: Thermal insulation is usually applied to the external walls of
the pipelines in order to keep the temperature in the interior of the pipeline, above the
hydrate formation limit. This requires extensive thermal analysis of the system taking
into consideration the ambient temperatures and management of the cold spots. The
insulation materials and points of placement must be chosen carefully so that the cost
threshold not to be exceeded. Another way to control the temperature and to keep it
high is by conducting heat from an external source in the flow.
Injection of chemical inhibitors in the flow: As inhibitors for the prevention of gas
hydrates is commonly used Methanol or MEG (MonoEthyleneGlycol), salts, alcohols,
glycols or ammonia.
Cold Flow Technology (CFT): The main concept is the controlled formation of
hydrates and the prevention of destructive blockages. The Cold Flow Technology is
based on the conclusion of scientific studies and observations [27] that the hydrates
do not accumulate when the temperature is kept constant. When the flow is entering
the pipeline, which is not insulated, hydrates start to form, because the ambient
temperature is low. Before the hydrates start to create agglomerates and depositions,
the flow is separated in gas and liquid phase. The liquid phase is cooled down in a
heat exchanger reaching a final temperature similar to the ambient and then it is
boosted to the reactor, where it is mixed again with the gas phase. By this way the
already formed hydrates do not accumulate to create blockages in the flow and they
Dissociation curve

49 | P a g e
remain in suspension since there is no heat convection between the ambient
environment and the flow in the pipeline.
Reduction techniques of already formatted hydrates in the pipelines
Heating up the flow: If heat is provided to the flow, the temperature will increase,
which will cause the hydrogen bonds that are responsible for the formation of the
hydrates to loosen up and to break eventually.
Depressurization: by reducing the pressure the gas and the solid water molecules
tend to liquefy. The pressure reduction must be done simultaneously and uniformly
from both sides of the hydrate plug otherwise the pressure difference between the
sides of the hydrate plug might cause the hydrate to move and result in a sudden
expansion with catastrophic results for the pipeline.
4.2.3. Operational
4.2.3.1. Liquid slugging
Gas-Liquid slugs are not considered as a flow assurance problem, as long as they do
not dominate the flow and create blockages. The pipeline network and the equipment
can be designed so to take into consideration the formation of slugs and that it can be
avoided, however prevention techniques can be applied to eliminate its formation.
Riser and terrain oriented slugging are the two types of slug flow that may cause
problems to the flow assurance.
At a riser plug liquids reach the bottom of the riser (the point of elevation change at
Figure 20a) and move upwards having as driving force the pressure of the flow, which
is induced mostly by the gas phase. As the flow moves upwards, the pressure
increases, because of the addition of the hydrostatic head from the liquid phase. Under
these conditions the liquid accumulates upstream and create slugs preventing the gas
from passing through the pipeline (Figures 20b). The pressure of the accumulated gas
downstream of the liquid slug increases. When the gas pressure overcomes the
pressure drop in the upstream pipeline, the liquid will blow out (Figure 20c). After the
blow out the pressure downstream will decrease and as the production continues liquid
loading may occur and liquid may start again to accumulate downstream (Figure 20d)
[28].

50 | P a g e
Figure 20: Production phases of riser slugs. [5]
Slugs create density discontinuities in the flow as well as pressure fluctuations. This
affects the gas flow as well as the separation procedure.
Hydrates formation: The discontinuities of the density are created due to the
extended occupation of flow with gas areas, the low density is fluid and the lower heat
capacity of the fluid. As a result, in case of extreme low ambient temperatures, the
areas occupied with gas may solidify, forming hydrates and even more solid plugs that
act as “bullets” for the pipe, guiding to its destruction.
Bad separation: The separation procedures are strongly affected by the
homogeneity of the layers that constitute the different phases. As a result of the
presence of slugs in the flow, the fluids can’t separate properly because of the multiple
layers of the same phase in a specific cross section.
Corrosion: High gas rates that are met in slug flow regimes, increases the erosion
rate.
Slug reduction techniques
Slug catchers: they operate as physical low-pass filters that filter the flow with high
wave propagation frequency (like slug flow) and transform it to smooth flow [29].
Subsea separation: Subsea separation is the conventional method for treating the
effluents in the midstream facilities. In this case slugging possibilities are eliminated
because the flow is separated in different streams per phase right after the wellhead.
Riser base gas injection [30]: In case of gas injection at the lower parts of the
risers, the fluid becomes lighter and the liquid flowing back is reduced. The creation of
severe slugging is prevented because the liquid flow is reinforced by inserting gas. The
backpressure increases and the liquid is forced to flow, preventing the accumulation
and slugging.
Self induced gas lift [28]: The idea behind self gas lifting is the usage of the gas
that exists at the top of the smooth flow, in order to inject it at the base of the riser. The

51 | P a g e
result is expected to be the same by injecting gas from a new well, as mentioned
above.
Topside choking [29]: By installing a choke at the outlet of the riser the flow rate is
controlled in such a way that disables the slug formation. When the choke closes, the
flow, that is able to pass through it, is reduced and consequently the velocity of the
fluid is reduced. However, the gas on the bottom of the riser keeps forcing the liquid to
blow out and the liquid slugging is avoided because the liquid is imposed in greatest
pressure differences, which is the driving force for the flow.
Optimize well production: By changing the production with chokes, the slug
phenomena may be prevented. The chokes control the flow rate so that the pressure
that is imposed to the liquid phase from the gas phase, is low enough to prevent
slugging.
Increase gas injection rate: By increasing the rate of the injected gas, the
backpressure is increased and liquid slugging is avoided. In this case should be paid
attention to the Joule-Thomson effect. More specifically, as the gas expands and taking
into consideration that the pipelines are well insulated, so that no heat exchange with
the environment to occur, the temperature of the gas will drop. This may cause the
unpleasant consequences of hydrates formation. In addition the increased gas flow
rate will add frictional losses, which must be overcome and this reduces the injection
system’s efficiency.
Active choking: Reduces the slug length by opening the hock valve when the slugs
start to develop.
4.2.3.2. Pressure maintenance
The pressure drop in the flowlines and the risers must be as lower as possible, in order
to achieve maximum production efficiency. This is interpreted as retaining the flow
regime in the pipelines constant, avoiding the pressure and temperature fluctuations
and reducing the backpressure of the wells.
Keeping the flow properties and the flow regime constant is achieved by inspecting
and regulating the PVT (Pressure-Volume (in terms of volumetric flow rate)-
Temperature) properties of the multiphase flow constant during the transport of the
effluents. Appropriate mechanical and hydraulic equipment as chokes, valves, flow
meters is used in order to regulate the flow rates and measure the fluid properties.
Reduction of the wells backpressure can be achieved by using multiphase pumps just
after the rise of the effluents to the manifolds. The types of the multiphase pumps and

52 | P a g e
the pumping system configuration will be presented analytically in the subsequent
chapters.
Factors affecting pressure drop in multiphase flow in pipelines
a. Flow rate
The flow rate is expressing the velocity of each phase that enters the flow. Any change
in the flow rate of one phase is enough to change the flow pattern in the pipeline. In
case that the gas phase velocity increases, the pressure drop also increases.
b. Friction losses
Between the fluid and the walls of the pipeline friction is developed and it is expressed
as pressure losses ΔPfriction. Friction is developed by the shear stresses on the surface
of the fluid flow. The more viscous the fluid the higher the shear stresses and the
friction losses.
c. Liquid percentage in flow
The liquid phase increases the density of the flow, because liquids are denser than
gases. This increase in the flow’s density leads to an increase of the frictional pressure
losses along the flow. So, the larger the densities of the liquids constituting multiphase
flow, the larger the pressure drop in the flow. For this reason when the wells start
producing more water than oil and gas, the pressure drop increases because the water
has greater density.
d. Length of the pipeline
The flow in the pipeline is not ideal, but viscous. Due to the viscosity of the fluid, the
velocity and pressure distribution in the direction vertical to the flow is characterized
by the boundary layers that are created on the walls of the pipeline. Along a cross
sectional area of the pipeline the thickness of the boundary layers increases and this
result in the formation of a bottleneck area in the pipeline, this restricts the flow and
increases the pressure drop.
e. Temperature
Any change in the temperature of the gas phase is enough to change the flow pattern
in the pipeline, because gas is very compressible. In case that the gas phase
temperature increases, the pressure drop also increases.
f. Restrictions in the flow due to pipeline geometry
Changes in the pipeline’s geometry and flow’s direction, as curvatures, inclinations and
elevation changes, create local pressure losses.
g. Restrictions in the flow due to mechanical equipment
The mechanical equipment that is installed along the pipeline for the surveillance,
control and measurement of flow properties, like chokes, valves and flow meters

53 | P a g e
enforces the flow to pass through smaller diameters. As a result their presence in the
pipeline adds pressure imposes additional pressure.
4.3. Integrity
4.3.1. Corrosion
Corrosion is referred to the abruption of particles from the surfaces that are in contact
with the flow, due to chemical or electrochemical reactions. The main causes of
corrosion are the reaction of the steel surfaces of the equipment with carbon dioxide
(CO2), hydrogen sulfide (H2S) and water (H2O).
The corrosion that may appears on the oil and gas facilities can be categorized to
external and internal corrosion, according to the parts of the equipment where it may
be developed.
External corrosion is caused by the oxidation of the steel when it is exposed to air.
As a result of this the metal surface loses its strength and becomes more brittle. If the
phenomenon continues for a long time, the corrosion can extend to the interior of the
pipeline and may cause the collapse of the pipeline.
Internal corrosion is caused by the chemical reaction of some of the transported fluid
ingredients and the steel material of the pipelines’ walls or equipment.
According to the nature of the corrosive agents, the following corrosion types may
appear:
CO2 in the flow (sweet corrosion): CO2 may appear in the flow as one of the non
hydrocarbon compounds of oil or because of direct injection for enhanced oil recovery
purposes. When it comes in contact with water it reacts, causing the formation of
carbonic acid (H2CO3). The corrosion due to CO2 is caused by the electrochemical
reaction between the carbonic acid and the iron of the metallic surface of the pipeline
[31].
H2S in the flow (sour corrosion): H2S may appear in the flow as one of the non
hydrocarbon compounds of oil. As the CO2 corrosion, the prerequisite for sour
corrosion is the presence of water in the flow. Corrosion due to H2S is caused by the
chemical reaction between the hydrogen sulphide, water and the iron of the metallic
surface of the pipeline [31]. The result of this reaction is the creation of iron sulphide
(FeS), which is observed as a film on the surface of the pipe.
O2 in the flow (oxygen corrosion): O2 may intrude the flow through leakages in
pumps’ seals, open hatches and process vents [32]. It reacts with the metallic surfaces
causing its oxidization.

54 | P a g e
Galvanic corrosion: galvanization is referred to the phenomenon of the
electrochemical reactions between the molecules of two metallic surfaces with different
electrochemical potentials, when they are in contact. The result of those reactions is
the charging of the surfaces with opposite electric loads thus altering their chemical
structure. The material properties change due to the change of the intergrannular
chemical bonds, resulting into corrosion damage.
Crevice corrosion: is a type of corrosion that appears on the surface of the metallic
equipment due to the concentration of different corrosive agents in these spots. It
appears in crevices and gaps of the equipment where fluid may get stagnant [32].
Microbiological corrosion: microorganisms such as bacteria are accumulating
and create colonies in reservoirs and in spots of equipment where stagnant water is
concentrated. Common products of the digestion procedures are CO2, H2S and organic
acids which cause corrosion on the metallic surfaces [32].
Stress Corrosion Cracking (SCC): is a combination of corrosion and tensile stress
failure. It occurs when the material is reaching its fatigue thresholds and cracks start
to propagate to the rest of the material meanwhile the corrosive environment
contributes to the expansion of the cracking [32].
Factors that affect (internal) corrosion
Flow temperature: in flows with high pH, high temperatures enhance the formation
of iron carbide on the surface of steel equipment, which is responsible for the creation
of the corrosion protective layer [32]
High pressure: under high pressures the solubility of CO2 and H2S in water
increases, so the environment becomes more corrosive.
pH of the environment: The pH of a flow is indicative of the number of cations
(positively electrically charged molecules) of hydrogen (H+) in the flow, which
contribute to the neutralization of the electrochemical potential. High pH is connected
to the low solubility of iron carbonate (FeCO3). Hence, iron carbonate doesn’t dissolve
fast and can accumulate on the metallic surfaces, as a protective layer, lowering by
this way the corrosion rate [31].
Problems that are created due to corrosion
Corrosion is not causing problems directly in the flow, but it affects the properties of
the pipe’s material.
As the corrosion keeps spreading in the surface of the metallic equipment, the
properties of the material change. More specifically the steel loses its elasticity and

55 | P a g e
becomes more brittle. The impacts of corrosion accumulate with time and they may
lead even to the complete failure of the material and its breakage.
Prevention/Reduction techniques
Inhibitors: chemical (organic and inorganic) inhibitors are imported in the flow and
protect the metallic surface from corrosion. They can create a protective surface layer
which prevents the contact of the metallic surface with the corrosive agents or they can
react with them and inactivate their corrosive effect [32].
Cathodic and Anodic protection: by this technique is prevented any
electrochemical reaction between the metallic surfaces and the possible corrosive
agents by neutralizing the electric potential [32].
Usage of corrosion resistant materials: oil and gas equipment is usually made of
steel alloys with high corrosion resistance.
Internal and external surface resistant coating: in order to avoid the corrosion,
the metallic surfaces of the equipment, are covered with protective coatings, usually a
primer rich in zinc [33]. Covering steel with zinc coatings is commonly referred as
galvanization. Galvanized metals are “corroded” metals, where zinc has reacted with
iron. The properties of the metallic equipment are altered but the steel has not reach
the brittleness’ thresholds. The zinc creates a layer on the steel, disabling corrosion
from environmental parameters to intrude the equipment. In the same way other
commonly used coatings are fiber glass, glass flake, epoxy, rubber, nickel and
cadmium [32].
Modifying the environment’s chemistry
Modifying operational parameters (decrease temperature)
4.3.2. Erosion
Erosion failure
Erosion is a common problem that is met when fluids, that contain solid particles, flow
over metallic surfaces. Erosion damage is caused by the solid particles that are
transported with the effluents flow or from the liquid droplets that are detected in the
flow. Solids in flow may come from sand, proppants and deposits of hydrates,
asphaltenes, waxes and scales, as mentioned in two phase flow between Liquid-Solids
chapter.
It is referred to the abruption of particles from the surfaces that are in contact with fluid
flow that contains solids. The erosive damage affects the protective oxide film of the

56 | P a g e
metallic surfaces and the result is observed as the creation of grooves, pits and other
types of deformation of the metallic surfaces [34].
The main erosion mechanisms are the following [35]:
Liquid droplets impingement: In case of multiphase flow or wet gas flow, liquid
droplets may appear in the flow in case of high gas velocities and volumetric flow rates.
The extension of erosion in this case depends on the droplet size, impact velocity,
impact frequency and liquid and gas density and viscosity [34]. The constant collision
of the liquid droplets on the walls of the pipeline may cause material fatigue and
abrasion [35].
Cavitation: in case of liquid droplets that are accumulating on the walls of the
pipeline and they break suddenly, metallic particles from the walls may abrupt.
Solid particles impingement: in case of multiphase flows that contain solids, the
flow regimes will exhibit the patterns and the characteristics of two or three phase flow
as described in previous chapters. So the solid particles may be deposited on the
bottom of the pipe or they may transport as dispersed flow in other fluids. When they
collide with the pipeline walls they gradually cause material fatigue and abrasion [35].
Factors that affect erosion
The velocity of the solid particles: the bigger the velocity of the solid particles,
the rougher will become the surface and thus the more extended will be the erosion.
Many scientific researches have correlated the relationship between the impact
velocity and the erosion rate by the general equation [31]:
p
oE E V
Where:
E is the erosion rate, Eo is a constant, V is the impact velocity and p is the velocity
exponent p. the values of Eo and p vary according to the different experimental
approaches.
The shape and size of the solid particles: the size of the solids particles affects
the erosion rate up to a certain size (50 to 1000μm) while the particles with spherical
shape contribute less to the erosion damage than the ones with angular shapes [31].
Angle of attack: it has been observed that solid particles that collide on the metallic
surface with non orthogonal angle of incidence have a great contribution to the
deformation of the surface [31].
Flow rate: when the volumetric flow rate increases, more liquid and solid particles
will collide on the walls of the pipe, which results to increased erosion damage [35].

57 | P a g e
Restrictions in the flow: the existence of restrictions along the pipeline indicates
that downstream of them the flow will exhibit high velocities. In case of sand or liquid
droplets in the flow, they will collide on the walls of the pipeline with greater velocity,
thus increasing the erosion damage.
Sudden changes of flow direction: when the pipeline network has sharp elevation
changes, the sand particles and/or liquid droplets in the flow may collide at the points
of elevation change on pipeline’s walls, resulting in their abrasion.
Problems that are created due to erosion
Related studies and experiments have concluded that the eroded metals become more
brittle [31]. When it is combined with extended corrosion the impacts are more severe
and may become destructive for the pipeline. The corroded particles that have created
a layer on the metallic surface are removed by the transported solid particles thus
destroying the corrosion layer. This layer was acting as a surface protection, disabling
the corrosion to intrude further below the surface [32].
Components of the pipeline network that are more vulnerable to erosion are the
following [34]:
Chokes
Sudden constrictions
Partially closed valves, check valves and valves that are not full bore
Standard radius elbows
Weld intrusions and pipe bore mismatches at flanges
Reducers
Long radius elbows, mitre elbows
Blind tees
Straight pipes
Prevention/Mediation techniques
Modeling the solids flow: there are several correlations about the
dependence of the erosion rate and the solids flow that can be used in combination
with flow modeling [36]. This measure implies the control over the production flow rate.
In the same direction the international standard API RP14E limits the maximum flow
velocity according to the density of the fluid by the following equation [35]:
e
CV
Where:
Ve is the maximum allowable erosional velocity [ft/sec], ρ is the density of the fluid
[lb/cft], C is a constant value that ranges between 100 to 125.

58 | P a g e
Use of improved pipe materials: the pipelines are made of alloys with
improved resistance on erosion. The alloys UNS N06625 and UNS S32750 are some
of the materials used for subsea applications [36].
Sand removal: downhole sand screens and gravel packs or sand separation
devices are used to remove sand from the flow [34].
4.3.3. Cavitation
When the pressure falls below the bubble point of the mixture, gas bubbles start to
appear in the flow. The gas bubbles are drifted away to areas with lower velocity and
higher pressure, where they collapse and the gas condensates. The problem is caused
when the bubbles are in contact with the pipe’s walls, because when they collapse
they cause locally high pressure, they may cause the abruption of some solid particles
from the pipe’s walls.
Cavitation may occur on pump impellers because of the low suction pressure regime.
In the suction side of the pump low pressure appears due to [37]:
- High flow velocity in case that the volumetric flow rate is high or
- High elevation difference between the point of flow inlet in the pump (suction side)
and the effluent level (reservoir), with the pump operating at a much higher elevation
level or
- Pumping of highly volatile effluent or
- Pressure drop in the fittings
4.3.4. Water hammer/Hydraulic Shock
Hydraulic shock (or water hammer) is a common problem that is met in hydraulic
installations of single or multiple phase flow pipelines. Usually flow under these
conditions is called “surge flow”.
It is referred to a sudden pressure drop or increment in the flow. Usually sudden
pressure fluctuations are met when sudden closing of non return valves (valves that
allow the flow through them only by one direction) and chokes occur upstream of the
flow or when a pump starts or stops suddenly. Under these violent pressure
fluctuations, the fluid stops moving abruptly sudden. The change of its kinetic energy
creates a great pressure difference that is induced to the fluid as wave that propagates
in the inverse direction of the flow. This phenomenon is met in flows that have at least
one liquid phase, because the liquids are highly incompressible, so the surge pressure
deviations are more intense [38].

59 | P a g e
Problems that are created due to hydraulic shock
Pipeline rupture: The pressure waves produce vibrations which are transformed
to sound waves. The vibrations affect the strength of the pipeline. Th forcesapplied on
the walls of the pipelines are big enough to lead to the pipeline’s burst [38].
Well completion damage, unset packers due to the great pressure surge.
Leakage at pipeline’s joints due to the high forces that are imposed on the joints.
Damage to pumps downstream of the flow
Operations and facilities during which hydraulic shock may occur
Downward inclination of the pipeline: The damage and burst of the pipeline may
be greater if it is inclined downwards. In this case the pressure difference that will be
created will be higher due to the additional hydraulic pressure drop [38].
Well Shut in and Start up: during these operations both bottomhole and wellhead
pressure increase and reduce respectively. The pressure fluctuations may lead to
hydraulic shock occurrence if they are not controlled [38].
Cavitation: when a valve close or a pump stops, the pressure difference
downstream creates an inverse flow backwards, towards the pump or valve. In case
that the pressure downstream the valve or pump decreases more than the bubble point
of the mixture, gas bubbles will appear in the flow. When the gas bubbles meet the
surface of the closed valve/pump, they will break resulting to an extended and violent
pressure surge [39].
Prevention/Reduction techniques
The noise that is created as an effect of the sharp pressure fluctuations in the flow, by
unexpected opening of pressure relief valves and when the flow shows pulse
periodicity, are indications of the hydraulic shock occurrence [39].
When one of these indications in the flow occur the following reduction techniques may
be applied:
Reduction of flow velocity: by using pipelines of larger diameter or by lower the
volumetric flow rate, the sudden pressure drop that may occur won’t be harmful for the
pipeline.
Surge tanks: they are used to absorb liquid in order to reduce the pressure surge.
Surge alleviators
Pressure relief valves
Air inlet valves
Injection of nitrogen or air into the fluid

60 | P a g e
5. Conventional midstream production boosting system
5.1. Conventional production system description
In conventional production systems, the effluents are guided to separators, where the
multiphase flow is separated into two or more different phases. From the separators,
one single phase pipeline is leaving. A gas pipeline is connecting the separator with
the dry gas compressor and an oil pipeline is connecting the separator with the liquid
(single phase) pump. Single phase flow lines are guiding each phase to the gathering
stations.
In multiphase production systems the effluents are guided to a multiphase pump and
then multiphase pipelines are responsible for their transportation to the gathering
stations.
In Figures 21 are presented the different configurations between a subsea production
system in which a multiphase pump is installed downstream of the wellhead and a
conventional production system in which a satellite platform hosts the separation,
single phase pumping and compression facilities.
Figure 21: Differences in offshore production system configuration with and without using MPPs [8].
Seabed equipment
Umbilicals: They are cables which consist of different type of wires grouped in a
steel tube matrix. The wires are used to transfer power and heat from the surface to
the seabed or control signals. They provide electric and fiber-optic signals, electrical
power and hydraulic and chemical injection fluids to the subsea unit. They can also
power subsea boosting and compression, as well as provide flow-line heating to
prevent the formation of wax and hydrates that could slow oil production.

61 | P a g e
Tie-in Systems: The pipelines that lie on the seabed cannot get connected manually
by divers because the human factor increases the risk of the project and mostly is only
possible for shallow depths. Tie-in-systems operate in favour of divers so that to
connect the pipelines on the seabed remotely. All the subsea operations all
implemented by ROVs (Remote Operated underwater Vehicles).
Different patented schemes have been developed from companies with great
experience in the subsea piping sector.
Different patented schemes have been developed from companies with great
experience in the subsea piping sector.
- Horizontal Connection Systems (HCS): They are used for the connection of
horizontal rigid jumpers and spools, flexible flow lines and umbilicals.
- Remote Tie-In System (RTS):The system can be installed by a ROV which is
operated from the surface
- Vertical Connection Systems (VCS): They are used for tying in vertical rigid
jumpers, spools and flexible flow lines, usually in deep waters without fishing
activity that would require extra protection for subsea structures.
Power System
Control System
Electrical and hydraulic jumpers
Chokes
Figure 22: Configuration of an onshore production system using multiphase boosting [40].

62 | P a g e
5.2. Other midstream production boosting systems
5.2.1. Subsea dry gas compression
Subsea compression is necessary for gas fields that exist in extreme ambient
conditions, like low arctic temperatures, because the ice formations in surface disable
the development of floating production facilities [41].
Dry gas compressors can handle fluids with less than 0.5% liquid volumetric fraction,
which means that they are referred to gases without water or liquid condensate when
the gas is imposed to very low temperatures. Subsea compression is complex and
needs high power drive (from 10 to 50MW) [41].
The first subsea dry gas compressor was installed in September 2015 in the Åsgard
gas field. The project was a contribution of AkerSolutions which designed and installed
the system and Statoil which operate the field.
For the design of the system, the selection of the suitable equipment and the
establishment of the flow assurance must be taken into consideration the following
parameters:
Prevention of gas hydrates formation in the dead legs and the gas line,
Elimination or absorption of the flow induced vibrations,
Control of the fluid’s temperature
The gas compression systems do not withstand alone on the seabed, but they are
connected with the appropriate hydraulic equipment, which enables the control,
regulation and measurement of the flow properties, in order to establish flow assurance
and the desired flow result.
Figure 23: Subsea production system.
The major hydraulic components that are met in gas compression systems are:
Compressor: The compressors that are used in the oil and gas industry do not differ
from the ones that are used in other industries. Their main operation is the increase of
the pressure of the gas phase.
Anti-surge, Control, By-pass valves

63 | P a g e
Venturi pump
Inlet cooler: Inlet coolers are heat exchangers that reduce the temperature of the
effluent inserting the scrubber. By this the efficiency of the compressor is increased,
because it needs to spend less energy in order to increase the pressure of the gas
phase. They don’t have rotary parts, because they use the laws of natural heat
convection between the cold sea water and the effluents. The cooler consists of tubes,
open from both sides, through which pass the effluents. The system is open and in
contact with the ambient environment of sea water (Figure 8).
Outlet/Discharge cooler: They have similar operational with the inlet coolers. They
are heat exchangers that reduce the temperature of the gas that is exerting the
compressor. They don’t have rotary parts, because they use the laws of natural heat
convection between the cold gas and the even colder sea water.
Figure 24: Cooler configuration.
Figure 25: Schematic of subsea gas compression station with two compressor trains.
Advantages
Reduce the operational costs (OPEX) because the need for an offshore platform or
onshore compression facility is eliminated.
The compressor is closer to the well and this contributes to a bigger recovery.
The CO2 emissions are reduced because less energy is consumed.

64 | P a g e
No emissions or disposals to the sea.
The operation doesn’t need any human operation, which is safer.
5.2.2. Multiphase Flow Turbines
Their operation is the inverse of the pumps and compressors. They are obtaining
energy from the fluid and they transform it in another form.
Their major applications in the oil and gas industry are the following [41]:
Recovery of energy and boosting production of low pressure wells. In this case the
turbines are used to drive multiphase pumps. Actually they are using a part of the flow
from high pressure wells that need throttling in order to operate. By this way the energy
that would be wasted is obtained from the flow and is used for the boosting of wells
that couldn’t be produced.
Replacement of a choke or let-down valve in two-phase flow,
Production of electricity in remote areas [42].
5.2.3. Multiphase Pumping Systems
From all the types of multiphase pumps, finally two types are used for offshore (subsea
and topside) applications; the Twin Screw Pump (TSP) and Helico Axial Pump (HAP).

65 | P a g e
6. Surface Jet pumps/Ejectors/Eductors (SJP)
Operating Principle
Their purpose is the increase of the effluents production and the flow boosting
downstream of the wellhead.
The operating principle of jet pumps is based on the fluid mechanics theory for nozzles
and diffusers. So the pressure increment is a result of energy conservation and can be
expressed by the Bernoulli equation.
The interior of jet pumps doesn’t have any moving part. It consists of a High Pressure
(HP) nozzle, which is connected to the diffuser with a mixing tube.
Figure 26: Surface Jet Pump configuration.
In Figure 27 are presented the fluctuations of flow pressure and velocity through the
different components of a jet pump. A high-pressure power fluid is guided to a
convergent nozzle. The flow is imposed to pass through a cross section of smaller
diameter and thus its velocity will increase and its pressure will decrease. Just before
the throttling section, a low or intermediate pressure fluid (LP and IP respectively)
enters the pump. Its velocity also increases and its pressure decreases as it is
approaching the nozzle’s tip. As the two fluids pass the outlet of the nozzle, the cross-
sectional area increases, so their pressure starts to increase. At the tip of the nozzle,
the pressure of the HP fluid has decreased enough, so that to create an appropriate
pressure drive and the LP fluid to be guided to the mixing chamber. After the nozzle
exit the two fluids start to mix, so the HP fluid transfers energy in terms of momentum
to the LP or IP flow, so the velocity of the HP flow decreases but the velocity of the LP
or IP flow increases slightly above its initial velocity [43]. Their final mixing is achieved
in the mixing tube. At the end of the mixing tube exists is a divergent diffuser where
they expand, so the mixture’s velocity decreases further and their pressure increases.
Finally, the discharge pressure has an intermediate value between the high pressure
of the power fluid and the lower pressure of the produced fluid.

66 | P a g e
Figure 27: Jet Pump flow dynamics [43].
As power (high pressure) fluid (HP) may be used the flow from a high-pressure stream
that has an extra energy potential that would be wasted or that its energy abstraction
is more beneficial for the general energy content of the production operation. Some of
the different types of HP fluids that may be used are the following:
HP oil from associated wells
HP water from injection water lines
Produced water
Pumped liquid
Downhole ESP liquid
HP gas from process systems
Lift gas
Compressor recycled gas
The phase of the power fluids that are used depend on the phase of the low pressure
fluid that is produced and will be boosted.
Low Pressure Gas production: In case of gas production, both HP and LP fluids
should be gases [44]. Then there is no need for separation of the production stream
(Low-pressure fluid).
If the LP flow contains a liquid with a volumetric flow rate greater than 1~2% of the gas
volumetric flow rate at the operating pressure and temperature, there is a need for
separation of the LP liquid upstream (before the entrance). In case of slightly wet gas,
LP flow
HP flow
Mixed flow
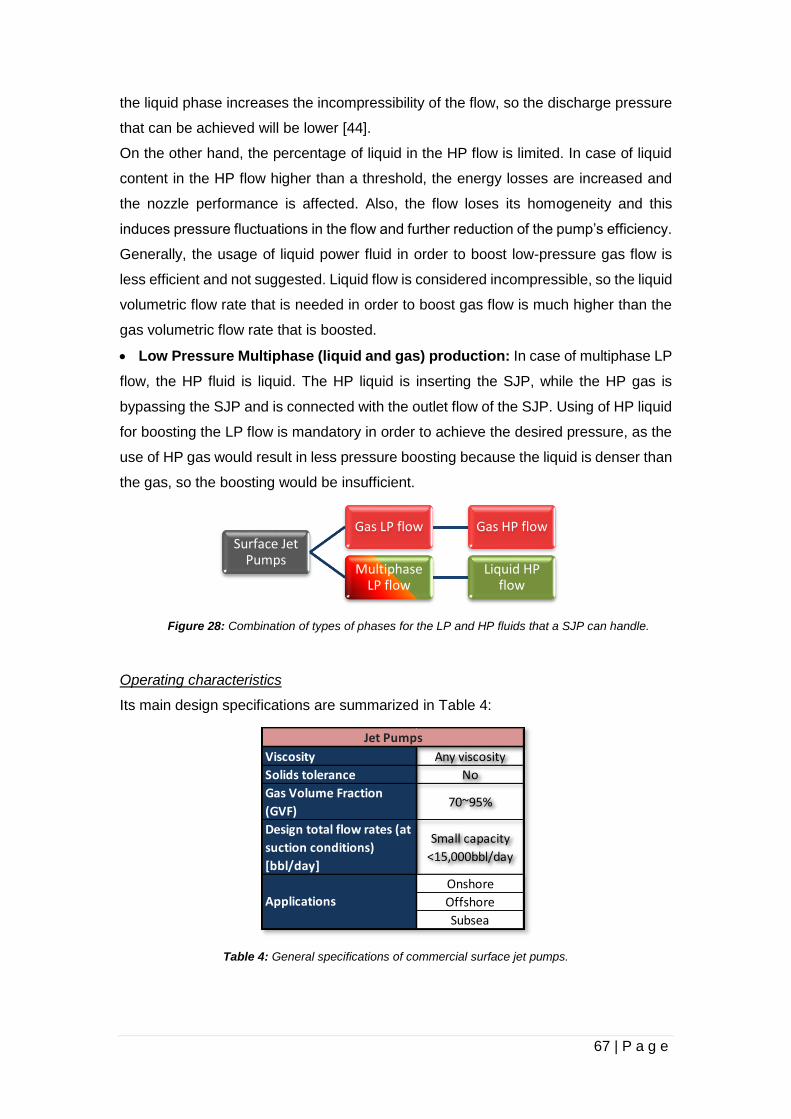
67 | P a g e
the liquid phase increases the incompressibility of the flow, so the discharge pressure
that can be achieved will be lower [44].
On the other hand, the percentage of liquid in the HP flow is limited. In case of liquid
content in the HP flow higher than a threshold, the energy losses are increased and
the nozzle performance is affected. Also, the flow loses its homogeneity and this
induces pressure fluctuations in the flow and further reduction of the pump’s efficiency.
Generally, the usage of liquid power fluid in order to boost low-pressure gas flow is
less efficient and not suggested. Liquid flow is considered incompressible, so the liquid
volumetric flow rate that is needed in order to boost gas flow is much higher than the
gas volumetric flow rate that is boosted.
Low Pressure Multiphase (liquid and gas) production: In case of multiphase LP
flow, the HP fluid is liquid. The HP liquid is inserting the SJP, while the HP gas is
bypassing the SJP and is connected with the outlet flow of the SJP. Using of HP liquid
for boosting the LP flow is mandatory in order to achieve the desired pressure, as the
use of HP gas would result in less pressure boosting because the liquid is denser than
the gas, so the boosting would be insufficient.
Figure 28: Combination of types of phases for the LP and HP fluids that a SJP can handle.
Operating characteristics
Its main design specifications are summarized in Table 4:
Table 4: General specifications of commercial surface jet pumps.
Surface Jet Pumps
Gas LP flow Gas HP flow
Multiphase LP flow
Liquid HP flow
Viscosity Any viscosity
Solids tolerance No
Gas Volume Fraction
(GVF)70~95%
Design total flow rates (at
suction conditions)
[bbl/day]
Small capacity
<15,000bbl/day
Onshore
Offshore
Subsea
Jet Pumps
Applications

68 | P a g e
Location of the SJP along a project’s facilities
The placement of the SJP depends on the location of the sources of the HP and LP
fluids. At onshore installations is usually installed at the gathering stations, while at
offshore installation sis usually placed close to the HP source. In details for cost
minimizing reasons, it is usually placed at:
Downstream and as close as possible to the wellhead, manifold and transportation
line,
Upstream of the compressor’s suction line,
Upstream and downstream of the inlet or outlet of a separator
Near the recycle line of the compressor in order to debottleneck them, downstream
of the compressor or between the compressor stages
Surface equipment
Silencers (for gas production): Inlet Silencers (Low Pressure) are placed in the
entrance of the jet pump. Outlet Silencers (High Pressure) are placed after the medium
pressure flow part (after the mix of the power and the production flow). They are
necessary because the gas velocity is so high that transmits noise in the environment.
Commingler (αναμίκτης)
Separator: A separator is needed when the HP is multiphase.
Pressure Relief (PRV): In most cases the SJPs and silencers are designed to meet
the highest operating pressure, plus an allowance for safety. Normally no pressure
relief is needed. It is, however, possible to incorporate a Pressure Relief Valve (PRV)
if the LP side piping system is of a lower pressure rating than the HP side piping, or to
meet site specific requirements such as the site fire case.
Operational advantages
When they are installed downstream of the wellhead they decrease the wellhead
flowing pressure [44], so they boost the production. When the power fluid enters the
nozzle, its pressure decreases due to the Venturi effect and obtains values lower than
the wellhead pressure. By this way the flow of the production fluid to the pump is
enabled and enhanced. So the actual pressure that exists downstream of the wellhead
is lower than upstream of the wellhead.
They have no moving parts and this means that they have low maintenance needs
and cost.
There are many different configurations for their implementation and installation in
existing facilities.

69 | P a g e
They don’t consume extra energy for their operation. The high pressure power
fluid that is used would be otherwise wasted.
Design
For the design and the performance analysis of the jet pumps as pump’s head Hp is
considered the dimensionless ratio of the pressure increase of the formation fluid over
the pressure loss of the power fluid [45]:
d f
p
p d
P PH
P P
Where:
Pd is the pressure at the discharge side of the pump,
Pf is the inlet pressure of the formation fluid (LP fluid),
Pp is the inlet pressure of the power fluid (HP fluid)
A dimensionless area ratio is used and indicates the ratio of the nozzle’s tip area (An)
over the throat area of the mixing tube (Am) [45]:
n
m
AR
A
A dimensionless density ratio is used and indicates the ratio of the LP fluid density
(ρLP) over the HP fluid density (ρHP):
LP
HP
D
A dimensionless flow rate is also used for the description of the pump’s performance
[45]:
f
p
QM
Q
Where Qf is the volumetric flow rate of the formation fluid (LP fluid) and Qp is the
volumetric flow rate of the power fluid (HP fluid).
The pump’s efficiency is:
f d f
p p
p p d
Q P PM H
Q P P
Performance
The performance curve of a surface jet pump is similar to that of a centrifugal pump,
but the curves of Hp – Q depend on the area ratio instead of the rotational speed.

70 | P a g e
The considerations for the performance curve of a jet pump are presented graphically
in Figure 29. Each parabolic curved line is the locus of the possible operating
conditions of head and volumetric flow rates and the different efficiencies that the pump
may have when the pump is designed for a specific area ratio, thus diameter of nozzle
and mixing tube. So the pump’s performance under different operating conditions may
be resulted.
Figure 29: Example of jet pumps characteristics Hp – Q –ηo for different area ratios [45].
Factors that affect the performance of the surface jet pumps:
HP and LP pressure ratio: High pressure ratio results in high efficiency
The higher is this ratio, the higher is the pressure of the power fluid than the pressure
of the formation fluid, as it is presented in Figure 30. So more energy will be provided
to the formation fluid for a specific flow rate ratio and this will cause the increase over
the discharge pressure.
Figure 30: Performance curve of a jet pump Hp-M for gas LP and HP flows for different ratios of HP flow pressure over LP flow [46].
Increase of Pp/Pf

71 | P a g e
HP and LP flow ratio: The adaptivity of the pump at changes in flow ratio can be
achieved by the diameters of the nozzle and the mixing tube.
In case of reduction of the flow ratio the nozzle or mixing tube has to be changed in
order to keep the pressure ratio constant and to avoid any change at the pump’s
efficiency. Less flow ratio means that the pump has to provide less energy to the flow,
either due to reduction of the formation flow rate or increase of the power flow rate.
The adaptivity of the pump can be achieved by increasing the area, thus by increasing
the nozzle’s tip diameter or decreasing the mixing tube’s diameter.
In real applications the change of the area diameter is a way to adapt the pump’s
operation when the production flow rate decreases in time since the initial operating
flow rates due to depletion. On the other hand an increase of the production flow rate
may occur when the surface jet pump gets connected with a manifold, where
production flow from more wells are arriving, while it initial was operating in order to
handle less flow rate coming from less wells.
Area ratio: High values of the area ratio lead to the decrease of the head ratio and
the efficiency for constant flow ratio for handling constant mass flow ratio
Low values of the area ratio indicate that the nozzle tip and the mixing tube diameters
are of similar magnitude. On the other hand high values of the area ratio indicate that
the difference between these two diameters is large. This means that the nozzle tip
diameter is much bigger and that the mixing tube diameter is much smaller.
Consequently for operation under constant flow rates, high values of the area ratio
indicate higher fluid velocity and lower pressure at the mixing tube inlet. This means
that less energy will be provided to the mixture, so the head ratio and the pump’s
efficiency will both decrease.
In real applications the increase of the head ratio and thus the necessary energy that
has to be provided to the flow may occur for example because of increment of the MW
of the fluids. In general the nozzles may be replaced during production with nozzles of
smaller tip diameter, in order to gain head.
MW of the HP and LP: High density ratios indicates low efficiency pump
The molecular weight of a hydrocarbon mixture indicates its specific gravity and is
directly connected with its compressibility. So fluids with high molecular weight have
high density and small compressibility.
When the LP fluid has high molecular weight and density, it won’t be easily
compressed. This means that the energy transformation inside the pump will not be
very efficient and more energy would be needed in order to achieve a specific
discharge pressure. For this reason the pumps that are handling flows (LP fluids) with

72 | P a g e
high molecular weight will have less efficiency than the ones that handle flows with low
molecular weight.
On the other hand HP fluids with high density are preferred, because they are less
compressible so they will provide the estimated energy to the LP fluid.
So in general the MW of the fluids that are getting into the pump are represented by
the density ratio and according to the previous high density ratios increase the pump’s
efficiency.
Operational restrictions and limitations - Design and flow assurance issues
Hydrate Formation: Hydrates do not normally form within the SJP because of high
velocity of flow and the combination of HP and LP flow. If the predicted outlet
temperature is within the hydrate formation band, then injection of hydrate inhibitor and
/ or use of heat tracing are recommended. It is usually recommended not to run the
HP flow alone (for over a few minutes) without flowing the LP gas in advance.
Noise: when the SJPs are handling low pressure gas production streams, the
produced noise level may often exceed 85dBA [43]. Silencers can be installed on the
LP inlet and the discharge line of the SJP to prevent noise travelling through the
interconnecting pipe work. In cases where noise emitted directly through the body of
the SJP exceeds the acceptable limit, the entire SJP can be lagged with acoustic
insulation materials [44]. The normal acceptable limit is generally 85dBA at 1.0m from
the SJP. There are, however, exceptional cases where lower noise level is required.
Vibration: If vibration from the SJP is predicted to be a problem, then the SJP and
Silencer supports can be fitted with custom designed anti-vibration mounts.
Temperature Drop Effect: This is an issue dependent on factors such as HP and
LP pressure, temperature and flow rate and the presence of liquids in the LP flow. In
general, the theoretical Joule Thomson temperature drop across the SJP does not fully
materialize, mainly as a result of the LP flow mixing rapidly with HP gas and the
pressure increasing along the mixing tube and diffuser. Low temperature may be
experienced if only HP gas passes through the SJP with no LP gas.
In general, the outlet temperature is often lower than the LP or HP temperature by
approximately 20% to 30%, whichever has the lower value.
Cavitation: At the tip of the nozzle the pressure is the lowest that can be met in the
pump. If its value decreases more than the bubble point pressure of the flow, gas
bubbles will start to appear and cavitation phenomena may occur.
Erosion: Not a major issue unless sand is produced. In this case, the internals can
be coated with materials resistant to erosion or lined with ceramic materials.
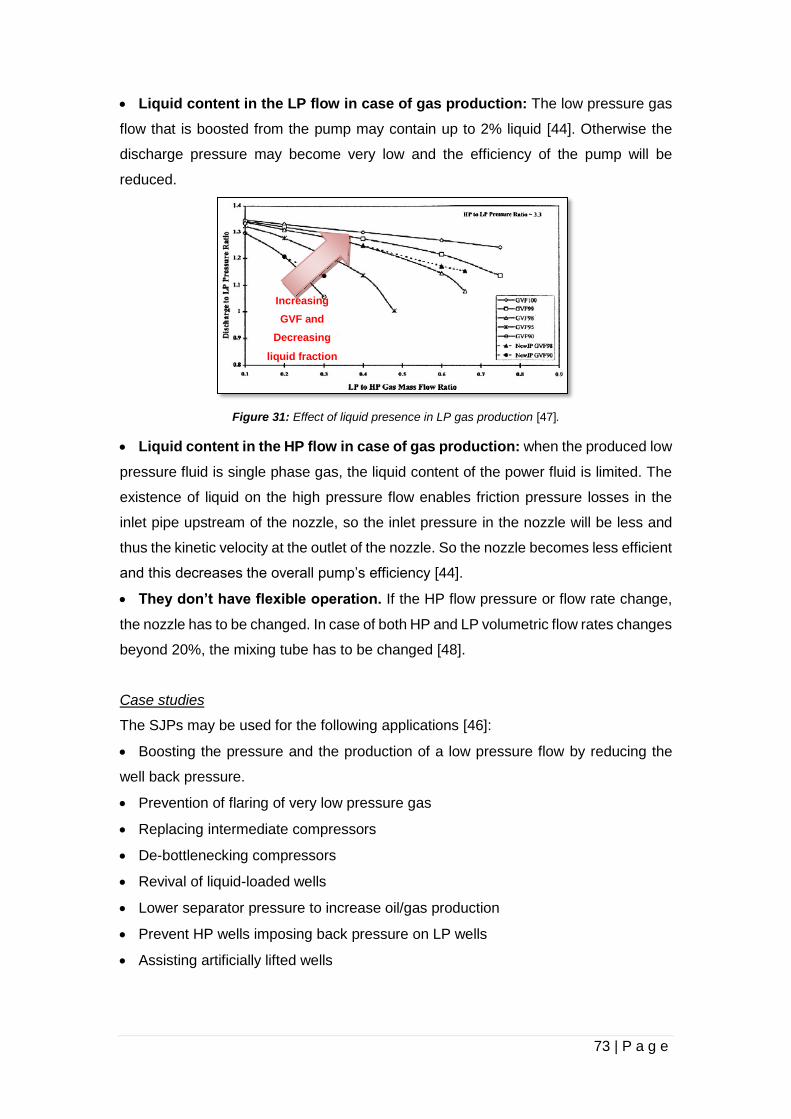
73 | P a g e
Liquid content in the LP flow in case of gas production: The low pressure gas
flow that is boosted from the pump may contain up to 2% liquid [44]. Otherwise the
discharge pressure may become very low and the efficiency of the pump will be
reduced.
Figure 31: Effect of liquid presence in LP gas production [47].
Liquid content in the HP flow in case of gas production: when the produced low
pressure fluid is single phase gas, the liquid content of the power fluid is limited. The
existence of liquid on the high pressure flow enables friction pressure losses in the
inlet pipe upstream of the nozzle, so the inlet pressure in the nozzle will be less and
thus the kinetic velocity at the outlet of the nozzle. So the nozzle becomes less efficient
and this decreases the overall pump’s efficiency [44].
They don’t have flexible operation. If the HP flow pressure or flow rate change,
the nozzle has to be changed. In case of both HP and LP volumetric flow rates changes
beyond 20%, the mixing tube has to be changed [48].
Case studies
The SJPs may be used for the following applications [46]:
Boosting the pressure and the production of a low pressure flow by reducing the
well back pressure.
Prevention of flaring of very low pressure gas
Replacing intermediate compressors
De-bottlenecking compressors
Revival of liquid-loaded wells
Lower separator pressure to increase oil/gas production
Prevent HP wells imposing back pressure on LP wells
Assisting artificially lifted wells
Increasing
GVF and
Decreasing
liquid fraction

74 | P a g e
Example Case study - Multiphase Boosting System: Depleted wells with very high
back pressure facing liquid loading problems. No compressor or pump is available to
boost production.
In this case HP wells from one field were used to increase production of LP wells of
another field. The multiphase flow from the LP wells is guided to the pump, where it
meets with the liquid phase of the HP wells.
It is more efficient if the HP power fluid is liquid, so in case that the HP flow is
multiphase it is suggested to be separated. In this case the high pressure liquid will be
used as power fluid and the high pressure gas will be mixed with the flow at the
discharge side.
Objective: Reduce the back pressure (wellhead pressure) of LP wells.
Vendors
Caltec, Transvac, Tech-Flo, Weatherford

75 | P a g e
7. Multiphase pumping systems
The production of the subsurface hydrocarbons and the reservoir effluents which may
contain solids is achieved due to the reservoir drive mechanisms. Every reservoir may
have three drive mechanisms:
1. Segregation drive mechanism: Pressure difference between the reservoir and the
well bottomhole and between the well bottomhole and the wellhead,
2. Gas drive mechanism,
3. Water drive mechanism.
When the reservoir is not able to produce the flow rate of the plateau hydrocarbons
either due to low reservoir pressure due to depletion or due to high pressure drops
within the production path, enhanced recovery production methods are implemented.
According to recent researches almost 67% of the oil and gas production worldwide
comes from mature fields. Field maturity is defined by several ways: when production
has reached 50&% or f the plateau rate or when the field’s age is greater than 10 years
old, etc [46].
The multiphase flow boosting is applied downstream of the wellhead and the main
target is to increase the recovery factor of the reservoir.
Table 5: Different types of field development techniques.
The installation of surface pumps is considered as a common measure method for
boosting the production. The surface pumps are separated according to the type of
flow they can handle, at the following categories:
Single phase pumps, which are used for handling of flows with up to 10% gas
content.
Hybrid pumps, which are used for handling of flows with up to 40% gas content.
•Pressure
•Gas cap
•Water drive-Aquifer
Natural flow drive
mechanisms
•Water injection
•Electrical Submersible Pumps (ESP)Primary
enhancement
•Gas injection
•Steam injection
•Multiphase surface/seabed boosting systems
•Single phase surface/seabed boosting systems
Secondary enhancement

76 | P a g e
Multiphase pumps, which are used for handling of flows with up to 100% gas
content.
The multiphase pump technology is considered to be a “Young Technology” [49].
Figure 32: Pump’s performance chart [50]
7.1.1. Selection criteria for the enhanced recovery method
When the decision of production lift is met, all the primary and secondary
enhancements methods are probable to be implemented. The different artificial lift
methods provide solutions for different production obstacles and have the same result:
increase of the recovery factor. The sources of the production problems should be first
defined because they offer the guidance needed to select the most suitable method.
The production midstream and downstream facilities are also taken into account but
as constraints for the boosting system deployment.
Before selecting the appropriate method for each occasion the following data should
be analyzed:
The reservoir conditions
The well bottomhole pressure and the reservoir pressure should be estimated in order
to evaluate the pressure drop in the reservoir
The production system
The design of the pipelines network, the mechanical and hydraulic equipment that is
used at the midstream facilities till their transport to the process facilities and the
arrangement of the separation facilities affect the decision for the most suitable
boosting technique and more specifically the cost and the practical feasibility of their
application. Production enhancement methods that are commonly used as first
boosting techniques are [7]: Well/Riser gas lift, Water Flooding, Electrical Submersible
Pumps (ESPs), Subsea Separation with single phase pressure boosting, Surface
Multiphase Pumps with multiphase pressure boosting.

77 | P a g e
The surface/seabed facilities
The selection procedure of the optimum technical and financially enhanced recovery
method is based on a combined analysis of the above information.
7.1.2. Multiphase pumping industrial status
The application of multiphase pumps in different field occasions provides with many
advantages, but the installation of multiphase pumps is not widely selected as a
boosting technique. Some thoughts about this fact are the following [51]:
The multiphase pumping technology started to develop at the 1980s.
The first subsea separation facility in shallow water (22m) was installed in 1969 in
the Zakum field in Abu Dhabi, which was operated by BP and Total.
The first subsea helico-axial multiphase pump was installed in 1993, at (280m)920ft
depth on the Draugen field that was operated by Shell [52]
Consequently, it is obvious that multiphase boosting technology has been developed
the last 20 years and it remains a new technology, so there is little operating
experience on multiphase pumps. They are low reliability systems because their
operation has not been tested for appropriate time.
Figure 33: Boosting systems per type implemented projects from 1995 until 2013 [53].
There are many uncertainties on the flow regimes of multiphase flow as well as on
the performance of some multiphase pumps under special flow conditions that has to
be investigated. But because of the low oil prices, the funding for further research is
not an option.
The personnel in the oil and gas industry are not very specialized on the multiphase
pumps technology and this prevents the companies to invest on this technology.

78 | P a g e
7.1.3. Types of multiphase pumps
Multiphase pumps can be categorized according to their hydraulic operation principle
to the following categories:
Centrifugal/Rotodynamics/Dynamic pumps/Turbomachines
o Helico-axial pumps
o Multi stage centrifugal pumps
Positive displacement/Volumetric pumps:
o Progressive cavity pumps (Single screw) (PCP)
o Twin Screw Pumps (TSP)
o Triple and Multiple Screw Pumps
o Reciprocating
Dynamic pumps
o Hydraulic/Jet pumps/Ejectors/ Eductors/Velocity spools
From all the different types of multiphase pumps in the Oil & Gas industry are most
commonly used three of them; helico-axial, single and twin screw pumps. These three
types of pumps represent the largest number of Multiphase Pumping applications [41].
Figure 34: Categories of multiphase pumps [8].
7.1.4. Application of multiphase boosting systems
Purpose
Multiphase flow pumping systems are usually used to enable the flow of the fluid from
the production site (wellheads and manifolds) to the gathering stations where
separation and process facilities take place. These are the only flow paths in-between

79 | P a g e
the midstream and downstream facilities that the transported flow in the pipelines is
multiphase (liquid and gas). After reaching the separation facilities, the flow is
separated into liquid and gas and then each different stream is guided through a
different pipeline system to the appropriate processing facilities. Usually, they are
installed as close to the wellhead or the manifolds as possible, in order to gain in
pressure [52].
Multiphase Pumps are used as an artificial lift method and in many applications, they
are used in combination with other recovery methods (ESPs, gas lift, etc.). Generally,
the target of the deployment of multiphase pumping systems is the overlapping of the
pressure drop that may occur along many components of the midstream production
facilities, so that to boost the pressure downstream of the wellhead.
Application in different field’s lifetime
They can be deployed in different time steps during the field’s life, depending on the
pressure boosting requirements. The typical phases of field life at which multiphase
boosting can be applied are the following [54]:
Natural flow-Marginal fields/remote wells where unmanned facilities are
preferred
The Pfwh (wellhead flowing pressure) is larger than the required at the inlet of the
flowline and flow can occur due to the pressure difference. If the wellhead or manifold
are placed in a hostile environment where human intervention is not easy and the
flowlines have to transport the effluents to a large distance in order to reach separation
and process facilities, multiphase pumps are installed close to the wellheads even if
there is no need for pressure boosting, in order to enable the transport of effluents
through a long distance.
Wells with increasing water cuts
As the field’s production continues with the years, the Pfwh (wellhead flowing pressure)
is decreasing while the water cut increases. This result is lower oil production with a
possibility of abandonment of the well. In this case, must be added energy to the
effluent by one of the known artificial lift methods or by the deployment of multiphase
pumping systems.
Mature wells with low wellhead or bottomhole flowing pressure
This case is referred to the oil fields that are difficult to establish flow even from the
beginning of production. The utility of multiphase pumps offers the advantage of
decreasing the well back pressure and eliminating the flow obstacles. Usually, for this
type of applications, they are used in combination with gas lift of submersible pumps.

80 | P a g e
Application for different types of flow
The multiphase pumps can be used for single phase flow, but the inverse cannot
happen. The cost of multiphase pumps is almost negligible for the project’s cost
control, so they are used only in case that boosting of multiphase flow is needed.
Application in different types of production fields
They can be applied for onshore and offshore fields. Offshore they can be
installed at the seabed or on surface platforms or FPSO (Floating Production, Storage
and Offloading) vessels. Onshore they can be installed close to the wellhead. In case
of subsea wellheads or manifolds the backpressure is further increased by the
hydrostatic pressure of the sea water, so the application of multiphase boosting is
usually mandatory [52].
They are applied for reservoirs with production of approximately 250,000 oil
bbl/day and with a GOR ranging between 100 and 1,000 scf/bbl [54].
In fields of medium or long tie-back distances. When the effluents have to be carried
for long distances to the process facilities, the application of multiphase pumps
compensates with the friction and static pressure losses [52].
7.1.5. Benefits of multiphase pumping
Production systems using conventional separation facilities before pumping have
generally more than 30% less capital cost than multiphase pumping systems. Although
the high cost, multiphase pumps have more technical advantages that lead to
increased production and financial profits. Some of the advantages of their usage are
the following:
1. Reduce the need for subsea separation and process to achieve similar
recovery. In offshore production systems conventionally the separation facilities are
implemented in satellite platforms and then the gases and liquids are guided towards
the host platform through separate flow lines. By using multiphase pumps, the need
for satellite platforms is eliminated. The effluent is pumped after the exit of the wellhead
and transported directly to the host platform through a single flow line.
Boost the production from mature wells with low wellhead flowing pressure.
The reservoirs lose their productivity ability as they keep producing with the years,
because the bottom hole reservoir pressure is decreasing due to depletion. As a result
the flowing wellhead pressure is reduced, reaching a point that it is not able to create
the appropriate pressure difference in the pipeline to create flow. These guide either

81 | P a g e
to the abandonment of the LP well or to choke back the HP well. Using a MPP will
increase the flowing pressure after the wellhead, enabling the flow.
Figure 35: Effect of production boosting on well’s performance. [53]
2. Reduce the field life but increases the field recovery. Both result in economic
benefits coming from the reduced operational cost due to minimization of
consumables, maintenance needs and expenses for the personnel.
3. Reduce liquid slugging in the risers. This results in economic benefits coming
from the reduced operational costs due to the elimination of the need for slug catchers.
4. The multiphase pumping systems can be integrated with the onshore and offshore
(subsea) production systems, which means reduced operational complexity. On the
other hand the installation of multiphase pumps in already working fields is easy. Their
installation doesn’t require any modification in the existed installations as tie-in
systems are used for their installation.
5. Reduction of environmental impact due to the reduction of gas flaring. The
multiphase pump eliminates the need for separation of the produced fluids. As a result
less or negligible amount of associated gas is produced. In most cases the associated
gas is flared because it is not used. So the MPP deployment is an ideal if the
minimization of flared gas is need for environmental and financial reasons.
6. Increase of production rate by lowering the well’s backpressure. Well’s
backpressure is the pressure imposed in the flow from the components and fittings of
the wellhead. It indicates the resistance that the effluent will meet when it reaches the
wellhead. By applying multiphase boosting downstream of the wellhead, the
backpressure that the effluent will have to overcome in the wellhead is lower, because
it is compensated by the additional boost.
7. Production of gas that would be flared in conventional production facilities.

82 | P a g e
7.2. Helico-axial pumps (Rotodynamic Centrifugal type)
They belong to the greater category of rotodynamic pumps, together with the
Multistage Centrifugal Pumps which are used as downhole electric submersible
pumps. The name “helico-axial” derives from the combination of the helical shape of
the blades and the global axial flow direction, i.e. parallel to the shaft [41].
Operating Principle
Its configuration combines construction elements from centrifugal pumps and axial
compressors [42]. The operating principle is that the kinetic energy of the accelerated
fluid that enters the pump is converted into dynamic energy (through pressure change)
by decelerating when it passes through the different stages of impellers-diffusers. The
liquid-gas mixture enters the pump in the axial direction and passes through an
impeller, where its direction changes to radial and is subjected to centrifugal forces.
The centrifugal forces that are applied to the fluid cause the development of angular
momentum. Then the fluid is guided through a stationary diffuser, where its angular
momentum is converted into pressure change (the velocity of the fluid is decreasing).
When the flow passes through the diffusers it becomes more homogeneous and the
separation is prevented.
(a) Side view (b) Cross section
Figure 36: Helico-axial pump configuration [55].
Mechanical design
The mechanical design is based on the international standard API 610 and the
rotordynamic design is based on the international standard API 917 which is referred
to compressors [54].
Their design varies depending on the number of stages between one or multiple
stages. Each stage (or compression cell) consist of an impeller (rotor) and a diffuser
(stator) as they are presented in Figure 36. The number of stages depends on the
required differential pressure (head) that is required to be developed between the
suction and the discharge sides [41].

83 | P a g e
Operating characteristics
Its main design specifications are summarized in Table 6:
Table 6: General specifications of commercial multiphase helico-axial pumps.
Operational advantages
They can get connected directly with electric motors, without intervention of any
kind of switch gear box. This indicates less energy losses and greater efficiency.
They can be driven either by an electric motor or by a gas turbine.
They don't need a lot of space for their installation.
Simple construction with low maintenance cost.
While the flow progress to the different stages, it mixes better and thus this
interstage mixing prevents the separation of the oil-gas mixture and retains the
homogeneity of the flow. In centrifugal pumps the phase may separates under
specific conditions which are connected with the high gas velocity and a dynamic
stress combination that are imposed to the fluid. In the helico-axial pumps the shape
of the helical impeller vanes reduces the effect of the centrifugal and coriolis forces
and diminishes the phase distribution [56].
It offers the advantage of easier control of the well head pressure. The
helicoaxial multiphase pump can operate in variable speed, so it can be adjusted in
variable pressure differences that arise due to changes of the wellhead pressure.
The construction of the helicoaxial pumps offers the advantages of hydraulic
flexibility that the turbomachinery has: the number of stages for the impeller-diffuser
can change during the time of their operation according to the demanded pressure
boosting at each stage of the field’s life. This can be implemented by using a cartridge
with inactive, dummy stages that are being activated when it is necessary [54].
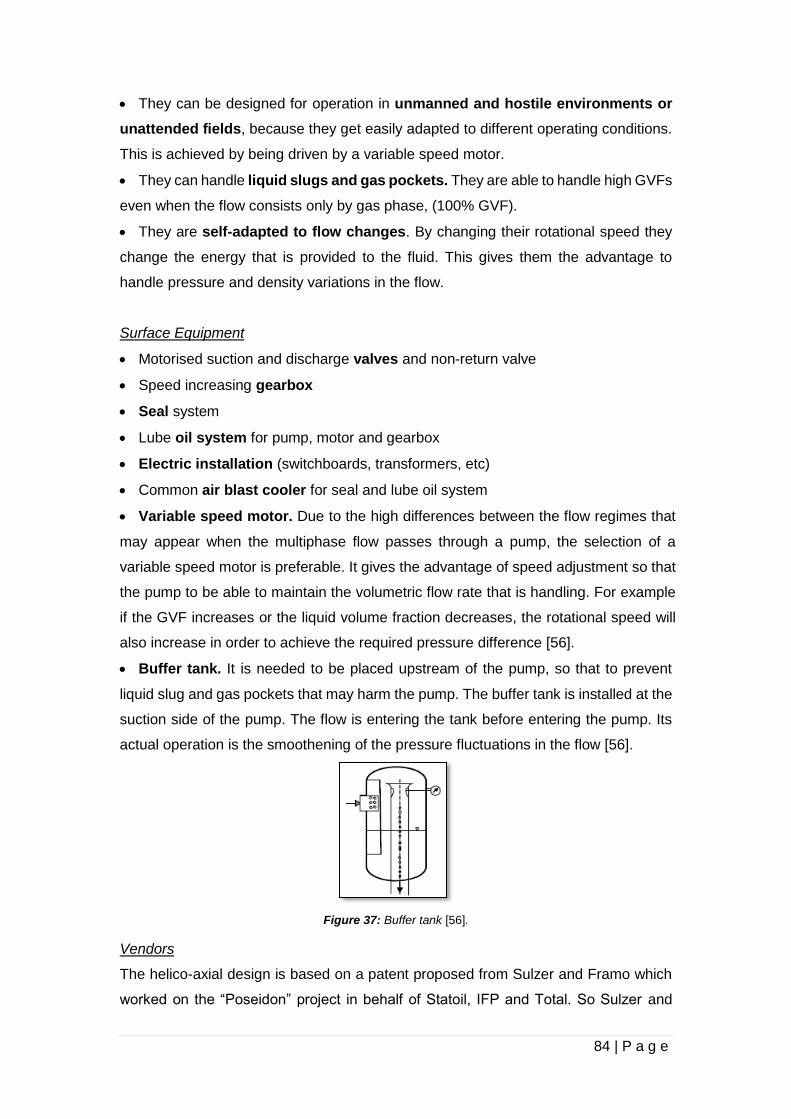
84 | P a g e
They can be designed for operation in unmanned and hostile environments or
unattended fields, because they get easily adapted to different operating conditions.
This is achieved by being driven by a variable speed motor.
They can handle liquid slugs and gas pockets. They are able to handle high GVFs
even when the flow consists only by gas phase, (100% GVF).
They are self-adapted to flow changes. By changing their rotational speed they
change the energy that is provided to the fluid. This gives them the advantage to
handle pressure and density variations in the flow.
Surface Equipment
Motorised suction and discharge valves and non-return valve
Speed increasing gearbox
Seal system
Lube oil system for pump, motor and gearbox
Electric installation (switchboards, transformers, etc)
Common air blast cooler for seal and lube oil system
Variable speed motor. Due to the high differences between the flow regimes that
may appear when the multiphase flow passes through a pump, the selection of a
variable speed motor is preferable. It gives the advantage of speed adjustment so that
the pump to be able to maintain the volumetric flow rate that is handling. For example
if the GVF increases or the liquid volume fraction decreases, the rotational speed will
also increase in order to achieve the required pressure difference [56].
Buffer tank. It is needed to be placed upstream of the pump, so that to prevent
liquid slug and gas pockets that may harm the pump. The buffer tank is installed at the
suction side of the pump. The flow is entering the tank before entering the pump. Its
actual operation is the smoothening of the pressure fluctuations in the flow [56].
Figure 37: Buffer tank [56].
Vendors
The helico-axial design is based on a patent proposed from Sulzer and Framo which
worked on the “Poseidon” project in behalf of Statoil, IFP and Total. So Sulzer and
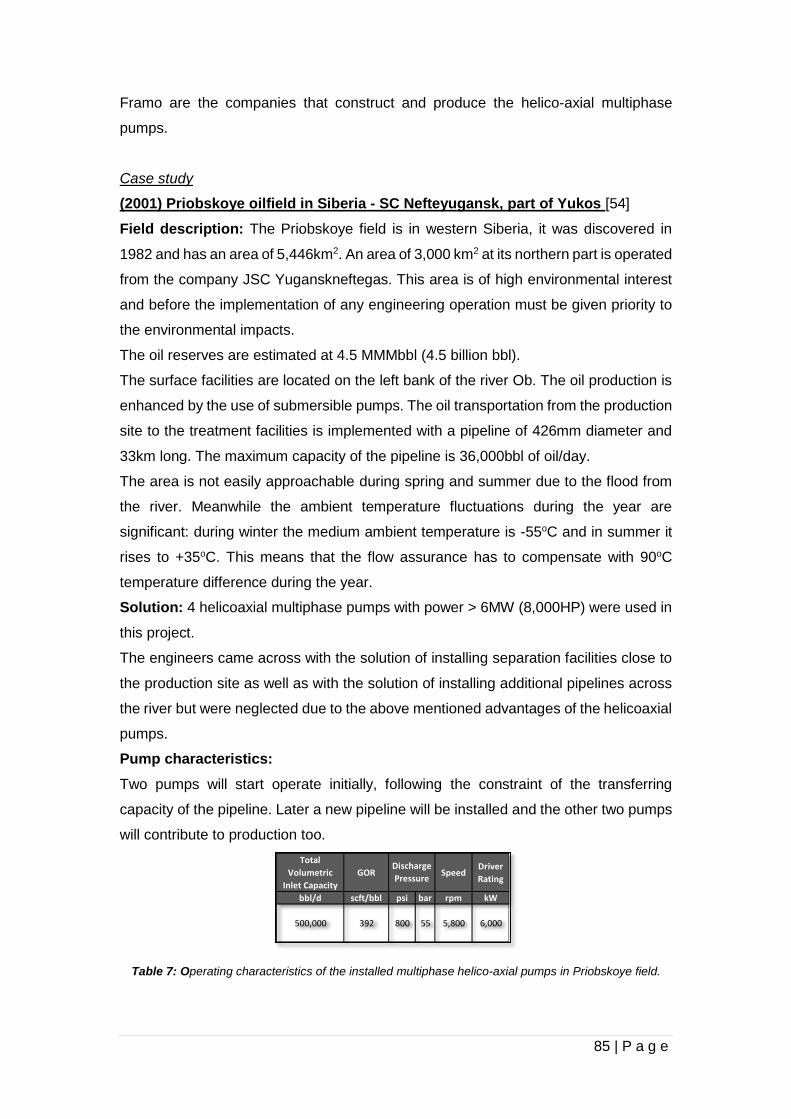
85 | P a g e
Framo are the companies that construct and produce the helico-axial multiphase
pumps.
Case study
(2001) Priobskoye oilfield in Siberia - SC Nefteyugansk, part of Yukos [54]
Field description: The Priobskoye field is in western Siberia, it was discovered in
1982 and has an area of 5,446km2. An area of 3,000 km2 at its northern part is operated
from the company JSC Yuganskneftegas. This area is of high environmental interest
and before the implementation of any engineering operation must be given priority to
the environmental impacts.
The oil reserves are estimated at 4.5 MMMbbl (4.5 billion bbl).
The surface facilities are located on the left bank of the river Ob. The oil production is
enhanced by the use of submersible pumps. The oil transportation from the production
site to the treatment facilities is implemented with a pipeline of 426mm diameter and
33km long. The maximum capacity of the pipeline is 36,000bbl of oil/day.
The area is not easily approachable during spring and summer due to the flood from
the river. Meanwhile the ambient temperature fluctuations during the year are
significant: during winter the medium ambient temperature is -55oC and in summer it
rises to +35oC. This means that the flow assurance has to compensate with 90oC
temperature difference during the year.
Solution: 4 helicoaxial multiphase pumps with power > 6MW (8,000HP) were used in
this project.
The engineers came across with the solution of installing separation facilities close to
the production site as well as with the solution of installing additional pipelines across
the river but were neglected due to the above mentioned advantages of the helicoaxial
pumps.
Pump characteristics:
Two pumps will start operate initially, following the constraint of the transferring
capacity of the pipeline. Later a new pipeline will be installed and the other two pumps
will contribute to production too.
Table 7: Operating characteristics of the installed multiphase helico-axial pumps in Priobskoye field.
Total
Volumetric
Inlet Capacity
GOR SpeedDriver
Rating
bbl/d scft/bbl psi bar rpm kW
500,000 392 800 55 5,800 6,000
Discharge
Pressure

86 | P a g e
Result: After the operation of the first two pumps, the oil production increased to
93,000bbl/day (158% increase of daily oil production). When the four pumps were
installed, the oil production reached 200,000bbl/day, corresponding to a total increase
of production by 456%).
Figure 38: Installation of 4 helicoaxial MPPs of Sulzer Company, in Priobskoye oilfield in Siberia [57].
7.3. Positive Displacement Pumps (PDP type)
These types of multiphase pumps are the most commonly used in the Oil &Gas
industry. They appear in many different configurations but the operation principles
remain the same. The fluid is displaced from the suction side where it exists under low
pressure, to the discharge side where its pressure is increased. The volume of the
displaced fluid depends on the geometrical configuration of the interior of the pump
and it can be assumed constant over each circle of suction and discharge.
Positive Displacement Pumps contribute to the production boosting not by increasing
the flow pressure as the rotordynamic pumps do, but by enhancing the displacement
of fluid and thus by increasing the total production volume.
Figure 39: Classification of positive displacement pumps [58].

87 | P a g e
7.3.1. Twin Screw Pumps (TSP)
Operating Principle
The twin screw pumps are based on the positive displacement principle. The screws
intermesh while mounted on two parallel shafts and they counter-rotate, resulting in
the creation of C-shaped sealed chambers between them. One of the screws is
mounted on a rotating shaft, which is powered electrically or mechanically by a gas
engine. The drive force is transferred to the other screw by timing gears [59].
The structure is enclosed inside a casing with tight clearances. The screws are
controlled by time gear mechanisms so that not to make contact.
The Low Pressure (LP) fluid enters the pump from the suction side and it gets trapped
in the clearances that are created between the stationary and the moving elements.
Then it is guided to the chamber with the moving elements (screws), where it is
displaced as a result of the rotary movement of the rotating elements.
As the screws rotate they apply centrifugal forces to the fluid, which cause the
separation of the gas phase from the multiphase mixture. Due to centrifugal forces the
heavier liquid will concentrate at the perimeter of the screws’ tips and the lighter gas
will stay in the clearances between the screws’ hubs. By this way the liquid is creating
a sealing on the gas flow. As the flow moves in further channels towards the discharge
side of the pump, its pressure increases. Some of the liquid flow will travel; reversely
from the discharge to the suction side, as a result of the differential pressure drive [60].
This backflow is responsible for the compression of the gas that is trapped in the
clearances. In Figure 40 are presented the directions of the flow on the suction and
the discharge side as previously described.
The pressure traverse between the channels of the pump is illustrated in Figure 40
(blue is referred to the gas phase and green to the liquid phase and the arrows indicate
the liquid backflow).
Figure 40: Pressure traverse between the screw chambers, from the suction up to the discharge side [60]

88 | P a g e
The volume of the trapped and displaced fluid is constantly the same and specific for
each pump and the flow rate is independent of the pressure or temperature of the fluid.
The displacement of the fluid has direction from the suction to the discharge side.
(a) Top view (b) Side view
Figure 41: Top view of a twin screw back-to-back pump configuration [41, 61].
Internal Configuration characteristics
Their design follows the rules and calculations described in the standard API 676.
Screw arrangement: the screws are not in contact between each other or with their
housing. There are two different arrangements: Standard Screw and Degressive
Screw: It has decreasing pitch.
Rotor: the rotors used in these pumps may be timed by external gears or untimed.
In case of using untimed rotors, the internal is designed so that to avoid contact
between the screws.
Operating characteristics
Twin screw multiphase pumps are used especially for the pumping of heavy crude oil.
Their main operating characteristics are summarized in Table 8:
Table 8: Main operating characteristics of multiphase twin screw pumps.
Suction
Discharge

89 | P a g e
Operational advantages
The main advantages of the twin screw multiphase pumps are the following [41]:
The ability to handle highly viscous fluids.
The ability to operate at low suction pressure.
They operate at low rotational speeds and they don’t need expensive and hard to
find accessories as bearings and drivers [41].
They have low sensitivity to variations in flow conditions (suction pressure,
GVF).
They have high tolerance in liquid slugging flows. In case of liquid slugs in the
flow, they will hit both sides of screws at the suction side simultaneously, applying
forces of same magnitude but of opposite direction on the screws [8]. Consequently
the applied forces will counteract each other and the net resulting force on the screws
will be zero.
Surface Equipment
Pressure relief valve: they are installed downstream of the twin screw pumps if
they are not embedded on the pump’s main structure. They are used for operational
safety reasons. In case that the pressure after the outlet of the pump increases (as it
may happens when it meets a closed valve) the pipe may failure due to burst. By
installing the pressure relief valves, the fluid may re-circulate through the valve and
thus preventing the damage in the pipe [41].
Vendors
The main vendors for surface multiphase twin screw pumps are: Bornemann Pumps
Inc., Flowserve Corp., and Leistritz Corp. Other suppliers are: Colfax Pump Group
(Houttuin, Imo, Allweiler, and Warren), GE Oil & Gas, Nuovo Pignone Corp., CAN-K
Artificial Lift Systems Inc. and OAO Livgidromash [62]
Case study
Huwaila oilfield in southern Abu Dhabi
Field description: The Huwaila field is in southern Abu Dhabi, it was discovered in
1965. The surface facilities are located in a gathering station (RDS-3) 27km northern
of the Bu Hasa field. The area has sand hills and it is approachable only by off-road
vehicles. The oil production started from one well (Hu-44) using the natural flow drive
mechanisms. The oil transportation from the production site to the treatment facilities
was implemented with a pipeline of 8in diameter and 27km long.

90 | P a g e
In 1996 an ESP was used to enhance the recovery but it also increased the water cut.
The well (Hu-44) was sidetracked as a 1,800ft horizontal well.
The area around the field is a dessert with high temperatures (during summer the
medium ambient temperature is +50oC).
Effluent description: The effluent was crude oil of low viscos.ity, 0.55cp. The content
in H2S and the content in CO2 were very high, 0,7% and 7,0%.respectively. Also the
formation water contained chlorides.
Pump characteristics:
Table 9: Operating characteristics of the installed multiphase twin screw multiphase pumps in Huwaila field.
7.3.2. Single Screw/Progressive Cavity Pumps (PCP)
Operating Principle
Progressive cavity pumps used to be called as eccentric screw pumps, eccentric gear
pumps and helical gear pumps. The principle of operation was first established in the
1930s by Rene Moineau [63].
They belong to the rotary positive displacement pumps category of multiphase pumps.
Their operating principle is similar to the operating principle of twin screw pumps: the
fluid is transferred from the suction to the discharge side of the pump through the
clearances between the screws and the casing. The backflow is responsible for both
pump types for the gas compression and the progressive movement of the flow.
They consist of a rotating metallic shaft with screw configuration, which is driven
electrically or hydraulically. The rotor is mounted in a stationary casing which is made
of flexible elastomeric material. The internal part of the stator has cavities in the shape
of a multiple helix (number of rotor screws plus one) [41]. The design of the stator and
the rotor is made so that the pitch of the screws and the stator’s cavities to be in contact
and to create closed clearances.
The Low Pressure fluid enters the pump and is guided to the chamber with the screw.
There the fluid is trapped between the cavities of the screw (rotor) and the sealing
(stator). As the rotor rotates centrifugal forces are imposed to the flow and result to
phase separation. The liquid is forced to occupy the screw’s outer diameter and seals
Driver
Rating
Suction
pressure
Nominal
liquid flow
rate
Nominal gas
flow rate
GVF at
suction
conditions
1st pump 2nd pump kW psi bar psi bbl/d MMscf/day %
MPC208 Twin screw Onshore Bornemann
Huwaila's
field, Abu
Dhabi
45mm 38mm 400 1,480 550 5,000 1.74 67.2
Screw pitchName
Discharge
PressureType of
pump
Type of
installationVendor
Case study of
deployment

91 | P a g e
the clearances, so the gas is trapped in the hub of the screws. The clearances are
moving progressively from the suction to the discharge side, so the motion of the rotor
causes the displacement of the gas. As the liquid moves towards the discharge side,
a liquid backflow is created due to the differential pressure drive mechanism. The
backflow is responsible for the compression of the gas and so the flow can be
continuously displaced.
The volume of the displaced fluid is constantly the same, specific for each pump and
the flow rate is independent of the pressure or temperature of the fluid.
Figure 42: Configuration of cavities in progressive cavity pumps [64].
Internal Configuration characteristics
The design of the progressive cavity pumps is based on the API 676 international
standard. The main components of a single screw multiphase pump as presented in
Figure 43, are the following:
1) Rotor
2) Stator: the stator is made of flexible materials and the internal surface has a
shape of a multiple helix (number of rotor screws plus one).
3) Drive Chain: Couples the rod with two gimbal joints and transmits the
necessary electrical energy to the rotor.
4) Shaft Seals
5) Suction and Discharge Housing
6) Block Construction
Figure 43: Single screw pump configuration.
Surface Equipment
Systems for controlling the conveying pressure
o Pressure gauges
o Gate valves
Cavity

92 | P a g e
o Safety valves
o Pressure relief valve
Dry running protection systems
Electrical Control System
Bypass lines
Application-specific baseplates
A great variety of drive systems
Operating characteristics
Their main operating characteristics are summarized in the Table 10:
Table 10: Main operating characteristics of multiphase single screw pumps.
Operational advantages
The main advantages of the twin screw multiphase pumps are the following [41, 45]:
They can handle flows with more than 8% of solids because the elastomeric
stator is not damaged by them.
The ability to handle highly viscous fluids.
They don’t need liquid recirculation when handling flows with high GVF (>90%).
Vendors
Colfax Pump Group (Houttuin, Imo, Allweiler, and Warren), Seepex, NETZSCH
Pumpen & Systeme GmbH, Weatherford.

93 | P a g e
8. Multiphase pumps performance and selection
8.1. Performance characteristics
Modeling of the MPPs performance is quite complex due to the different geometries
and the complexity of the multiphase flow. For this reason there isn’t a general model
for their performance.
For design purposes the multiphase pumps can be considered as wet gas
compressors [7], because the gas volume fraction is higher than the liquid volume
fraction, thus it influences the behavior of the liquid phase. The flow regime is
considered as steady state for calculations simplification.
In multiphase pumping design the most important parameters that must be calculated
are the following [7, 41]:
Pump’s capacity (gas and liquid flow rates),
The Gas Volume Fraction (GVF) and the water fraction (or water cut),
The fluid densities (gas and liquid),
The required pressure rise,
The suction pressure and fluid temperature,
The oil viscosity,
The pressure and temperature gradients along the pipeline,
Fluid characteristics and gas composition (presence and concentrations of
corrosive components, possible wax deposition),
Possible presence of solid particles (sand, scale formation).
All the different types of pumps have the same fundamental working principle:
increasing the pressure of the transferred fluid by different ways and means. The
pressure that is provided to the fluid is better expressed in terms of equivalent height
of a column that contains the transferred fluid [65]. More specifically the term pump’s
(manometric) head (Hp) is usually used to express the specific work (mechanically
induced energy per unit of mass flow) ΔW that is transferred to the fluid, but it is
expressed in terms of liquid column’s height and it has dimensions of length. The
energy that is transferred to the fluid is dictated by the energy conservation law
(Bernoulli equation) and it expresses the kinetic energy of the fluid, its potential energy
and its dynamic energy.
Hence the pump’s head is an indication of the differential pressure between the suction
and the discharge side of the pump, which is affected by the fluid’s properties (density).
The head depends on the pump’s geometry, its rotational speed, the velocity slip
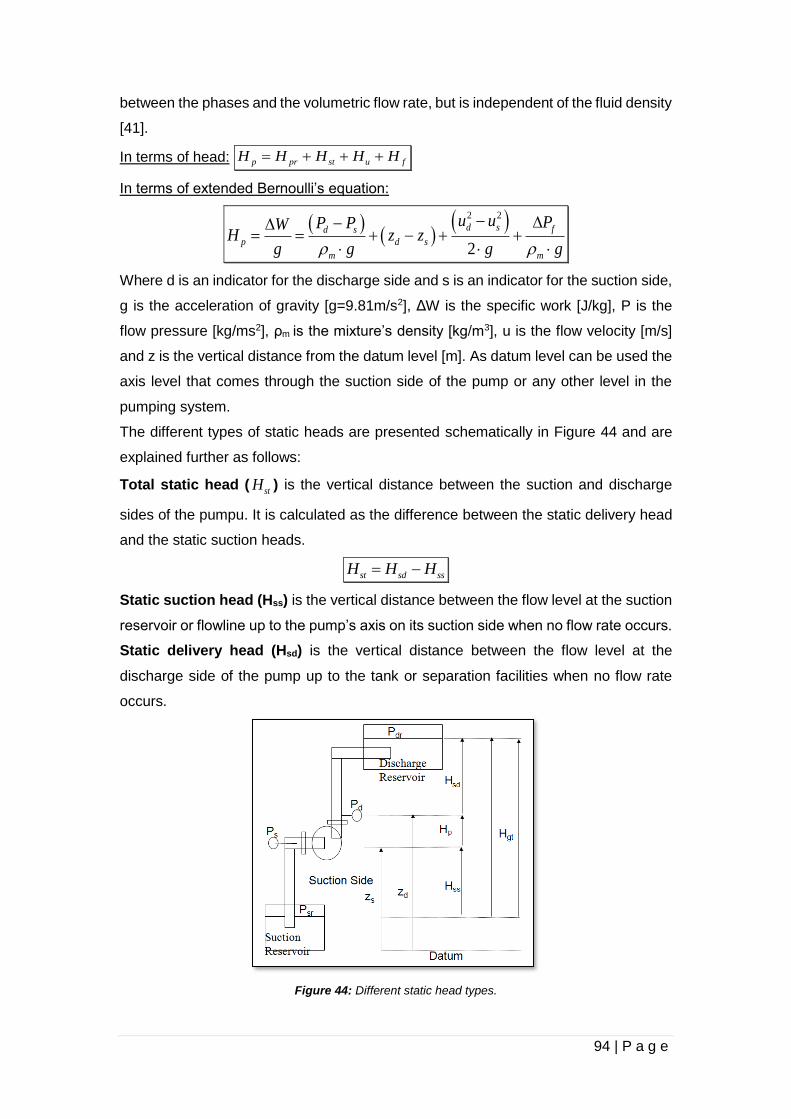
94 | P a g e
between the phases and the volumetric flow rate, but is independent of the fluid density
[41].
In terms of head: p pr st u fH H H H H
In terms of extended Bernoulli’s equation:
2 2
2
d s fd s
p d s
m m
u u PP PWH z z
g g g g
Where d is an indicator for the discharge side and s is an indicator for the suction side,
g is the acceleration of gravity [g=9.81m/s2], ΔW is the specific work [J/kg], P is the
flow pressure [kg/ms2], ρm is the mixture’s density [kg/m3], u is the flow velocity [m/s]
and z is the vertical distance from the datum level [m]. As datum level can be used the
axis level that comes through the suction side of the pump or any other level in the
pumping system.
The different types of static heads are presented schematically in Figure 44 and are
explained further as follows:
Total static head (stH ) is the vertical distance between the suction and discharge
sides of the pumpu. It is calculated as the difference between the static delivery head
and the static suction heads.
st sd ssH H H
Static suction head (Hss) is the vertical distance between the flow level at the suction
reservoir or flowline up to the pump’s axis on its suction side when no flow rate occurs.
Static delivery head (Hsd) is the vertical distance between the flow level at the
discharge side of the pump up to the tank or separation facilities when no flow rate
occurs.
Figure 44: Different static head types.

95 | P a g e
Pressure head (prH ) represents the potential energy that is converted the fluid’s
elastic energy that comes from its hydrostatic pressure pr
m
PH
g
Velocity head ( uH ) represents the potential energy that is converted to fluid’s kinetic
energy
2
2u
uH
g
Friction head (fH ) represents the potential energy that is lost during the flow through
the pipeline. They include the losses at the entrance of the pipeline from the suction
side, the losses at the exit of the pipeline from the discharge side, the friction losses
as the flow is moving through the pipeline and the friction losses due to restrictions in
the flow from hydraulic components as valves, heat exchangers, etc. The friction head
is calculated by the following formula: 2
fH k Q where k is the loss coefficient of
the hydraulic components [66].
Dynamic Total Suction Head (TSH) represents the total energy of the flow when it is
on the suction side. From the Bernoulli equation is the summation of the pressure
head, the velocity head and the static head at the suction side subtracted by the friction
head on the suction side (friction head is reducing the pressure at the suction side of
the pump and hence its energy regime).
2
2
s sss fs
m
P uTSH H H
g g
Dynamic Total Discharge Head (TDH) represents the total energy of the flow when
it is on the discharge side. From the Bernoulli equation is the summation of the
pressure head, the velocity head, the static head at the discharge side and the friction
head on the discharge side (friction head is increasing the pressure at the discharge
side of the pump and hence its energy regime).
2
2
d dsd fd
m
P uTDH H H
g g
Total Pump’s Head (Hp) represents the energy that is provided to the fluid by the
pump. It is the overall pump’s head and it is equal to the difference:
2 2
2
d sd s
p st fd fs
m
u uP PH TDH TSH H H H
g g
dP : the pressure at the discharge side
sP : the pressure at the suction side

96 | P a g e
Total Suction Lift (TSL) is the total suction head (TSH) when the flow level at the
suction reservoir or flowline is lower than the datum level. In this case TSH has
negative value and instead of using a negative value, it is expressed as total suction
lift but with positive sign.
Net Positive Suction Head (NPSH) is the total head on the suction side of the pump,
over the bubble point pressure.
Net Positive Suction Head Available (NPSHA) is the energy that the pump must
overcomes on the suction side in order to avoid cavitation. It is a characteristic of the
hydraulic system, not only the pump.
b
m
PNPSHA TSH
g
Pb: is the pressure at the bubble point of the flow
Net Positive Suction Head Required (NPSHR) is the energy that is required to move
and accelerate the liquid from the suction side to the inlet of the pump. It is a
characteristic of the pump provided by the manufacturer.
The pump’s capacity (Q) is the total actual volumetric flow rate that is delivered by
the pump in the discharge side [m3/s].
d dQ u A
ud: flow velocity at the discharge side [m/s]
Ad: pipe’s diameter at the discharge side [m2]
The normal volumetric flow rate of the pump (QN), corresponds to the total actual
volumetric flow rate in the discharge side when the pump operates at its maximum
efficiency, at the nominal total head, at the nominal rotational speed and for the specific
fluid.
The nominal volumetric flow rate of the pump (QN), corresponds to the total actual
volumetric flow rate in the discharge side when the pump operates at its nominal total
head, at the nominal rotational speed and for the specific fluid, but not at the maximum
efficiency. The pumps are designed according to this value.
The minimum volumetric flow rate of the pump or surge limit (Qmin), corresponds
to the minimum possible volumetric flow rate that the pump can handle.

97 | P a g e
The maximum volumetric flow rate of the pump (Qmax), corresponds to the
maximum possible volumetric flow rate that the pump can handle.
The Gas Volume Fraction (GVF) is the ratio of the actual gas volumetric flow rate to
the total oil and gas rate at suction conditions. Often instead of GVF the Gas Liquid
Ratio (GLR) in suction conditions is used [41]. They derive from the following equation:
1
g
g l rec
Q GLRGVF
Q Q Q GLR
Where Qrec is the flow rate that is used for recirculation
GVF must not be confused with GOR (Gas Oil Ratio) which represents the ratio of the
gas volumetric flow rate at standard conditions to total liquid flow rate at standard
conditions. In Figure 45 is presented a plot of gas and liquid flow for different inlet
gauge pressures. GOR corresponds to the ratio between the values of gas volume and
liquid volume at the vertical axis, while GVF corresponds to the ratio between the
values of gas volume of over gas and oil volume at the all the other points of the
surface, except the ones on the vertical axis.
Figure 45: GOR and GVF difference [40].
Pump’s delivery/hydraulic power (Wh,out) is the power that the pump delivers to the
fluid. The hydraulic efficiency of the pump is highly affected by the temperature and
the GVF.
In case that the flow is considered adiabatic, no heat exchange with the environment
is taken into consideration. This is a theoretical approach for the estimation of the
hydraulic power and then the following equation is used for its calculation:
,h out m p tW g H Q
More realistic approaches consider that the thermodynamic processes that take part
in the passageways of a pump are:
When the flow enters a multiphase pump it is subjected to an isochoric heating and an
isothermal compression. The mechanical energy of the rotating element is transferred

98 | P a g e
to the fluid, which results to an increase in its pressure, while its volume remains
constant (isochoric heating). The fluid progressively is further compressed when it is
passing through the pump’s stages, while its temperature remains constant (isothermal
compression). The thermodynamic processes to which the fluid is subjected are not
ideal, but some of the energy that is transferred to the fluid is lost due to the resistance
that must the flow overcome in suction and discharge sides (backflows).
In case of low GVF the flow is liquid dominated and because liquids have greater heat
capacities than gases, the flow will be more influenced by the temperature changes.
In this case the compression of the flow is not any more considered as adiabatic but
as isothermal. The hydraulic power that is provided to the fluid is calculated by the
following equation [59]:
, ln dh out m p l g s
s
pW g H Q Q p
p
For higher GVF values the liquid content is low and the flow has less thermal capacity.
The compression of the flow is considered as polytropic and the hydraulic power that
is provided to the fluid is calculated by the following equation [59]:
1
, 11
n
nd
h out m p l g s
s
n pW g H Q Q p
n p
Shaft’s power (Ws) is the power output from the motor that is provided to the shaft
m p
s
o
g H QW
Motor power (Wm) the power that the motor needs in order to operate
2
60
sm p p
m e
WW n M
Where ηe is the transmission efficiency and ηm is the efficiency of the motor.
The motor power is given by the manufacturer. In case of an electrically driven motor,
it depends on the rotational speed np and the rotating torque Mp.
Theoretical Pump’s drive power (Wth,in) is the theoretical power that the pump needs
in order to operate.
,th in thW Q p
Where Δp is the differential pressure that the pump creates
The volumetric efficiency of a pump (ηvol) represents the percentage of the actual
volumetric flow rate of the displaced fluid Qt over the theoretical volumetric flow rate of

99 | P a g e
the fluid that would be displaced if no flow obstacles and restrictions existed Qth. It is
calculated by the following equation:
tvol
th
Q
Q
The hydraulic efficiency of a pump (ηh) represents the ratio of the pump’s hydraulic
power (,h outW ) over the shaft’s power that is provided to the fluid when it enters the
pump (sW ). It is calculated by the following equation:
,h out
h
s
W
W
The mechanical efficiency of a pump (ηm) represents the ratio of the shaft’s power
(sW ) over the motor power ( mW ). The power requirements can also be expressed in
terms of torque. The pump needs more power than the theoretical calculated in order
to deliver the appropriate pressure boost, due to the power losses that occur as a result
of the friction between the fluid and the moving parts of the pump (bearings, gears,
etc.). It is calculated by the following equation:
sm
m
W
W
The overall efficiency (ηo) is the ratio of the hydraulic power output of the pump (
,h outW ) over the motor power input (sW ) and can also be expressed as the product of
the mechanical, the hydraulic and the volumetric efficiency of the pump. Due to the
friction pressure losses and the backflows, the overall efficiency is less than 100%. It
is calculated by the following equation:
o m vol h
The performance of a multiphase pump is better described by the pump
effectiveness. It represents the ability of the pump to compress liquid as the gas
content in the flow increases [59], in other words it shows the performance of the pump
when handling a multiphase flow in comparison of the performance of the pump for
single phase flow (so ηeffective =100% for GVF=0%) and is calculated as following:
,
,
h out isothermal or polytropic
effective
h out adiabatic
W
W

100 | P a g e
8.2. Multiphase Pump selection
The selection of a multiphase pump is an optimization problem that can be solved by
the field’s architect and the pump engineer [54]. They will decide about the time that
the operation of a multiphase pump is needed, the operating characteristics and the
type of the pump. The selection for each application is based on the desired delivery
flow rate Q and the head that the pump needs to overcome H.
The following steps are followed for the selection of an MPP [41, 65]:
1) Selection and calculation of the overall pumping system’s characteristics. The
pumping system is consisting of the pumps, the pipelines and other hydraulic
components (valves, etc.). The design and the arrangement of all the components are
implemented according to technical regulations and space restrictions. The result of
the first step will be the construction of the characteristic curve of the pumping system
between different flow rates and the total pumping head.
2) Selection of the type of the pump (single or twin screw, helico-axial multiphase
pump). The selection is done according to the total volumetric flow rate that each pump
type can handle and some additional parameters suction pressure, pressure rise, liquid
viscosity and the characteristic curve of each pump.
3) Selection of a specific pump model. After having decide about the type of pump, it
must be verified the feasibility of its application. The model that will be selected must
be able to give the required pressure rise. Also in this step the driver power is
calculated as well as the pump’s efficiency.
4) Design optimization. In the third step are conducted design optimization
calculations, about the number of pump’s stages and the selection of the nominal
rotational speed. In this step it is decided the speed variation according to the
production fluctuations.
For the first step the procedure is the following [65]:
1A) Design of the overall pumping system and calculation of the overall system’s
head: At the first step are designed the pipelines and the appropriate hydraulic
components with the characteristics (length, material, diameter, configuration in the
area) that will have after construction. Finally the overall system’s head will be
calculated.
1B) Calculation of the design volumetric flow rate: it is the flow rate that the pump
will have to handle. The calculation is referred to the production flow rates of the well
(IPR and VLP) as they have been estimated from the production engineers.

101 | P a g e
1C) Specify the properties of the transferred fluid: in order to accomplish flow
assurance through the pipelines and the pumps, the following fluid characteristics must
be known: type of fluids, chemical composition, pressure and temperature at bubble
point and pumping conditions, density, viscosity, acidity, solids concentration.
1D) Calculation of the Total Pump’s Head (Hp): the calculations must be
implemented for the most extreme suction temperatures that may occur. For safety
reasons the calculated total pump’s head may be increased by 10%.
For the second step the procedure is the following [65]:
2A) Examine the influence of the rheological characteristics of the fluid to the
different types of pumps:
For viscosity values higher than 110cSt the friction pressure losses in centrifugal
pumps are getting very high, because of the creation of turbulence in the flow. This
may result also to the decrease of NPSHA and to increase the possibility of cavitation.
The positive displacement pumps are not affected so much because their operating
principle is not affected by the flow characteristics. So in this case of flows, positive
displacement pumps are preferred.
For flows with high solids content and highly erosive characteristics the positive
displacement pumps may get damaged easier.
2B) Examine the margins of possible handling flow rates for each type of pump:
it is an initial estimation of the type of pump that can be used according to the flow rate
that each type can handle and the required flow rate.
For the third step the procedure is the following [65]:
3A) Calculation of the net positive suction head available (NPSHA)
3B) Calculation of the required motor power
For the fourth step the procedure is the following [67]:
4A) Estimation of the operation/duty point: the characteristic curves of the overall
pumping system (Q-H) and the pump (Q-Hp) are plotted in the same diagram. The
operation point of the pump is the intersection point of the two curves (Figure 46a for
rotodynamic pumps and 46b for positive displacement pumps).
4B) Estimation of the best efficiency point: the characteristic curves of the pump
(Q-Hp) and the pump’s efficiency curve (η-Hp) are plotted in the same diagram. The
best efficiency point is the point of maximum pump’s efficiency for a specific flow rate.

102 | P a g e
System’s characteristic curve
The characteristic curve of the pumping system provides information about all the
possible pressure losses that occur at the flow path between reservoir and separation
facilities in the flowlines upstream and downstream and the well [41]. It is the
summation of the total static head (Hst) and the friction head (Hf).
With increasing flow rate the friction pressure losses increase, because they are
directly connected with the flow velocity and thus with the flow rate. Consequently the
system’s head increase when the flow rate increases (Figure 46).
The system’s characteristic is a parabola with positive slope, because the friction head
is directly proportional to the square of flow rate (considering no liquid hold up
phenomena occurrence).
(a) (b)
Figure 46: System curve, positive displacement (b) and helico-axial (a) pump’s characteristic curve and duty/operating point [58, 68].
Pump’s performance and characteristic curves
Pumps performance can be predicted by their characteristic curves. For multiphase
pumps, the performance can be predicted for each pump under specific operating
conditions of Gas Volume Fraction, suction pressure, liquid density and viscosity,
because of the high complexity of the multiphase flow patterns and the different internal
configuration of the pumps [8]. The operation of the multiphase pumps and thus their
characteristic curves are influenced by the Gas Volume Fraction (GVF) and the gas
and liquid properties [56].
The pumps’ performance can be presented with four different types of characteristic
curves: pump’s overall efficiency ηo over capacity Q (Q-ηo), pump’s overall head Hp
over capacity Q (Q-Hp), shaft’s power Ws over capacity Q (Q-Ws) and NPSHR over
capacity Q (Q- NPSHR) [65]. Usually, they are all presented in one plot. The abscissa
of the characteristic curves of multiphase pumps is referred to total (liquid and gas) or
liquid volumetric flow rates.

103 | P a g e
Characteristic curve (Q- NPSHR)
The NPSHR is increasing with increase of the flowrate, as it is presented in Figure 49,
because friction pressure losses are induced and operate as an obstacle to the flow.
Figure 47: Multiphase pump’s general characteristic curve Q-NPSHR [65].
Characteristic curve (Q-Hp)
It represents the locus of the possible operational points for a given rotational speed.
When the pump operates at a certain rotational speed the flow rate that can handle is
reduced as the energy that has to provide to the fluid and hence the head, increases.
Characteristic curve (Q-Ws)
The shaft power is increasing with the increase of pump’s head because the pump
needs to provide more energy to the fluid in order to overcome the higher head and
the necessary power will be transferred through the shaft. In the case of closing a valve
at the discharge side of the pump, while it is operating, the pump will provide zero
flowrates at its outlet. However, the shaft will receive energy from the motor drive,
which will be transformed into thermal energy and will increase the flow temperature.
For this reason, the characteristic curve of (Q-Ws) indicates a non-zero shaft power for
zero flow rate (Figure 48).
Figure 48: Multiphase pump’s general characteristic curve Q-Ws [65].

104 | P a g e
Characteristic curve (Q -ηo)
Each characteristic curve is the locus of the pump’s overall efficiency that can be
achieved for different combinations of volumetric flow rate and differential pressure or
head when the pump is operating at a specific rotational speed. The pump’s efficiency
is close to its maximum value for a specific range of flow rates but it decreases sharply
as the flowrate approaches zero or its maximum as it is presented in Figure 47 [65].
The combination of the (Q-Hp-ηo) curves includes information about the Best Efficiency
Point (BEP) of the pump, which indicates the optimum operating conditions in order to
achieve the maximum or optimum efficiency for a specific deliverable total flow rate
[56].
The operating range of the pump is between the Shut-Off and the Run-Out Point [69].
The head for zero flow rate is called “Shut-Off Head”. The shut-off head is an indicator
of the feasibility of the pump to start. The static head needs to be less than this. This
is important in particular cases of boosting systems where the pump is at a lower level
than the discharge tank (for example in the case of seabed pumps and risers as
discharge flowlines). The maximum flow rate that the pump can handle corresponds
to a minimum head and this point is called “Run-Out Point”. Beyond this point, the
pump cannot operate.
Figure 49: Multiphase helico-axial pump’s general characteristic curve Q-ηo [41].
The pump must operate as closest as possible to the best efficiency point and the ideal
margins of operation are ±10% of the BEP flow rate [70].
If the pump operates at flow rates lower than the one that corresponds to the BEP, so
at the left side of the BEP, the main problems that may arise are thermal build up,
cavitation, recirculation and components damage. The low flow rate indicates high-
pressure flow which means may that possible recirculation may occur. Due to the
recirculation unbalanced forces are implied to the internal components of the pump,
which can cause shaft deflection, vibrations, bearings and mechanical seals fatigue
Shut-Off Head
Run-Out Point

105 | P a g e
and vanes damage. Also, the high pressures are connected with the occurrence of
high temperatures. This increases the risk of thermal build up of the pump.
Runout is the operating condition with flow rates higher than the flow rate that
corresponds to the BEP, so it corresponds to the right side of the BEP [71]. The main
problems that may arise are cavitation and components failure. In this case, the
increased flow rate will cause the decrease of the pressure at the inlet of the pump,
which means that the head that can be provided by the pump (NPSHA) may be less
than the bubble point pressure. As a result, bubbles will start to develop in the flow
(cavitation) that may break when the flow reaches the discharge area where high
pressures occur. The collapse of the bubbles may cause uneven axial and radial
loading on the impeller which can cause shaft deflection, vibrations, bearings and
mechanical seals fatigue and vanes damage.
Figure 50: Possible problems for operation of a helico-axial pump away from the BEP [72].
Operating Point
The conditions of head and flow rate under which the pump will operate are the ones
that correspond to the best efficiency point. The operating point corresponds to the
flow and head required for the pump to operate. Graphically is the intersection of the
system’s curve with the pump’s performance curve of Q-Hp-ηo. The performance curve
in Figure 51 corresponds to a helico-axial pump and in Figure 51b corresponds to a
positive displacement pump.
There are two possible operating conditions when a centrifugal pump starts [69]:
When the discharge valve is closed. In this case, after starting the pump the head
is equal to that of shut-off point because no flow rate is passing through the pump. As
the discharge valve opens gradually, the operation of the pump reaches the operating
point by following the pump’s curve. So, the operation of the pump follows a path on
the performance curve, starting from the shut-off point up to the operating point.
When the discharge valve is open. In this case the pump gradually increases its
speed, so initially, it can handle low flow rate and creates a small head. Gradually the

106 | P a g e
operation of the pump reaches higher values for flow rate and head because its
performance curve shifts to higher speeds. This method is not preferred because it
may cause water hammer effects in case of high initial speed.
(a) (b)
Figure 51: Operating point of a helico-axial (a) and a positive displacement pump (b) [68].
In Figure 52 is presented a typical characteristic curve for a multiphase pump. The
areas that can be distinguished are the following:
The dotted lines indicate the possible operational points of the pump when it is
operating at constant Gas Liquid Ratio (GLR) and suction pressure, but the rotational
speed varies. Each one of them corresponds to a different rotational speed.
The continuous black lines indicate the possible operational points of the pump
when it is operating at constant rotational speed and suction pressure, but the GVF
varies. Each one of them corresponds to a different GVF percentage.
The red line indicates the locus of all the possible operational points that can handle
the maximum total volumetric flow rate.
The green line is the locus of all the possible operational points that can handle the
minimum total volumetric flow rate, which is the surge limit. All the multiphase pumps
need to handle a minimum flow rate. The fluctuations of pressure that are created
under low flow rate result in low-frequency fluctuations of power and thus vibrations
and dynamic stresses imposed to the pump elements, that may hurt their strength.
Figure 52: Multiphase pump’s general performance curve [8].

107 | P a g e
8.3. Helico-axial Pumps (Rotodynamic)
Multiphase flow in helico-axial pump
The flow regimes that may appear inside a helico-axial pump in case of multiphase
flow are dictated by the same physical mechanisms that create the flow regime that
may appear inside a pipe [56].
The important differences are related to the pressure distribution and the pressure
losses in the pump. The flow is imposed by centrifugal forces which are generated by
the rotational motion of the impeller. This affects the phase distribution in the flow and
creates pressure fluctuations.
Performance
Factors that affect the performance of the multiphase helico-axial pumps:
Increase of Pump’s stages: Discharge pressure increases (Pd), GVF decreases,
mixture’s density (ρm) increase, total volumetric flow rate decrease [41]
When the fluid passes through the diffuser it is compressed. Its pressure increases
because of the tighter flow passages that are created from the stator. Since the flow
pressure increases, its velocity and its volumetric flow rate decreases, as it is
prescribed by the energy conservation law. The gas phase will condensate due to
compression, so the GVF will decrease and the average mixture’s density will increase.
The profiles of the affected flow parameters are presented in Figure 53.
Figure 53: Multiphase helico-axial pump’s discharge pressure, total volumetric flow rate, average mixture density and GVF profile [41].

108 | P a g e
Increase in Gas Volume Fraction (GVF) and Gas Liquid Ratio (GLR):
Compression ratio decreases
In centrifugal and helico-axial pumps in case of high gas flow rate the gas bubbles
coalescent in the areas of low pressure (near to the impeller’s eye) resulting in gas
accumulations. The flow regime becomes similar to slug or plug flow in pipes and gas
pockets are created. In the case of continuous gas accumulation, the flow may be
blocked and the pump may become gas-locked, which means that the pressure at the
discharge side may be disrupted [56]. However, the helico-axial pumps have the
advantage of being able to handle up to 100% GVF. This occurs due to the shape of
the vanes because the helical-shaped vanes enable the homogeneity of the flow.
In Figure 54 are presented the characteristic curves for a multistage helico-axial two-
phase pump for its operation at GLR between 2 and 15, when the same constant inlet
pressure and rotational speed occur for all the different operation cases. The upper
boundary indicates the surge limit and the lower boundary indicates the maximum liquid
flow rate that can be handled. As the GLR increases the GVF increases too, so the
curves of increasing GLR correspond to increasing values of the gas fraction. The fluid
is imposed in compression as it passes through the pump, so as the compression ratio
increases through the pump stages, the gas volume fraction GVF will decrease [51].
So the curve is shifted to the right, at higher flow rates as the GVF decreases.
Figure 54: Helico-axial pumps’ characteristic curve for constant speed and inlet pressure [56].
Decrease in rotational speed (n): Compression ratio decreases [56]
In Figure 55 are presented the characteristic curves for a multistage helico-axial two-
phase pump for its operation at speeds between 4,000rpm and 6,000rpm, when the
same constant inlet pressure and GVF occur for all the different operation cases. As
the rotational speed decreases, without any change in GVF and suction pressure, the
shaft’s power decreases, consequently less energy is transferred to the fluid and less
Increasing GVF and GLR
Decreasing shaft’s

109 | P a g e
pressure boosting is given to the flow (in terms of head) and thus less flow rate can be
handled. So the curve is shifted to the right, at higher flow rates as the rotational speed
increases. Also, the curves for constant speeds become sharper for higher rotational
speeds, because with increasing speed the compression increases and the void
fraction and density ratio decreases [56].The upper boundary indicates the surge limit
and the lower boundary indicates the maximum liquid flow rate that can be handled.
Figure 55: Helico-axial pumps’ characteristic curve for constant GVF and inlet pressure [56].
Operational restrictions and limitations
They can handle flows with dissolved solid particles, but they must have small size
in order to prevent their accumulation in the pump casing or gaps [41]. The flow regime
will be homogeneous in case that the particles have small size so that they settle down
fast. Else their concentration will vary on the three axes and the flow regime will be
heterogeneous.
The number of stages is restricted by the mechanical strength of the shaft on the
dynamic stress.
The operational target of a pump is the pressure increase in its outlet. This means
that while the fluid is guided to the discharge side, it is imposed to flow to the opposite
direction, as a result of the force that is applied to the flow due to the pressure
difference. This force is the axial thrust and it acts as an obstacle to the flow. In order
to overcome it, balance pistons (or thrust bearings) are placed next to the discharge
side of the pump [56]. The piston is pushed by the flow that is escaping from the exit
of the pump, so the discharge pressure decreases and the axial thrust too. When the
suitable pressure decrease is achieved, the fluid is provided again to the suction side.
Another solution is the rearrangement of the impellers like in the double suction pumps,
where the axial thrusts that are created from the two suction sides are neutralized.
Decreasing speed
and shaft’s power
110 | P a g e
As for all the different types of pumps there is a surge capacity limit for the flow
rate that they can handle, below which they become unstable, due to the stress fatigue
that is imposed to the pump’s elements [56].
Impeller Slip of the flow. The fluid is exerting the pump (at the discharge side) with
a different velocity than the one it is inserting (at the suction side). This phenomenon
is called “impeller slip of the flow”. It is occurring independently of the viscosity of the
fluid. In case that the flow is considered non-ideal (viscous) the slip of the velocity is
more intense due to the consideration of the boundary layers.
When the fluid is inserting the pump, it meets the impeller with its initial velocity vu. The
impeller is rotating with a constant angular velocity ω. While the fluid is getting trapped
between the gaps of the blades, its flow is affected by the dynamic field that is created
from the movement of the impeller and the flow becomes similar to a vortex. The flow
direction towards the tips of the vanes follows the direction of the centrifugal forces
that are imposed by the rotating shaft. Meanwhile, corriolis forces are applied to the
flow because of the movement of the flow relatively to the impeller, which causes the
redirection of the flow from the direction that would have in case of stationary impeller
vanes. As a result, the fluid is exerting the pump with a velocity of a different direction
and of less magnitude than the velocity that it is inserting (due to energy losses from
the vortex flow) [66]. The difference between the inlet and outlet velocity indicate the
energy loss due to non-ideal processes (the actual outlet velocity is less than the ideal
outlet velocity, which indicates that the fluid lost energy).
The different types of velocities that are met in impellers can be described with the
velocity triangles. In Figure 56 is presented a typical velocity triangle for a centrifugal
pump, where u is the flow velocity, Vu is the actual flow velocity in the tip of the vanes
when it is exerting the impeller and Vu’ is the ideal flow velocity when it is exiting the
tips of the vanes without any energy loss to occur. The difference between the actual
and the theoretical flow velocity, which indicates the energy losses, is presented as
the horizontal dotted line.
Figure 56: Slip effect on velocity triangles for centrifugal pumps [8].
111 | P a g e
Design
The flow is considered to be well mixed and its properties vary between the properties
of a single phase liquid and a dry gas flow. In other words, the flow density and
compressibility are calculated using the mixtures’ equations.
The operating pressures are expressed in terms of head because it is more important
to know how much a pump can raise the liquid it is pumping, rather than the amount
of pressure the pump is adding to the liquid.
Pump’s head: The calculation of the head of a helico-axial multiphase pump is
simplified by assuming that the flow is homogeneous, the phases are in thermal
equilibrium and the thermodynamic processes in the pump are considered isothermal
and the GVF is not too high. In case of very high values of GVF, the flow behavior is
more similar to the dry gas. Then the thermodynamic processes are considered as
polytropic and the temperature change of the flow in the pump must be taken into
consideration for the pump’s head calculation [41].
11 dd s
s
m
PGVF P P GVF P ln
PH
Where:
dP : is the absolute discharge pressure
sP : is the absolute suction pressure
m : is the mixture’s density
1m L GGVF GVF
L : is the liquid phase density
G : is the gas phase density
8.4. Single and Twin Screw Pumps
Performance
Factors that affect the slip and the flow rate and thus the performance of the multiphase
screw pumps:
Increase of the number of internal clearances: Increase of differential pressure
By increasing the number of the internal clearances, the pressure rise that can be
achieved is increased. But the clearances are preferred to be as less as possible, so
that to avoid backflow and to have greater efficiency.

112 | P a g e
Increase of the flow viscosity: Decrease of backflow and increase of volumetric
efficiency
Liquid mixtures with high viscosity create less backflow, because the shear stresses
increase and it will be more difficult for flow to move backwards. This results to the
increase of the volumetric efficiency.
Increase of the suction pressure: Increase of hydraulic efficiency and
effectiveness
When the pump is operating at high suction pressure, the high pressure may cause
the condensation of the gas phase, so the flow is behaving as incompressible. Hence
the pump’s ability to compress the gas content of the multiphase flow increases, so its
hydraulic efficiency and effectiveness increase [59].
Increase of the Gas Volume Fraction (GVF): Increase of volumetric efficiency up
to a threshold for low pressure rise, decrease of volumetric efficiency for high pressure
rise
The volumetric efficiency of screw multiphase pumps is highly affected by the gas
volume fraction (GVF). The gas appears in the suction side of the pump either as
entrained or dissolved gas and when it enters the pump it will expand/released and will
occupy the clearances [63].
When the pump operates at a specific speed and delivers low-pressure rise, the
pump’s volumetric efficiency increase as the gas volume fraction increases up to a
specific value (around 85%), as indicated in Figure 57 [7]. With increasing gas fractions
the flow becomes more compressible. So the pump is compressing the flow “easier”
and consumes less energy, so the hydraulic, the volumetric and overall efficiency of
the pump increase.
For values of GVF exceeding this threshold, the flow regime may become more
turbulent which means that flow instabilities may occur. The flow regime is
characterized by gas pockets, which lead to pressure pulsations that consequently
lead to vibrations and strength failure of the pump’s components.
On the other hand for such high values of GVF, the flow can be considered that
consists almost totally of gas phase, so the pump clearances will be filled mostly by
the gas phase. Consequently, the liquid film sealing in the perimeter of the screws tips
cannot be created due to low liquid content in the flow and thus the gas that is trapped
in the clearances cannot be compressed and may remain trapped. So the flow will be
blocked and the liquid flow rate that the pump can actually handle as well as its
volumetric efficiency will be reduced.

113 | P a g e
Figure 57: Volumetric efficiency curve of a multiphase screw pump for different GVF values when it is operating at constant pressure rise and speed [7].
When the pump operates at a specific speed and delivers high-pressure rise, the
pump’s volumetric efficiency shows fluctuations that depend on the amount of pressure
rise. As it is indicated in Figure 58, the efficiency decreases up to a threshold for high
gas volume fractions (>50% GVF), then it increases, meets a maximum efficiency and
decreases again. The pump will operate smoothly under these conditions, but the flow
temperature will rise since there will be almost no liquid recirculation to cool down the
pump [51].
The flow which is characterized by 50% GVF seems to behave as a 100% of liquid
flow, meaning that the volumetric efficiency of the pump decreases for constant GVF
as the pressure rise demand increases.
Figure 58: Volumetric efficiency curve of a multiphase screw pump for different GVF values when it operates at constant inlet pressure and speed [59].
Screw geometry (size and pitch of screws): Decrease of pitch results in decrease
of slip and increase of volumetric flow rate [51]
As the pitch decreases, more clearances between the screw locks are created, so
there is more space where gas may be trapped. Consequently the slip will be reduced
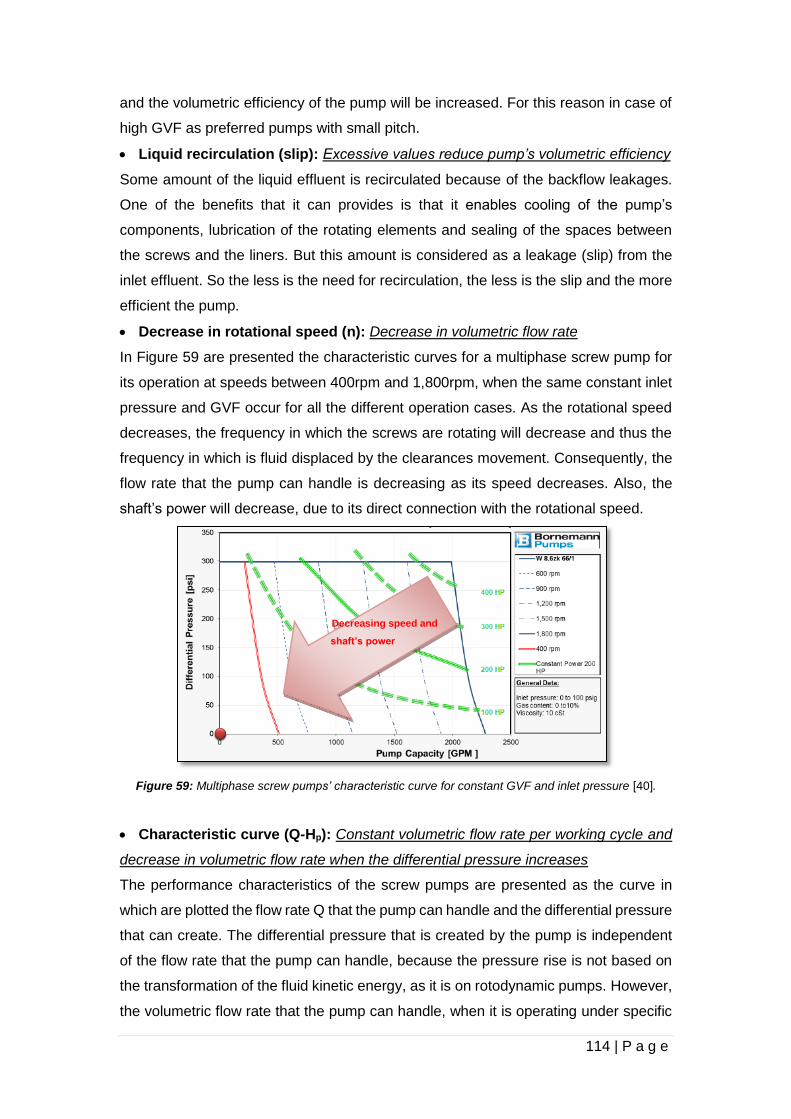
114 | P a g e
and the volumetric efficiency of the pump will be increased. For this reason in case of
high GVF as preferred pumps with small pitch.
Liquid recirculation (slip): Excessive values reduce pump’s volumetric efficiency
Some amount of the liquid effluent is recirculated because of the backflow leakages.
One of the benefits that it can provides is that it enables cooling of the pump’s
components, lubrication of the rotating elements and sealing of the spaces between
the screws and the liners. But this amount is considered as a leakage (slip) from the
inlet effluent. So the less is the need for recirculation, the less is the slip and the more
efficient the pump.
Decrease in rotational speed (n): Decrease in volumetric flow rate
In Figure 59 are presented the characteristic curves for a multiphase screw pump for
its operation at speeds between 400rpm and 1,800rpm, when the same constant inlet
pressure and GVF occur for all the different operation cases. As the rotational speed
decreases, the frequency in which the screws are rotating will decrease and thus the
frequency in which is fluid displaced by the clearances movement. Consequently, the
flow rate that the pump can handle is decreasing as its speed decreases. Also, the
shaft’s power will decrease, due to its direct connection with the rotational speed.
Figure 59: Multiphase screw pumps’ characteristic curve for constant GVF and inlet pressure [40].
Characteristic curve (Q-Hp): Constant volumetric flow rate per working cycle and
decrease in volumetric flow rate when the differential pressure increases
The performance characteristics of the screw pumps are presented as the curve in
which are plotted the flow rate Q that the pump can handle and the differential pressure
that can create. The differential pressure that is created by the pump is independent
of the flow rate that the pump can handle, because the pressure rise is not based on
the transformation of the fluid kinetic energy, as it is on rotodynamic pumps. However,
the volumetric flow rate that the pump can handle, when it is operating under specific
Decreasing speed and
shaft’s power

115 | P a g e
speed, is reduced when the pressure rise increases. When this happen the backflow
increases and the theoretical volumetric flow rate that the pump is able to handle is
decreased by this amount. As indicated in Figure 60, the actual volumetric flow rate is
relatively constant per working cycle but it reduces due to the backflow losses.
Figure 60: Positive displacement pumps’ characteristic curve [41].
Operational restrictions and limitations of twin screw multiphase pumps
The twin screw multiphase pumps cannot handle liquids with high solids
content. The fluid is displaced due to the differential hydrostatic pressure that is
created from the alternation of clearances. As a result, the clearances must be as
higher as possible in order to achieve higher pressure difference and flow boosting. In
case that the fluid contains solids, the clearances will be less, resulting in less
efficiency.
The volumetric capacity that a twin screw pump can handle depends on the
volume of the clearances that are created by the screws in the core of the pump and
thus by the size, the rotational speed and the number of pitches on the screws.
Generally tight clearances reduce backflows and improve pump capacity and
efficiency [41].
Backflow (or slip) between the suction side and the clearances may occur and
reduce the volumetric efficiency and the differential pressure between the suction and
the discharge side of the pump [41, 7]. As the flow moves from the suction to the
discharge side, its pressure increases, creating a pressure drive mechanism that
forces the flow to the different direction. This drive mechanism is known as axial thrust
and the result is the creation of backflow, which acts as an internal fluid leakage. In
order to overcome it, the two screws are installed back-to-back. With this arrangement,
the high-pressure channel is placed in the middle of the shaft and the low-pressure
part, from which the flow enters the pump, is placed on the sides [41].

116 | P a g e
The differential pressure between the suction and the discharge side of the pump
is restricted by the strength of the pipe in pressure induced forces [7].
A minimum magnitude of the clearances must be satisfied in order to accomplish
safe operation. The clearances must big wide enough so that to allow thermal
expansion of the flow and to provide the appropriate mechanical tolerance that the
shafts need in order to withstand the pressure loads. For this reason the back-to-back
arrangements are preferred since they provide larger clearances.
A maximum number of chambers can be applied. The internal configuration of
twin screw multiphase pumps may vary between the different manufacturers, but they
can’t overcome a specific number of chambers. The restriction arises from the fact that
more chambers require longer shafts and in this case is possible the occurrence of
internal leakages (backflow).
Operational restrictions and limitations of single screw multiphase pumps
The can operate up to a maximum temperature which is dictated by the strength
of the elastomeric material of the stator [41].
The rotational speed of the pump is restricted by the strength of the shaft [41]. As
the rotor rotates it is imposed to dynamic stresses coming from the rotational motion
and the fluid that hits on the shaft. In case of increase of the rotational speed of the
rotor’s shaft, its fatigue increases and limits its mechanical strength.
The volumetric capacity is affected by the number of clearances that are created
between the screw and the stator’s sealing, the rotational speed and the pitch of the
screws [41].
Design of twin screw multiphase pump
The twin screw pumps are characterized by two flow rates: the theoretical and the
actual. The actual flow rate Qa is measured with multiphase flow meters. It is
influenced by the slip, the backflow of the effluent to the clearances and for this reason
it is different from the theoretical flow rate that the pump can handle. From the flow
rate that enters the pump from the suction side, there is an amount that is not handled
because it is leaked from the internal clearances that exist between the screws and
between the screws and the seal (slip). So, the theoretical flow rate Qth is the
maximum that the pump can handle.
The theoretical flow rate depends on the pump speed and the dimensions of the pump
and is calculated by the following equation [73]:
th a slipQ A h n Q Q

117 | P a g e
Where:
h: pitch of the screws,
n: rotational speed of the pump,
A: net flow cross sectional area of the screws
Design of single screw multiphase pump
The fluid displacement is the fluid volume that is handled in one operating circle [45].
It depends on the geometrical characteristics of the screw and the clearances and it is
calculated by the formula:
4o sV E D L
Where:
D is the rotor’s diameter
Ls is the pitch length of the stator
E is the eccentricity
As for the twin screw pumps, the theoretical flow rate that can be handled by the pump
is decreased due to the backflow losses.
The actual flow rate Qa is calculated by the formula [45]:
a th slipQ Q Q
And the theoretical flow rate Qth is calculated by the formula [45]:
4th sQ E D L n
Where n is the rotational speed of the screw.
8.5. Performance issues in multiphase pumps
8.5.1. Cavitation
Cavitation is a phenomenon that occurs when the pressure of a liquid falls below its
critical pressure and gas bubbles start to appear. In multiphase pumps cavitation is
most likely to occur in the suction side, where low pressures occur or in case of
handling fluids of high volatility. The pressure may decreases because of pressure
losses or because of increase of the velocity of the fluid and thus it is more possible to
occur in dynamic pumps (their operating principle is the increase of the kinetic energy
of the flow) [65].
Initially the phenomenon starts with the formation of small bubbles (incipient cavitation)
which gradually gather and create a slug gas flow, as the pressure continues

118 | P a g e
decreasing. This may happen at any point of the flow. The existence of dissolved air
in the liquid and solids are responsible for the initiation of cavitation.
The phenomenon may become destructive for the structure of the machine and for its
operation. In case that the gas bubbles break, the pressure expansion is big enough
that may harm the blades (the points where the bubbles break are destroyed, not the
points where the bubbles appear).
Cavitation phenomena are more intense in helico-axial pumps as their operation is
similar to centrifugal pumps. The flow pressure start to decrease due to friction when
it enters the suction pipe, as it is indicated in Figure 61. The lowest pressure is met
near the impeller’s eye due to turbulence pressure losses. If the pressure decreases
more than the bubble point pressure, gas bubbles will be created. As the flow goes
near the tip of the blades, the pressure increase and the bubbles collapse, resulting to
cavitation damage (noise, vibration and material loss from the blades).
Figure 61: Pressure variation through the inlet and the impeller of centrifugal pumps [69].
The NPSHA is directly connected with cavitation. As long as the NPSHA has negative
values (NPSHA≤0), the flow pressure decreases below bubble point and gas formation
starts.
In order to avoid cavitation, the pumping system must be designed in a way that:
NPSHA>NPSHR + 0.5m and
NPSHA>0
This means that the pressure at upstream of the pump must be high. The additional
0.5m are proposed as a safety annotation [65]. For this reason the upstream vessels
and flow lines are usually installed at higher elevation levels than the pump. In this way
the upstream flow pressure increases by the hydrostatic pressure component. Another

119 | P a g e
way to keep the suction pressure high enough in order to avoid cavitation is the use of
pipelines with big diameter on the suction side, so that to decrease the friction pressure
drop at this point. In case of centrifugal pumps the suction pressure may be decreased
by decreasing the flow rate.
8.5.2. Priming
Priming is a significant issue that influences pump’s ignition and is related to the ability
of the pump to create the necessary pressure drive mechanism on the suction side
when it is put into operation so that to start pumping the effluents. The pumps are
distinguished in self-priming and non-self-priming pumps. Self-priming pumps have the
ability to pump when they ignite, the air that is initially placed in the suction pipeline
and the effluents. Non-self-priming pumps need to be filled with liquid in order to start
pumping the effluents.
In case that the pump is non-self-priming the pressure at the suction side must be
controlled in order to avoid losing of prime.
Centrifugal and Helico-axial pumps (non-self-priming)
Helico-axial pumps’ operation is similar to centrifugals’ and they are non-self-priming.
From their ignition centrifugal pumps operate according to the principle of increasing
the kinetic energy of the flow and then transforming it into pressure increase. The
increase of the kinetic energy of the fluid is accomplished by the movement of the
impeller’s blades. When the shaft starts to rotate the impeller also rotates
counterclockwise and the air that is initially occupying the suction pipeline is getting
into the pump’s passageways [74]. This amount of air must be removed in order to
start the fluid pumping.
Each pump is constructed to operate at a specific speed, so the lighter is the effluent,
the less will be the kinetic energy that will be induced to the fluid. Since air is about
1/600 times less dense than oil, the impeller needs to rotate at a high speed, but it is
constructed to operate at lower speed in order to pump the oil [74]. So the pump may
not be able to remove the air and it will get stuck inside the pump and the pump won’t
be able to operate (loss of “prime”). The problem is enhanced when the static suction
head is high, in case of installation of the pump at a higher elevation level than the
reservoir.
In order to overcome this, before the ignition of the pump, the liquid must be inserted
to the pump, so that to create the pressure difference that is needed when the pump
will start operation. This may be achieved by the following ways [74]:

120 | P a g e
Installation of foot (non-return) valve in the suction line: it’s a valve installed at the
bottom of the suction line and it closes when the pump stops, so liquid remains in the
suction line.
Installation of priming tanks: they are tanks installed between the suction side of
the pump and the reservoir. They store liquid, so that when the pump ignites the liquid
is directly guided through them to the pump’s inlet.
Installation of priming inductor: through them liquid is entering to the suction line.
Installation of vacuum providing devices such as dry and wet vacuum pumps and
ejectors.
Centrifugal and Helico-axial pumps (self-priming)
In order for the centrifugal pumps to be self-primed, an amount of liquid is always
retained in the casing or in an accessory-priming chamber. When the pump starts, the
impeller starts rotating and creates a vacuum which is filled with air from the suction
side. This amount of air is mixed with the liquid that enters the pump. The air-liquid
mixture is guided to the air separation chamber within the casing, where the air is
separated and expelled to the discharge side. Since the air is lighter than the liquid,
they will separate, so the liquid will return to the priming chamber and the air is guided
to the atmosphere through the air release line. By this procedure is implemented the
self-priming of the pumps, until all of the air from the suction side has been expelled
and prime has been established [75].
Priming assurance can be achieved through the following [75]:
In the priming chamber should exist adequate liquid.
For outdoor and remote installations a heating element may be required to prevent
freezing.
In case of solids in the fluid, a strainer may be required so that to prevent the solids
entrance to the priming chamber. If the eye of the impeller is plugged with solids the
capability of the impeller to create a low-pressure area will be reduced.
All the piping connections at the suction side should be sealed, in order to prevent
the entrance of air (no air leak in the suction line).
The time needed for priming should be minimized so that to avoid vaporization of
the liquid in the priming chamber.
Installation of a bypass priming line may be needed so that to prevent the creation
of a backpressure in the discharge side during priming.
The design of the suction side of the pump should not allow air entrapment.

121 | P a g e
Positive displacement pumps (self-priming)
Positive displacement pumps do not need help to be primed because the working
principle is not based on energy transfer from the shaft to the fluid but on the
mechanical displacement of the fluid. The characteristic of self-priming gives them the
ability of dry running operation when they start to operate, meaning to run without liquid
presence in the flow.
Self-priming is achieved due to the backflow internal leakage. Because of the
backflows, the pump’s chambers maintain always an amount of liquid and they don’t
lose prime.
8.5.3. Gas locking
Gas locking is referred to the flow blockage or stop that may occur due to high gas
content in the suction side of the pump. In case of high gas content in the flow and
high flow rates, the gas may accumulate and create gas pockets. The gas pockets that
may appear in multiphase pumps are not always bad. In the twin screw pumps, gas
pockets are developed between the screws clearances and in the helico-axial pumps
as a result of the phase separation due to the centrifugal forces that are imposed to
the flow. They are not creating problems in the flow as long as the liquid flow is not
blocked, which occurs when the GVF becomes very high.
High gas content at the suction side of the pump may appear under the following
possible conditions:
When the suction pressure is low enough (less than the bubble point pressure) due
to high friction losses or high flow velocities in the upstream pipeline and consequently
dissolved gas is released.
When the pressure in the upstream pipe is lower than the atmospheric pressure
(vacuum piping pressure), in case of gaps at the sealing of the pump, ambient air will
entrain through them.
When the minimum static head at zero flow rate is large [41].
Gas starts to accumulate at the suction side of the pump, where low pressures are met
and finally they may coalescent (gas pockets). Consequently, the flow obstacles are
increased (head) as well as the NPSHR increases and this may result to complete
blockage of the liquid flow and.
Multiphase submersible pumps are considered as the best option in case of extremely
high differential pressure in the well.

122 | P a g e
Figure 62: Gas pockets configuration in slug flow [40].
8.6. Multiphase pumps operation in series and in parallel
The efficiency of the pumping system that results from the combination of two or more
pumps in series or in parallel is the same with the efficiency of one pump. The pumps
can be driven by one motor all together all each one separately. The arrangement of
the hydraulic connection of the pumps may combine more than one groups of pumps
connected in series with more than one groups of pumps connected in parallel.
In series operation
In series installation of the pumps corresponds to the hydraulic connection of the
pumps so that the same flow rate to pass through them and the result will be the
increase of the dynamic head that they can handle. The overall operating point is
shifted to greater differential pressures, while each pump is operating within her
performance envelope.
The rotational speed of the pumps in series must be controlled in order to avoid
instabilities [41]. As the flow passes through the first pump, the volumetric flow rate
decreases and if it falls below the surge limit, the pressure in the suction side of the
next pump may increase more than the value that it can handles. So by controlling the
rotational speed of the intermediate pump, are prevented excessive pressure
fluctuations.
In parallel operation
In parallel installation of the pumps corresponds to the hydraulic connection of the
pumps so that the flow rate that can pass through will be the summation of the flow
rate each one can handle, while the dynamic head will remain the same.
8.7. Comparison of multiphase pumps
The main differences between the two different categories of multiphase pumps
(helico-axial and positive displacement with screws) are the following [54]:

123 | P a g e
Positive displacement pumps provide constant flow rate for a given rotational speed
at one working cycle, regardless the discharge pressure
When a PDP operates under constant rotational speed, the screw clearances keep
creating the gap cells with the same frequency. So the clearances are “trapping” and
displacing a specific amount of flow, which is gathered in the gap cells. If the speed
changes the volumetric flow rate will also change because the speed of displacement
will also change. So the flow rate that all the positive displacement pumps handle
doesn’t depend on the discharge pressure, but only on the volume of the screw
clearances and its rotational speed.
On the other hand the flow rate that all the helico-axial pumps can handle depends on
the impeller’s size, the rotational speed and the total head that the pump needs to
overcome.
Positive displacement pumps tend to have lower capacity than the rotodynamic [7]
Positive displacement pumps are used when the flow rate that the pumps must handle
is low or moderate and the discharge pressure must be high.
Progressive cavity pumps can handle only very low flow rates because they are
restricted by the small size of the clearances between the screw and the sealing of the
pump.
Helico-axial pumps are used for the handling of large flow rates under low or moderate
differential pressure but they are not suitable for handling low flow rates under high
pressure [8]. This limitation is connected with the energy conservation principle in
helico-axial pumps. The pressure they can deliver is connected with the head losses.
Operation under high pressure means that the flow velocity and the flow rate will be
low, the impeller diameter will be high and consequently, a pump of bigger size will be
needed and the mechanical losses will be increased.
On the other hand operation of helico-axial pumps at low flow rates induces vibrations
due to internal flow re-circulations (backflows), high-temperature rises and possible
surge behavior, that may damage the pump [41].
In Figure 63 are presented the different operational envelopes for the four main
categories of multiphase pumps. The envelopes indicate the ranges of the possible
pressure boost that each pump may give to the flow and the range of the total flow
rates that each pump can handle. The data for the pressure boost and the handling
flow rates are based on published information from pump manufacturers [62].

124 | P a g e
Figure 63: Multiphase pump’s operational envelope [62]
Corrosion tolerance
Positive displacement pumps are more prone to corrosion than the rotodynamic [7].
Solids tolerance
Positive displacement pumps tend to have higher tolerance in the existence of solids
in the flow than the rotodynamic [7]
Gas Volume Fraction
Positive displacement pumps are less affected by changes in GVF, Suction Pressure and
Differential Pressure than the rotodynamic [7]. However both twin screw and helico-axial
multiphase pumps can handle flows with high GVF.
Fluid viscosity
High viscosity fluids are better handled by positive-displacement pumps. In helico-axial
pumps the increase of flow viscosity leads to the increase of the friction pressure losses,
so the friction head is increased and the total pump’s head is decreased [8].
Differential pressure
The differential pressure is the pressure that is created between the discharge and the
suction side of a pump.
In helico-axial pumps the differential pressure depends on the mixture’s density [42]. This
means that the pump adjusts its operating characteristics (rotational speed) and changes
the discharge pressure, according to the variations of mixture’s density in the inlet of the
pump that cause pressure variations.

125 | P a g e
Table 11: Operational characteristics for different types of multiphase flow boosting systems (the jet pumps are operating only in single phase flow but they appear in the table for comparison reasons.).

126 | P a g e
9. Simulation and Results
9.1. Simulation
Description of the case
In the present work the replacement of a conventional separation system with a surface
multiphase pump is evaluated. The simulation is based on the data presented in the
Example 2a of GAP software from the IPM suite [76].
An offshore oilfield at the Loggie Mill area is considered. It has two reservoirs (A and
B). Each reservoir is drained by three wells which end up to a manifold. Both manifolds
(A and B) are installed on the seabed, around 600ft under the sea level. A flowline of
7.5 km is connecting the manifolds between each other and another one is connecting
Manifold B with the separation facilities. In the conventional production configuration
the effluents from all the six wells are transferred through a 12km pipeline to the
onshore separation facilities.
Figure 64: Field configuration before the multiphase pump installation.
The multiphase pump is installed on the seabed, it boosts the flow and a multiphase
flowline transfers the effluents to the separation facilities onshore.

127 | P a g e
Figure 65: Field configuration after the multiphase pump installation.
Constraints and assumptions
The pressure of the separator is selected to be 200psig, which is a realistic value,
since the pressure at the separator usually doesn’t exceed 500psia.
The liquid capacity of the separator is selected to be limited to 20,000sbbl/day.
The simulation is taking in consideration the ability to control the pressure in the
midstream pipelines, by opening and closing the wellhead chokes at the surface. So it
is assumed that the chokes will not be fully open during all the years of production.
This is achieved by enabling the dP calculation option for each well. Also by this
selection, the simulation can be implemented with main target the optimization of the
production, which can be achieved by changing the status of the chokes with respect
to the constraint of the liquid flow rate that the separation facilities can handle.
Reservoirs and wells data
Since no accurate data about the production effluents composition existed, the black
oil model method was used for the estimation of the fluid properties. For this reason,
the flow assurance issues of wax accumulation and hydrates formation were not
calculated.
Information for the reservoirs is obtained by applying history matching of production
data, according to the material balance method. Production data for the reservoir A
were collected for the period 01/01/2003 up to 22/12/2010 and the volume of the oil
initial in place was estimated 376.952MMsbbl in standard conditions (STOIIP).
Similarly, production data for Reservoir B are available for the period 01/01/2008-
01/12/2010 and the corresponding STOIIP was estimated 238.93MMsbbl. The history

128 | P a g e
matching was implemented with the software package MBAL of the IPM suite and the
output files were used as input for the reservoirs at the GAP software.
Information for the wells is obtained by the output files of the software PROSPER (from
IPM suite), with which the IPR and VLP curves were built.
PVT data
Both reservoirs are oil reservoirs. The main characteristics of the reservoirs as the oil
specific gravity, average reservoir pressure, Gas-Oil-Ratio (GOR) are presented in
Table 12:
Properties Reservoir A Reservoir B
API [o] 37 39
GOR [scf/ sbbl] 800 500
Average reservoir pressure [psig] 3,750.42 3,542.19
Table 12: Main characteristics of the reservoirs.
Reservoir B becomes undersaturated at 01/08/2010 when the reservoir pressure
declines below the bubble point pressure which is Pb=3,500psia. On the other hand
Reservoir A becomes undersaturated earlier at 01/05/2010. The pressure keeps
declining after production starts, due to depletion.
Figure 66: Reservoir pressure declination during production for both reservoirs.
Flowline data
In GAP simulation package the distance between the reservoirs and the wells are not
taken into account, because they are governed by the VLP curves which are estimated
by the PROPSER simulation package they have been inserted in GAP for the wells’
description.

129 | P a g e
The flowlines that are taken into consideration are the ones that connect each well with
the corresponding manifold, the flowline that interconnects the two manifolds as well
as the flowline that connects manifold B with the midstream facilities.
All the flowlines have 0.0006in roughness. The rest of their dimensions are given to
the Table 13 for the conventional system without the MPP and for the system with the
MPP.
Pipe Segment
Length
[km]
Pipe
ID
[in]
Upstream
TVD
[ft]
Downstream
TVD
[ft]
WH1A to ManifoldA 1 6 600 600
ManifoldA to ManifoldB 7.5 8 600 525
Before the
MPP
installation
ManifoldB to Sep Joint 3 12 525 0
ManifoldB to Sep Joint 4 12 515 525
ManifoldB to Sep Joint 3 12 480 515
ManifoldB to Sep Joint 2 12 525 480
After the
MPP
installation
ManifoldB to Pump Joint 0.050 12 600 525
Intermediate Joint to Sep Joint 3 12 525 0
Intermediate Joint to Sep Joint 4 12 515 525
Intermediate Joint to Sep Joint 3 12 480 515
Intermediate Joint to Sep Joint 2 12 525 480
Table 13: Flowline dimensions before the MPP installation.
The flow in the pipelines is considered to be multiphase. The pressure drop is
calculated using the “Petroleum Experts 5” correlations, as it is recommended by the
GAP software.
Pump data
The pump that was selected is a multiphase helicoaxial type pump manufactured from
the company OneSubsea. The pump has 12 stages and its name is H300/105. The
minimum flow rate that can handle is 9,056.6bbl/d and the maximum capacity is
72,452.8bbl/d, while the maximum differential pressure that can be ontained is
1,522.9psi. The discharge pressure of the pump is calculated 345psia and its optimum
power 753HP.

130 | P a g e
Figure 67: Pump’s data and characteristic curves for different speeds.
Prediction results for the conventional system
A prediction simulation was run for the period from 01/12/2010 up to 10 years later
until 01/12/2020 (3,653 days in total) with a time step of 6 months. The prediction was
ran with the target of optimization of the oil production taking into consideration the
constraint of the maximum daily liquid rate that the separator can handle. The
simulation is taking into consideration the ability of optimizing the production by
alternating the opening and closing of the surface chokes.
The results of the simulation are the following:
A. Increase of the oil recovery
The oil recover from Reservoir A is increased by 0.5% and from Reservoir B by 1%
Figure 68: Oil recovery from both reservoirs before and after installation of the MPP.

131 | P a g e
B. Cumulative production before and after the integration of the MPP
By installing a multiphase pump the cumulative oil production in the period of 10 years
between 1/12/2010 until 1/12/2020, increases by 20%. Specifically the cumulative oil
production for the conventional system is approximately 29.5MMsbbl/day and after
installing the multiphase pump, it increases to 35.4MMsbbl/day.
Table 14: Cumulative production flow rates and GOR at the separator at 01/12/2020 before and after
installation of the MPP.
Figure 69: Cumulative oil production on the separation facilities before and after installation of the MPP.
Figure 70: Cumulative water production on the separation facilities before and after installation of the MPP.
Production dates
Cumulative Oil
flow rate
[sbbl/day]
Cumulative Gas
flow rate
[MMscf/day]
Cumulative
Water flow rate
[sbbl/day]
GOR
[scf/sbbl]
Before MPP installation 29.484 20,973.40 17.159 660
After MPP installation 35.402 25,257.76 26.958 1,433
Difference +20.07% +20.43% +57.11% +117%

132 | P a g e
C. Oil-Gas-Water-Liquid production rates when the MPP is integrated
The multiphase pump boosts the production from each well. The prediction
calculations start at 01/12/2010. The oil production flow rates from each well up to this
time are summarized in Table 15:
Separator Well1A Well1B Wel2A Well2B Well3A Well3B
Oil flow rate
[sbbl/day] 18,358.2 4,758.4 1,059.3 5,443.8 1,085.3 4,789.3 1,222
Table 15: Oil production flow rates at 01/12/2010.
The wells that are connected to the Reservoir B are more influenced by the installation
of the MPP. Their oil production is increased more than 70% for Well 1B, 55% for Well
2B and 30% for Well 3B. Well 1A is depleted on 1/12/2019 when the oil flow rate that
is produced is becoming zero as it is shown in Figure 72. With the installation of the
MPP the production curves over time are shifted upwards. As it is observed from the
Figures 71 and 72 the oil rates increase and the life of the wells 3A, 2B and 3B are
elongated.
Figure 71: Oil production rates from each well before the installation of the MPP.

133 | P a g e
Figure 72: Oil production rates from each well after the installation of the MPP.
As the production continues the reservoirs get depleted so the production flow rates,
as they are measured at the separation facilities, decrease. However the water
production increases, which indicates the depletion. Also the GOR increase, which
means that more gas will be produced for every barrel of oil that is produced. Since
the API has not changed significantly, the increase of GOR also indicates the
depletion, meaning that the reservoir gets drained of oil. The production flow rates and
the effluents characteristics for the scenario of MPP placement are presented in Table
16.
Production
dates
Oil
flow rate
[sbbl/day]
Gas
flow rate
[MMscf/day]
Water flow
rate
[sbbl/day]
Liquid flow
rate
[sbbl/day]
API GOR
[scf/sbbl]
Water
cut
[%]
01/12/2010 18,358.2 13.677 1,646.6 20,004.8 37.36 744.98 8.23
01/12/2020 2,897 4.152 6,844 9,941 37.93 1,433.22 70.26
Table 16: Production flow rates at the separator at the beginning and the end of prediction dates, for the
case of MPP installation. (The Liquid flow rate exceeds the constraint of 20,000sbbl/day, but this is not
an actual increase but it is correlated to the software simulation calculations).
9.2. Conclusions
Remarks on the results
The integration of the multiphase pump (MPP) in the midstream facilities right after the
wellhead, is beneficial and delivers the purposes for the production enhancement.
This simulation used a pump that actually was much oversized for the needs of the
field. On 01/12/2010, when the pump’s operation started the oil production was
approximately 18,358.2sbbl/day. The minimum flow rate that the pump can handle is
9,000bbl/day, which is reached almost 4.5 years after its operation (approximately on
May 2014). This means that after this date the pump is not actually boosting the
production. So it is an oversized pump, which was intentionally selected from the
database of the software and used only for academic purposes, in order to emphasize
to the benefits of MPPs use. The simulation results show an average pump’s efficiency
of about 30%, which is very low.
However, the simulation shows that even in case of using an oversized multiphase
pump which doesn’t operate at the optimum operation or maximum efficiency point, it
comes up with an increase of 20% of the oil production.

134 | P a g e
Figure 73: Oil production rate after the installation of the MPP.
General
The installation of a multiphase pump enhances the oil recovery. The gas and oil
production increase, as well as the water cut, because the reservoirs reach to their
depletion.
The selection of the appropriate pump follows some technical rules relevant to the
characteristic curves of each pump. Normally the optimum operating range is between
± 10% of their maximum efficiency point. Pumps are usually oversized in order to cover
possible changes in the future production, which means that are imposed to operate
outside of their optimum efficiency range. According to the simulation that was
implemented in this thesis, it seems that even in case of a “bad design, they are quite
beneficial.
The minimum 20% increase of the cumulative oil production in the 10 years of
operation of the MPPs are interpreted in big financial profits. Assuming 40$/bbl, the
gross benefit will be approximately 288million $. The total financial benefits from the
elimination of single phase flowlines and their equipment are additional cost minimizer
parameters.
The installation cost, the limited installations, hands-on experience and knowledge
about multiphase pumps operation are the biggest obstacles for the wider
implementation of these applications.

135 | P a g e
10. References
[1] W. L. L. Thomas O. Miesner, Oil and Gas Pipelines in Nontechnical Language,
PennWell Corporation, 2006.
[2] E. Solbraa, "Flow Control in Oil/Gas Wells and Pipelines," 2003.
[3] "www.halliurton.com," [Online]. Available: http://www.halliburton.com/en-
US/ps/solutions/mature-fields/default.page?node-id=hgjyd46l. [Accessed 02 05
2017].
[4] D. P. S. Kumar, "Accelerate your brown field production at low cost," in 9th
Biennial International Conference & Exposition on Petroleum Geophysics,
Hyderabad, 2012.
[5] D. O. Bratland, Pipe Flow 2: Multi-phase Flow Assurance, 2013.
[6] T. Y. Dukler A.E., "A Model for Predicting Flow Regime Transitions in Horizontai
and Near Horizontal Gas-Liquid Flow," vol. 22 , no. 1, January 1976.
[7] B. Exploration, Multiphase Design Manual: A reference manual of design
methods for multiphase oil and gas production systems, 1994.
[8] W. H. A. Hassan M. Badr, Pumping Machinery Theory and Practice, John Wiley
& Sons, Ltd, 2015.
[9] N. M. G. N. Anca Baciu, "Example for Determination of the Phase Inversion
Point," Bucureşti, 2008.
[10] [Online]. Available: http://petrowiki.org/Oil_emulsions. [Accessed 10 12 2016].
[11] K. O. M. M. O. S. J. B. S. Arirachakaran, "An Analysis of Oil/Water Flow
Phenomena in Horizontal Pipes," Oklahoma, March 13-14 1989.
[12] D. B. P. Doron, "Flow pattern maps for solid-liquid flow in pipes," International
Journal of Multiphase Flow, vol. 22, pp. 273-283, 1996.
[13] D. B. P. Doron, "A three-layer model for solid-liquid flow in horizontal pipes,"
International Journal of Multiphase Flow, vol. 19, no. 6, pp. 1029-1043, 1993.
[14] H. Q. S. C. Zhang, "Unified Modeling of Gas/Oil/Water-Pipe Flow – Basic
Approaches and Preliminary Validation.," Dallas., 2006.
[15] K. E. Kee, "A Study of Flow Patterns and Surface Wetting in Gas-Oil-Water Flow,"
2014.
[16] A. W. Jamieson, "Recent experience on implementation of new techniques of gas
metering," in Norflow seminar, 1999.
[17] "Method sizes multiphase-flow gathering lines," Oil & Gas Journal, July 1999.

136 | P a g e
[18] H. M. James P. Brill, Multiphase Flow in Wells, Richardson, Texas: Society of
Petroleum Engineers Inc., 1999.
[19] L. C. A. U. M. O. Maria del Carmen Garcia, "Paraffin deposition in oil production
oil composition and paraffin inhibitors activity," Petroleum Science and
Technology, vol. 16, no. 9 & 10, pp. 1001-1021, 1998.
[20] A. S. Anand Gupta, "Need of Flow Assurance for Crude Oil Pipelines: A Review,"
International journal of multidisciplinary sciences and engineering, vol. 6, no. 2,
pp. 43-49, February 2015.
[21] J. R. Ahmed Hammami, "Precipitation and Deposition of Asphaltenes in
Production Systems: A Flow Assurance Overview," in Asphaltenes, Heavy Oils,
and Petroleomics, vol. 23, Springer Science + Business Media LLC, 2007, pp.
617-660.
[22] "Formation damage from paraffins and asphaltenes," [Online]. Available:
http://petrowiki.org/Formation_damage_from_paraffins_and_asphaltenes.
[Accessed 14 12 2016].
[23] L. d. B. S. J. .. G. M. A. Hirschberg, "Influence of Temperature and Pressure on
Asphaltene Flocculation," Society of Petroleum Engineers Journal, vol. 24, no. 3,
pp. 283-293, 1984.
[24] J. R. Becker, Crude Oil Waxes, Emulsions,, PennWell Corporation, 1997.
[25] D. E. P. F. A. J. G. K. Mike Crabtree, "Fighting scale - Removal and prevention,"
Oilfield Review, vol. 11, no. 3, 1999.
[26] H. M.-S. M. J. A. S. J. Moghadasi, "Scale deposits in porous media and their
removal by EDTA injection," in Proceedings of 7th International Conference on
Heat Exchanger Fouling and Cleaning - Challenges and Opportunities,, Portugal,
2007.
[27] J. S. Gudmundsson, "Cold Flow Hydrate Technology," in 4th International
Conference on Gas Hydrates, Yokohama, 2002.
[28] J. Ø. T. Cem Sarica, "A New Technique to Eliminate Severe Slugging in
Pipeline/Riser Systems," in 2000 SPE Annual Technical Conference and, Dallas,
Texas, 2000.
[29] P. D. Z. Y. Simon Pedersen, "Challenges in slug modeling and control for offshore
oil and gas productions: A review study," International Journal of Multiphase Flow,
vol. 88, pp. 270-284, 14 September 2016.

137 | P a g e
[30] T. Hill, "Gas injection at riser base solves slugging flow problems," Oil and Gas
Journal, vol. 88, no. 9, January 1990.
[31] A. M. A. M. Okonkwo Paul C., "Erosion-Corrosion in oil and gas industry: a
review," International Journal of Metallurgical & Materials Science and
Engineering (IJMMSE), vol. 4, no. 3, pp. 7-27, 7-28 June 2014.
[32] A. S. G. G. K. L. B. G. A. S. B. Lekan Taofeek Popoola, "Corrosion problems
during oil and gas production and its mitigation," International Journal of Industrial
Chemistry, pp. 1-15, 2013.
[33] R. E. A. H. D. H. S. M. T. S. Denis Brondel, "Corrosion in the Oil Industry," Oilfield
Review, vol. 6, no. 2, pp. 4-18, 3 1 1994.
[34] "Erosion," [Online]. Available: http://www.oilfieldwiki.com/wiki/Erosion. [Accessed
19 12 2016].
[35] E. V. M.M. Salama, "Evaluation of API RP 14E Erosional Velocity Limitations for
Offshore Gas Wells," in Offshore Technology Conference, Houston, Texas, 1983.
[36] R. D. B. D. P. M. Y. Z. E. G. J. D. F. Guruprasad Kulkarni, "Sand erosion
experiments and model development for UNS N06625 cladding and UNS
S32750," in Offshore Technology Conference, Houston, Texas, 2012.
[37] L. A. I., "Fluids handling lectures," National Technical University of Athens.
[38] K. L. S. H. K. H. Z. R. K. T. Guoqing Han, "Simulation of Multiphase Fluid-Hammer
Effects During Well StartUp and Shut-In," Oil and Gas Facilities, vol. 2, no. 6, pp.
68-77, September 2013.
[39] S. Ord, "Preventing Water Hammer from Damaging Pumps and Pipes," 10
October 2011. [Online]. Available: http://empoweringpumps.com/preventing-
water-hammer-from-damaging-pumps-and-pipes/. [Accessed 30 12 2016].
[40] A. Jäschke, "General Overview and Multiphase Boosting - Twin Screw
Technology," in Calgary Pump Symposium 2013, 2013.
[41] D. S. F. J. D. S. Falcimaigne J., "Multiphase Production: Pipeline Transport,
Pumping and Metering," 2008.
[42] J. B. Y. C. P. P. R. V. J. Falcimaigne, "Multiphase Pumping: Achievements and
Perspectives," Oil & Gas Science and Technology, vol. 57, no. 1, pp. 99-107,
2003.
[43] H. H. Al-Khalifa, Saudi Aramco SAOO, S. Peeran, Caltec Ltd UK, V. S.
Koleshwar, Saudi Aramco, "Successful Utilization of Surface Jet Pumps at Gas-

138 | P a g e
Oil Separation Plants," in International Exhibition and Conference, Abu Dhabi ,
2015.
[44] C. Carpenter, "Surface Jet Pumps to Enhance Production and Processing,"
Journal of Petroleum Technology, pp. 134-136, November 2014.
[45] C. Henri, Well production practical handbook, Technip, Ed., Paris: Institut
Francais du Petrole, 2000.
[46] N. B. Sacha Sarchar, "Production Enhancement and Assurance Using Surface
Jet Pump Technology," in SPE Middle East Oil & Gas Show and Conference,
Bahrain, 2015.
[47] Dr. Najam Beg, Caltec, "The applications of Surface Jet Pump technology to
increase Oi l& Gas production".
[48] D. N. B. S. S. Syed M. Peeran, "Novel Examples of the use of Surface Jet Pumps
(SJP) to Enhance Production and Processing: Case Studies and Lessons
learned," in SPE Middle East Oil and Gas Show and Conference, Bahrain, 2013.
[49] Gerhard Rohlfing, Bornemann GmbH, "The Research & Development Path of the
Multiphase Pump Technology," in 2nd International EMBT Conference, 2009.
[50] M. Dixon, "Deepwater subsea boosting planning and application move ahead,"
Offshore, 5 1 2012.
[51] B. S. C. d. M. J. d. S. A. J. P. D. H. B. Paul Cooper, "Tutorial on multiphase gas-
liquid pumping," in 13th International Pump users Symposium.
[52] Haakon J. Grimstad-Framo Engineering AS, "Subsea Multiphase Boosting-
Maturing technology Applied for Santos Ltd's Mutineer and Exeter field," in SPE
Asia Pasific Oil and Gas Conference and Exhibition, Perth, Australia, 2004.
[53] Arne B. Olsen-OneSubsea, "Optimize from pore to process-20 Years of Subsea
Boosting Technology Development," in MCE Deepwater development, Madrid,
Spain, 2014.
[54] J. d. S. M. C. V. A. Pershukov, "Multiphase Pumps for 250,000 bbl/D Field
Development," in SPE Annual Technical Conference and, New Orleans,
Louisiana, 2001.
[55] I. J. Rafael Lastra, "Feasibility Study on Application of Multiphase Pumping
Towards Zero Gas Flaring in Nigeria," in 29th Annual SPE International Technical
Conference and Exhibition, Abuja, Nigeria, 2005.
[56] J. F. Gülich, Centrifugal Pumps, 2nd ed., Springer-Verlag Berlin Heidelberg,
2010.

139 | P a g e
[57] "http://www.sulzer.com/," 11 2014. [Online]. Available:
http://www.sulzer.com/el/Products-and-Services/Pumps-and-
Systems/Multiphase-Pumps. [Accessed 10 1 2017].
[58] Pump handbook, Grundfos Management A/S, 2004, pp. 1-160.
[59] R. K. A. P. J. X. S. S. S. S. O. Gerald L. Morrison, "Experimental Investigation of
Wellhead Twin-Screw Pump for Gas-Well Deliquefication," in SPE Annual
Technical Conference and Exhibition, San Antonio, Texas, USA, 2012.
[60] S. Olson, "Multiphase Pumps Solve Liquid Loading," The American Oil & Gas
Reporter, May 2006.
[61] G. A. R. L. S. J. Dolan J. P., "Development of a Twin-Screw Pump for Multiphase
Duties," SPE Production Engineering, pp. 629-632, November 1988.
[62] S. L. Scott, "Multiphase pumping addresses a widerange of operating problems,"
Oil & Gas Journal, 29 9 2003.
[63] B. Nesbitt, Handbook of Pumps and Pumping, Elsevier in association with Roles
& Associates Ltd, 2006.
[64] Thomas Boehme, NETZSCH Pumps & Systems GmbH, "Progressing Cavity
Pump Applications," in Calgary pump symposium, 2013.
[65] S. o. C. Engineering, Ed., "Elements of mechanical equipment," in Fluid transport
(Lecture notes), National Technical University of Athens.
[66] G. Apostolos, Fundamentals of turbomachinery, Thessaloniki: Giachoudi-
Giapoudi.
[67] in Industrial flow networks (Course lectures), Aristotle University of Thessaloniki,
2009.
[68] E. U. D. o. E. (. I. T. P. Hydraulic Institute, "Variable Speed Pumping-A Guide to
Successful Applications," 2004.
[69] J. Chaurette, Pump System Analysis and Sizing, 5th ed., Fluide Design Inc, 1994.
[70] "Some Effects of Operating Pumps Away from Best Efficiency Point," 20 2 2013.
[Online]. Available: http://empoweringpumps.com/some-effects-of-operating-
pumps-away-from-best-efficiency-point/. [Accessed 3 3 2017].
[71] Daniel Kernan, ITT, "Pumps 101: Operation, Maintenance and Monitoring
Basics," [Online]. Available:
https://www.gouldspumps.com/ittgp/medialibrary/goulds/website/Literature/Whit
e%20Papers/ITT_white_paper_Pumps_101_Operation_Maintenance_and_Mon
itoring_Basics.pdf?ext=.pdf. [Accessed 3 3 2017].

140 | P a g e
[72] B. D. Cruz, "Session One: Pump Characteristics and ISO Efficiency Curves," in
PUMPS: Maintenance, Design, and Reliability Conference, 2009.
[73] G. F. C. T. G. L. M. Gong Hua, "Comparison of Multiphase Pumping Technologies
for Subsea and Downhole Applications," in SPE Annual Technical Conference
and Exhibition, Denver, 2012.
[74] M. P. J. C. P. H. C. T. J. C. Karassik J. Igor, Pump Handbook, third ed., The
McGraw-Hill Companies, Inc, 2001, pp. 1-1789.
[75] "www.labourtaber.com," LaBour Pump Company, 2005. [Online]. Available:
http://www.labourtaber.com/Self-Priming%20Pumps%20Guidelines.pdf.
[Accessed 10 1 2017].
[76] P. Experts, User Manual of GAP (IPM), 10 ed., Petroleum Experts Limuted, 2014.
[77] S. R. M. B. S. N. Kok Eng Kee, "Flow Patterns and Water Wetting in Oil-Water
Two Phase Flow – A Flow Loop Study," San Antonio, Texas, USA, 2014.
[78] S. S. H. Sümer M. Peker, Solid-Liquid Two Phase Flow, First ed., Elsevier B.V.,
2008, p. 534.
[79] "Asphaltenes and waxes," [Online]. Available:
http://petrowiki.org/Asphaltenes_and_waxes. [Accessed 13 12 2016].
[80] D. S. S. Shippen Mack, "Multiphase Pumping as an Alternative to Conventional
Separation, Pumping and Compression," in 34th PSIG Annual Meeting, Portland,
Oregon, 2002.
[81] "http://www.grpumps.eu/," Gorman-Rupp Company, [Online]. Available:
http://www.grpumps.eu/educationsafety/education. [Accessed 18 7 2016].
[82] P. P., "Hydraulics, Closed pipes (Lectures)," Aristotle University of Thessaloniki.
[83] "Enhanced Oil Recovery (EOR) Summary," [Online]. Available:
http://www.scmdaleel.com/category/enhanced-oil-recovery-eor-summary/164.
[Accessed 2 5 2017].