prevalence of noncommunicable disease risk factors...
TRANSCRIPT

PREVALENCE OF NONCOMMUNICABLE
DISEASE RISK FACTORS AMONG KANI
TRIBE IN THIRUVANANTHAPURAM
DISTRICT, KERALA
PRIYANKA.S
Dissertation submitted in partial fulfillment of the requirements for the
award of the degree of Master of Public Health.
ACHUTHA MENON CENTRE FOR HEALTH SCIENCE STUDIES,
SREE CHITRA TIRUNAL INSTITUTE FOR MEDICAL SCIENCES AND
TECHNOLOGY.
Thiruvananthapuram, Kerala.
October 2014

i
ACKNOWLEDGEMENT
I would like to express my deepest gratitude to my guide, Dr.Biju Soman for his endless support
and overall guidance. I hereby take immense pleasure to thank Dr. TG Vinod Kumar, Scientist,
Jawaharlal Nehru Tropical Botanic Garden and Research Institute (JNTBGRI), Palode for his
invaluable motivation and guidance throughout the course of this work.
I am grateful to Dr.VR.Raman Kutty for the technical support and suggestions. I would like to
express my sincere thanks to Dr.TK.Sundari Raveendran, Dr.P Sankara Sarma, Dr.Ravi Prasad
Varma, Dr.KR Thankappan, Dr.Mala Ramanathan, Dr.K Srinivasan and Dr.Manju R Nair and
Ms.VT Jissa, Faculty, AMCHSS for their priceless suggestions.
My sincere thanks to Kerala State Science, Technology and Environment for granting research
fund for this study. I would like to thank Integrated Tribal Development Project (ITDP),
Thiruvananthapuram for their co-operation.
My special gratitude to Mr.Bhuvanachandran, Ms.Vijaya Kumari and Mr.Sreedharan for their
priceless help and motivation throughout the data collection period. I would like to extend my
gratitude to Ms.Lekshmikutty from Mottammood settlement for all her help and guidance even
from the initial stage of this work and thereafter. I also wish to thank Ms.Bindhu from Valiyakala
settlement, Ms.Krishnamma from Manithooki settlement, Ms.Chandrika from Cherumanali
settlement and Mr.AadichanKani from Kochukilikodu settlement and Mr.Makku from
Chathankodu settlement who helped me to reach some of the difficult to access areas of the forest
for data collection.
There are no words to express thanks and gratitude to my family- Mr.Mukesh, Ms.Geetha Bai,
Mr.Adarsh and Ms.Megha for being a great support throughout, especially during data collection
period. Once again I thank each and every soul specially my colleagues and seniors who
supported me throughout this work.

ii
DECLARATION
I hereby declare that this dissertation titled “PREVALENCE OF NON
COMMUNICABLE DISEASE RISK FACTORS AMONG KANI TRIBE IN
THIRUVANANTHAPURAM DISTRICT, KERALA” is a bonafide record of my
original field research. It has not been submitted to any other university or institution for
the award of any degree or diploma. Information derived from the published and
unpublished work of others has been duly acknowledged in the text.
PRIYANKA.S,
Achutha Menon Centre for Health Science Studies,
Sree Chitra Tirunal Institute for Medical Sciences and Technology,
Thiruvananthapuram, Kerala.
October 2014.
iii
CERTIFICATE
Certified that the dissertation entitled “PREVALENCE OF NON
COMMUNICABLE DISEASE RISK FACTORS AMONG KANI TRIBE IN
THIRUVANANTHAPURAM DISTRICT, KERALA” is a record of the research work
undertaken by Ms. PRIYANKA.S in partial fulfillment of the requirements for the award
of the degree of “Master of Public Health“ under my guidance and supervision.
Dr. BIJU SOMAN,
Additional Professor,
Achutha Menon Centre for Health Science Studies,
Sree Chitra Tirunal Institute for Medical Sciences and Technology,
Thiruvananthapuram, Kerala.
October 2014.

iv
I dedicate this work to the Kanikaran tribe.
v
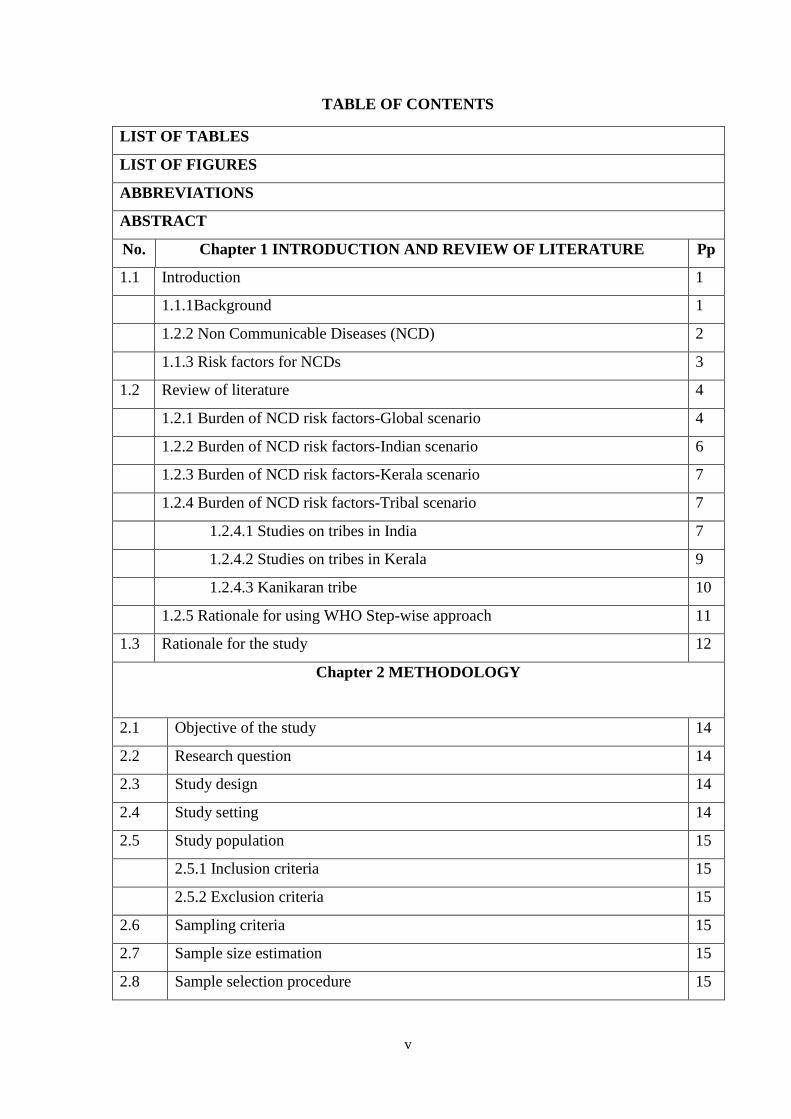
TABLE OF CONTENTS
LIST OF TABLES
LIST OF FIGURES
ABBREVIATIONS
ABSTRACT
No. Chapter 1 INTRODUCTION AND REVIEW OF LITERATURE Pp
1.1 Introduction 1
1.1.1Background 1
1.2.2 Non Communicable Diseases (NCD) 2
1.1.3 Risk factors for NCDs 3
1.2 Review of literature 4
1.2.1 Burden of NCD risk factors-Global scenario 4
1.2.2 Burden of NCD risk factors-Indian scenario 6
1.2.3 Burden of NCD risk factors-Kerala scenario 7
1.2.4 Burden of NCD risk factors-Tribal scenario 7
1.2.4.1 Studies on tribes in India 7
1.2.4.2 Studies on tribes in Kerala 9
1.2.4.3 Kanikaran tribe 10
1.2.5 Rationale for using WHO Step-wise approach 11
1.3 Rationale for the study 12
Chapter 2 METHODOLOGY
2.1 Objective of the study 14
2.2 Research question 14
2.3 Study design 14
2.4 Study setting 14
2.5 Study population 15
2.5.1 Inclusion criteria 15
2.5.2 Exclusion criteria 15
2.6 Sampling criteria 15
2.7 Sample size estimation 15
2.8 Sample selection procedure 15

vi
2.8.1 Cluster selection 15
2.8.2 Household selection 17
2.8.3 Subject selection 17
2.9 Data collection process 20
2.9.1 Data collection instrument 21
2.9.2Procedures 22
2.9.2.1 Blood pressure measurement 22
2.9.2.2 Height measurement 23
2.9.2.3 Weight measurement 23
2.9.2.4 Waist circumference measurement 24
2.11 Data storage and analysis 24
2.12 Variables under study 25
2.13 Study definitions 25
2.14 Ethical considerations 30
2.15 Funding 31
Chapter 3 RESULTS
3.1 Baseline characteristics 32
3.1.1Sociodemographic profile 33
3.2 Prevalence of NCD risk factors among Kani tribe 37
3.2.1Tobacco use 40
3.2.2Alcohol consumption 42
3.2.3Fruits and vegetable consumption 45
3.2.4 Physical activity 47
3.2.5 Height, weight, waist circumference and BMI 49
3.2.6Systolic blood pressure, diastolic blood pressure 49
3.2.7 Hypertension 50
3.2.8 Overweight 50
3.2.9 Abdominal obesity 51
3.3 Treatment history of chronic diseases 52
3.4 Awareness treatment and control of hypertension 53

vii
3.5 History of chest pain on exertion 55
3.6 History of cervical cancer screening 55
3.7 Combined risk 55
3.8 Results of bivariate analysis 56
3.9 Results of multivariate analysis for Hypertension 59
Chapter 4 DISCUSSION AND CONCLUSION
4.1 Characteristics of the sample and the Kani tribal context 61
4.2 Profile of NCD risk factors 62
4.2.1Tobacco use 62
4.2.2Alcohol consumption 64
4.2.3Fruits and vegetable consumption 65
4.2.4Physical activity 65
4.2.5 Overweight and abdominal obesity 66
4.2.6 Hypertension 67
4.2.7 Combined risk 69
4.3 History of cervical cancer screening 69
4.4 Strengths of the study 70
4.5 Limitations of the study 70
4.6 Conclusions 71
4.7 Implications 72
REFERENCES
No. APPENDICES
I Written consent form in English
II Questionnaire in English
III Written consent form in Malayalam
IV Questionnaire in Malayalam
V Standards of measurement-WHO Show cards
VI Ethical clearance document, IEC, SCTIMST
viii
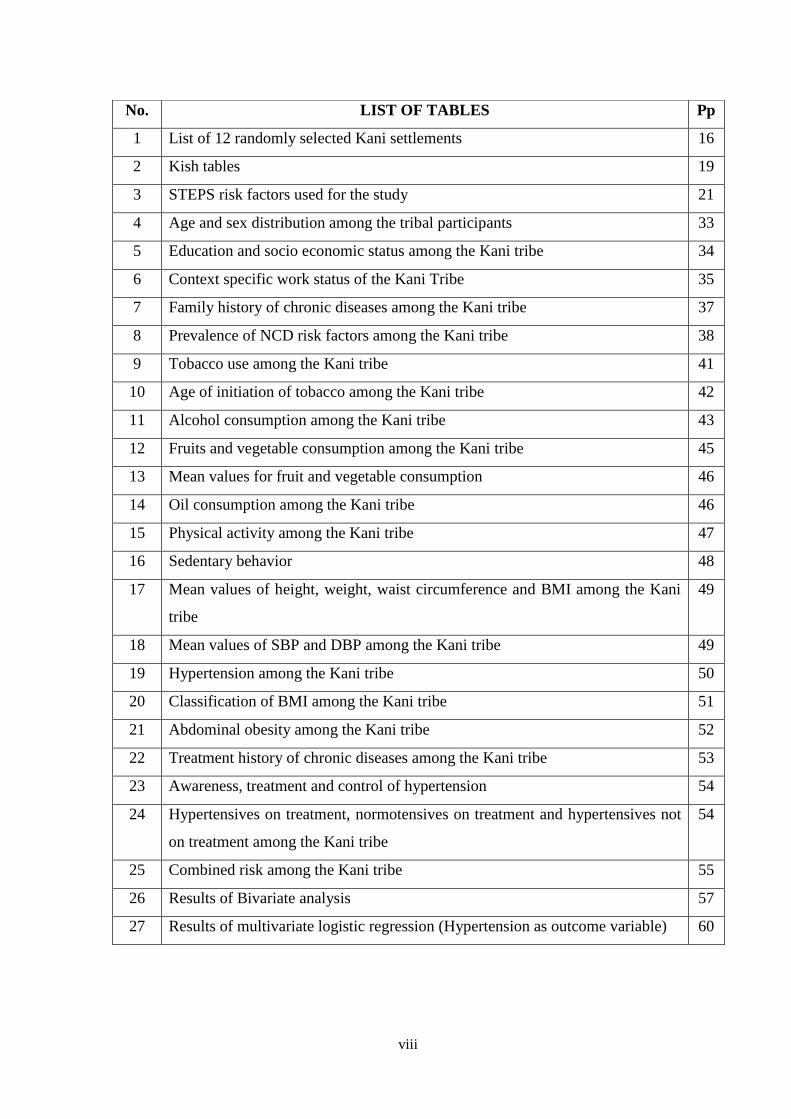
No. LIST OF TABLES Pp
1 List of 12 randomly selected Kani settlements 16
2 Kish tables 19
3 STEPS risk factors used for the study 21
4 Age and sex distribution among the tribal participants 33
5 Education and socio economic status among the Kani tribe 34
6 Context specific work status of the Kani Tribe 35
7 Family history of chronic diseases among the Kani tribe 37
8 Prevalence of NCD risk factors among the Kani tribe 38
9 Tobacco use among the Kani tribe 41
10 Age of initiation of tobacco among the Kani tribe 42
11 Alcohol consumption among the Kani tribe 43
12 Fruits and vegetable consumption among the Kani tribe 45
13 Mean values for fruit and vegetable consumption 46
14 Oil consumption among the Kani tribe 46
15 Physical activity among the Kani tribe 47
16 Sedentary behavior 48
17 Mean values of height, weight, waist circumference and BMI among the Kani
tribe
49
18 Mean values of SBP and DBP among the Kani tribe 49
19 Hypertension among the Kani tribe 50
20 Classification of BMI among the Kani tribe 51
21 Abdominal obesity among the Kani tribe 52
22 Treatment history of chronic diseases among the Kani tribe 53
23 Awareness, treatment and control of hypertension 54
24 Hypertensives on treatment, normotensives on treatment and hypertensives not
on treatment among the Kani tribe
54
25 Combined risk among the Kani tribe 55
26 Results of Bivariate analysis 57
27 Results of multivariate logistic regression (Hypertension as outcome variable) 60
ix
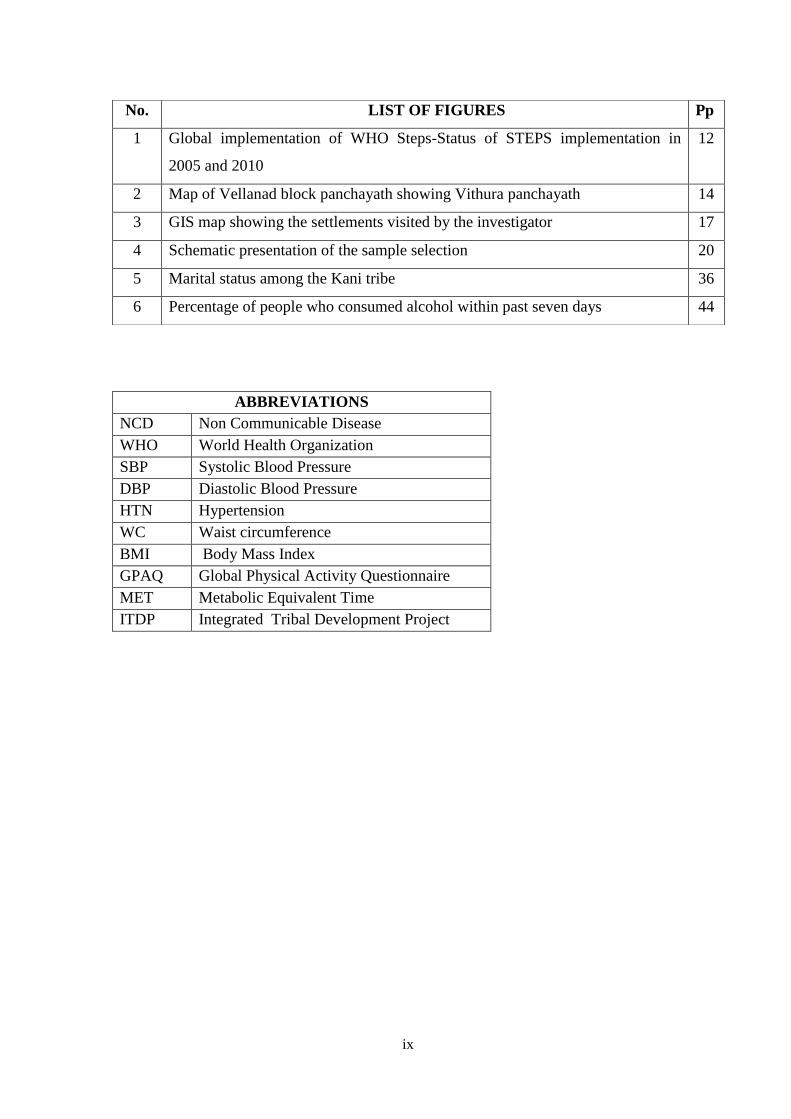
ABBREVIATIONS
NCD Non Communicable Disease
WHO World Health Organization
SBP Systolic Blood Pressure
DBP Diastolic Blood Pressure
HTN Hypertension
WC Waist circumference
BMI Body Mass Index
GPAQ Global Physical Activity Questionnaire
MET Metabolic Equivalent Time
ITDP Integrated Tribal Development Project
No. LIST OF FIGURES Pp
1 Global implementation of WHO Steps-Status of STEPS implementation in
2005 and 2010
12
2 Map of Vellanad block panchayath showing Vithura panchayath 14
3 GIS map showing the settlements visited by the investigator 17
4 Schematic presentation of the sample selection 20
5 Marital status among the Kani tribe 36
6 Percentage of people who consumed alcohol within past seven days 44

x
ABSTRACT
Prevalence of non-communicable disease risk factors among Kani tribe
in Thiruvananthapuram district, Kerala.
Introduction: The NCD risk factors are on an increase in Kerala. One may expect lower
prevalence of risk factors in tribal population as these are linked with modern life styles.
The studies on NCD risk factors among tribal population are very limited in India
especially in Kerala. This study explores the prevalence of NCD risk factors among Kani
tribe in Thiruvananthapuram, which is the most educated tribe in Kerala.
Method: A Cross sectional study was conducted in Vithura panchayath among 300 Kani
tribal people (25-64 years) using cluster sampling. Data on NCD risk factors were
collected using WHO STEP-wise approach for surveillance of NCD risk factors.
Statistical analysis was done in the R statistical package.
Results: Equal number of men and women were studied. Prevalence of hypertension
among Kani tribe was 48.3%, which is much higher than general population. Other
significant NCD risk factors were overall consumption of any form of tobacco(81.5%),
alcohol use(36.2%), abdominal obesity(22.1%), overweight(10.7%) and insufficient
consumption of fruits or vegetables(100%). Almost one third (28.2%) of Kani tribes were
found to have high combined risk score for NCDs. In bivariate analysis hypertension was
significantly (p<0.05) associated with higher age, male sex, lower education, current
smoking and alcohol use. In multivariate analysis, higher age (OR=2.28, CI=1.03-5.03),
and alcohol consumption (OR=9.43, CI=1.11-80.28) were found to be risk factors and
education (OR=0.27, CI=0.08-0.87) as protective factor for hypertension among Kani
tribe.
Conclusion: Kani tribes in Thiruvananthapuram were found to have higher prevalence of
major NCD risk factors like hypertension, tobacco use, alcohol use and inadequate fruits
and vegetable intake compared to the general population. Abdominal obesity and physical
inactivity among Kani tribes were found to be higher than other tribal groups. This could
be a reflection of the fast adoption of modern lifestyle among Kani tribe.
1
CHAPTER 1
INTRODUCTION AND LITERATURE REVIEW
1.1 INTRODUCTION
1.1.1 Background
Global burden of disease has continued to shift from communicable to non
communicable diseases and from premature deaths to years lived with disability.1 Non
Communicable Diseases (NCD) are diseases of long duration and generally of slow progression.
NCDs account for more than 60 percent morbidity, 63percent of all deaths killing more than 36
million people every year globally of which 80 percent of deaths occur in low and middle
income countries and most of it occur before the age of 60 years.2,3
The incidence of NCDs among socially disadvantaged people will be more when
compared to the people of higher social positions, because they are at greater risk of being
exposed to harmful products, such as tobacco or unhealthy food, also having limited access to
health services according to a systematic analysis done in 21 regions globally on the burden of
diseases.2
In the current phase of India's health transition, chronic diseases contribute to an
estimated 53 percent of deaths and 44 percent of disability adjusted life years lost.4 According to
a study done in 2010, the leading cause of death in rural India was found out to be NCDs.5 Thus
NCDs are steadily increasing in the rural areas as in the urban locations. There is a high burden
of NCD risk factors in Kerala, comparable to US, according to a large community based study by
Thankappan et al.6

2
Considering the increased risk of NCDs in populations with rapid urbanization and
resultant nutritional transition, it can be predicted that the tribal states of Northeast India will
have a greater risk of NCDs as revealed in the work of Khongsdier et al.7 Studies on different
tribes in India reports high prevalence of hypertension and other risk factors of NCDs as per
Sachdev et al and other researchers.8-11
A recent study in 2013 reports that the prevalence of hypertension was higher(40%) among
tribal adult population of Kerala and was associated with age, gender, educational status,
physical inactivity, alcohol consumption and obesity.12
By Government of Kerala's own admittance, “Even after five decades of efforts, STs
continue to constitute relatively the most backward and vulnerable sections of the population in
the state with extremely weak economic base.”13,14
NCD is increasing in the world and it disproportionally affects the disadvantaged groups
in any community. The Kani tribes were famous for their traditional wisdom on medicinal
plants.15
Unfortunately this knowledge is getting endangered. Moreover there can be a chance of
reflection of urbanization on their nutritional habits and lifestyles. So it is worth looking at the
NCD risk factor among the Kani tribe, the most educated (urbanized) tribe in Kerala.
1.1.2NON COMMUNICABLE DISEASES (NCD)
Non communicable diseases (NCDs) are also known as chronic diseases and they are of
long duration and slow progression. NCDs are not spreading from person to person. Four main
3
categories of NCDs are cardiovascular diseases (heart attack, stroke etc), cancers, chronic
respiratory diseases (chronic obstructive pulmonary disorders and asthma) and diabetes.1
1.1.3 RISK FACTORS FOR NCDs
Modifiable behavioral risk factors:
Modifiable risk factors include tobacco use, physical inactivity, unhealthy diet and the
harmful use of alcohol. All these will increase the risk of development of NCDs.1
Metabolic/physiological risk factors:
Behavioral risk factors will lead to metabolic or physiological fluctuations in the body
which increase the risk of NCDs. They include raised blood pressure, overweight/obesity,
hyperglycemia (elevated blood glucose level) and hyper-lipidemia (elevated level of fat in
blood).1
Prevention of NCDs should focus on minimizing the risk factors associated with NCDs
by reducing the common modifiable risk factors (tobacco use, unhealthy diet, physical inactivity
and the harmful alcohol consumption) and mapping the epidemic of NCDs and its risk factors.

4
1.2. LITERATURE REVIEW
1.2.1 Global scenario
Non Communicable Diseases (NCDs) are diseases of long duration and generally of slow
progression. NCDs account for more than 60 percent morbidity globally of which 80 percent of
deaths occur in low and middle income countries and most of it occurs before the age of 60yrs.1,3
It is anticipated that by 2020, the deaths due to non communicable disease will be almost three
quarters more compared to communicable, perinatal, neonatal and nutritional disorders. And by
2030 it will become the major cause of death in the world.4
In 2012, the UN conference on
sustainable development referred NCDs as “one of the major challenges for sustainable
development in the 21st century”16
According to a study by Ikeda et al, though the life expectancy of the Japanese are not
affected by the high rates of smoking and high blood pressure at present, it is anticipated to risk
for their economic development in future.17
Jayawardena et al demonstrated that there is a rapid
increase in the prevalence of diabetes in South Asian region and several modifiable and non
modifiable risk factors played a major role in the development of diabetes.18
A study done to
assess the prevalence of NCD risk factors among adult in urban areas of Kabul city, Afghanistan
using WHO STEP wise approach for surveillance revealed high prevalence of NCD risk
factors.19
Though old age groups are more at risk, evidences shows that 9 million of all deaths
attributed to non-communicable diseases occur before the age of 60. Children, adults and elderly
are more vulnerable to the risk factors of non-communicable diseases through unhealthy diet,
physical inactivity, exposure to tobacco smoke or alcohol consumption. According to WHO,

5
poverty is invariably linked with NCDs which is evident in low and middle income countries
(often due to lengthy and expensive treatment, loss of breadwinners and loss of income).1
According to Murray et al, global burden of disease has continued to shift from
communicable diseases to non communicable diseases and from premature death to years lived
with disability. Globally there will be a rising trend in the burden of mental and behavioral
disorders, musculoskeletal disorders and diabetes.2
Driving forces for NCD include ageing, rapid unplanned urbanization and unhealthy
lifestyles. Unhealthy lifestyles and unhealthy diets can manifest as raised blood pressure,
elevated blood glucose, high blood lipids, overweight and obesity which are called intermediate
risk factors which leads to cardiovascular disease which is an important NCD.1
Tobacco is accountable for 6 million deaths (including deaths due to passive smoking)
globally every year and is expected to increase to 8 million by 2030. World Health Organization
estimated that, other modifiable risk factors such as insufficient physical activity, low fruit and
vegetable intake and harmful alcohol consumption accounts for 3.2million, 1.7million and
1.1million deaths respectively. As per WHO, NCDs disproportionally affects the lower income
groups in a society, although the NCD risk factors are often present in the high income groups as
well. This could be due to the difference in access to health services for the rich and poor in any
society.1
Elevated blood pressure is the leading NCD risk factor and accounts for 16.5 percent of
the attributable deaths globally. Similarly tobacco use (9%), elevated glucose (6%), physical
inactivity (6%) and overweight and obesity (5%) all are NCD risk factors that contribute to the

6
mortality rate in our society. Rapid rise in overweight and obesity rates are seen among young
children in low and middle income countries1
1.2.2 Indian scenario
In the present stage of India's health transition, chronic diseases contribute to an
estimated 53 percent of deaths and 44 percent of disability adjusted life years lost.2
As per a study done in Faridabad, it is found that the prevalence of NCD risk factors
across all age groups among urban slums is high.20
A study from Andhra Pradesh points out that though cardiovascular risk factors are less
in rural areas compared to urban areas, the management of modifiable risk factors is
suboptimal.21
According to the INTERHEART STUDY, the New Delhi birth cohort evaluation found
that the incidence and prevalence of risk factors are high among young age and it rapidly shows
a transition. Incidence of obesity is more among women compared to men whereas incidence of
hypertension and diabetes were more among men when compared to women.22
According to a study in 2010, the leading cause of death in rural India was NCDs.5
A
study done in rural areas of Nagpur showed a high burden of non communicable disease risk
factors in which tobacco and alcohol use was high among men and physical inactivity and
overweight was high among women. They found low vegetable consumption across the group
regardless of the sex of the subjects.23
A study using WHO STEP approach done in Haryana
showed higher prevalence of NCD risk factors.24

7
According to a study done in Tamil Nadu, apart from central obesity and BMI,
alcoholism is the significant risk factor for hypertension among men and family history of
hypertension is the risk factor among women for hypertension.25
1.2.3 Kerala scenario
A recent large community based study by Thankappan et al revealed that the burden of
NCD risk factors is quite high in Kerala, even comparable to that of United States of America
(USA). The study showed an increase in the prevalence of all NCD risk factors with age.6
In Kerala, behavioral risk factors such as smoking and alcohol intake are more prevalent
among young adults. It has been established that socio economic status played the predictor role
for the habit of alcohol intake, tobacco consumption, stress and unhealthy diet.26
Socially
disadvantaged people are highly vulnerable to the incidence of NCDs compared to the people of
higher social positions.2
1.2.4 Tribal scenario
1.2.4.1 Studies on tribes in India
According to 2011 census, total tribal population in India constitute 104,281,034 which is
8.6 percent of the total population.
A study on problem perceived by tribal women in Haryana revealed some socio cultural
issues such as untouchability still exists in the community. Still the economic problems and
educational problems were the most dominant problems perceived by the tribal women.27

8
A genetic study on tribal people in southern India revealed that all Nilgiri Hills’tribal
groups are more closely related to each other regardless of phenotypic characteristics and they
share a common ancestry although they are morphologically and culturally different.28
According to a study done by Sarkar et al to understand the impact of urbanization on
high prevalence of metabolic disorders and its correlates among genetically similar rural
Himalayan tribal group compared to urban Himalayan tribal group revealed, an additional impact
of urbanization and adoption of urban lifestyles on cardiovascular risk factors.29
There is only limited literature on risk factors of NCDs among tribal population in India.
Studies on different tribes in India reports high prevalence of hypertension and other risk factors
of NCDs.8-11, 30
Considering the increased risk of NCDs in populations with rapid urbanization
and resultant nutritional transition, it can be predicted that the tribal states of Northeast India will
have a greater risk of NCDs.7
A study done to find out the reason behind alcoholism among tribals revealed cultural
factors such as traditional acceptance and pressure as well as high emotional problems due to
low self esteem as the main etiology behind high prevalence of substance dependence among
tribals.31
According to a study done among the Chenchus tribe of Andrapradesh revealed the
predominant use of locally prepared alcoholic beverages instead of harmless beverages such as
hot milk and tea.32
Different states in India revealed high prevalence of under nutrition among
tribal community especially among children and adolescent girls.33-41
A large number of death
occurs among children due to malnutrition among tribals.42
A study among Aimol tribe of
Manipur revealed high intake of animal meat and low intake of fluid as the reason for renal stone
among them.43
Thus tribal lifestyles are different from the general population in many manner.

9
Though government has initiated several schemes for tribals, they have low knowledge
about the provisions and their rights.27
Utilization of antenatal care services and family planning
services among tribals are substantially low in India.44,45
1.2.4.2 Studies on Tribes in Kerala
According to 2011 census, total tribal population in Kerala is 484,839 which constitute
1.5 percent of the total population in Kerala. Among them 433,092 are residing in rural area. In
Thiruvananthapuram district there are 26,759 scheduled tribes of which 20,022 are staying in
rural areas. (Data obtained from Census office, Thiruvananthapuram)
The tribal traditional agricultural practices have changed a lot due to changing pattern of
land use, intrusion of non tribal into tribal land and changes in the forest rules.46,47
There is a shift
from food crops to cash crops and this can have a significant effect on their lifestyle and eating
habits of tribals.
A recent study reported high prevalence of hypertension (40%) among tribal adult
population of Kerala and it was shown to associate with age, gender, educational status, physical
inactivity, alcohol consumption and obesity.12
As per the 2001 Census, there are 36 tribal
communities across Kerala. Of them Koraga, Kattunayakan, Cholanaickan, Kurumbar and
Kadar are categorized as particularly vulnerable tribal groups(PTGs) by Government of
India.13
The Scheduled Tribe (ST) population of Kerala state is 364,189 which contributes to 1.14
percent of the total population of the state (2001 census, Government of India).48
The life situation in tribal people is far from satisfactory. It is quite evident from the
statement of Government of Kerala that, “Even after five decades of development efforts, STs
10
continue to constitute relatively the most backward and vulnerable sections of the population in
the state with extremely weak economic base".13,14
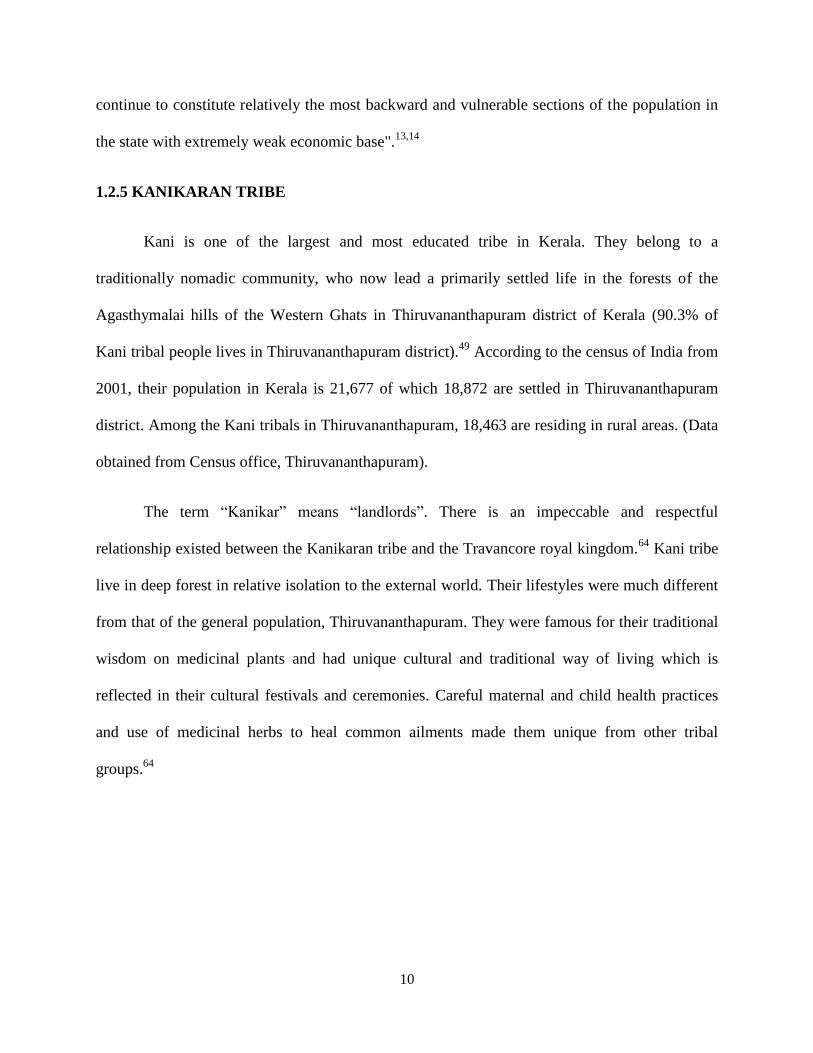
1.2.5 KANIKARAN TRIBE
Kani is one of the largest and most educated tribe in Kerala. They belong to a
traditionally nomadic community, who now lead a primarily settled life in the forests of the
Agasthymalai hills of the Western Ghats in Thiruvananthapuram district of Kerala (90.3% of
Kani tribal people lives in Thiruvananthapuram district).49
According to the census of India from
2001, their population in Kerala is 21,677 of which 18,872 are settled in Thiruvananthapuram
district. Among the Kani tribals in Thiruvananthapuram, 18,463 are residing in rural areas. (Data
obtained from Census office, Thiruvananthapuram).
The term “Kanikar” means “landlords”. There is an impeccable and respectful
relationship existed between the Kanikaran tribe and the Travancore royal kingdom.64
Kani tribe
live in deep forest in relative isolation to the external world. Their lifestyles were much different
from that of the general population, Thiruvananthapuram. They were famous for their traditional
wisdom on medicinal plants and had unique cultural and traditional way of living which is
reflected in their cultural festivals and ceremonies. Careful maternal and child health practices
and use of medicinal herbs to heal common ailments made them unique from other tribal
groups.64
11
1.2.6 RATIONALE FOR USING WHO STEPS
WHO STEP-wise approach for the surveillance of Non Communicable Disease risk
factors
WHO step is first initialized in Armstrong and Bonitain 2003. The step methodology is
flexible and adaptable so that it can be used in majority of resource constrained settings.50
STEP
1 and STEP 2 are more flexible and suitable for developing countries.1
WHO STEP wise
approach for the surveillance of NCD risk factors was successfully implemented in Kerala in a
community based study.6
The study done by Nawi Ng et al discuss the potential of combining the WHO STEP wise
approach for the surveillance within ongoing demographic surveillance system (DSS), (By
combining WHO STEPS methodology and INDEPTH methodologies) to assess changes in non
communicable disease risk factors.51
By combining WHO STEPS methodology and INDEPTH
methodology we can find out how the NCD risk factors are distributed in populations, who
among the population is affected because of it and does it reached the world’s poor. In this
context DSS will chart the shift of population risk profiles and will give an idea about
epidemiological transition in poorer countries.51
So combination of these two methodologies are
more beneficial for developing countries.

12
GLOBAL IMPLIMENTATION OF WHO STEPS
1.3 RATIONALE FOR THE STUDY
Many ethno pharmacological studies had revealed the richness of traditional knowledge
on medicinal plants among Kani tribe.15,52,53
Unfortunately the transmission of these traditional
knowledge to next generation is getting endangered as more and more young tribes adopt the
fascinating modern way of living.54
As their health practices and life habits are different from the general population, it is
worth looking at their NCD risk factors.40, 49
Source: Ng N, Minh HV, Tesfaye F, Bonita R, Byass P, Stenlund H, et al. Combining risk factors and demographic
surveillance: Potentials of WHO STEPS and INDEPTH methodologies for assessing epidemiological transition. Scand
J Public Health 2006; 34(2):199–208.
13
Moreover there can be a chance of reflection of urbanization on their nutritional habits
and lifestyles. No study has been done to assess the burden of NCD risk factors among this
vulnerable population. Understanding the pattern of NCD risk factors among ‘Kani tribe’ is
essential to address the health issues of this population.
14
CHAPTER 2
METHODOLOGY
2.1 OBJECTIVE OF THE STUDY
To assess the prevalence of NCD risk factors among Kani tribe in Thiruvananthapuram district,
Kerala.
2.2 RESEARCH QUESTION
What is the prevalence of NCD risk factors among ‘Kani tribe’ in Thiruvananthapuram district?
2.3 STUDY DESIGN: Cross sectional survey
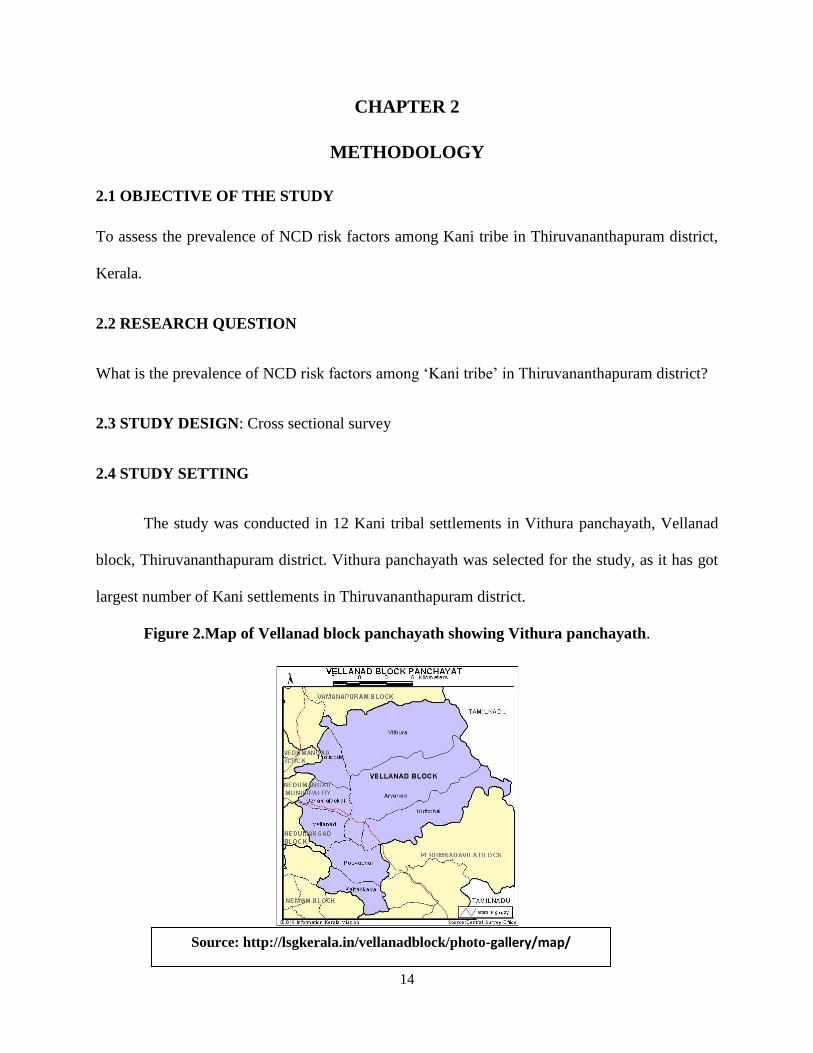
2.4 STUDY SETTING
The study was conducted in 12 Kani tribal settlements in Vithura panchayath, Vellanad
block, Thiruvananthapuram district. Vithura panchayath was selected for the study, as it has got
largest number of Kani settlements in Thiruvananthapuram district.
Figure 2.Map of Vellanad block panchayath showing Vithura panchayath.
Source: http://lsgkerala.in/vellanadblock/photo-gallery/map/

15
2.5 STUDY POPULATION
Men and women of age group 25-64yrs who belongs to Kani tribe.
2.5.1 INCLUSION CRITERIA
1. Age group 25-64yrs
2. Who belongs to ‘Kani tribe’
2.5.2 EXCLUSION CRITERIA
1. Debilitating illness and bed ridden
2.6 SAMPLING CRITERIA
Sampling was done using Cluster sampling. In this type of sampling method, the target
population will be divided into clusters/groups and a subset of each cluster will be selected. Here
in this study, tribal settlements in Vithura panchayath were taken as the cluster units.
2.7 SAMPLE SIZE ESTIMATION:
Sample size was calculated based on the prevalence of hypertension (40%), a leading
NCD risk factor, from previous studies.12
With an anticipated prevalence of 40%12
precision 8 percent and design effect of two, the
required sample size is estimated as 289 which are rounded to 300. (Open Epi 3.01)
2.8 SAMPLE SELECTION PROCEDURE:
2.8.1 Cluster selection- There were 67 Kani settlements in Vithura panchayath as per the
list obtained from Integrated Tribal Development Project (ITDP). On average there were 25
households in each settlement and they were taken as cluster units for the study. Total of twelve

16
settlements were randomly selected from the list of 67 Kani settlements in order to achieve the
sample size of 300.
* One of the settlements, “Kallupara” was replaced due to practical reasons. It is sparsely
populated, and has to be reached through a narrow mountain way, high mountains on one side
and steep fall in the other side. It was substituted by another settlement that was selected at
random from the list.
Table 1-List of 12 randomly selected Kani settlements
Sl No Name of the settlement Number of
participants included
1 Kochukilikodu 26
2 Pattomkulichira 25
3 Manithooki 23
4 Narakathumkala 26
5 Chathankodu 26
6 Cherumanali 25
7 Mottammood 18
8 Kallamkudi 31
9 Podiyakala 26
10 *Nettayam 18
11 Valiyakala 28
12 Alummood 26
TOTAL 300
*Kallupara was replaced by Nettayam.
17
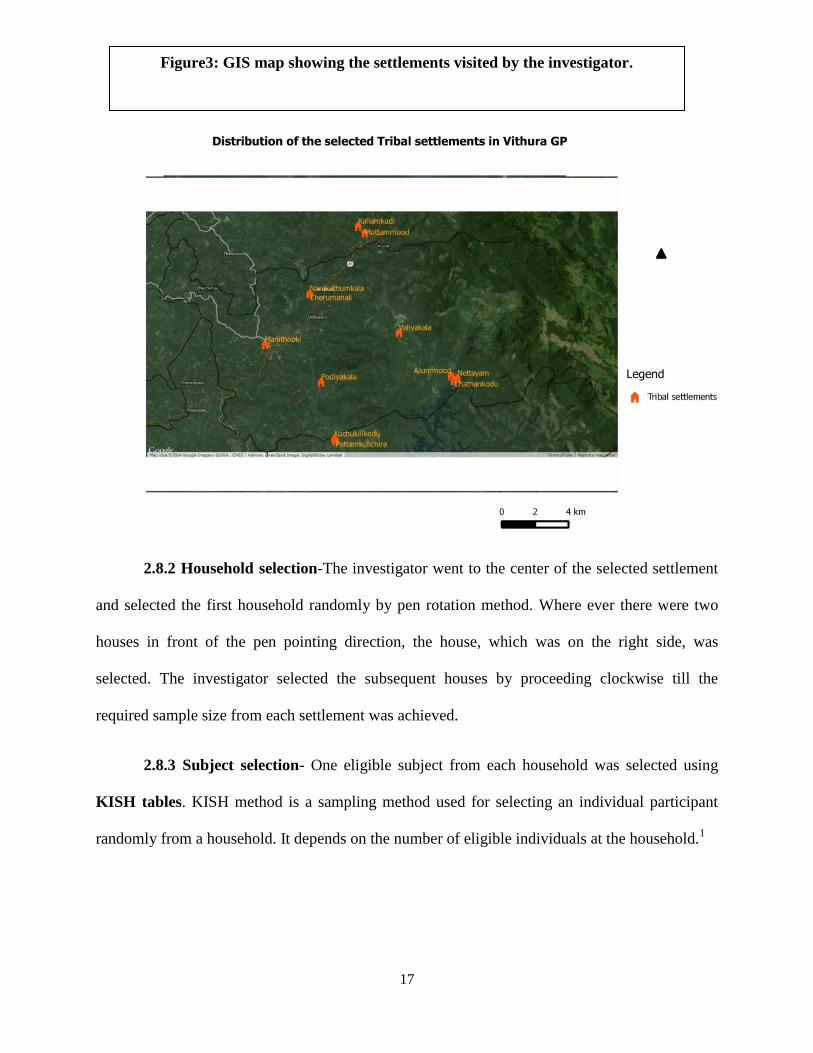
2.8.2 Household selection-The investigator went to the center of the selected settlement
and selected the first household randomly by pen rotation method. Where ever there were two
houses in front of the pen pointing direction, the house, which was on the right side, was
selected. The investigator selected the subsequent houses by proceeding clockwise till the
required sample size from each settlement was achieved.
2.8.3 Subject selection- One eligible subject from each household was selected using
KISH tables. KISH method is a sampling method used for selecting an individual participant
randomly from a household. It depends on the number of eligible individuals at the household.1
Figure3: GIS map showing the settlements visited by the investigator.

18
KISH table was with the investigator during data collection. All the questionnaires were
given serial numbers from 1-300. During the first household visit, the investigator listed out the
age and sex of all eligible members in the households (men and women in the age group of 24-65
years) and ranked it based on decreasing age (oldest to youngest).
Eg:
After that a questionnaire was selected randomly and noted the last digit of its serial
number. Then by using the following KISH table, found out the digit matching last digit of the
serial number (column) and the total number of eligible persons in the household (row). The
person whose rank matched this number was the selected participant from that household.
Eg: If the serial number is 122 and total number of eligible persons in the household is 4,
then
Last digit of the serial number=2
Total number of eligible persons in the household=4
Digit matching the column digit 2 and the row digit 4=3
The person ranked as 3 will be the selected participant from that household.
Sex Age Rank
M 50 1
F 47 2
M 27 3
F 25 4

19
Table 2: Kish tables
Number of Eligible
Persons in
Household
Last Digit of the serial number in the questionnaire
0 1 2 3 4 5 6 7 8 9
1 1 1 1 1 1 1 1 1 1 1
2 1 2 1 2 1 2 1 2 1 2
3 3 1 2 3 1 2 3 1 2 3
4 1 2 3 4 1 2 3 4 1 2
5 1 2 3 4 5 1 2 3 4 5
6 6 1 2 3 4 5 6 1 2 3
7 5 6 7 1 2 3 4 5 6 7
8 1 2 3 4 5 6 7 8 1 2
9 8 9 1 2 3 4 5 6 7 8
10 9 10 1 2 3 4 5 6 7 8
WHO Kish tables1
Thereafter from each house the ranking was done separate for male and female since the
investigator’s plan was to get equal number of men and women in her sample .The rest of the
procedure was same as above. The investigator selected men and women alternatively from
consequent household.
20
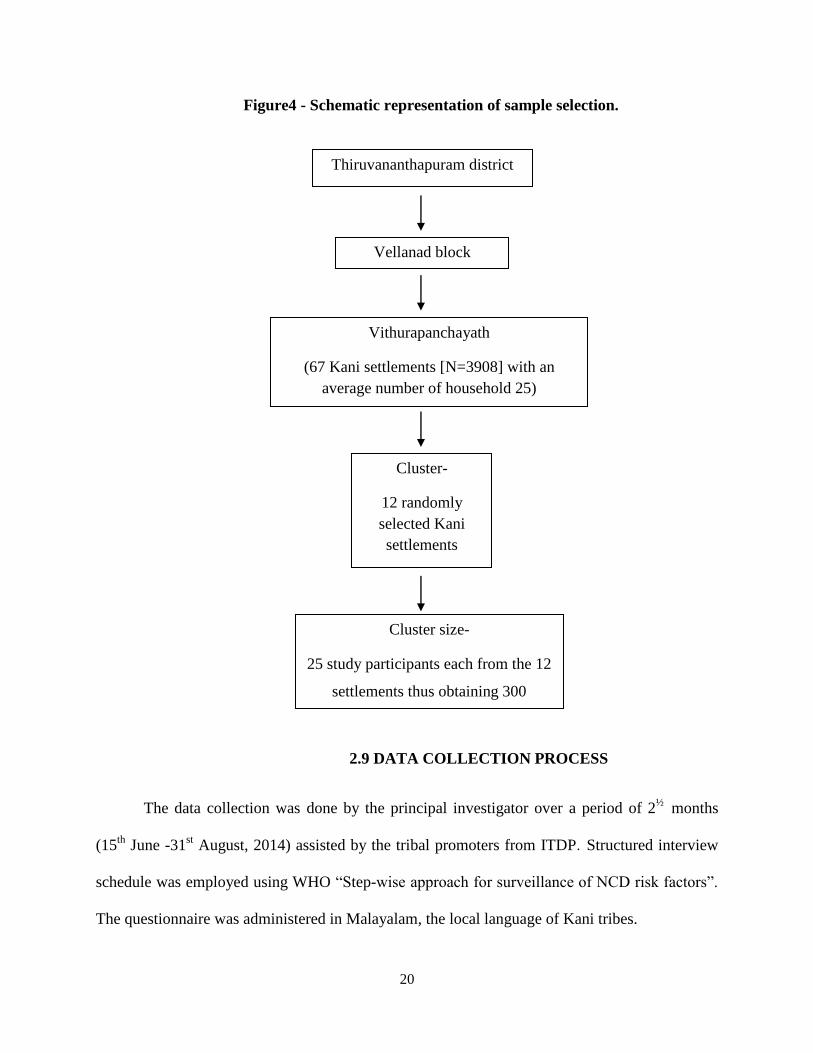
Figure4 - Schematic representation of sample selection.
2.9 DATA COLLECTION PROCESS
The data collection was done by the principal investigator over a period of 2½
months
(15th
June -31st August, 2014) assisted by the tribal promoters from ITDP. Structured interview
schedule was employed using WHO “Step-wise approach for surveillance of NCD risk factors”.
The questionnaire was administered in Malayalam, the local language of Kani tribes.
Vellanad block
Vithurapanchayath
(67 Kani settlements [N=3908] with an
average number of household 25)
Cluster-
12 randomly
selected Kani
settlements
Cluster size-
25 study participants each from the 12
settlements thus obtaining 300
Thiruvananthapuram district

21
2.9.1 Data collection instrument
Structured interview schedule was employed using WHO STEP-wise approach for
surveillance of NCD risk factors (STEP 1 & STEP 2) Version 3.0. This questionnaire
included WHO Step 1 & 2 (core and some expanded) with items on family history of chronic
diseases and socio economic status. STEP 1 and STEP 2 data were collected as per WHO
guidelines.
Table 3- STEPS risk factors used for the study.
WHO STEP INSTRUMENT CORE EXPANDED
STEP 1 BEHAVIOURAL
RISK FACTORS
Demographic information such
as age, sex and highest level of
education
Expanded demographic
information like marital
status and main work status.
Tobacco use Smokeless tobacco use
Alcohol consumption -------------
Fruit and vegetable consumption Oil consumption
Physical activity Sedentary behavior
History and treatment of raised
blood pressure, diabetes and
raised cholesterol
History of cardio vascular
disease, lifestyle advice and
history of cervical cancer
screening
-------------
STEP 2 PHYSICAL
MEASUREMENTS
Height ,weight, waist
circumference and blood
pressure
Heart rate
22
Instruments used for STEP 2 Physical Measurements:
Height Measurement was done using:
TYLON non-stretchable height measuring tape. (Stanley 130656)
Accuracy-one millimeter
SECA 213 standalone stadio meter with accuracy of one millimeter.
Weight Measurement was done using SECA 813 Electronic Flat weighing scale
with accuracy of 100 grams.
Waist circumference Measurement was taken using SECA constant tension tape
(SECA 201) with accuracy of 0.1centimeter.
Blood Pressure Measurement was taken using Digital sphygmomanometer.
(OMRON HEM 7203).
2.9.2Procedures1
2.9.2.1 Blood Pressure Measurement
Blood pressure measurement was done to find out the prevalence of hypertension among
Kani tribe. As per WHO recommendation, the physical measurements (Step 2) were taken
immediately after the Step 1 questionnaire. The participant was asked to sit for at least 15
minutes with his/her leg uncrossed. The blood pressure (BP) measurements were taken using
OMRON digital sphygmomanometer. Medium size cuff was used because in pilot survey the
investigator found it as suitable size for this tribal population. Left arm was used for BP
measurement. BP was measured as per WHO guidelines. After obtaining first reading the
investigator deflated the cuff fully and waited for other three minutes in between other two

23
readings. Thus total of three reading were recorded. The mean of second and third reading was
calculated (Systolic blood pressure and diastolic blood pressure) during data analysis. Heart
rate which was displayed along with blood pressure readings also was recorded along with this.
During analysis the mean of second and third measurement of heart rate was calculated.
2.9.2.2. Height Measurement
The investigator at first started measuring height using SECA 213 standalone
Stadiometer as per WHO guidelines .But found it difficult to carry all the way to each of the
settlement due to the geographic constraints of the tribal settlements. Later investigator used
TYLON non-stretchable height measuring tape (Stanley 130656) with accuracy one millimeter
which is suitable for research purposes. The subject was asked to remove their footwear and cap
if any. Then they were asked to stand straight on a flat surface, with feet together, knee straight
and heels against the wall. The subject was then asked to look straight in such a way that eyes
were in same level as ears. Using a hard board placed onto the head, marked the height against
the wall. Then with the assistance of the tribal promoter measured the height in exact point (in
centimeter) using TYLON non-stretchable height measuring tape.
2.9.2.3. Weight Measurement
The weight of the subject was measured after placing the scale on a flat and firm surface.
The subject was asked to remove their foot wear, wear light clothing and step onto scale with one
foot on each side of the scale. The subject was then asked to stand still, facing forward, placing
arms on the side until asked to step off. Then the investigator recorded the weight in kilograms.

24
2.9.2.4. Waist-circumference
The procedure was explained to the subject prior to the measurement. Adequate privacy
was provided during measurement. The measurement was taken over light clothing. The
investigator located the last palpable rib and the top of the hipbone taking the participant’s help
to assist in locating these points on their body. Then the SECA constant tension tape was bound
around themselves with their assistance. The tape was positioned at the midpoint of the last
palpable rib and the top of the hipbone. It was made sure that the tape was horizontal across the
back and front of the subject and was parallel with the floor as possible. Measurement was taken
at the end of normal expiration.
2.11 DATA STORAGE AND ANALYSIS
After data entry, softcopy of the data were stored in the computer with password
encryption of the file. The hard copy of the filled interview schedule and the consent form were
strictly kept under lock and key with the principal investigator.
After the data entry in Epidata manager V1.4.4.6, the data were analyzed using software
R statistical package 3.1.1 (R Foundation for Statistical Computing, Vienna, Austria)55, 56
by the
principal investigator. The data were analyzed for the prevalence of non-communicable disease r
isk factors (Tobacco use, alcohol consumption, low fruit and vegetable consumption, physical in
activity, abdominal obesity, overweight, self reported diabetes and hypertension) among the Kani
tribe. Descriptive statistics of all variables were done. Further bivariate and multivariate analyse
s were done to find out the significant association between STEP1 &STEP 2 variables. Multivari
ate logistic regression analysis was carried out for dependent variable (hypertension) after adjusti

25
ng for independent variables (socio demographic factors and STEP 1variables). Significance was
tested at 95% confidence level with P value<0.05.
2.12VARIABLES UNDER STUDY
DEPENDENT VARIABLES-
Non Communicable Disease risk factors such as;
Tobacco use
Alcohol use
Inadequate fruit and vegetable consumption
Physical inactivity
Self reported diabetes
Abdominal obesity
Overweight
Hypertension
INDEPENDENT VARIABLES;
Demographic variables such as; Age, sex, marital status
Socio economic variables such as; educational status, occupational status
2.13 STUDY DEFINITIONS
1. STEP 1 VARIABLES
i. Tobacco use variables:
Current tobacco smokers- Smoked beedi, cigarettes or others within the past 30
days.
Current users of smokeless tobacco- Used smokeless tobacco products such as
chewing tobacco and betel leaves, snuff, kaini or others within the past 30 days.
Current use of both smoked and smokeless tobacco- Used both smoked and
smokeless form of tobacco within the past 30 days.

26
Current use of any form of tobacco products- Used smoked or smokeless form of
tobacco within the past 30 days.
ii. Alcohol consumption variable
Ever consumed alcohol- Ever consumed any alcoholic drink such as beer, whisky,
rum, gin, brandy or local preparations. “Aayal” is the local preparation in that
area.
Current use of alcohol- Consumption of alcohol within the past 30 days.
Binge drinkers- Binge drinker was defined as ≥ five standard drinks for men and
≥ four standard drinks for women in one occasion at least once during the past 30
days.1
Standard drink- A standard drink is the amount of ethanol contained in standard
glasses of beer, wine, fortified wine such as sherry, and spirits. The net alcohol
content of a standard drink is generally 10 grams of ethanol but can vary between
eight and 13 grams of ethanol depending on the country/site.(One standard
drink=30 ml of spirit or 285 ml of regular beer).1
iii. Fruits and vegetable consumption variable
Data on fruits and vegetable consumption was traced in terms of ‘Number of
servings’. One serving=80 grams of fruit and vegetable.
One serving= One medium piece of fruit (banana, apple, guava, orange etc).
Tubers such as potato were not included in the vegetable.
Show cards were used to collect the data on fruits and vegetable consumption in a
typical day. Information on oil intake was traced by asking about the type of oil
they are most often using for their meal preparation.

27
It is recommended that one should eat more than or equal to five servings of fruits
and vegetable per day.1
iv. Physical activity variable
STEPS physical activity questions represents Global Physical Activity
Questionnaire (GPAQ) V2.1
Physical activity was calculated based on intensity, duration and frequency of
physical activity at three different domains such as activity at work, travel to and
from places and recreational settings. Data on number of days spent and the
duration of physical activity of these three domains were used for analysis.
Intensity can be classified as vigorous and moderate intensity activities.
Vigorous intensity activity=Activities which take hard physical effort and cause
large increase in breathing or heart rate for at least 10 minutes. ( Eg: heavy lifting,
digging, running or playing football)
Moderate intensity activity= Activities which take moderate physical effort and
cause small increase in breathing or heart rate for at least 10 minutes. ( Eg: brisk
walking, carrying light loads, cycling or swimming)
Total physical activity was measured using *Metabolic Equivalent Time per week
(MET-minutes /week) which is the sum of total MET minutes of activity for each
domain such as ‘work’, ‘travel to and from places’ and ‘recreation’.
MET value for vigorous activity=8
MET value for moderate activity=4
MET value for travel=4

28
*MET- One MET is defined as the energy used by a body when one sits quietly
and is equivalent to a caloric consumption of one kcal/kg/hour. This unit is used
to estimate the amount of oxygen used by body for a specific type of physical
activity.57
Equation:
Physical activity in MET-minutes/week= [(P2*P3*8)+
(P5*P6*4)+(P8*P9*4)+(P11*P12*8)+(P14*P15*4)]
WHO GPAQ analysis guide1
P2,P3,P5,P6,P8,P9,P11,P12,P14 and P15were question codes for STEP 1 physical
activity questionnaire.
The levels of physical activity were classified into three groups such as High,
Medium and Low physical activity1.
High physical activity: >=3000 MET-minutes/week
Medium physical activity: 600-2999 MET-minutes/week
Low physical activity:<600 MET-minutes/week
WHO recommendations: An adult should do physical activity; an equivalent
combination of vigorous and moderate intensity physical activity achieving at
least 600 MET minutes in a week. It includes physical activity during work,
transport and recreation. Individuals who do not meet the criteria of at least 600
MET- minutes /week were considered as “physically inactive”.1
2. STEP 2 VARIABLES
v. Abdominal obesity:
International cutoff- Waist circumference ≥102 cm for men and ≥88 cm for
women.58
Asian cutoff - Waist circumference ≥90 cm for men and ≥80 cm for women.59

29
Indian cutoff- Waist circumference ≥85cm for men and ≥80 cm for women.60
vi. Overweight:
According to WHO, overweight is defined as, *Body Mass Index(BMI)≥25kg/m2.
Indian cutoff for overweight is BMI ≥ 23kg/m2.60
*BMI=weight (kg)/height (m2)
BMI classification (WHO)1
Underweight : <18.50kg/m2
Normal : 18.50-24.99 kg/m2
Overweight : 25-29.99 kg/m2
Obesity : ≥30kg/m2
vii. Hypertension: Hypertension is defined as systolic blood pressure ≥140 mm of Hg or
diastolic blood pressure ≥90 mm of Hg or currently taking any medication for
hypertension.1
a. Participants who were aware of their hypertension status= Participants who
are having the history of hypertension.
b. Participants whose hypertension under control is those who are on medication
and are Normotensives. (Systolic blood pressure <140 mm of Hg and
diastolic blood pressure <90 mm of Hg).57
viii. Combined Risk Factors:57
The risk factors used to estimate the combined risk are as follows;
a. Current daily smokers
b. Less than five servings of fruit and vegetables per day
c. Low level of activity (<600METmts/week)
30
d. Overweight or obese (BMI≥25kg/m2)
e. Raised Blood pressure (SBP ≥140 mm of Hg or DBP ≥90 mm of Hg or
Hypertension on treatment)
If ≥Three above mentioned risk factors present, then the person is at high risk.
If ≤Three above mentioned risk factors present, then the person is at low risk.
2.14 ETHICAL CONSIDERATIONS
Ethical clearance was obtained from Institutional Ethics Committee, SCTIMST,
Thiruvananthapuram (IEC RegnNo.ECR/189/Inst/KL/2013). The support and co-operation
were obtained from Integrated Tribal Development Project (ITDP), Nedumangad,
Thiruvananthapuram.
Consent
Informed written consent was obtained from the subject prior to the start of the interview
(In local language Malayalam) after the doubt was being clarified to the subject.
Participation in the study was voluntary. The subject had the freedom to refuse answering
questions or opt out of the study at any stage of the research.
Privacy and confidentiality
Privacy and confidentiality of the subject was honored. During physical measurements,
adequate privacy was provided. The personal information like name, address and contact
number were separated and maintained strictly confidential under the investigator’s
custody. The soft copy and hard copy of the data were stored under safe custody of the
31
investigator. The data will be stored for two years for any further references and
clarifications.
Individual’s cultural and traditional autonomy was given due respect. The interview
was conducted at house /work place, whichever the respondent chooses and as per their
availability. The adverse findings detected (Raised blood pressure with Systolic blood
pressure ≥140 mm of Hg or diastolic blood pressure ≥90mm of Hg) were revealed to the
respondent. After being given lifestyle advices for the same, the investigator advice them to
visit the nearest PHC (Vithura PHC) for further management.
2.15 FUNDING
The study was funded by Kerala State Council for Science, Technology and
Environment(KSCSTE), Department of science and technology, Government of Kerala,
Thiruvananthapuram, Kerala.(File No. 80/SPS-52.2014/CSTE)
32
CHAPTER 3
RESULTS
The results of the data analysis are described in this chapter. Out of 311 selected study
subjects contacted, 300 consented to participate in the study with a response rate of 96.4 percent.
Two subjects were found to be outlier and were excluded from the general analysis as their anthr
opometric parameters like weight, height and blood pressure measurements were higher by more
than two standard deviations from the rest. The non responders were not different from the study
subjects in their demographic characteristics.
3.1 BASELINE CHARACTERISTICS
Baseline characteristics are described under following domains.
1. Socio demographic profile
2. Prevalence of NCD risk factors among the Kani tribe.
3. Tobacco consumption
4. Alcohol consumption
5. Fruit and vegetable consumption
6. Physical activity
7. Sedentary behavior
8. Height ,weight, waist circumference and BMI
9. Systolic blood pressure and diastolic blood pressure
10. Hypertension
11. Abdominal obesity
12. Overweight
33
13. Treatment history of chronic diseases among the Kani tribe
14. Awareness, treatment and control of hypertension
15. History of chest pain on exertion and history of cervical cancer screening
16. Combined risk factors
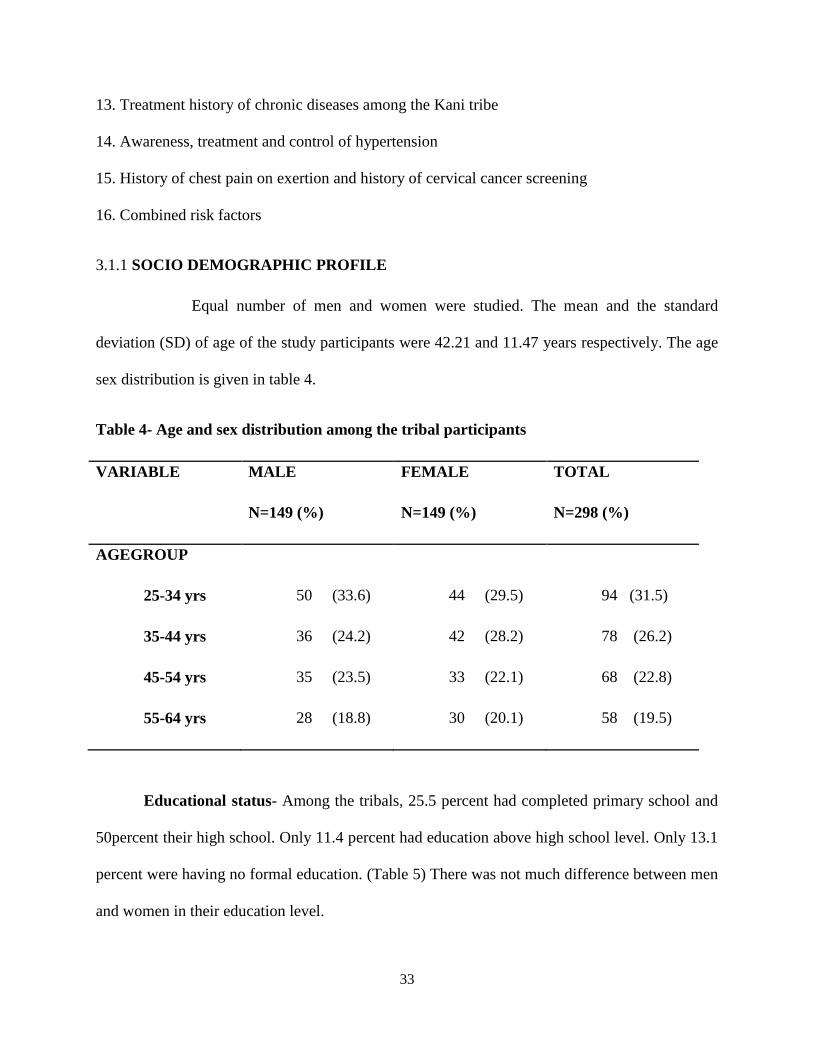
3.1.1 SOCIO DEMOGRAPHIC PROFILE
Equal number of men and women were studied. The mean and the standard
deviation (SD) of age of the study participants were 42.21 and 11.47 years respectively. The age
sex distribution is given in table 4.
Table 4- Age and sex distribution among the tribal participants
VARIABLE MALE
N=149 (%)
FEMALE
N=149 (%)
TOTAL
N=298 (%)
AGEGROUP
25-34 yrs 50 (33.6) 44 (29.5) 94 (31.5)
35-44 yrs 36 (24.2) 42 (28.2) 78 (26.2)
45-54 yrs 35 (23.5) 33 (22.1) 68 (22.8)
55-64 yrs 28 (18.8) 30 (20.1) 58 (19.5)
Educational status- Among the tribals, 25.5 percent had completed primary school and
50percent their high school. Only 11.4 percent had education above high school level. Only 13.1
percent were having no formal education. (Table 5) There was not much difference between men
and women in their education level.

34
Socioeconomic status- In the total sample, 89.3 percent were belonged to below poverty
level. (Table 5)
Table 5- Education and socio economic status among the Kani tribe
VARIABLE TOTAL
N=298 (%)
EDUCATION
No formal education 39 (13.1)
Primary school 76 (25.5)
High school 149 (50)
Higher secondary 26 (8.7)
Diploma after higher secondary/graduate 8 (2.7)
SOCIO ECONOMIC STATUS
Below Poverty Level(BPL) 266 (89.3)
Above Poverty Level (APL) 32 (10.7)
Context specific Work status-
Among the study subjects, 29.53 percent were daily wage earners doing labor works .One
forth (25.17%) attended domestic duties and 14.4 percent were doing Mahatma Gandhi National
Rural Employment Guarantee Act (MGNREGA). More men were involved in labor works and
rubber tapping than women. Similarly more women were engaged in domestic works than men.

35
The percentages of farmers were only four percent and those who are doing traditional
handicrafts (“Eera works”) are only 1.34 percent. (Table 6)
Table 6- Context specific work status of the Kani Tribe
VARIABLE MALE
N=149 (%)
FEMALE
N=149 (%)
TOTAL
N=298 (%)
CONTEXT SPECIFIC
OCCUPATION
Labor works
70 (46.98) 18 (12.1) 88 (29.53)
Attended domestic
duties
7 (4.6) 68 (45.6) 75 (25.17)
Mahatma Gandhi
National Rural
Employment Guarantee
Act(MGNREGA)
7 (4.6) 36 (24.2) 43 (14.4)
Rubber tapping 22 (14.77) 0 22 (7.38)
Regular wage employee 7 (4.6) 7 (4.6) 14 (4.7)
Engaged in free
collection of
goods(minor forest
product collection)
2 (1.3) 11(7.4) 13 (4.36)
Farmers 11 (7.4) 1 (0.6) 12 (4)
Available for work 6 (4) 3 (2) 9 (3)
Unpaid family worker 6 (4) 2 (1.34) 8 (2.7)
Traditional handicrafts 4 (2.68) 0 4 (1.34)
Others 10 (6.66) 0 10 (3.28)

36
Marital status-
Just less than half (43.3%) were currently married and 34.9% were cohabiting. More
women were cohabiting than men (38.9%). (Figure 5)
Figure5: Marital status among the Kani tribe
14.8
48.3
6
30.9
6.7
38.3
16.1
38.9
0 20 40 60
Never married
Currently married
Divorced/separated/widowed
Cohabitating
Female
Male
Marital status
Percentage

37
Family history
Among the total sample, 23.5 percent had history of hypertension and 17.8 percent had
history of respiratory problems. (Table 7)
Table7-Family history of chronic diseases among the Kani tribe
VARIABLE TOTAL
N=298 (%)
Hypertension 70 (23.5)
Heart attack 29 (9.7)
Diabetes 23 (7.7)
Respiratory problems 53 (17.8)
Cancer 17 (5.7)
3.2 PREVALENCE OF NCD RISK FACTORS AMONG THE KANI TRIBE
The prevalence of hypertension among Kani tribe was 48.3 percent. The prevalence of
abdominal obesity was 22.1 percent. Among the Kani tribe, 37.9 percent were current users of
tobacco and 81.5 percent were using any form of tobacco. Among the Kani tribe, 32.2 percent
were current alcohol users. The proportion of those who were involved in high physical activity
was 77.2 percent. There is no sufficient intake of fruits and vegetables among the Kani tribe. All
of them were consuming less than five servings per day. Among the whole subjects, 15.4 percent
were not at all consuming at least one serving of fruit and vegetable. (Table 8)

38
Table 8- Prevalence of NCD risk factors among the Kani tribe
VARIABLE
PREVALENCE(N=298)
CONFIDENCE
INTERVAL
HYPERTENSION
144 (48.3%)
46-57.3
OVERWEIGHT
32 (10.7%)
7.7-14.8
ABDOMINAL OBESITY
66 (22.1%)
17.8-27.2
COMBINED RISK FACTORS
-HIGH RISK
84 (28.2%)
23.4-33.5
CURRENT TOBACCO USE
113 (37.9%)
32.6-43.5
CURRENT SMOKELESS
TOBACCO USERS
226 (75.8%)
70.7-80.4
CONSUMPTION OF ANY FORM
OF TOBACCO
243 (81.5%)
76.7-85.5
CONSUMPTION OF BOTH
FORM OF TOBACCO
96 (32.2%)
27.2-37.7

39
VARIABLE
PREVALENCE(N=298)
CONFIDENCE
INTERVAL
CURRENT
ALCOHOL
USERS
108 (36.2%)
31-41.8
PHYSICAL
ACTIVITY
HIGH
230 (77.2%)
72.1-81.6
MEDIUM
39 (13.1%)
9.7-17.4
LOW
29 (9.7%)
6.9-13.6
BMI
UNDERWEIGHT
67 (22.5%)
18.1-27.6
NORMAL
199 (66.8%)
61.2-71.9
OVERWEIGHT
30 (10.1%)
7.1-14.0
OBESE 2 (0.7%) 0.2-2.4
FRUIT AND
VEGETABLE
CONSUMPTION
N=252
>=FIVE
SERVINGS
0
---
<FIVE
SERVINGS
252 (100%)
98.5-100

40
3.2.1 Tobacco use
Among the total sample, 37.9 percent were current smokers. Current smokers among men
and women were 69.1 percent and 6.7 percent respectively. Of the total sample, 32.6 percent
were current daily smokers.
Of the total study participants, 75.8 percent were current users of smokeless tobacco.
The prevalence of current use of smokeless tobacco among men and women were 81.9 percent
and 69.8 percent respectively. It was found that 61.7 percent among men and 58.4 percent among
women were using smokeless tobacco daily. Among total sample, 81.5 percent used any form of
tobacco and 32.2 percent consumed both forms of tobacco. Predominant form of tobacco
smoking was beedi. But a few were using Kanjavu for smoking. The main smokeless form of
tobacco in this tribal area was betel leaves along with tobacco leaves. But some were using
sambhu, chukka churut and thambak as smokeless form of tobacco. (Table 9)

41
Table 9- Tobacco use among the Kani tribe
VARIABLE MALE
N=149 (%)
FEMALE
N=149 (%)
TOTAL
N=298 (%)
Current smokers
(tobacco use within past
30 days)
103(69.1) 10(6.7) 113(37.9)
Current daily smokers 90(60.4) 7(4.7) 97(32.6)
Current users of
smokeless tobacco
products(smokeless
tobacco use within past
30 days)
122(81.9)
104(69.8)
226(75.8)
Current daily users of
smokeless tobacco
92(61.7) 87 (58.4) 179(60.1)
Current users of both
smoked and smokeless
tobacco
87(58.4) 9(6) 96(32.2)
Current users of any
form of tobacco
138(92.6) 105(70.5) 243(81.5)
Age of initiation of tobacco
Mean and standard deviation (SD) age of initiation of tobacco smoking was 20 years and
six years respectively with a range of 5-40 years. Mean and standard deviation (SD) age of
initiation of smokeless tobacco use was 24.4 years and 10.75 years respectively with a range of
4-60 years.
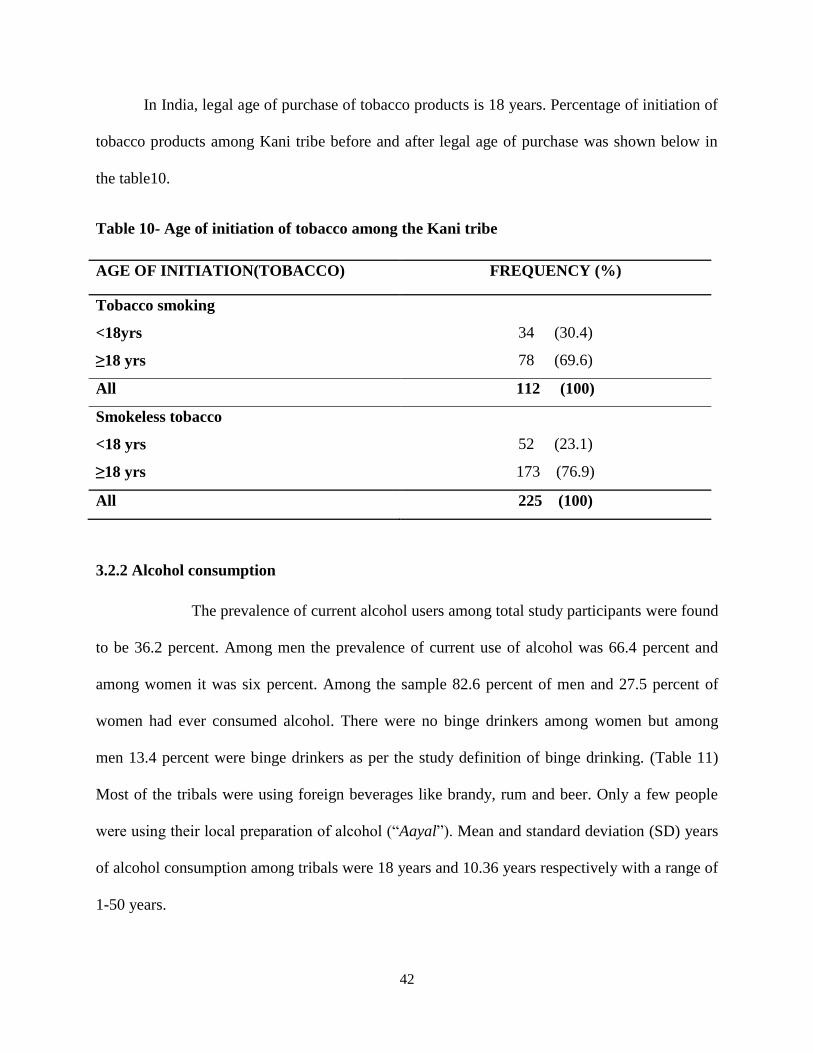
42
In India, legal age of purchase of tobacco products is 18 years. Percentage of initiation of
tobacco products among Kani tribe before and after legal age of purchase was shown below in
the table10.
Table 10- Age of initiation of tobacco among the Kani tribe
AGE OF INITIATION(TOBACCO) FREQUENCY (%)
Tobacco smoking
<18yrs 34 (30.4)
≥18 yrs 78 (69.6)
All 112 (100)
Smokeless tobacco
<18 yrs 52 (23.1)
≥18 yrs 173 (76.9)
All 225 (100)
3.2.2 Alcohol consumption
The prevalence of current alcohol users among total study participants were found
to be 36.2 percent. Among men the prevalence of current use of alcohol was 66.4 percent and
among women it was six percent. Among the sample 82.6 percent of men and 27.5 percent of
women had ever consumed alcohol. There were no binge drinkers among women but among
men 13.4 percent were binge drinkers as per the study definition of binge drinking. (Table 11)
Most of the tribals were using foreign beverages like brandy, rum and beer. Only a few people
were using their local preparation of alcohol (“Aayal”). Mean and standard deviation (SD) years
of alcohol consumption among tribals were 18 years and 10.36 years respectively with a range of
1-50 years.

43
Table 11- Alcohol consumption among the Kani tribe
VARIABLE MALE
N=149 (%)
FEMALE
N=149 (%)
TOTAL
N=298 (%)
Ever consumed alcohol 123 (82.6) 41 (27.5) 164 (55)
Current alcohol users
(Alcohol consumption
within past 30 days)
99 (66.4) 9 (6) 108 (36.2)
Binge drinkers(≥5
standard drinks for male
and ≥4 standard drinks
for female in one
occasion at least once
during past 30 days)1
20 (13.4) 0 20 (6.7)

44
Figure 6-Percentage of people who consumed alcohol within past seven days.
Percentage of people who consumed alcohol within past one week was more on Sunday
and Thursday. And percentage of people who consumed alcohol was least on Monday.
35.20%
10.10%
17.50%
27.80% 35.20%
29.60%
27.80%
PERCENTAGE OF PEOPLE WHO CONSUMED ALCOHOL WITHIN PAST 7 DAYS(N=108)
Sunday
Monday
Tuesday
Wednesday
Thursday
Friday
Saturday

45
3.2.3 Fruits and vegetable consumption-
Among the total tribal participants, no one was consuming at least five servings of fruits
and vegetables per day. Among the total sample 15.4 percent were not at all consuming fruits
and vegetables. All others (84.6%) were consuming less than five servings of fruits and
vegetables per day. (Table 12)
Table 12- Fruit and vegetable consumption among the Kani tribe
VARIABLE
MALE
N=149 (%)
FEMALE
N=149 (%)
TOTAL
N=298 (%)
≥ 5 servings per
day*
0 0 0
<5 servings per
day*
125 (83.9) 127 (85.2) 252 (84.6)
Non users 24 (16.1) 22 (14.8) 46 (15.4)
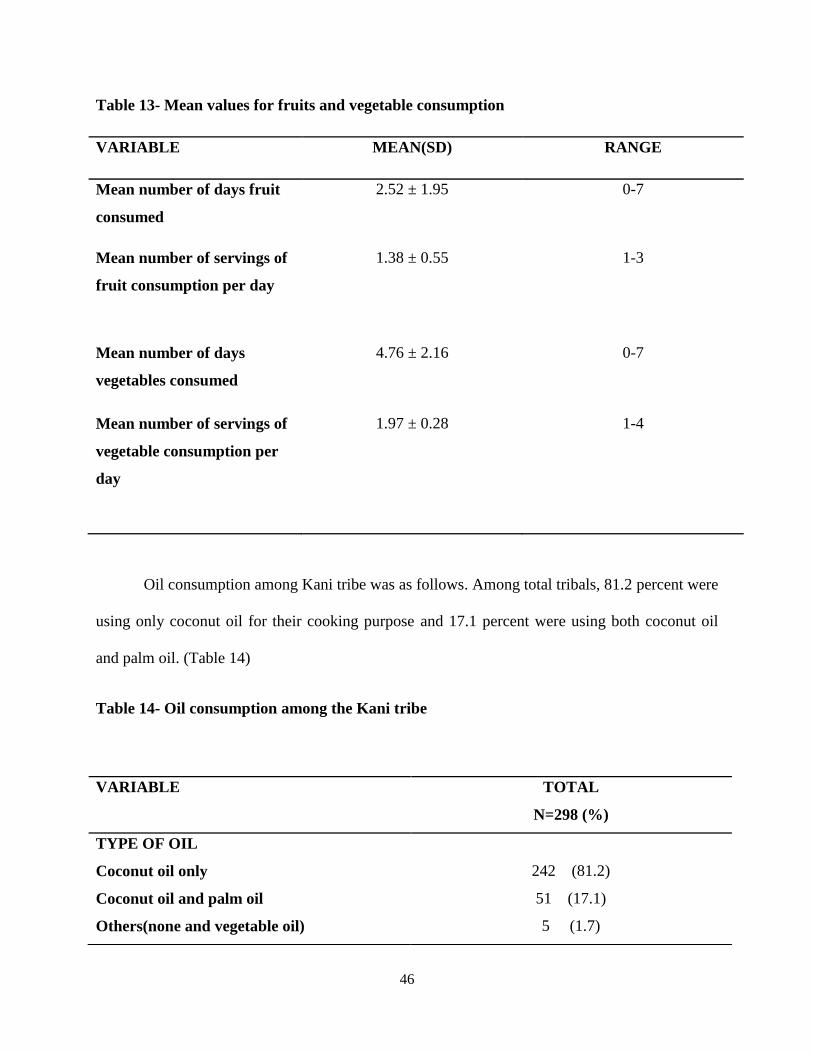
Mean and standard deviation, number of servings of fruit consumption per day was 1.38 and 0.55
respectively. Mean and standard deviation number of servings of vegetable consumption per day
was1.97 and 0.28 respectively. (Table 13)
46
Table 13- Mean values for fruits and vegetable consumption
VARIABLE MEAN(SD) RANGE
Mean number of days fruit
consumed
2.52 ± 1.95 0-7
Mean number of servings of
fruit consumption per day
1.38 ± 0.55 1-3
Mean number of days
vegetables consumed
4.76 ± 2.16 0-7
Mean number of servings of
vegetable consumption per
day
1.97 ± 0.28 1-4
Oil consumption among Kani tribe was as follows. Among total tribals, 81.2 percent were
using only coconut oil for their cooking purpose and 17.1 percent were using both coconut oil
and palm oil. (Table 14)
Table 14- Oil consumption among the Kani tribe
VARIABLE TOTAL
N=298 (%)
TYPE OF OIL
Coconut oil only 242 (81.2)
Coconut oil and palm oil 51 (17.1)
Others(none and vegetable oil) 5 (1.7)
47
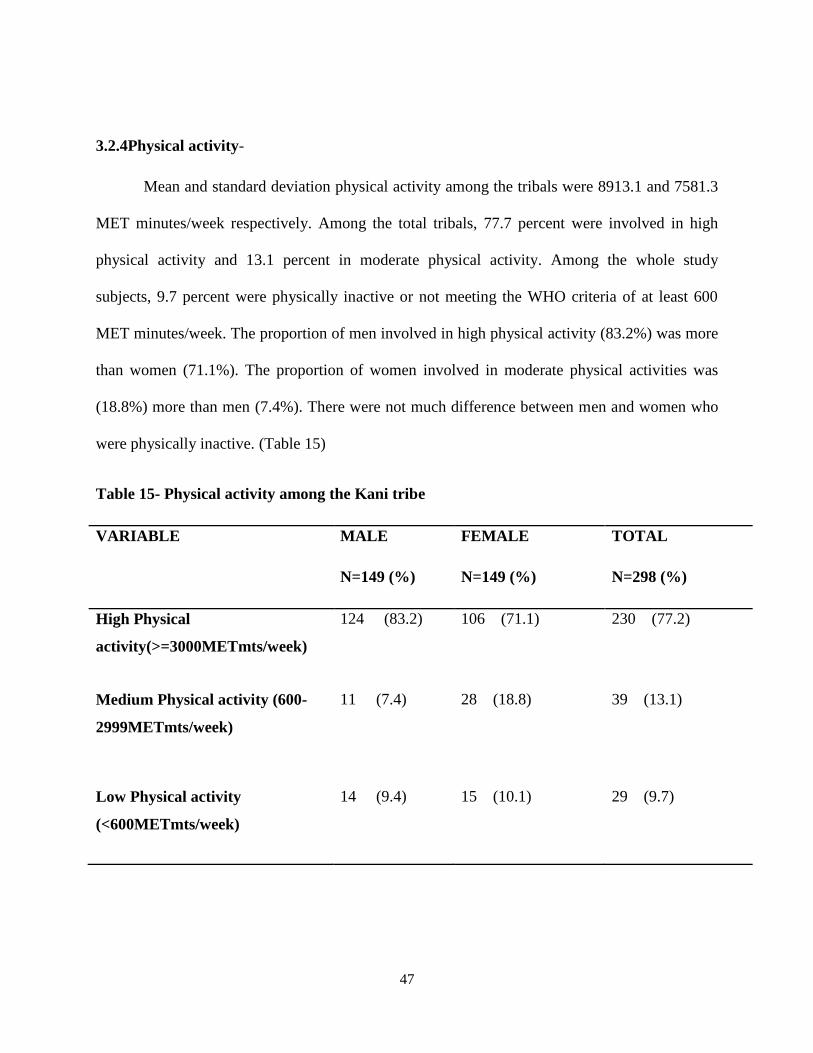
3.2.4Physical activity-
Mean and standard deviation physical activity among the tribals were 8913.1 and 7581.3
MET minutes/week respectively. Among the total tribals, 77.7 percent were involved in high
physical activity and 13.1 percent in moderate physical activity. Among the whole study
subjects, 9.7 percent were physically inactive or not meeting the WHO criteria of at least 600
MET minutes/week. The proportion of men involved in high physical activity (83.2%) was more
than women (71.1%). The proportion of women involved in moderate physical activities was
(18.8%) more than men (7.4%). There were not much difference between men and women who
were physically inactive. (Table 15)
Table 15- Physical activity among the Kani tribe
VARIABLE MALE
N=149 (%)
FEMALE
N=149 (%)
TOTAL
N=298 (%)
High Physical
activity(>=3000METmts/week)
124 (83.2) 106 (71.1) 230 (77.2)
Medium Physical activity (600-
2999METmts/week)
11 (7.4) 28 (18.8) 39 (13.1)
Low Physical activity
(<600METmts/week)
14 (9.4) 15 (10.1) 29 (9.7)
48
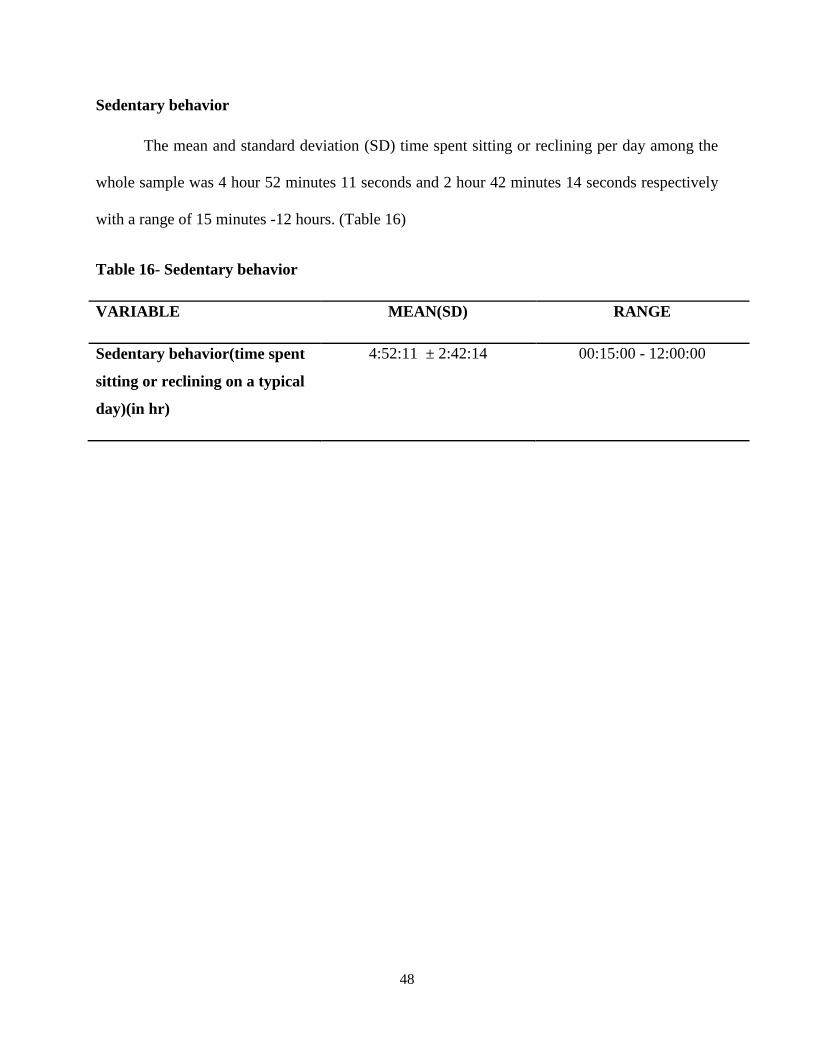
Sedentary behavior
The mean and standard deviation (SD) time spent sitting or reclining per day among the
whole sample was 4 hour 52 minutes 11 seconds and 2 hour 42 minutes 14 seconds respectively
with a range of 15 minutes -12 hours. (Table 16)
Table 16- Sedentary behavior
VARIABLE MEAN(SD) RANGE
Sedentary behavior(time spent
sitting or reclining on a typical
day)(in hr)
4:52:11 ± 2:42:14 00:15:00 - 12:00:00
49
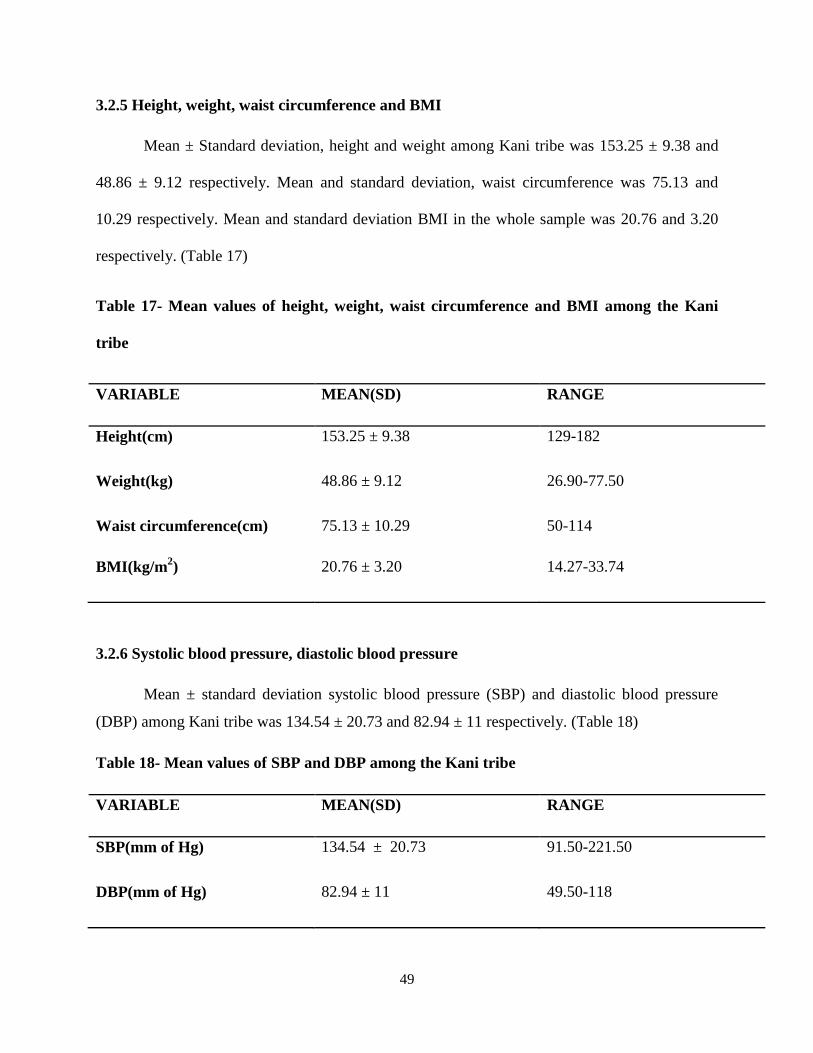
3.2.5 Height, weight, waist circumference and BMI
Mean ± Standard deviation, height and weight among Kani tribe was 153.25 ± 9.38 and
48.86 ± 9.12 respectively. Mean and standard deviation, waist circumference was 75.13 and
10.29 respectively. Mean and standard deviation BMI in the whole sample was 20.76 and 3.20
respectively. (Table 17)
Table 17- Mean values of height, weight, waist circumference and BMI among the Kani
tribe
VARIABLE MEAN(SD) RANGE
Height(cm) 153.25 ± 9.38 129-182
Weight(kg) 48.86 ± 9.12 26.90-77.50
Waist circumference(cm) 75.13 ± 10.29 50-114
BMI(kg/m2) 20.76 ± 3.20 14.27-33.74
3.2.6 Systolic blood pressure, diastolic blood pressure
Mean ± standard deviation systolic blood pressure (SBP) and diastolic blood pressure
(DBP) among Kani tribe was 134.54 ± 20.73 and 82.94 ± 11 respectively. (Table 18)
Table 18- Mean values of SBP and DBP among the Kani tribe
VARIABLE MEAN(SD) RANGE
SBP(mm of Hg) 134.54 ± 20.73 91.50-221.50
DBP(mm of Hg) 82.94 ± 11 49.50-118

50
3.2.7 Hypertension
The prevalence of hypertension among Kani tribe was found out to be 48.3 percent.
Among men the prevalence was 55 percent and among women it was 41.6 percent. (Table 19)
Table 19-Hypertension among the Kani tribe
3.2.8 Overweight
As per the WHO cut off of overweight (BMI ≥ 25kg/m2), the prevalence of overweight
among Kani tribe was 10.8 percent. Among men and women, it was 1.3 percent and 14.8 percent
respectively. The proportion of underweight was 22.5 percent and it was almost the same for
both men and women. (Table 20) According to Indian cutoff of 23 kg/m2, the prevalence of
overweight among Kani tribe was 20.1 percent. Here also, the prevalence is more among women
(28.2%) than men (12.1%).
VARIABLE MALE
N=149 (%)
FEMALE
N=149 (%)
TOTAL
N=298 (%)
Hypertensive 82 (55) 62 (41.6) 144 (48.3)
Non hypertensive 67 (45) 87 (58.4) 154 (51.7)
51
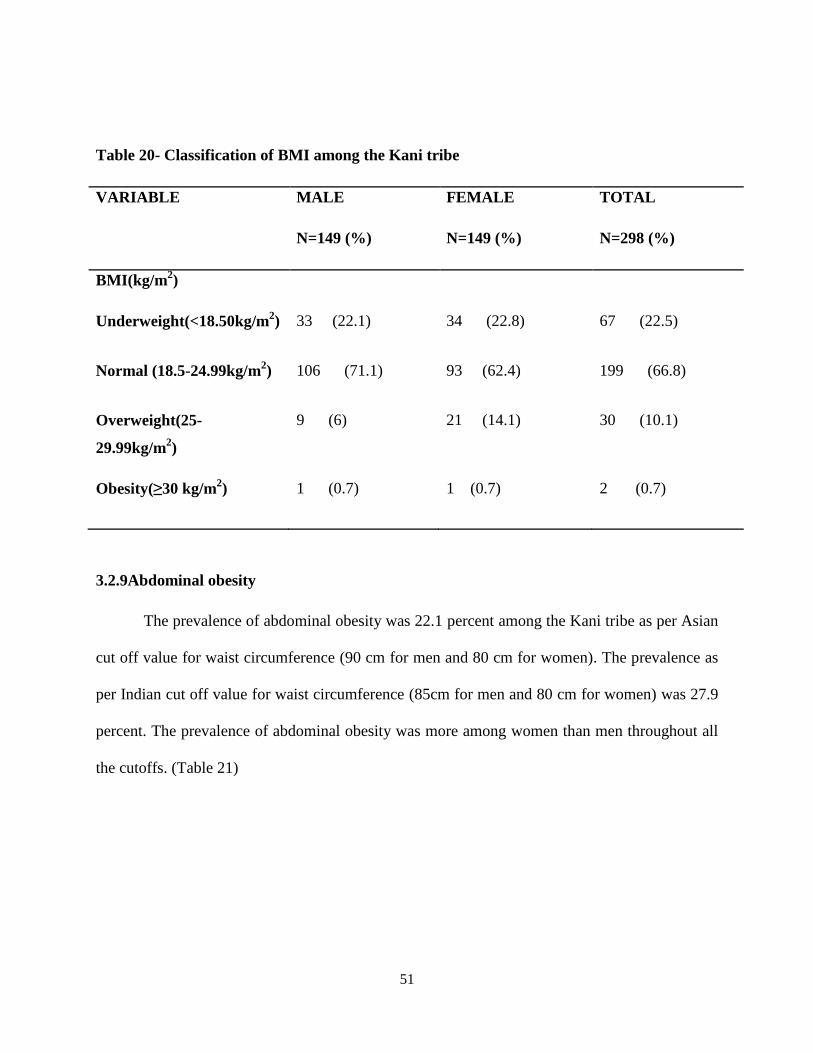
Table 20- Classification of BMI among the Kani tribe
VARIABLE MALE
N=149 (%)
FEMALE
N=149 (%)
TOTAL
N=298 (%)
BMI(kg/m2)
Underweight(<18.50kg/m2) 33 (22.1) 34 (22.8) 67 (22.5)
Normal (18.5-24.99kg/m2) 106 (71.1) 93 (62.4) 199 (66.8)
Overweight(25-
29.99kg/m2)
9 (6) 21 (14.1) 30 (10.1)
Obesity(≥30 kg/m2) 1 (0.7) 1 (0.7) 2 (0.7)
3.2.9Abdominal obesity
The prevalence of abdominal obesity was 22.1 percent among the Kani tribe as per Asian
cut off value for waist circumference (90 cm for men and 80 cm for women). The prevalence as
per Indian cut off value for waist circumference (85cm for men and 80 cm for women) was 27.9
percent. The prevalence of abdominal obesity was more among women than men throughout all
the cutoffs. (Table 21)
52
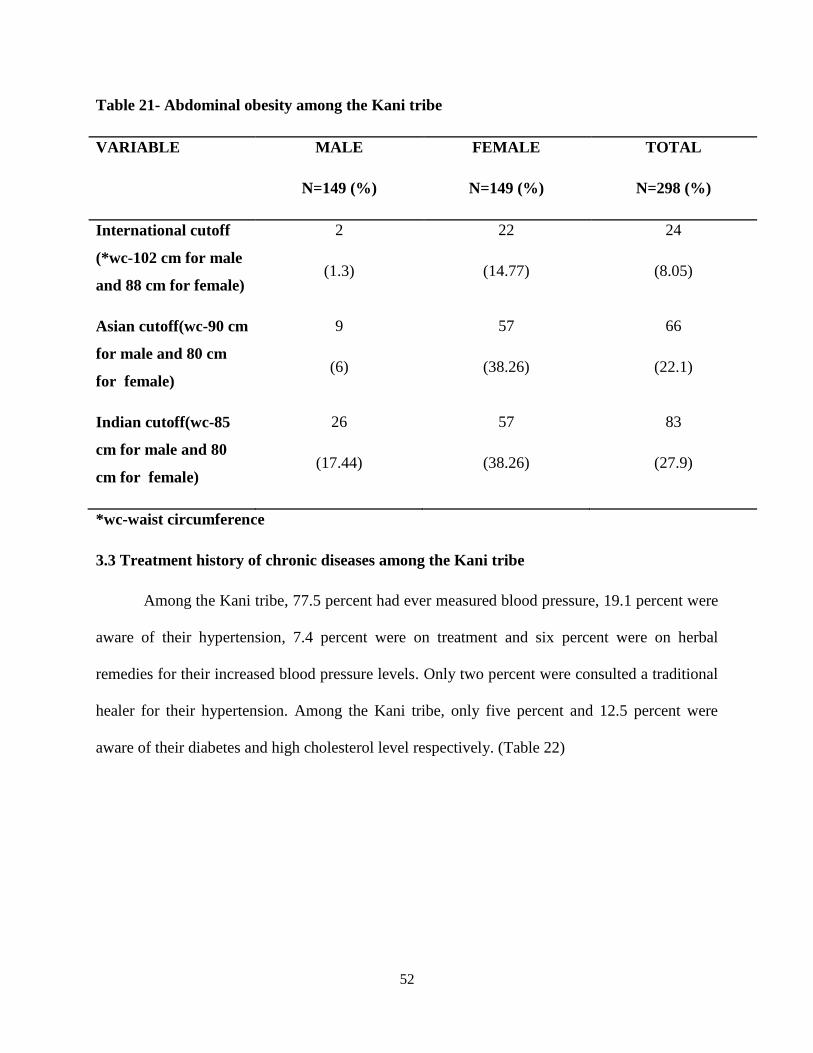
Table 21- Abdominal obesity among the Kani tribe
VARIABLE MALE
N=149 (%)
FEMALE
N=149 (%)
TOTAL
N=298 (%)
International cutoff
(*wc-102 cm for male
and 88 cm for female)
2
(1.3)
22
(14.77)
24
(8.05)
Asian cutoff(wc-90 cm
for male and 80 cm
for female)
9
(6)
57
(38.26)
66
(22.1)
Indian cutoff(wc-85
cm for male and 80
cm for female)
26
(17.44)
57
(38.26)
83
(27.9)
*wc-waist circumference
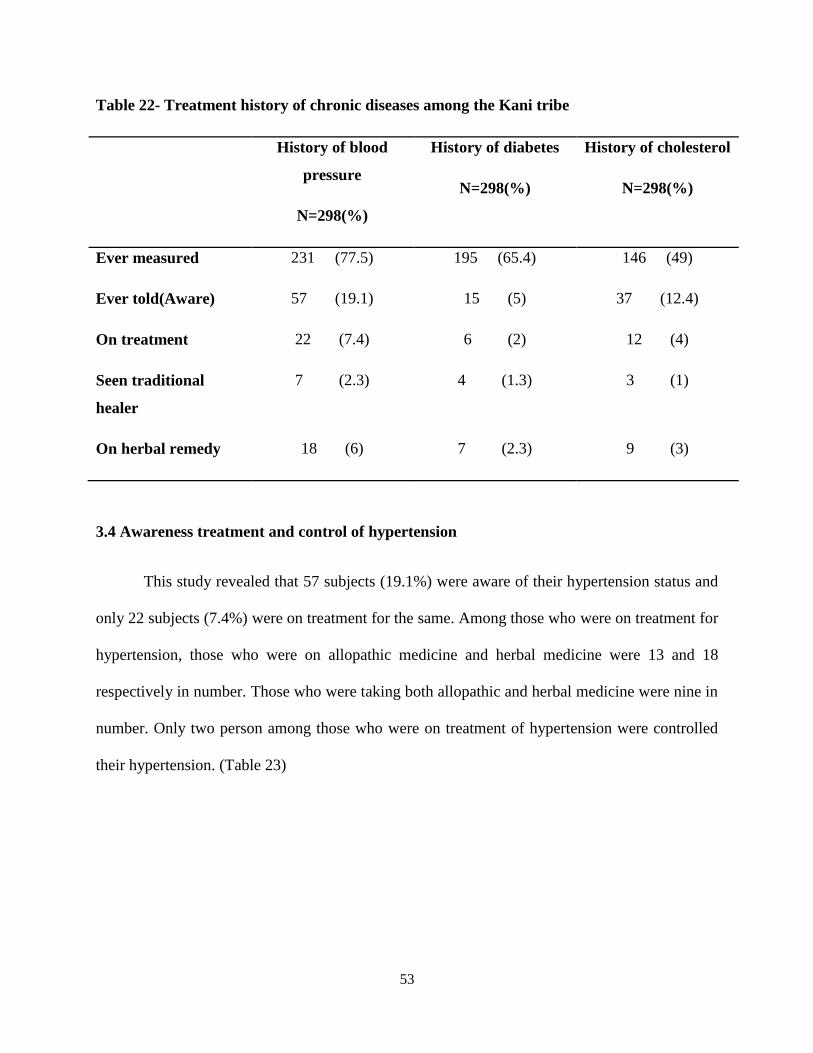
3.3 Treatment history of chronic diseases among the Kani tribe
Among the Kani tribe, 77.5 percent had ever measured blood pressure, 19.1 percent were
aware of their hypertension, 7.4 percent were on treatment and six percent were on herbal
remedies for their increased blood pressure levels. Only two percent were consulted a traditional
healer for their hypertension. Among the Kani tribe, only five percent and 12.5 percent were
aware of their diabetes and high cholesterol level respectively. (Table 22)
53
Table 22- Treatment history of chronic diseases among the Kani tribe
History of blood
pressure
N=298(%)
History of diabetes
N=298(%)
History of cholesterol
N=298(%)
Ever measured 231 (77.5) 195 (65.4) 146 (49)
Ever told(Aware) 57 (19.1) 15 (5) 37 (12.4)
On treatment 22 (7.4) 6 (2) 12 (4)
Seen traditional
healer
7 (2.3) 4 (1.3) 3 (1)
On herbal remedy 18 (6) 7 (2.3) 9 (3)
3.4 Awareness treatment and control of hypertension
This study revealed that 57 subjects (19.1%) were aware of their hypertension status and
only 22 subjects (7.4%) were on treatment for the same. Among those who were on treatment for
hypertension, those who were on allopathic medicine and herbal medicine were 13 and 18
respectively in number. Those who were taking both allopathic and herbal medicine were nine in
number. Only two person among those who were on treatment of hypertension were controlled
their hypertension. (Table 23)

54
Table 23- Awareness, treatment and control of hypertension
Variable Aware *Treated **Controlled
22
Hypertension
57
Allopathic Herbal Both 2
13 18 9
Total 298 22 22 22 22
*Those that are on treatment.
**Controlled-Normotensives among those who are on treatment.
Table 24 - Hypertensives on treatment, normotensives on treatment and hypertensives not
on treatment among the Kani tribe.
VARIABLE MALE FEMALE TOTAL
Elevated BP and not on
treatment
(SBP >=140 or DBP
>=90 and BP on
treatment =0)
79(53) 58(38.9) 137(46)
Normotensive and on
treatment
(SBP<140 and DBP
<90 and BP on
treatment =1)
0 3(2) 3(1)
Elevated BP and on
treatment
(SBP >=140 or DBP
>=90 and BP on
treatment =1)
69(46.3) 52(34.9) 121(40.6)

55
3.5 History of chest pain on exertion
Among the tribals, 30.2 percent reported history of chest pain on exertion. More women
were having history of chest pain on exertion (34.2%) than men (26.2%).
3.6 History of cervical cancer screening
Only one person had done cervical cancer screening (6.7%) among tribals.
3.7 COMBINED RISK
Among the tribals, 28.2 percent were at high risk for developing NCDs. Men were found
to be at higher risk than women. All the study subjects had at least one of the risk factors present.
(Table 25)
Table 25-Combined risk* among the Kani tribe
VARIABLE MALE
N=149 (%)
FEMALE
N=149 (%)
TOTAL
N=298 (%)
High risk(≥3 risk
factors)
63(42.3) 21(14.1) 84(28.2)
Low risk(<3 risk
factors)
86(57.7) 128(85.9) 214(71.8)
Presence of none of
the risk factors
0 0 0
*Risk factors used to estimate combined risk are current daily smokers, less than five servings of fruit and
vegetables per day, low level of activity(<600MET minutes/week), overweight or obesity(BMI≥25kg/m2)
and raised blood pressure(SBP ≥140 mm of Hg or DBP ≥90 mm of Hg or Hypertension on treatment)57
56
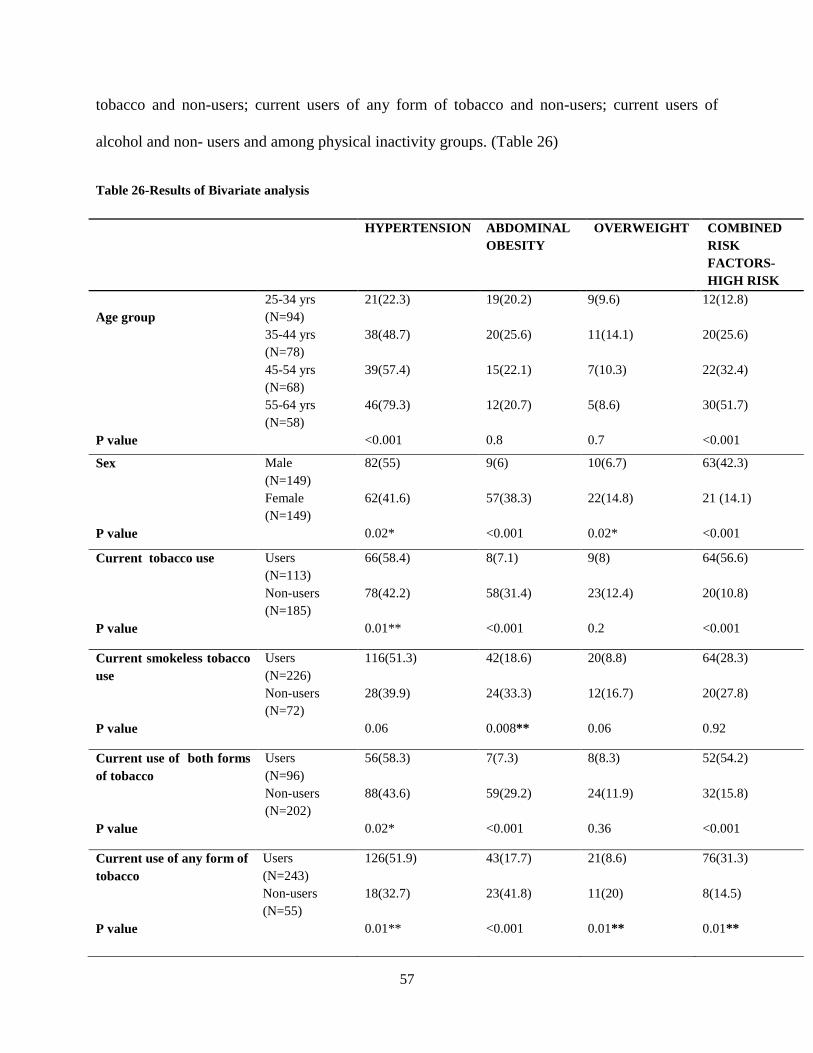
3.8 RESULTS OF BIVARIATE ANALYSIS
Bivariate analysis (Chi square test) was done using hypertension, abdominal obesity, over
weight and combined risk factors as outcome variable. Association between dependent variables
and independent variables were done using R statistical package 3.1.1.55,56
(Table 26)
HYPERTENSION-
Bivariate analysis showed that the prevalence of hypertension was significantly different
among different age groups (p<0.001). Prevalence of hypertension increases with age. The
prevalence of hypertension was significantly different between men and women; current tobacco
users and non-users; current smokeless tobacco users and non-users; current users of both forms
of tobacco and non-users; current users of any form of tobacco and non-users; current users of
alcohol and non -users. (Table 26)
ABDOMINAL OBESITY-
The risk of abdominal obesity was significantly different between men and women; all
categories of tobacco users and non- users; current users of alcohol and non-users. (Table 26)
OVERWEIGHT-
Prevalence of overweight was significantly different between men and women; current
users of any form of tobacco and non-users. (Table 26)
COMBINED RISK FACTORS-HIGH RISK
High risk for developing NCDs (High risk ≥3 risk factors) was significantly different
between men and women; current tobacco users and non-users; current users of both forms of
57
tobacco and non-users; current users of any form of tobacco and non-users; current users of
alcohol and non- users and among physical inactivity groups. (Table 26)
Table 26-Results of Bivariate analysis
HYPERTENSION
ABDOMINAL
OBESITY
OVERWEIGHT
COMBINED
RISK
FACTORS-
HIGH RISK
Age group
25-34 yrs
(N=94)
21(22.3) 19(20.2) 9(9.6) 12(12.8)
35-44 yrs
(N=78)
38(48.7) 20(25.6) 11(14.1) 20(25.6)
45-54 yrs
(N=68)
39(57.4) 15(22.1) 7(10.3) 22(32.4)
55-64 yrs
(N=58)
46(79.3) 12(20.7) 5(8.6) 30(51.7)
P value <0.001 0.8 0.7 <0.001
Sex Male
(N=149)
82(55) 9(6) 10(6.7) 63(42.3)
Female
(N=149)
62(41.6) 57(38.3) 22(14.8) 21 (14.1)
P value 0.02* <0.001 0.02* <0.001
Current tobacco use Users
(N=113)
66(58.4) 8(7.1) 9(8) 64(56.6)
Non-users
(N=185)
78(42.2) 58(31.4) 23(12.4) 20(10.8)
P value 0.01** <0.001 0.2 <0.001
Current smokeless tobacco
use
Users
(N=226)
116(51.3) 42(18.6) 20(8.8) 64(28.3)
Non-users
(N=72)
28(39.9) 24(33.3) 12(16.7) 20(27.8)
P value 0.06 0.008** 0.06 0.92
Current use of both forms
of tobacco
Users
(N=96)
56(58.3) 7(7.3) 8(8.3) 52(54.2)
Non-users
(N=202)
88(43.6) 59(29.2) 24(11.9) 32(15.8)
P value 0.02* <0.001 0.36 <0.001
Current use of any form of
tobacco
Users
(N=243)
126(51.9) 43(17.7) 21(8.6) 76(31.3)
Non-users
(N=55)
18(32.7) 23(41.8) 11(20) 8(14.5)
P value 0.01** <0.001 0.01** 0.01**

58
HYPERTENSION
ABDOMINAL
OBESITY
OVERWEIGHT
COMBINED
RISK
FACTORS
Current use of alcohol Users
(N=108)
60(55.6) 6(5.6) 6(5.6) 48(44.4)
Non-users
(N=56)
31(55.4) 11(19.6) 8(14.3) 15(26.8)
P value 0.02* <0.001
0.09 <0.001
Physical activity High Physical
activity(N=230)
108(47) 47(20.4) 25(10.9) 57(24.8)
Medium Physical
activity(N=39)
19(48.7) 13(33.3) 5(12.8) 7(17.9)
Low Physical
activity(N=29)
17(58.6) 6(20.7) 2(6.9) 20(69)
P value 0.5 0.2 0.7 <0.001
*p<0.05, **p<0.01

59
3.9 RESULTS OF MULTIVARIATE ANALYSIS FOR HYPERTENSION
To find out the individual factors associated with hypertension, multivariate
regression analysis (Logistic Regression analysis) was performed using age group, sex,
education, socioeconomic status, current tobacco smoking, current smokeless tobacco
use, current use of both forms of tobacco, current use of alcohol and physical activity
groups as independent variable and hypertension as dependent variable. After adjusting
for the above variables, it was found that age group and current alcohol consumption
were positively associated with hypertension and education was negatively associated
with hypertension.
As compared to 25-42 yrs age group, the risk of developing hypertension was 2.28
(OR=2.28, CI=1.03-5.03) times higher among 42-65 years and this association was
significant at five percent level.
The risk of developing hypertension was 9.43(OR=9.43, CI=1.11-80.28) times
higher among users of alcohol as compared to non-users and this association was
significant at five percent level.
Those with higher education (≥High school level) had lower odds of having
hypertension (OR=0.27 CI=0.08-0.87) when compared to those with education less than
high school level. This association was significant at five percent level. (Table 27)
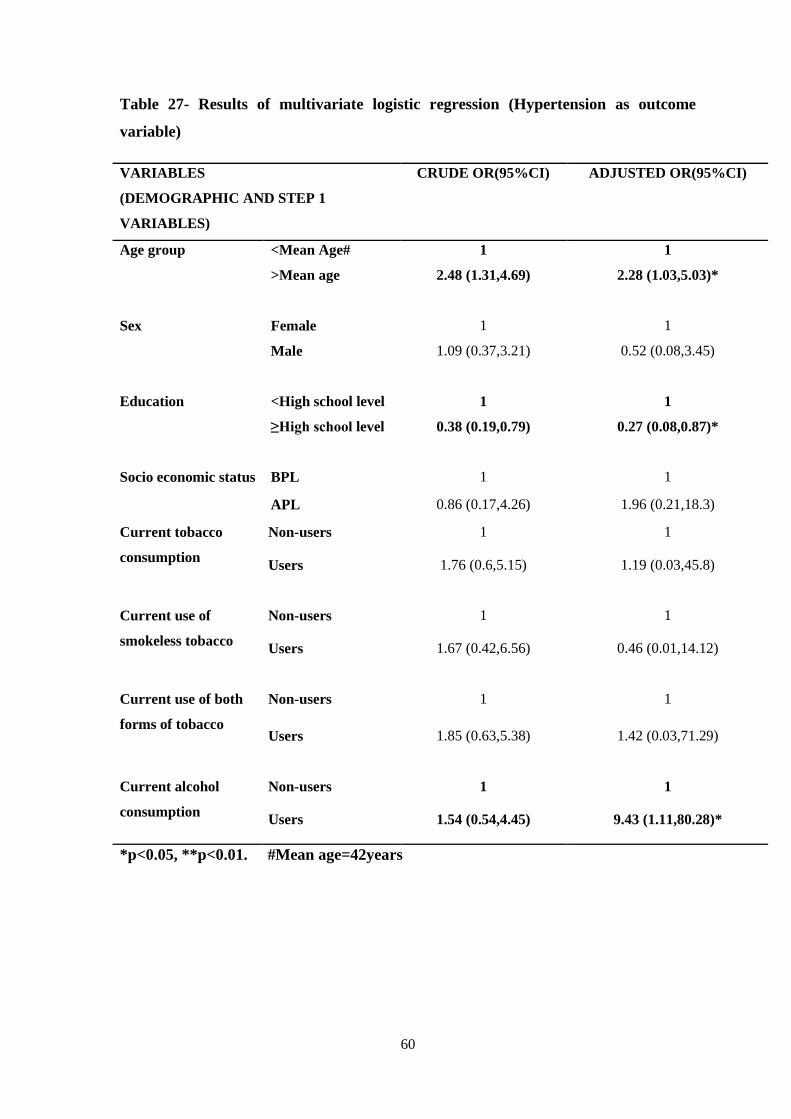
60
Table 27- Results of multivariate logistic regression (Hypertension as outcome
variable)
VARIABLES
(DEMOGRAPHIC AND STEP 1
VARIABLES)
CRUDE OR(95%CI) ADJUSTED OR(95%CI)
Age group <Mean Age# 1 1
>Mean age 2.48 (1.31,4.69) 2.28 (1.03,5.03)*
Sex Female 1 1
Male 1.09 (0.37,3.21) 0.52 (0.08,3.45)
Education <High school level 1 1
≥High school level 0.38 (0.19,0.79) 0.27 (0.08,0.87)*
Socio economic status BPL 1 1
APL 0.86 (0.17,4.26) 1.96 (0.21,18.3)
Current tobacco
consumption
Non-users 1 1
Users 1.76 (0.6,5.15) 1.19 (0.03,45.8)
Current use of
smokeless tobacco
Non-users 1 1
Users 1.67 (0.42,6.56) 0.46 (0.01,14.12)
Current use of both
forms of tobacco
Non-users 1 1
Users 1.85 (0.63,5.38) 1.42 (0.03,71.29)
Current alcohol
consumption
Non-users 1 1
Users 1.54 (0.54,4.45) 9.43 (1.11,80.28)*
*p<0.05, **p<0.01. #Mean age=42years
61
CHAPTER 4
DISCUSSION AND CONCLUSION
The present study has revealed high prevalence of NCD risk factors among the
Kani tribe in Thiruvananthapuram district, Kerala. Among the 298 subjects, the
prevalence of hypertension was found to be much higher (48.3%) than the general
population. This is one of the first studies using the WHO step-wise approach to find out
the prevalence of NCD risk factors among tribes in Kerala.
4.1 Characteristics of the sample and the Kani tribal context:
Same number of men and women were enrolled in the study. The age group
chosen for the study was 25-64 years as per WHO recommendation. Most of the Kani
settlements were difficult to access areas with mountains and steep terrain.
There is an apparent shift from food crops to cash crops among the Kani tribe.
Earlier they were mainly engaged in agriculture and traditional handicrafts (“Eera”
works) for their livelihood. Now the proportion of farmers and “Eera” workers have come
down to four percent and 1.34 percent respectively and most of the men undertake daily
wage labor and rubber tapping for the livelihood. More women were engaged in Mahatma
Gandhi National Rural Employment Guarantee Act (MGNREGA) than men. However
most women were homemakers doing their household chores. Most of them were living
in huts made of “Eera” leaves and mud bricks. People from settlements such as
“Chathankodu” and “Podiyakala” were unable to cultivate any vegetables because of
nuisance of wild animals such as wild elephant, wild pig, monkey and tiger.
Though Kani tribe is the most educated tribal group in Kerala, only 11.4 percent
had education above high school level. One tenth (13.1%) have no formal education.

62
Most of the Kani children quit schooling at the high school level and go for labor works
to earn livelihood to support their family.
Among the Kani tribe, 34.9 percent were cohabiting. Some of the participants
mentioned money constraint as the reason for cohabitation. On exploration it was found
that there exists a “Dowry system” (“Penpanam/Athyarapanam”) among the Kani tribe,
wherein the bridegroom has to give money to the bride’s family.64
Practical difficulties:
Due to some logistic issues the investigator couldn’t strictly adhere to the KISH
tables (Availability of men in the households was less due to their work schedule). The
investigator had to go to the concerned work places in each settlement or had to wait for
them to arrive after work to get the male participants for the study. Men and women were
selected alternatively from consequent households at first as per the plan but couldn’t
strictly adhere to that also due to lack of men at the households.
4.2 Profile of NCD risk factors
4.2.1Tobacco use
The prevalence of current tobacco smoking among the Kani tribe was 37.9
percent, which is higher than the reported figures for the overall rural and urban
population of Kerala (24.3%and 22.6% respectively) but comparable to the slum
population (37.3%).6
The prevalence of current smoking among the Kani men (69.1%)
were almost double the national average among the men (37%).61
The prevalence is also
much higher than the general male population of Kerala(40%).26
Main form of smoking
tobacco among men was beedi. But some were using Kanjavu. Most of the tribals
reported peer influence as the major factor that influenced the tobacco initiation.
63
Prevalence of current smoking among the Kani women (6.7%) was also higher than the
national average among women (1.4%).61
Similar to general population, the prevalence of
current smoking was more among men than women. In nutshell, prevalence of tobacco
smoking among Kani tribe was much higher when compared to the non-tribal population
of India.
The prevalence of smokeless tobacco use was 75.8 percent and is much higher
than the national average for the same (38%).61
However the prevalence is closer to that
of the Mishing tribe of Assam (78.9%).30
As per NFHS3, only eight percent women and
37 percent men were using smokeless tobacco. But among the Kani tribe it was much
more (69.8% and 81.9% among men and women respectively). Since past years, they
have a habit of chewing tobacco irrespective of age and sex. Some men were using
sambhu, chukka churut and thambak as smokeless form of tobacco. Most women reported
cultural influence and the influence of peer during MGNREGA works as reasons for
starting smokeless tobacco.
The study also revealed a high prevalence of current use of tobacco in any form
among the Kani tribe (92.6% among men, 70.5% among women and 81.5% among both
men and women). It was much higher than ever use of tobacco among primitive tribes in
Kerala (76.3% among men, 47.2% among women), as revealed in the study by NIN,
ICMR .12
Among those who consume tobacco products, one third started their smoking
habit and a quarter started their tobacco chewing habit much before attaining the legal age
for purchase of tobacco products.

64
4.2.2 Alcohol consumption
The prevalence of current alcohol consumption among the Kani tribe was 36.2
percent which is slightly higher than national prevalence (32%) as stated by NFHS3.61
Prevalence is much higher than rural, urban or slum population of Kerala, as revealed in
the work of Thankappan et al.6
The prevalence of current alcohol use among Kani men
(66.4%) was higher than the prevalence among primitive tribal men in Kerala (53.1%).12
The work by IIPS states that alcohol consumption among women in India is only
two percent.61
But among the Kani tribe current users of alcohol among women were six
percent. Among the Kani tribes, 27.5 percent women had consumed alcohol at least once
in their lifetime. Among primitive tribe in Kerala, the alcohol consumption among
women were only 0.7 percent, as reported by Meshram et al.12
And in general population
of Kerala, alcohol consumption among women were only 0.9%.26
Thus among the Kani
tribes, prevalence of alcohol consumption among men and women were markedly higher
than general population of Kerala.6
As per this study, there were no binge drinkers among women. Binge drinkers
among men were 13.4 percent. According to a study among the tribes of Andhra Pradesh,
a predominant use of locally prepared alcoholic beverages were found to be preferred by
the tribes rather than harmless beverages such as hot milk and tea were found.32
Most of
the Kani tribals were using foreign beverages like brandy, rum and beer. Only a few
people were using their local preparation of alcohol (“Aayal”). Consumption of milk and
milk tea which is common among general population was not there among the Kani
tribes. Most of them consume black tea without sugar.
Proportions of people who consumed alcohol within the past one week of the
study were more on Sunday and Thursday. And percentage of people who consumed
65
alcohol was least on Monday. The reason for this could be the fact that the tribals
purchase alcohol when they go out on market days, those being Thursdays. On Mondays
everyone would be busy with their work after the no wage day on Sundays.
4.2.3 Fruits and vegetable consumption
Among the Kani tribe, the percentage of people who were consuming at least five
servings of fruits and vegetables were found out to be zero. Among the total sample, 84.6
percent were consuming less than five servings of fruits and vegetables per day. It is
comparable to an earlier study by Shah B and Mathur P whose figures for men and
women were 82.1 percent and 87.2 percent respectively.62
Fruits and vegetable intake
among this tribes are much less compared to even the slum population in Kerala as
revealed in the study by Thankappan et al.6
There were many people in among the Kani
tribe who were not at all consuming even a single serving of fruits and vegetables per day
(15.4%). In most of the settlements, rubber and acacia plantations have now replaced the
agricultural land. So the tribals living in those settlements were hardly having space to
cultivate the fruits and vegetables for themselves. And those who were having the space
to cultivate were neither cultivating anything nor taking adequate servings of fruits and
vegetables. Most of them now started buying fruits and vegetables from the market. This
may be a perfect reflection of influence of urban lifestyle onto this tribal population.
More than 3/4th
of the tribals were using coconut oil for their cooking purpose.
4.2.4 Physical activity:
Among the Kani tribe, 77.2 percent were involved in high physical activity and
13.1 percent in moderate physical activity. Prevalence of high physical activity among the
tribals was very high when compared to general population of Kerala. Moderate physical
activity among the tribals were much lesser when compared to general population of
66
Kerala.6
Higher physical activity was less prevalent among women. More exploration is
needed to find out the cultural influence on physical activity among women.
This study revealed 9.7 percent physical inactivity among the Kani tribe that is
comparable to the urban population of Kerala (9.5%). But the prevalence is much higher
than rural and slum populations of Kerala6
and tribes of Assam.30
There were not much
differences among the proportions of men and women who were physically inactive
among the Kani tribe.
The sedentary behavior (Mean time spent sitting or reclining per day) among the
Kani tribe (292.11 minutes) was also higher when compared to Mishing tribe (127.44
minutes) from Assam30
.
It is heartening to see that overall physical activity was still high among the Kani
tribe even though physical inactivity is prevalent among many. This higher prevalence of
physical inactivity warrants rapid attention.
4.2.5 Overweight and abdominal obesity
Prevalence of abdominal obesity among the Kani tribe (22.1%) is almost double
when compared to Mishing tribes of Assam (11.4%).30
It is much less compared to
urban(41.9%), rural(33.9%) and slum population(42.4%) of Kerala.6
This may be because
of high level of physical activity among them. However one in five (20.4%) men and
women were having abdominal obesity among the Kani tribe.
The prevalence of overweight among the Kani tribe was 10.8 percent which is
lesser than Mishing tribe from Assam.30
As in general population the prevalence of
abdominal obesity and overweight were higher among women than in men in this tribal
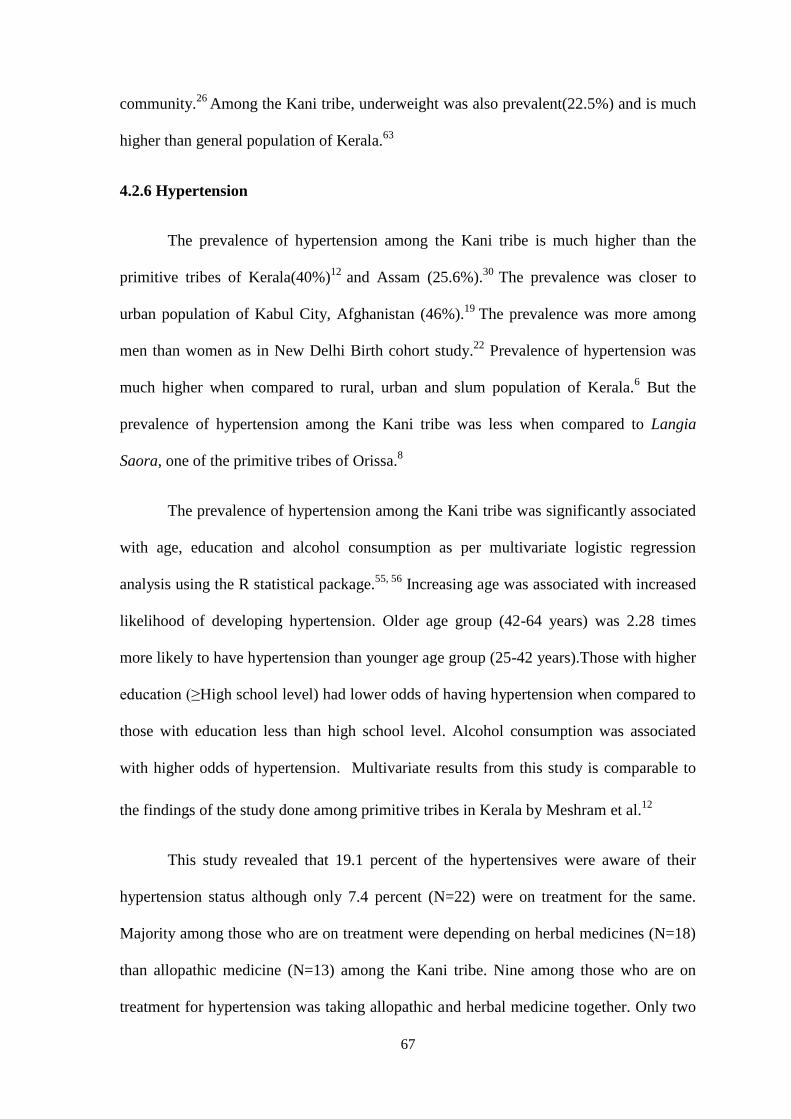
67
community.26
Among the Kani tribe, underweight was also prevalent(22.5%) and is much
higher than general population of Kerala.63
4.2.6 Hypertension
The prevalence of hypertension among the Kani tribe is much higher than the
primitive tribes of Kerala(40%)12
and Assam (25.6%).30
The prevalence was closer to
urban population of Kabul City, Afghanistan (46%).19
The prevalence was more among
men than women as in New Delhi Birth cohort study.22
Prevalence of hypertension was
much higher when compared to rural, urban and slum population of Kerala.6 But the
prevalence of hypertension among the Kani tribe was less when compared to Langia
Saora, one of the primitive tribes of Orissa.8
The prevalence of hypertension among the Kani tribe was significantly associated
with age, education and alcohol consumption as per multivariate logistic regression
analysis using the R statistical package.55, 56
Increasing age was associated with increased
likelihood of developing hypertension. Older age group (42-64 years) was 2.28 times
more likely to have hypertension than younger age group (25-42 years).Those with higher
education (≥High school level) had lower odds of having hypertension when compared to
those with education less than high school level. Alcohol consumption was associated
with higher odds of hypertension. Multivariate results from this study is comparable to
the findings of the study done among primitive tribes in Kerala by Meshram et al.12
This study revealed that 19.1 percent of the hypertensives were aware of their
hypertension status although only 7.4 percent (N=22) were on treatment for the same.
Majority among those who are on treatment were depending on herbal medicines (N=18)
than allopathic medicine (N=13) among the Kani tribe. Nine among those who are on
treatment for hypertension was taking allopathic and herbal medicine together. Only two

68
persons among those who were on treatment had their hypertension under control.
Awareness and treatment of other NCDs such as diabetes and high cholesterol level were
also very low among the Kani tribe.
Kani tribe was famous for their traditional knowledge on medicinal plants. But
only a small percentage was consulting the traditional healer (“Plathy”) for their chronic
diseases. Most of them were aware of the home remedies to manage and prevent
different ailments.52, 54
But only six percent were on herbal remedy to manage their high
blood pressures. Even now the most preferred treatment option for any disease among
them is their own herbal medicine. Unfortunately the transfer of traditional knowledge to
the next generation is endangered now. This may be the reason behind less utilization of
herbal remedies among them. This might be one of the reasons for higher burden of NCD
risk factors among the Kani tribe.
Awareness, treatment and control of hypertension were much less among the Kani
tribe when compared to general population of Kerala.6 Though they had access to mass
media in most of these tribal settlements, their levels of awareness on treatment and
control of hypertension were very low. Most of the tribals were not utilizing the health
system properly because of difficulty in access, increased waiting time to see the doctor,
lack of medicines in the primary health centre, lack of facilities in the primary health
centre and the transportation cost. A study among the tribal groups of Rajasthan says that
the tribals have lost their trust in the health system.45
Most of the Kani tribal people had
also lost their trust in the health system as far as they are concerned.
So the Kani tribes were not utilizing the health system nor do they use their own
traditional knowledge to prevent the diseases. There is an urgent need for the health
sector to take appropriate action to safeguard their health.
69
4.2.7 Combined risk:
The risk factors that were used to estimate the combined risk are as follows.57
a. Current daily smokers
b. Less than five servings of fruit and vegetables per day
c. Low level of activity(<600MET minutes/week)
d. Overweight or obesity(BMI≥25kg/m2)
e. Raised Blood pressure(SBP ≥140 mm of Hg or DBP ≥90 mm of Hg or
Hypertension on treatment)
Those having three or more risk factors were included in high risk category.
Among the Kani tribe, 28.2 percent were having high risk of developing NCD. Our
estimate of high risk category is slightly more than the Mangolian people (27%) as stated
by Mangolian STEPS Survey on the prevalence of non communicable disease and injury
risk factors-2009.57
The proportion of men with high risk for developing NCD was more
when compared to females. Everyone in the study subjects had at least one risk factor
present. This is a clear evidence of mounting NCD burden among the Kani tribes.
4.3 History of cervical cancer screening
This study revealed that only one person had done cervical cancer screening
(6.7%) among tribals.

70
4.4 STRENGTHS OF THE STUDY
a. There are limited studies on NCD risk factors among tribes from India
especially from Kerala using a standard tool like WHO step wise approach
for surveillance of NCD risk factors.
b. To my knowledge this is the first study from Kerala and second study from
India to assess the prevalence of NCD risk factors among tribes using a
standard tool like WHO step wise approach for surveillance of NCD risk
factors.
c. Data collection was done by a single investigator. So the chance of inter
observer bias was eliminated.
d. Good response rate (96.4%).
e. Male participation was adequate (50%) in this study.
f. Adoption of Kish method avoided the chance of random error.
4.5 LIMITATIONS OF THE STUDY
a. Self reported information on diet and physical activity might have resulted
in overestimation of the results.
b. Occupation categories in WHO questionnaire were not sufficient to
capture Kani tribe’s vocational activities.
c. Qualitative aspects were not covered. So the exact contextual story might
be missing.

71
4.6 CONCLUSION
a. Prevalence of hypertension was higher (48.3%) among Kani tribe when
compared to general population. Prevalence of hypertension was higher
among the elder age group, less educated groups and alcohol users.
b. Among the Kani tribe, the fruits and vegetable consumption was found
totally insufficient. This will be a perfect reflection of impact of
urbanization and adoption of urban lifestyles in this literate tribal
community.
c. Tobacco use in any form (81.5%), alcohol use (36.2%) and physical
inactivity (9.7%) were high among Kani tribe in Thiruvananthapuram
district when compared to general population.
d. The overall physical activity is still high among this tribal group. However
abdominal obesity (22.1%) and overweight (10.1%) were also present at
significant levels.
e. Awareness, treatment and control of hypertension were very low among
Kani tribe. Even now the most preferred treatment option for any disease
among them is their own herbal medicine. Unfortunately the transfer of
traditional knowledge to the next generation is endangered now. Only six
percent were on herbal remedy to manage their high blood pressures.
f. There is an apparent shift from cultivation of food crops to cash crops
(agricultural work to rubber tapping) among the Kani tribe as earlier they
were solely depending on agriculture and traditional handicrafts for their
livelihood.

72
4.7 IMPLICATIONS
a. This study calls for focused intervention to address the mounting NCD risk
factors among the Kani tribes in Kerala.
b. Concerted action for the documentation of traditional knowledge should be
undertaken to safeguard traditional medicinal capabilities of the tribal
people, before it get endangered.
c. Efforts should be undertaken to establish the tribal people’s trust in the
health care delivery system.
d. Exploratory ethnographic research is needed to understand the contextual
and behavioral aspects of tribal life in the state for meaningful healthcare
intervention.

73
REFERENCES
1. World Health Organization. Non-communicable diseases [homepage on the Internet].
WHO;2014.Available from: http://www.who.int/mediacentre/factsheets/fs355/en/.
[Accessed on 2014 Jan 23].
2. Murray CJL, Vos T, Lozano R, Naghavi M, Flaxman AD, Michaud C, et al. Disability-
adjusted life years (DALYs) for 291 diseases and injuries in 21 regions, 1990–2010: a
systematic analysis for the Global Burden of Disease Study 2010. Lancet
2012;380(9859):219–23.
3. World Health Organization. Global status report on non communicable diseases 2010
[Internet].WHO;2014.Availablefrom:http://www.who.int/nmh/publications/ncd_report20
10/en/. [Accessed on 2014 Feb 20].
4.Sacco R, Smith S, Holmes D, Shurin S, Brawley O, Cazap E, et al. Accelerating
progress on non-communicable diseases. Lancet 2013;382(9895):e4–e5.
5.Kinra S,Bowen LJ,Lyngdo T,Prabhakaran D,Reddy KS,Ramakrishnan L et al.
Sociodemographic patterning of non-communicable disease risk factors in rural India: a
cross sectional study.BMJ 2010;341:C4974.
6. Thankappan KR, Shah B, Mathur P, Sarma PS, Srinivas G, Mini GK, et al. Risk factor
profile for chronic non-communicable diseases: results of a community-based study in
Kerala, India. Indian J Med Res 2010;131:53–63.
7. Khongsdier R. Increasing urbanisation in tribal states of Northeast India: implications
for the prevalence of chronic diseases. Health Nutr Probl Indig Popul Tribes Tribals
2008;2:25–33.
8. Kerketta AS, Bulliyya G, Babu BV, Mohapatra SSS, Nayak RN. Health status of the
elderly population among four primitive tribes of Orissa, India: a clinico-epidemiological
study.Z Gerontol Geriatr 2009;42(1):53–9.
9. Sachdev B. Prevalence of hypertension and associated risk factors among Nomad Tribe
groups. Online J Anthropol 2011;7: 181–9.
10. Mukhopadhyay B, Mukhopadhyay S, Majumder PP. Blood pressure profile of
Lepchas of the Sikkim Himalayas: epidemiological study. Hum Biol 1996;68(1):131–45.
11. Basavegowda M, Ashok N, Hathur B. Hypertension: An emerging threat among tribal
population of Mysore; Jenu Kuruba tribe diabetes and hypertension study. Int J Health
Allied Sci 2013;2(4):270.

74
12. Meshram II, Arlappa N, Balkrishna N, Rao KM, Laxmaiah A, Brahmam GNV.
Prevalence of hypertension, its correlates and awareness among adult tribal population of
Kerala state, India. J Postgrad Med 2012;58(4):255–61.
13. Kakkoth Seetha.The primitive tribal groups of Kerala:a situational appraisal. Stud
Tribes Tribals 2005;3(1):47-55.
14. NR Nithya.Globalization and the plight of tribals:The case of Kerala,India.The Dawn
Journal 2014;3(1):12.
15.Ayyanar M, Ignacimuthu S. Traditional knowledge of Kani tribals in Kouthalai of
Tirunelveli hills, Tamil Nadu, India. J Ethnopharmacol 2005;102(2):246–55.
16. Clark H. NCDs: a challenge to sustainable human development. Lancet
2013;381(9866):510–1.
17. Ikeda N, Inoue M, Iso H, Ikeda S, Satoh T, Noda M, et al. Adult mortality attributable
to preventable risk factors for non-communicable diseases and injuries in Japan: a
comparative risk assessment. PLoS Med 2012;9(1):e1001-160.
18. Jayawardena R, Ranasinghe P, Byrne NM, Soares MJ, Katulanda P, Hills AP.
Prevalence and trends of the diabetes epidemic in South Asia: a systematic review and
meta-analysis. BMC Public Health 2012;12(1):380.
19. Saeed KMI. Prevalence of risk factors for non-communicable diseases in the adult
population of urban areas in Kabul City, Afghanistan. Cent Asian J Glob
Health2014;2(2).
20. Anand K, Shah B, Yadav K, Singh R, Mathur P, Paul E, et al. Are the urban poor
vulnerable to non-communicable diseases? A survey of risk factors for non-
communicable diseases in urban slums of Faridabad. Natl Med J India 2007;20(3):115.
21. Chow C, Cardona M, Raju PK, Iyengar S, Sukumar A, Raju R, et al. Cardiovascular
disease and risk factors among 345 adults in rural India—the Andhra Pradesh Rural
Health Initiative. Int J Cardiol 2007;116(2):180–5.
22. Huffman MD, Prabhakaran D, Osmond C, Fall CHD, Tandon N, Lakshmy R, et al.
Incidence of cardiovascular risk factors in an Indian urban cohort results from the New
Delhi Birth Cohort. J Am Coll Cardiol 2011;57(17):1765–74.
23. Bhardwaj SD, Shewte MK, Bhatkule PR, Khadse JR. Prevalence of risk factors for
non-communicable disease in a rural area of Nagpur district, Maharashtra-A WHO STEP
wise approach. Int J Biomed Res 2012; 3(1).
24. Krishnan A, Shah B, Lal V, Shukla DK, Paul E, Kapoor SK. Prevalence of risk
factors for non-communicable disease in a rural area of Faridabad district of Haryana.
Indian J Public Health 2008;52(3):117–24.
75
25. Kaur P, Rao SR, Radhakrishnan E, Rajasekar D, Gupte MD. Prevalence, awareness,
treatment, control and risk factors for hypertension in a rural population in South India.
Int J Public Health 2012;57(1):87–94.
26. Sugathan TN, Soman CR, Sankaranarayanan K. Behavioural risk factors for non
communicable diseases among adults in Kerala, India. Indian J Med Res 2008; 127(6).
27. Asrani Salini,Kaushik Sushama.Problems perceived by scheduled caste women in
Haryana. Stud Tribes Tribals 2011; 9(1):029-36.
28. Vishwanathan H, Deepa E, Cordaux R, Stoneking M, Usha Rani MV, Majumder
PP. Genetic structure and affinities among tribal populations of southern India: a study of
24 autosomal DNA markers. Ann Hum Genet 2004;68(2):128–38.
29. Sarkar S, Das M, Mukhopadhyay B, Chakrabarti CS, Majumder PP. High
prevalence of metabolic syndrome & its correlates in two tribal populations of India & the
impact of urbanization. Indian J Med Res 2006;123(5):679–86.
30. Misra J Palash. .[working paper on the internet] NCD risk factors among a tribal
community in the riverine islands of river Brahmaputhra,Assam.2012;Available from:
https://www.sctimst.ac.in/About%20SCTIMST/.../NO%206.pdf. [Accessed on 2014 Feb
19]
31. Sreeraj VS,Prasad S, Khess CJ,Uyais NA. Reasons for substance use: a comparative
study of alcohol use in tribals and non-tribals.Indian J Psychol Med 2012;34:242-6.
32. Alexey Ivanov.Food and sanitation pattern and social structure in relation with food
customs of the Chenchus of Andrapradesh. Stud Tribes Tribals 2011;9(1):11-28.
33. National Nutrition Monitoring Bureau (NNMB). Diet and nutritional status of tribal
population Repeat survey. Hyderabad; 2000 .
34. Parimalavalli.R.Socio economic and nutritional status of the tribal children. Stud
Tribes Tribals 2012;10(2):183-187.
35. Pradhan Sanjay,Sharma Kamlesh.Nutritional status of Bhil tribal children in
Madhyapradesh,India:a cross sectional study: Stud Tribes Tribals 2011;9(1):37-40.
36. Chatterjee Sumana,Dhar Soujatya,Sengupta Bani,Sengupta Sarthak,Mazumder
Lakshmi,Chakrabarti Sila.Co existence of haemoglobinopathies and iron deficiency in the
development of anemias in the tribal population Eastern India. Stud Tribes Tribals
2011;9(2):111-121.
37. Dhingra Rajni. An assessment of health status of adolescent Gujjar tribal girls of
Jammu District. Stud Tribes Tribals 2011;9(2):133-138.

76
38. Das Megha.Study of nutritional status of Korku tribes in Betul district of Madhya
Pradesh. Stud Tribes Tribals 2010;8(1):31-36.
39. Chandraker Richa,Chakrabarty suman,Mitra Mitashree,Bharati Premananda.A study
of reproductive and child health among Dhur Gond tribal community of Mahasamund
district,Chasttisgarh,India. Stud Tribes Tribals 2009;7(2):97-103.
40. Varadarajan.A,Prasad Sheela.Regional variations in nutritional status among tribals
of Andrapradesh. Stud Tribes Tribals 2009;7(2):137-141.
41. Sharma Shubhangna,Rani R,Samkaria Meenakshi.Prevalence of anemia and
malnutrition among Gaddi girls of Chamba and Kangra district of Himachal Pradesh.
Stud Tribes Tribals 2007;5(2):139-142.
42.Singh Rajesh,Singh Pritee.A study on high mortality of children in Melghat Region of
Amravati(Maharashtra). Stud Tribes Tribals 2008;6(1):35-43.
43. Meitei KS,Sachdeva MP.Incidence of renal stone:an investigation among the Aimol
tribe of Manipur. Stud Tribes Tribals 2010;8(1):45-48.
44. Negi NS,Sekhar TV,Ganguly Sujata.Antenatal care among tribals;a study of
Chattisgarh and Jharkhand. Stud Tribes Tribals 2010;8(2):77-86.
45. Singh LP,Srinivasan K.Family planning and scheduled tribes of Rajastan:Taking
stock and moving forward. Journal of Health Management 2000; 2(1):55–80.
46. Karunakaran CK. Kanikar. 1st
Ed. Thiruvananthapuram: State Institute of
Languages;1989.
47. Suresh KP.Indigenous agricultural practices among Mavilan tribe in North Kerala.
Stud Tribes Tribals 2010;8(2):103-106.
48. Government of India.www.censusindia.gov.in/2001.[Accessed on 2014 Feb 2]
49. Anuradha RV. [Internet] Sharing with the Kanis: a case study from Kerala, India.
Submitted to the Secretariat of the Convention on Biological Diversity.1998.Available
from: https://www.cbd.int/financial/bensharing/india-kanis.pdf. [Accessed on 2014 Feb
19]
50. Ten years of the WHO STEP wise approach to chronic disease risk factor surveillance
(STEPS):Challenges and opportunities-WHO Consultation: Review of International
experience in NCD prevention & Control (methodology-10 years of step wise
approach).WHO ;2009.

77
51. Ng N, Minh HV, Tesfaye F, Bonita R, Byass P, Stenlund H, et al. Combining risk
factors and demographic surveillance: Potentials of WHO STEPS and INDEPTH
methodologies for assessing epidemiological transition. Scand J Public Health
2006;34(2):199–208.
52.Ayyanar M, Ignacimuthu S. Ethnobotanical survey of medicinal plants commonly
used by Kani tribals in Tirunelveli hills of Western Ghats, India.J Ethnopharmacol
2011;134(3):851–64.
53. Ayyanar M. Ethnobotanical Wealth of Kani tribe in Tirunelveli hills. Dissertation,
University of Madras, Chennai, India; 2008.
54. Ayyanar M, Sankarasivaraman K, Ignacimuthu S. Traditional herbal medicines used
for the treatment of diabetes among two major tribal groups in South Tamil Nadu, India.
Ethnobot Leafl 2008;2008(1):32.
55. R Core Team (2014). R: A language and environment for statistical computing. R
Foundation for Statistical Computing, Vienna, Austria. URLhttp://www.R-project.org/.
56.Virasakdi Chongsuvivatwong (2012). epicalc: Epidemiological calculator. R package
version 2.15.1.0. http://CRAN.R-project.org/package=epicalc.
57. Mangolian STEPS Survey on the prevalence of non communicable disease and injury
risk factors-2009:WHO 2010, Geneva.
58.Misra A,Vikram N K,Gupta R,Pandey R.M,Wasir JS, Gupta V P.Waist circumference
cutoff points and action levels of Asian Indians for identification of abdominal obesity.Int
J Obes(Lond)2006;30:106-11.
59. Western Pacific Region (WPRO). 2000. The Asia Pacific perspective: redefining
obesity and it’s treatment, WHO interim report on obesity: World Health Organization,
Australia.
60.Snehalatha Chamukuttan,Viswanathan Vijay,Ramachandran Ambadi.Cutoff values for
normal anthropometric variables in Asian Indian adults.Diabetes Care 2003; 26(5):1380-
84.
61. International institute for population sciences(IIPS) and macro international. National
Family Health Survey(NFHS 3),2005-2006:India:Volume2:Mumbai:IIPS;2007.
62.Shah B, Mathur P. Surveillance of cardiovascular disease risk factors in India: the
need & scope. Indian J Med Res. 2010;132: 634–42.

78
63. National Institute of Medical Statistics, Indian Council of Medical Research (ICMR),
2009,IDSP Non-Communicable Disease Risk Factors Survey, Phase-I States of India,
2007-08.
64. Sebastian M. Kanikarudelokam .1stEd.Thiruvananthapuram: Department of Cultural
Publications;1990.

i
APPENDICES
APPENDIX I
CONSENT FORM
Namaskaram, I am ******, currently doing Masters in Public Health(MPH) at
Achutha Menon Centre for Health Science Studies(AMCHSS), Sree Chitra Tirunal
Institute of Medical Sciences and Technology, Thiruvananthapuram, Kerala. As a part
of my course curriculum, I am conducting a study titled “Prevalence of non-
communicable disease risk factors among Kani tribe in Thiruvananthapuram district,
Kerala”, under the guidance of *******. I plan to do this study to find out the
prevalence of non-communicable-disease risk factors among Kani tribe in
Thiruvananthapuram district, Kerala. The potential risk factors include tobacco use,
alcoholism, unhealthy diet, obesity, sedentary behavior, raised blood pressure and
diabetes.
I would like to ask you some questions related to this study regarding some
behaviors like smoking/chewing tobacco, drinking alcohol, diet, physical activities
which are related to increased risk of developing chronic diseases. I will take
measurement of your height, weight, waist circumference and blood pressure. I will
also ask questions inquiring about diabetes and hypertension. The whole procedure
will take 30-45 minutes. Although there is no immediate benefit for you from the
study except measuring your blood pressure, height, weight and waist circumference, I
sincerely hope that, in the long run this exploration will help in better planning for
health interventions in Kani tribal community and other tribes living in the state. As a
whole this will benefit the public health programs.
The information obtained from you will be kept confidential and will be used
only for research purpose. Your participation in this study will be voluntary. You are
free to withdraw from the interview at any point of time. Also you can refuse to
answer any question without giving any explanations.
Are you willing to take part in this study? Yes □No□
If you are not willing to take part in this study, thank you for your time.

ii
If you are willing to take part in this study, please sign/or give your thumb impression over the
specified space.
Signature of the respondent: ……………….. OR
Thumb impression of the
respondent
Time: ………..
Date: ………..
If you have any queries you can contact,
******
MPH 2013, AMCHSS,
SCTIMST,
Thiruvananthapuram.
Mobile Number: *******
******
Member Secretary, Institutional Ethics Committee,
SCTIMST,
Thiruvananthapuram.
Contact Number:*******
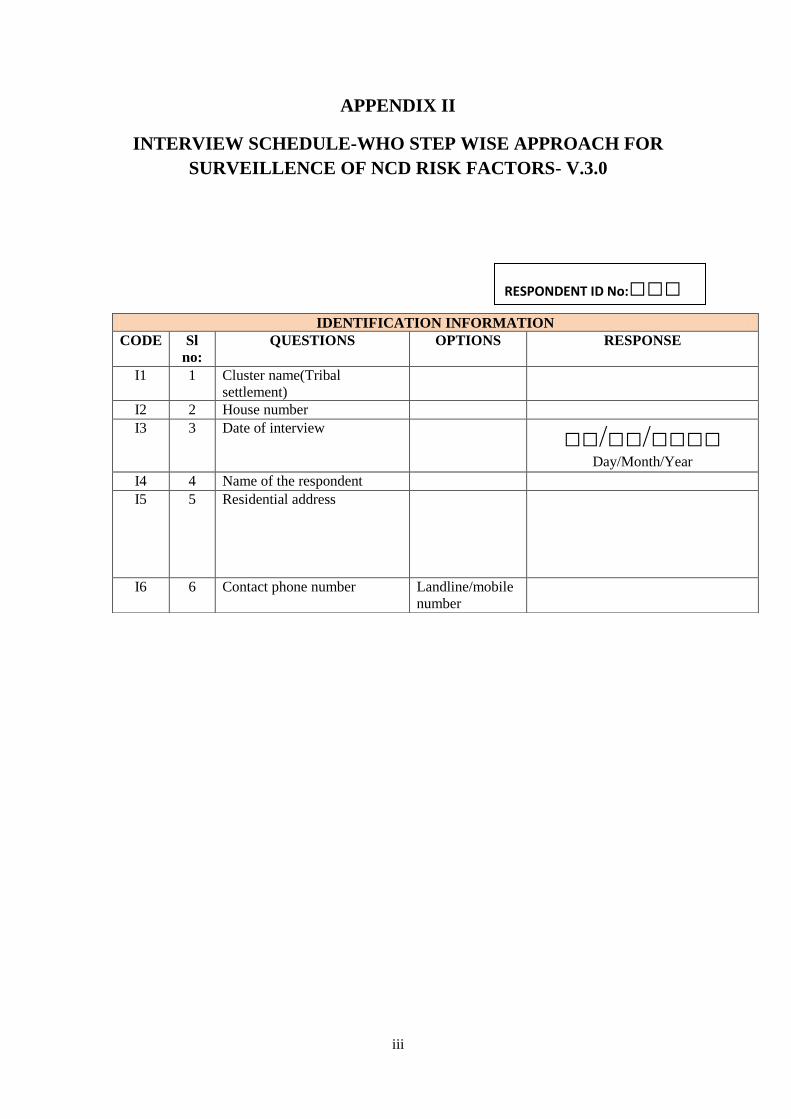
iii
APPENDIX II
INTERVIEW SCHEDULE-WHO STEP WISE APPROACH FOR
SURVEILLENCE OF NCD RISK FACTORS- V.3.0
IDENTIFICATION INFORMATION
CODE Sl
no:
QUESTIONS OPTIONS RESPONSE
I1 1 Cluster name(Tribal
settlement)
I2 2 House number
I3 3 Date of interview □□/□□/□□□□
Day/Month/Year
I4 4 Name of the respondent
I5 5 Residential address
I6 6 Contact phone number Landline/mobile
number
RESPONDENT ID No:□□□

iv
DEMOGRAPHIC INFORMATION
CODE Sl No: QUESTION RESPONSE CODING
COLUMN
C1 7 How old are you?
(Age in completed years) □□ □□
C2 8 Sex(Record male or
female as observed)
Male-01
Female-02 □□
C3 9 What is the highest level
of education you have
completed?
No formal
schooling-01
Primary school
level(1-7)-03
High school level
(8-10)-04
Higher secondary
level (11-12)-05
Diploma after higher
secondary(13-14)-06
Graduate level(13-
15)-07
Postgraduate
degree(16 and
above)-08
Others
(specify)………
□□ Others
(specify)…………
………
C4 10 Which of the following
best describes your main
work status over the last
12 months?
(***ILO selected
occupational
categories)
□□ Others
(specify)…………
………
C5 11 What is your current
marital status? Never married-01
Currently married-
02
Divorced/separated-
03
Widowed-04
Cohabitating-05
□□
C6 12 Under which category you
belong to?(APL/BPL)
APL-01
BPL-02 □□
(***)Worked in household enterprise (self-employed): own account worker –01,Employer –02,Worked as helper in household enterprise
(unpaid family worker) – 03;Worked as regular salaried/wage employee – 04;Worked as casual wage laborer;In public works –05;In other
types of work – 06;Did not work but was seeking and/or available for work –07;Attended educational institution –08;Attended domestic
duties only – 09;Attended domestic duties and was also engaged in free collection of goods (vegetables, roots, firewood, cattle feed, forest
products etc.), sewing, tailoring, weaving, etc. for household use –10;Pensioners– 11;Not able to work due to disability -12;Others -13
RESPONDENT ID No: □□□

v
PERSONAL AND FAMILY HISTORY OF CHRONIC DISEASES
C7 13 Does any of your family
member have any of the
given chronic
diseases(Diabetes,
Hypertension, Heart disease,
Stroke, COPD, Cancer,
Asthma)? (Self
reported/Medically
diagnosed/On medication)
Yes-01
No-02
Don’t know-77
□□
NCD RISK FACTORS
STEP 1-BEHAVIOURAL MEASURES
TOBACCO USE (SECTION S)
Now I am going to ask you some questions about tobacco use.
Tobacco smoking CODE Sl No QUESTION RESPONSE CODING
COLUMN
S1 14 Do you currently smoke
any tobacco products such
as cigarettes, beedior others?
Yes-1
No-2
□ If No, go to S5
S2 15 Do you currently smoke
tobacco products daily?
Yes-1
No-2 □ S3 16 How old were you when
you first started smoking
daily?
Age in year
Don’t remember-88 □□
S4 17 On average, how many of
the following do you smoke
each day?
Manufactured Cigarettes
Cheroots
Beedi
Others (specify)……….
□□
□□
□□ (specify) ………
Smokeless tobacco use CODE Sl No QUESTION RESPONSE CODING
COLUMN
S5 18 Do you currently use any
smokeless tobacco products
such as chewing tobacco
and betel leaves;snuff
,kainior others?
Yes-1
No-0
□ If no, go to A1
S6 19 Do you currently use any
smokeless tobacco products
daily?
Yes-1
No-0 □
S7 20 How old were you when
you first started using
smokeless tobacco products
daily?
Age in years
Don’t remember-88 □□
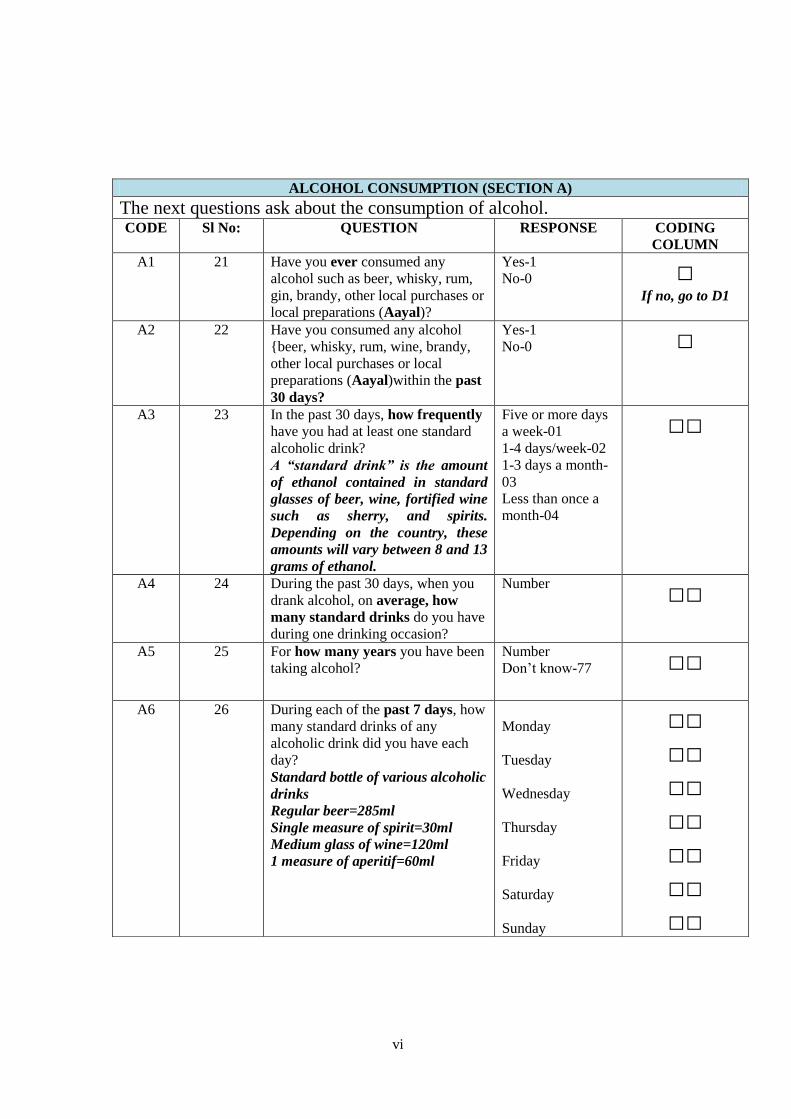
vi
ALCOHOL CONSUMPTION (SECTION A)
The next questions ask about the consumption of alcohol. CODE Sl No: QUESTION RESPONSE CODING
COLUMN
A1 21 Have you ever consumed any
alcohol such as beer, whisky, rum,
gin, brandy, other local purchases or
local preparations (Aayal)?
Yes-1
No-0 □ If no, go to D1
A2 22 Have you consumed any alcohol
{beer, whisky, rum, wine, brandy,
other local purchases or local
preparations (Aayal)within the past
30 days?
Yes-1
No-0 □
A3 23 In the past 30 days, how frequently
have you had at least one standard
alcoholic drink?
A “standard drink” is the amount
of ethanol contained in standard
glasses of beer, wine, fortified wine
such as sherry, and spirits.
Depending on the country, these
amounts will vary between 8 and 13
grams of ethanol.
Five or more days
a week-01
1-4 days/week-02
1-3 days a month-
03
Less than once a
month-04
□□
A4 24 During the past 30 days, when you
drank alcohol, on average, how
many standard drinks do you have
during one drinking occasion?
Number
□□
A5 25 For how many years you have been
taking alcohol?
Number
Don’t know-77 □□
A6 26 During each of the past 7 days, how
many standard drinks of any
alcoholic drink did you have each
day?
Standard bottle of various alcoholic
drinks
Regular beer=285ml
Single measure of spirit=30ml
Medium glass of wine=120ml
1 measure of aperitif=60ml
Monday
Tuesday
Wednesday
Thursday
Friday
Saturday
Sunday
□□
□□
□□
□□
□□
□□
□□

vii
DIET (SECTION D)
The next questions ask about the fruits and vegetables that you usually eat. I have a nutrition
card here that shows you some examples of local fruits and vegetables. Each picture represents
the size of a serving. As you answer these questions please think of a typical week in the last
year.
CODE Sl No: QUESTION RESPONSE CODING
COLUMN
D1 27 In a typical week, how many days
do you eat fruits?
Number of days □
if zero days, go to
D3
D2 28 How many servings of fruit do you
eat on one of those days?
(Servings- WHS nutrition card)
Number of
servings □
D3 29 In a typical week, how many days
do you eat vegetables?
Number of days □
If zero days, go to
D5
D4 30 How many servings of vegetables
do you eat on one of those days?
Number of
servings □
D5 31 What type of oil or fat is most
often used for meal preparation in
your household?
Vegetable oil…..-
01
Butter or
ghee……-02
Coconut oil……-
03
Others
(specify)…04
None in particular-
05
None used-06
□□
PHYSICAL ACTIVITY (SECTION P)
Next I am going to ask you about the time you spend doing different types of physical activity
in a typical week. Please answer these questions even if you do not consider yourself to be a
physically active person. Think first about the time you spend doing work. Think of work as the
things that you have to do such as paid or unpaid work, study/training, household chores,
harvesting food/crops, fishing or hunting for food, seeking employment. [Insert other examples
if needed]. In answering the following questions 'vigorous-intensity activities' are activities that
require hard physical effort and cause large increases in breathing or heart rate, 'moderate-
intensity activities' are activities that require moderate physical effort and cause small increases
in breathing or heart rate.
WORK
P1 32
Does your work involve vigorous-
intensity activity that causes large
increases in breathing or heart rate,
like (heavy lifting, digging or other
work) for at least 10 minutes
continuously?
Yes-1
No-0 □ If no, go to P4

viii
P2 33 In a typical week, how many days
do you do vigorous-intensity
activities as part of your work?
Days per week □□
P3 34 On a typical day, how much time
do you spend doing vigorous –
intensity activities at work?
In hours and
minutes
Or
In minutes
□□:□□
□□□ P4 35 Does your work involve moderate-
intensity activity that causes small
increases in breathing or heart rate,
like (brisk walking or carrying light
loads) for at least 10 minutes
continuously?
Yes-1
No-0 □ If no, go to P7
P5 36 In a typical week, on how many
days do you do moderate-intensity
activities as part of your work?
Days per week □
P6 37 On a typical day,how much time
do you spend doing moderate –
intensity activities at work?
In hours
Or
In minutes
□□:□□
□□□ P7 38 How much time do you usually
spendsitting or reclining on a typical
day?
In hours □□:□□
TRAVEL TO AND FROM PLACES
The next questions exclude the physical activities at work that you have already
mentioned.Now I would like to ask you about the usual way you travel to and from places. For
example to work, for shopping, to market, to place of worship. P8
39 Do you walk or use a bicycle for at
least 10 minutes continuously to get
to and from places?
Yes-1
No-0 □ If no, go to P9
P9 40 How do you travel from one place
to another?
Specify…… ………
… Next go to P12
P10 41 In a typical week, on how many
days do you walk or bicycle for at
least 10 minutes continuously to get
to and from places?
Days a week □
P11 42 On a typical day, how much time
would you spend walking or
bicycling for travel?
In hours
□□:□□
RECREATIONAL ACTIVITIES
The next questions exclude the work and transport activities that you have already mentioned.
Now I would like to ask you about sports, fitness and recreational activities (leisure)
P12 43 Do you do any vigorous-intensity
sports, fitness or recreational
Yes-1
No-0 □

ix
(leisure) activities that cause large
increases in breathing or
heart rate like [running] for at least
10 minutes
continuously?
[INSERT EXAMPLES] (USE
SHOWCARD)
If yes,-----
days/week
&
------hour:----
minutes/day
If no, go to P13
P13 44 Do you do any moderate-intensity
sports, fitness or recreational
(leisure) activities that cause a small
increase in breathing or
heart rate such as brisk walking,
[cycling, swimming]
for at least 10 minutes
continuously?
[INSERT EXAMPLES] (USE
SHOWCARD)
Yes-1
No-0
If yes,-----
days/week
&
------hour:----
minutes/day
□ If no, go to H1
TREATMENT HISTORY (SECTION-H)
HISTORY OF RAISED BLOOD PRESSURE
H1 45 Have you ever had your Blood
Pressure measured by a doctor or
other health worker?
Yes-1
No-0 □ If no, go to H6
H2 46 Have you ever been told by a doctor
or other health worker that you have
elevated blood pressure or
hypertension?
Yes-1
No-0 □
H3 47 Are you currently receiving any
treatment for high blood pressure
prescribed by a doctor or other
health worker?
Yes-1
No-0 □
H4 48 During the past 12 months, have you
seen a traditional healer for elevated
blood pressure or hypertension?
Yes-1
No-0 □
H5 49 Are you currently taking any herbal
or traditional remedy for your high
blood pressure?
Yes-1
No-0 □
HISTORY OF DIABETES
H6 50 Have you ever had your Blood
Sugar measured by a doctor or other
health worker?
Yes-1
No-0 □ If no, go to H11
H7 51 Have you ever been told by a doctor
or other health worker that you have
diabetes (sugar disease)?
Yes-1
No-0 □

x
H8 52 Are you currently receiving any
treatment for diabetes prescribed by
a doctor or other health worker?
Yes-1
No-0 □
H9 53 During the past 12 months, have you
seen a traditional healer for
diabetes?
Yes-1
No-0 □
H10 54 Are you currently taking any herbal
or traditional remedy for your
diabetes?
Yes-1
No-0 □
HISTORY OF CHOLESTEROL
H11 55 Have you ever had your cholesterol
(fat levels in your blood) measured
by a doctor or other health worker?
Yes-1
No-0 □ If no, go to H16
H12 56
Have you ever been told by a doctor
or other health worker that you have
raised cholesterol?
Yes-1
No-0 □
H13 57 Are you currently receiving any
treatment for high cholesterol
prescribed by a doctor or other
health worker?
Yes-1
No-0 □
H14 58 During the past 12 months, have you
seen a traditional healer for high
cholesterol level?
Yes-1
No-0 □
H15 59 Are you currently taking any herbal
or traditional remedy for your
cholesterol?
Yes-1
No-0 □
HISTORY OF CARDIO VASCULAR DISEASES
H16 60 Have you ever had a heart attack or
chest pain from heart disease
(angina) or a stroke (cerebrovascular
accident or incident)?
Yes-1
No-0 □
HISTORY OF LIFESTYLE ADVICE
During the past three years, has a doctor or other health worker advised you to do any of the
following?(RECORD FOR EACH) H17 61 Quit using tobacco or don’t start
using any tobacco products
Yes-1
No-0 □
H18 62 Reduce salt in your diet
Yes-1
No-0 □ H19 63 Eat at least five servings of fruit
and/or vegetables each day
Yes-1
No-0 □
H20 64 Reduce fat in your diet Yes-1
No-0 □ H21 65 Start or do more physical activity
Yes-1
No-0 □ H22 66 Maintain a healthy body weight or
lose weight
Yes-1
No-0 □ CERVICAL CANCER SCREENING(For women only)

xi
The next question asks about cervical cancer prevention. Screening tests for cervical cancer
prevention can be done in different ways, including Visual Inspection with Acetic Acid/vinegar
(VIA), pap smear and Human Papilloma virus (HPV) test.
CX1 67 Have you ever had a screening test
for cervical cancer? (VIA is an
inspection of the surface of the
uterine cervix after acetic acid
(or vinegar) has been applied to
it. For both pap smear and HPV
test, a doctor or nurse uses a
swab to wipe from inside your
vagina, take a sample and send it
to a laboratory. It is even
possible that you were given the
swab yourself and asked to swab
the inside of your vagina.)
Yes-1
No-0 □
STEP 2-PHYSICAL MEASUREMENT(CODE M)
During the past 12 months, have you
seen a traditional healer for
diabetes?
Height and weight Are you currently taking any herbal
or traditional remedy for your
diabetes?
M1 68 For women: Are you pregnant? Yes1
No 0 □ If yes, go to M5
M2 69 Height In
centimeters(cm) □□□.□
M3 70 Weight In kilograms(kg)
If too large for
the scale 666.6
□□□.□
Waist
M4 71 Waist circumference In
centimeters(cm) □□□.□
Blood Pressure
M5a 72 Reading 1
Record first measurement after the
participant has rested for 15
minutes. Wait 3 minutes before
taking second measurement
systolic □□□
diastolic □□□
M5b 73 Reading 2
Ask the participant to rest for
another 3 minutes before taking the
third measurement
systolic □□□
diastolic □□□
M5c 74 Reading 3 systolic □□□
diastolic □□□
xii
INTERVIEW COMPLETE/INCOMPLETE
SIGNATURE OF THE INVESTIGATOR
ANY OTHER COMMENT

xiii
k½-X-]-{Xhpw
]T-\s¯ kw_-Ôn¨ hnh-c-§fpw
\a-kvIm-cw. Rm³ ********** ANyp-X-ta-t\m³ skâÀ t^mÀ sl¯v kb³kv ÌUo-kn ({io Nn{X Xncp-
\mÄ C³Ìn-äyq«v t^mÀ saUn-¡Â kb³kv Bâv sSIvt\m-f-Pn) ]»nIv sl¯v (s]m-Xp-P\ BtcmKy kwc-£-
Ww) _ncp-Zm-\-´c _ncpZ hnZymÀ°n\n BWv. Fsâ A²y-b-\-¯nsâ `mambn F\n¡v Hcp ]T\w \S-t¯--
Xp-v. Cu ]T\w ANyp-X-ta-t\m³ skâ-dnse s{]m^-kdpw Fsâ ssKUp-amb ********* \oco-£-W-¯n-
emhpw Rm³ sN¿p-I. tIc-f-¯nse Xncp-h-\-´-]pcw PnÃ-bnse ImWn kap-Zm-b-¯n DÄs¸-Sp-¶-h-cnÂ
]IÀt¨-Xc tcmK-§Ä _m[n-¡m-\p-ff km[yXm LS-I-§Ä Af-¡pI F¶-XmWv Fsâ ]T-t\m--t±-iw. ]pI-bne
D]-tbm-Kw, aZy-]m-\w, hymbma¡pdhv Nn«-bn-Ãm¯ Blm-c-co-Xn-IÄ, s]m®-¯-Sn, càmXn-k-
½À±w, cà-¯nse DbÀ¶ sImgp¸v, {]talw F¶n-h-bmWv ]IÀt¨-Xc tcmK-§Ä¡v tlXp-hm-Ip¶ LS-I-§Ä.
Cu ]T-\-¯nsâ `mK-ambn ]IÀ¨t¨X-c-tcm-K-§Ä¡v Imc-W-am-Im-hp¶ C¯cw LS-I-§-sf-¡p-dn¨v
tNmZy-§Ä tNmZn-¡p-¶-Xm-bn-cn¡pw Xm¦-fpsS Db-cw, ico-c-`m-cw, Ac-s¡-«nsâ Npä-f-hv, cà-k-
½À±w (3 Xh-W) F¶n-hbpw Cu ]T-\-`m-K-ambn Af¶v tcJ-s¸-Sp-¯p-¶-Xm-bn-cn-¡pw. {]talw (]-©-
km-c-bpsS Akp-Jw), càm-Xn-k-½À±w ({]-j-dv), cà-¯nse sImgp¸v IqSp¶ AhØ (sIm-
gp¸v/sImfkvt{SmÄ) F¶o tcmK-§-sf-¡p-dn¨pw Rm³ tNmZn-¡p-¶-Xm-bn-cn-¡pw. Cu \S-]-Sn-{I-a-
§Ä FÃmw IqSn 30þ45 an\n«v FSp-¡p-¶-Xm-bn-cn-¡pw.
Cu ]T-\-¯n ]s¦-Sp-¡p-¶-Xp-aqew Xm¦-fpsS Db-cw, ico-c-`m-cw, Ac-sI«nsâ Npä-f-hv, cà-
k-½À±w F¶o Af-hp-IÄ Adn-bm-sa-¶-Xn-ep-]cn aäv t\«-§-sfm¶pw Ct¸mÄ \n§Ä¡v Dm-Ip-¶-X-Ã.
APPENDIX III

xiv
F¦nepw Cu ]T-\-¯nsâ ^e-am-bn, `mhn-bn ImWn kap-Zmbw DÄs¸-sS-bp-ff BZn-hmkn kap-Zm-
b-§-fpsS Btcm-Ky-kw-c-£-W-cw-K¯v sa¨-s¸« CS-s]-S-ep-IÄ kÀ¡m-cnsâ `mK-¯p-\n¶v Dm-Ip-sa¶v
Rm³ BßmÀ°-ambn {]Xo-£n-¡p-¶p. Cu ]T\w s]mXp-P-\m-tcmKy kwc-£-W-cw-Ks¯ ]²-Xn-IÄ¡v
klm-b-I-am-Ipw.
Cu ]T-\-¯n ]s¦-Sp-¡p-¶-Xn-eqsS Xm¦Ä¡v Hcp Btcm-Ky-{]-iv\-§fpw Dm-Ip-¶-X-Ã.
F¶m Fsâ Nne tNmZy-§fpw Af-hp-IÄ FSp-¡epw Xm¦Ä¡v _p²n-ap-«mbn A\p-`-h-s¸-t«-¡mw.
Xm¦Ä \ÂIp¶ kzmIm-cy-hn-h-c-§Ä cl-ky-ambn kq£n-¡p-¶-XmWv hyàn-hn-h-c-§Ä H¶pw
aä-pf-f-hÀ¡v shfp-s¸-Sp-¯p-¶-X-Ã. Cu ]T-\-hp-ambn t\cn«v _Ô-s¸-«n-«p-f-fhÀ¡v am{Xta Cu tcJ-IÄ
e`y-am-hp-I-bp-f-fq. Cu ]T-\-¯n-ep-ff ]¦m-fn¯w Xm¦Ä kza-\-Êmse FSp-t¡--Xm-Wv. ]T-\-¯n-\n-S-
bn GXv thf-bnepw Xm¦Ä¡v CXn \n¶pw Hcp ]ngbpw IqSmsX ]n·m-dm-hp-¶-Xm-Wv. IqSmsX
Xm¦Ä¡v GXv tNmZy-¯nsâ D¯cw ]d-bp-¶-Xn \n¶pw ]n·m-dm-hp-¶-Xpam-Wv.
Xm¦Ä¡v Cu ]T-\-¯n ]¦m-fn-bm-Im³ k½-X-amtWm?
AÃ (Xm-¦-fpsS ka-b-¯n\v \µn)
AsX {]Xn-IÀ¯m-hnsâ H¸v /hnc-e-S-bmfw:
t]cv: hnc-e-S-bmfw:
Cu ]T-\-s¯-¡p-dn¨v IqSp-X Adn-bp-¶-Xn-\mbn NphsS X¶n-cn-¡p¶ t^m¬\-¼-dp-I-fn _Ô-s¸-Sm-
hp-¶-Xm-Wv.

xv
******,t^m¬: ******
]T\-¯nsâ B[n-Im-cn-I-X-sb-¡p-dn¨v Adn-bm³:-þ
*********
C³Ìn-äyq-j-W F¯nIvkv I½nän
{io Nn{X Xncp-\mÄ C³Ìn-äyq«v
t^mÀ saUn-¡Â kb³kkv Bâv sSIvt\m--fPn ,Xncp-h-\-´-
]pcw.
PREVALENCE OF NCD RISK FACTORS AMONG KANI TRIBE
IN THIRUVANANTHAPURAM, KERALA
A`n-apJ tNmZym-hen
ASn-Øm-\-hn-h-c-§Ä (hn`mKw þ sF)
Code No.
Sl. No
QUESTIONS OPTIONS RESPONSE
I1 1 BZn-hm-kn- Ducnsâ t]cv
I2 2 ho«p \¼À
I3 3 A`n-apJw \S-¡p¶ XobXn
□□/ □□/ □□□□
Znhkw/amkw/hÀjw
RESPONDENT ID No: □□□
APPENDIX IV

xvi
I4 4 {]Xn-IÀ¯m-hnsâ t]cv
I5 5 ta hnemkw
I6 6 t^m¬ \¼À
DEMOGRAPHIC INFORMATION (SECTION C) / hyàn-KX hnh-c-§Ä C 1 7
\n§Ä¡v F{X hb-Êpv? □□ □□
C 2 8 kv{Xo/ ]pcp-j³ □□
C 3 9 Xm¦-fpsS ]qÀ¯n-bm-¡nb DbÀ¶ hnZym-
`ymk tbmKyX F´mWv?
Hu]Nm-cn-I-hn-Zym-`ymkw
CÃ
ss{]adn seh (1þ7)
sslkvIqÄ seh (8þ10)
lbÀsk-¡âdn (11þ12)
Unt¹ma (13þ14)
_ncpZw (13þ15)
_ncp-Zm-\-´c _ncpZw (16 Dw
apI-fn-epw)
aäp-ffh þþ-þþ
hyà-am-¡pIþþ-þ-þ-þ-þ-þ-þ-þþ
□□
……………….
C 4 10 Xm¦-fpsS \ne-hn-ep-ff sXmgn GXv
hn`m-K-¯nÂs¸Spw? (I-gnª 12 amk-am-
bn)
1 * þþ-þ-þ-þ-þ-þ-þ-þ-þ-þ-þ-þ-þ-þ-
þ-þþ
□□
………………
C 5 11 Xm¦-fpsS \ne-hn-ep-ff hnhm-l-ØnXn
F´mWv?
hnhmlw Ign-¨n-«nÃ
hnhm-ln-X³/hnhm-lnX
_Ôw thÀ]n-cnªp/ thÀ]n-cnªp
□□
1 ILO selected classification of occupation

xvii
Xma-kn-¡p¶p.
hn[h Hcp-an¨v Xma-kn-¡p¶p
SOCIO ECONOMIC STATUS / kmaqlnI km¼-¯nI (Øn-Xn) C 6 12
Xm¦Ä Ch-bn-teXv hn`m-K-¯nÂ
DÄs¸Spw?
F. ]n.-FÂ
_n. ]n. FÂ
□□
PERSONAL & FAMILY HISTORY OF CHRONIC DISEASES C 7 13
Xm¦-fpsS IpSpw-_-¯n BÀs¡-¦nepw
ChnsS ]dªn-cn-¡p¶ GsX-¦nepw
tcmKm-hØIÄ Df-f-Xmbn Adn-hptm?/
acp-¶p-IÄ Ign-¡p-¶ptm?
{]talw
càmXn-k-½À±w
lrZ-bm-LmXw
]£m-LmXw
izmk-tIm-i-kw-_-Ô-am-bXv
Im³kÀ,
Bkva
□□
NCD RISK FACTORS – STEP 1 BEHAVIOURAL MEASURES
TOBACCO USE (S SECTIONS)/ ]pIbne D]-t`mKw (Fkv . hn-`m-Kw)
C\n Rm³ Xm¦-tfmSv ]pI-bne D]-tbm-K-s¯-¡p-dn¨v Ipd¨v tNmZy-§Ä tNmZn-¡m³ t]mIp-I-bmWv
]pI-bne D]-tbmKw
Code
No.
Sl.
No
Questions Options Coding column
S 1 14 Xm¦Ä Ct¸mÄ ]pI-h-en-¡m-dptm? (kn-
K-d-äv, Npcp-«v, _oUn, aäp-f-f-h)
Dv
CÃ
□
S2 15 AsX F¦n Xm¦Ä ]pI-bne D¸-¶-§Ä
F¶pw D]-tbm-Kn-¡m-dptm?
Dv
CÃ
□
S3 16 BZy-ambn ]pI-h-en¨v XpS-§n-b-t¸mÄ
Xm¦Ä¡v F{X {]mbw Dm-bn-cp¶p?
þþ-þ-þ-þ-þþ hbÊv □□
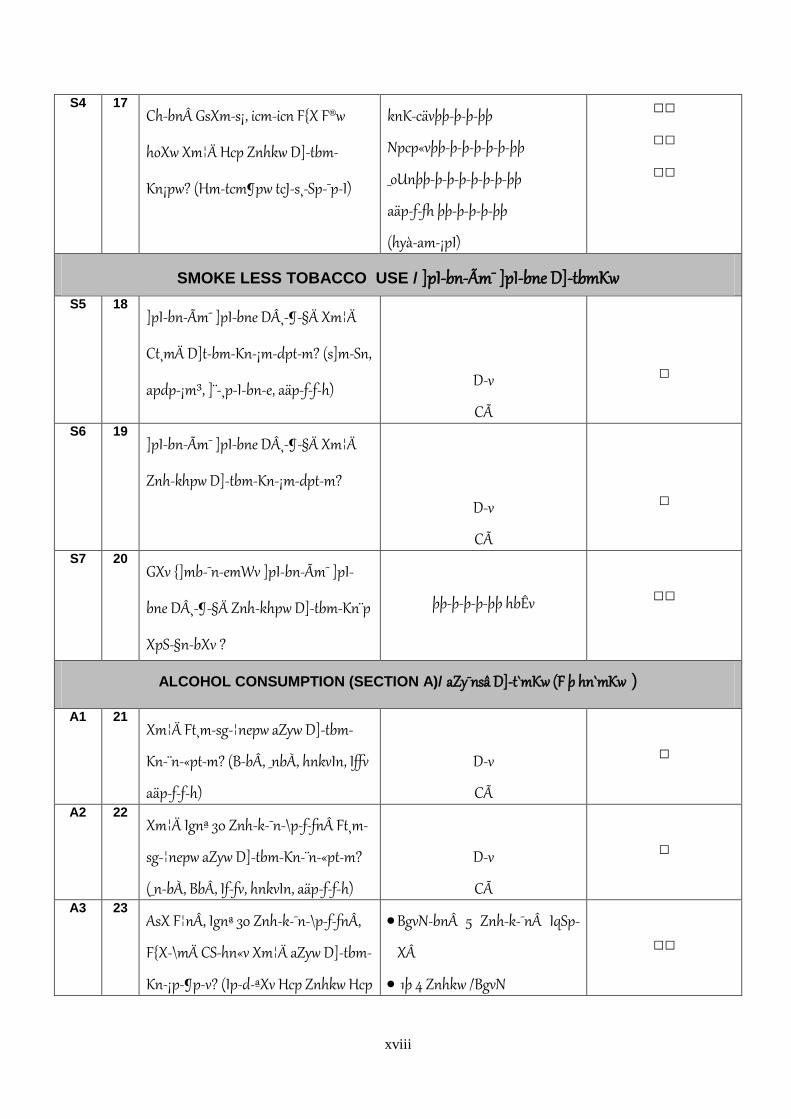
xviii
S4 17 Ch-bn GsXm-s¡, icm-icn F{X F®w
hoXw Xm¦Ä Hcp Znhkw D]-tbm-
Kn¡pw? (Hm-tcm¶pw tcJ-s¸-Sp-¯p-I)
knK-cävþþ-þ-þ-þþ
Npcp«vþþ-þ-þ-þ-þ-þ-þþ
_oUnþþ-þ-þ-þ-þ-þ-þ-þþ
aäp-f-fh þþ-þ-þ-þ-þþ
(hyà-am-¡pI)
□□
□□
□□
SMOKE LESS TOBACCO USE / ]pI-bn-Ãm¯ ]pI-bne D]-tbmKw
S5 18 ]pI-bn-Ãm¯ ]pI-bne D¸-¶-§Ä Xm¦Ä
Ct¸mÄ D]t-bm-Kn-¡m-dptm? (s]m-Sn,
apdp-¡m³, ]¨-¸p-I-bn-e, aäp-f-f-h)
Dv
CÃ
□
S6 19 ]pI-bn-Ãm¯ ]pI-bne D¸-¶-§Ä Xm¦Ä
Znh-khpw D]-tbm-Kn-¡m-dptm?
Dv
CÃ
□
S7 20 GXv {]mb-¯n-emWv ]pI-bn-Ãm¯ ]pI-
bne D¸-¶-§Ä Znh-khpw D]-tbm-Kn¨p
XpS-§n-bXv ?
þþ-þ-þ-þ-þþ hbÊv
□□
ALCOHOL CONSUMPTION (SECTION A)/ aZy¯nsâ D]-t`mKw (F þ hn`mKw )
A1 21 Xm¦Ä Ft¸m-sg-¦nepw aZyw D]-tbm-
Kn-¨n-«ptm? (B-bÂ, _nbÀ, hnkvIn, Iffv
aäp-f-f-h)
Dv
CÃ
□
A2 22 Xm¦Ä Ignª 30 Znh-k-¯n-\p-f-fn Ft¸m-
sg-¦nepw aZyw D]-tbm-Kn-¨n-«ptm?
(_n-bÀ, BbÂ, If-fv, hnkvIn, aäp-f-f-h)
Dv
CÃ
□
A3 23 AsX F¦nÂ, Ignª 30 Znh-k-¯n-\p-f-fnÂ,
F{X-\mÄ CS-hn«v Xm¦Ä aZyw D]-tbm-
Kn-¡p-¶pv? (Ip-d-ªXv Hcp Znhkw Hcp
BgvN-bn 5 Znh-k-¯n IqSp-
XÂ
1þ 4 Znhkw /BgvN
□□

xix
{Un¦vkv F¦n-epw) 1þ 3 Znhkw / amkw
<1/amkw A4 24
Ignª 30 Znh-k-¯n-\p-f-fn aZy-]n-¡p-
t¼mÄ Hcp aZy-]m-\-th-f-bn icm-icn
F{X {Un¦vkv FSp-¡m-dpv?
þþ-þ-þþ F®w
□□
A5 25 F{X hÀj-§-fmbn Xm¦Ä aZyw D]-tbm-
Kn-¡p-¶pv?
þþ-þ-þ-þþ hÀjw □□
A6 26 Ignª Hcm-gvN-bn Hmtcm Znh-khpw
Xm¦Ä F{X Af-hn aZy-]n¨p? (Hmtcm
Znh-k-s¯bpw {Un¦vknsâ Afhv {]tXyIw
tcJ-s¸-Sp-¯p-I)
Xn¦Ä þþ-þ-þ-þ-þ-þ-þþ
sNmÆþþ-þ-þ-þ-þ-þ-þ-þþ
_p[³þþ-þ-þ-þ-þ-þ-þþ
hymgwþþ-þ-þ-þ-þ-þ-þ-þ-þ-þþ
shffnþþ-þ-þ-þ-þ-þ-þ-þ-þ-þþ
i\n þþ-þ-þ-þ-þ-þ-þ-þ-þ-þ-þ-þþ
RmbÀ þþ-þ-þ-þ-þ-þ-þ-þ-þ-þþ
□□ □□ □□ □□ □□ □□ □□
DIET (SECTION D)/ Blm-c-coXn (Un hn`mKw)
ASp¯ `mKw \n§Ä Ign-¡p¶ ]¨-¡-dn-I-sfbpw ]g-hÀ¤-§-sfbpw Ipdn-¨p-f-f-Xm-Wv. Fsâ I¿n Ah-bpsS DZm-l-cWw ImWn-
¡p¶ Nn{X-§Ä Dv. Hmtcm Nn{Xhpw Hcp t\cw Ign-¡p¶ ]g-¯nsâ Af-hmWv ImWn-¡p-¶-Xv. Cu tNmZy-§Ä¡v D¯cw \ÂIp-
t¼mÄ Ignª hÀjs¯ km[m-cW HcmgvN HmÀ¡p-I.
D1 27 km[m-cW Hcp BgvN-bn Xm¦Ä F{X
Znhkw ]g-hÀ¤-§Ä Ign¡pw ?
þþ-þ-þ-þ-þ-þ-þ-þ-þ--þ
□
D2 28 Ign-¡p¶ Znh-k§-fnÂ, F{X-am{Xw ]g-
hÀ¤-§Ä Hcp Znhkw Ign¡pw?
..-þ-þ-þ-þ-þ-þ-þ-þ-þ-þ-
--
□
D3 29 Hcp km[m-cW BgvN-bn Xm¦Ä F{X
Znhkw ]¨-¡-dn-IÄ Ign-¡pw?
þþ-þ-þ-þ-þ-þ-þ-þþ
□
D4 30 Ign-¡p¶ Znh-k-§-fnÂ, Hcp Znhkw F{X- □

xx
am{Xw ]¨¡dn-IÄ Ign¡pw? -----þþ-þ-þ-þ-þ-----þ-þþ D5 31
GXv Xcw F®-bmWv km[m-c-W-bmbn
ho«n ]mN-I-¯n\v D]-tbm-Kn-¡p-¶Xv?
(Afhv tcJ-s¸-Sp-¯p-Iþ F{X kv]q¬)
kkyF®
s\¿v/ sh®
shfns¨®
aäpf-fh
{]tXy-In¨v Hsc®bpw D]-tbm-Kn-
¡p-¶nÃ
PHYSICAL ACTIVITY (SECTION P)/ imco-cnI A²zm\w (]n.-hn-`m-Kw)
Hcp km[m-cW BgvN-bn Xm¦Ä sN¿p¶ Imbn-Im-²zm-\-s¯-¡p-dn-¨mWv C\n-bp-ff tNmZy-§Ä. \n§Ä tPmen sN¿m³
Nne-h-gn-¡p¶ ka-b-s¯-¸än Nn´n-¡pI ( h\-D¸-¶-§Ä tiJ-cn-¡Â, Irjn, thX-\-ap-ff tPmen, ho«p-tPm-en, ao³]n-Sp-¯w, ]T-\w,
tPm-en, At\z-jWw apX-em-b-h.) NphsS ]d-ªn-cn-¡p-¶-Xn ITn-\m-[zm\w F¶m izmk-K-Xnbpw \mUn CSp¸pw Iq«p¶
ITn\-amb ImbnI{]-hr-¯n-I-fm-Wv. anXm-[zm-\wþ izmk-K-Xn-bnepw \mUn CSp-¸nepw sNdnb tXmXn hÀ²-\-hp-m-
¡p¶ anX-amb ImbnI {]hr-¯n-IÄ
Work
P1 32 IpdªXv 10 an\n-s«-¦nepw XpSÀ¨-bmbn
ITn-\m-²zm\w DÄs¸-«-XmtWm Xm¦-
fpsS tPmen? (D-Zm. `mcw Npa¡p-I,
`mcw DbÀ¯p-I, Ipgn-¡p-I, \nÀ½mW
{]hÀ¯\w apX-em-b-h)
AsX
AÃ
□
P2 33 Hcp km[m-cW BgvN-benÂ, ITn-\m-

xxi
[zm\w DÄs¸« tPmen F{X Znhkw
DmIpw?
þþ-þ-þþ Znhkw/ BgvN □□
P3 34 Hcp km[m-cW Znhkw F{X kabw Xm¦Ä
ITn-\m-²zm\w DÄs¸« tPmen sN¿m-
dpv?
þþ-þ-þ-þ-þþ aWn-¡qÀ
þþ-þ-þ-þ-þ-þþan\n«v:
□□:□□ □□□
P4 35 Xm¦-fpsS tPmen Ipd-ªXv 10 an\n-s«-
¦nepw anX-amb A²zm\w
thp¶XmtWm" (D-Zm. thK-¯n \S-¡p-I,
sNdnb `mcw Npa-¡pI)
AsX
AÃ
□
P5 36 Hcp km[m-cW BgvN-bn F{X Znhkw
\n§Ä anX-amb A²zm\wDÄs¸« tPmen
sN¿pw
þþ-þ-þ-þ-þ-þ-Zn-hkw /-BgvN □
P6 37 Hcp km[m-cW Znh-kw, F{X t\cw \n§Ä
anX-amb A²zm\w DÄs¸« tPmen
sN¿pw?
þþ-þ-þ-þ-þþ aWn-¡qÀ
þþ-þ-þ-þ-þ-þþan\n«v:
□
P7 38 km[m-cW Hcp Znhkw F{X kabw Ccn-
¡p-Itbm Nmcn-¡n-S-¡p-Itbm sN¿pw ?
þþ-þ-þ-þ-þþ aWn-¡qÀ
þþ-þ-þ-þ-þ-þþan\n«v:
□□:□□
TRAVEL TO AND FROM PLACES
C\n-bp-ff tNmZy-§Ä Xm¦-fpsS Hcp Øe-¯p-\n¶pw aäv Øe-§-fn-te-¡p-ff bm{X-sb-¸-än-bm-Wv. (D-Zm-l-c-W-¯n\v
tPmen¡v t]mIp-I. km[\§Ä hm§m³ t]mIp-I, N´bn t]mIp-I. {]mÀ°-\m-e-b-§-fnÂ/ Bcm-[-\m-e-b-§-fn t]mIp-I)
P8 39 Ipd-ªXv 10 an\n-s«-¦nepw ssk¡nÄ Nhn-
«p-Itbm ImÂ\-S-bm-{Xtbm sN¿m-
dptm?
Dv
CÃ
□
P9 40 \n-§Ä Hcp Øe¯p-\n¶pw aäv Øe-§-fn-
te¡v bm{X sN¿p-¶Xv F§-s\-bmWv?
þþ-þ-þ-þ-þ-þ-þþ
………… □
P10 41 Hcp km[m-cW BgvN-bn F{X Znhkw
Ipd-ªXv 10 an\n-s«-¦nepw ssk¡nÄ Nhn-
«p-Itbm ImÂ\-S-bm{X sN¿p-Itbm
þþ-þþ Znhkw/BgvN
□
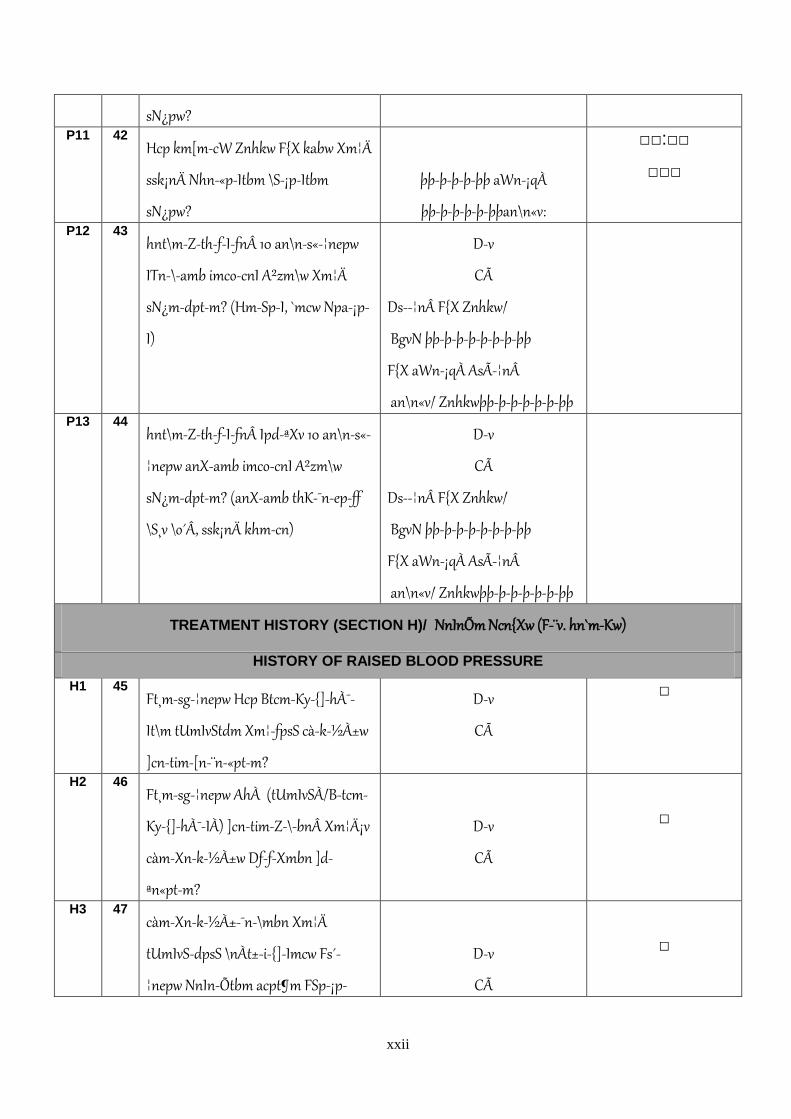
xxii
sN¿pw? P11 42
Hcp km[m-cW Znhkw F{X kabw Xm¦Ä
ssk¡nÄ Nhn-«p-Itbm \S-¡p-Itbm
sN¿pw?
þþ-þ-þ-þ-þþ aWn-¡qÀ
þþ-þ-þ-þ-þ-þþan\n«v:
□□:□□
□□□
P12 43 hnt\m-Z-th-f-I-fn 10 an\n-s«-¦nepw
ITn-\-amb imco-cnI A²zm\w Xm¦Ä
sN¿m-dptm? (Hm-Sp-I, `mcw Npa-¡p-
I)
Dv
CÃ
Ds-¦n F{X Znhkw/
BgvN þþ-þ-þ-þ-þ-þ-þ-þþ
F{X aWn-¡qÀ AsÃ-¦nÂ
an\n«v/ Znhkwþþ-þ-þ-þ-þ-þ-þþ
P13 44 hnt\m-Z-th-f-I-fn Ipd-ªXv 10 an\n-s«-
¦nepw anX-amb imco-cnI A²zm\w
sN¿m-dptm? (anX-amb thK-¯n-ep-ff
\S¸v \o´Â, ssk¡nÄ khm-cn)
Dv
CÃ
Ds-¦n F{X Znhkw/
BgvN þþ-þ-þ-þ-þ-þ-þ-þþ
F{X aWn-¡qÀ AsÃ-¦nÂ
an\n«v/ Znhkwþþ-þ-þ-þ-þ-þ-þþ
TREATMENT HISTORY (SECTION H)/ NnInÕm Ncn{Xw (F-¨v. hn`m-Kw)
HISTORY OF RAISED BLOOD PRESSURE
H1 45 Ft¸m-sg-¦nepw Hcp Btcm-Ky-{]-hÀ¯-
It\m tUmIvStdm Xm¦-fpsS cà-k-½À±w
]cn-tim-[n-¨n-«ptm?
Dv
CÃ
□
H2 46 Ft¸m-sg-¦nepw AhÀ (tUmIvSÀ/B-tcm-
Ky-{]-hÀ¯-IÀ) ]cn-tim-Z-\-bn Xm¦Ä¡v
càm-Xn-k-½À±w Df-f-Xmbn ]d-
ªn«ptm?
Dv
CÃ
□
H3 47 càm-Xn-k-½À±-¯n-\mbn Xm¦Ä
tUmIvS-dpsS \nÀt±-i-{]-Imcw Fs´-
¦nepw NnIn-Õtbm acpt¶m FSp-¡p-
Dv
CÃ
□
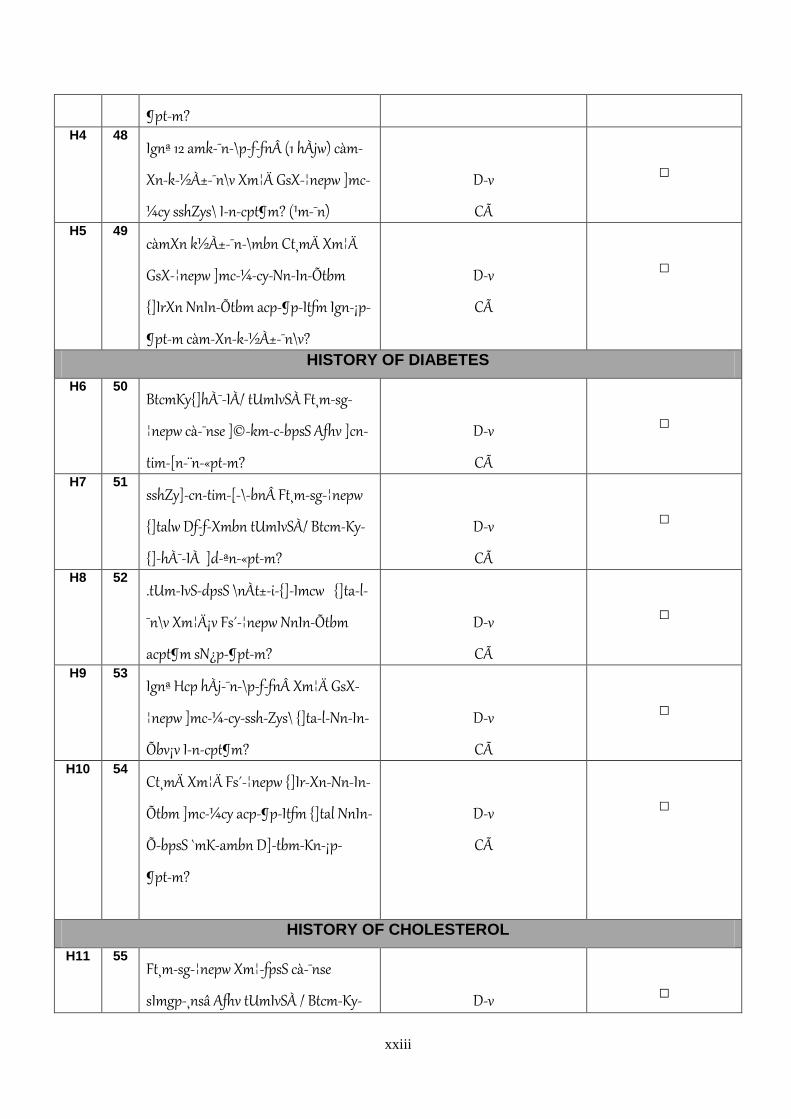
xxiii
¶ptm? H4 48
Ignª 12 amk-¯n-\p-f-fn (1 hÀjw) càm-
Xn-k-½À±-¯n\v Xm¦Ä GsX-¦nepw ]mc-
¼cy sshZys\ In-cpt¶m? (¹m-¯n)
Dv
CÃ
□
H5 49 càmXn k½À±-¯n-\mbn Ct¸mÄ Xm¦Ä
GsX-¦nepw ]mc-¼-cy-Nn-In-Õtbm
{]IrXn NnIn-Õtbm acp-¶p-Itfm Ign-¡p-
¶ptm càm-Xn-k-½À±-¯n\v?
Dv
CÃ
□
HISTORY OF DIABETES
H6 50 BtcmKy{]hÀ¯-IÀ/ tUmIvSÀ Ft¸m-sg-
¦nepw cà-¯nse ]©-km-c-bpsS Afhv ]cn-
tim-[n-¨n-«ptm?
Dv
CÃ
□
H7 51 sshZy]-cn-tim-[-\-bn Ft¸m-sg-¦nepw
{]talw Df-f-Xmbn tUmIvSÀ/ Btcm-Ky-
{]-hÀ¯-IÀ ]d-ªn-«ptm?
Dv
CÃ
□
H8 52 .tUm-IvS-dpsS \nÀt±-i-{]-Imcw {]ta-l-
¯n\v Xm¦Ä¡v Fs´-¦nepw NnIn-Õtbm
acpt¶m sN¿p-¶ptm?
Dv
CÃ
□
H9 53 Ignª Hcp hÀj-¯n-\p-f-fn Xm¦Ä GsX-
¦nepw ]mc-¼-cy-ssh-Zys\ {]ta-l-Nn-In-
Õbv¡v In-cpt¶m?
Dv
CÃ
□
H10 54 Ct¸mÄ Xm¦Ä Fs´-¦nepw {]Ir-Xn-Nn-In-
Õtbm ]mc-¼cy acp-¶p-Itfm {]tal NnIn-
Õ-bpsS `mK-ambn D]-tbm-Kn-¡p-
¶ptm?
Dv
CÃ
□
HISTORY OF CHOLESTEROL
H11 55 Ft¸m-sg-¦nepw Xm¦-fpsS cà-¯nse
sImgp-¸nsâ Afhv tUmIvSÀ / Btcm-Ky-
Dv
□

xxiv
{]-hÀ¯-IÀ ]cn-tim-[n-¨n-«ptm? Cà H12 56
.ssh-Zy-]-cn-tim-[-\-bn Ft¸m-sg-
¦nepw Xm¦Ä¡v cà-¯n sImgp-¸nsâ Afhv
IqSp-X-em-sW¶v tUmIvÀ /B-tcm-Ky-
{]-hÀ¯-IÀ ]d-ªn-«ptm?
Dv
CÃ
□
H13 57 .tUm-IvS-dpsS \nÀt±-i-{]-Imcw CXn\v
Xm¦Ä Fs´-¦nepw NnIn-Õtbm acpt¶m
sN¿p-¶ptm?
Dv
CÃ
□
H14 58 Ignª Hcp hÀj-¯n-\p-f-fn Xm¦Ä GsX-
¦nepw ]mc-¼-cy-ssh-Zys\ CXnsâ NnIn-
Õbv¡v kao-]n-¨n-cpt¶m?
Dv
CÃ
□
H15 59 Ct¸mÄ Xm¦Ä Fs´-¦nepw {]Ir-Xn-Nn-
InÕtbm ]mc-¼cy acp-¶p-Itfm sImgp-
¸nsâ Afhv Ipd-bv¡m-\mbn D]-tbm-Kn-
¡m-dptm?
Dv
CÃ
□
HISTORY OF CARDIOVASCULAR DISEASES
H 16 60 \n§Ä¡v Ft¸m-sg-¦nepw lrZ-bm-Lm-
Xtam lrZ-b-kw-_-Ô-amb AkpJw aqe-ap-
ff s\©p-th-Z-\-tbm, ]£m-Lm-Xtam
h¶n-«ptm?
Dv
CÃ
□
HISTORY OF LIFESTYLE ADVICE
Ignª 3 hÀ¯n-\p-f-fn Hcp tUmIvtdm Btcm-Ky-{]-hÀ¯-It\m Ch-bn GsX-¦nepw sN¿m³ Xm¦sf D]-tZ-in-¨n-cpt¶m?
(Hm-tcm¶pw AS-bm-f-s¸-Sp-¯p-I)
H 17 61 ]pI-hen Dt]-£n-¡p-I. ]pI-h-en-ioew
BhÀ¯n-¡m-Xn-cn-¡pI
Dv
CÃ
□
H18 62 Blm-c-¯n D¸nsâ D]-tbmKw Ipd-bv¡pI Dv
CÃ
□
H19 63 Znh-k-¯n 5 Xh-W-sb-¦nepw ]g-§fpw Dv □
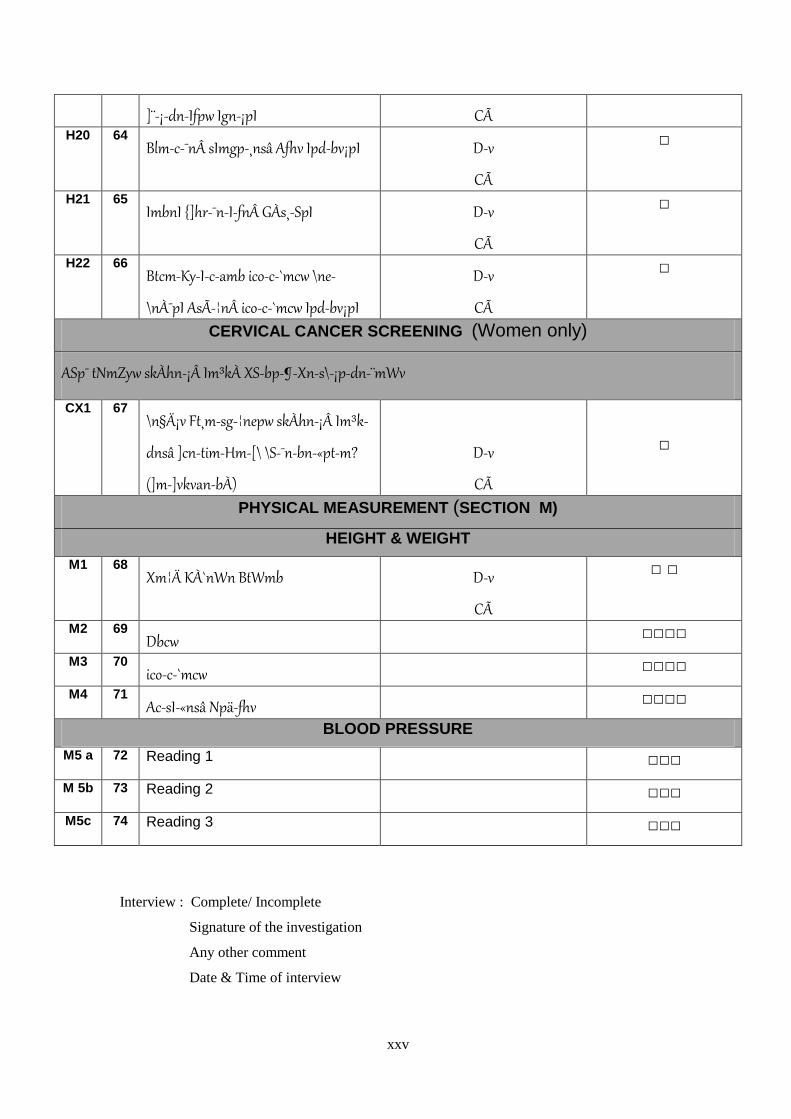
xxv
]¨-¡-dn-Ifpw Ign-¡pI CÃ H20 64
Blm-c-¯n sImgp-¸nsâ Afhv Ipd-bv¡pI Dv
CÃ
□
H21 65 ImbnI {]hr-¯n-I-fn GÀs¸-SpI Dv
CÃ
□
H22 66 Btcm-Ky-I-c-amb ico-c-`mcw \ne-
\nÀ¯pI AsÃ-¦n ico-c-`mcw Ipd-bv¡pI
Dv
CÃ
□
CERVICAL CANCER SCREENING (Women only)
ASp¯ tNmZyw skÀhn-¡Â Im³kÀ XS-bp-¶-Xn-s\-¡p-dn-¨mWv
CX1 67 \n§Ä¡v Ft¸m-sg-¦nepw skÀhn-¡Â Im³k-
dnsâ ]cn-tim-Hm-[\ \S-¯n-bn-«ptm?
(]m-]vkvan-bÀ)
Dv
CÃ
□
PHYSICAL MEASUREMENT (SECTION M)
HEIGHT & WEIGHT
M1 68 Xm¦Ä KÀ`nWn BtWmb Dv
CÃ
□ □
M2 69 Dbcw □□□□
M3 70 ico-c-`mcw □□□□
M4 71 Ac-sI-«nsâ Npä-fhv □□□□
BLOOD PRESSURE
M5 a 72 Reading 1 □□□
M 5b 73 Reading 2 □□□
M5c 74 Reading 3 □□□
Interview : Complete/ Incomplete
Signature of the investigation
Any other comment
Date & Time of interview

xxvi
APPENDIX V

xxvii
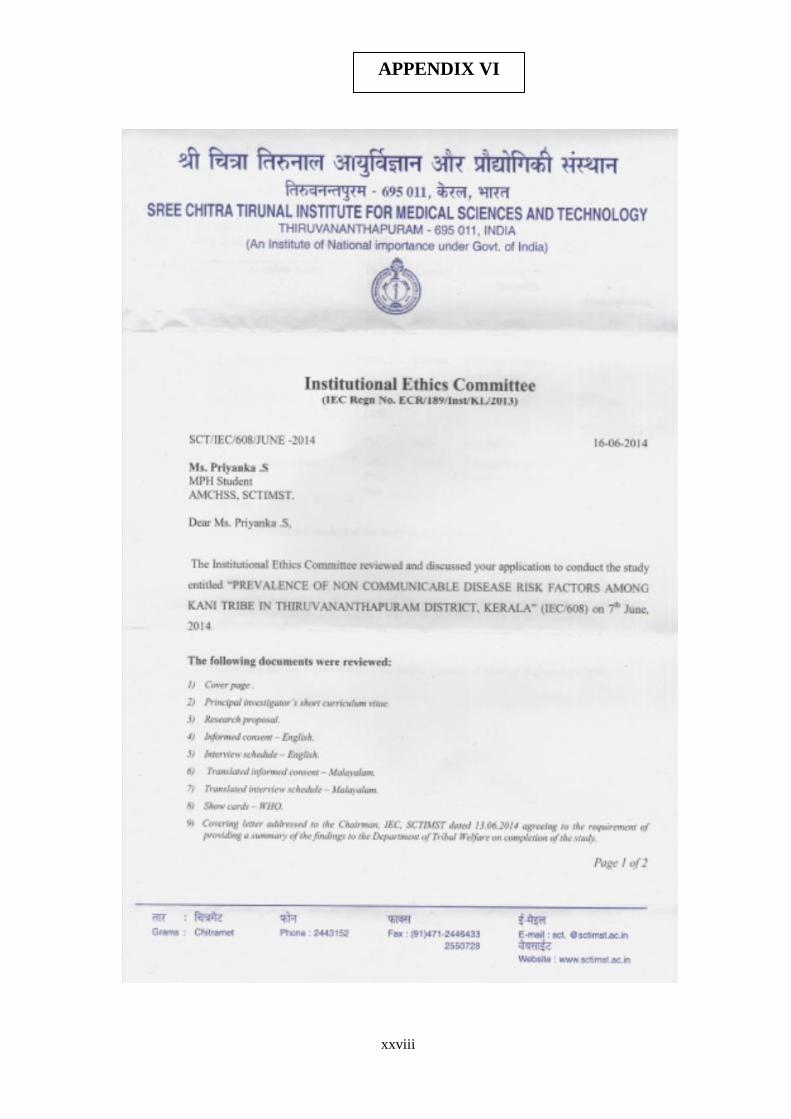
xxviii
APPENDIX VI

xxix