prevalence of virulence genes associated with pathogenic escherichia coli strains isolated from
TRANSCRIPT

1
Prevalence of virulence genes associated with pathogenic Escherichia coli strains isolated 1
from domestically harvested rainwater during low and high rainfall periods 2
3
P. H. Dobrowksy1, A. van Deventer1, M. De Kwaadsteniet1, T. Ndlovu2, S. Khan2, T. E. 4
Cloete1 and W. Khan1# 5
6
1Department of Microbiology, Faculty of Science, Stellenbosch University, Stellenbosch, 7
South Africa. 8
2Department of Biomedical Sciences, Faculty of Health and Wellness Sciences, Cape 9
Peninsula University of Technology, Bellville, South Africa. 10
11
Running Title: Seasonal variation of virulent E. coli in rainwater 12
13
14
15
16
# Address Correspondence to W. Khan; Email: [email protected]; Tel: +27 21 808 5804; 17
Fax: +27 21 808 5846 18
19
20
AEM Accepts, published online ahead of print on 27 December 2013Appl. Environ. Microbiol. doi:10.1128/AEM.03061-13Copyright © 2013, American Society for Microbiology. All Rights Reserved.
on Novem
ber 15, 2018 by guesthttp://aem
.asm.org/
Dow
nloaded from

2
Abstract 21
The possible health risks associated with the consumption of harvested rainwater remains one 22
of the major obstacles hampering its large scale implementation in water limited countries 23
such as South Africa. Rainwater tank samples collected on eight occasions during the low 24
and high rainfall periods (March to August 2012) in Kleinmond, South Africa were thus 25
monitored for the presence of virulence genes associated with Escherichia coli. The identity 26
of presumptive E. coli isolates in rainwater samples collected from ten DRWH tanks 27
throughout the sampling period was confirmed through universal 16S rRNA PCR with 28
subsequent sequencing and phylogenetic analysis. Species specific primers were also used to 29
routinely screen for the virulent genes, aggR, stx, eae and ipaH found in Enteroaggregative 30
E. coli (EAEC), Enterohaemorrhagic E. coli (EHEC), Enteropathogenic E. coli (EPEC) and 31
Enteroinvasive E. coli (EIEC), respectively, in the rainwater samples. Of the 92 E. coli strains 32
isolated from the rainwater using culture based techniques, 6% were presumptively positively 33
identified as E. coli 0157:H7 using 16S rRNA. Furthermore, virulent pathogenic E. coli genes 34
were detected in 3% (EPEC and EHEC) and 16% (EAEC) of the 80 rainwater samples 35
collected during the sampling period from the ten DRWH tanks. This study thus contributes 36
valuable information to the limited data available on the on-going prevalence of virulent 37
pathotypes of E. coli in harvested rainwater during a longitudinal study in a high population 38
density, peri-urban setting. 39
40
Key Words: Domestic rainwater harvesting; Escherichia coli; E. coli virulent genes; 41
longitudinal rainwater study 42
43
on Novem
ber 15, 2018 by guesthttp://aem
.asm.org/
Dow
nloaded from

3
INTRODUCTION 44
Rainwater harvesting is practiced worldwide and refers to the collection and storage of 45
rainwater runoff for domestic and agricultural use (1-3). Domestic rainwater harvesting 46
(DRWH) can also potentially serve as a safe and inexpensive water supply for households 47
and worldwide, countries such as Australia, Greece and Bermuda, are making extensive use 48
of this water source (4-6). However, possible health risks associated with the consumption of 49
harvested rainwater remains one of the major obstacles hampering the large scale 50
implementation of DRWH, as microbial and chemical contaminants have previously been 51
detected in rainwater tanks (7-9). 52
Depending on the atmospheric pollution, the harvesting method and the storage of 53
rainwater, the quality of harvested rainwater may fluctuate and be compromised due to 54
various pollutants, for example, bird or animal droppings (10). While generally an increase in 55
the use of stored rainwater is observed during the high rainfall seasons, it should be noted that 56
correspondingly increased levels of microbial pollution are also experienced during rainy 57
seasons as large numbers of microorganisms are washed from various point- and non-point 58
pollution sites, such as rooftops. Water then acts as an inert carrier of the pathogenic 59
microorganisms, such as protozoa, helminths, viruses and bacteria, and humans can become 60
infected with diseases such as diarrhea, skin irritations, typhoid and respiratory disorders 61
from the microbially contaminated water sources (11). Escherichia coli (E. coli), a general 62
indicator of water quality, can however also be pathogenic, and is divided into five classes 63
namely Enteroaggregative E. coli (EAEC), Enterohaermorrhagic E. coli (EHEC), 64
Enteropathogenic E. coli (EPEC), Enterotoxigenic E. coli (ETEC) and Enteroinvasive E. coli 65
(EIEC), based on the specific virulent genes present. All the strains are associated with 66
watery diarrhea but some strains are associated with bloody diarrhea (EHEC), vomiting 67
(ETEC) and fever (ETEC and EIEC) (12). 68
on Novem
ber 15, 2018 by guesthttp://aem
.asm.org/
Dow
nloaded from

4
The frequency of detecting E. coli strains during low and high rainfall seasons in 69
DRWH tanks in Kleinmond, a coastal town in South Africa was monitored. The detection of 70
the virulence genes associated with the four pathogenic E. coli strains (EAEC, EHEC, EPEC 71
and EIEC) was particularly focused on. Spearman Rank Order Correlations were also 72
determined between E. coli, rainfall, temperature, pH and between chemical compounds, for 73
example, metal ions. 74
75
MATERIALS AND METHODS 76
Sample collection and general rainwater analysis 77
The Department of Science and Technology (DST) commissioned the Council of Science and 78
Industrial Research (CSIR) to investigate technologies that will improve the sustainability 79
and quality of low-income subsidized housing in South Africa (13). Consequently 411 pilot-80
scale houses (40 m2) were constructed in Kleinmond, Western Cape, with each of the houses 81
provided with a DRWH tank. From a cluster of 411 houses, 10 houses were selected for 82
sampling rainwater during the study period (March to August 2012) and for the E. coli 83
enumeration and identification. In addition, 29 houses (including the 10 for E. coli analysis) 84
were selected for the statistical correlation studies. The vertical rainwater tanks, made of 85
polyethylene, had a capacity of 2000 liters. There were no obstacles obstructing the roofs, i.e. 86
trees or electrical power lines and no first flush diverters were installed to eliminate the first 87
flush of debris from the roof surface into the tanks. Sampling was initially conducted every 88
three weeks (March to May 2012) and there after one to four days after a rain event (June to 89
August 2012). 90
For microbial and chemical analysis water samples were collected in 2 L sterile 91
polypropylene bottles that were rinsed with tap water and sterilized with 70% ethanol. After 92
on Novem
ber 15, 2018 by guesthttp://aem
.asm.org/
Dow
nloaded from

5
collection the samples were stored on ice to maintain a temperature below 4°C during 93
transportation. In total eight sampling sessions were conducted with data on the total rainfall 94
recorded for each month obtained from the South African Weather Services (14). 95
Membrane filtration was also used to enumerate E. coli and the procedure was 96
performed in duplicate within 4 hours of sampling. For sampling sessions one and two, 97
undiluted samples were filtered. From sampling session three a 1:4 dilution was made of each 98
sample in duplicate. The method consisted of filtering 100 mL (25 mL rainwater sample plus 99
75 mL sterile distilled water) of each sample through a sterile GN-6 Metricel® S-Pack 100
Membrane Disc Filter (Pall Life Sciences, Michigan, USA) with a pore size of 0.45 μm and a 101
diameter of 47 mm. The filters were then incubated on m-Endo Agar (Merck) at 35 ± 2°C for 102
18 - 24 hours (15). The membrane filtration results were utilized for the enumeration of 103
E. coli and selection of isolates. 104
For each of the DRWH tanks an undiluted and diluted (10-1) rainwater sample were 105
spread plated onto Membrane Lactose Glucuronide Agar (MLGA) (Oxoid) (35 ± 2°C for 18 - 106
24 hours) to isolate E. coli. ChromoCult® Coliform Agar (CCA) (Merck, Biolab, Wadeville, 107
Gauteng) was used to obtain E. coli numbers and the plates were also incubated at 35 ± 2°C 108
for 18 - 24 hours. The CCA counts were used for statistical purposes only, while isolates of 109
E. coli were obtained from CCA and MLGA for the further selection of E. coli. 110
The temperature and pH of the rainwater at the sampling locations were measured 111
using a hand-held mercury thermometer and color-fixed indicator sticks with a pH range of 0 112
- 14 (ALBET®, Barcelona, Spain). The concentrations of metals such as aluminum (Al), 113
vanadium (V), chromium (Cr), manganese (Mn), iron (Fe), copper (Cu) and zinc (Zn), 114
amongst others, were determined for the first sampling. Metal concentrations were 115
determined using nitric acid digestion and inductively coupled plasma atomic emission 116
spectrometry (ICP-AES). All chemical analyses were performed at the Central Analytical 117
on Novem
ber 15, 2018 by guesthttp://aem
.asm.org/
Dow
nloaded from

6
Facility (CAF), Stellenbosch University. High-Performance Ion Chromatography (HPIC) was 118
used to determine the concentration of anions such as, chloride (Cl), nitrate (NO3) and 119
sulphate (SO4) during the first sampling. 120
121
Molecular Analysis of Escherichia coli 122
Isolation of Escherichia coli and Genomic DNA Extractions 123
Typical E. coli isolates from 10 randomly selected rainwater tanks (within the cluster of 29 124
tanks monitored) were selected from ChromoCult® Coliform Agar, m-Endo agar and MLGA 125
agar, which specifically selects for the growth of E. coli and suppresses the growth of other 126
enteric species. These isolates were then subjected to the IMViC test for the further selection 127
of E. coli strains (16). 128
After purification and IMViC test analysis, single colonies obtained from nutrient 129
agar were inoculated into Luria Bertani (LB) broth (Merck) and were grown at 37°C for 12 h. 130
Cells were harvested from 2 mL of the cell suspension by centrifuging at 16 000 × g for 131
10 min and discarding the supernatant. Genomic DNA was then isolated according to the 132
manufacturer’s instructions using the ZRTM Soil microbe DNA Miniprep Kit (Zymo 133
Research). 134
135
Universal 16S rRNA identification of E. coli isolates 136
With the use of conventional PCR, presumptive positive E. coli isolated from rainwater 137
samples were identified. Universal 16S rRNA primers Fdd2 (5'- 138
CCGGATCCGTCGACAGAGTTTGATCITGGCTCAG- 3') and Rpp2 (5' -139
CCAAGCTTCTAGACGGITACCTTGTTACGACTT - 3') and the PCR conditions adapted 140
from Rawlings (17), were used to amplify the 16S rRNA conserved region (1600 bp) of each 141
on Novem
ber 15, 2018 by guesthttp://aem
.asm.org/
Dow
nloaded from

7
isolate. The PCR conditions were optimized by increasing the annealing temperature from 142
54°C to 59°C. 143
Phylogenetic trees of the results obtained for the 16S rRNA E. coli sequences were 144
constructed to observe whether non-pathogenic and pathogenic strains of E. coli clustered 145
together and how this varied between certain sampling sessions (18). Most similar type 146
species with 97% similarity (<3% diversity) to the sequences of isolates were designated as 147
the same species. The 16S rRNA sequences were aligned using Clustal X (19, 20). The 148
evolutionary distances for each 16S rRNA were also calculated by the neighbor-joining 149
method with Maximum Composite Likelihood model by 1000 replicates and phylogenetic 150
trees were created by using MEGA (21). All positions containing gaps and missing data were 151
eliminated from the dataset using complete deletion option. 152
153
Screening for pathogenic E. coli genes in rainwater samples 154
In addition to extracting DNA from each presumptive E. coli isolate, total DNA was also 155
extracted from rainwater samples collected from ten tanks. To extract total DNA from the 156
water samples a modified version of the boiling method proposed by Watterworth et al. (22) 157
was used. Eight hundred milliliters of each sample was filtered through a sterile GN-6 158
Metricel® S-Pack Membrane Disc Filter (Pall Life Sciences) with a pore size of 0.45 μm and 159
a diameter of 47 mm. The filters were then processed for DNA extraction as outlined in 160
Ndlovu et al. (23). 161
The species specific primers adopted from Toma et al. (24) that were used for the 162
detection of the pathogenic E. coli strains (EPEC, EIEC, EHEC and EAEC) in the rainwater 163
samples are indicated in Table 1. All the positive control strains (EPEC B170, EIEC ATCC 164
43892, EHEC O157:H7 and EAEC 3591-87) utilized in this study were obtained from the 165
Cape Peninsula University of Technology (CPUT), Bellville. The PCR conditions and 166
on Novem
ber 15, 2018 by guesthttp://aem
.asm.org/
Dow
nloaded from

8
reagents utilized were adapted from the Ndlovu et al. (23) protocol as outlined in Table 2. 167
The PCR conditions were also optimized by increasing the annealing temperature from 52°C 168
to 54°C. 169
170
Statistical Analysis 171
The data obtained from the microbial and physico-chemical analysis of the collected 172
rainwater samples was assessed using the statistical software package Statistica™ Ver. 11.0 173
(Stat Soft Inc, Tulsa, USA). In each data set, analysis of the residuals revealed that the data 174
was not normally distributed, which pointed to the requirement for the Spearman Rank Order 175
Correlation as non-parametric correlation technique to test the significance of the data set. In 176
this test, a Restricted Maximum Likelihood solution (REML) with type Ш decomposition 177
was performed on all data recorded to establish whether there was variation between 178
sampling sessions. Once it was established that variation was indeed present, Variance 179
Estimation, Precision and Comparison (VEPACK) analysis was performed. However the data 180
for pH, temperature and average rainfall were set as fixed variables and time and sample were 181
set as grouping variables. Data pairs that showed significant differences were subsequently 182
further analyzed using the Least Squares Difference (LSD) test and probabilities for Post-hoc 183
pair-wise comparisons. In all hypothesis tests, a significant level of 5% was used as 184
standards (25). In all tests a P-value smaller than 0.05 was considered as statistically 185
significant. 186
187
188
189
190
on Novem
ber 15, 2018 by guesthttp://aem
.asm.org/
Dow
nloaded from

9
RESULTS 191
Prevalence of Escherichia coli during low and high rainfall period 192
On average the membrane filtration E. coli counts for the ten DRWH tanks ranged from zero 193
(for isolated tanks) to 2.5 × 10² cfu 100 mL-1 over the entire sampling period. Throughout 194
sampling one to four, the low rainfall period (16.8 mm in March to 30.6 mm in May), 195
numerous tanks had no E. coli present with 44% of the DRWH tanks sampled exceeding the 196
drinking water guidelines as stipulated by the Department of Water Affairs (DWAF) (26) and 197
the Australian Drinking Water Guidelines (ADWG) (27). In comparison, for sampling five 198
to eight, where higher rainfall events (74.7 mm in June to 198.1 mm in August) were 199
recorded, 79% of the tanks sampled had E. coli counts significantly (p < 0.05) exceeding the 200
standards. Overall for all the rainwater samples collected from the domestic rainwater 201
harvesting tanks (1 to 29) for sampling one to eight, utilizing membrane filtration, 62% of the 202
E. coli counts recorded exceeded the recommended values as stipulated by DWAF (26) and 203
the ADWG (27). 204
205
Identification of E. coli isolates based on 16S rRNA analysis 206
Of the 170 presumptive positive E. coli plate isolates identified throughout the sampling 207
period from ten DRWH tanks, 71% (121 strains) yielded a positive IMViC analysis and 208
exhibited E. coli characteristics. The identity of these presumptive E. coli strains was then 209
confirmed through universal 16S rRNA PCR with subsequent sequencing. Sequencing 210
revealed that 76% (92 strains) of the IMViC positive isolates were E. coli strains, while the 211
remaining isolates belonged to the genera Enterobacter, Serratia, Shigella and Proteus. 212
The phylogeny of the representative organisms according to GenBank for samplings 213
1, 3 and 6 (greater E. coli strain diversity identified during these sampling times) were 214
on Novem
ber 15, 2018 by guesthttp://aem
.asm.org/
Dow
nloaded from
10
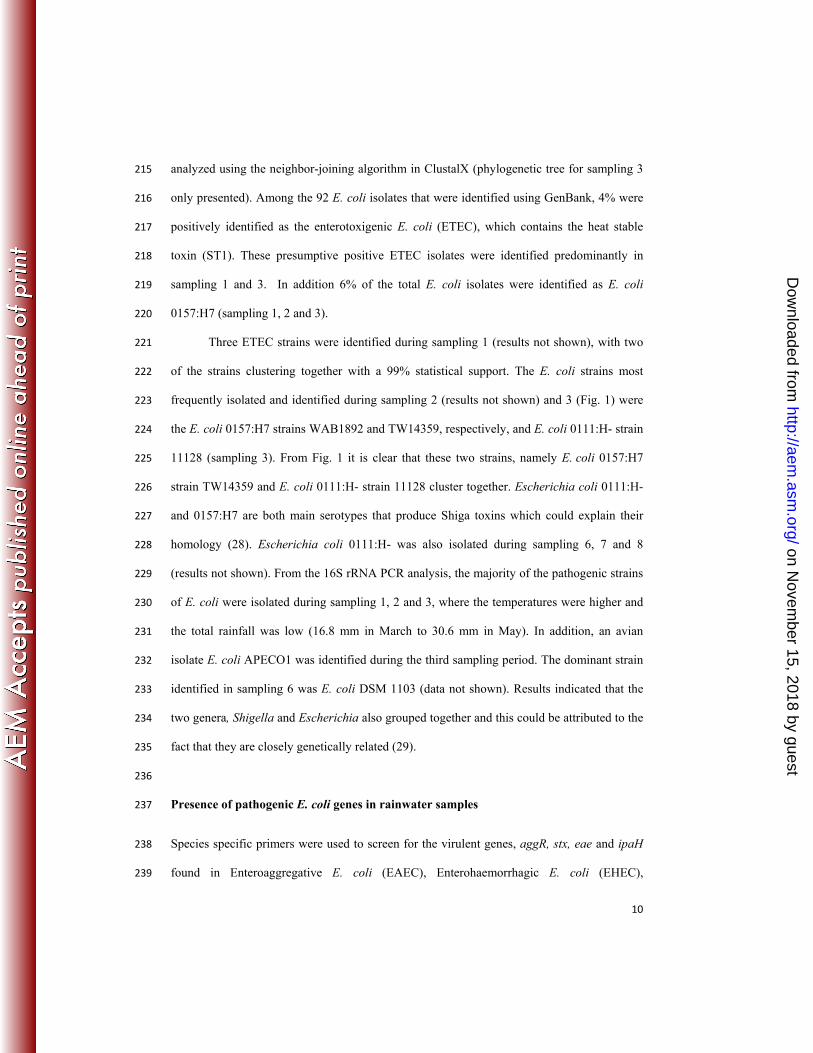
analyzed using the neighbor-joining algorithm in ClustalX (phylogenetic tree for sampling 3 215
only presented). Among the 92 E. coli isolates that were identified using GenBank, 4% were 216
positively identified as the enterotoxigenic E. coli (ETEC), which contains the heat stable 217
toxin (ST1). These presumptive positive ETEC isolates were identified predominantly in 218
sampling 1 and 3. In addition 6% of the total E. coli isolates were identified as E. coli 219
0157:H7 (sampling 1, 2 and 3). 220
Three ETEC strains were identified during sampling 1 (results not shown), with two 221
of the strains clustering together with a 99% statistical support. The E. coli strains most 222
frequently isolated and identified during sampling 2 (results not shown) and 3 (Fig. 1) were 223
the E. coli 0157:H7 strains WAB1892 and TW14359, respectively, and E. coli 0111:H- strain 224
11128 (sampling 3). From Fig. 1 it is clear that these two strains, namely E. coli 0157:H7 225
strain TW14359 and E. coli 0111:H- strain 11128 cluster together. Escherichia coli 0111:H- 226
and 0157:H7 are both main serotypes that produce Shiga toxins which could explain their 227
homology (28). Escherichia coli 0111:H- was also isolated during sampling 6, 7 and 8 228
(results not shown). From the 16S rRNA PCR analysis, the majority of the pathogenic strains 229
of E. coli were isolated during sampling 1, 2 and 3, where the temperatures were higher and 230
the total rainfall was low (16.8 mm in March to 30.6 mm in May). In addition, an avian 231
isolate E. coli APECO1 was identified during the third sampling period. The dominant strain 232
identified in sampling 6 was E. coli DSM 1103 (data not shown). Results indicated that the 233
two genera, Shigella and Escherichia also grouped together and this could be attributed to the 234
fact that they are closely genetically related (29). 235
236
Presence of pathogenic E. coli genes in rainwater samples 237
Species specific primers were used to screen for the virulent genes, aggR, stx, eae and ipaH 238
found in Enteroaggregative E. coli (EAEC), Enterohaemorrhagic E. coli (EHEC), 239
on Novem
ber 15, 2018 by guesthttp://aem
.asm.org/
Dow
nloaded from

11
Enteropathogenic E. coli (EPEC) and Enteroinvasive E. coli (EIEC), respectively, in the 240
rainwater samples collected from the ten DRWH tanks. These PCR products were sequenced 241
to confirm the amplification of the gene and BLAST results that showed a homology of 242
≥ 98% was confirmed as the amplification of the correct gene. The virulent genes that were 243
amplified in the various tanks throughout the sampling period are presented in Tables 1 and 244
3, and as indicated no pathogenic E. coli genes were detected during sampling sessions one, 245
two, three and five. 246
In this study, the aggR gene, associated with the EAEC strain, was detected in 10% of 247
the rainwater tanks during samplings 4 and 6, respectively (Table 3). Detection of the aggR 248
gene was also confirmed in 50% and 60% of the DRWH tanks during sampling sessions 7 249
and 8. The occurrence of EPEC [intimin gene (eae)] and EHEC [shiga toxin gene (stx)] was 250
much lower than EAEC throughout the sampling period, but was confirmed in sampling 6 251
and 8 (Table 3) at 10% for EPEC (sampling 6) and at 20% for EHEC (sampling 8). 252
253
Spearman Rank Order Correlations between E. coli and physico-chemical properties of 254
rainwater 255
For the statistical correlation studies, the results for 29 houses (including the 10 for E. coli 256
analysis) were analysed. Significant correlations (p < 0.00) were noted between E. coli 257
counts, utilizing the spread plate technique (CCA) and the following parameters; E. coli 258
counts utilizing membrane filtration (R = -0.21) (m-Endo) and rainfall (R = -0.36). It should 259
also be noted that in the current study the pH (R = -0.655) and temperature (R = -0.705) of 260
the rainwater samples showed a significant negative correlation to the average rainfall 261
recorded. After analyzing all the data the REML and the Fixed Effect test showed significant 262
variation (p = 0.00, F = 8.968) for E. coli counts (utilizing the spread plate technique) 263
on Novem
ber 15, 2018 by guesthttp://aem
.asm.org/
Dow
nloaded from

12
amongst the eight sampling sessions. The LSD test then showed that the highest mean 264
difference (2465.52±449.86) (p = 0.00) was recorded between sampling sessions one and 265
seven, while the lowest mean difference, with the least amount of variation, was recorded 266
between sampling sessions two and six (68.97± 449.8644) ( p = 0.878). 267
268
DISCUSSION 269
Escherichia coli is included as a specific indicator organism of the level of fecal 270
pollution from warm-blooded animals (4, 30) and the presence of E. coli in harvested 271
rainwater samples was thus monitored in the low and high rainfall seasons in DRWH tanks in 272
Kleinmond, South Africa. Enumeration techniques indicated that the E. coli counts recorded 273
exceeded the recommended value of 0 cfu 100 mL-1 (26, 27) in 62% of the rainwater samples 274
collected throughout the study period. In comparison to the low rainfall season, a significant 275
increase (p < 0.05) in the numbers of E. coli were also observed in harvested rainwater 276
samples collected during the high rainfall season [sampling five (74.7 mm) to eight 277
(198.1 mm)]. The percentages of E. coli detected in similar studies conducted on the 278
microbial quality of rainwater also varied from 33% (9), 63% (31) to 79% of the samples 279
(32). However, these studies were performed 1 to 4 days after a rain event and, to our 280
knowledge, only the study performed by Sazakli et al. (4) investigated the effect of seasonal 281
variation on the quality of harvested rainwater, with the highest E. coli numbers recorded in 282
autumn, which is the start of the rainfall season. A negative correlation was also recorded 283
between pH and temperature and rainfall, which implies that E. coli numbers increased 284
during sampling five to eight when the rainfall was high and the pH [sampling five (pH 5.4) 285
to eight (pH 5.1)] and temperature [sampling five (14.8 °C) to eight (13.3 °C)] were low. 286
Ninety-two E. coli strains were subsequently isolated by culture techniques from the 287
10 rainwater tanks sampled in the Kleinmond Housing Scheme during the study period with a 288
on Novem
ber 15, 2018 by guesthttp://aem
.asm.org/
Dow
nloaded from

13
preliminary identification performed using 16S rRNA analyses. Non-pathogenic and 289
pathogenic E. coli strains, including E. coli ETEC H10407, E. coli 0157:H7 and an avian 290
isolate E. coli APECO1, were isolated from numerous DRWH samples during the study. The 291
ETEC strain identified predominantly in sampling 1 and 3, causes watery diarrhea and in a 292
few cases it can also cause vomiting and fever. Infants and travelers in underdeveloped 293
countries are the most susceptible to this E. coli strain (33). Escherichia coli 0157:H7, 294
isolated during sampling 2 and 3, is the predominant serotype of enterohaemorrhagic E. coli 295
(EHEC) that produces the Shiga-like toxin that is responsible for causing watery and 296
subsequent bloody diarrhea in humans. In addition, the avian isolate E. coli APECO1, 297
isolated during sampling 3, most likely originated from bird feces and may contain many 298
virulent genes belonging to the extra-intestinal pathogenic E. coli (ExPEC). 299
The whole DNA isolated from the harvested rainwater samples directly was then 300
screened for the presence of the virulence genes, aggR, stx, eae and ipaH associated with 301
Enteroaggregative E. coli (EAEC), Enterohaemorrhagic E. coli (EHEC), Enteropathogenic 302
E. coli (EPEC) and Enteroinvasive E. coli (EIEC), respectively. The most prevalent gene 303
detected during the study was aggR, associated with EAEC strains. This virulence gene was 304
detected during sampling 4, 6, 7 and 8, at 10%, 10%, 50% and 60%, respectively. The 305
presence of EAEC harboring the aggR gene in these tanks can have a severe impact on the 306
health of children and adults. In addition, while the occurrence of EPEC [intimin gene (eae)] 307
and EHEC [shiga toxin gene (stx)] was much lower than EAEC throughout the sampling 308
period, the presence of these genes were also confirmed in sampling 6 and 8 (Table 3) at 309
10%, respectively for EPEC and at 20% for EHEC (sampling 8). The detection of the intimin 310
eae gene in EPEC could indicate the presence of shiga-toxin producing E. coli (STEC), since 311
this gene is found in more than one pathotype (34). The ingestion of EPEC however, causes 312
watery diarrhea that is associated with vomiting and low fever (12), while the EHEC is one of 313
on Novem
ber 15, 2018 by guesthttp://aem
.asm.org/
Dow
nloaded from

14
the most pathogenic E. coli groups that have the ability to cause bloody diarrhea, with little or 314
no fever. If the disease is left untreated, it can lead to haemorrhagic colitis (HC) and can 315
progress to haemolytic-uraemic syndrome (HUS), affecting the kidney and liver. The 316
virulence gene ipaH, associated with EIEC strains, was not detected in any of the rainwater 317
samples collected during the sampling period. 318
It is important to note that during sampling 1, 2, 3 and 5 no virulence genes were 319
detected in the rainwater tanks. Ten per cent of the rainwater samples collected from the 320
tanks during sampling 4 were contaminated with virulence genes, while sampling 8 had the 321
highest number of tanks (90%) contaminated. Overall, during sampling 4, 6, 7 and 8, 10%, 322
20%, 50% and 90%, respectively of the tanks were contaminated with pathogenic E. coli 323
toxin genes. It is also evident that the virulent genes were most often detected during 324
sampling 8 where the highest average rainfall of 198 mm was recorded. On comparison, these 325
results are contradictory to the 16S rRNA analysis where pathogenic E. coli (0157:H7 and 326
ETEC) were most frequently identified from culturable E. coli strains during sampling 1 to 3. 327
It can thus clearly be seen that 16S rRNA may not be not suitable to distinguish between 328
strains in a species, as was also confirmed by Lukjancenko et al. (29). Results of this study 329
also clearly indicate that the E. coli plate counts and the presence of E. coli virulence genes 330
were lower in the low rainfall season (sampling 1 to 4) and significantly increased (p < 0.05) 331
in the high rainfall season (sampling 5 to 8). The feces of warm-blooded animals could serve 332
as a possible source of E. coli contamination in the rainwater tanks, as warm blooded animals 333
have been shown to carry a high number of pathogenic E. coli strains in their intestines (36). 334
Ahmed et al. (35) conducted a study in Southeast Queensland, Australia, and successfully 335
isolated E. coli species with identical biochemical phenotype profiles from rainwater tanks as 336
well as from bird and possum feces found on the roof surfaces where the tanks were installed. 337
Other sources of rainwater contamination include “leaf debris and organic material washed 338
on Novem
ber 15, 2018 by guesthttp://aem
.asm.org/
Dow
nloaded from

15
into the tank, animals, insects and birds that have drowned in the water and breeding 339
mosquitoes” (37). A recent study conducted in Singapore confirmed the presence of 340
pathogenic microorganisms, including E. coli, in airborne particulate matter which can serve 341
as another source of contamination (38). A gravel road also runs along the outside of the 342
settlement, and with cars passing by on a regular basis, dust could be disturbed and settle on 343
the roof surface, resulting in contamination. 344
Although studied serotypes of E. coli are well recognized as being of zoonotic origin 345
these E. coli strains have been shown to infect humans and are therefore a health risk if 346
present in a water source. For example EHEC strains are known to be of zoonotic origin with 347
animals such as cattle being the reservoir for human infections (39). Therefore, even though 348
microbial source tracking with the use of sewage associated markers such as Bacteroides 349
HF183 (40), could be used to determine if fecal contamination is of human origin, the focus 350
of this study was on the detection of pathogenic E. coli serotypes present in harvested 351
rainwater which could have potential health risks. Additional studies have also been 352
conducted which focused on the detection of bacterial pathogens associated with human 353
diseases, such as Salmonella and Shigella spp. in the harvested rainwater collected from 354
DRWH in Kleinmond, South Africa. 355
In conclusion, the E. coli counts, isolation and identification of E. coli strains and the 356
detection of virulence genes associated with EAEC, EHEC and EPEC strains in the rainwater 357
samples, clearly indicates that the roof harvested rainwater is not suitable for potable 358
purposes, with limited domestic application, as this water source could be associated with 359
public health risks and human disease. Similar observations were made world-wide, where it 360
was concluded that harvested rainwater is not suitable for drinking purposes without prior 361
treatment (4, 7, 8, 41). In addition, rain allows pathogens from animal droppings and other 362
organic debris to be flushed into the tanks via the gutters and as E .coli counts and toxin 363
on Novem
ber 15, 2018 by guesthttp://aem
.asm.org/
Dow
nloaded from

16
genes were increased during the higher rainfall period, the feces of birds, insects and 364
mammals, could have filtered from the roof tops into the rainwater tank, which would have 365
resulted in the fecal contamination of the water source. However, harvested rainwater is an 366
important, alternative water source that could be utilized if the technology is applied in the 367
correct manner and if the rainwater is treated before it is used for drinking and certain 368
domestic purposes. Therefore promoting the correct use and maintenance of DRWH tanks 369
could improve the microbial and chemical quality of the harvested rainwater (42, 43). Future 370
research is thus focusing on the implementation of point of use systems, such as 371
nanofiltration, solar pasteurization, etc. for the treatment of harvested rainwater sources. In 372
addition, currently solar pasteurization and filtration systems are being optimized and 373
analyzed at the pilot plant scale level and the efficiency and durability of these systems in 374
improving the microbial quality of harvested rainwater are being investigated. 375
376
ACKNOWLEDGEMENTS 377
The authors would like to thank the following persons and institutions: the Water Research 378
Commission and the National Research Foundation for funding this project; the South 379
African Weather Services for providing the total rainfall data for the months of March to 380
August 2012; Prof Alf Botha for critical reading of the manuscript and Mr. Joseph Smith and 381
the Kleinmond Municipality, for their assistance in the selection of sampling houses included 382
in this study. 383
384
REFERENCES 385
1. Gould J. 1999. Contributions relating to rainwater harvesting. Thematic Review IV.3: 386
Assessment of Water Supply Options. World Commission on Dams. 387
on Novem
ber 15, 2018 by guesthttp://aem
.asm.org/
Dow
nloaded from

17
2. Mwenge Kahinda JM, Lillie ESB, Taigbenu AE, Taute M, Boroto RJ. 2008. 388
Developing suitability maps for rainwater harvesting in South Africa. Phys. Chem. 389
Earth 33:788-799. 390
3. Helmreich B, Horn H. 2009. Opportunities in rainwater harvesting. Desalination 391
248:118-124. 392
4. Sazakli E, Alexopoulos A, Leotsinidis M. 2007. Rainwater harvesting, quality 393
assessment and utilization in Kefalonia Island, Greece. Water Res. 41:2039-2047. 394
5. Ahmed W, Gardner T, Toze S. 2011. Microbiological quality of roof-harvested 395
rainwater and health risks: A review. J. Environ. Qual. 40:13 - 21. 396
6. Lévesque B, Pereg D, Watkinson E, Maguire JS, Bissonnette L, Gingras S, Rouja 397
P, Bergeron MG, Dewailly E. 2008. Assessment of microbiological quality of 398
drinking water from household tanks in Bermuda. Can. J. Microbiol. 54:495-500. 399
7. Yaziz MI, Gunting H, Sapari N, Ghazali AW. 1989. Variations in rainwater quality 400
from roof catchments. Water Res. 23:761-765. 401
8. Zhu K, Zhang L, Hart W, Liu M, Chen H. 2004. Quality issues in harvested 402
rainwater in arid and semi-arid Loess Plateau of northern China. J. Arid Environ. 403
57:487-505. 404
9. Spinks J, Phillips S, Robinson P, Van Buynder P. 2006. Bushfires and tank 405
rainwater quality: A cause for concern? J. Water Health 4:21–28. 406
10. Pathak N, Heijnen H. 2006. Health and hygiene aspects of rainwater for drinking. 407
32nd WEDC International Conference, Colombo, Sri Lanka. 408
11. Kong RYC, Mak MMH, Wu RSS. 2009. DNA technologies for monitoring 409
waterborne pathogens: A revolution in water pollution monitoring. Ocean and Coastal 410
Management 52:355-358. 411
on Novem
ber 15, 2018 by guesthttp://aem
.asm.org/
Dow
nloaded from

18
12. Todar K. 2008. Pathogenic E. coli Todars online textbook of bacteriology [Online]. 412
Available: http://www.textbookofbacteriology.net/e.coli_4.html. 413
13. CSIR. 2010. CSIR expertise and technology employed for improving low income 414
subsidised housing. In Sustainable implementation, monitoring and evaluation, 415
National Survey Delivery Support, April 2011. 416
14. South African Weather Service (SAWS). 2012. Available at: 417
http://www.weathersa.co.za/. 418
15. U.S. Environmental Protection Agency. 2009. Analytical methods approved for 419
drinking water compliance monitoring under the total coliform rule – Natiobal 420
Primary Drinking Water Regulations. U.S. Environmental Protection Agency Office 421
of Water, Washington, DC. 422
16. Harley JP, Prescott ML. 1993. Laboratory Exercises in Microbiology, United States 423
of America: Wm. C. Brown Publishers. 424
17. Rawlings D.E. 1995. Restriction enzyme analysis of 16S rRNA genes for the rapid 425
identification of Thiobacillus ferooxidans, Thiobacillus thiooxidans, Leptospirillum 426
ferooxidans strains in leaching environments. In: Jerez CA, Vargas T, Toledo H and 427
Wiertz JV (eds.) Biohydrometallurgical Processing, University of Chile Press, 428
Santiago. 9 - 17. 429
18. Lee J, Lee CS, Hugunin KM, Maute CJ, Dysko RC. 2010. Bacteria from drinking 430
water supply and their fate in gastrointestinal tracts of germ-free mice: A phylogenetic 431
comparison study. Water Res. 44:5050 - 5058. 432
19. Larkin MA, Blackshields G, Brown NP, Chenna R, McGettigan PA, McWilliam 433
H, Valentin F, Wallace IM, Wilm A, Lopez R, Thompson JD, Gibson TJ, 434
Higgens DG. 2007. Clustal W and Clustal X version 2.0. Bioinformatics 23:2947 - 435
2948. 436
on Novem
ber 15, 2018 by guesthttp://aem
.asm.org/
Dow
nloaded from

19
20. Tamura K, Nei M, Kumar S. 2004. Prospects for inferring very large phylogenies 437
by using the neighbor-joining method. P. Natl. Acad. Sci. USA 101:11030 - 11035. 438
21. Tamura K, Dudley J, Nei M, Kumar S. 2007. MEGA4: molecular evolutionary 439
genetics analysis (MEGA) software version 4.0. Mol. Biol. Evol. 24:1596 - 1599. 440
22. Watterworth L, Topp E, Schraft H, Leung KT. 2005. Multiplex PCR-DNA probe 441
assay for the detection of pathogenic Escherichia coli. J. Microbiol. Meth. 60:93-442
105. 443
23. Ndlovu TM, Le Roux, M, Khan, W, Khan, S. 2013. Comparison of diagnostic tools 444
and molecular based techniques for the rapid identification of Escherichia coli and 445
coliforms in contaminated river water. Masters’ Thesis, Cape Peninsula University of 446
Technology, South Africa 447
24. Toma C, Lu Y, Higa N, Nakasone N, Chinen I, Baschkier A, Rivas M, Iwanaga 448
M. 2003. Multiplex PCR assay for identification of human diarrheagenic Escherichia 449
coli. J. Clin. Microbiol. 41:2669 - 2671. 450
25. Dunn OJ, Clark VA. 1974. Applied Statistics: Analysis of Variance and Regression, 451
Second ed. John Wiley, and Sons, London, UK. 452
26. Department of Water Affairs & Forestry (DWAF). 1996. South African Water 453
Quality Guidelines 2nd Edition, Volume 1: Domestic Water Use. Pretoria: CSIR 454
Environmental Services, 1996. 455
27. NHMRC, NRMMC. 2011. Australian Drinking Water Guidelines Paper 6 National 456
Water Quality Management Strategy. 2011. National Health and Medical Research 457
Council, National Resource Management Ministerial Council Commonwealth of 458
Australia, Canberra. 459
28. Mainil J. 1999. Shiga/Verocytotoxins and Shiga/verotoxigenic Escherichia coli in 460
animals. Vet. Res. 30:235 - 257. 461
on Novem
ber 15, 2018 by guesthttp://aem
.asm.org/
Dow
nloaded from

20
29. Lukjancenko O, Wassenaar TM, Ussery DW. 2010. Comparison of 61 Sequenced 462
Escherichia coli Genomes. Microbial. Ecol. 60:708 - 720. 463
30. Rompré A, Servais P, Baudart J, De-Roubin MR, Laurent P. 2002. Detection and 464
enumeration of coliforms in drinking water: current methods and emerging 465
approaches. J. Microbiol. Meth. 49:31-54. 466
31. Ahmed W, Hodgers L, Sidhu JPS, Toze S. 2012. Fecal indicators and zoonotic 467
pathogens in household drinking taps fed from rainwater tanks in Southeast 468
Queensland, Australia. Appl. Environ. Microb. 78:219- 226. 469
32. Albrechtsen HJ. 2002. Microbiological investigations of rainwater and graywater 470
collected for toilet flushing. Wa. Sci. Technol. 46:311-316. 471
33. Tobias J, Vutukuru SR. 2012. Simple and rapid multiplex PCR for identification of 472
the main human diarrheagenic Escherichia coli. Microbiol. Res. 167:564-570. 473
34. Ahmed W, Hodgers L, Masters N, Sidhu JPS, Katouli M, Toze S. 2011. 474
Occurrence of intestinal and extraintestinal virulence genes in Escherichia coli 475
isolates from rainwater tanks in Southeast Queensland, Australia. Appl. Environ. 476
Microb. 77:7394 – 7400. 477
35. Ahmed W, Sidhu JPS, Toze S. 2012. An attempt to identify the likely sources of 478
Escherichia coli harbouring toxin genes in rainwater tanks. Environ. Sci. Technol. 479
46:5193 - 5197. 480
36. Ishii N, Nakahigashi K, Baba T, Robert M, Soga T, Kanai A, Tomita M. 2007. 481
Multiple high-throughput analyses monitor the response of E. coli to perturbations. 482
Science 316:593-597. 483
37. Worm J, Van Hattum T. 2006. Rainwater harvesting for domestic use. Agromisa 484
Foundation, Digigrafi, Wageningen, Netherlands. 485
on Novem
ber 15, 2018 by guesthttp://aem
.asm.org/
Dow
nloaded from

21
38. Kaushik R, Balasubramanian R, De La Cruz AA. 2012. Influence of air quality on 486
the composition of microbial pathogens in fresh rainwater. Appl. Environ. Microb. 487
78:2813–2818. 488
39. Caprioli A, Morabito S, Brugere H, Oswald E. 2005. Enterohaemorrhagic 489
Escherichia coli: emerging issues on virulence and modes of transmission. Vet. Res. 490
36: 289-311. 491
40. Sidhu JPS, Ahmed W, Gernjak W, Aryal R, McGarthy D, Palmer A, Kolotelo P, 492
Toze S. 2013. Sewage pollution in urban stormwater runoff as evident from the 493
widespread presence of multiple microbial and chemical source tracking markers. Sci. 494
Total Environ. 463: 488-496. 495
41. Nevondo TS, Cloete, TE. 1999. Bacterial and chemical quality of water supply in the 496
Dertig village settlement. Water SA 25:215-220. 497
42. Dobrowsky PH, Mannel D, de Kwaadsteniet M, Prozesky H, Khan W, Cloete 498
TE. 2013. Microbial and chemical quality assessment and perception and primary 499
uses of domestic harvested rainwater in Kleinmond, South Africa. Water SA 500
(Submitted). 501
43. Mannel D, Prozesky H. 2012. Domestic rainwater harvesting: Survey of perceptions 502
of users in Kleinmond. The Water Research Commission (WRC), Pretoria, South 503
Africa. (Project number: K5_2124_3). 504
505
506
507
508
509
510
on Novem
ber 15, 2018 by guesthttp://aem
.asm.org/
Dow
nloaded from

22
List of Figures and Tables: 511
512
FIG 1 An unrooted phylogenetic tree of organisms isolated during sampling three. The tree of 513
isolates was constructed using the neighbor-joining algorithm of ClustalX. Bootstrap values 514
are shown at the nodes with the accession numbers indicated after the strain name. 515
516
TABLE 1 Primer sequences used in this study for the identification and detection of E. coli 517
(24). 518
519
TABLE 2 PCR condition and reagents used to detect pathogenic E. coli in DNA extracted 520
from water samples (23) 521
522
TABLE 3 The presence of Escherichia coli harbouring toxin genes in rainwater samples 523
524
525
on Novem
ber 15, 2018 by guesthttp://aem
.asm.org/
Dow
nloaded from
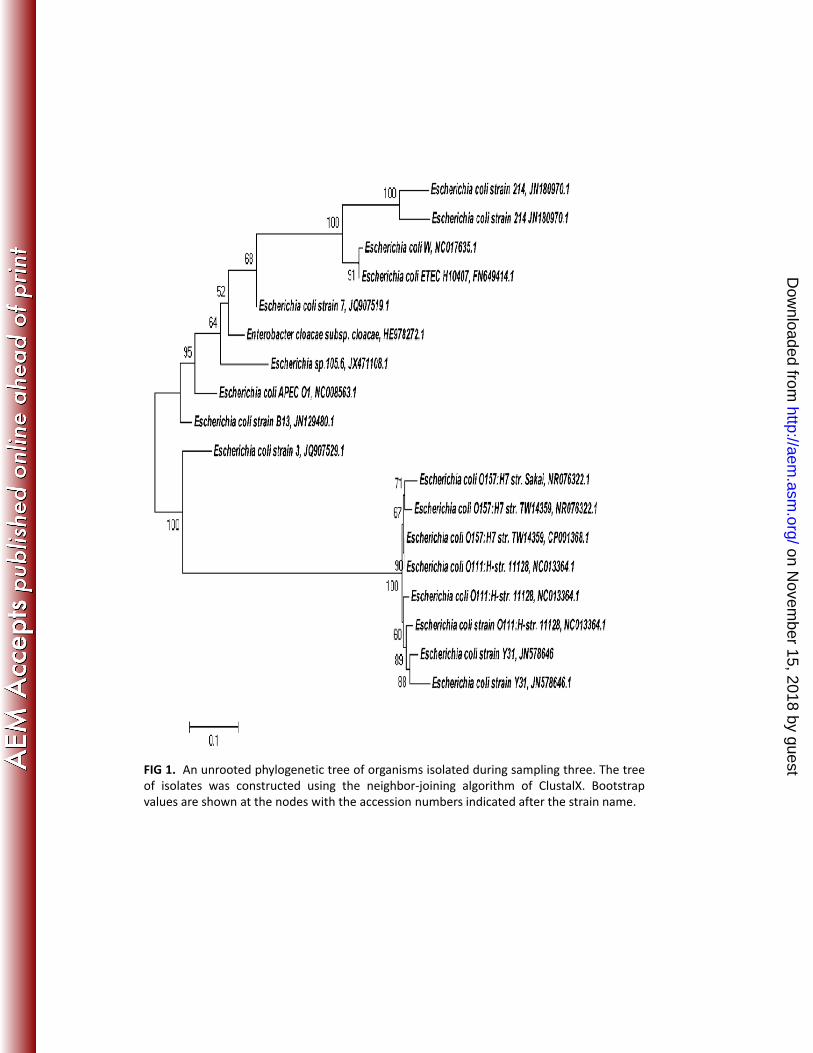
FIG 1. An unrooted phylogenetic tree of organisms isolated during sampling three. The treeof isolates was constructed using the neighbor-joining algorithm of ClustalX. Bootstrapvalues are shown at the nodes with the accession numbers indicated after the strain name.
on Novem
ber 15, 2018 by guesthttp://aem
.asm.org/
Dow
nloaded from

TABLE 1 Primer sequences used in this study for the identification and detection of E. coli
(24)
Bacteria Primer set 5’-3’
Primer
Name
Target
gene
Product
size
EAEC
GTATACACAAAAGAAGGAAGC
ACAGAATCGTCAGCATCAGC
AggRKs1
AggRkas2
aggR 254 bp
EHEC
GAGCGAAATAATTTATATGTG
TGATGATGGCAATTCAGTAT
VTcomU
Vtcomd
stx
518 bp
EPEC
CCCGAATTCGGCACAAGCATAAGC
CCCGGATCCGTCTCGCCAGTATTCG
SK1
SK2
eae 881 bp
EIEC
GTTCCTTGACCGCCTTTCCGATACCGTC
GCCGGTCAGCCACCCTCTGAGAGTAC
Ipa
IpaV
ipaH 619 bp
on Novem
ber 15, 2018 by guesthttp://aem
.asm.org/
Dow
nloaded from

TABLE 2 PCR condition and reagents used to detect pathogenic E. coli in DNA extracted
from water samples (23)
PCR Reagent
EAEC
(µl)
EHEC
(µl)
EPEC
(µl)
EIEC
(µl)
Final
concentration
PCR conditions
Buffer (5X) 12 12 12 12 1X
Stage 1: Initial
denaturing at 95°C
for 2 min
Stage 2: Denaturing
at 95°C for 1 min,
primer annealing at
54°C for 1 min and
elongation at 72°C
for 1 min
Stage 3: Final
elongation step at
72°C for 10 min.
MgCl2 (25 mM) 6 6 6 6 2.5 mM
AggRKs1 (10 µM)
AggRkas2(10 µM)
1
1
0.16 µM
VTcomU (10 µM)
Vtcomd (10 µM)
1.5
1.5
0.25 µM
SK1 (10 µM)
SK2 (10 µM)
0.75
0.75
0.125 µM
Ipa (10 µM)
IpaV (10 µM)
0.6
0.6 0.1 µM
dNTP (10 mM) 1.2 1.2 1.2 1.2 0.2 mM
GoTaq Polymerase
(5 U/µl)
0.5 0.5 0.5 0.5 2.5 U
Template DNA 5 5 5 5 5
dH2O 33.3 32.3 33.8 34.1
Final volume 60 60 60 60 60
on Novem
ber 15, 2018 by guesthttp://aem
.asm.org/
Dow
nloaded from

TABLE 3 The presence of Escherichia coli harbouring toxin genes in rainwater samples
Sampling
number
Percentage rainwater tanks
contaminated with E. coli toxin
genes
*EPEC
eae
*EIEC
ipaH
*EHEC
stx
*EAEC
aggR
4 10% ND ND ND 9
6 20% 5 ND ND 4
7 50% ND ND ND 2, 6, 8,
7, 10
8 90% 1 ND 9, 10 1, 2, 3,
5, 6, 10
ND-Not detected
* Indicates tanks where genes were isolated.
on Novem
ber 15, 2018 by guesthttp://aem
.asm.org/
Dow
nloaded from