primary and secondary aerosols in beijing in winter ... · y. sun et al.: primary and secondary...
TRANSCRIPT

Atmos. Chem. Phys., 16, 8309–8329, 2016www.atmos-chem-phys.net/16/8309/2016/doi:10.5194/acp-16-8309-2016© Author(s) 2016. CC Attribution 3.0 License.
Primary and secondary aerosols in Beijing in winter: sources,variations and processesYele Sun1,2, Wei Du1,3, Pingqing Fu1, Qingqing Wang1, Jie Li1, Xinlei Ge4, Qi Zhang5, Chunmao Zhu6,7, Lujie Ren1,Weiqi Xu1,3, Jian Zhao1,3, Tingting Han1,3, Douglas R. Worsnop8, and Zifa Wang1
1State Key Laboratory of Atmospheric Boundary Layer Physics and Atmospheric Chemistry,Institute of Atmospheric Physics, Chinese Academy of Sciences, Beijing 100029, China2Center for Excellence in Urban Atmospheric Environment, Institute of Urban Environment,Chinese Academy of Sciences, Xiamen 361021, China3College of Earth Sciences, University of Chinese Academy of Sciences, Beijing 100049, China4School of Environmental Science and Engineering, Nanjing University of InformationScience & Technology, Nanjing 210044, China5Department of Environmental Toxicology, University of California, 1 Shields Ave., Davis, CA 95616, USA6Institute of Low Temperature Science, Hokkaido University, Sapporo 060-0819, Japan7CMA Key Laboratory of Aerosol-Cloud-Precipitation, Nanjing University of InformationScience and Technology, Nanjing 210044, China8Aerodyne Research, Inc., Billerica, MA 01821, USA
Correspondence to: Yele Sun ([email protected])
Received: 23 March 2016 – Published in Atmos. Chem. Phys. Discuss.: 29 March 2016Revised: 23 June 2016 – Accepted: 23 June 2016 – Published: 11 July 2016
Abstract. Winter has the worst air pollution of the yearin the megacity of Beijing. Despite extensive winter stud-ies in recent years, our knowledge of the sources, forma-tion mechanisms and evolution of aerosol particles is notcomplete. Here we have a comprehensive characterization ofthe sources, variations and processes of submicron aerosolsthat were measured by an Aerodyne high-resolution aerosolmass spectrometer from 17 December 2013 to 17 January2014 along with offline filter analysis by gas chromatogra-phy/mass spectrometry. Our results suggest that submicronaerosols composition was generally similar across the win-ter of different years and was mainly composed of organ-ics (60 %), sulfate (15 %) and nitrate (11 %). Positive ma-trix factorization of high- and unit-mass resolution spectraidentified four primary organic aerosol (POA) factors fromtraffic, cooking, biomass burning (BBOA) and coal combus-tion (CCOA) emissions as well as two secondary OA (SOA)factors. POA dominated OA, on average accounting for56 %, with CCOA being the largest contributor (20 %). BothCCOA and BBOA showed distinct polycyclic aromatic hy-drocarbons (PAHs) spectral signatures, indicating that PAHs
in winter were mainly from coal combustion (66 %) andbiomass burning emissions (18 %). BBOA was highly cor-related with levoglucosan, a tracer compound for biomassburning (r2
= 0.93), and made a considerable contribution toOA in winter (9 %). An aqueous-phase-processed SOA (aq-OOA) that was strongly correlated with particle liquid watercontent, sulfate and S-containing ions (e.g. CH2SO+2 ) wasidentified. On average aq-OOA contributed 12 % to the totalOA and played a dominant role in increasing oxidation de-grees of OA at high RH levels (> 50 %). Our results illustratethat aqueous-phase processing can enhance SOA productionand oxidation states of OA as well in winter. Further episodeanalyses highlighted the significant impacts of meteorologi-cal parameters on aerosol composition, size distributions, ox-idation states of OA and evolutionary processes of secondaryaerosols.
Published by Copernicus Publications on behalf of the European Geosciences Union.

8310 Y. Sun et al.: Primary and secondary aerosols in Beijing in winter
1 Introduction
Air pollution caused by high concentration of fine parti-cles (PM2.5, particles with aerodynamic diameter less than2.5 µg m−3) is of great concern in densely populated megac-ities due to its harmful effects to public health (Cao etal., 2012; Madaniyazi et al., 2015). Although the annualaverage concentration of PM2.5 in Beijing decreased from89.5 µg m−3 in 2013 to 80.6 µg m−3 in 2015, it is still farabove the Chinese National Ambient Air Quality Standard(CNAAQS, 35 µg m−3 as an annual average). Mitigating airpollution in Beijing remains a great challenge (Zhang et al.,2012, 2016), not only because of its complex sources andprocesses, for instance local emissions vs. regional transportand primary emissions vs. secondary formation, but also dueto the complex interactions between meteorology and atmo-spheric aerosols (Ding et al., 2013, 2016; Petäjä et al., 2016).Therefore, an understanding of the sources and processes ofatmospheric aerosols in the megacity of Beijing is importantfor providing mitigation strategies related to air quality tothe northern pan-Eurasian and Chinese societies, and it alsocontributes to the Earth system science and climate policy(Kulmala et al., 2015).
Extensive studies on the basis of various offline and onlinetechniques have been conducted in Beijing in recent years toinvestigate the concentrations and sources of fine particles.The results show consistently higher PM levels in winter thanin other seasons, mainly due to coal combustion emissions inthe heating season (Sun et al., 2013b; Zhang et al., 2013;Sun et al., 2014; Liang et al., 2015; Liu et al., 2015). Recep-tor model analyses, e.g. positive matrix factorization (PMF)and chemical mass balance (CMB) further confirmed the im-portance of coal combustion emissions in particulate matter(PM) pollution in winter (Zheng et al., 2005; Zhang et al.,2013). For example, coal combustion aerosol was found tobe one of the most important primary components, on aver-age contributing 20–33 % of the total organic aerosol (OA)mass in winter (Sun et al., 2013b, 2014; Wang et al., 2015;Hu et al., 2016). However, the contributions of traffic emis-sions are highly uncertain. For instance, Zhang et al. (2013)reported a contribution of 4 % for traffic emissions, whereasTian et al. (2016) showed a much higher contribution (19 %)in Beijing. The reasons for such differences are not clear yet.More recently, many studies highlight the importance of sec-ondary aerosols in the formation of severe haze episodes inmegacities (Liu et al., 2013; X. J. Zhao et al., 2013; Huang etal., 2014; Sun et al., 2014; Yang et al., 2015). Because sec-ondary aerosols are mainly formed over regional scales, theirdominance in PM demonstrates the importance of regionaltransport in the formation of severe haze episodes in north-ern China (Sun et al., 2014; Z. Wang et al., 2014; Li et al.,2015; Zheng et al., 2015). Such conclusions are further sup-ported by the Asia-Pacific Economic Cooperation (APEC)studies when secondary aerosol species from regional trans-
port showed the largest reductions due to emission controlsin Beijing and surrounding regions (Sun et al., 2016).
The rapid changes in source and evolution of severe hazeepisodes have also been studied using various state-of-the-artonline instruments, particularly the Aerodyne aerosol massspectrometer (AMS), which is capable of quantifying size-resolved non-refractory submicron aerosol composition at ahigh time resolution (Canagaratna et al., 2007). The PMFanalysis of aerosol mass spectrometer (PMF-AMS) data il-lustrated the rapid variations of OA factors from differentsources and processes. Primary OA (POA), such as traffic-related hydrocarbon-like OA (HOA), cooking OA (COA),coal combustion OA (CCOA) and biomass burning OA(BBOA), generally showed strong diurnal variations influ-enced by local source emissions (Huang et al., 2010; J. Sunet al., 2010; Sun et al., 2012, 2013b; Zhang et al., 2014; Sunet al., 2015; Xu et al., 2015; Elser et al., 2016; Hu et al.,2016), whereas secondary organic aerosols (SOA) and sec-ondary inorganic aerosols (SIA) were found to accumulaterapidly within days and contribute most to the severe hazepollution (Sun et al., 2014; Zheng et al., 2015). Recent laband field studies also indicated that heterogeneous reactionsunder high RH and NOx levels might have played impor-tant roles in secondary aerosol formation and can increasethe PM levels substantially (He et al., 2014; Y. Wang et al.,2014; Quan et al., 2015; Xie et al., 2015).
Although submicron aerosol composition in Beijing hasbeen relatively well characterized using aerosol mass spec-trometry during the last decade (Huang et al., 2010; J. Sun etal., 2010; Sun et al., 2012, 2013b; Zhang et al., 2014; Sun etal., 2015; Xu et al., 2015; Elser et al., 2016; Hu et al., 2016),the contributions of primary sources to PM pollution and theevolutionary processes of SOA and its oxidation properties,particularly under high RH conditions, remain less under-stood. For example, BBOA was mixed within other primaryOA factors in previous winter PMF-ACSM analysis due tothe limited sensitivity of the ACSM (Sun et al., 2013b; Jianget al., 2015). The recent two HR-AMS studies also showedsubstantially different OA composition in different winters inBeijing (Elser et al., 2016; Hu et al., 2016). Elser et al. (2016)found that CCOA contributed approximately 50 % of the to-tal OA mass in PM2.5, whereas Hu et al. (2016) reportedan average contribution of 24 % to OA in PM1. The reasonsfor such differences are not clear yet, although the differentsized cut-offs might be one of them. In addition, the aqueous-phase processing of OA at low temperatures in winter re-mains uncertain. While it has been suggested to be an im-portant formation pathway of SOA (Ge et al., 2012b; Lin etal., 2014), Sun et al. (2013a) found that aqueous-phase pro-cessing appeared not to significantly enhance SOA and oxi-dation degree of OA in winter in Beijing. Most importantly,source emissions in northern China are undergoing signifi-cant changes since the implementation of the AtmosphericPollution Prevention and Control Action Plan on 10 Septem-ber 2013. As a response, the sources and processes of at-
Atmos. Chem. Phys., 16, 8309–8329, 2016 www.atmos-chem-phys.net/16/8309/2016/

Y. Sun et al.: Primary and secondary aerosols in Beijing in winter 8311
mospheric aerosols might have significant changes and varysubstantially in different years. Thus, continuous characteri-zation of aerosol particles in different years in Beijing is ofimportance for future validation of the response of aerosolchemistry-to-emission controls.
In this study, an Aerodyne high-resolution time-of-flightAMS (AMS hereafter) along with various collocated on-line instruments were deployed at an urban site in Beijingfor real-time characterization of the sources and processesof aerosol particles during winter 2013–2014. Three-hourfilter samples were also collected and analysed for molec-ular markers with gas chromatography/mass spectrometry(GC/MS). The aerosol composition, size distributions and di-urnal variations are comprehensively investigated and alsocompared with the results in previous studies. The sourcesof OA are investigated by PMF-AMS analysis of both highmass resolution (HMR) and unit mass resolution (UMR)spectra, together with molecular marker analysis. The evolu-tion processes of OA, particularly aqueous-phase processingof SOA and its oxidation degrees, are elucidated, and the im-pacts of meteorological parameters on severe haze formationare demonstrated.
2 Experimental methods
2.1 Sampling site and instrumentation
The AMS was deployed at an urban site in Beijing, i.e. In-stitute of Atmospheric Physics (IAP), Chinese Academy ofSciences, which was described in detail in Sun et al. (2012)from 17 December 2013 to 17 January 2014. The samplingsite is subject to multiple local influences, including cook-ing emissions from nearby restaurants, traffic emissions fromtraffic, roads and Jingzang highway and sporadic coal com-bustion emissions from residential heating. During this studyperiod, ambient aerosol particles were first drawn inside thesampling room at a flow of 10 L min−1, of which ∼ 0.1 wasisokinetically sampled into the AMS. The AMS was thenoperated by alternating the mass-sensitive V-mode and thehigh mass resolution W-mode every 2 min. The AMS wascalibrated for ionization efficiency with 350 nm (Dm) ammo-nium nitrate particles following the standard protocols (Jayneet al., 2000; Jimenez et al., 2003), and the relative ionizationefficiency (RIE) of ammonium (= 5.0) was also determined.
The gaseous species were measured by a range of gasanalysers (Thermo Scientific), including CO (model 48i),NO/NOy (model 42i), O3 (model 49i) and SO2 (model 43i),and the meteorological parameters (winds, temperature andrelative humidity) were obtained from the Beijing 325 m me-teorological tower nearby. All the data in this study are re-ported at ambient temperature and pressure conditions inBeijing Time (BT), which equals Coordinated UniversalTime (UTC) plus 8 h.
Three-hour PM1.0 samples were collected using an airsampler (Zambelli, Italy) at a flow rate of 38.3 L min−1
with quartz filters (47 mm diameter, Pallflex), which wereprecombusted at 450 ◦C for 6 h over 6–9 January 2014.Field blanks were collected by placing filters onto the filterholder for a few minutes without pumping before and afterthe campaign. After sampling, each aerosol or blank filterwas wrapped individually with aluminum foil and stored at−18 ◦C in darkness prior to analysis.
2.2 Chemical analysis
Aliquots of filter quartz samples were first extracted withdichloromethane/methanol (2 : 1; v/v), and then concen-trated by a rotary evaporator under vacuum after filtra-tion. After dryness with pure nitrogen gas, the extractswere reacted with N,O-bis-(trimethylsilyl)trifluoroacetamideto form derivatives for subsequent GC/MS analysis. In thisstudy, 24 molecular compounds were quantified, includingsugar compounds (levoglucosan, galactosan, mannosan), 4-hydroxybenzoic acid, vanillin, 2-methyltetrols etc. A moredetailed filter pretreatment and GS/MS analysis is given inFu et al. (2008).
2.3 AMS data analysis
The AMS data were analysed for the mass concentrationsand size distributions of non-refractory submicron aerosol(NR-PM1) species using high-resolution data analysis soft-ware package PIKA (Sueper, 2014). A collection efficiency(CE) of 0.5 was applied to the entire data set to compensatefor the incomplete detection of the AMS because (1) aerosolparticles were dried by a silica gel dryer, (2) aerosol particleswere slightly acidic (Fig. S1 in the Supplement), yet not highenough to affect CE substantially, and (3) the mass fraction ofNH4NO3 was smaller than 0.4 for the entire study (Matthewet al., 2008; Middlebrook et al., 2012). Elemental analysis(EA) was performed on high-resolution mass spectra of OAusing the software APES (Aiken et al., 2008). The elemen-tal ratios, including oxygen-to-carbon (O / C), hydrogen-to-carbon (H / C), nitrogen-to-carbon (N / C) and organic-mass to organic carbon (OM / OC) ratios, were determinedwith the Aiken-Ambient (A-A) (Aiken et al., 2008) methodand the recently updated parameterization named Improved-Ambient (I-A) (Canagaratna et al., 2015). As shown inFig. S2, the O / C and H / C ratios are on average 28 and11 % higher than those derived from the A-A method. Theelemental ratios reported in this study are obtained from theI-A method unless otherwise stated.
Positive matrix factorization (Paatero and Tapper, 1994)was performed on high resolution mass spectra of V-modeand W-mode to retrieve potential OA factors from differ-ent sources. Because of the limited mass resolution of AMS,PMF analysis was limited to m/z 150. It should be noted that,for m/z 120–150, only major fragment ions were included in
www.atmos-chem-phys.net/16/8309/2016/ Atmos. Chem. Phys., 16, 8309–8329, 2016

8312 Y. Sun et al.: Primary and secondary aerosols in Beijing in winter
the PMF analysis. The data and error matrices were treatedaccording to the procedures detailed in DeCarlo et al. (2010).The PMF solution was then evaluated using a PMF Evalua-tion Toolkit written in Igor Pro (Ulbrich et al., 2009) follow-ing the procedures described in Zhang et al. (2011). After acareful evaluation of the PMF results, we found that the sixfactor solution at fpeak = 0 can be well interpreted. The sixfactors are four POA factors, including HOA, COA, BBOAand CCOA, and two SOA factors, including an oxygenatedOA (OOA) and an aqueous-OOA (aq-OOA). As indicatedby the diagnostic plot in Fig. S3, the contributions of OA fac-tors were fairly stable across different fpeak values. Figure S4shows the correlations of six OA factors with other tracers.It is clear that each OA factor was correlated with specifictracers, for instance, HOA vs. NOx (r2
= 0.73), CCOA vs.PAHs (r2
= 0.92), COA vs. C6H10O+ (r2= 0.76), BBOA
vs. C2H4O+2 (r2= 0.65), OOA vs. CO+2 (r2
= 0.89) and aq-OOA vs. SIA (r2
= 0.92). We also compared the PMF resultsbetween V-mode and W-mode. As shown in Fig. S5, the timeseries of six OA factors were highly correlated between thetwo modes. In this study, we further performed PMF analysison UMR mass spectra of V-mode between m/z 12 and 350.Such an analysis can keep the most important PAHs informa-tion (Dzepina et al., 2007) for a better source apportionmentdespite several recent PMF-HMR analyses to m/z 200 (Huet al., 2013, 2016). The PMF-UMR solution was also evalu-ated in the same way as that of PMF-HMR. As indicated inFig. S6, the mass spectra of six OA factors from PMF-UMRwere similar to those from PMF-HMR (r2
= 0.86–0.98).
2.4 Liquid water content
Liquid water content associated with inorganic species waspredicted using a ISORROPIA-II model (Nenes et al., 1998;Fountoukis and Nenes, 2007) with AMS aerosol compositionand meteorological parameters (temperature and relative hu-midity) as input. The ISORROPIA-II model then calculatedthe composition and phase state of a K+–Ca2+–Mg2+–NH+4–Na+–SO2−
4 –NO−3 –Cl−–H2O in thermodynamic equilib-rium with gas-phase precursors.
3 Results and discussion
3.1 Mass concentrations and compositions
Figure 1 shows the time series of meteorological parame-ters, gaseous species and NR-PM1 aerosol species for theentire study period. The NR-PM1 species varied dramati-cally throughout the study. The average NR-PM1 mass con-centration was 64± 59 µg m−3, which is similar to that ob-served during winter 2011–2012 (Sun et al., 2013b), yet32 % lower than that measured during the severe pollutionmonth of January 2013 (Zhang et al., 2014). As shown inFig. 2b, the average NR-PM1 concentrations in Beijing var-
ied from 50 to 94 µg m−3 since 2006, and even remained atrelatively high levels in 2014 (51–67 µg m−3 ) after the re-lease of Atmospheric Pollution Prevention and Control Ac-tion Plan on 10 September 2013. The concentration levels ofPM are much higher than the annual CNAAQS of 35 µg m−3,indicating that the air pollution in Beijing is still severe dur-ing all seasons (Sun et al., 2015).
Organics constituted a major fraction of NR-PM1, on av-erage accounting for 60 % during this study. The dominanceof organics is generally consistent with previous winter stud-ies in Beijing, which showed that 50–60 % of NR-PM1 wereorganics (Sun et al., 2013b; Zhang et al., 2014; Sun et al.,2015; Zhang et al., 2015; Hu et al., 2016). The contributionof organics to NR-PM1 in winter was much higher than thatduring other seasons (∼ 30–40 %), which was primarily dueto substantial emissions from coal combustion (Sun et al.,2013b; Elser et al., 2016; Hu et al., 2016). This is furthersupported by a large enhancement of chloride contributionfrom ∼ 1 % in summer to 4–6 % in winter. Sulfate was thesecond largest component (15 %) and is comparable to ni-trate (11 %). SIA showed much lower contributions to NR-PM1 in winter compared to summer due to weaker photo-chemical processing associated with low O3 (5.6± 7.3 ppb).Aerosol composition of NR-PM1 varied substantially acrossthe entire study, yet appeared to be strongly affected by RH.While the entire study period was characterized by low RH(< 40 %, 77 % of the time), five episodes with RH > 40 %were also observed (E1–E5 in Fig. 1). The periods with highRH levels were clearly characterized by high contributionsof SIA, particularly sulfate. Indeed, the sulfate concentrationoften rapidly exceeded nitrate as the RH increased to above40 %, indicative of aqueous-phase production during winter-time (Sun et al., 2013a, 2014; Quan et al., 2015). As indi-cated in Fig. 3a, SO4/ NO3 ratios showed evident increasesas a function RH at high PM loading periods (> 30 µg m−3).As RH was > 40 %, the ratios of SO4/ NO3 exceeded 1 mostof the time, demonstrating a more important role for sulfatein SIA during high RH periods. As a comparison, nitratewas more significant at low RH levels (< 30 %). These re-sults elucidate different mechanisms in the formation of sul-fate and nitrate, which are mainly driven by aqueous-phaseand photochemical production, respectively, in winter. Con-sidering that aerosol particles were slightly acidic, as indi-cated by the average ratio (0.69) of measured NH+4 to pre-dicted NH+4 that requires to fully neutralize sulfate, nitrateand chloride (Zhang et al., 2007), sulfate in this study mainlyexisted in the form of (NH4)2SO4 and NH4HSO4. We alsonoticed higher SO4/ NO3 ratios during periods with loweraerosol loadings (< 30 µg m−3). One reason is that air masseswere dominantly from the north-north-west with much lowerNOx emissions compared to the megacities in eastern China(B. Zhao et al., 2013). In addition, the shorter lifetime of ni-trate compared to sulfate might also have played a role duringthe long-range transport from the north-north-west to Bei-
Atmos. Chem. Phys., 16, 8309–8329, 2016 www.atmos-chem-phys.net/16/8309/2016/

Y. Sun et al.: Primary and secondary aerosols in Beijing in winter 8313
Figure 1
302010
0O3
(pp
b)
12/16 12/20 12/24 12/28 1/1 1/5 1/9 1/13 1/17
Date & time
10080604020
0
Co
nc.
(µ
g m
-3)
360270180900
WD
( o)
1.00.80.60.40.20.0
Mas
s fra
c.
10080604020
0
RH
(%
) 1050
-5
T ( oC
)
201510
50W
S (
m s
-1)
400300200100
0NO
x (p
pb
) 86420
CO
(ppm
)806040200
SO
2 (ppb)
Org (/2)SO4NO3NH4Cl
8 m 320 m
8 m 320 m
E1 E2 E3 E4E5C1 C2M1 M2 M3 M4 M5
(a)
(f)
(e)
(d)
(c)
(b)
Figure 1. Time series of (a) relative humidity (RH) and temperature (T ), (b) wind speed (WS) and wind direction (WD), (c) O3 and SO2,(d) CO and NOx , (e) mass concentrations of NR-PM1 species and (f) mass fractions of NR-PM1 species for the entire study period. Inaddition, five episodes with relatively high RH levels (E1–E5), five episodes with moderately high RH levels (M1–M5), and two cleanperiods (C1, C2) are marked for further discussion.
Figure 2
(a)
(b)80
60
40
20
0
NR
-PM
1 (µ
g m
-3)
50
40
30
20
10
0
OA
(µg
m-3
)
0.5
0.4
0.3
0.2
0.1
0.0
O/C
Ratio
80
61 64
50
67
94
6451
67
2824
34.5
20
34
13
27
51
38
27 30
S, 200
6
S-F, 200
8
W, 201
0
S, 201
1
W, 201
1-201
2
S, 201
2
F, 201
2
W, 201
3
W, 201
3-201
4
W, 201
4
F, 201
4
OrgSO4
NO3
NH4
Chl
LV-OOA SV-OOA OOABBOA CCOA COA HOA
This study
Figure 2. Average chemical composition of (a) organic aerosols and(b) NR-PM1 in the megacity of Beijing measured by aerosol massspectrometers. Also shown in panel (a) is the oxygen-to-carbon(O / C) ratio of organic aerosol for each study. The O / C was cal-culated using the A-A method (Aiken et al., 2008). A more detaileddescription of the data is presented in Table S1.
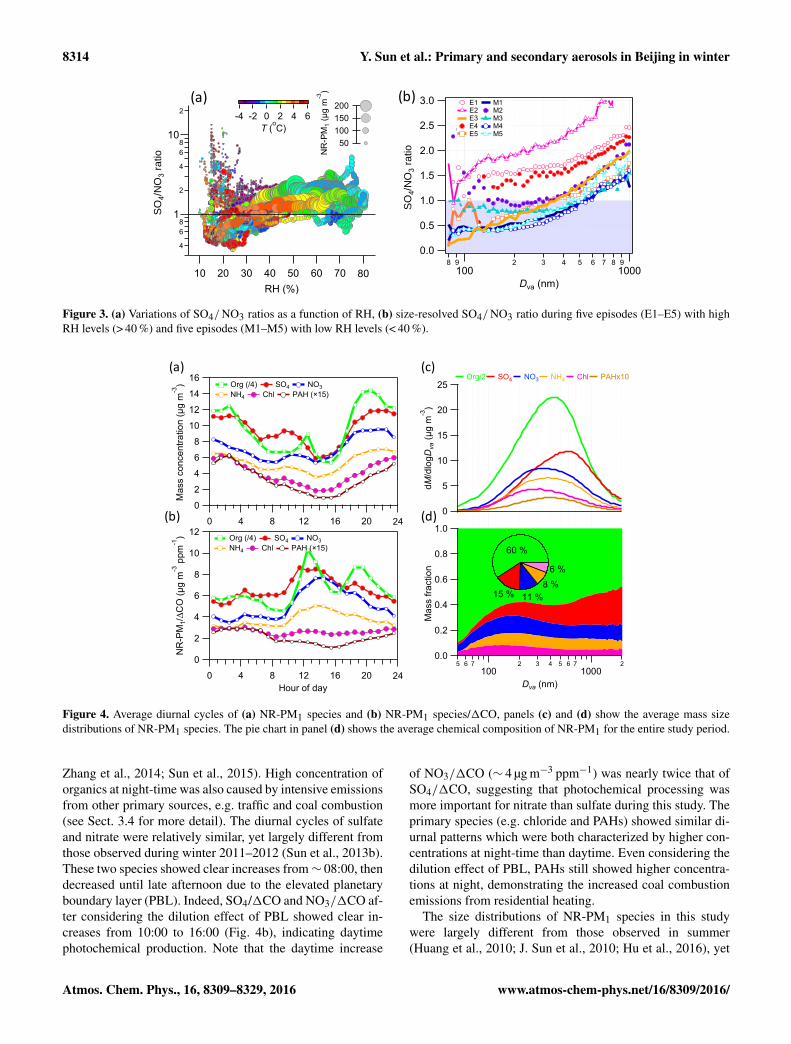
jing. Figure 3b shows the size dependence of SO4/ NO3 ra-tios during five episodes with high RH levels (> 40 %) andfive episodes with low RH levels (< 40 %). It is clear thatSO4/ NO3 ratios at high RH levels were consistently higherthan those at low RH levels across different size ranges, fur-ther supporting the importance of aqueous-phase processingin the formation of sulfate. Also, SO4/ NO3 ratios showedclear increases as a function of particle sizes, likely indicat-ing the different formation processes of sulfate and nitratein different size ranges. Considering that large accumulationmode particles are generally more aged than smaller particles(Zhang et al., 2005), results here might indicate that nitratemainly formed via photochemical production played a moreimportant role in SIA at smaller sizes, whereas sulfate thatformed over regional scales was more significant in accumu-lation mode particles.
3.2 Diurnal cycles and size distributions
The diurnal cycles varied differently among different NR-PM1 species. As shown in Fig. 4a, organics were charac-terized by two peaks occurring at noon and evening time.Such a diurnal pattern influenced by cooking emissions atmeal times has been observed during all seasons in Beijing(Huang et al., 2010; J. Sun et al., 2010; Sun et al., 2012;
www.atmos-chem-phys.net/16/8309/2016/ Atmos. Chem. Phys., 16, 8309–8329, 2016
8314 Y. Sun et al.: Primary and secondary aerosols in Beijing in winter
Figure 3
3.0
2.5
2.0
1.5
1.0
0.5
0.0
SO/N
O ra
tio4
3
8 9100
2 3 4 5 6 7 8 91000
Dva (nm)
E1 E2 E3 E4 E5
M1 M2 M3 M4 M5
4
68
1
2
4
68
10
2
SO/N
O ra
tio4
3
8070605040302010RH (%)
200150100
50
NR
-PM
1 (µg
m-3
)
6420-2-4T (oC)
(a) (b)
Figure 3. (a) Variations of SO4/ NO3 ratios as a function of RH, (b) size-resolved SO4/ NO3 ratio during five episodes (E1–E5) with highRH levels (> 40 %) and five episodes (M1–M5) with low RH levels (< 40 %).
Figure 4
12
10
8
6
4
2
0
NR
-PM
1/ΔC
O (µ
g m
-3 p
pm-1
)
24201612840Hour of day
Org (/4) SO4 NO3 NH4 Chl PAH (×15)
16
14
12
10
8
6
4
2
0
Mas
s co
ncen
tratio
n (µ
g m
)-3
24201612840
Org (/4) SO4 NO3 NH4 Chl PAH (×15)
5 6 7100
2 3 4 5 6 71000
2
Dva (nm)
25
20
15
10
5
0
dM/d
logD
va (µ
g m
-3)
1.0
0.8
0.6
0.4
0.2
0.0
Mas
s fra
ctio
n
60 %
15 % 11 % 8 %
6 %
Org/2 SO4 NO3 NH4 Chl PAHx10(a)
(b)
(c)
(d)
Figure 4. Average diurnal cycles of (a) NR-PM1 species and (b) NR-PM1 species/1CO, panels (c) and (d) show the average mass sizedistributions of NR-PM1 species. The pie chart in panel (d) shows the average chemical composition of NR-PM1 for the entire study period.
Zhang et al., 2014; Sun et al., 2015). High concentration oforganics at night-time was also caused by intensive emissionsfrom other primary sources, e.g. traffic and coal combustion(see Sect. 3.4 for more detail). The diurnal cycles of sulfateand nitrate were relatively similar, yet largely different fromthose observed during winter 2011–2012 (Sun et al., 2013b).These two species showed clear increases from∼ 08:00, thendecreased until late afternoon due to the elevated planetaryboundary layer (PBL). Indeed, SO4/1CO and NO3/1CO af-ter considering the dilution effect of PBL showed clear in-creases from 10:00 to 16:00 (Fig. 4b), indicating daytimephotochemical production. Note that the daytime increase
of NO3/1CO (∼ 4 µg m−3 ppm−1) was nearly twice that ofSO4/1CO, suggesting that photochemical processing wasmore important for nitrate than sulfate during this study. Theprimary species (e.g. chloride and PAHs) showed similar di-urnal patterns which were both characterized by higher con-centrations at night-time than daytime. Even considering thedilution effect of PBL, PAHs still showed higher concentra-tions at night, demonstrating the increased coal combustionemissions from residential heating.
The size distributions of NR-PM1 species in this studywere largely different from those observed in summer(Huang et al., 2010; J. Sun et al., 2010; Hu et al., 2016), yet
Atmos. Chem. Phys., 16, 8309–8329, 2016 www.atmos-chem-phys.net/16/8309/2016/
Y. Sun et al.: Primary and secondary aerosols in Beijing in winter 8315
Figure 5
2.0
1.8
1.6
1.4
1.2
1.0
H/C
0.80.60.40.20.0O/C
OS=-1
OS=0
Slope=-2+ketone/aldehyde
Slope=0+alcohol/peroxide
Slope=-1+carboxylic
acid
Slope = -0.42Slope = -0.70
6050403020
RH
(%)
0.6
0.5
0.4
0.3
0.2
0.1
0.0
O/C
24201612840Hour of day
2.0
1.9
1.8
1.7
1.6
H/C
O/C O/C, w/t COA H/C H/C, w/t COA
200
150
100
50
0
Org (µg m
-3)
12/18 12/22 12/26 12/30 1/3 1/7 1/11 1/15
2.01.91.81.71.61.5
H/C
80
60
40
20R
H (%
)
0.8
0.6
0.4
0.2
0.0
O/C
(a)
(b)
(c) (d)
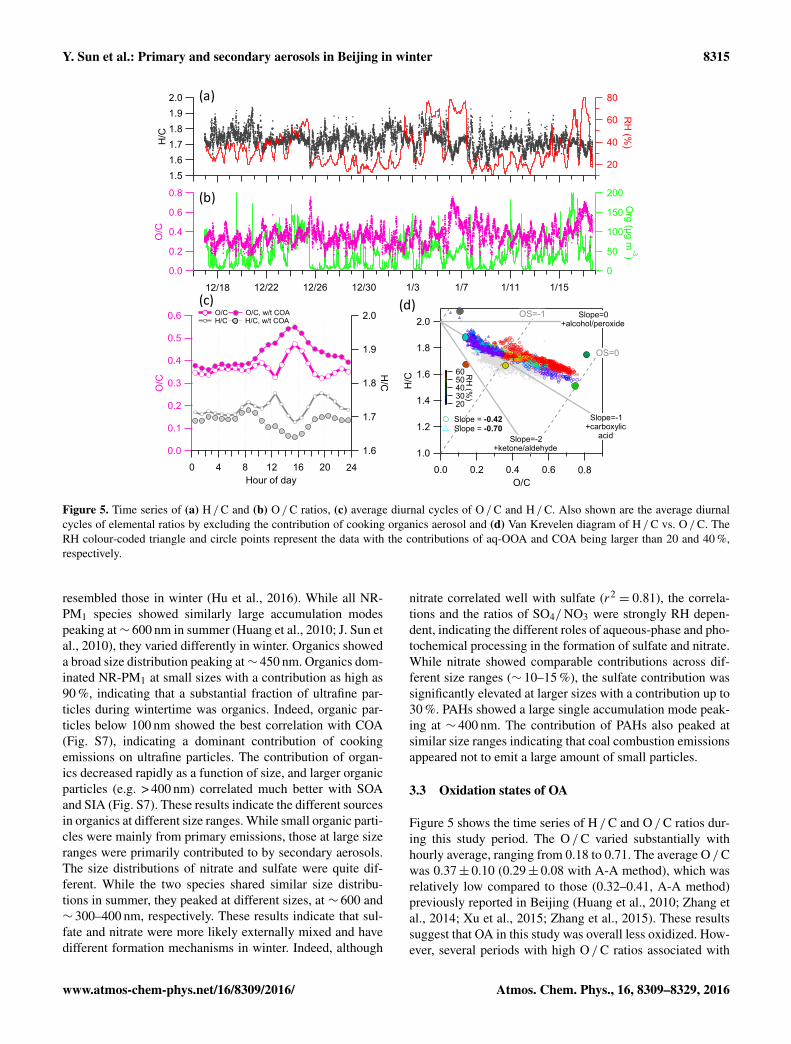
Figure 5. Time series of (a) H / C and (b) O / C ratios, (c) average diurnal cycles of O / C and H / C. Also shown are the average diurnalcycles of elemental ratios by excluding the contribution of cooking organics aerosol and (d) Van Krevelen diagram of H / C vs. O / C. TheRH colour-coded triangle and circle points represent the data with the contributions of aq-OOA and COA being larger than 20 and 40 %,respectively.
resembled those in winter (Hu et al., 2016). While all NR-PM1 species showed similarly large accumulation modespeaking at∼ 600 nm in summer (Huang et al., 2010; J. Sun etal., 2010), they varied differently in winter. Organics showeda broad size distribution peaking at∼ 450 nm. Organics dom-inated NR-PM1 at small sizes with a contribution as high as90 %, indicating that a substantial fraction of ultrafine par-ticles during wintertime was organics. Indeed, organic par-ticles below 100 nm showed the best correlation with COA(Fig. S7), indicating a dominant contribution of cookingemissions on ultrafine particles. The contribution of organ-ics decreased rapidly as a function of size, and larger organicparticles (e.g. > 400 nm) correlated much better with SOAand SIA (Fig. S7). These results indicate the different sourcesin organics at different size ranges. While small organic parti-cles were mainly from primary emissions, those at large sizeranges were primarily contributed to by secondary aerosols.The size distributions of nitrate and sulfate were quite dif-ferent. While the two species shared similar size distribu-tions in summer, they peaked at different sizes, at ∼ 600 and∼ 300–400 nm, respectively. These results indicate that sul-fate and nitrate were more likely externally mixed and havedifferent formation mechanisms in winter. Indeed, although
nitrate correlated well with sulfate (r2= 0.81), the correla-
tions and the ratios of SO4/ NO3 were strongly RH depen-dent, indicating the different roles of aqueous-phase and pho-tochemical processing in the formation of sulfate and nitrate.While nitrate showed comparable contributions across dif-ferent size ranges (∼ 10–15 %), the sulfate contribution wassignificantly elevated at larger sizes with a contribution up to30 %. PAHs showed a large single accumulation mode peak-ing at ∼ 400 nm. The contribution of PAHs also peaked atsimilar size ranges indicating that coal combustion emissionsappeared not to emit a large amount of small particles.
3.3 Oxidation states of OA
Figure 5 shows the time series of H / C and O / C ratios dur-ing this study period. The O / C varied substantially withhourly average, ranging from 0.18 to 0.71. The average O / Cwas 0.37± 0.10 (0.29± 0.08 with A-A method), which wasrelatively low compared to those (0.32–0.41, A-A method)previously reported in Beijing (Huang et al., 2010; Zhang etal., 2014; Xu et al., 2015; Zhang et al., 2015). These resultssuggest that OA in this study was overall less oxidized. How-ever, several periods with high O / C ratios associated with
www.atmos-chem-phys.net/16/8309/2016/ Atmos. Chem. Phys., 16, 8309–8329, 2016

8316 Y. Sun et al.: Primary and secondary aerosols in Beijing in winter
Figure 6
1.0
0.8
0.6
0.4
0.2
0.0
Frac
tion
of O
A
8070605040302010RH (%)
SOA POA aq-OOA0.8
0.6
0.4
0.2
0.0
O/C
8070605040302010RH (%)
120
100
80
60
40
20
0
OA
(µg m-3)
O/C O/Cw/t COA OA
(a) (b)
Figure 6. Variations of (a) O / C and OA, (b) mass fractions of POA, SOA and aq-OOA as a function of RH. The data points are grouped inRH bins (5 % increment).
high RH, e.g. 6 and 17 January, were also observed, indi-cating very different oxidation degrees of OA. The OM / OCratio was highly correlated with O / C (r2
= 0.998), with anaverage value of 1.64± 0.13 (1.53± 0.11 with A-A method).The OM / OC ratio is similar to the one suggested for the ur-ban sites (Turpin and Lim, 2001). The O / C ratio showed apronounced diurnal cycle with higher values during the day-time. Similar O / C diurnal cycles have been widely observedin various seasons in Beijing (Zhang et al., 2014, 2015; Huet al., 2016). However, the daytime increase of O / C was in-terrupted by a clear decrease at noon due to the influencesof cooking emissions. In fact, the average O / C ratio exclud-ing the COA contribution showed a continuous increase from0.38 at 08:00 to 0.55 at 16:00, and the H / C ratio showeda corresponding decrease from 1.72 to 1.64. Such a diurnalcycle demonstrated the photochemical processing in the day-time. The Van Krevelen plot showed that the relationship be-tween H / C and O / C appeared to be quite different at dif-ferent levels of oxidation. For example, the slope of H / Cvs. O / C was −0.70 during the period with the COA contri-bution larger than 40 %, which is much steeper than −0.42during the period with high aq-OOA (> 20 %). These resultsindicated the different evolutionary mechanisms between pri-mary OA and highly oxidized OA (Chen et al., 2015).
Figure 6a shows the variations of O / C as a function ofRH. The O / C first showed a slight decrease at RH < 50 %,then had a rapid increase until RH= 80 %. The O / C ratioby excluding the influences of COA showed similar RH de-pendence. Higher O / C ratios at higher RH levels are likelyto indicate the aqueous-phase processing in the formation ofhighly oxidized organic aerosols. By investigating the OAcomposition change as a function of RH, we found that thePOA contribution decreased from ∼ 60 to 25 % as the RHincreased from 40 to 80 %; correspondingly, the SOA con-tribution increased from 40 to 70 %, and in particular aq-OOA increased from 10 to 40 %. As a result, the increaseof O / C ratio at high RH levels was mainly caused by theincrease of aq-OOA. As discussed in Sect. 3.4.5, aq-OOAin this study is likely to be an oxidized aqueous-phase pro-
cessed OA. These results suggest that aqueous-phase pro-cessing can form highly oxidized SOA and also enhance ox-idation degree of OA in winter (Ge et al., 2012b). This con-clusion appeared to be different from a previous winter studyin which f44 (fraction of m/z 44 in OA), a surrogate of O / C,was relatively constant at high RH levels (Sun et al., 2013a).We noticed that the variations of mass concentrations of OAfactors as a function of RH between the two studies. For ex-ample, most OA factors showed almost linear increases atlow RH levels, reaching maxima at ∼ 50 %, then decreasingrapidly between 50 and 80 % (Fig. S8). The aq-OOA con-centration was low at RH < 40 %, showed a large increasebetween 40 and 60 %, then remained relatively constant athigh RH levels. Such a RH dependence of OA compositionwas significantly different from that observed during winter2011–2012 when all OA factors remained at high concentra-tions at high RH levels (Sun et al., 2013a). Our results sug-gest that the OA sources and evolution processes at high RHlevels might vary significantly in different years.
3.4 Sources and variations of OA
Compared to our previous ACSM study during winter 2011–2012 (Sun et al., 2013b), PMF-HMR and PMF-UMR wereable to identify six OA factors, including four POA fac-tors (HOA, COA, BBOA and CCOA) and two SOA factors(OOA and aq-OOA). Although similar PMF resolution wasobtained in winter 2010 and 2014 (Elser et al., 2016; Hu etal., 2016), we found that OA sources, variations and pro-cesses can vary substantially in different years.
3.4.1 Hydrocarbon-like OA
The HOA spectrum was characterized by typical hydrocar-bon ion series of CnH+2n+1 and CnH+2n+1 (Fig. 7a), which issimilar to those observed at various urban sites (Ng et al.,2011) and from diesel exhausts (Canagaratna et al., 2004).Consistently, HOA was highly correlated with CnH+2n+1ions, e.g. C3H+7 , C4H+9 , C5H+11, C6H+13, C7H+15 and C8H+17(r2 > 0.80, Fig. 8). The O / C of HOA is 0.11, which is lower
Atmos. Chem. Phys., 16, 8309–8329, 2016 www.atmos-chem-phys.net/16/8309/2016/

Y. Sun et al.: Primary and secondary aerosols in Beijing in winter 8317
Figure 7
12
8
4
0120110100908070605040302010
m/z (amu)
12840
6420
6420
86420
1086420
(f) aq-OOA O/C = 0.81, H/C = 1.75, N/C = 0.045, OM/OC = 2.22
(e) OOA O/C = 0.75, H/C = 1.51, N/C = 0.016, OM/OC = 2.13
(d) CCOA O/C = 0.14, H/C = 1.67, N/C = 0.008, OM/OC = 1.35
(c) BBOA O/C = 0.36, H/C = 1.67, N/C = 0.042, OM/OC = 1.63
(b) COA O/C = 0.14, H/C = 1.88, N/C = 0.004, OM/OC = 1.35
(a) HOA O/C = 0.11, H/C = 2.08, N/C = 0.022, OM/OC = 1.31
% o
f tot
al s
igna
l
CxHy CxHyO1 CxHyO2 HyO1 CxHyNp CxHyOzNp
0.080.060.040.020.00
350330310290270250230210190170150130
m/z (amu)
0.2
0.1
0.0
0.80.60.40.20.0
0.4
0.2
0.0
0.10
0.05
0.00
0.10
0.05
0.00
152
152
165
165
178
178
189
189
202
202
215
215
226
226
239
239
252
252
276
276
300
300
326
326
350
350
Figure 7. Left panel: high resolution mass spectra of six OA factors. Right panel: unit mass resolution spectra (m/z 120–350) of six OAfactors.
than observed in summer (0.17) (Huang et al., 2010) and Jan-uary 2013 (Zhang et al., 2014), indicating that HOA duringthis study period was primarily from fresh emissions. In-deed, HOA was tightly correlated with NOx and CO (r2
=
0.73 and 0.69, respectively, Fig. S4), two tracers for vehicleemissions, yet presented much weaker correlations with sec-ondary aerosol species (r2 < 0.3). The diurnal cycle of HOAwas characterized by high concentration at night due to theenhanced traffic emissions from diesel trucks and heavy dutyvehicles (Han et al., 2009), as well as shallow PBL at night.Such a diurnal cycle was similar to previously observed cy-cles in winter in Beijing (Sun et al., 2013b; Zhang et al.,2015; Hu et al., 2016). HOA on average accounted for 10 %(6–14 %) of the total OA for the entire study period, which ismuch lower than the 18 % during the Beijing 2008 OlympicGames (Huang et al., 2010), yet close to the 11 % reported inJanuary 2013 (Zhang et al., 2014) and 14 % in winter 2010(Hu et al., 2016).
3.4.2 Cooking OA
Similar to previously reported COA, the mass spectrum wascharacterized by high m/z 55/57 ratio (He et al., 2010; Sunet al., 2011; Mohr et al., 2012). COA contributed 31 and36 % to C3H3O+ and C4H+7 , respectively, at m/z 55 and∼ 21 % to C3H5O+ and C4H+9 at m/z 57. Although m/z 55is often used as a tracer for cooking emissions, our re-sults indicated that COA correlated much better with sev-eral other fragment ions, e.g. C6H10O+, C5H8O+, C4H+6 ,
Figure 8
1201101009080706050403020m/z (amu)
1.00.90.80.70.60.5
1.00.90.80.70.60.5
1.00.90.80.70.60.5
1.00.90.80.70.60.5
1.00.90.80.70.60.5
1.00.90.80.70.60.5
(f) aq-OOA
(e) OOA
(d) CCOA
(c) BBOA
(b) COA
(a) HOA
R2 O
A fa
ctor
s vs
. ion
s
CxHy CxHyO1 CxHyO2 CxHyNp CxHyOzSq
C4H6C6H8 C6H10OC5H8OC5H7
CH3SO2CH2SO2CH3SO
C2H2O2C2O2
CH2O2
CO2C2H3O
C3H2O2 C4H2O2 C7H4O
C7H4 C8H5C6H3C9H5
C3H7 C4H9C5H11 C6H13 C7H15 C8H17
C6H6O2C2H4O2
Figure 8. Correlations between six OA factors and HRMS ions thatare segregated into five categories (CxH+y , CxHyO+, CxHyO+2 ,CxHyN+p and CxHyOzS+q ).
www.atmos-chem-phys.net/16/8309/2016/ Atmos. Chem. Phys., 16, 8309–8329, 2016

8318 Y. Sun et al.: Primary and secondary aerosols in Beijing in winter
C5H+7 and C6H+8 (Fig. 8). Compared to the results in NewYork City, COA showed similarly tight correlations withC6H10O+ and C5H8O+, yet much weaker correlations withlarge hydrocarbon ions (Sun et al., 2011). These results sug-gest that C6H10O+ and C5H8O+ are better tracers for cook-ing emissions than the unit m/z 55 and 57 although theycontribute small fractions to the total organics. The ratio ofCOA / C6H10O+ is 184, which is close to that obtained inwinter in Fresno, California (Ge et al., 2012a) and New YorkCity (Sun et al., 2011) (170 and ∼ 180, respectively). As aresult, the COA aerosol could be simply estimated with theequation of COA= 180×C6H10O+. The O / C of COA is0.14 which is similar to those observed in winter in Beijingand Fresno, CA (Ge et al., 2012a; Zhang et al., 2014; Hu etal., 2016), and fresh cooking emissions (0.08–0.13) (He etal., 2010). These results indicate that COA is mainly com-posed of low oxygenated organics. In addition, COA showedmuch better correlation with smaller organic particles, e.g.< 100 nm (Fig. S7), indicating substantial emissions of ultra-fine particles from cooking activities.
COA showed a pronounced diurnal cycle with two promi-nent peaks at lunch and dinner time and a visible morningbreakfast peak at ∼ 08:00. Such a unique diurnal cycle ofCOA has been observed many times in megacities. COA onaverage accounted for 18 % of the total OA with the high-est contribution close to 40 % during meal times. COA hasbeen found to show comparable and even higher contribu-tions than traffic-related HOA in densely populated megac-ities, e.g. New York City (16 vs. 14 %) (Sun et al., 2011),Paris (15–17 vs. 11–14.3 %) (Crippa et al., 2013; Fröhlichet al., 2015), London (22–30 vs. 23–25 %) (Allan et al.,2010), Fresno (19 vs. 22 %) (Ge et al., 2012a) and Beijing(24 vs. 18 %) (Huang et al., 2010). A recent study foundthat emissions from residential heating and cooking have thelargest impact on premature mortality globally (Lelieveld etal., 2015). Particularly, aerosol particles tend to be presentat small size ranges during the periods with high COA con-tribution, which are subject to more adverse health effects.Therefore, reducing cooking emissions is of importance, notonly in mitigating urban PM pollution, but also alleviatingthe harmful effects in densely populated megacities.
3.4.3 Coal combustion OA
CCOA showed a similar spectral pattern to HOA at smallm/z’s (< 120) (Fig. 7d). The largest difference is m/z 115(mainly C9H+7 ) which is prominent in the CCOA spectrumyet much smaller in HOA spectrum. The CCOA spectrumshowed a visible m/z 44 peak, yet it is much smaller thanthose observed in Beijing (Hu et al., 2016) and Lanzhou (Xuet al., 2016). The spectral differences were likely due to dif-ferent burning conditions and ageing processes. For example,a recent study by burning different types of coals showed thatthe CCOA spectrum, particularly m/z 44 and 73, can havesignificant changes during the different stages of the burning,
and high m/z 44 in the spectrum was mainly the fragmentsof organic acids (Zhou et al., 2016). Although CCOA wasseparated from HOA by PMF analysis of ACSM UMR spec-tra in our previous study during winter 2011–2012 (Sun etal., 2013b), the interpretation of these two components werequite difficult due to the absence of the information at largem/z’s (> 150). In this study, PMF analysis of UMR spectra tom/z 350 showed strong PAH signatures in the CCOA spec-trum, which are m/z’s 152, 165, 178, 189, 202, 215, 226,239, 252, 276, 300, 326 and 350 (Dzepina et al., 2007). Thedistinct PAH peaks of m/z’s 152, 165, 178 and 189 were al-ready observed in the CCOA spectrum resolved in Beijingin winter 2010 (Hu et al., 2016) and a rural site in centralChina (Hu et al., 2013). Comparatively, the traffic-relatedHOA did not present pronounced PAH signals, which wasdifferent from those observed at morning rush hours in Mex-ico City (Dzepina et al., 2007). This likely indicates that adominant source of PAHs is coal combustion. In fact, CCOAwas highly correlated with PAHs (r2
= 0.92, Fig. 8d). In ad-dition, CCOA was found to have ubiquitously tight corre-lations with large m/z’s (> 150) (Fig. S9), and contributedmore than 40 % for most m/z’s (Fig. S10). This likely indi-cates that coal combustion emits a considerable amount ofhigh molecular weight organics. The O / C of CCOA is 0.14suggesting that organic aerosols emitted from coal combus-tion are fresh. Higher O / C ratio of CCOA (0.17) observedat the rural site (Hu et al., 2013) was likely due to the atmo-spheric ageing during the transport.
The average mass concentration of CCOA was 7.6 µg m−3,which is lower than (11.3 µg m−3) observed during win-ter 2011–2012 (Sun et al., 2013b), yet similar to those (7.3–8.2 µg m−3) in January 2013 and winter 2010 (Sun et al.,2014; Hu et al., 2016). CCOA was the largest primary OA, onaverage accounting for 20 %. CCOA showed a pronounceddiurnal cycle with significantly higher concentration at night-time than daytime (Fig. 8g).The contribution of CCOA to OAreached 37 % at night-time, which is much higher than 7 %during the daytime. After considering the PBL dilution ef-fect, CCOA still showed a pronounced diurnal variation, il-lustrating much stronger coal combustion emissions at night.
3.4.4 Biomass burning OA
Compared to previous AMS winter studies in Beijing (Sunet al., 2013b, 2014; Zhang et al., 2014, 2015), we were ableto resolve a factor, the mass spectrum of which was char-acterized by prominent m/z 60 (mainly C2H4O+2 ) and 73(C3H5O+2 ), two markers indicative of biomass burning emis-sions (Lanz et al., 2007; Mohr et al., 2009). The two recentAMS studies also resolved BBOA factors in winter in Beijing(Elser et al., 2016; Hu et al., 2016). Consistently, the BBOAspectrum resembles to those observed at various sites (Nget al., 2011), e.g. Fresno, CA (Ge et al., 2012a) and Mex-ico City (Aiken et al., 2009). Although BBOA was tightlycorrelated with C2H4O+2 (r2
= 0.65), similar high correla-
Atmos. Chem. Phys., 16, 8309–8329, 2016 www.atmos-chem-phys.net/16/8309/2016/

Y. Sun et al.: Primary and secondary aerosols in Beijing in winter 8319
tions between C2H4O+2 and primary HOA and CCOA werealso observed, indicating the contributions of multiple com-bustion sources to m/z 60 (Fig. 8). Indeed, the four primaryOA factors showed comparable contributions to ion C2H4O+2in this study. We noticed that BBOA showed the best cor-relation with C6H6O+2 (m/z 110), a marker ion for hydro-quinone and catechol from the pyrolysis of lignin and/or thehydroxylation of phenol (Y. L. Sun et al., 2010), supportingthe influence of biomass burning emissions on this factor.In addition, similar strong PAHs signals to CCOA were alsoobserved at large m/z’s, suggesting that BBOA is also an im-portant source of PAHs during wintertime. BBOA showed asimilar diurnal pattern to CCOA which was characterized byhigh concentration at night-time. The O / C ratio of BBOA is0.36, which is similar to those observed at other urban sites(Aiken et al., 2009; He et al., 2011; Huang et al., 2011; Ge etal., 2012a). It’s interesting to note that BBOA presents a highN / C ratio (= 0.042) compared to the other three primaryfactors, which is likely due to the large amount of nitrogen-containing organic compounds emitted from biomass burn-ing emissions (Laskin et al., 2009). Consistently, high N / Cratios in BBOA (∼ 0.06) were also observed in Pearl Riverdelta (He et al., 2011; Huang et al., 2011). The average massconcentration of BBOA was 3.3 µg m−3 (9 % of the totalOA), indicating that BBOA is an important source of OA dur-ing wintertime. The overall concentration and contribution ofBBOA was consistent with the values previously reported inBeijing in winter (Elser et al., 2016; Hu et al., 2016).
BBOA was highly correlated with levoglucosan (r2=
0.93, Fig. 10a), a common tracer compound for biomassburning (Simoneit, 2002). The average ratio of levoglucosanto organic carbon (OC) derived from BBOA is 0.257, whichis generally higher than from burning individual biomass(Sullivan et al., 2008) and during the BB episode in sum-mer in Beijing (0.036) (Cheng et al., 2013). Previous stud-ies showed that coal combustion also emits a considerableamount of levoglucosan (Zhang et al., 2008). In fact, lev-oglucosan was also correlated with the total OC from BBOAand CCOA (r2
= 0.91), yielding an average ratio of levoglu-cosan / OC of 0.062. The ratio of levoglucosan/mannosan(L/M) can be used to indicate different types of burning.For example, burning hardwood showed a much higher L/M
ratio compared to burning softwood. Cheng et al. (2013)observed quite different L/M ratios for different types ofbiomass burning, e.g. 12.7 for wheat straw and 19.7 for cornstraw, yet much lower values for pine and poplar wood. Inthis study, levoglucosan was highly correlated with man-nosan (Fig. 10b, r2
= 0.95), and the ratio of L/M (17.1) issimilar to those from burning wheat straw and corn straw(Cheng et al., 2013). We also noticed that the L/M ratioin this study is similar to those (14.8–19.6) from residen-tial burning of bituminite and coal briquette (Zhang et al.,2008), likely indicating the contribution of coal combustionto these two compounds. This is further supported by the vis-ible m/z 60 in the CCOA spectrum. As a result, levoglucosan
and mannosan observed in this study were likely from bothbiomass burning and coal combustion; however it is difficultto separate them only based on L/M ratios. We further calcu-lated the bivariate polar plot of BBOA (Fig. S11) and foundthat a high concentration of BBOA was mainly located inthe regions to the north and north-east, and likely has mixedsources from local emissions and regional transport.
3.4.5 Secondary organic aerosols
Two SOA factors, i.e. OOA and aq-OOA, with similar spec-tral patterns yet largely different time variations, were iden-tified. While the O / C ratios were similar between OOA andaq-OOA (0.75 vs. 0.81), the H / C ratio was much more dif-ferent (1.51 for OOA and 1.75 for aq-OOA). We also noticedthe different ratios of C2H3O+/ CO+2 and CHO+/ CO+2 inOOA and aq-OOA spectra. Indeed, the correlations betweenOOA/aq-OOA and individual fragment ions were quite dif-ferent. As shown in Fig. 8, OOA was highly correlated withthe oxygenated ion series CxHyO+2 and CxHyO+1 , e.g. CO+2(m/z 44, r2
= 0.89), C2H3O+ (m/z 43, r2= 0.85), C3H2O+2
(m/z 70, r2= 0.90) and C4H2O+2 (m/z 82, r2
= 0.85) etc.,yet the correlations with hydrocarbon ions CxH+y were muchweaker. These results indicate that OOA was primarily com-posed of oxygenated organics. OOA was tightly correlatedwith Ox (r2
= 0.73) and NO3 (r2= 0.71), consistent with
previous results observed in January 2013 (Sun et al., 2014).The diurnal cycle of OOA was significant, showing an in-crease from 08:00 to 20:00. The daytime increase was in-terrupted by a temporary decrease in the afternoon due tothe dilution effect of PBL. In fact, OOA /1CO presented acontinuous increase from 08:00 to 14:00, then remained ata relatively high level until 19:00 (Fig. S12). These resultsclearly indicate the photochemical production of OOA inthe daytime. Based on the variations of OOA between 08:00and 14:00, we estimated that local photochemical productioncould contribute ∼ 70 % of OOA during this study. OOA onaverage contributed 25 % of the total OA with the contribu-tion as high as 42 % in the late afternoon.
The aq-OOA was highly correlated with specific uniquefragment ions from typical aqueous-phase processing prod-ucts. For example, aq-OOA correlated well with C2H2O+2(m/z 58), C2O+2 (m/z 56) and CH2O+2 (m/z 46) (Fig. 8).These ions are typical fragment ions of glyoxal and methyl-gloxyal (Chhabra et al., 2010), which are important precur-sors in the formation of low volatility SOA in cloud pro-cessing (Carlton et al., 2007; Altieri et al., 2008; Tan etal., 2009). In addition, aq-OOA was also highly correlatedwith several sulfur-containing ions, e.g. CH3SO+, CH2SO+2and CH3SO+2 (Fig. 8), which are typical fragment ions ofmethanesulfonic acid (MSA), a secondary product from theoxidation of dimethyl sulfide (DMS) (Zorn et al., 2008; Ge etal., 2012b). Previous studies have found that hydromethane-sulfonate (HMS) can be used a tracer for aqueous-phase fogprocessing. Although the HMS spectrum does not present
www.atmos-chem-phys.net/16/8309/2016/ Atmos. Chem. Phys., 16, 8309–8329, 2016
8320 Y. Sun et al.: Primary and secondary aerosols in Beijing in winter
Figure 9
40302010
0
60
40
20
0
604020
0
40302010
0
120
80
40
0
30
20
10
0
4003002001000
NO
x (pp
b)
0.50.40.30.20.10.0
C6 H
10 O
+
3.0
2.0
1.0
0.0
C2 H
4 O2 +
1.00.80.60.40.20.0
PA
H (µ
g m
-3)
100806040
Ox (pp
b)
6040200
SO
4 (µg m
-3)
1208040
012/18 12/22 12/26 12/30 1/3 1/7 1/11 1/15
Date & time
Mas
s co
nce
ntra
tion
(µg
m-3
)
(f) aq-OOA
(e) OOA
(d) CCOA
(c) BBOA
(b) COA
(a) HOA
LWC
20
16
12
8
4
0
Ma
ss c
on
cent
ratio
n (
µg
m)
-3
24201612840Hour of day
HOA COA BBOA CCOA OOA aq-OOA
1.0
0.8
0.6
0.4
0.2
0.0
Ma
ss fr
actio
n
24201612840Hour of day
(g)
(h)
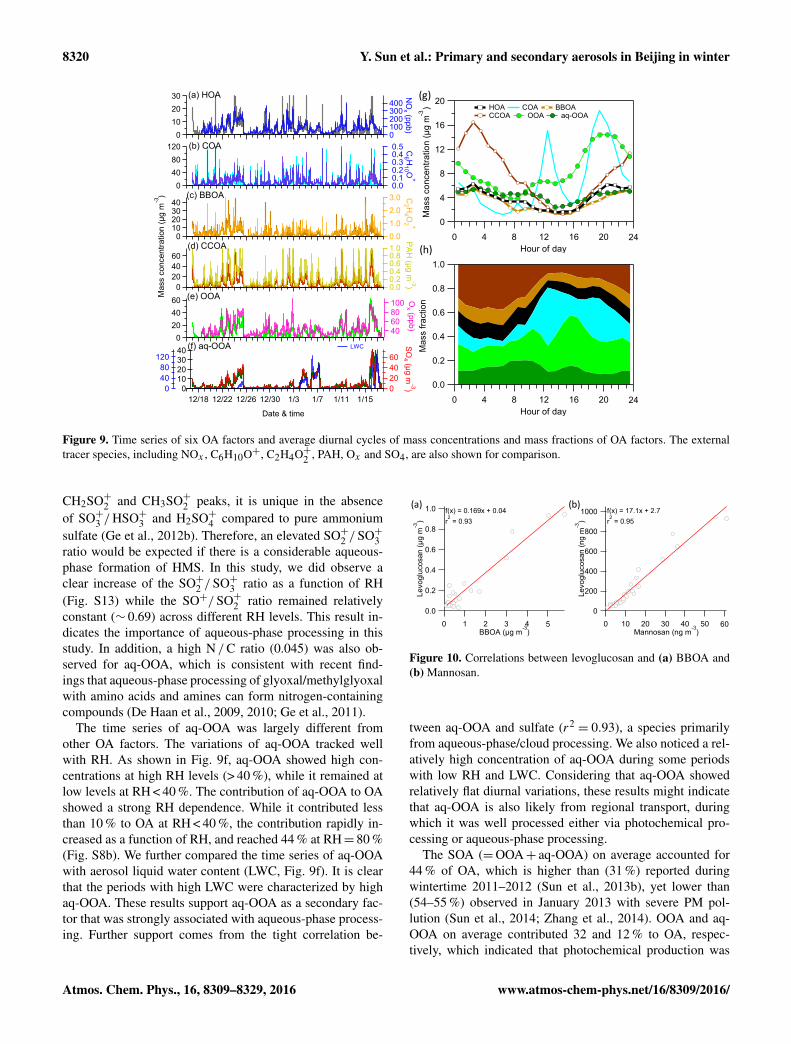
Figure 9. Time series of six OA factors and average diurnal cycles of mass concentrations and mass fractions of OA factors. The externaltracer species, including NOx , C6H10O+, C2H4O+2 , PAH, Ox and SO4, are also shown for comparison.
CH2SO+2 and CH3SO+2 peaks, it is unique in the absenceof SO+3 / HSO+3 and H2SO+4 compared to pure ammoniumsulfate (Ge et al., 2012b). Therefore, an elevated SO+2 / SO+3ratio would be expected if there is a considerable aqueous-phase formation of HMS. In this study, we did observe aclear increase of the SO+2 / SO+3 ratio as a function of RH(Fig. S13) while the SO+/ SO+2 ratio remained relativelyconstant (∼ 0.69) across different RH levels. This result in-dicates the importance of aqueous-phase processing in thisstudy. In addition, a high N / C ratio (0.045) was also ob-served for aq-OOA, which is consistent with recent find-ings that aqueous-phase processing of glyoxal/methylglyoxalwith amino acids and amines can form nitrogen-containingcompounds (De Haan et al., 2009, 2010; Ge et al., 2011).
The time series of aq-OOA was largely different fromother OA factors. The variations of aq-OOA tracked wellwith RH. As shown in Fig. 9f, aq-OOA showed high con-centrations at high RH levels (> 40 %), while it remained atlow levels at RH < 40 %. The contribution of aq-OOA to OAshowed a strong RH dependence. While it contributed lessthan 10 % to OA at RH < 40 %, the contribution rapidly in-creased as a function of RH, and reached 44 % at RH= 80 %(Fig. S8b). We further compared the time series of aq-OOAwith aerosol liquid water content (LWC, Fig. 9f). It is clearthat the periods with high LWC were characterized by highaq-OOA. These results support aq-OOA as a secondary fac-tor that was strongly associated with aqueous-phase process-ing. Further support comes from the tight correlation be-
Figure 10
1.0
0.8
0.6
0.4
0.2
0.0
Levo
gluc
osan
(µg
m-3
)
543210BBOA (µg m
-3)
f(x) = 0.169x + 0.04r2 = 0.93
1000
800
600
400
200
0
Levo
gluc
osan
(ng
m-3
)
6050403020100Mannosan (ng m
-3)
f(x) = 17.1x + 2.7r2 = 0.95
(a) (b)
Figure 10. Correlations between levoglucosan and (a) BBOA and(b) Mannosan.
tween aq-OOA and sulfate (r2= 0.93), a species primarily
from aqueous-phase/cloud processing. We also noticed a rel-atively high concentration of aq-OOA during some periodswith low RH and LWC. Considering that aq-OOA showedrelatively flat diurnal variations, these results might indicatethat aq-OOA is also likely from regional transport, duringwhich it was well processed either via photochemical pro-cessing or aqueous-phase processing.
The SOA (=OOA+ aq-OOA) on average accounted for44 % of OA, which is higher than (31 %) reported duringwintertime 2011–2012 (Sun et al., 2013b), yet lower than(54–55 %) observed in January 2013 with severe PM pol-lution (Sun et al., 2014; Zhang et al., 2014). OOA and aq-OOA on average contributed 32 and 12 % to OA, respec-tively, which indicated that photochemical production was
Atmos. Chem. Phys., 16, 8309–8329, 2016 www.atmos-chem-phys.net/16/8309/2016/

Y. Sun et al.: Primary and secondary aerosols in Beijing in winter 8321
the major process in the formation of SOA during this studyperiod.
3.5 Polycyclic aromatic hydrocarbons (PAHs)
PAHs mainly from incomplete combustion are of great con-cerns in megacities due to their carcinogenicity and muta-genicity (Boström et al., 2002). Knowledge of their con-centration levels and sources is thus important for miti-gation strategies of air pollution. Here we quantified thePAHs with AMS using the algorithm developed by Dzepinaet al. (2007). The average concentration of PAHs is 0.22(±0.27) µg m−3 for the entire study. The concentration is sig-nificantly higher than that (21–29 ng m−3) reported in sum-mer in Lanzhou (Xu et al., 2014) and in autumn in Beijing(Zhang et al., 2016), yet close to that observed in the heat-ing season (Okuda et al., 2006). These results illustrate thelargely different sources of PAHs between the heating sea-son and non-heating season. In this study, PAHs presenteda pronounced diurnal cycle with a significantly higher con-centration at night-time than in the daytime. Such a strongdiurnal variation is remarkably similar to that of CCOA, con-firming that coal combustion is a large source of PAHs duringwintertime (Zhang et al., 2008). Indeed, the mass spectrumof CCOA showed distinct fragment m/z’s from PAHs, e.g.m/z 152, 165, 178, 189, 202, 215, 226, 239, 252, 276, 300,326, etc. (Fig. 7d). Note that the mass spectrum of BBOA(Fig. 7c) was also characterized by similar PAHs m/z’s, sug-gesting that BBOA might also be a considerable contribution.For example, PAHs were highly correlated with BBOA inFresno, California, yet the correlations with COA and HOAwere much weaker. Similar tight correlations between BBOAand PAHs were also observed during the APEC summit inBeijing (Zhang et al., 2016). For a better understanding ofthe sources of PAHs, a linear regression analysis of OA fac-tors was performed on PAHs.
[PAHs] = aCCOA×[CCOA] + aBBOA×[BBOA] + aHOA
×[HOA] + aCOA×[COA] + aother×[other] (1)
The average contributions of OA sources to PAHs are shownin Fig. 11a. Coal combustion is the dominant source of PAHs,on average accounting for 66 %. This is consistent with theresults from previous studies that coal combustion emits alarge amount of PAHs (Chen et al., 2005; Zhang et al., 2008).Biomass burning and traffic emissions contributed 18 and11 %, respectively, to the total PAHs. Cooking emissionswere a minor source of PAH in this study, on average ac-counting for 3 %, which is also consistent with the fact thatthe amount of PAHs emitted from the Chinese cooking wassmall (Zhao et al., 2006).
Figure 11b shows a comparison of OA spectra during ahaze episode on 24 December with that during rush traffichours in Mexico City (Dzepina et al., 2007). While the spec-tra were both characterized by distinct PAH signals, the PAH
spectra patterns were quite different, indicating that the com-position of PAHs was substantially different between coalcombustion and traffic emissions. We further compared theOA spectra at two different night-time periods and the spec-tra pattern (m/z > 150) was remarkably similar (r2
= 0.99,Fig. 11d), suggesting similar source emissions on differ-ent days. However, the average OA spectra in the afternoonshowed differences from those at night-time, likely indicat-ing that photochemical processing changed OA compositionto a certain degree. The average size distribution of PAHsshowed a large single mode peaking at ∼ 400 nm, which issimilar to observations in Mexico City (Dzepina et al., 2007).The size distributions of PAHs were quite similar betweendifferent episodes which were both characterized by singleaccumulation modes peaking at ∼ 400–500 nm.
3.6 Episode analysis
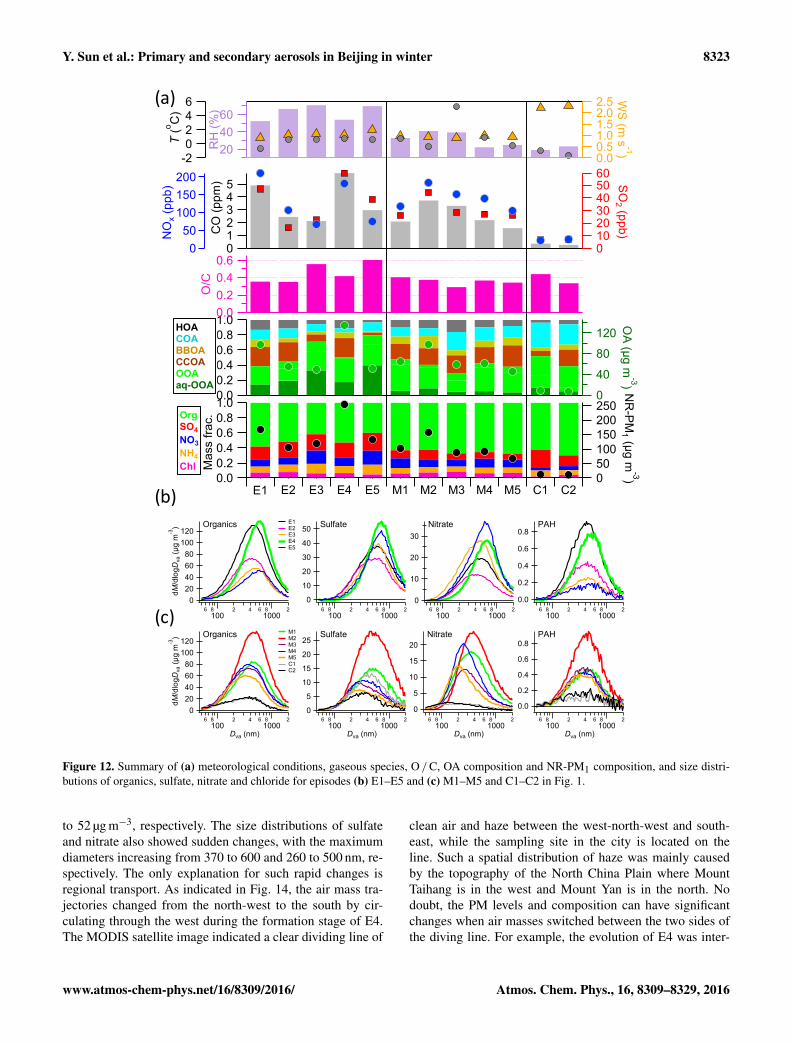
Many previous studies have found largely different aerosolcomposition between clean periods and haze episodes inBeijing (Huang et al., 2010; Sun et al., 2012, 2013b; Jianget al., 2015). In this study, we also observed frequentchanges of clean periods and pollution episodes (Fig. 1). Fiveepisodes (E1–E5) with relatively high RH levels (> 50 %),five episodes (M1–M5) with RH levels between 20 and 40 %,and two clean periods (C1–C2) were selected to investigatethe variations of aerosol chemistry among different episodes.The average mass concentrations of NR-PM1 varied substan-tially from 105 to 255 µg m−3 during E1–E5, which was gen-erally higher than those (67–158 µg m−3) during M1–M5.The average composition was also different. While the con-tribution of organics varied between 40 and 58 % during E1–E5, it was relatively constant at 62–67 % during M1–M5, in-dicating a more important role of organics in PM pollutionat lower RH levels. Sulfate also played a very different roleduring the two types of episodes with a much higher con-tribution (17–24 %) during E1–E5 than the 8–13 % duringM1–M5. This result is consistent with our previous conclu-sion that sulfate played an enhanced role at high RH lev-els due to aqueous-phase processing. OA composition var-ied greatly among different episodes. But overall, episodeswith high RH levels showed much higher aq-OOA contribu-tions than those in episodes with low RH levels. Because theaverage temperature and wind speed were relatively similar,such compositional differences were mainly caused by dif-ferent RH conditions. For instance, two episodes, i.e. E3 andE5, showed much higher SOA contributions (67–77 %) thanthe other episodes (22–49 %). The two episodes of E3 andE5 were characterized by the highest RH and aq-OOA (37–45 %), likely indicating strong aqueous-phase processing ofOA. The O / C ratios during the two episodes were also thehighest (0.56–0.60), demonstrating that aqueous-phase pro-cessing enhanced the oxidation levels of OA. CCOA wasthe largest primary OA for most episodes with the contri-butions ranging from 22 to 31 % except for E3 and E5. Sev-
www.atmos-chem-phys.net/16/8309/2016/ Atmos. Chem. Phys., 16, 8309–8329, 2016

8322 Y. Sun et al.: Primary and secondary aerosols in Beijing in winter
Figure 11
0.35
0.30
0.25
0.20
0.15
0.10
0.05
0.00
MS
, 1/1
5 23
:00
- 1/1
6 7:
00
0.40.30.20.10.0MS, 12/24 3:00 - 6:00
152165
178
189
202
215
226
239252
276300
326350
f(x) = 0.73xr2 = 0.99
66%
18% 11%
3% 3%
2.0
1.5
1.0
0.5
0.0
dM/d
logD
va (µ
g m
-3)
5 6100
2 3 4 5 61000
2
Dva (nm)
Entire Period (x5) 12/24 3:00-6:00 1/15 23:00-1/16 7:00
CCOA
BBOAHOA
COA
Other
340320300280260240220200180160
Mexico City,5:00 - 9:00 Episode, 12/24 3:00 - 6:00
152 165178
189202
215226
239 252
276
300
326350
0.22 µg m-3(a) (b)
(c) (d)
Figure 11. (a) Average contributions of OA factors to PAHs for the entire study, (b) UMR OA spectra during an episode (03:00–06:00on 24 December). The average PAH spectrum between 05:00 and 09:00 h in Mexico City (Dzepina et al., 2007) is shown for comparison.Panel (c) shows the average size distribution of PAHs for the entire study and two selected episodes and panel (d) presents a comparison ofOA spectra (m/z 150–300) between the two episodes.
eral episodes (M3 and C1–C2) with significant local cookinginfluences (COA: 27–45 %) were also observed. In additionto the RH impacts, the sources emissions were also likelyto be different among different episodes. The CO / NOx ra-tios varied from 23 to 40 during E1–E5, while they weregenerally low-ranging from 15 to 22 during M1–M5. Also,the NO2/ NOx ratios were generally higher (0.40–0.59) dur-ing E1–E5 than 0.33–0.45 during M1–M5, and even higher(0.67–0.69) during C1–C2. The size distributions of aerosolspecies are also substantially different between the two typesof episodes. The episodes with high RH levels (E1–E5)showed larger maximum diameters than those during M1–M5, for instance, > 500 vs. 300–500 nm for sulfate and 400–700 vs. 200–400 nm for nitrate. In contrast, the differences insize distributions of organics and PAHs were much smaller(Fig. 12b and c). Larger particles of sulfate and nitrate werelikely due to the hygroscopic growth at high RH levels.
Figure 13 shows the evolution of secondary aerosolspecies and size distributions over two periods with differ-ent RH levels. The first period contains two episodes, i.e.M1 and M2 in Fig. 1. The formation of M1 was clearly as-sociated with a change of air masses from the north to thesouth-west that occurred at approximately 12:00 on 21 De-cember. Winds remained consistently from the south-westover the next 10 h and RH increased gradually from ∼ 20to 40 %. Under such meteorological conditions, nitrate andsulfate showed gradual increases from less than 5 µg m−3 tomore than 20 µg m−3. The mean geometric diameters (GMD)
showed similar increases, approximately from 180 to 450 nmfor nitrate, and 270 to 570 nm for sulfate. However, we ob-served different evolution behaviours between OOA and aq-OOA. While OOA showed similar increases to sulfate andnitrate, aq-OOA remained at relatively low concentrations.This indicates a dominance of OOA over aq-OOA duringthe early stage of regional transport with low RH levels. Theepisode of M1 was rapidly cleaned by the northerly windsuntil 12:00 on 22 December when wind direction changed tothe south-south-west and the episode of M2 was formed. It isinteresting to note that the wind direction changes did not re-sult in immediate increases of all secondary aerosol species.In fact, wind speed firstly decreased at both ground level andhigher altitudes (e.g. 320 m), associated with correspondingdecreases of RH. Nitrate and OOA showed clear increasesduring this stage, while the sulfate and aq-OOA concen-trations were consistently low. One explanation is that sec-ondary aerosols during the early stage of these two episodeswere mainly from local photochemical production, consis-tent with the increasing O / C ratios. After wind speed in-creased significantly at higher altitudes, relatively more hu-midified air masses from the south-south-west arrived at thesampling site, leading to dramatic increases of all secondaryaerosol species.
The formation of episode E4 was more rapid compared toM1 (Fig. 13b). The mass concentrations of secondary sul-fate, nitrate and OOA showed dramatic increases by a factorof 2–5 in 1 h (17:00–18:00) from 11 to 24, 6 to 30 and 15
Atmos. Chem. Phys., 16, 8309–8329, 2016 www.atmos-chem-phys.net/16/8309/2016/
Y. Sun et al.: Primary and secondary aerosols in Beijing in winter 8323
Figure 12
6 8100
2 4 6 81000
2
120100
80604020
0
dM/d
logD
va (µ
g m
-3)
E1 E2 E3 E4 E5
Organics
6 8100
2 4 6 81000
2
50
40
30
20
10
0
Sulfate
6 8100
2 4 6 81000
2
30
20
10
0
Nitrate
6 8100
2 4 6 81000
2
0.8
0.6
0.4
0.2
0.0
PAH
1.00.80.60.40.20.0
Mas
s fra
c.
E1 E2 E3 E4 E5 M1 M2 M3 M4 M5 C1 C2
1.00.80.60.40.20.0
Mas
s Fr
ac.
604020R
H (%
)
2.52.01.51.00.50.0
WS
(m s
-1)
0.60.40.20.0
O/C
543210
CO
(ppm
) 6050403020100
SO
2 (ppb)200150100
500
NO
x (pp
b)
6420
-2T
(o C)
250200150100500
NR
-PM
1 (µg m-3)
120
80
40
0
OA
(µg m-3)
HOACOABBOACCOAOOAaq-OOA
OrgSO4NO3NH4Chl
(a)
(b)
6 8100
2 4 6 81000
2
Dva (nm)
120100
80604020
0
dM/d
logD
va (µ
g m
-3)
M1 M2 M3 M4 M5 C1 C2
Organics
6 8100
2 4 6 81000
2
Dva (nm)
25
20
15
10
5
0
Sulfate
6 8100
2 4 6 81000
2
Dva (nm)
0.8
0.6
0.4
0.2
0.0
PAH
6 8100
2 4 6 81000
2
Dva (nm)
20
15
10
5
0
Nitrate(c)
Figure 12. Summary of (a) meteorological conditions, gaseous species, O / C, OA composition and NR-PM1 composition, and size distri-butions of organics, sulfate, nitrate and chloride for episodes (b) E1–E5 and (c) M1–M5 and C1–C2 in Fig. 1.
to 52 µg m−3, respectively. The size distributions of sulfateand nitrate also showed sudden changes, with the maximumdiameters increasing from 370 to 600 and 260 to 500 nm, re-spectively. The only explanation for such rapid changes isregional transport. As indicated in Fig. 14, the air mass tra-jectories changed from the north-west to the south by cir-culating through the west during the formation stage of E4.The MODIS satellite image indicated a clear dividing line of
clean air and haze between the west-north-west and south-east, while the sampling site in the city is located on theline. Such a spatial distribution of haze was mainly causedby the topography of the North China Plain where MountTaihang is in the west and Mount Yan is in the north. Nodoubt, the PM levels and composition can have significantchanges when air masses switched between the two sides ofthe diving line. For example, the evolution of E4 was inter-
www.atmos-chem-phys.net/16/8309/2016/ Atmos. Chem. Phys., 16, 8309–8329, 2016
8324 Y. Sun et al.: Primary and secondary aerosols in Beijing in winter
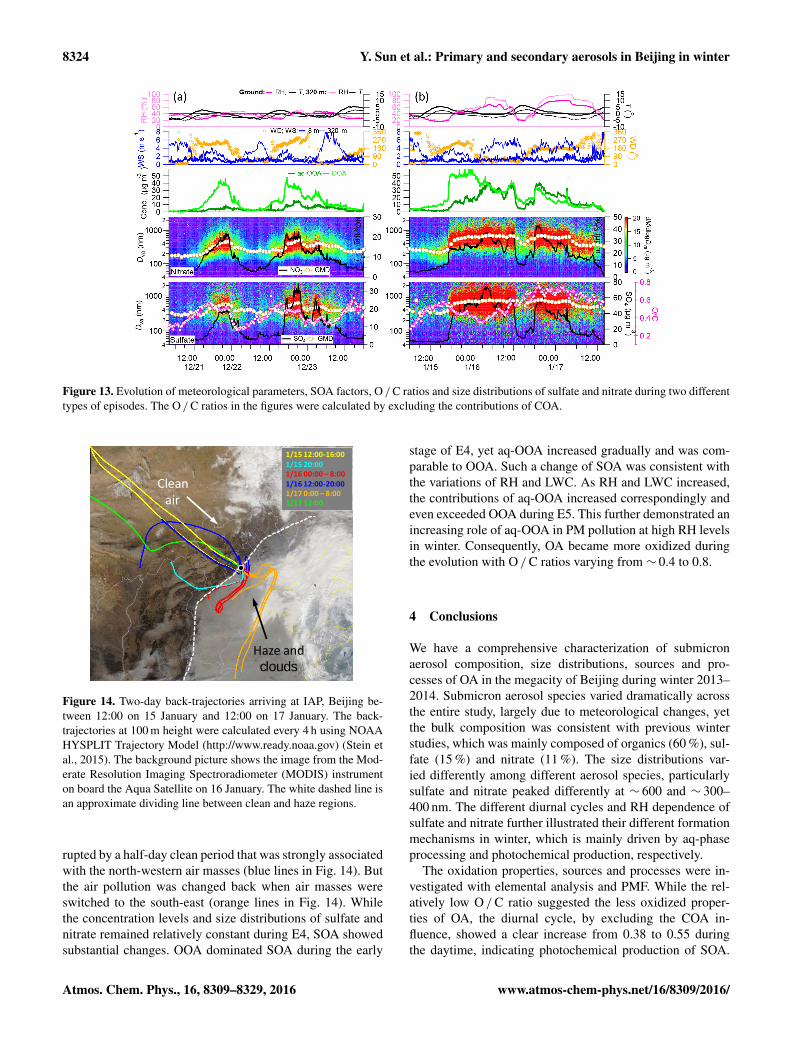
Figure 13. Evolution of meteorological parameters, SOA factors, O / C ratios and size distributions of sulfate and nitrate during two differenttypes of episodes. The O / C ratios in the figures were calculated by excluding the contributions of COA.
Figure 14
1/15 12:00-16:001/15 20:001/16 00:00 – 8:001/16 12:00-20:001/17 0:00 – 8:001/17 12:00
Clean air
Haze and clouds
Figure 14. Two-day back-trajectories arriving at IAP, Beijing be-tween 12:00 on 15 January and 12:00 on 17 January. The back-trajectories at 100 m height were calculated every 4 h using NOAAHYSPLIT Trajectory Model (http://www.ready.noaa.gov) (Stein etal., 2015). The background picture shows the image from the Mod-erate Resolution Imaging Spectroradiometer (MODIS) instrumenton board the Aqua Satellite on 16 January. The white dashed line isan approximate dividing line between clean and haze regions.
rupted by a half-day clean period that was strongly associatedwith the north-western air masses (blue lines in Fig. 14). Butthe air pollution was changed back when air masses wereswitched to the south-east (orange lines in Fig. 14). Whilethe concentration levels and size distributions of sulfate andnitrate remained relatively constant during E4, SOA showedsubstantial changes. OOA dominated SOA during the early
stage of E4, yet aq-OOA increased gradually and was com-parable to OOA. Such a change of SOA was consistent withthe variations of RH and LWC. As RH and LWC increased,the contributions of aq-OOA increased correspondingly andeven exceeded OOA during E5. This further demonstrated anincreasing role of aq-OOA in PM pollution at high RH levelsin winter. Consequently, OA became more oxidized duringthe evolution with O / C ratios varying from ∼ 0.4 to 0.8.
4 Conclusions
We have a comprehensive characterization of submicronaerosol composition, size distributions, sources and pro-cesses of OA in the megacity of Beijing during winter 2013–2014. Submicron aerosol species varied dramatically acrossthe entire study, largely due to meteorological changes, yetthe bulk composition was consistent with previous winterstudies, which was mainly composed of organics (60 %), sul-fate (15 %) and nitrate (11 %). The size distributions var-ied differently among different aerosol species, particularlysulfate and nitrate peaked differently at ∼ 600 and ∼ 300–400 nm. The different diurnal cycles and RH dependence ofsulfate and nitrate further illustrated their different formationmechanisms in winter, which is mainly driven by aq-phaseprocessing and photochemical production, respectively.
The oxidation properties, sources and processes were in-vestigated with elemental analysis and PMF. While the rel-atively low O / C ratio suggested the less oxidized proper-ties of OA, the diurnal cycle, by excluding the COA in-fluence, showed a clear increase from 0.38 to 0.55 duringthe daytime, indicating photochemical production of SOA.
Atmos. Chem. Phys., 16, 8309–8329, 2016 www.atmos-chem-phys.net/16/8309/2016/

Y. Sun et al.: Primary and secondary aerosols in Beijing in winter 8325
In addition, we observed an evident increase of O / C as afunction of particle liquid water content at high RH levels(> 50 %). Such a RH dependence of O / C was mainly causedby the increase of aq-OOA at high RH levels. These resultsindicate that aqueous-phase processing enhanced SOA pro-duction and oxidation states of OA as well in winter. PMFanalysis of OA identified four primary sources, i.e. traffic,cooking, biomass burning and coal combustion, and two sec-ondary factors. CCOA was the largest contributor of POA,on average accounting for 20 %, followed by COA (18 %).The CCOA spectrum showed distinct PAH signatures andwas highly correlated with PAH (r2
= 0.92). BBOA showeda tight correlation with the tracer compound levoglucosan(r2= 0.93). The average levoglucosan/BBOA ratio is 0.169
for the entire study, which might be used to estimate BBOAconcentrations using molecular marker levoglucosan.
The two SOA factors showed largely different time anddiurnal variations. While OOA was highly correlated withphotochemical processing products (e.g. Ox , NO3 and frag-ment ions of CO+2 ), aq-OOA was strongly correlated withaqueous-phase processed products (e.g. liquid water content,sulfate and S-containing ions, e.g. CH2SO+2 and CH3SO+2 ).This result illustrated two different formation mechanisms information of SOA in winter. Although POA dominated OAfor the entire study (56 %), episode analyses highlighted themore important role of SOA in OA (67–77 %) at high RHlevels. Aerosol composition and size distributions can varylargely among different episodes, not only caused by differ-ent meteorological conditions, but also due to the air massesfrom different source regions. Particularly, the switching ofair masses between north-west and south-south-east can leadto the rapid formation and cleaning of haze episodes.
5 Data availability
The observational data in this study are available from theauthors upon request ([email protected]).
The Supplement related to this article is available onlineat doi:10.5194/acp-16-8309-2016-supplement.
Acknowledgements. This work was supported by the Na-tional Key Basic Research Program of China (2014CB447900;2013CB955801), the National Natural Science Foundation ofChina (41575120; 41175108; 41475117), and the Strategic PriorityResearch Program (B) of the Chinese Academy of Sciences(XDB05020501). We thank Jean-Eudes Petit for providing a ZeFirtoolkit to calculate bivariate polar plot.
Edited by: A. DingReviewed by: two anonymous referees
References
Aiken, A. C., DeCarlo, P. F., Kroll, J. H., Worsnop, D. R., Huff-man, J. A., Docherty, K. S., Ulbrich, I. M., Mohr, C., Kimmel,J. R., Sueper, D., Sun, Y., Zhang, Q., Trimborn, A., Northway,M., Ziemann, P. J., Canagaratna, M. R., Onasch, T. B., Alfarra,M. R., Prevot, A. S. H., Dommen, J., Duplissy, J., Metzger, A.,Baltensperger, U., and Jimenez, J. L.: O / C and OM / OC ratiosof primary, secondary, and ambient organic aerosols with High-Resolution Time-of-Flight Aerosol Mass Spectrometry, Environ.Sci. Technol., 42, 4478–4485, 2008.
Aiken, A. C., Salcedo, D., Cubison, M. J., Huffman, J. A., DeCarlo,P. F., Ulbrich, I. M., Docherty, K. S., Sueper, D., Kimmel, J.R., Worsnop, D. R., Trimborn, A., Northway, M., Stone, E. A.,Schauer, J. J., Volkamer, R. M., Fortner, E., de Foy, B., Wang,J., Laskin, A., Shutthanandan, V., Zheng, J., Zhang, R., Gaffney,J., Marley, N. A., Paredes-Miranda, G., Arnott, W. P., Molina,L. T., Sosa, G., and Jimenez, J. L.: Mexico City aerosol analysisduring MILAGRO using high resolution aerosol mass spectrom-etry at the urban supersite (T0) – Part 1: Fine particle composi-tion and organic source apportionment, Atmos. Chem. Phys., 9,6633–6653, doi:10.5194/acp-9-6633-2009, 2009.
Allan, J. D., Williams, P. I., Morgan, W. T., Martin, C. L., Flynn, M.J., Lee, J., Nemitz, E., Phillips, G. J., Gallagher, M. W., and Coe,H.: Contributions from transport, solid fuel burning and cook-ing to primary organic aerosols in two UK cities, Atmos. Chem.Phys., 10, 647–668, doi:10.5194/acp-10-647-2010, 2010.
Altieri, K. E., Seitzinger, S. P., Carlton, A. G., Turpin, B. J., Klein,G. C., and Marshall, A. G.: Oligomers formed through in-cloudmethylglyoxal reactions: Chemical composition, properties, andmechanisms investigated by ultra-high resolution FT-ICR massspectrometry, Atmos. Environ., 42, 1476–1490, 2008.
Boström, C.-E., Gerde, P., Hanberg, A., Jernström, B., Johansson,C., Kyrklund, T., Rannug, A., Törnqvist, M., Victorin, K., andWesterholm, R.: Cancer risk assessment, indicators, and guide-lines for polycyclic aromatic hydrocarbons in the ambient air,Environ. Health Perspect., 110, 451–488, 2002.
Canagaratna, M., Jayne, J., Jimenez, J. L., Allan, J. A., Alfarra,R., Zhang, Q., Onasch, T., Drewnick, F., Coe, H., Middlebrook,A., Delia, A., Williams, L., Trimborn, A., Northway, M., Kolb,C., Davidovits, P., and Worsnop, D.: Chemical and microphysi-cal characterization of aerosols via Aerosol Mass Spectrometry,Mass Spectrom. Rev., 26, 185–222, 2007.
Canagaratna, M. R., Jayne, J. T., Ghertner, D. A., Herndon, S., Shi,Q., Jimenez, J. L., Silva, P. J., Williams, P., Lanni, T., Drewnick,F., Demerjian, K. L., Kolb, C. E., and Worsnop, D. R.: Chasestudies of particulate emissions from in-use New York City vehi-cles, Aerosol Sci. Tech., 38, 555–573, 2004.
Canagaratna, M. R., Jimenez, J. L., Kroll, J. H., Chen, Q., Kessler,S. H., Massoli, P., Hildebrandt Ruiz, L., Fortner, E., Williams, L.R., Wilson, K. R., Surratt, J. D., Donahue, N. M., Jayne, J. T.,and Worsnop, D. R.: Elemental ratio measurements of organiccompounds using aerosol mass spectrometry: characterization,improved calibration, and implications, Atmos. Chem. Phys., 15,253–272, doi:10.5194/acp-15-253-2015, 2015.
Cao, J., Xu, H., Xu, Q., Chen, B., and Kan, H.: Fine particulatematter constituents and cardiopulmonary mortality in a heavilypolluted Chinese city, Environ. Health Perspect., 120, 373–378,2012.
www.atmos-chem-phys.net/16/8309/2016/ Atmos. Chem. Phys., 16, 8309–8329, 2016

8326 Y. Sun et al.: Primary and secondary aerosols in Beijing in winter
Carlton, A. G., Turpin, B. J., Altieri, K. E., Seitzinger, S., Reff, A.,Lim, H.-J., and Ervens, B.: Atmospheric oxalic acid and SOAproduction from glyoxal: Results of aqueous photooxidation ex-periments, Atmos. Environ., 41, 7588–7602, 2007.
Chen, Q., Heald, C. L., Jimenez, J. L., Canagaratna, M. R., Zhang,Q., He, L.-Y., Huang, X.-F., Campuzano-Jost, P., Palm, B. B.,Poulain, L., Kuwata, M., Martin, S. T., Abbatt, J. P. D., Lee, A.K. Y., and Liggio, J.: Elemental Composition of Organic Aerosol:The Gap Between Ambient and Laboratory Measurements, Geo-phys. Res. Lett., 42, 4182–4189, doi:10.1002/2015GL063693,2015.
Chen, Y., Sheng, G., Bi, X., Feng, Y., Mai, B., and Fu, J.: Emissionfactors for carbonaceous particles and polycyclic aromatic hy-drocarbons from residential coal combustion in China, Environ.Sci. Technol., 39, 1861–1867, doi:10.1021/es0493650, 2005.
Cheng, Y., Engling, G., He, K.-B., Duan, F.-K., Ma, Y.-L., Du, Z.-Y., Liu, J.-M., Zheng, M., and Weber, R. J.: Biomass burningcontribution to Beijing aerosol, Atmos. Chem. Phys., 13, 7765–7781, doi:10.5194/acp-13-7765-2013, 2013.
Chhabra, P. S., Flagan, R. C., and Seinfeld, J. H.: Elemental analysisof chamber organic aerosol using an aerodyne high-resolutionaerosol mass spectrometer, Atmos. Chem. Phys., 10, 4111–4131,doi:10.5194/acp-10-4111-2010, 2010.
Crippa, M., DeCarlo, P. F., Slowik, J. G., Mohr, C., Heringa, M.F., Chirico, R., Poulain, L., Freutel, F., Sciare, J., Cozic, J., DiMarco, C. F., Elsasser, M., Nicolas, J. B., Marchand, N., Abidi,E., Wiedensohler, A., Drewnick, F., Schneider, J., Borrmann,S., Nemitz, E., Zimmermann, R., Jaffrezo, J.-L., Prévôt, A. S.H., and Baltensperger, U.: Wintertime aerosol chemical compo-sition and source apportionment of the organic fraction in themetropolitan area of Paris, Atmos. Chem. Phys., 13, 961–981,doi:10.5194/acp-13-961-2013, 2013.
DeCarlo, P. F., Ulbrich, I. M., Crounse, J., de Foy, B., Dunlea,E. J., Aiken, A. C., Knapp, D., Weinheimer, A. J., Campos,T., Wennberg, P. O., and Jimenez, J. L.: Investigation of thesources and processing of organic aerosol over the Central Mex-ican Plateau from aircraft measurements during MILAGRO, At-mos. Chem. Phys., 10, 5257–5280, doi:10.5194/acp-10-5257-2010, 2010.
De Haan, D. O., Corrigan, A. L., Smith, K. W., Stroik, D. R., Turley,J. J., Lee, F. E., Tolbert, M. A., Jimenez, J. L., Cordova, K. E., andFerrell, G. R.: Secondary Organic Aerosol-Forming Reactions ofGlyoxal with Amino Acids, Environ. Sci. Technol., 43, 2818–2824, doi:10.1021/es803534f, 2009.
De Haan, D. O., Hawkins, L. N., Kononenko, J. A., Turley, J. J.,Corrigan, A. L., Tolbert, M. A., and Jimenez, J. L.: Formation ofNitrogen-Containing Oligomers by Methylglyoxal and Aminesin Simulated Evaporating Cloud Droplets, Environ. Sci. Tech-nol., 45, 984–991, doi:10.1021/es102933x, 2010.
Ding, A. J., Fu, C. B., Yang, X. Q., Sun, J. N., Petäjä, T., Kerminen,V.-M., Wang, T., Xie, Y., Herrmann, E., Zheng, L. F., Nie, W.,Liu, Q., Wei, X. L., and Kulmala, M.: Intense atmospheric pol-lution modifies weather: a case of mixed biomass burning withfossil fuel combustion pollution in eastern China, Atmos. Chem.Phys., 13, 10545–10554, doi:10.5194/acp-13-10545-2013, 2013.
Ding, A. J., Huang, X., Nie, W., Sun, J. N., Kerminen, V. M., Petäjä,T., Su, H., Cheng, Y. F., Yang, X. Q., Wang, M. H., Chi, X. G.,Wang, J. P., Virkkula, A., Guo, W. D., Yuan, J., Wang, S. Y.,Zhang, R. J., Wu, Y. F., Song, Y., Zhu, T., Zilitinkevich, S., Kul-
mala, M., and Fu, C. B.: Enhanced haze pollution by black car-bon in megacities in China, Geophys. Res. Lett., 43, 2873–2879,doi:10.1002/2016GL067745, 2016.
Dzepina, K., Arey, J., Marr, L. C., Worsnop, D. R., Salcedo, D.,Zhang, Q., Onasch, T. B., Molina, L. T., Molina, M. J., andJimenez, J. L.: Detection of particle-phase polycyclic aromatichydrocarbons in Mexico City using an aerosol mass spectrome-ter, Int. J. Mass Spectrom., 263, 152–170, 2007.
Elser, M., Huang, R.-J., Wolf, R., Slowik, J. G., Wang, Q.,Canonaco, F., Li, G., Bozzetti, C., Daellenbach, K. R., Huang, Y.,Zhang, R., Li, Z., Cao, J., Baltensperger, U., El-Haddad, I., andPrévôt, A. S. H.: New insights into PM2.5 chemical compositionand sources in two major cities in China during extreme hazeevents using aerosol mass spectrometry, Atmos. Chem. Phys.,16, 3207–3225, doi:10.5194/acp-16-3207-2016, 2016.
Fountoukis, C. and Nenes, A.: ISORROPIA II: a computa-tionally efficient thermodynamic equilibrium model for K+-Ca2+-Mg2+-NH+4 -Na+-SO2−
4 -NO−3 -Cl−-H2O aerosols, At-mos. Chem. Phys., 7, 4639–4659, doi:10.5194/acp-7-4639-2007,2007.
Fröhlich, R., Crenn, V., Setyan, A., Belis, C. A., Canonaco, F.,Favez, O., Riffault, V., Slowik, J. G., Aas, W., Aijälä, M.,Alastuey, A., Artiñano, B., Bonnaire, N., Bozzetti, C., Bressi, M.,Carbone, C., Coz, E., Croteau, P. L., Cubison, M. J., Esser-Gietl,J. K., Green, D. C., Gros, V., Heikkinen, L., Herrmann, H., Jayne,J. T., Lunder, C. R., Minguillón, M. C., Mocnik, G., O’Dowd,C. D., Ovadnevaite, J., Petralia, E., Poulain, L., Priestman, M.,Ripoll, A., Sarda-Estève, R., Wiedensohler, A., Baltensperger,U., Sciare, J., and Prévôt, A. S. H.: ACTRIS ACSM intercompar-ison – Part 2: Intercomparison of ME-2 organic source apportion-ment results from 15 individual, co-located aerosol mass spec-trometers, Atmos. Meas. Tech., 8, 2555–2576, doi:10.5194/amt-8-2555-2015, 2015.
Fu, P., Kawamura, K., Okuzawa, K., Aggarwal, S. G., Wang, G.,Kanaya, Y., and Wang, Z.: Organic molecular compositionsand temporal variations of summertime mountain aerosols overMt. Tai, North China Plain, J. Geophys. Res., 113, D19107,doi:10.1029/2008jd009900, 2008.
Ge, X., Wexler, A. S., and Clegg, S. L.: Atmospheric Amines –Part II. Thermodynamic properties and gas/particle partitioning,Atmos. Environ., 45, 561–577, 2011.
Ge, X., Setyan, A., Sun, Y., and Zhang, Q.: Primary and secondaryorganic aerosols in Fresno, California during wintertime: Re-sults from high resolution aerosol mass spectrometry, J. Geo-phys. Res., 117, D19301, doi:10.1029/2012JD018026, 2012a.
Ge, X., Zhang, Q., Sun, Y., Ruehl, C. R., and Setyan, A.: Effect ofaqueous-phase processing on aerosol chemistry and size distribu-tions in Fresno, California, during wintertime, Environ. Chem.,9, 221–235, 2012b.
Han, S., Kondo, Y., Oshima, N., Takegawa, N., Miyazaki, Y., Hu,M., Lin, P., Deng, Z., Zhao, Y., Sugimoto, N., and Wu, Y.: Tem-poral variations of elemental carbon in Beijing, J. Geophys. Res.,114, D23202, doi:10.1029/2009JD012027, 2009.
He, H., Wang, Y., Ma, Q., Ma, J., Chu, B., Ji, D., Tang, G., Liu,C., Zhang, H., and Hao, J.: Mineral dust and NOx promote theconversion of SO2 to sulfate in heavy pollution days, Sci. Rep.,4, 4172, doi:10.1038/srep04172, 2014.
He, L.-Y., Lin, Y., Huang, X.-F., Guo, S., Xue, L., Su, Q., Hu,M., Luan, S.-J., and Zhang, Y.-H.: Characterization of high-
Atmos. Chem. Phys., 16, 8309–8329, 2016 www.atmos-chem-phys.net/16/8309/2016/
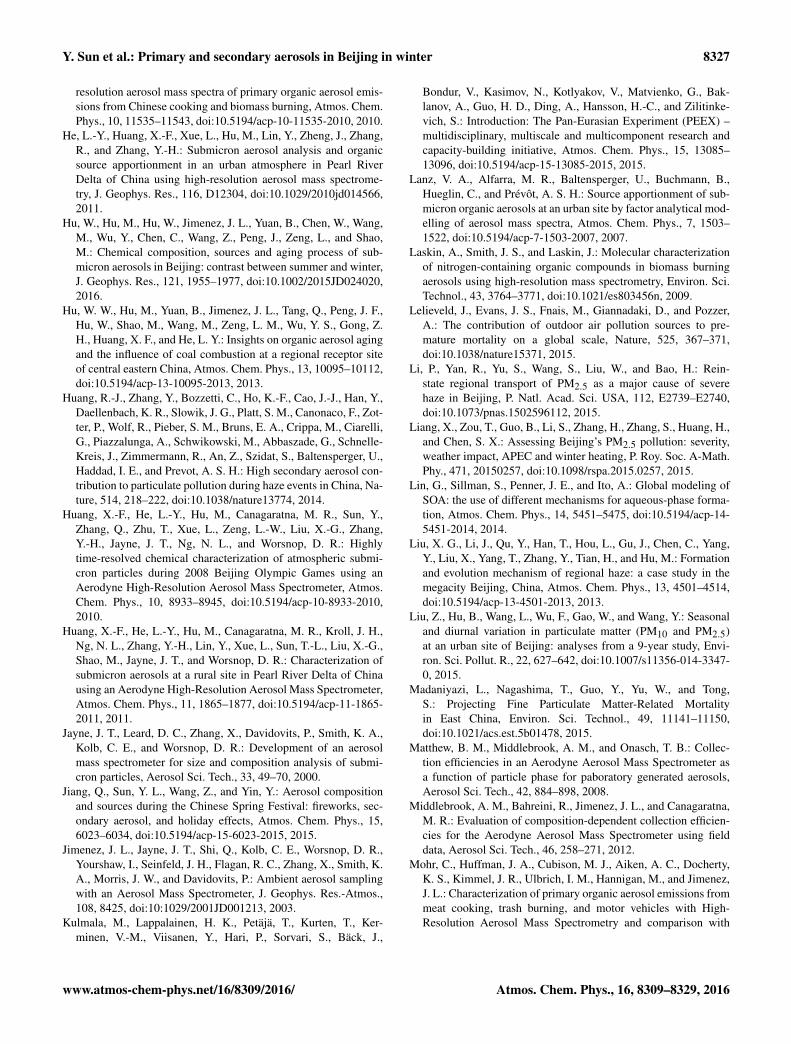
Y. Sun et al.: Primary and secondary aerosols in Beijing in winter 8327
resolution aerosol mass spectra of primary organic aerosol emis-sions from Chinese cooking and biomass burning, Atmos. Chem.Phys., 10, 11535–11543, doi:10.5194/acp-10-11535-2010, 2010.
He, L.-Y., Huang, X.-F., Xue, L., Hu, M., Lin, Y., Zheng, J., Zhang,R., and Zhang, Y.-H.: Submicron aerosol analysis and organicsource apportionment in an urban atmosphere in Pearl RiverDelta of China using high-resolution aerosol mass spectrome-try, J. Geophys. Res., 116, D12304, doi:10.1029/2010jd014566,2011.
Hu, W., Hu, M., Hu, W., Jimenez, J. L., Yuan, B., Chen, W., Wang,M., Wu, Y., Chen, C., Wang, Z., Peng, J., Zeng, L., and Shao,M.: Chemical composition, sources and aging process of sub-micron aerosols in Beijing: contrast between summer and winter,J. Geophys. Res., 121, 1955–1977, doi:10.1002/2015JD024020,2016.
Hu, W. W., Hu, M., Yuan, B., Jimenez, J. L., Tang, Q., Peng, J. F.,Hu, W., Shao, M., Wang, M., Zeng, L. M., Wu, Y. S., Gong, Z.H., Huang, X. F., and He, L. Y.: Insights on organic aerosol agingand the influence of coal combustion at a regional receptor siteof central eastern China, Atmos. Chem. Phys., 13, 10095–10112,doi:10.5194/acp-13-10095-2013, 2013.
Huang, R.-J., Zhang, Y., Bozzetti, C., Ho, K.-F., Cao, J.-J., Han, Y.,Daellenbach, K. R., Slowik, J. G., Platt, S. M., Canonaco, F., Zot-ter, P., Wolf, R., Pieber, S. M., Bruns, E. A., Crippa, M., Ciarelli,G., Piazzalunga, A., Schwikowski, M., Abbaszade, G., Schnelle-Kreis, J., Zimmermann, R., An, Z., Szidat, S., Baltensperger, U.,Haddad, I. E., and Prevot, A. S. H.: High secondary aerosol con-tribution to particulate pollution during haze events in China, Na-ture, 514, 218–222, doi:10.1038/nature13774, 2014.
Huang, X.-F., He, L.-Y., Hu, M., Canagaratna, M. R., Sun, Y.,Zhang, Q., Zhu, T., Xue, L., Zeng, L.-W., Liu, X.-G., Zhang,Y.-H., Jayne, J. T., Ng, N. L., and Worsnop, D. R.: Highlytime-resolved chemical characterization of atmospheric submi-cron particles during 2008 Beijing Olympic Games using anAerodyne High-Resolution Aerosol Mass Spectrometer, Atmos.Chem. Phys., 10, 8933–8945, doi:10.5194/acp-10-8933-2010,2010.
Huang, X.-F., He, L.-Y., Hu, M., Canagaratna, M. R., Kroll, J. H.,Ng, N. L., Zhang, Y.-H., Lin, Y., Xue, L., Sun, T.-L., Liu, X.-G.,Shao, M., Jayne, J. T., and Worsnop, D. R.: Characterization ofsubmicron aerosols at a rural site in Pearl River Delta of Chinausing an Aerodyne High-Resolution Aerosol Mass Spectrometer,Atmos. Chem. Phys., 11, 1865–1877, doi:10.5194/acp-11-1865-2011, 2011.
Jayne, J. T., Leard, D. C., Zhang, X., Davidovits, P., Smith, K. A.,Kolb, C. E., and Worsnop, D. R.: Development of an aerosolmass spectrometer for size and composition analysis of submi-cron particles, Aerosol Sci. Tech., 33, 49–70, 2000.
Jiang, Q., Sun, Y. L., Wang, Z., and Yin, Y.: Aerosol compositionand sources during the Chinese Spring Festival: fireworks, sec-ondary aerosol, and holiday effects, Atmos. Chem. Phys., 15,6023–6034, doi:10.5194/acp-15-6023-2015, 2015.
Jimenez, J. L., Jayne, J. T., Shi, Q., Kolb, C. E., Worsnop, D. R.,Yourshaw, I., Seinfeld, J. H., Flagan, R. C., Zhang, X., Smith, K.A., Morris, J. W., and Davidovits, P.: Ambient aerosol samplingwith an Aerosol Mass Spectrometer, J. Geophys. Res.-Atmos.,108, 8425, doi:10:1029/2001JD001213, 2003.
Kulmala, M., Lappalainen, H. K., Petäjä, T., Kurten, T., Ker-minen, V.-M., Viisanen, Y., Hari, P., Sorvari, S., Bäck, J.,
Bondur, V., Kasimov, N., Kotlyakov, V., Matvienko, G., Bak-lanov, A., Guo, H. D., Ding, A., Hansson, H.-C., and Zilitinke-vich, S.: Introduction: The Pan-Eurasian Experiment (PEEX) –multidisciplinary, multiscale and multicomponent research andcapacity-building initiative, Atmos. Chem. Phys., 15, 13085–13096, doi:10.5194/acp-15-13085-2015, 2015.
Lanz, V. A., Alfarra, M. R., Baltensperger, U., Buchmann, B.,Hueglin, C., and Prévôt, A. S. H.: Source apportionment of sub-micron organic aerosols at an urban site by factor analytical mod-elling of aerosol mass spectra, Atmos. Chem. Phys., 7, 1503–1522, doi:10.5194/acp-7-1503-2007, 2007.
Laskin, A., Smith, J. S., and Laskin, J.: Molecular characterizationof nitrogen-containing organic compounds in biomass burningaerosols using high-resolution mass spectrometry, Environ. Sci.Technol., 43, 3764–3771, doi:10.1021/es803456n, 2009.
Lelieveld, J., Evans, J. S., Fnais, M., Giannadaki, D., and Pozzer,A.: The contribution of outdoor air pollution sources to pre-mature mortality on a global scale, Nature, 525, 367–371,doi:10.1038/nature15371, 2015.
Li, P., Yan, R., Yu, S., Wang, S., Liu, W., and Bao, H.: Rein-state regional transport of PM2.5 as a major cause of severehaze in Beijing, P. Natl. Acad. Sci. USA, 112, E2739–E2740,doi:10.1073/pnas.1502596112, 2015.
Liang, X., Zou, T., Guo, B., Li, S., Zhang, H., Zhang, S., Huang, H.,and Chen, S. X.: Assessing Beijing’s PM2.5 pollution: severity,weather impact, APEC and winter heating, P. Roy. Soc. A-Math.Phy., 471, 20150257, doi:10.1098/rspa.2015.0257, 2015.
Lin, G., Sillman, S., Penner, J. E., and Ito, A.: Global modeling ofSOA: the use of different mechanisms for aqueous-phase forma-tion, Atmos. Chem. Phys., 14, 5451–5475, doi:10.5194/acp-14-5451-2014, 2014.
Liu, X. G., Li, J., Qu, Y., Han, T., Hou, L., Gu, J., Chen, C., Yang,Y., Liu, X., Yang, T., Zhang, Y., Tian, H., and Hu, M.: Formationand evolution mechanism of regional haze: a case study in themegacity Beijing, China, Atmos. Chem. Phys., 13, 4501–4514,doi:10.5194/acp-13-4501-2013, 2013.
Liu, Z., Hu, B., Wang, L., Wu, F., Gao, W., and Wang, Y.: Seasonaland diurnal variation in particulate matter (PM10 and PM2.5)at an urban site of Beijing: analyses from a 9-year study, Envi-ron. Sci. Pollut. R., 22, 627–642, doi:10.1007/s11356-014-3347-0, 2015.
Madaniyazi, L., Nagashima, T., Guo, Y., Yu, W., and Tong,S.: Projecting Fine Particulate Matter-Related Mortalityin East China, Environ. Sci. Technol., 49, 11141–11150,doi:10.1021/acs.est.5b01478, 2015.
Matthew, B. M., Middlebrook, A. M., and Onasch, T. B.: Collec-tion efficiencies in an Aerodyne Aerosol Mass Spectrometer asa function of particle phase for paboratory generated aerosols,Aerosol Sci. Tech., 42, 884–898, 2008.
Middlebrook, A. M., Bahreini, R., Jimenez, J. L., and Canagaratna,M. R.: Evaluation of composition-dependent collection efficien-cies for the Aerodyne Aerosol Mass Spectrometer using fielddata, Aerosol Sci. Tech., 46, 258–271, 2012.
Mohr, C., Huffman, J. A., Cubison, M. J., Aiken, A. C., Docherty,K. S., Kimmel, J. R., Ulbrich, I. M., Hannigan, M., and Jimenez,J. L.: Characterization of primary organic aerosol emissions frommeat cooking, trash burning, and motor vehicles with High-Resolution Aerosol Mass Spectrometry and comparison with
www.atmos-chem-phys.net/16/8309/2016/ Atmos. Chem. Phys., 16, 8309–8329, 2016

8328 Y. Sun et al.: Primary and secondary aerosols in Beijing in winter
ambient and chamber observations, Environ. Sci. Technol., 43,2443–2449, doi:10.1021/es8011518, 2009.
Mohr, C., DeCarlo, P. F., Heringa, M. F., Chirico, R., Slowik, J.G., Richter, R., Reche, C., Alastuey, A., Querol, X., Seco, R.,Peñuelas, J., Jiménez, J. L., Crippa, M., Zimmermann, R., Bal-tensperger, U., and Prévôt, A. S. H.: Identification and quan-tification of organic aerosol from cooking and other sources inBarcelona using aerosol mass spectrometer data, Atmos. Chem.Phys., 12, 1649–1665, doi:10.5194/acp-12-1649-2012, 2012.
Nenes, A., Pandis, S. N., and Pilinis, C.: ISORROPIA: A new ther-modynamic equilibrium model for multiphase multicomponentinorganic aerosols, Aquat. Geochem., 4, 123–152, 1998.
Ng, N. L., Canagaratna, M. R., Jimenez, J. L., Zhang, Q., Ul-brich, I. M., and Worsnop, D. R.: Real-time methods for es-timating organic component mass concentrations from AerosolMass Spectrometer data, Environ. Sci. Technol., 45, 910–916,doi:10.1021/es102951k, 2011.
Okuda, T., Naoi, D., Tenmoku, M., Tanaka, S., He, K., Ma, Y.,Yang, F., Lei, Y., Jia, Y., and Zhang, D.: Polycyclic aromatic hy-drocarbons (PAHs) in the aerosol in Beijing, China, measuredby aminopropylsilane chemically-bonded stationary-phase col-umn chromatography and HPLC/fluorescence detection, Chemo-sphere, 65, 427–435, 2006.
Paatero, P. and Tapper, U.: Positive matrix factorization: A non-negative factor model with optimal utilization of error estimatesof data values, Environmetrics, 5, 111–126, 1994.
Petäjä, T., Järvi, L., Kerminen, V. M., Ding, A. J., Sun, J. N.,Nie, W., Kujansuu, J., Virkkula, A., Yang, X., Fu, C. B., Zil-itinkevich, S., and Kulmala, M.: Enhanced air pollution viaaerosol-boundary layer feedback in China, Sci. Rep., 6, 18998,doi:10.1038/srep18998, 2016.
Quan, J., Liu, Q., Li, X., Gao, Y., Jia, X., Sheng, J., and Liu, Y.: Ef-fect of heterogeneous aqueous reactions on the secondary forma-tion of inorganic aerosols during haze events, Atmos. Environ.,122, 306–312, 2015.
Simoneit, B. R. T.: Biomass burning – a review of organic tracers forsmoke from incomplete combustion, Appl. Geochem., 17, 129–162, 2002.
Stein, A. F., Draxler, R. R., Rolph, G. D., Stunder, B. J. B., Cohen,M. D., and Ngan, F.: NOAA’s HYSPLIT Atmospheric Transportand Dispersion Modeling System, B. Am. Meteorol. Soc., 96,2059–2077, doi:10.1175/BAMS-D-14-00110.1, 2015.
Sueper, D.: ToF-AMS Analysis Software, available at:http://cires.colorado.edu/jimenez-group/ToFAMSResources/ToFSoftware/index.html, last access: 1 December 2014.
Sullivan, A. P., Holden, A. S., Patterson, L. A., McMeeking, G.R., Kreidenweis, S. M., Malm, W. C., Hao, W. M., Wold, C.E., and Collett, J. L., Jr.: A method for smoke marker measure-ments and its potential application for determining the contribu-tion of biomass burning from wildfires and prescribed fires toambient PM2.5 organic carbon, J. Geophys. Res., 113, D22302,doi:10.1029/2008jd010216, 2008.
Sun, J., Zhang, Q., Canagaratna, M. R., Zhang, Y., Ng, N. L.,Sun, Y., Jayne, J. T., Zhang, X., Zhang, X., and Worsnop, D.R.: Highly time- and size-resolved characterization of submicronaerosol particles in Beijing using an Aerodyne Aerosol MassSpectrometer, Atmos. Environ., 44, 131–140, 2010.
Sun, Y. L., Zhang, Q., Anastasio, C., and Sun, J.: Insights into sec-ondary organic aerosol formed via aqueous-phase reactions of
phenolic compounds based on high resolution mass spectrom-etry, Atmos. Chem. Phys., 10, 4809–4822, doi:10.5194/acp-10-4809-2010, 2010.
Sun, Y.-L., Zhang, Q., Schwab, J. J., Demerjian, K. L., Chen, W.-N., Bae, M.-S., Hung, H.-M., Hogrefe, O., Frank, B., Rattigan,O. V., and Lin, Y.-C.: Characterization of the sources and pro-cesses of organic and inorganic aerosols in New York city witha high-resolution time-of-flight aerosol mass apectrometer, At-mos. Chem. Phys., 11, 1581–1602, doi:10.5194/acp-11-1581-2011, 2011.
Sun, Y. L., Wang, Z., Dong, H., Yang, T., Li, J., Pan, X.,Chen, P., and Jayne, J. T.: Characterization of summer or-ganic and inorganic aerosols in Beijing, China with an AerosolChemical Speciation Monitor, Atmos. Environ., 51, 250–259,doi:10.1016/j.atmosenv.2012.01.013, 2012.
Sun, Y. L., Wang, Z., Fu, P., Jiang, Q., Yang, T., Li, J., and Ge,X.: The impact of relative humidity on aerosol composition andevolution processes during wintertime in Beijing, China, Atmos.Environ., 77, 927–934, 2013a.
Sun, Y. L., Wang, Z. F., Fu, P. Q., Yang, T., Jiang, Q., Dong, H. B.,Li, J., and Jia, J. J.: Aerosol composition, sources and processesduring wintertime in Beijing, China, Atmos. Chem. Phys., 13,4577–4592, doi:10.5194/acp-13-4577-2013, 2013b.
Sun, Y. L., Jiang, Q., Wang, Z., Fu, P., Li, J., Yang, T., and Yin,Y.: Investigation of the sources and evolution processes of severehaze pollution in Beijing in January 2013, J. Geophys. Res., 119,4380–4398, doi:10.1002/2014JD021641, 2014.
Sun, Y. L., Wang, Z. F., Du, W., Zhang, Q., Wang, Q. Q., Fu, P.Q., Pan, X. L., Li, J., Jayne, J., and Worsnop, D. R.: Long-term real-time measurements of aerosol particle compositionin Beijing, China: seasonal variations, meteorological effects,and source analysis, Atmos. Chem. Phys., 15, 10149–10165,doi:10.5194/acp-15-10149-2015, 2015.
Sun, Y. L., Wang, Z., Wild, O., Xu, W., Chen, C., Fu, P., Du, W.,Zhou, L., Zhang, Q., Han, T., Wang, Q., Pan, X., Zheng, H., Li,J., Guo, X., Liu, J., and Worsnop, D. R.: “APEC Blue”: Sec-ondary Aerosol Reductions from Emission Controls in Beijing,Sci. Rep., 6, 20668, doi:10.1038/srep20668, 2016.
Tan, Y., Perri, M. J., Seitzinger, S. P., and Turpin, B. J.: Ef-fects of Precursor Concentration and Acidic Sulfate in Aque-ous Glyoxal-OH Radical Oxidation and Implications for Sec-ondary Organic Aerosol, Environ. Sci. Technol., 43, 8105–8112,doi:10.1021/es901742f, 2009.
Tian, S. L., Pan, Y. P., and Wang, Y. S.: Size-resolved sourceapportionment of particulate matter in urban Beijing duringhaze and non-haze episodes, Atmos. Chem. Phys., 16, 1–19,doi:10.5194/acp-16-1-2016, 2016.
Turpin, B. J. and Lim, H. J.: Species contributions to PM2.5 massconcentrations: Revisiting common assumptions for estimatingorganic mass, Aerosol Sci. Tech., 35, 602–610, 2001.
Ulbrich, I. M., Canagaratna, M. R., Zhang, Q., Worsnop, D. R., andJimenez, J. L.: Interpretation of organic components from Posi-tive Matrix Factorization of aerosol mass spectrometric data, At-mos. Chem. Phys., 9, 2891–2918, doi:10.5194/acp-9-2891-2009,2009.
Wang, Q., Sun, Y., Jiang, Q., Du, W., Sun, C., Fu, P., andWang, Z.: Chemical composition of aerosol particles and lightextinction apportionment before and during the heating sea-
Atmos. Chem. Phys., 16, 8309–8329, 2016 www.atmos-chem-phys.net/16/8309/2016/

Y. Sun et al.: Primary and secondary aerosols in Beijing in winter 8329
son in Beijing, China, J. Geophys. Res., 120, 12708–12722,doi:10.1002/2015JD023871, 2015.
Wang, Y., Yao, L., Wang, L., Liu, Z., Ji, D., Tang, G., Zhang, J.,Sun, Y., Hu, B., and Xin, J.: Mechanism for the formation of theJanuary 2013 heavy haze pollution episode over central and east-ern China, Sci. China Earth Sci., 57, 14–25, doi:10.1007/s11430-013-4773-4, 2014.
Wang, Z., Li, J., Wang, Z., Yang, W., Tang, X., Ge, B., Yan, P.,Zhu, L., Chen, X., Chen, H., Wang, W., Li, J., Liu, B., Wang, X.,Wand, W., Zhao, Y., Lu, N., and Su, D.: Modeling study of re-gional severe hazes over mid-eastern China in January 2013 andits implications on pollution prevention and control, Sci. ChinaEarth Sci., 57, 3–13, doi:10.1007/s11430-013-4793-0, 2014.
Xie, Y., Ding, A., Nie, W., Mao, H., Qi, X., Huang, X., Xu, Z., Ker-minen, V.-M., Petäjä, T., Chi, X., Virkkula, A., Boy, M., Xue,L., Guo, J., Sun, J., Yang, X., Kulmala, M., and Fu, C.: En-hanced sulfate formation by nitrogen dioxide: Implications fromin-situ observations at the SORPES Station, J. Geophys. Res.,120, 12679–12694, doi:10.1002/2015JD023607, 2015.
Xu, J., Zhang, Q., Chen, M., Ge, X., Ren, J., and Qin, D.: Chemi-cal composition, sources, and processes of urban aerosols duringsummertime in northwest China: insights from high-resolutionaerosol mass spectrometry, Atmos. Chem. Phys., 14, 12593–12611, doi:10.5194/acp-14-12593-2014, 2014.
Xu, J., Shi, J., Zhang, Q., Ge, X., Canonaco, F., Prévôt, A. S. H.,Vonwiller, M., Szidat, S., Ge, J., Ma, J., An, Y., Kang, S., andQin, D.: Wintertime organic and inorganic aerosols in Lanzhou,China: Sources, processes and comparison with the results dur-ing summer, Atmos. Chem. Phys. Discuss., doi:10.5194/acp-2016-278, in review, 2016.
Xu, W. Q., Sun, Y. L., Chen, C., Du, W., Han, T. T., Wang, Q. Q.,Fu, P. Q., Wang, Z. F., Zhao, X. J., Zhou, L. B., Ji, D. S., Wang,P. C., and Worsnop, D. R.: Aerosol composition, oxidation prop-erties, and sources in Beijing: results from the 2014 Asia-PacificEconomic Cooperation summit study, Atmos. Chem. Phys., 15,13681–13698, doi:10.5194/acp-15-13681-2015, 2015.
Yang, Y. R., Liu, X. G., Qu, Y., An, J. L., Jiang, R., Zhang, Y.H., Sun, Y. L., Wu, Z. J., Zhang, F., Xu, W. Q., and Ma, Q. X.:Characteristics and formation mechanism of continuous hazes inChina: a case study during the autumn of 2014 in the North ChinaPlain, Atmos. Chem. Phys., 15, 8165–8178, doi:10.5194/acp-15-8165-2015, 2015.
Zhang, H., Wang, S., Hao, J., Wang, X., Wang, S., Chai, F., and Li,M.: Air pollution and control action in Beijing, J. Clean. Prod.,112, 1519–1527, 2016.
Zhang, J. K., Sun, Y., Liu, Z. R., Ji, D. S., Hu, B., Liu, Q., and Wang,Y. S.: Characterization of submicron aerosols during a monthof serious pollution in Beijing, 2013, Atmos. Chem. Phys., 14,2887–2903, doi:10.5194/acp-14-2887-2014, 2014.
Zhang, J. K., Ji, D. S., Liu, Z. R., Hu, B., Wang, L. L., Huang, X. J.,and Wang, Y. S.: New characteristics of submicron aerosols andfactor analysis of combined organic and inorganic aerosol massspectra during winter in Beijing, Atmos. Chem. Phys. Discuss.,15, 18537–18576, doi:10.5194/acpd-15-18537-2015, 2015a.
Zhang, J. K., Wang, L. L., Wang, Y. H., and Wang, Y. S.: Submicronaerosols during the Beijing Asia–Pacific Economic Cooperationconference in 2014, Atmos. Environ., 124, 224–231, 2016.
Zhang, Q., Worsnop, D. R., Canagaratna, M. R., and Jimenez, J.L.: Hydrocarbon-like and oxygenated organic aerosols in Pitts-burgh: insights into sources and processes of organic aerosols,Atmos. Chem. Phys., 5, 3289–3311, doi:10.5194/acp-5-3289-2005, 2005.
Zhang, Q., Jimenez, J. L., Worsnop, D. R., and Canagaratna, M.: Acase study of urban particle acidity and its effect on secondaryorganic aerosol, Environ. Sci. Technol., 41, 3213–3219, 2007.
Zhang, Q., Jimenez, J., Canagaratna, M., Ulbrich, I., Ng, N.,Worsnop, D., and Sun, Y.: Understanding atmospheric or-ganic aerosols via factor analysis of aerosol mass spec-trometry: a review, Anal. Bioanal. Chem., 401, 3045–3067,doi:10.1007/s00216-011-5355-y, 2011.
Zhang, Q., He, K., and Huo, H.: Policy: Cleaning China’s air, Na-ture, 484, 161–162, 2012.
Zhang, R., Jing, J., Tao, J., Hsu, S.-C., Wang, G., Cao, J., Lee,C. S. L., Zhu, L., Chen, Z., Zhao, Y., and Shen, Z.: Chemi-cal characterization and source apportionment of PM2.5 in Bei-jing: seasonal perspective, Atmos. Chem. Phys., 13, 7053–7074,doi:10.5194/acp-13-7053-2013, 2013.
Zhang, Y., Schauer, J. J., Zhang, Y., Zeng, L., Wei, Y., Liu, Y., andShao, M.: Characteristics of particulate carbon emissions fromreal-world Chinese coal combustion, Environ. Sci. Technol., 42,5068–5073, 2008.
Zhao, B., Wang, S. X., Liu, H., Xu, J. Y., Fu, K., Klimont, Z., Hao,J. M., He, K. B., Cofala, J., and Amann, M.: NOx emissions inChina: historical trends and future perspectives, Atmos. Chem.Phys., 13, 9869–9897, doi:10.5194/acp-13-9869-2013, 2013.
Zhao, X. J., Zhao, P. S., Xu, J., Meng„ W., Pu, W. W., Dong, F., He,D., and Shi, Q. F.: Analysis of a winter regional haze event andits formation mechanism in the North China Plain, Atmos. Chem.Phys., 13, 5685–5696, doi:10.5194/acp-13-5685-2013, 2013.
Zhao, Y., Hu, M., Slanina, S., and Zhang, Y.: ChemicalCompositions of Fine Particulate Organic Matter Emittedfrom Chinese Cooking, Environ. Sci. Technol., 41, 99–105,doi:10.1021/es0614518, 2006.
Zheng, G. J., Duan, F. K., Su, H., Ma, Y. L., Cheng, Y., Zheng,B., Zhang, Q., Huang, T., Kimoto, T., Chang, D., Pöschl, U.,Cheng, Y. F., and He, K. B.: Exploring the severe winter haze inBeijing: the impact of synoptic weather, regional transport andheterogeneous reactions, Atmos. Chem. Phys., 15, 2969–2983,doi:10.5194/acp-15-2969-2015, 2015.
Zheng, M., Salmon, L. G., Schauer, J. J., Zeng, L., Kiang, C. S.,Zhang, Y., and Cass, G. R.: Seasonal trends in PM2.5 source con-tributions in Beijing, China, Atmos. Environ., 39, 3967–3976,doi:10.1016/j.atmosenv.2005.03.036, 2005.
Zhou, W., Jiang, J., Duan, L., and Hao, J.: Evolution of submicronorganic aerosols during a complete residential coal combustionprocess, Environ. Sci. Technol., doi:10.1021/acs.est.6b00075,online first, 2016.
Zorn, S. R., Drewnick, F., Schott, M., Hoffmann, T., and Bor-rmann, S.: Characterization of the South Atlantic marine bound-ary layer aerosol using an aerodyne aerosol mass spectrometer,Atmos. Chem. Phys., 8, 4711–4728, doi:10.5194/acp-8-4711-2008, 2008.
www.atmos-chem-phys.net/16/8309/2016/ Atmos. Chem. Phys., 16, 8309–8329, 2016