primary author: scherrer, simon c. (meteoswiss - federal ... · primary author: scherrer, simon c....
TRANSCRIPT
Primary author: Scherrer, Simon C. (MeteoSwiss - Federal Office of Meteorology and Climatology, Climate Services), [email protected] Co-authors: Deborah van Geijtenbeek, Claudine Naguel, Mischa Croci-Maspoli and Christof Appenzeller (MeteoSwiss - Federal Office of Meteorology and Climatology, Climate Services) Abstract ID: 4O4 Towards semi-automation of manual precipitation data quality control at MeteoSwiss using spatial information At MeteoSwiss several automatic data quality control systems for automated data are operational and incorporated into our data warehouse system (DWH) for several years now. They allow treating automatically retrieved data at high temporal resolution (usually 10 minute) with a high degree of automation using a graphical user interface for interactive correction of data (see companion paper by van Geijtenbeek et al.). A few surface measurement networks, such as the manual precipitation network with ~330 stations retrieving 1-day precipitation sums are still treated manually and create a substantial workload which should be reduced. We present a semi-automatic approach that incorporates automatic spatial interpolation and empirical thresholds to flag suspicious values which are then evaluated by expert knowledge. It is shown that although there are several problems with the interpolation in the high Alpine terrain due to spatial density of the network, the manual workload can be reduced substantially by the new tool. In the lowlands the method is very reliable. In more complex terrain, such as the Swiss Alps, or convective cases, expert knowledge, using additional local information about the station, is still very helpful to decide whether an automatically identified suspicious value is indeed wrong and needs to be corrected. Therefore a fully automated data quality control is not recommended especially as long as the measurements are not fully automated and difficult to detect shifts, i.e. wrong allocations of date to a measurement, can occur. There are several applications of the above tool such as the testing of historical data, e.g. to find “potential” values that are saved as 1-day sum but are several day-sums in reality. Finding and removing these wrong record values can be crucial for a proper extreme value analysis. Further refinement of the interpolation method (especially for sparse measurement networks) and testing of less empirically based flagging thresholds are planned in the future.
Federal Departement of Home Affairs FDHAFederal Office of Meteorology and Climatology MeteoSwiss
Simon C. Scherrer, D van Geijtenbeek, C Naguel, M Croci-Maspoli and C AppenzellerClimate Services, Swiss Federal of Office of Meteorology and Climatology MeteoSwiss
5 November 20097th ECSN Data Management Workshop 2009, DMI Copenhagen
Towards semi-automation of manual precipitation data quality control at MeteoSwiss using spatial information
2Towards semi-automation of manual precipitation DQC | 7th DQM workshop, 5 November 2009, Copenhagen [email protected]
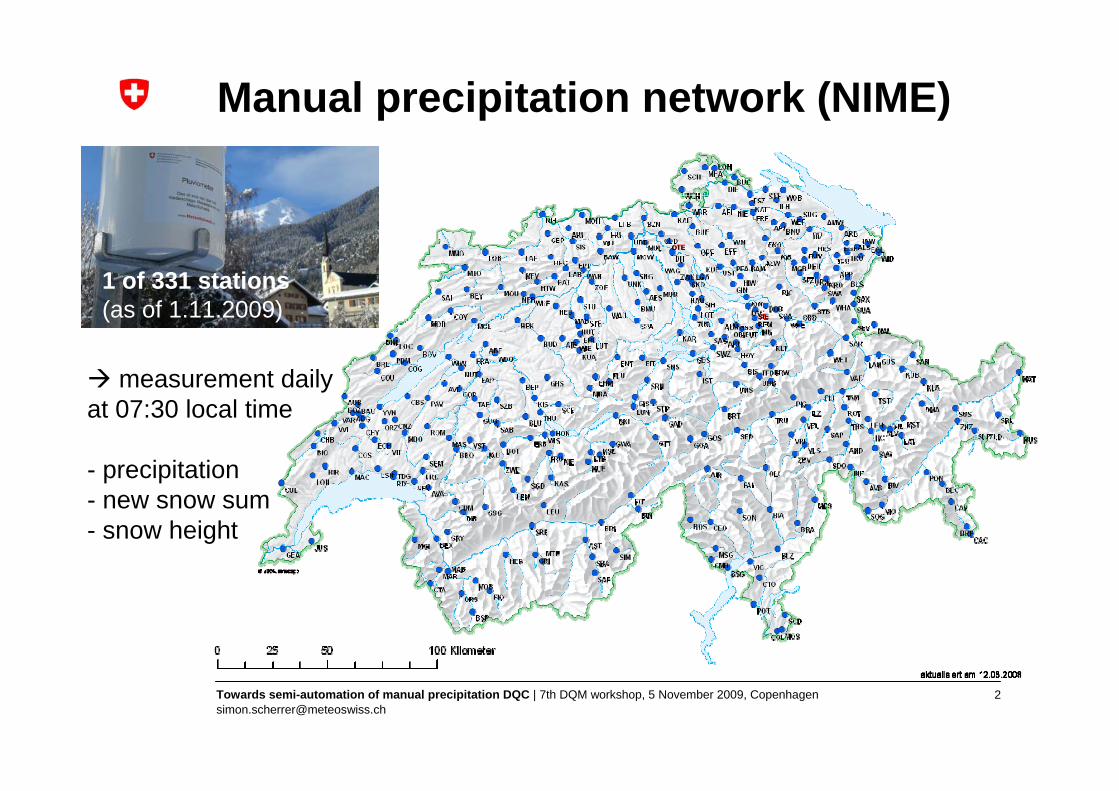
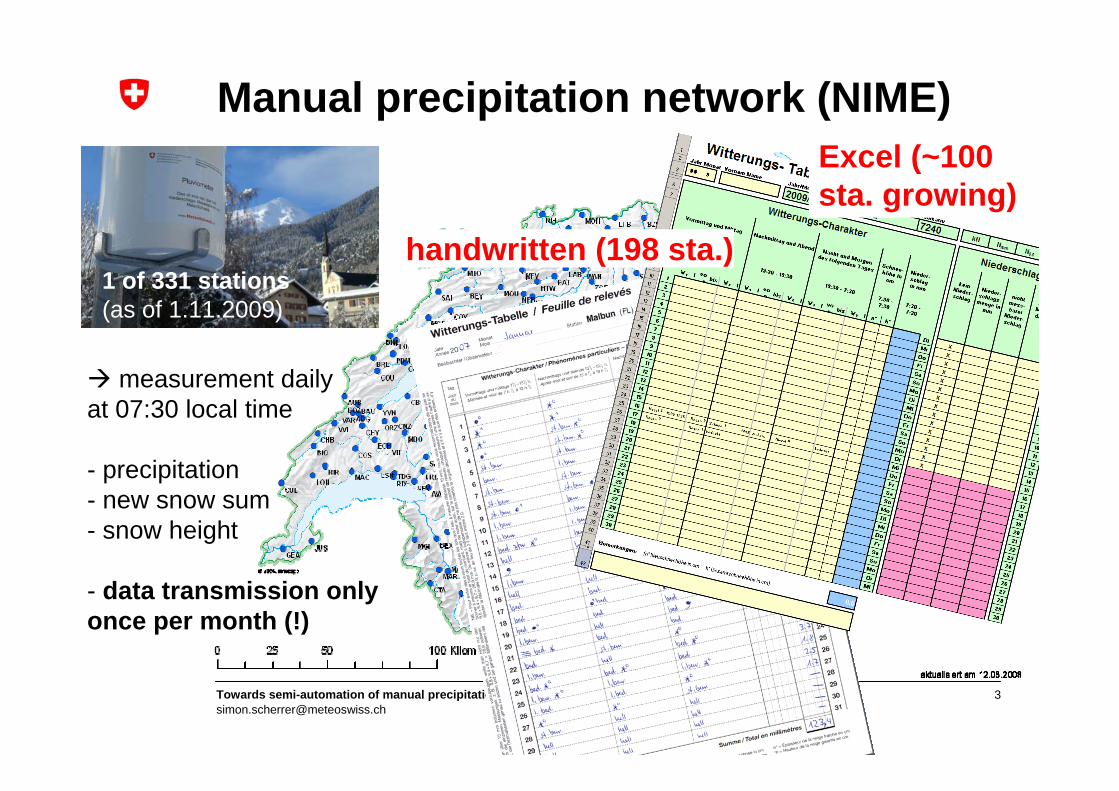
Manual precipitation network (NIME)
1 of 331 stations(as of 1.11.2009)
OTE
SIE
measurement dailyat 07:30 local time
- precipitation- new snow sum- snow height
3Towards semi-automation of manual precipitation DQC | 7th DQM workshop, 5 November 2009, Copenhagen [email protected]
Manual precipitation network (NIME)
1 of 331 stations(as of 1.11.2009)
OTE
SIE
measurement dailyat 07:30 local time
- precipitation- new snow sum- snow height
- data transmission onlyonce per month (!)
handwritten (198 sta.)
Excel (~100 sta. growing)
4Towards semi-automation of manual precipitation DQC | 7th DQM workshop, 5 November 2009, Copenhagen [email protected]
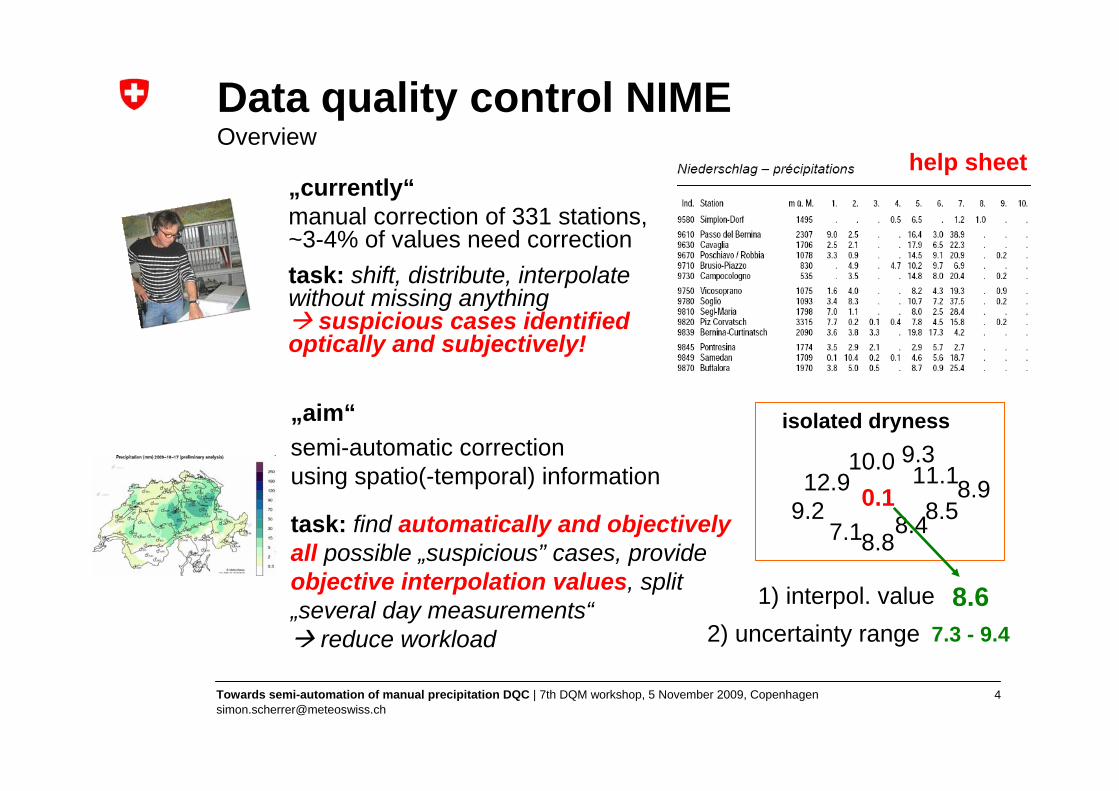
Data quality control NIMEOverview
„currently“manual correction of 331 stations,~3-4% of values need correctiontask: shift, distribute, interpolatewithout missing anything
suspicious cases identified optically and subjectively!
„aim“semi-automatic correctionusing spatio(-temporal) information
task: find automatically and objectively all possible „suspicious” cases, provide objective interpolation values, split „several day measurements“
reduce workload
12.910.0
9.2
9.3
8.88.5
11.1
7.1 8.48.90.1
isolated dryness
help sheet
8.61) interpol. value2) uncertainty range 7.3 - 9.4
5Towards semi-automation of manual precipitation DQC | 7th DQM workshop, 5 November 2009, Copenhagen [email protected]
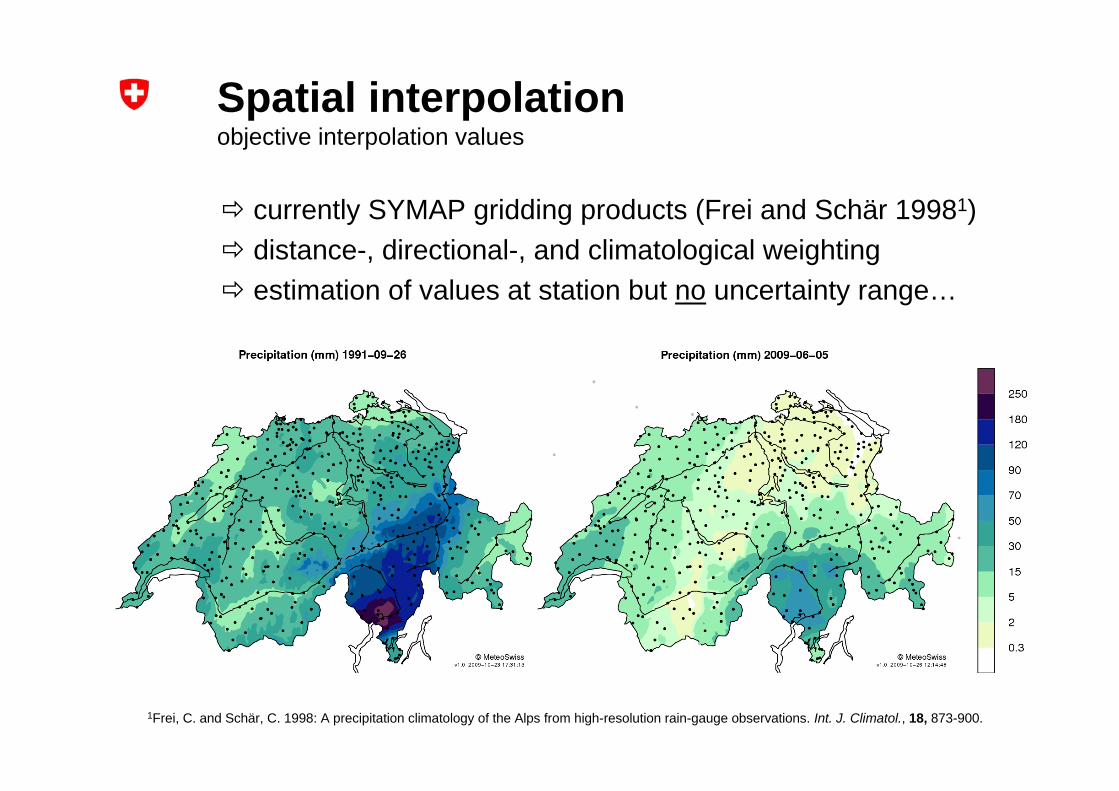
Spatial interpolation objective interpolation values
currently SYMAP gridding products (Frei and Schär 19981)distance-, directional-, and climatological weightingestimation of values at station but no uncertainty range…
1Frei, C. and Schär, C. 1998: A precipitation climatology of the Alps from high-resolution rain-gauge observations. Int. J. Climatol., 18, 873-900.
6Towards semi-automation of manual precipitation DQC | 7th DQM workshop, 5 November 2009, Copenhagen [email protected]
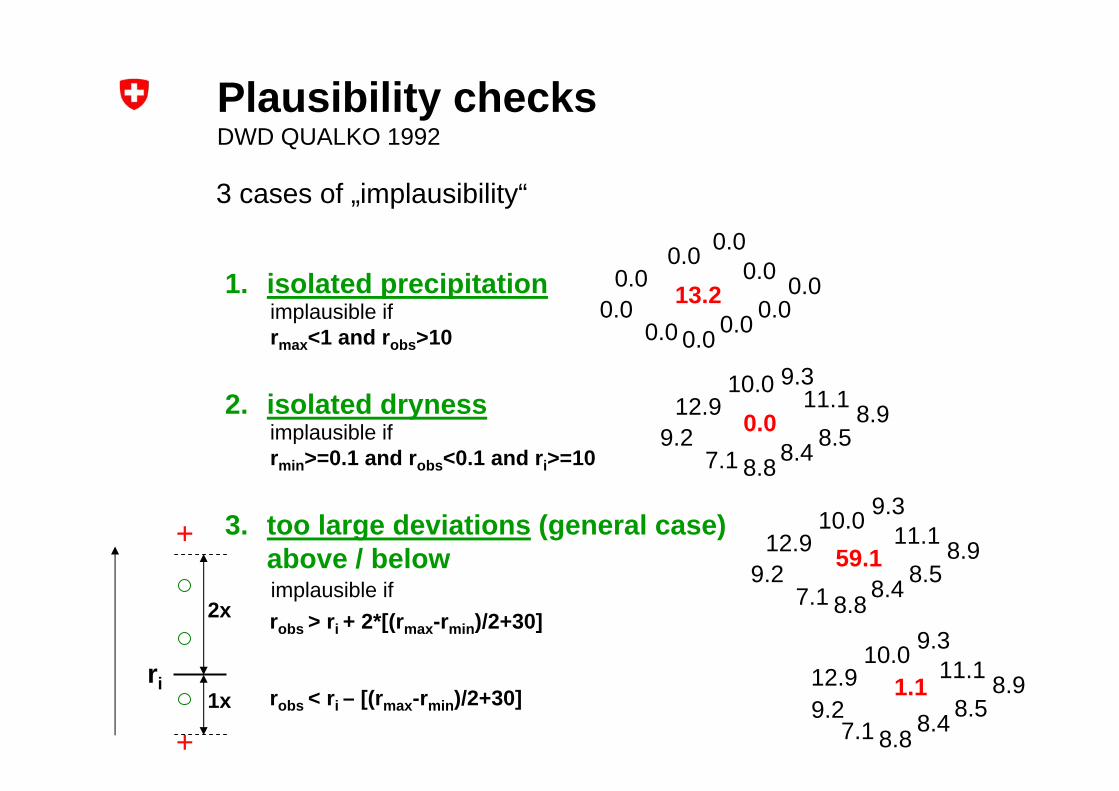
implausible ifrobs > ri + 2*[(rmax-rmin)/2+30]
robs < ri – [(rmax-rmin)/2+30]
implausible ifrmin>=0.1 and robs<0.1 and ri>=10
implausible if rmax<1 and robs>10
3 cases of „implausibility“
1. isolated precipitation
2. isolated dryness
3. too large deviations (general case) above / below
Plausibility checksDWD QUALKO 1992
0.00.0
0.0
0.0
0.00.0
0.0
0.0 0.00.013.2
12.910.0
9.2
9.3
8.88.5
11.1
7.1 8.48.90.0
12.910.0
9.2
9.3
8.88.5
11.1
7.1 8.48.959.1
12.910.0 9.3
8.88.5
11.1
7.1 8.48.91.1ri
+
+
9.2
2x
1x
7Towards semi-automation of manual precipitation DQC | 7th DQM workshop, 5 November 2009, Copenhagen [email protected]
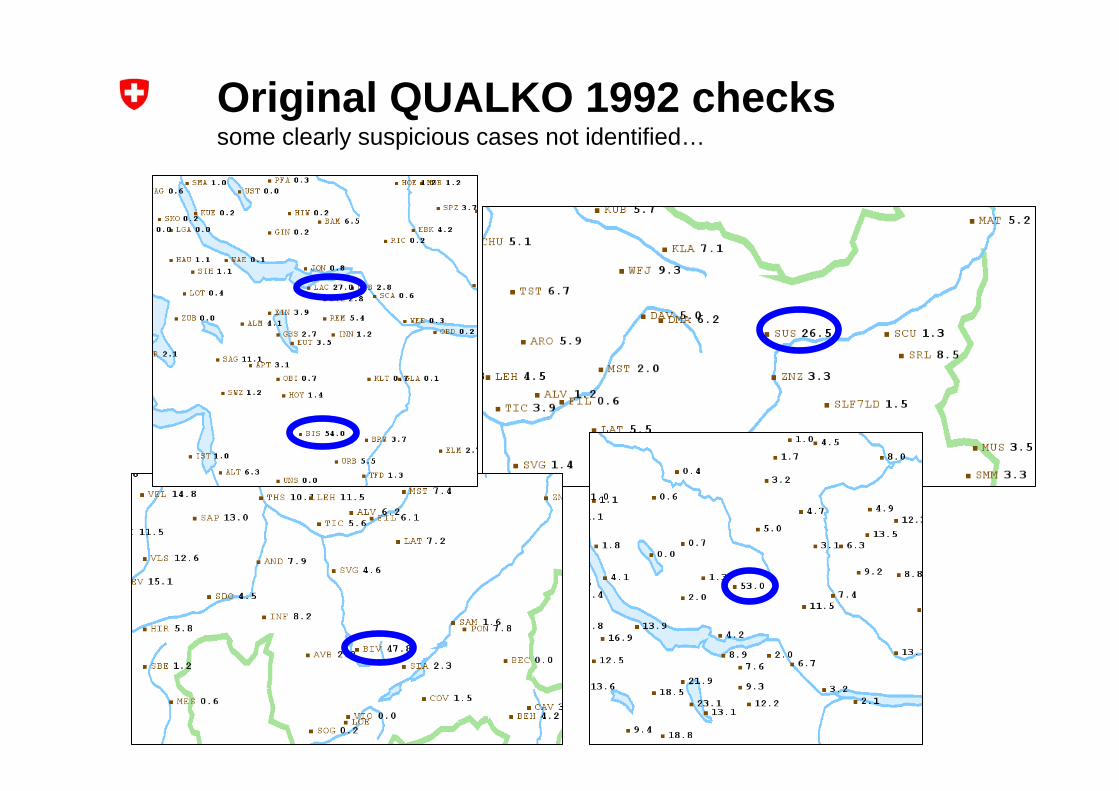
Original QUALKO 1992 checkssome clearly suspicious cases not identified…
8Towards semi-automation of manual precipitation DQC | 7th DQM workshop, 5 November 2009, Copenhagen [email protected]
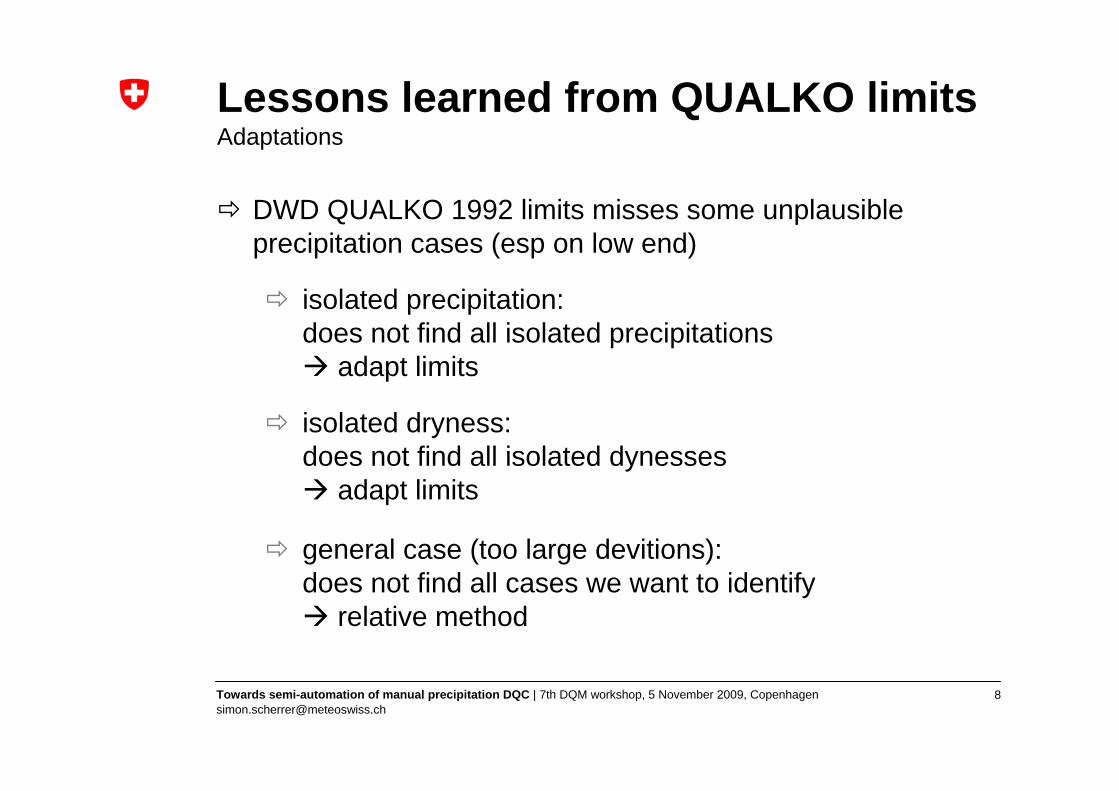
Lessons learned from QUALKO limitsAdaptations
DWD QUALKO 1992 limits misses some unplausible precipitation cases (esp on low end)
isolated precipitation:does not find all isolated precipitations
adapt limits
isolated dryness: does not find all isolated dynesses
adapt limits
general case (too large devitions):does not find all cases we want to identify
relative method
9Towards semi-automation of manual precipitation DQC | 7th DQM workshop, 5 November 2009, Copenhagen [email protected]
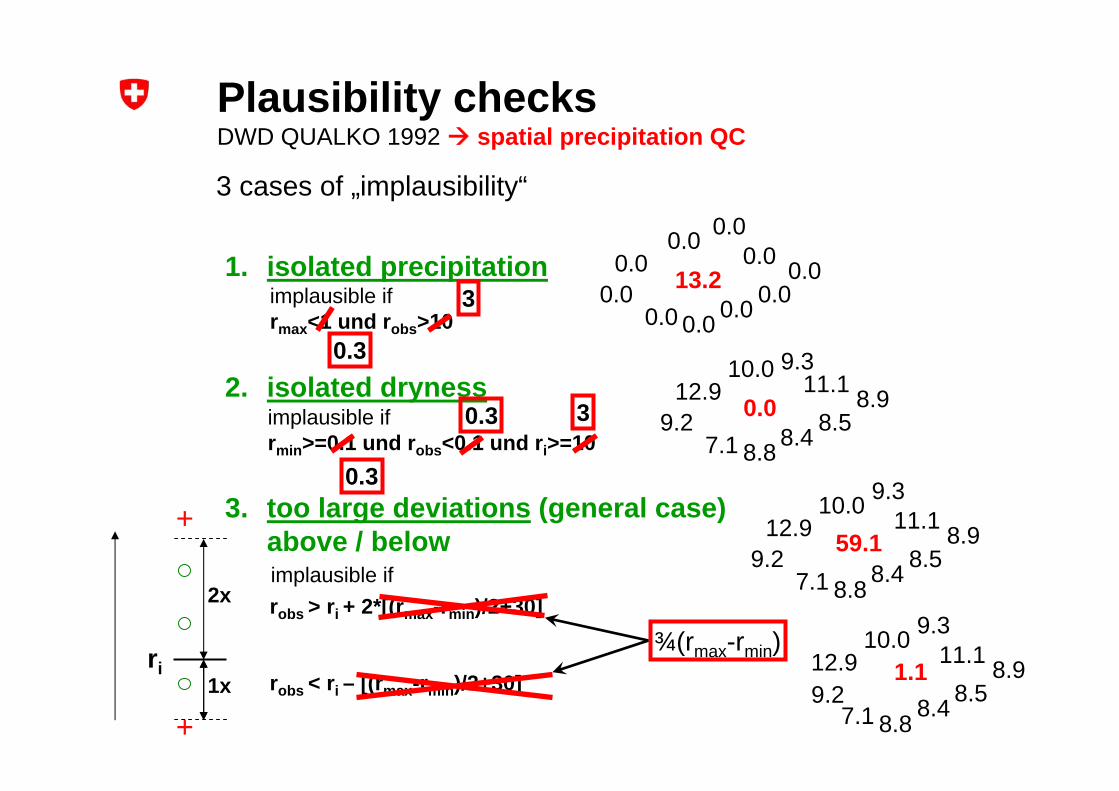
implausible ifrobs > ri + 2*[(rmax-rmin)/2+30]
robs < ri – [(rmax-rmin)/2+30]
implausible ifrmin>=0.1 und robs<0.1 und ri>=10
implausible ifrmax<1 und robs>10
3 cases of „implausibility“
1. isolated precipitation
2. isolated dryness
3. too large deviations (general case) above / below
Plausibility checksDWD QUALKO 1992 spatial precipitation QC
0.3
3
0.3 3
0.3
0.00.0
0.0
0.0
0.00.0
0.0
0.0 0.00.013.2
12.910.0
9.2
9.3
8.88.5
11.1
7.1 8.48.90.0
12.910.0
9.2
9.3
8.88.5
11.1
7.1 8.48.959.1
12.910.0 9.3
8.88.5
11.1
7.1 8.48.91.1ri
+
+
9.2
¾(rmax-rmin)
2x
1x
10Towards semi-automation of manual precipitation DQC | 7th DQM workshop, 5 November 2009, Copenhagen [email protected]
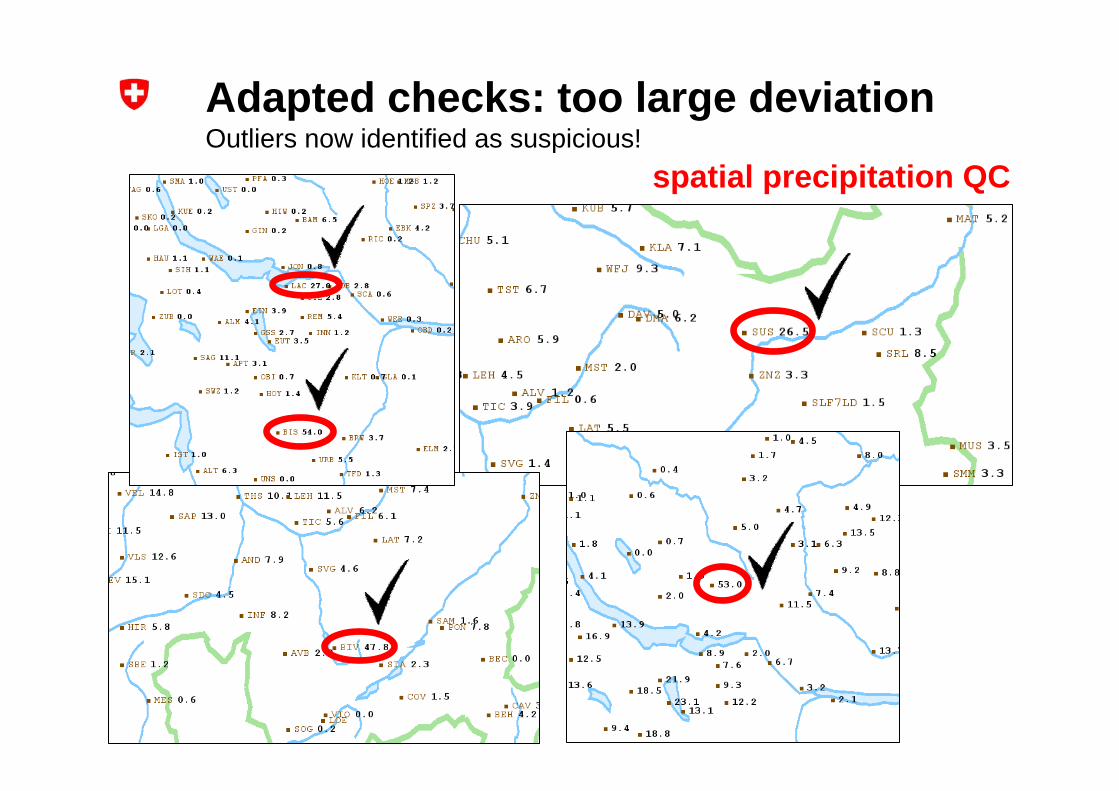
Adapted checks: too large deviationOutliers now identified as suspicious!
spatial precipitation QC
11Towards semi-automation of manual precipitation DQC | 7th DQM workshop, 5 November 2009, Copenhagen [email protected]
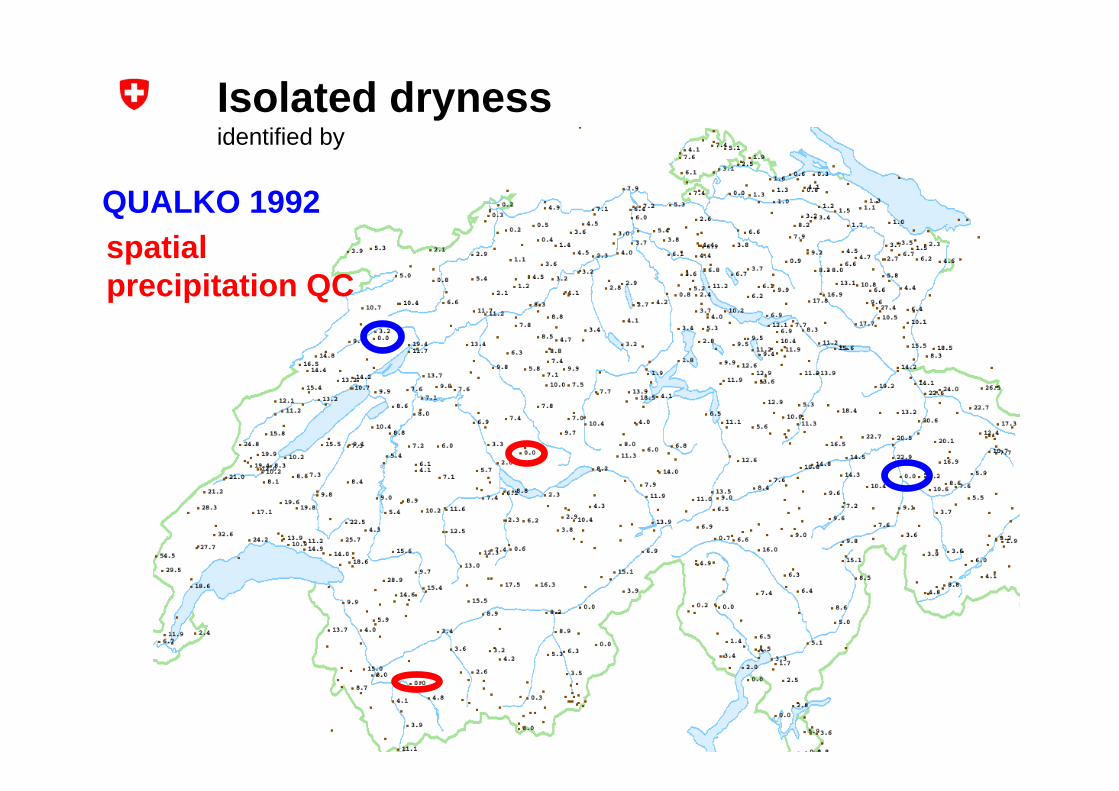
QUALKO 1992
Isolated drynessidentified by
spatialprecipitation QC
12Towards semi-automation of manual precipitation DQC | 7th DQM workshop, 5 November 2009, Copenhagen [email protected]
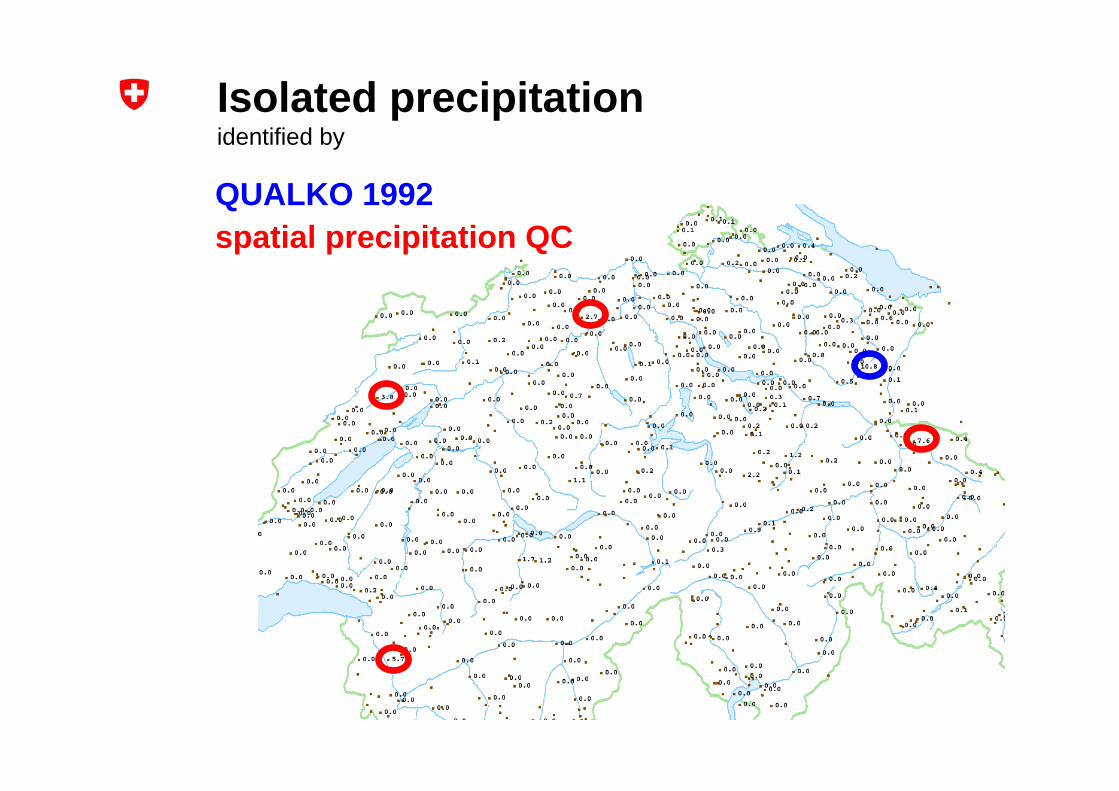
Isolated precipitationidentified by
QUALKO 1992spatial precipitation QC
13Towards semi-automation of manual precipitation DQC | 7th DQM workshop, 5 November 2009, Copenhagen [email protected]
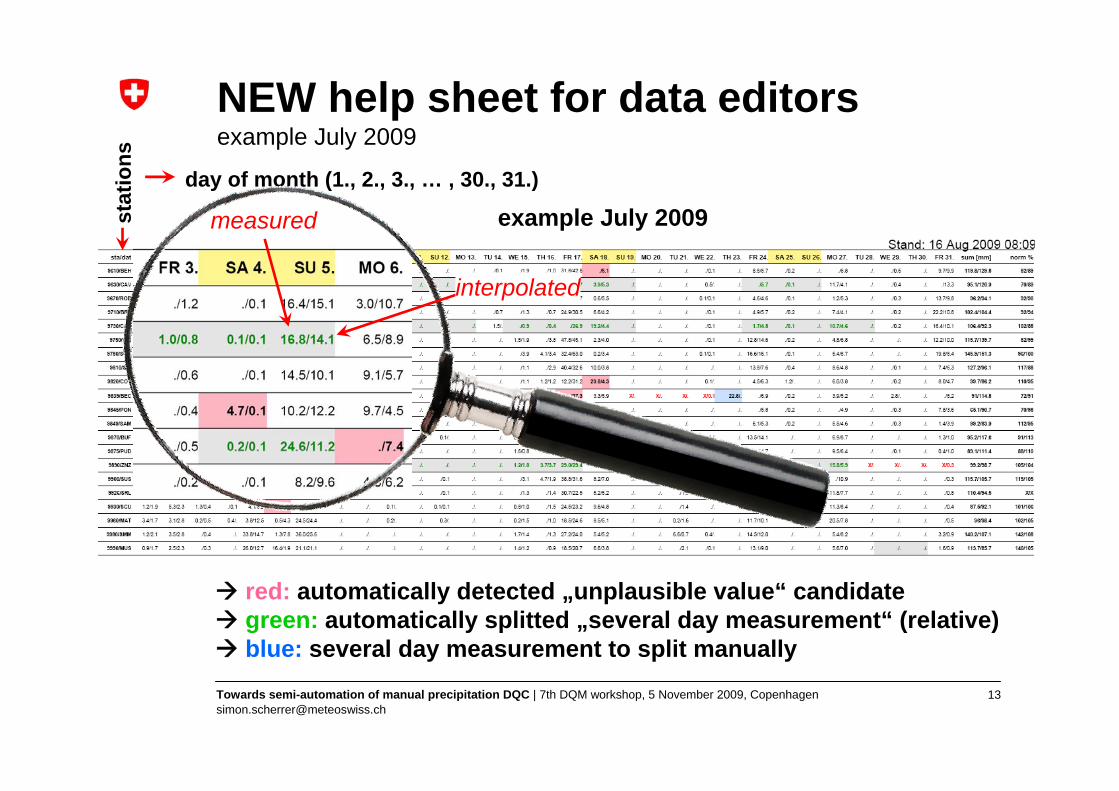
NEW help sheet for data editorsexample July 2009
stat
ions
day of month (1., 2., 3., … , 30., 31.)
red: automatically detected „unplausible value“ candidategreen: automatically splitted „several day measurement“ (relative)blue: several day measurement to split manually
example July 2009measured
interpolated
14Towards semi-automation of manual precipitation DQC | 7th DQM workshop, 5 November 2009, Copenhagen [email protected]
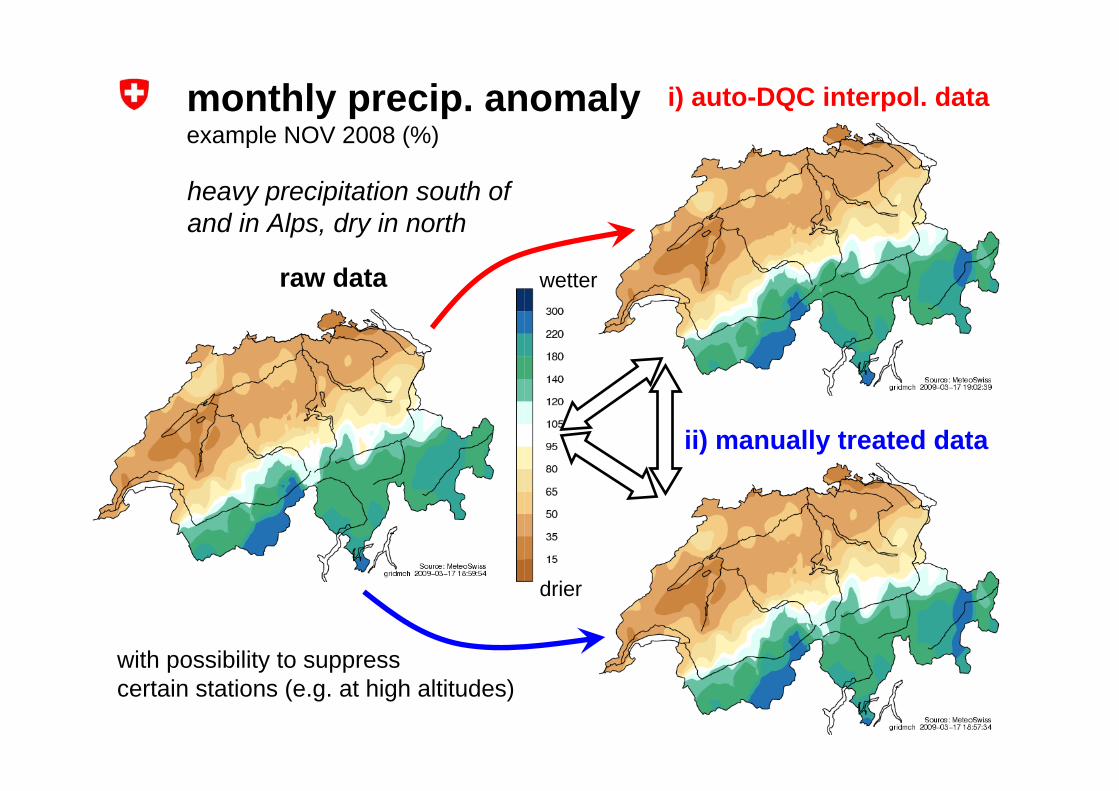
ii) manually treated data
raw data
drier
wetter
with possibility to suppresscertain stations (e.g. at high altitudes)
i) auto-DQC interpol. data
heavy precipitation south of and in Alps, dry in north
monthly precip. anomalyexample NOV 2008 (%)
15Towards semi-automation of manual precipitation DQC | 7th DQM workshop, 5 November 2009, Copenhagen [email protected]
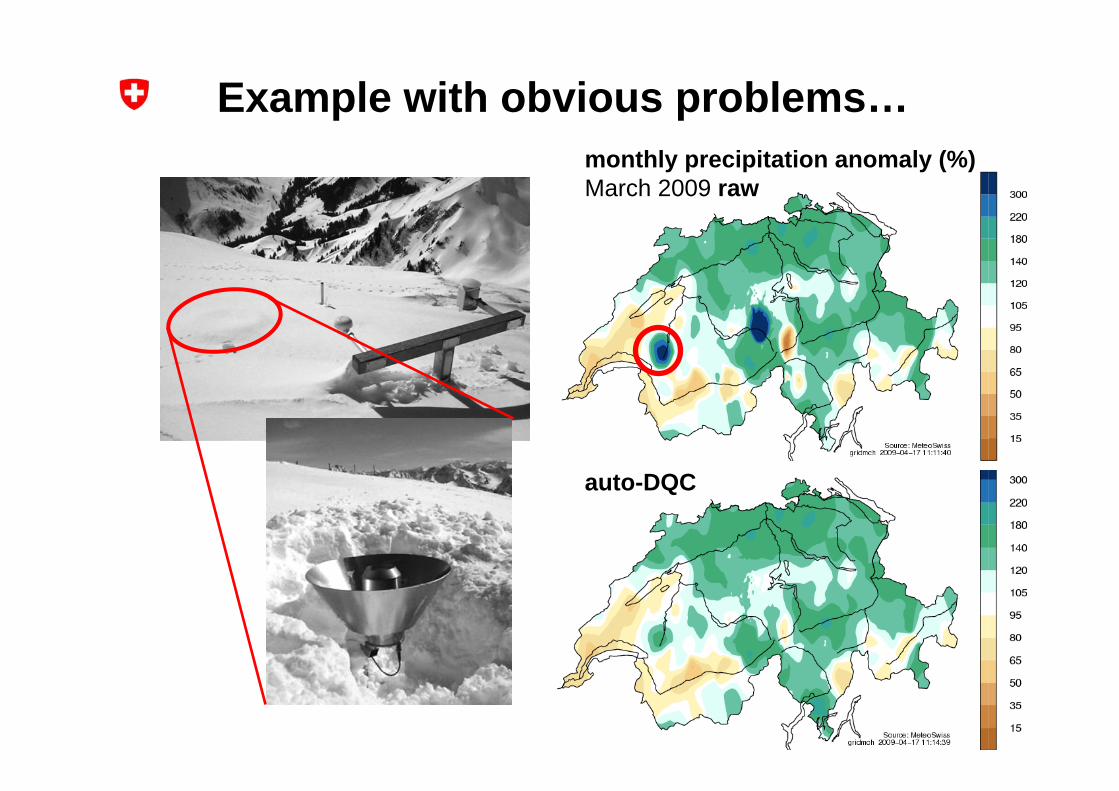
Example with obvious problems…monthly precipitation anomaly (%)March 2009 raw
auto-DQC
16Towards semi-automation of manual precipitation DQC | 7th DQM workshop, 5 November 2009, Copenhagen [email protected]
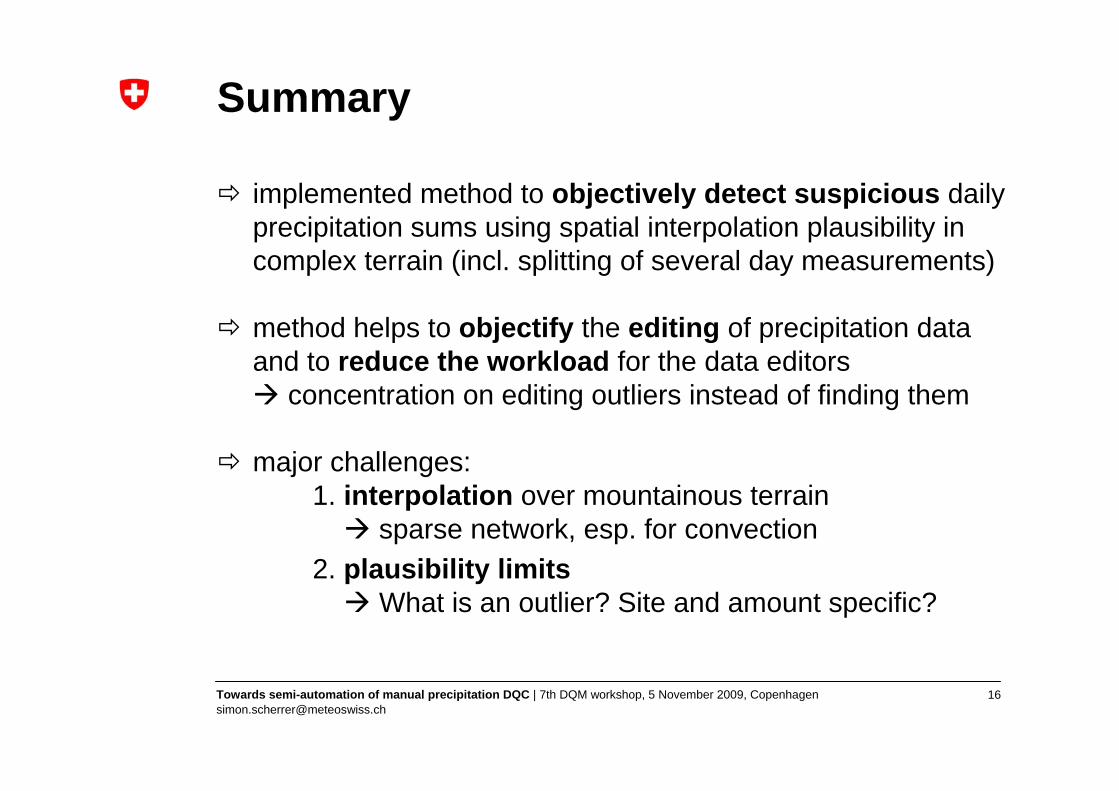
Summary
implemented method to objectively detect suspicious daily precipitation sums using spatial interpolation plausibility in complex terrain (incl. splitting of several day measurements)
method helps to objectify the editing of precipitation data and to reduce the workload for the data editors
concentration on editing outliers instead of finding them
major challenges:1. interpolation over mountainous terrain
sparse network, esp. for convection2. plausibility limits
What is an outlier? Site and amount specific?

17Towards semi-automation of manual precipitation DQC | 7th DQM workshop, 5 November 2009, Copenhagen [email protected]
Challenge: interpolation (I)SYMAP mean absolute error (MAE) and mean relative error (MRE)
20.413.3>5022.28.230-5021.05.120-3025.13.610-2033.12.45-1045.61.83-570.91.41-31310.970.5-11900.760.3-0.53600.54<0.3
MRE[%]
MAE[mm]
precip[mm]
year 2007(2005/2006 similar)
for values< ~2 mm:
mean error larger than
measurement!
~20%
18Towards semi-automation of manual precipitation DQC | 7th DQM workshop, 5 November 2009, Copenhagen [email protected]
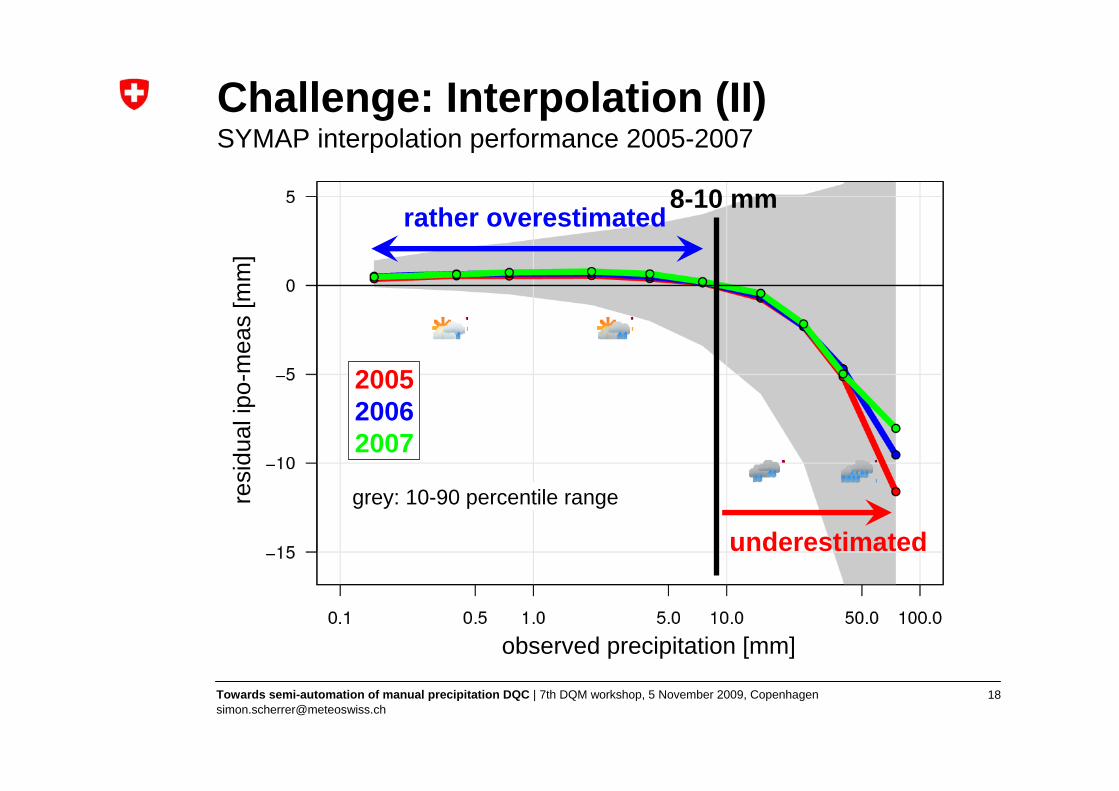
Challenge: Interpolation (II) SYMAP interpolation performance 2005-2007
observed precipitation [mm]
resi
dual
ipo-
mea
s [m
m]
200520062007
8-10 mm
underestimated
rather overestimated
grey: 10-90 percentile range
19Towards semi-automation of manual precipitation DQC | 7th DQM workshop, 5 November 2009, Copenhagen [email protected]
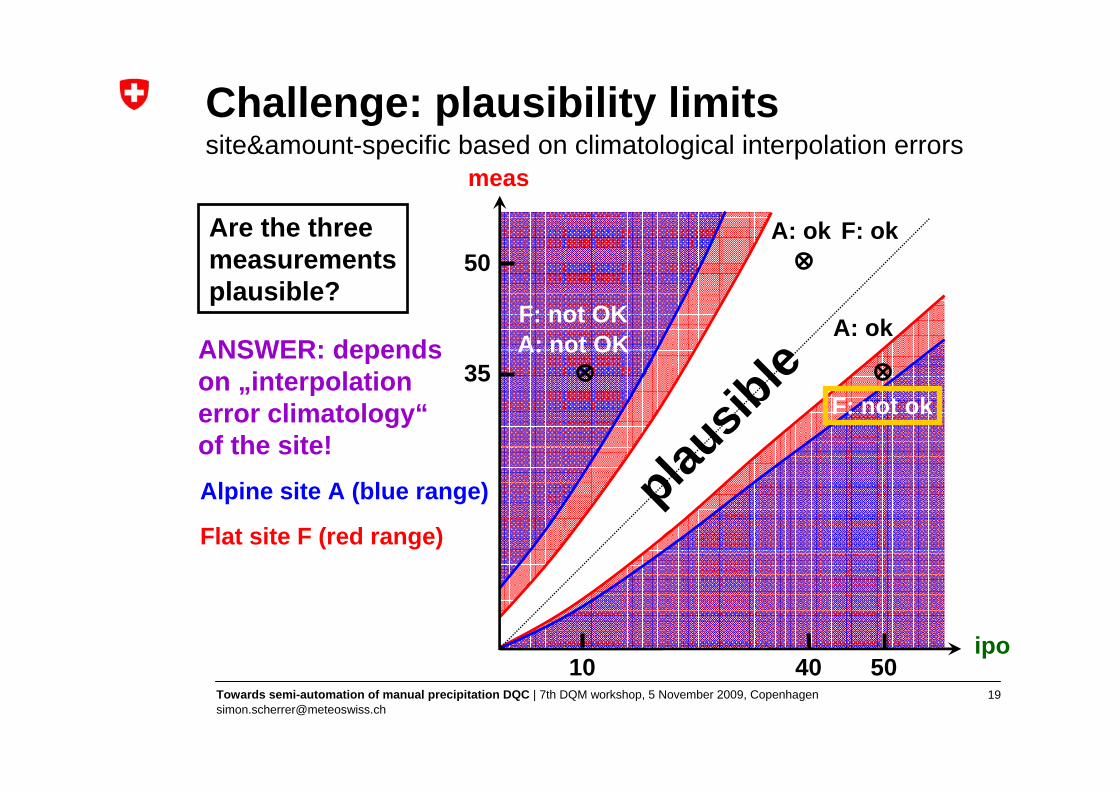
Challenge: plausibility limitssite&amount-specific based on climatological interpolation errors
Alpine site A (blue range) plausib
le
A: ok50
40
A: ok
50
A: not OK35
10
meas
ipo
Flat site F (red range)
F: ok
F: not OK
F: not ok
Are the three measurementsplausible?
ANSWER: dependson „interpolationerror climatology“of the site!
20Towards semi-automation of manual precipitation DQC | 7th DQM workshop, 5 November 2009, Copenhagen [email protected]
Outlook
measurements / data transmissionmanual precipitation measurements will go ondaily data transmission via SMS/phone (~200 stations)automation of >100 stations or certification of partner sites
enhanced interpolationreduced space optimal interpolation (RSOI) ie use of spacio-temporal information (Schiemann et al. 2009)combination “ground obs + radar” (PhD thesis R. Erdin)
plausibility limits: site & amount specific statistical modelling of the interpolation error to identify possible outliers
operational implementation of interpolated values / plausibility info into MeteoSwiss data warehouse (DWH)
21Towards semi-automation of manual precipitation DQC | 7th DQM workshop, 5 November 2009, Copenhagen [email protected]
more on DQC at MeteoSwiss…
Poster 7-P2:„The data quality control chain for
automatic surface observation data at MeteoSwiss“by Deborah van Geijtenbeek et al.