primary school-age population projections for counties in
TRANSCRIPT

PRIMARY SCHOOL-AGE POPULATION PROJECTIONS FOR COUNTIES IN CENTRAL PROVINCE, KENYA
BYMWANGI FRANCIS KAMUNYA
Q56/63724/2010
A PROJECT SUBMITTED IN PARTIAL FULFILLMENT OF THE REQUIREMENTS FOR THE AWARD OF THE DEGREE OF MASTER OF SCIENCE IN POPULATION STUDIES AT THE
POPULATION STUDIES AND RESEARCH INSTITUTE, UNIVERSITY OF NAIROBI
POPULATION STUDIES AND RESEARCH INSTITUTRE (PSRI)UNIVERSITY OF NAIROBI
PO BOX 30197 NAIROBI
NOVEMBER 2012University of NAIROBI Library
0435958 4

DECLARATION
This project is my original work and to the best of my knowledge has not been submitted,either wholly or partially, to this or any other University for award of a degree.
Signature Date.................
Mwangi Francis Kamunya Registration Number: Q56/63724/2010
This project has been submitted for examination with our approval as University supervisors:
Date
Population Studies and Research Institute University of Nairobi
2. Signature Date
Mr. Ben Obonyo JarabiPopulation Studies and Research InstituteUniversity of Nairobi
11

DEDICATION
I dedicate this work to my late mother, Teresia Watiri, for making a sound decision to take me to school at a tender age and hence provided the firm education foundation which has seen me climb the academic ladder this far.
I also dedicate this work to my lovely wife Faith Wanja, my children Godfrey Kimani and Joy Watiri. Thanks for your moral support and understanding when the academic work took centre stage and I would be away for long hours from you during the entire study period. Many thanks for your understanding.
To God, I give all the Glory.
m

ACKNOWLEDGEMENT
I give Glory to our God the Father, God the son, and God the Holy Spirit. All through, I have seen His wholesome grace, favour, provision and protection in my entire period of study. I bless and glorify His Holy name.
I do appreciate the critical evaluation, counsel and professional input by my supervisors: Prof. John Oucho and Mr. Ben Obonyo Jarabi.Many Thanks.
I also appreciate Mr. Charles O. Obiero (Manager, Education Statistics and Planning Unit, Ministry of Education) and other ministry officials, for the technical assistance that I received whenever I visited the Ministry of Education offices in pursuit of educational data.
Many thanks to my colleagues at Pumwani Boys Secondary School, for moral and physical support you offered to me during the entire period of study.
Finally, I pass my sincere and heartfelt thanks to the entire PSRI family: The Director and Lecturers, for their tireless efforts and guidance provided to me throughout the entire course. Many thanks to the non-teaching staff, and in particular, the Librarian, for the assistance given whenever required. I am also indebted to my classmates; in particular my MSc cohort Beatrice Odaa, Dhillon Nyachieo, Charles O Ogolla, Emma Watathi and Edwin Mugo, who shared ideas and supported me throughout the course and were always there at the hour of need. Last, but not least, many thanks to Christopher A. Mushira (Class representative) and Irene A. Maeri (Event organizer) for the leadership you provided whenever you were called upon and this contributed a lot to the unity exhibited by the PSRI 2010-2012 MA/MSc class.God bless.
IV
ABSTRACT
The main objective of the study was to carry out a population projection for the school- age population of Central Province. In order to achieve this goal, the study employed the use of Cohort Component Method to project the population at National and Provincial levels and thereafter used the Ratio Method in obtaining the projected primary school-age population at county level.
The study used the 2009 population census data after subjecting it to data quality assessment and the UN Accuracy Index to detect the degree of accuracy. From the 2009 census data, Kenya’s population was 38.5 million people. The study projected that this population will increase from 38.5 million people in 2010, to 50 million people in 2020, and 62.4 million people by 2030.
After projecting for the national, then followed by provincial projections, the study later narrowed down to Central Province, which was to provide the required projections for its respective counties. The projected provincial population shows that, Central Province population is set to increase from 4.5 million in 2010, to 5.1 million in 2015, to 5.7 million in 2020, to 6.3 million in 2025 and 7 million by 2030.
After obtaining the projected population for Central Province, the projected primary school-age population was computed. The study used the projected Central Province primary school-age population to generate the projected primary school-age population for the respective counties of Nyeri, Kirinyaga, Murang’a, Nyandarua, and Kiambu. The study found out that, in Central Province, there was a population of 813,000 pupils in 2010, and it is set to increase to 965,000 pupils in 2020 and 1.08 million pupils by 2030.
The study did also project the number of teachers, classrooms and toilets in Central Province using the indicators/norms (PTR, PCR and PToR) as provided by the Ministry of Education. The demand for teachers in Central Province will grow at an average rate of 1.6 percent per annum while that of classrooms was observed to grow at a rate of 32.5 percent within the 20 years period of the study. The demand for toilets will continue to be on the increase with more demand inclined to the girls across the entire Province.
v

TABLE OF CONTENTSDECLARATION..............................................................................................................iiDEDICATION..................................................................................................................iiiACKNOWLEDGEMENT.............................................................................................. ivABSTRACT.......................................................................................................................vLIST OF TABLES........................................................................................................... viiiLIST OF FIGURES......................................................................................................... ixLIST OF ABBREVIATIONS.........................................................................................x
CHAPTER 1: INTRODUCTION.................................................................................. 11.1 Background...................................................................................................................11.2 Problem Statement....................................................................................................... 41.4 Study Objectives.......................................................................................................... 51.5 Justification of the Study............................................................................................. 51.6 Scope and Limitations................................................................................................. 7
CHAPTER 2: LITERATURE REVIEW..................................................................... 82.1 Introduction...................................................................................................................82.2 Projections....................................................................................................................82.3 Population Projections................................................................................................. 92.4 Case Study on Population Projections.........................................................................102.5 Types of Population Projection Methods....................................................................112.6 School-Age Population Projections.............................................................................12
CHAPTER 3: METHODOLOGY.................................................................................143.1 Introduction...................................................................................................................143.2 Projection Methods...................................................................................................... 143.3 Quality of the 2009 Census Data................................................................................. 153.3.1 Coverage Errors.........................................................................................................163.3.2 Content Errors............................................................................................................173.3.3 Age - Sex Accuracy Index....................................................................................... 17
v i
3.3.4 Smoothed Population................................................................................................ 193.4 Components Projections............................................................................................ 203.4.1 Fertility Projections..................................................................................................203.4.2 Mortality Projections................................................................................................213.4.3 Migration Projections...............................................................................................223.4.4 Adjustment Due to HIV............................................................................................223.5 Type of Projection Methods used in the Study........................................................... 233.5.1 The Cohort-Component Method.............................................................................. 243.5.2 The Ratio Method.....................................................................................................26
CHAPTER FOUR: RESULTS OF POPULATION PROJECTIONS..................... 294.1 Introduction.................................................................................................................. 294.2 Projected Population....................................................................................................294.2.1 National Population Projections.............................................................................. 294.2.2 Provincial Population Projections.............................................................................304.2.3 Projected School-Age Population by County, 2010-2030...................................... 314.2.4 Enrolment Projections, 2010-2030...........................................................................334.3 Projected Number of Teachers by County, Central Province, 2010-2030..............344.3.1 Projected Number of Classrooms by County, Central Province, 2010-2030.........354.3.2 Projected Number of Toilets by County, for Males and Females, Central Province,2010-2030...........................................................................................................................37
CHAPTER 5: SUMMARY, CONCLUSIONS AND RECOMMENDATIONS..... 395.1 Introduction.................................................................................................................. 395.2 Summary of the Findings.............................................................................................395.3 Conclusions.................................................................................................................. 405.4 Recommendations........................................................................................................ 405.4.1 Policy Recommendations.........................................................................................415.4.2 Recommendations for Further Research................................................................. 41
REFERENCES 42

LIST OF TABLES
Table 3.1: United Nations Age-Sex Accuracy Index..................................................Table 4.1: Projected Population by Sex. Kenya, 2010-2030........................................Table 4.2: Projected Population by Province, 2010-2030............................................Table 4.3: Projected Primary School-Age Population, Central Province, 2010-2030 .Table 4.4: Projected Enrolment by county, Central Province, 2010-2030..................Table 4.5: Projected number of Teachers, Central Province, 2010-2030...................Table 4.6: Projected number of classrooms by county. Central Province, 2010-2030Table 4.7: Projected number of Toilets for Females,by county, 2010-2030..............Table 4.8: Projected number of Toilets for Males,by county, 2010-2030..................
183131323334363739

LIST OF FIGURES
Figure 3.1: Sex Ratios by Age, North Eastern Province and Kenya, 2009.......................16Figure 3.2: United Nations Age-Sex Accuracy Index....................................................... 18Figure 3.3: Accuracy Index by Province, 2009..................................................................18Figure 3.4: Enumerated versus Smoothed Population, Kenya, 2009................................20Figure 3.5: Trend in Total Fertility Rate, Kenya, 2010-2030............................................ 21
IX

LIST OF ABBREVIATIONSAIDS..............................................................Acquired Immunodeficiency SyndromeECDE.............................................................Early Childhood Development and Education
EFA................................................................Education for AllFPE................................................................Free Primary EducationFTI.................................................................Fast Track Initiative
GER...............................................................Gross Enrolment Rate
GOK...............................................................Government of Kenya
HIV................................................................Human Immunodeficiency Virus
KESSP.......................................................... Kenya Education Sector Support Programme
MDG..............................................................Millennium Development Goal
NER.............................................................. Net Enrolment Rate
PCR............................................................... Pupil Classroom Ratio
PTR............................................................... Pupil Teacher Ratio
PToR...............................................................Pupil Toilet Ratio
TFR................................................................ Total Fertility Rate
UPE................................................................ Universal Primary Education
UBS................................................................ Uganda Bureau of Statistics
x

CHAPTER 1: INTRODUCTION1.1 Background
Population projection is the estimation of future populations based on the present age-sex structure, together with assumed rates of fertility, mortality, and migration in the future, that is, extrapolation of past and present population trends into the future. Projections must be evaluated in light of when they were made, prescribed assumptions and conditions at that time. Therefore, projections are based on current knowledge about population size, age structure, rates of birth, death, migration, and assumptions about how quickly these rates will change.
Population projections are essentially concerned with future growth. They may be prepared for the total population of nations, their principal geographical subdivisions or specific localities within them. Among the most frequently required and produced are projections of the population in terms of educational characteristics (that is, enrolment and attainment) and economic characteristics (that is, economically active population, employment distribution by occupation and industry).
Based on such projections, educational planners are in a position to judge if the current physical facilities will be enough for the growing population and hence make decisions about the required investments.
Provision of education and training to all Kenyans is fundamental to the success of the Government of Kenya’s overall development strategy. Since independence, the Government has addressed challenges facing the education sector through Commissions, Committees and Taskforces.
The first Commission was established immediately after independence and it sought to reform the education system inherited from the colonial government. The commission also aimed at making education more responsive to the needs of independent Kenya. Among the key recommendations made was to make education more child-centred, to provide educational opportunities to all, to make English language a medium of
1

communication in schools, and make the age of entry to primary schools be six years (The Ominde Report, 1964).
The second Commission was set up in 1972 and its findings provided great motivation in changing the inherited curricula to make it more relevant to the local needs (Bessay Report, 1972). Then, there was the Gachathi Commission, which recommended a nine- year basic education (9-4-3 system) with a bias on pre-vocational subjects (Gachathi Report, 1976). Vocational subjects were introduced in both primary and secondary schools curricula despite the fact that the 9-4-3 system never saw the light of the day due to financial implications.
In 1981, another Commission was established that recommended a major shift by restructuring the previous 7-4-2-3 system (it did away with the A-level component) to 8- 4-4 system and recommended the creation of the second institution of higher learning, namely Moi University (Mackay Report, 1981).
As the 8-4-4 system progressed over time, it became apparently expensive to maintain and this brought in yet another Commission, which re-introduced cost sharing in financing education in Kenya (Kamunge Report, 1988). Finally, there was the Koech Commission, which made recommendations on education for technological and industrial development, reduction of examinable subjects and life-long learning (Koech Report, 2000).
The recommendations from all the Commissions set up since independence have been used in policy formulation, yet there is no evidence that these have been responsive to population trends, in particular that of school-age population, which is a critical component in planning for educational needs in future.
Recent policy initiatives have focused on the attainment of Education for All (EFA) and, in particular, Universal Primary Education (UPE). The key concerns are access, retention, equity, quality and relevance, and internal and external efficiencies within the education system.
2

The Government is committed to the provision of quality education and training as a human right for all Kenyans in accordance with the new Constitution and the international conventions, such as the Education for All (EFA) goal, and is developing strategies for moving the country towards the attainment of this goal. The implementation of Free Primary Education (FPE) was and still is critical to the attainment of Universal Primary Education (UPE) as a key milestone towards the realization of the EFA goal.
At the dawn of the new millennium in September 2000, the largest gathering of the world leaders in history, adopted the United Nations Millennium Declaration. The states committed their nations to a new global partnership aimed at reducing extreme poverty and set out a series of time-bound targets, with year 2015 as the deadline, that have become to be known as the eight Millennium Development Goals (MDGs).
The launching and implementation of Free Primary Education (FPE) programme in January 2003, was a clear indication of the Government of Kenya’s commitment in pursuit of achieving MDG 2 (achieve universal education) and MDG 3 (promote gender equality and empower women). The government aimed at eliminating gender disparity in primary and secondary education, preferably by 2005, and in all levels of education by 2015. Due to the successive implementation of FPE, the enrolment figures increased tremendously over time and it is projected that Early Childhood Development and Education (ECDE), primary school age and secondary school populations will reach 3.0 million, 10.7 million and 3.6 million respectively by 2015 (GOK, 2011).
The Government has further demonstrated its commitment in achieving MDG 2 by incorporating it in the Vision 2030 blue print as well as domesticating it in the Constitution under the Bill of Rights which states that “Every child has the right to free and Compulsory basic Education” {Chapter 4, Section 53 (1) (b); Constitution of Kenya, 2010}.
None of the Commissions or Taskforces on educational policies since independence has ever paid attention to the importance of proper planning for the ever-increasing school age population. With the effective implementation of FPE, there is a demand for accurate data for policy formulation and effective planning.
3

1.2 Problem Statement
Education is considered the best means of improving the quality of human life and population quality in general. An educated and technically empowered population will contribute enormously to the promotion of economical development of any given country, Kenya being no exception. Population projections by level of education are an important step in improving population forecasting and its relevance.Data pertaining to school-age population provide a proxy measure of demand for education at different levels; for example, population aged 4-5 years represents a pool for those entering Early Childhood Development and Education (ECDE) schools. Similarly, population of age groups 6-13 and 14-17 correspond to those who enter primary and secondary schools respectively. In order to achieve national and global goals in the provision of quality and compulsory primary school education for all, there is a need for reliable data on school-age population at all levels of governance including counties.
Because of stabilization of the impact of FPE, the total primary school enrolment is expected to grow at a constant rate. Enrolment in public primary school is set to increase from 7.5 million pupils in 2007 to 9.2 million pupils in 2012 and 10.5 million pupils by 2015. At the national level, the following statistical data are available, primary school- age population, total primary school enrolment, pupil teacher ratio (43:1) which was slightly higher than the norm of 40:1 and average public primary school enrolment per school of 385 pupils. As the Government of Kenya prepares to adopt the devolved form of governance at county level, there is dire need for such data that are completely lacking at county level.
Continued lack of data on educational demand can result in serious oversight, which may lead to poor distribution of resources within the counties of Central Province hence the need to provide projected school-age population at county level.
Therefore, by having primary school-age population projections for counties in Central Province, it will not only provide the necessary statistical data but also inform education policy makers to make informed decisions concerning various requisite inputs like the number and distribution of teachers, physical facilities, teaching materials, etc.
4

Demand for education drives the supply for the same in many different areas, like plans for the construction of schools, the training and recruitment of teachers, etc. Therefore, for the counties of Central Province to provide quality education for all in the future there is need for educational planners to have the projected population of the school age population. The projected figures will inform the planners on the need to have the correct number of students per class, the number of teachers per school, in order to achieve the recommended teacher-pupil ratio and invest in infrastructural facilities especially in sanitation.
1.3 Research QuestionThe study addressed the question: what is the projected population size of the primary school-age population for the counties of Central Province between 2010 and 2030?
1.4 Study Objectives
General ObjectiveThe study aimed at projecting the primary school-age population for Central Province up to the year 2030.
Specific Objectives1. To project the primary school-age population for Nyeri, Nyandarua, Kiambu,
Murang’a and Kirinyaga counties up to the year 2030.
2. To project the enrolment rates of primary school age population in each county of Central Province up to 2030.
3. To project the required number of toilets, classrooms and teachers at primary school level in the five counties of Central Province up to 2030.
1.5 Justification of the Study
The study focused on the population of primary school-age of counties in Central Province. With the promulgation of the new Constitution, 47 counties were created as centres of the devolved form of governance to be adopted in 2013. Rift Valley Province
5

has a lion share of 14 counties while North Eastern Province with 3 counties has the least. Central Province, which consists of 5 counties, was randomly chosen for this study.
The study projected the number of toilets, classrooms and teachers in Central Province as key indicators even though there are many more indictors in this field like average school enrolment and pupil teacher ratio. The pupil toilet ratio is a good parameter in measuring the level of hygiene and sanitation in schools while pupil teacher ratio and class size will reflect on issues of access and quality of education in the counties. These three parameters form the basis for monitoring progress towards the achievement of EFA goals and analyzing policies and initiatives implemented at both national and county levels and their impacts year by year during the projection period. Hence, projection of primary school-age population is a good analytical instrument that is helpful in a monitoring exercise at county level. Projections may warn or alert some counties on the risk of not achieving the goals if past trends persist and appropriate measures are not taken.
Knowledge of the projected school-age population is very essential to education planners. An important requirement of educational planning is enrolment projections, which forms the basis for many investment decisions. For example, based on enrolment projections, it is possible for education planners to upgrade or open new schools. Equally, the number of teachers required depends on the number of children enrolled. None of these tasks may be accomplished efficiently unless the planner has empirical evidence from the projections of school-age population, clearly indicating how it will proceed through various academic levels, and what number would finally graduate.
This study will inform education planners to be better prepared to meet the challenges arising from the projected school-age population at county level. The successive increase in projections of the respective county population will lead to exerted additional pressure on the existing physical facilities, like permanent classrooms (particularly in poor rural areas) as well as on human resources which include teachers and support staff too.
6

Projected county school-age population will permit the formulation of appropriate policies and programmes that will ensure optimum service delivery in various components of educational provision: such as, teachers in service, trainee teachers, the number of schools required, and other basic facilities. By doing so, the study shall make an invaluable contribution towards the achievement of both national and global goals in education as stipulated in the Government policy, Kenya Vision 2030, particularly at county level in Central Province.
1.6 Scope and Limitations
The study has used secondary data from the 2009 Population and Housing Census.The study focused on the primary school-age population projections for counties in Central Province due to limitation of time. Within the given period of the study, it could not have been possible to undertake population projections for all the 47 counties in the country. Since the assumptions on the demographic processes used at the time of the projections may change in future, the projected figures may differ from the actual population. In order to minimize the difference, a medium-term projection was adopted for a span of 20 years.
7
CHAPTER 2: LITERATURE REVIEW2.1 IntroductionAn understanding of the concept of population projections was important in this study. To highlight on this concept, the literature review in this section is organized under the headings: Projections, Population Projections, The Uganda/Myanmar case study on population projections, Projection Methods, and School-age Population Projections.2.2 ProjectionsThere is a distinction between Projections, Forecasts, and Predictions. In this section, an attempt is made to define each of the three terms. Demographers often draw a distinction between projections and forecasts.Projections are conditional statements about the future. They refer mostly to the exercises of extrapolation of the past trends into the future; and they do not take into account changes in the policy parameters. Tor example, a projection of the future population
growth may not be taking into account changes in the government health policies, family health programmes, etc. Projections are based on the assumption that the past trends will continue to operate in the future and are usually extrapolations of past and present population trends into the future. Projections must be evaluated in the light of when they were made, and conditions at the time.Projections are the outcomes of a particular set of assumptions regarding future population values, whereas forecasts are the specific projections that are expected to provide the most accurate predictions of those values (Shryock, 1976).
The reliability and usefulness of projections depend on the assumptions and their closeness to reality. In the end, the policy parameters are to be incorporated in the projections. The likely effects of policy changes are to be judged and projections are to be made accordingly. Thus, when an element of judgment is added to the projections, it becomes a forecast.
Population forecasts predict the future size and composition of populations, based on predictions of fertility, mortality, and migration. Projections are used for many purposes, including for predicting the demand for food, water, education, medical services, labour
8

markets, pension systems, and predicting future impact on the environment. It is important for decision makers to not only have a point forecast that states the most likely scenario of a future population, but also to know the uncertainty around it, that is, the possible future values of an outcome, and how likely each set of possible future values is. Forecasts enjoy the advantage of being based upon the assumption or a set of assumptions, which are likely to be realized in the near future and can yield a relatively more realistic picture of the future.
In general, population projections are treated as predictions and are never to be termed as final population. They should be reviewed frequently in order to determine the degree to which they agree with recent demographic changes. If the discrepancies between the projections and the ultimate events are significant, it should be found out whether it is due to the quality of input data or due to the methodology adopted (Mehta, 1994).
Population projections are used for a wide variety of planning and budgeting purposes. In many instances, projections of demographic characteristics are at least as important as projections of the total population. Age is a particularly important characteristic and is commonly used when projecting births (Lapkoff, 1993), school enrolment (Fishlow, 1994), residential care for children (Dunton, 1994), hospital services (Rives, 1994), social security revenues and expenditures (Lee and Tuljapurkar, 1997), and many other policyrelevant variables. By their very nature, population projections are uncertain. We cannot know precisely what the population will be one year from now, much less in 10, 20 or 30 years. The accuracy in a projection is improved by developing stochastic forecasting models that attach explicit statements of probability to population projections (Alho, 1990)
2.3 Population Projections
Population projections are essential for planning at the national, regional and county levels in the private and public sectors. In order for planners and policy makers to allocate efficiently the scarce resources, they need to know the future size and structure of the country’s population as well as their characteristics.
9

2.4 Case Study on Population ProjectionsThe world population is expected to keep on rising during the 21 s1 century, although its growth is projected to experience a marked deceleration during the second half of the century. According to the medium variant of the 2010 Revision of World Population Prospects, the world population is expected to increase from 6.9 billion in mid-2011 to9.3 billion in 2050 and to reach 10.1 billion by 2100. Realization of this projection is contingent on the continued decline of fertility in countries that still have fertility above replacement level (that is, countries where women have, on average, more than one daughter) and an increase of fertility in the countries that have below-replacement fertility. In addition, mortality would have to decline in all countries (United Nations, Population Division, 2011).The Uganda Bureau of Statistics (UBS) undertook a population projection using the 2002 census data, yielding the following demographic trends. The population of Uganda is youthful and will continue to be throughout the projection period due to the prevailing high fertility. The projected median age of the population by 2017 is 15 years. The size of the working age population in Uganda is projected to increase steadily from about 14 million in 2007 to about 21 million in 2017. The population of school going age (6-18 years) is generally increasing over the projection period irrespective of the existence of HIV/AIDS Preston et al (2001). The population of Uganda was projected using the Cohort Component Method, which was also used in projecting the Kenyan population in this study.
The Ugandan case study have captured the projections of primary school age population as well as the secondary school age population which the government must plan for in good time as they transit into adulthood and enter into the job market.
Another independent study was carried out using 1973 and 1983 census data to examine various demographic factors, which affect population growth, to forecast the future size of the population, and to examine socioeconomic effects of rapid population growth on Myanmar (previously known as Burma). The researcher had to adjust 1983 data since
10

remote rural areas were not included in the census. Since data quality was flawed, indirect estimation techniques were used to estimate fertility, mortality, and life expectancy at birth. The researcher used the UN general assumption model to make 9 populations projections. The low and high variant projections showed the dependency ratios to remain high until 1998, and then they would steadily fall to 0.56 and 0.58 by 2013. The high variant projection revealed a slight rise throughout the 30-year period with the dependency ratio peaking in 2003. In terms of health, Myanmar would need an increased number of physicians and nurses at all variants in 2013 if the ratio of health personnel to population could be held constant (2.2 and 1.6 respectively).
On the education sector, the study revealed that the number of teachers who will be needed in 2013 would also need to increase more than 2 times the 1983 number at the high variant projection if the ratio of teachers to students could be held at 1:39. The researcher concluded that Myanmar therefore needs family planning to effect socioeconomic development (Win, 1990). The study also pointed out clearly the importance of projections in particular in the area of public health and education.
2.5 Types of Population Projection Methods
There are several methods, which can used to project a given population depending on the objective of the research. While using the exponential equation Pt=P0e11, Ondieki (1989) in his thesis, projected the population of Nairobi and its implications for Housing and observed that housing needs were increasing with time, as does the population.
Wekesa (1989) used the four parameter logit system to project the Kenya population and analyzed its implications for educational sector and more so the enrolment. The conclusion was that same provinces showed a consistently high retention rate while others performed very poorly. Central and Nairobi are among those provinces with highest cohort enrolments. The study also revealed that all cohorts showed retention rate of 90 per cent in all grades for Nairobi while for North Eastern province enrolment figures were markedly low in all grades.
11

Bwila (2004) used the stable population model (an 18 by 18-matrix method) and in his finding projected that the population of Kenya will stabilize by the year 2090.
This study was different from any of the above studies for it applied the cohort component method in projecting the national and provincial populations and Ratio Method to project the county populations.
2.6 School-Age Population ProjectionsIn the recent past, a study done by Kiema, et al (2011), reveal that Kenya’s population had increased from 28.7 million in 1999 to 36.9 million in 2008. They project that the population will reach 42.1 million in 2012 and 46.1 million in 2015. The primary school- age population stood at 7.9 million in 2009 and it is projected to reach 9.3 million in the year 2012 and 10.7 million by the year 2015 (GOK, 2011).In 2006, Kenya evaluated and endorsed Education support from Fast Track Initiative (FTI) based on the credibility of the ‘basic education for all’ policy as formulated in the Kenya Education sector support programme (KESSP) which was launched in July 2005. This highlights the importance of Early Childhood Development and Education (ECDE), which the government has recognized as one of the most important levers of accelerating the attainment of EFA and the MDG’s 2 and 3. One of the EFA goals obligates the government to expand and enhance comprehensive ECDE programmes that are essential for the basic education. While enrolment in ECDE increased from 1,672 thousand in 2006 to 1,691 thousand children in 2007, the gross enrolment rate (GER) of 59.3 percent is still below acceptable levels. Furthermore, the number of ECDE centres also increased marginally from 36 thousand in 2006 to 37 thousand in 2007. With low enrolment at this level, many children between ages 4-5 years end up directly joining primary schools without the relevant background thus negatively affecting retention rate and quality of education.
There has been remarkable progress in increasing access to primary education across the country ever since the introduction of free primary education was implemented. Primary school net enrolment rate (NER) increased from 86.5 percent in 2006, to 91.6 percent in
12

2007. There was a slight change in the GER to 107.2 percent during the same period. The completion rate increased from 56.7 percent to 76.8 percent in 2006. In 2008, the country had 18,063 public primary schools and 8,041 private schools with a total enrolment of 8.2 million pupils (GOK, 2011).There has been significant increase in primary school enrolment after the introduction of FPE in 2003. However, this has exerted additional pressure on the existing physical facilities. This has led to an acute shortage of permanent classrooms, particularly in poor communities. The results of the sharp rise in enrolment numbers include poor learning conditions and over-crowding in schools, which will finally result in provision of low quality of education (GOK, 2011).
13
CHAPTER 3: METHODOLOGY3.1 Introduction
This chapter gives a detailed account of the Methodology used in the study, namely Cohort Component Method and the Ratio Method. The Cohort Component Method was used to project populations at National and Provincial level. On the other hand. Ratio Method was used in splitting the projected population of Central Province in order to obtain the respective county data. However, brief account on the quality of data and smoothing procedure is also highlighted.
3.2 Projection MethodsThere are various methods of projecting population (e.g. mathematical, economic, and component methods). Some are very sophisticated and rigorous while others are simple and less sophisticated. In population projections, it is important to consider the size of the geographical area (projection at national level) where uncertainty is lower or smaller area (projection at county level). At county level, migration makes future population developments more volatile and projections more difficult.
In choosing which projection method to use, it is important to note that there is no superior method than the other for all purposes. However, each projection method has its strengths and weakness that must be evaluated according to, among others, its face validity, cost, data requirements, ease of application, and other parameters. Methods of population projections may be classified as mathematical and cohort component methods.
The choice of method usually depends on the available data. Mathematical methods require relatively less data than the cohort component method. Mathematical methods entail fitting one of several mathematical curves to the total population observed in one census to derive a projected total population at some future date. This class of methods yields reasonably good results for short-range projections (not more than ten years) and is very useful for projecting populations at sub-national levels. However, the results obtained from this approach may have very large errors for medium to long-range
14

projections (10-25 years, and more than 25 years respectively) because the assumptions underlying mathematical methods may not hold in the medium to long term.In general, mathematical methods provide information about the future size of the population but not the structure of the projected population. Hence, this study adopted to use the cohort-component method (at national and provincial level) and Ratio method (at county level). The choice of using the cohort component method (it requires detailed age- structure of a population in the base year along with estimates of the three demographic processes) to obtain the projection of the school age population of Central Province by county was due to its accuracy as compared to other methods.
3.3 Quality of the 2009 Census DataBefore using the data as provided for by the 2009 census to population projections, it was necessary to ascertain the quality of it. This is because demographic data collected in Kenya or elsewhere in the world, may have some problems due to administrative and logistics issues. Some of the errors may be due to content or coverage errors. The nature and magnitude of the errors differ from one country to another and one region to another.
The omission of certain pockets of the population will result to coverage errors while content of events pertain to misreporting or misclassification of events. The errors, if not rectified, will have a bias or a distortion of facts in the estimates from such data.
The census data may as well contain errors originating from the fact that some people do not know their true age and others do not report their age accurately. The distribution of a population by age and sex is one of the most basic types of information needed in planning for the future and with such importance of the age structure with respect to social and economic characteristics, it is imperative that the information on the population by age and sex be as accurate as possible. Therefore, for this reason it is of critical importance to evaluate the reported age and sex composition of the population before undertaking population projects. Therefore, it was necessary to evaluate both the content error and the coverage error too.
15
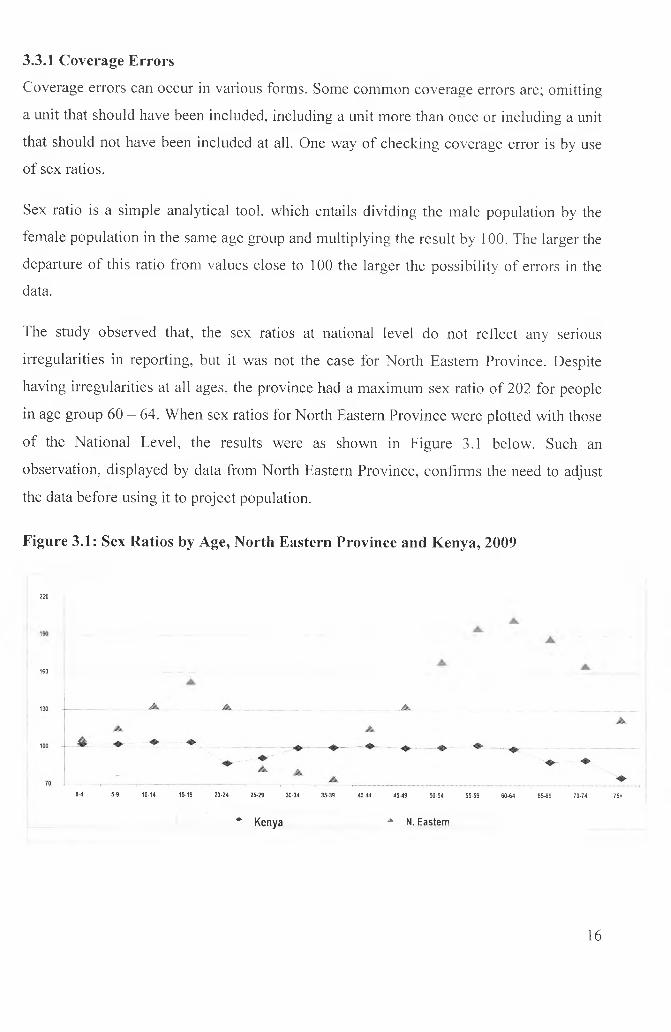
3.3.1 Coverage ErrorsCoverage errors can occur in various forms. Some common coverage errors are; omitting a unit that should have been included, including a unit more than once or including a unit that should not have been included at all. One way of checking coverage error is by use of sex ratios.
Sex ratio is a simple analytical tool, which entails dividing the male population by the female population in the same age group and multiplying the result by 100. The larger the departure of this ratio from values close to 100 the larger the possibility of errors in the data.
The study observed that, the sex ratios at national level do not reflect any serious irregularities in reporting, but it was not the case for North Eastern Province. Despite having irregularities at all ages, the province had a maximum sex ratio of 202 for people in age group 60 - 64. When sex ratios for North Eastern Province were plotted with those of the National Level, the results were as shown in Figure 3.1 below. Such an observation, displayed by data from North Eastern Province, confirms the need to adjust the data before using it to project population.
Figure 3.1: Sex Ratios by Age, North Eastern Province and Kenya, 2009
220
160
0-4 5-9 10-14 15-19 20-24 25-29 30-94 35-39 40-44 45-49 50-54 55-59 60-64 65-69 70-74 75+
* Kenya '*■ N. Eastern
16

3.3.2 Content ErrorsPopulation data in most developing countries is often subjected to age misreporting. The irregularities in the age distribution may be because of the respondent’s incorrect age declaration or the competency of the enumerator. Digit preference or age heaping is another common error that occurs in age reporting and Myers index can be used to detect it.
3.3.3 Age - Sex Accuracy IndexThis is another tool used to test the accuracy of a census data. Based on the empirical analysis of the age and sex declaration in census from different developed and developing countries, the United Nations came up with an Age-sex Accuracy index as shown in table 3.1 below.
Table 3. 1: United Nations Age-Sex Accuracy IndexAccurate Less than 20
Inaccurate Between 20 and 40
Highly inaccurate Over 40
An evaluation of a time series of such indices for Kenya censuses from 1979 to 2009 was done and the result obtained are as shown in the Figure 3.2 below. The trend if maintained, is a clear indication that the future Kenyan censuses will enter the accuracy category.
17

Figure 3.2: United Nations Age-Sex Accuracy Index, Kenya2928
XCD 27-a 26_E>* 25OTO 24=3OO 23
< 222120
28.1
26.4
24.9
1979 1989 1999Census
Year
23.7
2009
The results show an improvement in the accuracy index since 1979 with the 2009 census having the best index (23.7) while 1979 census reported the worst index (28.1). Further analysis of the 2009 census reveals regional differentials by province as shown in the Figure 3.3 below
Figure 3.3: Accuracy Index by Province, 2009
Accuracy Index by Province, 2009120 110 100
90
g 80T3=§ 70 >.| 60
| 50
40
30
20
10
108.4
N.Eastern Nairobi Coast Nyanza R. Valley Eastern Kenya Central WesternProvince
18

Once again, as captured in the coverage errors, Northern Eastern Province had an index of 108, indicating that the Age-Sex Accuracy index for this Province is highly inaccurate. Nairobi province (64) came in second, while other provinces had indices that placed them in the category of inaccurate with the exception of Western province (18), the only province in the category of accurate reporting.
Having confirmed that the data had irregularities (from the analysis of sex ratios and Age-Sex Accuracy index), it was then paramount for the data to undergo a smoothing process.Therefore, the next step was to correct the irregularities observed so far by generating smoothed age-sex distributions. The resultant smoothed populations were later used in this study to generate base populations for projection purposes.
3.3.4 Smoothed PopulationThe main purpose of smoothing procedures is to correct any irregularities reported in coverage and content errors, in the population data. Smoothing techniques are frequently used for correcting data for age misreporting. Most of these techniques involve the application of a formula to the original data. Nevertheless, these formulas produce only a light smoothing. However, if the irregularities are so large, like the case of North Eastern Province, then a stronger smoothing procedure is required. For the 2009 data, light smoothing was applied in adjusting data from all provinces with exception of North Eastern Province.
To have consistent, the 1999 population for North Eastern Province, was projected to 2009 and the result served as the “smoothed” population for the Province. Finally, the smoothed population of all provinces was cumulated to yield the national population. The results are well captured by the comparison of the national enumerated and smoothed population in Figure 3.4 below. The graph observes a trend of consistent in both enumerated and smoothed population, with a slight difference in the age groups 5-9 and 10-14 years.
19
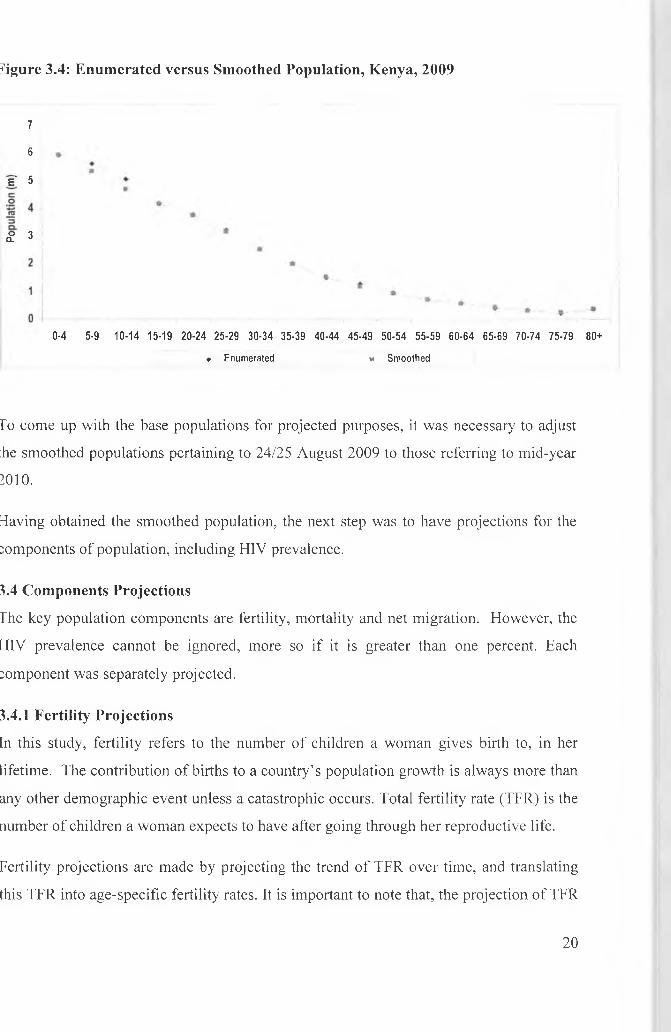
figure 3.4: Enumerated versus Smoothed Population, Kenya, 2009
7
6
E" 5
° 3Q _ 0
0-4 5-9 10-14 15-19 20-24 25-29 30-34 35-39 40-44 45-49 50-54 55-59 60-64 65-69 70-74 75-79 80+
♦ Enumerated * Smoothed
Fo come up with the base populations for projected purposes, it was necessary to adjust :he smoothed populations pertaining to 24/25 August 2009 to those referring to mid-year 2010.
Having obtained the smoothed population, the next step was to have projections for the :omponents of population, including HIV prevalence.
3.4 Components ProjectionsThe key population components are fertility, mortality and net migration. However, the HIV prevalence cannot be ignored, more so if it is greater than one percent. Each component was separately projected.
3.4.1 Fertility ProjectionsIn this study, fertility refers to the number of children a woman gives birth to, in her lifetime. The contribution of births to a country’s population growth is always more than any other demographic event unless a catastrophic occurs. Total fertility rate (TFR) is the number of children a woman expects to have after going through her reproductive life.
Fertility projections are made by projecting the trend of TFR over time, and translating this TFR into age-specific fertility rates. It is important to note that, the projection of TFR
20
is divided into assumptions regarding an assumed eventual fertility level, and the course taken from the current to the eventual level. The two assumptions are important in determining trends in population size and age structure.
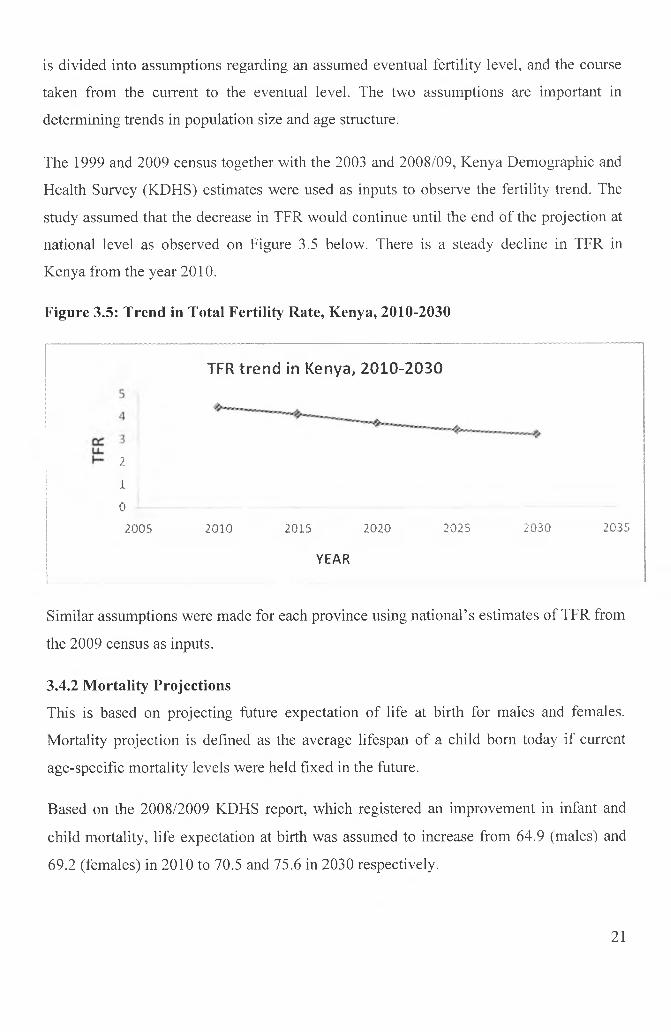
The 1999 and 2009 census together with the 2003 and 2008/09, Kenya Demographic and Health Survey (KDHS) estimates were used as inputs to observe the fertility trend. The study assumed that the decrease in TFR would continue until the end of the projection at national level as observed on Figure 3.5 below. There is a steady decline in TFR in Kenya from the year 2010.
Figure 3.5: Trend in Total Fertility Rate, Kenya, 2010-2030
TFR trend in Kenya, 2010-2030
2 ""!1 4
02005 2010 2015 2020 2025 2030 2035
YEAR
Similar assumptions were made for each province using national’s estimates of TFR from the 2009 census as inputs.
3.4.2 Mortality ProjectionsThis is based on projecting future expectation of life at birth for males and females. Mortality projection is defined as the average lifespan of a child born today if current age-specific mortality levels were held fixed in the future.
Based on the 2008/2009 KDHS report, which registered an improvement in infant and child mortality, life expectation at birth was assumed to increase from 64.9 (males) and69.2 (females) in 2010 to 70.5 and 75.6 in 2030 respectively.
21

3.4.3 Migration ProjectionsIn contrast with mortality and fertility where the impact of policy is much less evident, migration is strongly influenced by policies. Migration is the most difficult demographic component to predict due to migration regulations and practices of different countries. Equally difficult to predict is the international migration due to data inadequacy.
The 2009 census recorded a low rate (less than 1%) of international migration, which was no difference with the past records; hence, it was not incorporated into the national population projections. However, internal migration (migration between provinces) was accounted for in 2009 census, ensuring that the sum of all provincial internal flows by age and sex must be zero. Care was taken to exclude migration between districts belonging to the same province.
The study assumed that the rate of net migration would remain constant at the 2009 level for the entire projection period, 2010-2030.
3.4.4 Adjustment Due to HIVi) Non-AIDS mortalityThe 2008/09 KDHS infants and child mortality estimates were used to subtract the estimated AIDS only mortality from the KDHS mortality estimates (which include AIDS), to obtain non-AIDS life table for 2004, the reference year of the estimates. The resultant values of non-AIDS expectation of the life at birth were projected to 2030. Since KDHS report does not provide mortality estimates by sex at provincial level, the infant and child mortality estimates had to be split by sex, using the sex ratio at birth. The provincial estimates from this process are used to estimate the non-AIDS age-specific mortality rates. This was achieved by subtracting the estimated AIDS-only mortality from the KDHS mortality estimates (which include AIDS) to obtain non-AIDS life tables for 2004, the reference year of the estimates.
ii) AIDS only mortalityThe National AIDS Control Council (NACC) Spectrum file on the AIDS-only age- specific mortality rates for 2010 to 2014 was used as the input to project these values to 2030. An adjusted exponential average growth rate based on change in mortality between
22
2009 and 2014 for each specific 5-year groups was used. In doing so, two adjacent age groups were taken into account (it was like a three-year moving average) which assisted mitigating any wide fluctuation in rates that might be present.
The results observed a continued decline in AIDS-only mortality in future years, which signifies that by 2030, there will be minimal impact of HIV/AIDS on the Kenyan population.
In order to achieve a set of mortality rates that include AIDS, the two (AIDS-only and non-AIDS mortality rates) were combined for all the provinces.
Finally, to obtain AIDS- only specific mortality values for each province, the ratio of the provincial HIV prevalence to the national HIV prevalence of 2008/2009 (KDHS) was used.
This ratio was then applied as an adjustment factor by multiplying this factor by the national-level age-specific mortality rates to obtain AIDS-only age specific mortality values for each province from 2010 to 2030.
As was the case at national projection, the AIDS-only age specific mortality rate and non- AIDS mortality rates were combined to produce a set of mortality rates that include AIDS for each province. Having subjected the data to all components of population including HIV prevalence, plus the process of validity as well, then the next step was to subject the data to component method to produce the required population projections.
3.5 Type of Projection Methods used in the StudyThe study employed the following two basic methods in projection:
I. Component method: it was preferred to mathematical method, for it involves a separate analysis of the changes affecting each component of the population (i.e. fertility, mortality, and migration).
II. Ratio Method, found to be the most reliable method of projecting population at lower geographic levels, like county, when the necessary input information about the components of population change are not readily available.
23

3.5.1 The Cohort-Component MethodThe United Nations Population Division has employed the cohort-component projection method for individual country projections since the 1963 Revision. This method, the most commonly projection method used by demographers, provides an accounting framework for the three demographic components of change: births, deaths and international migration and relates them to the population affected. Technically, it is not a projections method, as it requires the components of change (births, deaths, and migration) to be projected in advance. Rather, it is a calculation device, which describes how to combine the demographic components arithmetically such that correct results are obtained hence the use of the Ratio Method at county level.
The cohort-component method is widely used because it accounts separately for the components of growth, can accommodate a number of different theoretical models and projection techniques, and provides projections of demographic characteristics and the size of the total population. However, it is a data-intensive method (i.e. have heavy data requirements, hence time consuming) that requires the collection or calculation of many age- and sex-specific fertility, mortality, and migration rates. The cohort-component method gives better projections since it takes into accounts all components of demography, however it is not only time consuming but also creates problems for projections of small areas where fertility, mortality, and migration data are difficult or impossible to obtain.
The component method involves an overview of each component of population change (fertility, mortality, and migration).
The components of population change are:(Births - Deaths) + (in-migrants - out-migrants)pz+t= pz+ B Z+t_ D z+t+ jyj-z+t
24

WherePz+t = population projected at some future date t, years.Pz = population at the base year from which the projection starts.
Bz+t = number of births that occur during the interval t
Dz+t = number of deaths that occur during the interval tMz+t = the amount of migration that takes place during the interval t.
In this method, the components of population change fertility, mortality and net migration are projected separately for each birth cohort (Shryock, Siegel, and Associates, 1976). In populations where HIV prevalence is greater than one percent, it is recommended by United Nations to project mortality including the impact of HIV/AIDS.
The method usually presents a set of scenarios chosen to represent plausible, possible or relevant future paths of the components of population change. The cohort component can generate three possible population projections namely high, medium, and low scenarios. Among the three scenarios, medium variant is treated as being the most likely outcome, for it gives a sense of neutrality and therefore an apparent plausibility in future development.The component method of projecting population follows a cohort of people of the same age throughout its lifetime and observes the groups, as it is exposures to mortality, fertility, and migration. Taking a base population by age and sex, the population at each specific age is exposed to the chances of dying as determined by projected mortality levels and patterns by age and sex. These will give the estimate of deaths in the cohort. The deaths are then subtracted from the surviving population, and those remaining alive become older with time. On the other hand, female population in childbearing ages, are subjected to the projected fertility rates to give an estimate of the number of births every year.
25

The cohort of children born is also followed through time by exposing it to the appropriate mortality rates. Finally, the component method takes into account the net- migrants who are incorporated at each specific age. The whole procedure is then repeated for each of the projection period (2010-2030), and the results are the projected population by age and sex for each year, for that particular cohort of people.
The cohort component method was used in this study to project both the national and provincial populations, by factoring in the components of population change including HIV. The provincial populations were then used to project the county populations using the Ratio Method.3.5.2 The Ratio MethodSince the corresponding input information about the components of population change were not available at county level (including HIV), the ratio method was considered appropriate to use in generating the projected county populations. This method was based on the assumption that the share of county to the provincial population at the census time was to remain constant throughout the projection period, 2010 to 2030.
The ratio method of population projection considers all the observations just like the least squares method does. The ratio method is found to be reliable at lower levels like the county where the necessary input information about the components of population change are not readily available.
The ratio method was based on the ratio of the county population to that of the provincial population (let R represent this ratio). After the ratio of the county population was obtained, assumptions were made on the future values of ratios. Once the future values of ratios were fixed, the projected population of the county was obtained by applying that ratio to the projected provincial population in that year. This procedure was then applied to any other year for which the projected population was available.
26

The aggregate county populations were made to tally with the original total at provincial level. Thus, the ratio (R) is defined as,
R = Pi[t]/Pc|t]
Where
Pi (t) is population of i* county at time, t.
Pc (t) is the population of the province at time, t to which county T belongs.
The ratio method required the initial/base population by age and sex and this technique utilizes historic population data for a larger geographic area to project the population for a component subarea.The study did apply the ratio method in splitting the provincial base population (05-09 and 10-14 age groups) to the respective county population in single years (primary school-age population between 6-13 years of age). The splitting into single years (6-13 years) for the grouped age group 05-09 years was done separately from that of age group 10-14 years but the procedure was the same as highlighted below.
In order to obtain the required ratios, the following fundamental steps were undertaken, in that order.
I. The ratio of the county base population, P \ to provincial base population, PpTotal County Population, 2010
~ Total Provincial Base Population, 2010II. The proportion of County base population by sex
_ County Subtotal Population by Sex, 2010 C o u n t y T o t a l P o p u l a t i o n . 2010
III. Projected County population, Pct
= County Ratio (SI) XProjected Provincial population Pp,
27

= C ounty Base Ratio (S 2 ) X Projected C ounty Population o f the Subunit (S 3).
V. Projected total county population by Age, Pct
Subtotal C ounty Base Population, sin gle yea rs X Total Coun ty Projected Population (S4)
Total C ounty Base Population
VI. Projected county population by sex in singles years
IV. Projected Total County populations by sex of the sub-unit Pct
county subtotal by sex, single years X projected county subtotal by age, single yea rs
County■ subtotal b y age, single years
Where:Ppt projected provincial Population at any time, t Pct projected County population at any time, tSI, S2, S3, and S4 refer to result obtained in steps 1, 2, 3, and 4 respectively.
28

CHAPTER FOUR: RESULTS OF POPULATION PROJECTIONS4.1 IntroductionThis chapter presents the findings of the study on primary school-age population projections in Central Province and their interpretation. The analysis of the data commences with the findings of the primary school-age population projections of Central Province, which were then used to generate the enrolment population projections for the five counties, namely Nyandarua, Nyeri, Kirinyaga, Murang’a, and Kiambu.
The study focused on the number of classrooms, toilets, and the numbers of teachers as the key educational indicators.
4.2 Projected PopulationThe study undertook projected populations at national, provincial, and county level. Then projected county population was used in getting the projected primary school-age population for each county in Central Province.
4.2.1 National Population ProjectionsThere are programmes that can be used for projecting population; among them is the Rural-Urban Population Projection (RUP) program (by the U.S Census Bureau). The RUP was utilized in this study. The program uses the cohort component method for projecting the population by age and sex and following the cohort by single years of age. By using interpolated values of central death rates from life tables, the RUP estimates the number of deaths and subtracts them from each cohort. The program is also designed to take into account internal and international migration. In this program, the cohort component method is able to follow a group of people in an age group at a point in time as they survive, while the three demographic components are observed and taken into consideration. Table 4.1 below gives a summary of the projection of Kenya’s population between 2010 and 2030.
29

Table 4.1: Projected Population by Sex, Kenya, 2010-2030
Y e a r 2 0 1 0 2 0 1 1 2 0 1 2 2 0 1 3 2 0 1 4 2 0 1 5 2 0 2 0 2 0 2 5 2 0 3 0
M a le 19 , 065,601 19 , 588 ,325 2 0 , 126,021 2 0 , 6 7 7 ,669 2 1 , 2 4 0 ,7 1 9 2 1 , 8 1 2 ,484 2 4 , 7 6 1 ,134 2 7 , 800 ,805 3 0 , 882 .517
F e m a le 19, 4 4 3 ,865 19 ,9 7 1 ,6 1 6 2 0 , 515 ,290 2 1 , 073 ,755 2 1 , 644 ,417 2 2 ,2 2 4 ,525 2 5 ,2 2 5 ,4 9 5 2 8 ,334 ,112 3 1 , 500 ,666
T o ta l 3 8 ,5 0 9 ,4 6 6 3 9 ,5 5 9 ,9 4 1 4 0 ,6 4 1 ,3 1 1 4 1 ,7 5 1 ,4 2 4 4 2 ,8 8 5 ,1 3 6 4 4 ,0 3 7 ,0 0 9 4 9 ,9 8 6 ,6 2 9 5 6 ,1 3 4 ,9 1 7 6 2 ,3 8 3 ,1 8 3
From the above result, the national population is set to progressively increase from 38.5 million in 2010, to 50 million by 2020, and reach 62.4 million by 2030. Without the effect of HIV/AIDs, the analysis showed that the 2030-projected population would have been more by 1 million people.
4.2.2 Provincial Population ProjectionsProvincial population projections were also generated using the RUP program. Usually regional population projections, when summed up to obtain the country’s total population, may produce inconsistent trends of mortality and fertility. To overcome this problem, the population projection of the whole country was carried out first to act as control total for the sum of the regions.
The sum of all the projections was done to get a national projection and adjusted appropriately to be consistent with the projected national population. Any difference between the projected national and aggregated provincial population were noted and finally, adjusted to keep the consistent with the national population.
An aggregate of the adjusted provincial projection with AIDS and without AIDS was done to confirm that the aggregated national totals matched the national projection. Table4.2 below is an extract showing the population projection trends for all provinces in Kenya.
30

Table 4.2: Projected Population by Province, 2010-2030P r o v in c e 2 0 1 0 2 0 1 1 2 0 1 2 2 0 1 3 2 0 1 4 2 0 1 5 2 0 2 0 2 0 2 5 2 0 3 0
K e n y a 3 8 ,5 0 9 ,4 6 6 3 9 ,5 5 9 ,9 4 1 4 0 ,6 4 1 ,3 1 1 4 1 ,7 5 1 ,4 2 4 4 2 ,8 8 5 ,1 3 6 4 4 ,0 3 7 ,0 0 9 4 9 .9 8 6 ,6 2 9 5 6 ,1 3 4 ,9 1 7 6 2 ,3 8 3 ,1 8 3
N a ir o b i 3,205,541 3,389,174 3,577,982 3,771,695 3,969,582 4,171,082 5,220,981 6,317,231 7,451,358
C e n t r a l 4 ,4 7 6 ,4 3 5 4 ,5 8 9 ,8 9 9 4 ,7 0 6 ,5 9 1 4 ,8 2 6 ,1 2 9 4 ,9 4 7 .6 3 2 5 ,0 7 0 ,4 2 6 5 ,6 9 5 ,1 2 8 6 ,3 2 6 ,4 5 8 6 ,9 6 1 ,0 0 2
C o a s t 3,396,107 3,521,404 3,650,276 3,782,461 3,917,490 4,054,921 4,770,767 5,520,138 6,295,125
E a s te r n 5,787,797 5,825.703 5,863,680 5,901,422 5,938,315 5,973,643 6,119,965 6,209,915 6,239,431
N E a s te r n 1.438,971 1.464,212 1,490,193 1,516,887 1,544,270 1,572,238 1,720,446 1.886,892 2,067,855
N y a n z a 5,558,465 5,685,335 5,815,582 5,949,091 6.085,121 6,222,651 6,919,161 7,617,128 8,309,550
R . V a l le y 10,219,673 10,597,153 10.987.981 11,391,538 1 1,806,601 12,231,928 14,484,569 16,894,299 19,401,865
W e s t e r n 4,426,477 4,487,061 4,549,026 4,612,201 4,676,125 4,740,120 5,055,612 5,362,856 5,656,997
From the above results, Central Province population projection is set to increase from 4.5 million in 2010, to 5.7 million in 2020, and 7 million people by 2030.
4.2.3 Projected School-Age Population by County, 2010-2030Having obtained the projected provincial population, the next step was to get the projected school-age population by county, for the period of study, 2010-2030. The study yielded the following results as tabulated in Table 4.3 below. The study reveals that the Central Province projected primary school-age population is set to increase from 813,000 pupils in 2010 to 965,000 pupils in 2020 and 1.08 million pupils by 2030.
31

Table 4.3: Projected Primary School-Age Population, Central Province, 2010-2030County 2010 2011 2012 2013 2014 2015 2020 2025 2030Kiambu 276,804 280,068 283.583 287,341 291.284 295.243 328,629 358,275 366,996Murang'a 186,034 188,228 190,590 193,116 195,766 198,427 220,865 240,790 246,651Nyandarua 135,243 136,838 138,556 140,392 142,318 144,252 160,564 175,049 179,310Nyeri 123,234 124,687 126,252 127,925 129,681 131,443 146,307 159.506 163,388Kirinyaga 91,315 92,391 93,551 94,791 96,091 97,397 108,411 118,191 121,068
Centra! Province 812,630 822,213 832,532 843,564 855,139 866,762 964,775 1,051,811 1,077,414
It was also noted that Kiambu County would experience the highest increase in the projected school-age population relative to the rest of the counties. Its population will increase from 277,000 pupils in 2010, to 329,000 pupils in 2020, to 367,000 by 2030, a32.5 percent increase in twenty years. Murang’a County was reported to come in second in population change with an increase of about 32.7 percent, while Nyandarua County came in third. Nyeri and Kirinyaga counties will contribute 15 and 11 percent respectively to the total projected school-age population in the province. The trend brought out a unique observation. Since Nyeri was the provincial headquarters for the province, it was expected to attract a high population increase due to labour force pull factor but this appears to take place in Kiambu county instead.
Another aspect observed in the study is the equity in gender parity. By 2030, there will be517,000 male pupils as compared to 501,000 female pupils in Central Province. This translates to a mere difference of 3.1 percent in favour of male pupils. Therefore, by 2030 Central Province would have closed the gap in gender parity in primary education. In attaining this goal, the education sector in Central Province would have revised the gender parity trend. This trend has been there since independent in 1963 and always favoured the boy child due to due social-economic factors.
32

4.2.4 Enrolment Projections, 2010-2030At national level, the enrolment in public primary schools is set to increase from 7.5 million pupils in 2007 to 9.2 million in 2002 and 10.5 million by 2015 (MOE, 2011). While the Ministry of Education targets to have a 100 percent enrolment in primary schools across the country, this target is not attainable in the near future due to several factors like poverty, cultural practices, economic setback, etc. The enrolment target of94.5 percent for 2010 by the Ministry of Education (MOE) was applied tothe projected school-age population.The projected enrolment in Table 4.4 was obtained by multiplying the projected school- age population by 94.5 percent (this target was assumed to remain constant throughout the study period).
P r o je c te d E n r o l m e n t P o p u la t io n = P r o je c te d S c h o o l A g e P o p u la t io n X 94.5%
Table 4.4: Projected Enrolment by County, Central Province, 2010-2030
County 2010 2011 2012 2013 2014 2015 2020 2025 2030
Kiambu 261,580 264,664 267,986 271,537 275,263 279,004 310,554 338,570 346,812
Murang'a 175,802 177,875 180,108 182,495 184,999 187,513 208,717 227,546 233,085
Nyandarua 127,805 129,312 130,935 132,670 134,490 136,318 151,733 165,422 169,448
Nyeri 116,456 117,830 119,308 120,889 122,548 124,214 138,260 150,733 154,402
Kirinyaga 86,292 87,310 88,406 89,577 90,806 92,040 102,448 111,691 114,409
Central Province 767,935 776,991 786,743 797,168 808,106 819,090 911,712 993,961 1,018,156
The projected enrolment population for primary schools in Central Province is set to increased from 768,000 pupils in 2010, to 820,000 pupils in 2015, to 912,000 pupils in 2020, to 994,000 pupils in 2025 and finally reach 1.02 million pupils by 2030 (Table 4.4 above). From the above statistics, it is clear that almost a third of the primary school enrolment in the entire Central Province would come from Kiarnbu County, while approximately 11 percent will come from Kirinyaga County by 2030. These can form a good basis for resource allocation within the Province. From the results obtained, it
33

emerges clearly that Kiambu County will be the most expensive of the five counties to run in terms of education.4.3 Projected Number of Teachers by County, Central Province, 2010-2030
The number of teachers is an important educational tool indicator because, together with the projected enrolment population one, can generate the pupil teacher ratio (PTR). A pupil teacher ratio, which is within the recommended Ministry of Education standard of 40:1, signifies good quality of education offered.Results in Table 4.5 below were obtained by using this ratio and applying the equation shown below.
P rojected P r im a ry School — A g eP ro jec ted N u m b e r o f T eachers = _______E n ro lm e n t________
P upil T eacher R a tio (PTR)
Table 4.5: Projected Number of Teachers, Central Province, 2010-2030
County 2010 2011 2012 2013 2014 2015 2020 2025 2030
Kiambu 6,539 6,617 6,700 6,788 6,882 6.975 7,764 8,464 8,670
Murang'a 4,395 4,447 4,503 4,562 4,625 4,688 5,218 5,689 5,827
Nyandarua 3,195 3,233 3,273 3,317 3,362 3,408 3,793 4,136 4,236
Nyeri 2,911 2,946 2,983 3,022 3,064 3,105 3.456 3,768 3,860
Kirinyaga 2,157 2,183 2,210 2,239 2,270 2,301 2,561 2,792 2,860
Central Province 19,198 19,425 19,669 19,929 20,203 20,477 22,793 24,849 25,454
The analysis shows that the demand for teachers will continue to increase in each county with Kiambu County expected to have 9000 primary school teachers by 2030. This is an increase of about 2100 teachers in twenty years time. There will be a demand for teachers in other counties as well. In Murang’a county, the demand will increase from 4400 teachers in 2010 to 6000 by 2030. The lowest demand for teachers, from 2200 teachers in
34

2010 to 3000 teachers by 2030 was registered by Kirinyaga County. It was also noted that at Provincial level, the demand would grow at an average rate of 1.6 percent per annum.
The primary school attendance rates have been on a steady upward trend over the past years since the implementation of FPE in the year 2003. Therefore as the Country moves closer to the achievement of the universal goal (i.e. Education for all), more attention should be paid to the quality of education offered, so as to maintain the standard, as the issue of education quality attracts more attention from many stakeholders in the education sector.
The pupil-teacher ratio is an important indicator of education quality. The PTR is a good indicator of quality and access of education if it is maintained at the optimal level. If the ratio is below optimal, then there is under utilization of the human resources and if otherwise, there will be a compromise of the quality of education offered.
In crowded classrooms with a high number of pupils per teacher, the quality of education suffers. For pupils, it is difficult to master the curriculum content and teachers can dedicate less time to the needs of each individual student. Furthermore, for pupils in a crowded classroom they make it difficult to concentrate on the material and to learn. Therefore, the results of such overcrowded classroom are lower academic achievement and increased dropout rate.
4.3.1 Projected Number of Classrooms by County, Central Province, 2010-2030One of the most important factors in education is class size. Class size does not refer to the physical size of the classroom. Rather, it refers to the number of pupils in the classroom and the lower the number, the better for teaching and learning process to take place effectively.
Class size is important because if a teacher has too many pupils in a classroom, it is not possible to give each student individual attention. Teachers pay attention that is more
35
individual to students with smaller class sizes and the result is improved performance by students in their schoolwork.
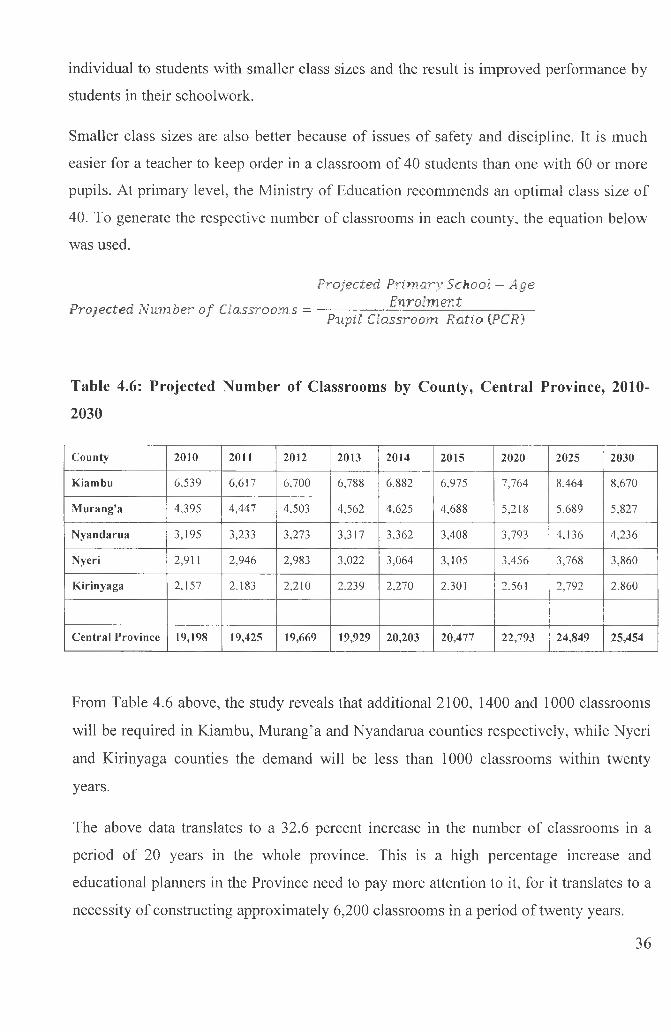
Smaller class sizes are also better because of issues of safety and discipline. It is much easier for a teacher to keep order in a classroom of 40 students than one with 60 or more pupils. At primary level, the Ministry of Education recommends an optimal class size of 40. To generate the respective number of classrooms in each county, the equation below was used.
P ro jected P r im a ry School — A g eP ro jec ted N u m b e r o f C la ssro o m s = _________E n ro lm e n t_________
P upil C lassroom R a tio (PCR)
Table 4.6: Projected Number of Classrooms by County, Central Province, 2010- 2030County 2010 2011 2012 2013 2014 2015 2020 2025 2030
Kiambu 6.539 6,617 6,700 6,788 6,882 6,975 7,764 8,464 8,670Murang'a 4.395 4,447 4.503 4,562 4,625 4,688 5,218 5,689 5,827Nyandarua 3,195 3,233 3,273 3,317 3,362 3,408 3,793 4,136 4,236Nyeri 2,911 2,946 2,983 3,022 3,064 3,105 3,456 3,768 3,860Kirinyaga 2.157 2.183 2,210 2.239 2,270 2.301 2.561 2,792 2.860
Central Province 19,198 19,425 19,669 19,929 20,203 20,477 22,793 24,849 25,454
From Table 4.6 above, the study reveals that additional 2100, 1400 and 1000 classrooms will be required in Kiambu, Murang’a and Nyandarua counties respectively, while Nyeri and Kirinyaga counties the demand will be less than 1000 classrooms within twenty years.
The above data translates to a 32.6 percent increase in the number of classrooms in a period of 20 years in the whole province. This is a high percentage increase and educational planners in the Province need to pay more attention to it, for it translates to a necessity of constructing approximately 6,200 classrooms in a period of twenty years.
36

4.3.2 Projected Number of Toilets by County, for Males and Females, Central Province, 2010-2030The pupil toilet ratio (PToR) is an important education parameter for it is a measure of the level of sanitation and hygiene in a school. To calculate the projected number of toilets, the projected primary school-age enrolment is divided by the respective PToR norm as shown by the equation below.
P ro jec ted P r im a ry School — A g eP ro jec ted N u m b e r o f T o ile ts = ________E n ro lm e n t________
Pupil Toilets Ratio ( PToR)At national level, the Ministry of Education recommends a PToR of 30:1 and 25:1 for boys and girls respectively. The above equation was applied in projecting the number of toilets in each county and using the respective PToR, Tables 4.7 and 4.8 below were obtained.
Table 4.7: Projected Number of Toilets for Females by County, 2010-2030
County 2010 2015 2020 2025 2030
Nyeri 2.289 2,441 2.718 2.963 3,035
Nyandarua 2,488 2,654 2,954 3,221 3,299
Kiambu 5,193 5,539 6,165 6,721 6,885
Murang'a 3,434 3,663 4,077 4,444 4.553
Kirinyaga 1,706 1,820 2,026 2,208 2,262
Central Province 15,110 16,116 17,939 19,557 20,033
The demand for toilets will continue to be on the increase with Kiambu County being at the top. A total of 1,700 and 1,100 toilets will have to be constructed within the projection period in Kiambu and Murang’a Counties respectively. The rest of counties will demand less than a 1,000 toilets within the same time.
37

Since the recommended PToR for boys is different from that of girls, it was then necessary to tabulate the results for boys separately as shown in Table 4.8 below. The same procedure was followed, as was the case for girls.
Table 4.8: Projected Number of Toilets for Males, by County, 2010-2030)County 2010 2015 2020 2025 2030
Nyeri 1,974 2,106 2,344 2,556 2,618
Nyandarua 2,187 2,332 2,596 2.830 2.899
Kiambu 4.392 4,685 5,214 5,685 5,823
Murang'a 2,999 3,198 3,560 3,881 3,976
Kirinyaga 1,455 1,552 1,727 1.883 1,929
Central Province 13,006 13,873 15,441 16,834 17,244
There was no much difference in the trend for the demand of toilets for boys as was the case for girls across the counties in Central Province.
It is important to note that when the PToR of any county is beyond the recommended one, then the quality of sanitation and hygiene will be found wanting. However, in Central Province, almost all the counties had PToR for both boys and girls below the recommended ratio. This is a good indicator on the quality of sanitation in the province. Since the quality of sanitation and hygiene plays an important role in ensuring a good learning environment, then it will be important for the respective counties to meet the toilets demand over the projection period. This can be achieved by constructing the number of toilets for girls and boys as projected in Tables 4.7 and 4.8 respectively.
38
CHAPTER 5: SUMMARY, CONCLUSIONS AND RECOMMENDATIONS5.1 IntroductionThis chapter summarizes the research findings, makes conclusions and recommendations that are based on the research findings. The main objective of the research was to project the primary school-age population for Central Province, the enrolment of primary school- age population in each county in Central Province up to the year 2030 and projected the few educational parameters in the counties, namely the number of Teachers, number of Toilets and the number of Classrooms.
5.2 Summary of the Findings
The general objective of the study was to project the primary school - age population for Central Province up to the year 2030. The study specifically looked at obtaining the population of school - age population in single years using cohort method and the ratio method.
According to the projections, the population size of Kenya is set to increase from 38.5 million, 44 million, 49.9 million, 56.1 million and 62.4 million in the years 2010, 2015, 2020, 2025 and 2030 respectively. This reflects a rapid population increase (about 1 million people every year). In Central Province, the population size was projected to be4.5 million in 2010, 5.1 million in 2015, 5.7 million in 2020, 6.3 million in 2025 and 7 million by 2030.
The study also found out that the projected Central Province primary school-age population would increase from 813,000 pupils in 2010, to 867,000 pupils in 2015, to965,000 pupils in 2020, to 1.05 million pupils in 2025 and finally reach 1.08 million pupils by the year 2030.
The education indicators were also projected. The projection for the numbers of teachers revealed that, teacher’s population will increase from 19,000 in 2010, to 20,000 teachers in 2015, to 23,000 teachers in 2020, to 24,800 teachers in 2025, and finally 25,500
39

teachers by 2030. For the number of classrooms in the province, it was projected that the demand for classrooms will increase from 15,000 classrooms in 2010, to 16,000 classrooms in 2015, to 18,000 classrooms in 2020, to 19,900 classrooms in 2025, and20,000 classrooms by 2030.
The final parameter to consider was the number of toilets. This was found to increase from 14,000 toilets in 2010, to 16,000 toilets in 2020, and 18,000 toilets 2030 for females while for males, it was found to increase from 12,000 toilets in 2010, to 14,000 toilets in 2025, and 15,000 toilets by 2030. The number of teachers and classroom size are indicators that determine the quality and access of education while the number of toilets measures the level of hygiene and sanitation.
5.3 Conclusions
The study indicated that the population of primary school-age population for Central Province will continuously increase, particularly in Kiambu, Nyandarua and Murang’a Counties. The study observed that the three counties contribute about 73.5 percent of the total primary school-age population projected in the province.
The Ministry of Education, together with the county governance structures, should take stock of the educational requirements and plan to mobilise the necessary resources to acquire them within a given span of time.
5.4 Recommendations
Based on the findings, the study has recommendations for policymakers, program planners and education service providers. In so doing, the stakeholders can benefit from this study by having good sanitation and hygiene in schools and manageable pupils teachers ratios. The end product will be quality education in the respective counties.
40
5.4.1 Policy RecommendationsThe study found out that the population of primary school-age population would continue to increase rapidly over time under the current fertility and mortality rates. There is a direct link between the population of school-age population and the educational needs like, number of teachers, number of classrooms and toilets (for good sanitation and conducive environment for learning). The county administration should therefore set policies that address the expansion of the existing facilities and proper utilization of the available resources based on the needs of each county as the study has clearly shown.5.4.2 Recommendations for Further Research
The study observed that there was a rapid increase of school-age population in Kiambu county while for Nyeri and Kirinyaga counties; the increase was not as rapid as was the case with the other three counties. We recommend the extension of this study to investigate further why, there is a large increase in the projected primary school-age population in Kiambu, yet all the five counties have similar demographic perspective as well as similar environmental conditions. There is need to investigate if this trend has any bearing on the fertility differential between the five counties.
41

REFERENCES
Alho J.M. 1990. Stochastic Methods in Population Forecasting. International Journal of Forecasting 6:521-30.
Alho J.M and Spencer B.D. 1997. The Practical Specification of the Expected Error of Population Forecasts. Journal of Official Statistics 13:203-25.
Bongaarts J. and Bulatao R.A. 2000. Beyond Six Billion. National Academy Press. Washington, DC.
Bwila M.I. 2004. Population projection in Kenya: An application of the stable population model. Unpublished MSc Project. Population Studies and Research Institute. University of Nairobi.
Chesswas J. D. 1969. Methodologies of Education Planning for Developing Countries, 2 Volumes, IIEP (UNESCO), Paris.
Dunton N.1994. Planning for Children's Residential Care: A Casebook for Business and Government. Westview Press. Boulder, Colorado.
Fishlow H. 1994. Enrolment Projection in a Multicampus University System: A Casebook for Business and Government. Westview Press. Boulder, Colorado.
Johnstone J.N. 1981. Indicators of Education Systems, Kogan Page and UNESCO. London and Paris.
Kenya National Bureau of Statistics (KNBS) and ICF Macro 2010. Kenya Demographic and Flealth Survey 2008-09. Calverton, Maryland: KNBS and ICR Macro.
Kenya National Bureau of Statistics 2010. Economic Survey 2009. Government Printer, Nairobi.
Kenya Vision 2030. A globally competitive and prosperous Kenya. Nairobi. Government Press 2008.
Kizito P.M.L.1985. The estimate of Adult mortality differentials in Kenya using a life table technique. Unpublished MSc. Population Studies and Research Institute. University of Nairobi.
Lapkoff S. 1993. Projecting Births in a California School District. Paper presented at the annual meeting of the Population Association of America, Cincinnati, April 1-3.
42
Lee R.D. and S. Tuljapurkar. 1997. Stochastic Population Forecasts for the United States: Beyond High, Medium, and Low. Journal of the American Statistical Association 89:1175-89.
Masaviru R. A. 1981. Population Trends and Provision of Primary Education in Nairobi, Kenya. Unpublished MA. Population Studies and Research Institute. University of Nairobi.
Mehta A.C. 1994. Enrolment Projections: Education for All in India, Journal of Education Planning and Administration, Volume VIII, Number 1, January, New Delhi.
Ministry of Education, 2009: Education Facts and Figures. GOK, Nairobi.Ministry of Education, 2011. Spatial Analytical Report for Central Province: School
Mapping, GOK, Nairobi.Ministry of State for Planning, National Development and Vision 2030. 2008. A globally
Competitive and Prosperous Kenya. Nairobi. Government Press.Muruingi A. A. 1988. Kenya’s Population Policy: A Critical Examination. Unpublished
P/G Diploma. Population Studies and Research Institute. University of Nairobi.Ondieki D.N.1989. Population Projections of Nairobi and its Implications on Housing.
1989. Unpublished Msc. Population Studies and Research Institute. University of Nairobi.
Preston S.H, Heuveline P & Guillot M. 2001. Demography: Measuring and Modelling Population Processes. Blackwell Publishers, Oxford.
Rives B. 1994. Strategic Financial Planning for Hospitals: Demographic Considerations. Pp. 251-64 in Demographics: A Casebook for Business and Government. Boulder: Westview Press.
Shryock H.S. 1976. The Methods and Materials of Demography. Academic Press. New York.
U.S Bureau of Census 1996. Current Population Reports, Series p-25, No. 1092. Washington, DC. U.S. Government Printing Office.
Uganda Bureau of Statistics. 2007. Projections of Demographic Trends in Uganda 2007- 2017, Volume 1.Kampala .Government Press.
United Nations. 2004. Methodology of the United Nations Population Estimates and Projections. New York.
43

United Nations. 2010. World Population Prospects: The 2010 Revision, Vol I, Comprehensive Tables. New York.
United Nations. 2011. World Population Prospects: The 2010 Revision. New York.Wekesa J.M.1989. Kenya’s Population Projections and Some of their Implications to
Education Planning. Unpublished MSc Thesis. Population Studies and Research Institute. University of Nairobi.
Win T. 1990. Population Projections for Myanmar (1983-2013). Asia-Pacific Population Journal, Vol. 6, No.2.
44