principles for nearly zero-energy buildings - bpie study.pdf · editing team chantal despret marina...
TRANSCRIPT
Principles for nearly Zero-Energy Buildings | 1
PrinciPles for nearly Zero-energy BuildingsPaving the way for effective implementation of policy requirements
Project coordinatorBogdan Atanasiu
Study elaborated in cooperation with:Ecofys Germany GmbH Authors: Thomas Boermans, Andreas Hermelink, Sven Schimschar, Jan Grözinger, Markus Offermann
Danish Building Research Institute (SBi)Authors: Kirsten Engelund Thomsen, Jørgen Rose, Søren O. Aggerholm
Photos © Residential buildings: Passiefhuis-platform vzw, Passivehouses Kalmthout, Architect Gert Willemen / Bilzen, Architect Eric Ubachs / Brecht, Jan StrangerTertiary buildings: Passiefhuis-platform vzw (Havenbedrijf Gent, evr-architecten / Natuur- en Milieucentrum De Bourgoyen, evr-architecten). Sca Architectes Associes and Marc Detiffe (Empereur, Elia, Aeropolis II)
Editing teamChantal DespretMarina EconomidouNigel GriffithsJoana MaioIngeborg NolteOliver Rapf
Graphic DesignLies Verheyen - Mazout.nu
Published in November 2011 by Buildings Performance Institute Europe (BPIE)
Copyright 2011, Buildings Performance Institute Europe (BPIE). Any reproduction in full or in part of this publication must mention the full title and author and credit BPIE as the copyright owner. All rights reserved.
ISBN: 9789491143021
forewordBuildings account for around 40% of total energy consumption and 36% of CO2 emissions in Europe. The reduction of energy consumption and the use of energy from renewable sources in the buildings sector therefore constitute important measures which are needed to reduce energy dependency and greenhouse gas emissions. The mitigation potential of emissions from buildings is important and as much as 80% of the operational costs of standard new buildings can be saved through integrated design principles, often at no or little extra cost over the lifetime of the measure. The recast Directive on the energy performance of buildings (EPBD) stipulates that by 2020 all new buildings constructed within the European Union after 2020 should reach nearly zero-energy levels. This means that in less than one decade, all new buildings will demonstrate very high energy performance and their reduced or very low energy needs will be significantly covered by renewable energy sources.
This very ambitious commitment fully supports the radical cuts in greenhouse gas emissions identified by the 4th report of the United Nations Intergovernmental Panel on Climate Change as being necessary to avoid the risks of irreversible climate change.
In addition, the move towards very low-energy buildings will trigger a deep market transformation of the construction sector and requires an important market deployment of very efficient technologies. This market up-scaling has important employment potential and, according to the estimates, hundreds of thousands jobs may be created and induced across Europe. Following the subsidiarity principle and also acknowledging the variety in building culture and climate throughout Europe, the Energy Performance of Buildings Directive requires EU Member States to elaborate national definitions and to draw up national plans for nearly Zero-Energy Buildings, reflecting specific national and regional conditions. Therefore, it is critical to have sustainable, robust and feasible country definitions and EU standards to support the successful implementation of the Directive, for realizing the savings potential and for maximizing the socio-economic benefits. More than one quarter of the 2050s building stock is still to be built and consequently more efforts are needed for supporting the effective implementation of low-energy buildings across Europe by providing guidance, common principles and quality checks of the concepts.
This study is among the first to do that and I warmly congratulate the Buildings Performance Institute Europe and the authors for this timely and useful initiative.
Paolo BertoldiSenior energy efficiency officerInstitute for Energy and TransportEuropean Commission Joint Research Centre
acknowledgements
This project was initiated by Tudor Constantinescu, first BPIE executive director and continued by Rod Janssen in his function as Interim Executive Director of BPIE. We would like to thank both of them for their inspiration and guidance.
BPIE would like to express its gratitude towards the organizations and experts that contributed to
improving this study by reviewing the draft report, by providing written suggestions or by actively
participating to our stakeholders consultation meeting on 10th May 2011:
Attia Shady (Université Catholique de Louvain), Tomislav Bagatin (European Partners for Environment),
Randall Bowie (Rockwool/EURIMA), Remi Carrié (INIVE), Frans Driessen (BuildDesk), Susanne Dyrboel
(Rockwool/EuroAce), Heike Erhorn-Kluttig (Fraunhofer Institute for Buildings), Kurt Emil Eriksen (Active
House Alliance, VKR Holding), Valeria Ferrando (E2B), Vivien Fourcade (Glass for Europe), Adam Hinge
(Sustainable Energy Partnerships), Michaela Holl (DG Energy), Adrian Joyce (EuroAce), Alaitz Landaluze
(Inno basque), Oliver Loebel (PU Europe), Patrice Millet (EC DG Research), Erwin Mlecnik (Passiefhuis-
Platform), Aleksandra Novikova (Climate Policy Initiative), Robert Nuij (EC, DG Energy), Yamina Saheb
(International Energy Agency), Niels Schreuder (Wuppertal Institut), Dietmar Schüwer (Wuppertal
Institut), Gordon Sutherland (EACI/Intelligent Energy Europe), Chantal Tiekstra (BuildDesk), Zsolt Toth
(RICS), Dick van Dijk (TNO).
Principles for nearly Zero-Energy Buildings | i
executive summaryThe European Union (EU) aims at drastic reductions in domestic greenhouse gas (GHG) emissions of 80% by 2050 compared to 1990 levels. The building stock is responsible for a major share of GHG emissions and should achieve even higher reductions of at least 88% - 91%i. Therefore, without consequently exploiting the huge savings potential attributed to the building stock, the EU will miss its reduction targets. More than one quarter of the 2050s building stock is still to be built. The energy consumption and related GHG emissions of those new buildings need to be close to zero in order to reach the EU’s highly ambitious targets.
The recast of the Energy Performance of Buildings Directive (EPBD) introduced, in Article 9, “nearly Zero -Energy Buildings” (nZEB) as a future requirement to be implemented from 2019 onwards for public buildings and from 2021 onwards for all new buildings. The EPBD defines a nearly Zero-Energy Building as follows: [A nearly Zero-Energy Building is a] “building that has a very high energy performance… [ ]. The nearly zero or very low amount of energy required should to a very significant extent be covered by energy from renewable sources, including renewable energy produced on-site or nearby.”
Acknowledging the variety in building culture and climate throughout the EU, the EPBD does not prescribe a uniform approach for implementing nearly Zero-Energy Buildings and neither does it describe a calculation methodology for the energy balance. To add flexibility, it requires Member States to draw up specifically designed national plans for increasing the number of nearly Zero-Energy Buildings reflecting national, regional or local conditions. The national plans will have to translate the concept of nearly Zero -Energy Buildings into practical and applicable measures and definitions to steadily increase the number of nearly Zero-Energy Buildings.
Obviously the qualitative nature of criteria in the above-mentioned nZEB definition leaves room for interpretation. While illustrating the major pillars of future nZEB – drastically reduced energy demand and a major share of renewable energy supply - the terms “nearly zero or very low amount of energy”, “very significant extent” (to which the energy required should be covered by renewable energy sources), and “renewable energy produced on-site or nearby” require further examination and definition.
In addition to the flexibility of the general EPBD definition for nZEB, several questions arise concerning the practicalities of a nZEB definition:
• howtokeepthenZEBdefinitionsufficientlyflexiblesoastobuilduponexistinglow-energystandardsand enable energy-positive buildings?
• howtoproperlydefineandsettheshareofrenewableenergy?
• howtodeterminetheoptimalbalancebetweenenergyefficiencyandrenewableenergy?
• howto forgethenZEBdefinitionasa‘silverbullet’ for reachingthesame levelsofenergyandGHGreduction?
• howtolinkthenZEBdefinitiontocost-optimalityii principles in order to have convergence and continuity?
i COM(2011) 112 final, A Roadmap for moving to a competitive low carbon economy in 2050.ii Cost-optimal methodology will be leading the improvement of the energy performance for new buildings before the implementation of the nZEBs approachin2021.Thecost-optimalmethodologyisrequiredbyArticle5oftherecastEPBD(Directive2010/31/EU)on‘calculationofcost-optimallevels of minimum energy performance requirements’.
ii | Principles for nearly Zero-Energy Buildings
At the present moment, the European Commission, EU Member States, stakeholders and experts are discussing the different aspects of nZEBs. Overall, there is an urgent need to establish common principles and methods to be taken into account by EU Member States for elaborating effective, practical and well thought-out nZEB definitions.
Objective Of this studyThe overarching objective of this study is to contribute to a common and cross-national understanding on:
• anambitious,cleardefinitionandfastuptakeofnearlyZero-EnergyBuildingsinallEUMemberStates;
• principlesofsustainable,realisticnearlyZero-EnergyBuildings,bothnewandexisting;
• possibletechnicalsolutionsandtheirimplicationsfornationalbuildingmarkets,buildingsandmarketplayers.
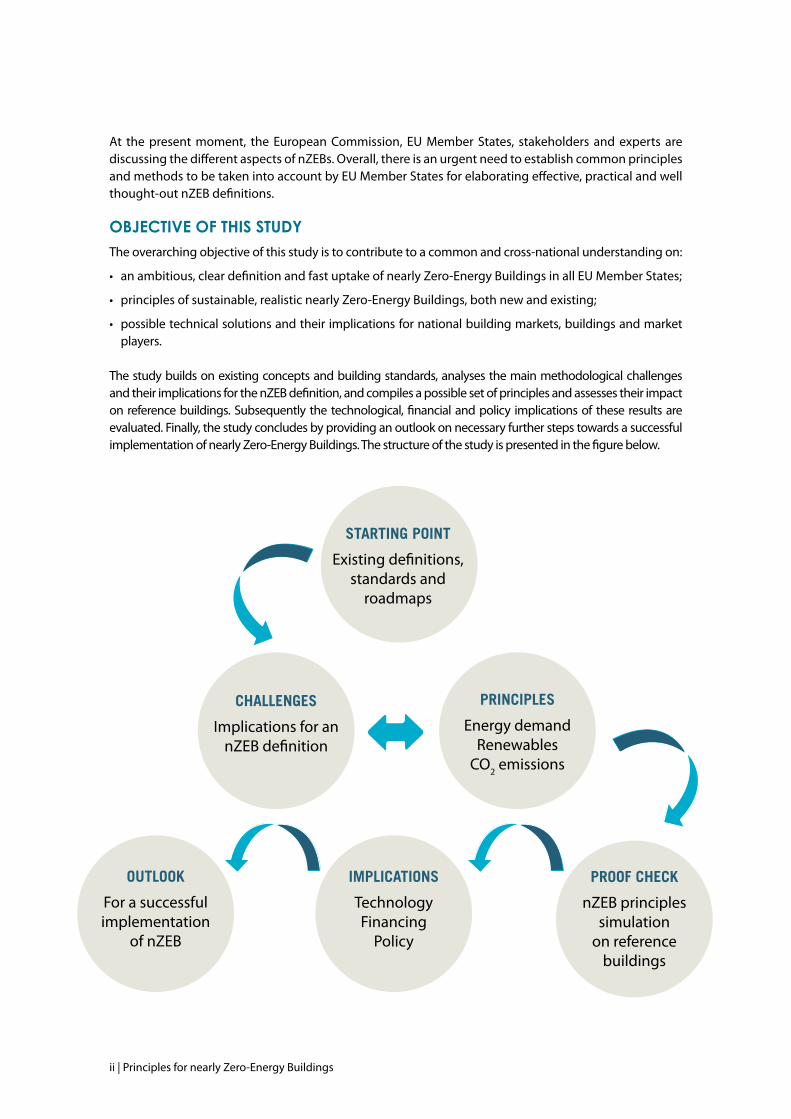
The study builds on existing concepts and building standards, analyses the main methodological challenges and their implications for the nZEB definition, and compiles a possible set of principles and assesses their impact on reference buildings. Subsequently the technological, financial and policy implications of these results are evaluated. Finally, the study concludes by providing an outlook on necessary further steps towards a successful implementation of nearly Zero-Energy Buildings. The structure of the study is presented in the figure below.
starting Point
Existing definitions, standards and
roadmaps
PrinciPles
Energy demandRenewables
CO2 emissions
cHallenges
Implications for an nZEB definition
imPlications
Technology Financing
Policy
outlook
For a successful implementation
of nZEB
Proof cHeck
nZEB principles simulation
on reference buildings
Principles for nearly Zero-Energy Buildings | iii
frOm existing lOw-energy building cOncepts tOwards the epbd’s nZeb requirementsThroughout Europe there is a large variety of concepts and voluntary standards for highly energy efficient buildings or even climate neutral buildings: passive house, zero-energy, 3-litre, plus energy, Minergie, Effinergie etc. In addition, these definitions refer to different spheres: site energy, source energy, cost or emissions. Moreover there may be further variations in the requirements of the above standards depending on whether new or existing, residential or non-residential buildings are under consideration. In a nutshell, the views on how nearly Zero-Energy Buildings should be defined, on which sphere to make the basis, as well as on which means and techniques are adequate, differ greatly.
Typically, low-energy buildings will encompass a high level of insulation, very energy efficient windows, a high level of air tightness and natural/ mechanical ventilation with very efficient heat recovery to reduce heating/cooling needs. Passive solar building design may boost their energy performance to very high levels by enabling the building to collect solar heat in winter and reject solar heat in summer and/or by integrating active solar technologies (such as solar collectors for domestic hot water and space heating or PV-panels for electricity generation). In addition, other energy/resource saving measures may also be utilized, e.g. on-site windmills to produce electricity or rainwater collecting systems.
Today, more than half of the Member States do not have an officially recognised definition for low or Zero-Energy Buildings. Various Member States have already set up long-term strategies and targets for achieving low-energy standards for new houses.
The existing low-energy building definitions among EU Member States have common approaches but also significant differences. Aggregation and improvement of the existing concepts is needed in order to align them to the nearly Zero-Energy Buildings requirements indicated by the EPBD and the Renewable Energy Directive. We would like to highlight three main issues to be considered as the existing low-energy buildings definitions evolve towards a nearly Zero-Energy Building definition:
• Mostofthelow-energybuildingdefinitionsintheEuropeancountriesspecifyamaximumpercentageof their national building standards’ limit for primary energy consumption per square meter and year. However, there are variations between EU Member States on how to calculate and express the primary energy consumption of a building (e.g. using net or gross floor areas).
• Theexistinglow-energybuildingdefinitionsdonotspecificallyindicateacertainshareofrenewablesin the energy supply. The EPBD Recast indicates that energy required should be covered to a significant extent by renewable sources. Especially this lack of guidance on the share of renewables generates a mismatch between current regulations or definitions and the above-cited EPBD nearly zero-energy definition.
• TherearevariouselementsofexistingconceptsthatcanbeusedforthedevelopmentofanearlyZero-Energy Building definition, such as the principle of working with overarching targets accompanied by “sub-thresholds” on specific issues (such as requirements for maximum primary energy demand and additional limits for heating energy demand within the passive house concept).
nearly ZerO-energy buildings: main challenges and implicatiOnsThe study analyses ten challenges and their implications for setting a sustainable and practical nZEB definition and proposes principles to be considered when setting up a practical definition. The challenges identified are presented as questions that have to be addressed for the transposition of a nearly Zero-Energy Buildings requirement into a practical, consistent and sustainable definition. The analysis of these challenges has led to several important implications for the nZEB definition. The main challenges and their implications are presented on the following page.
iv | Principles for nearly Zero-Energy Buildings
challenge no 1:How and to what extent do current sectoral and overall targets of the EU regarding CO2 emissions, energy efficiency, renewable energies and other indicators affect the ambition level and set-up of a nearly Zero-Energy Building definition?
Implication for the nZEB definitionIf EU countries want to meet the 2050 targets for CO2 reduction, then the nZEB requirements for new buildings also have to include nearly zero carbon emissions below approx. 3kgCO2/m²yriii. A weaker ambition for new buildings between 2021 and 2050 would necessarily lead to an even higher and almost unrealistic savings requirement of “90% plus” for the renovation of today’s building stock.
challenge no 2: How different are the solutions between nearly zero CO2 and nearly zero (primary) energy solutions for individual buildings and what are the implications for a suitable definition of nZEBs?
Implication for the nZEB definitionThe first nZEB implication identified is the need for a consistent definition, which should contribute at the same time to both energy and CO2 emission reductions. Hence, the minimum requirements for the energy performance of the building should use an energy indicator that can properly reflect both energy and CO2 emissions of the building as the reduced energy consumption should lead to a proportional reduction of CO2 emissions.
In general, the primary energy use of a building accurately reflects the depletion of fossil fuels and issufficiently proportional to CO2 emissions. Proportions are only distorted when nuclear electricity isinvolved. Nevertheless, if a single indicator is to be adopted, then the energy performance of the building should be indicated in terms of primary energy, as in line with current EPBD. However, to reflect the climate relevance of a building’s operation, CO2 emissions should be added as supplementary information.It should be noted that there are additional requirements for ensuring a match between nZEBs and climate targets.
In particular, it is very important that the conversion factors from final to primary energy are based on reality and not influenced by political considerations or by an inaccurate approximation. Moreover the conversion factors should be adapted continuously to the real situation of the energy system.
challenge no 3: Which choices should be made within a definition regarding time disparities (e.g. daily vs. annual balance) and local disparities (e.g. on-site vs. off-site production) between produced and consumed energy?
Implication for the nZEB definitionThe nZEB definition should properly deal with local and temporal disparities of renewable energy production. This is necessary in order to, on one hand, maximise the renewable energy share and the emission reductions and, on other hand, ensure a sustainable development of the local heating and cooling systems. Therefore the nZEB definition should address the following:
• Astolocaldisparities,themostobviousandpracticalsolutionistoacceptandcountallon-site,nearbyand off-site production from renewable energy sources when calculating the primary energy use of the
iii Starting from CO2 emissions for the building sector of approximately 1.100 MtCO2 in 1990 (direct and indirect emissions for heating, domestic hot water and cooling purposes) and assuming a useful floor area in 2050 of 38 billion m² in 2050, a 90% decrease of emissions would require an average CO2 emissions of maximum 3 kgCO2/(m²yr).: 1,100MtCO2 x (100%-90%) / 38 billion m² = 2.89 kg/(m²yr).
Principles for nearly Zero-Energy Buildings | v
building. Allowing for only on-site and nearby renewable energy production could be a considerable barrier in implementing nZEBs. Thus the nZEB definition should be flexible and adaptable to changes in local plans and strategies. For instance, a district heating connection should be mandatory for nZEBs when there are plans for a renewable powered district heating plant that offers supply at a reasonable price. Off-site renewable energy should be allowed as well because this offers more opportunities for ‘green’energyproduction,openingandnot restricting the futureprogress towardsenergy-positivebuildingsiv. However, off-site renewable energy has to be properly controlled and certified for avoiding fraud and double counting.
• TemporaldisparitiesinrenewableenergysupplymayinfluencetheassociatedGHGemissionsofthebuilding when off-site energy is used to compensate for periods with a lower renewable energy supply than the building’s actual energy demand. Therefore, the period over which the energy balance of the building is calculated is important. The practical solution, offering at the same time a reasonable compromise, is to accept either monthly or annual balances. If annual balances are allowed, it will be necessary to introduce an additional verification methodology to take into account the associated GHG emissions of the energy supply over the period. The monthly energy balances are short enough to offer a reasonable guarantee for the emissions associated with the energy supplied to the building. In order to keep the concept as simple as possible it seems preferable and sufficient to use for the time being an annual balance, but to leave the option open for a more accurate yet demanding monthly energy balance in the future.
challenge no 4: How to ensure that a definition of nearly Zero-Energy Buildings avoids lock-in effects and allows the concept to be expanded later towards energy-positive buildings?
Implication for the nZEB definitionIn order to ensure maximum flexibility and to minimise the risk of lock-in situations the nZEB definition should take into account the following:
• Theevaluationofthebuildingsenergyperformanceshouldbebasedonanannualbalancebutmovetowards a more accurate monthly balance in the future.
• Thesystemboundariesshouldnotbetootight,e.g.inclusionofrenewableenergyfromthegridshouldbe possible in specific cases when on-site/nearby capacities cannot be installed due to spatial and building geometry constrictions and/or weather conditions.
• Theenergybalancemusttakeintoaccountthequalityoftheenergyandbeassessedseparatelyforelectricity and heating. Hence, the quality of the energy production should be considered as being an important condition for avoiding a misleading nZEB concept with ineffective or counter-productive achievements.
challenge no 5: How can a definition be shaped to be applicable or transferable to different climates, building types, building traditions etc. in a way that reflects such differing circumstances and allows flexibility without leading to (too) complex rules?
Implication for the nZEB definitionA proper nZEB definition should take into account the climate, building geometry and usage conditions as follows:
iv Energy-positive buildings are buildings with on-site renewable energy production higher than the building’s energy demand.
vi | Principles for nearly Zero-Energy Buildings
• Climate: Two options are suggested for taking into account climate conditions in the nZEB definition:
- A first option is to calculate the energy requirement for an average European building located in an average European climate on the basis of the EU’s 2050 climate target. This average energy requirement may then be corrected and adapted at national/regional level, e.g. by using the relation of national/regional vs. European cooling degree days (CDD)+ heating degree days (HDD).
- A second option is to calculate and impose a fixed value, being zero or very close to zero, and the same for each country and all over Europe. Such option would be chosen in the event that the first option appears to be too complicated or it will be necessary to have an absolute zero-energy balance for all new European buildings in order to reach the climate targets.
• Geometry: It appears unfair for buildings with an “easy” shape to have to compensate for the unfavorable geometries of other buildings. Hence, for new buildings differences in geometry do not seem to be a striking argument for differences in energy requirements (e.g. in kWh/m²yr) and the requirements should therefore be independent of geometryv. On the other hand, for the existing building stock this might be seen differently and the geometry aspects should be further analysed in order to avoid additional unfair burdening of the building owners.
• Usage: All residential buildings should meet the same requirements as they typically have the same usage patterns. In addition, non-residential buildings with a similar usage pattern as residential buildings may still have the same requirements as residential buildings. The other non-residential buildings should be classified in as few categories as possible (following the main criteria of indoor temperature, internal heat gains, required ventilation etc.) and should have particular energy performance requirements.
challenge no 6: Should a definition of nearly Zero-Energy Buildings and related thresholds include or exclude household electricity (plug load) and in which way could this be done?
Implication for the nZEB definitionFor providing convincing guidance on a nearly Zero-Energy Buildings definition, it may well be questioned if the EPBD lists all the relevant energy uses that are actually related to the ultimate goal of minimising building related CO2 emissions. Based on an extensive analysis, the following is proposed:
• AccordingtotheEPBDonlytheenergyuseofequipmentprovidingsomeselected“buildingservices”which are heating, cooling, ventilation and lighting is to be considered in an nZEB definition. Nevertheless there is some further integrated equipment providing building services, which may be even mandatory by law in most of the Member States, but which is missing in the EPBD and thus should be a part of it. For example lifts and fire protection systems are not within the scope of the nZEB definitionfromtheEPBD,butarepartofthedefault‘buildingservices’.
• Atthispointintime,includingelectricityforappliancesinthedefinitionofnZEBisnotrecommended,because it is not in the current scope of the EPBD. However, in the long run, it is advisable to complement the energy uses currently mentioned in the EPBD by all other energy uses in the buildings. Household electricity or electricity for appliances should be included in a future version of the EPBD, e.g. via a given value per person or m² (similar to the approach regarding the need for domestic hot water in current regulations) and consequently in the nZEB definition.
• Afeasible interimsolutionforavoidingsub-optimisationmightbetosystemizeallenergyusesandclearly show the subset of uses currently included in the EPBD. The energy uses outside the scope of the EPBD do not necessarily need to be integrated in the same energy performance indicator, but
v An exception might be made for single family homes with a very small floor area per capita as in the end it is the absolute [kWh/yr] and not the specific consumption [kWh/m2y] that counts.
Principles for nearly Zero-Energy Buildings | vii
they might be mentioned using the same unit along with the EPBD indicator in order to get the whole picture.
• ToachieveasustainablenZEBdefinitionitmaybeimportanttotakeintoaccountalltheenergyusesofa building for two main reasons:
- In today’s very low-energy or passive houses the amount of household electricity or electricity for appliances respectively has the same order of magnitude as that needed for space heating/cooling and domestic hot water. The same is true for the technical systems providing building services.
- In Europe, on average, electricity consumption represents comparatively high amounts of primary energy consumption and related carbon dioxide emissions. The same goes for energy use in the construction of the building and its supply systems as well as for disposal of the building.
challenge no 7: Should a definition of nearly Zero-Energy Buildings and related thresholds include or exclude the production and disposal stage of building elements, components and systems and in which way could this be done?
Implication for the nZEB definitionA life-cycle assessment (LCA) approach for nZEB is definitely far beyond the current intention of the EPBD, but might be in a future recast. There are some practical recommendations to be considered for the time being:
• Energy consumption during the construction and disposal phases of a building becomes moreimportant the more the energy consumption during the use phase decreases.
• DuetoinsufficientconsistencyofresultsfromdifferentLCAtools itmaybetooearlytorequireLCAinformation as part of a threshold value. Nevertheless, in principle, it would make sense to include LCA information in the evaluation of a building’s energy performance.
• A practical solution for the near futurewould be to estimate the energy need for production anddisposal and require an informative mention of this value in addition to the indicator(s) reflecting the energy performance of the building. Including the information regarding energy consumption during the phases of construction and disposal of a building will underline the importance of each life cycle phase’s energy consumption. However, for the time being it is not suggested that life cycle energy consumption should be included within the scope of the EPBD.
challenge no 8: Should it be possible within the definition of nearly Zero-Energy Buildings (regarding demand side and supply side) to look at groups of buildings rather than at a single building?
Implication for the nZEB definitionThe EPBD clearly focuses on the energy performance of individual buildings. However, there may be good reasons to address a group of buildings and to have a common energy balance for them. For assessing the opportunity of considering groups of buildings instead of a single building, the energy demand and the energy supply need to be analysed separately.
• As to the energy demand side, it may be a solution to compensate specific disadvantageouscircumstances affecting one or a few selected buildings within a group of buildings (e.g. shading from landscape and thereby reduced solar gains) that do not allow each of these selected buildings to achieve a required very low energy demand with an acceptable level of effort. However, this would
viii | Principles for nearly Zero-Energy Buildings
mean that the owner of a building which is part of such a pool would depend on what is actually built and maintained by other owners. Apparently the situation is easier when having one owner for the whole new settlement, e.g. a building complex owned and rented by a real-estate company. However, especially in the case of new buildings, there seems to be little evidence to explain why a certain requiredthresholdshouldnotbereachedatthe levelofthe individualbuilding;theenergyrelatedor financial synergies from pooling buildings are not obvious. Consequently, there are no sufficiently strong reasons for clustering buildings.
• Astotheenergysupplyside,itisclearlywithintheEPBDscopetousenearby/on-sitecentralsystemsasan alternative to individual systems per building. Such central supply can yield benefits e.g. in terms of investment savings, better efficiency and better possibilities for seasonal storage.
challenge no 9: What guidance can/needs to be given regarding the balance of energy efficiency and renewable energy within the nearly Zero-Energy Buildings definition?
Implication for the nZEB definitionIt is necessary and also in line with the EPBD’s nZEB definition to have a threshold for maximum energy demand as well as a requirement for the minimum percentage of renewables. For this reason, the renewable energy share should take into account only active supply systems such as solar systems, pellet boilers etc. The passive use of renewable energy, e.g. passive solar gains, is an important design element of nearly Zero-Energy Buildings, but it seems logical - and also in line with EPBD-related CEN standards - to take these into account for the reduction of gross energy needs.
A threshold for energy demand could be set for each country in a given corridor, defined top-down at EU level according to the needs imposed by longer term climate targets and climate adjusted at country/regional level, e.g. based on HDD/ CDD.
The minimum share of renewables to cover the remaining nearly zero or very low energy demand of the building might be chosen in the range of 50%-90% in order to be consistent with EU energy and climate targets. Moreover, there are two more reasons for choosing a compulsory range of 50%-90%:
• Theproposed range is in linewith thenZEBdefinition fromEPBDwhich is asking that the energydemand of the building be covered from renewable sources to a “very significant extent”.
• Theproposed range is likely to satisfy all thepotential requirements for achieving theoverarchingtargets for energy or GHG respectively.
The requirement proposed above for the renewable energy share would contribute to a paradigm change moving from renewable energy being a minor substitute or complement of a fossil fuel based energy system towards an energy system where renewable energy is dominant, while fossil systems exist only to a certain extent, e.g. to secure the supply during peak loads or as a backup source.
Whereas the bandwidth of the necessary share of renewable energy supply can be derived from technical and financial boundary conditions, the exact share to be achieved at EU or country levels is likely to remain subject to political considerations. A possible practical solution is to start with a minimum requirement for the renewable energy share as part of the nZEB definition and to stimulate a further increase of the share.
Principles for nearly Zero-Energy Buildings | ix
challenge no 10: Is there a necessary or optional link between the principle of cost-optimality and the concept of nearly Zero-Energy Buildings within the EPBD recast and what could be the implications?
Implication for the nZEB definitionThe recast EPBD stipulates that the EU Member States shall ensure minimum energy performance requirements for buildings to be set ‘with a view to achieving cost-optimal levelsvi’. Whereas the Commission is to provide the comparative framework cost-optimal methodology, each EU Member State has to do the calculations at country level, to compare the results with its energy performance requirements in force and to improve those requirements accordingly if necessary.
Beyond delivering information for the update of current requirements over the coming years, the cost-optimal methodology is suitable for gradually steering cost-optimal levels towards nZEB levels by 2021. Indeed, the cost-optimal methodology may be used, for instance, to calculate the needed financial support (soft loans, subsidies etc.) and market developments (cost reduction for certain technology etc.) for facilitating a smooth and logical transition from today’s energy performance requirements towards nZEB levels in 2021.
Consequently, when fixing a threshold for the energy demand of a nZEB, it is recommended to leave some freedom for placing this threshold within a certain corridor, which could be defined as follows:
• Theupper–leastambitious-limit,definedbytheenergydemandofdifferentbuildingtypes,wouldresult from applying the cost-optimal levels according to Article 5 of the EPBD recast.
• Thelower–mostambitious-limitofthecorridor,wouldbesetbythebestavailabletechnologythatisfreely available and well introduced on the market, e.g. as, currently, triple glazing for windows.
The EU Member States may determine their national requirement for the buildings’ energy demand within the limits of the above corridor, according to the specific national context. Imposing a corridor and not a fixed threshold, will allow specific country solutions for achieving an overarching target (primary energy / CO2-emissions), based on the most convenient and affordable balance between minimum requirements for energy demand and renewable energy share.
Today we assume that, on the one hand, there may still be a gap to be bridged between cost-optimal levels and nZEB levels by 2021, at least in some EU Member States. On the other hand, in several Member States it is also possible to reach convergence between cost-optimal and nZEB levels by 2021, mainly due to the estimated increase in energy pricesvii and expected decrease in technology costsviii.
principles fOr nearly ZerO-energy buildingsTo achieve a suitable definition, related facts and findings need to be seen in a broader societal context and need to be transferred into a practical standard, taking into account financial, legal, technical and environmental aspects. Analysing the implications identified above, it becomes obvious that most of them interact or require the consideration of one or several societal aspects. Consequently, the principles for an nZEB definition should be built on the same broad perspective, should take into account all financial, legal, technical and environmental aspects and should meet the present and future challenges and benefits. Hence, a proper and feasible nZEB definition should have the following characteristics:
vi The cost-optimal level shall lie within the range of performance levels where the cost-benefit analysis calculated over the estimated economic lifecycle is positive. The cost-optimal level is defined in Article 2 and described in Article 5 of the EPBD (Directive 2010/31/EU).
vii Incl. the national energy tax system development as part of the national activities towards more economic solutions.viii Due to volume effects induced by the introduction of the nZEB requirement.
x | Principles for nearly Zero-Energy Buildings
• Tobeclearinitsaimsandterms,toavoidmisunderstandingsandimplementationfailures.
• Tobetechnicallyandfinanciallyfeasible.
• Tobesufficientlyflexibleandadaptableto localclimateconditions,buildingtraditionsetc.,withoutcompromising the overall aim.
• Tobuildontheexistinglow-energystandardsandpractices.
• Toallowandevenfosteropencompetitionbetweendifferenttechnologies.
• Tobeambitiousintermsofenvironmentalimpactandtobeelaboratedasanopenconcept,abletokeep pace with the technology development.
• Tobeelaboratedbasedonawideagreementofthemainstakeholders(politicians,designers,industry,investors, users etc.).
• Tobeinspiringandtostimulatetheappetiteforfasteradoption.
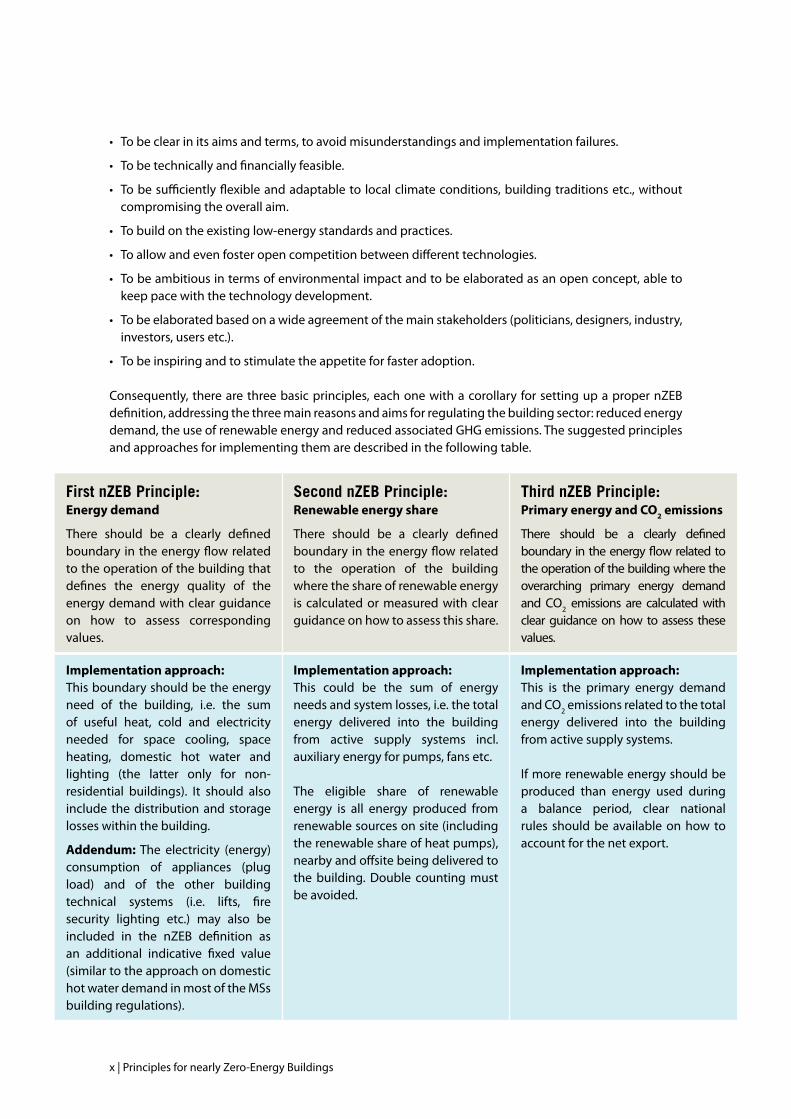
Consequently, there are three basic principles, each one with a corollary for setting up a proper nZEB definition, addressing the three main reasons and aims for regulating the building sector: reduced energy demand, the use of renewable energy and reduced associated GHG emissions. The suggested principles and approaches for implementing them are described in the following table.
first nZeB Principle:Energy demand
There should be a clearly defined boundary in the energy flow related to the operation of the building that defines the energy quality of the energy demand with clear guidance on how to assess corresponding values.
second nZeB Principle:Renewable energy share
There should be a clearly defined boundary in the energy flow related to the operation of the building where the share of renewable energy is calculated or measured with clear guidance on how to assess this share.
third nZeB Principle:Primary energy and CO2 emissions
There should be a clearly defined boundary in the energy flow related to the operation of the building where the overarching primary energy demand and CO2 emissions are calculated with clear guidance on how to assess these values.
Implementation approach: This boundary should be the energy need of the building, i.e. the sum of useful heat, cold and electricity needed for space cooling, space heating, domestic hot water and lighting (the latter only for non-residential buildings). It should also include the distribution and storage losses within the building.
Addendum: The electricity (energy) consumption of appliances (plug load) and of the other building technical systems (i.e. lifts, fire security lighting etc.) may also be included in the nZEB definition as an additional indicative fixed value (similar to the approach on domestic hot water demand in most of the MSs building regulations).
Implementation approach: This could be the sum of energy needs and system losses, i.e. the total energy delivered into the building from active supply systems incl. auxiliary energy for pumps, fans etc.
The eligible share of renewable energy is all energy produced from renewable sources on site (including the renewable share of heat pumps), nearby and offsite being delivered to the building. Double counting must be avoided.
Implementation approach: This is the primary energy demand and CO2 emissions related to the total energy delivered into the building from active supply systems.
If more renewable energy should be produced than energy used during a balance period, clear national rules should be available on how to account for the net export.
Principles for nearly Zero-Energy Buildings | xi
validatiOn Of nZeb principles: simulatiOn Of reference buildings in different climate ZOnesTo verify and evaluate the proposed nZEB principles and implementation approaches, indicative simulations on reference buildings were performed.
The main challenge of the simulation was to provide robust insights into the nZEB principles’ effect by applying them to a set of reference buildings, sufficiently representative of the wide variety of building-types, while considering at the same time the influence of different European climate zones.
Within an extensive BPIE assessment of the European building stockviiii, residential buildings turned out to represent around 75% of the EU building stock in terms of floor area, where single family houses account for 64% and multi-storey family buildings for 36%. As to non-residential buildings, 58% are multi-storey buildings consisting of offices and administrative buildings, educational buildings, hospitals and hotels.
viiii Europe’s buildings under the microscope. A country-by-country review of the energy performance of buildings, Buildings Performance Institute Europe 2011.
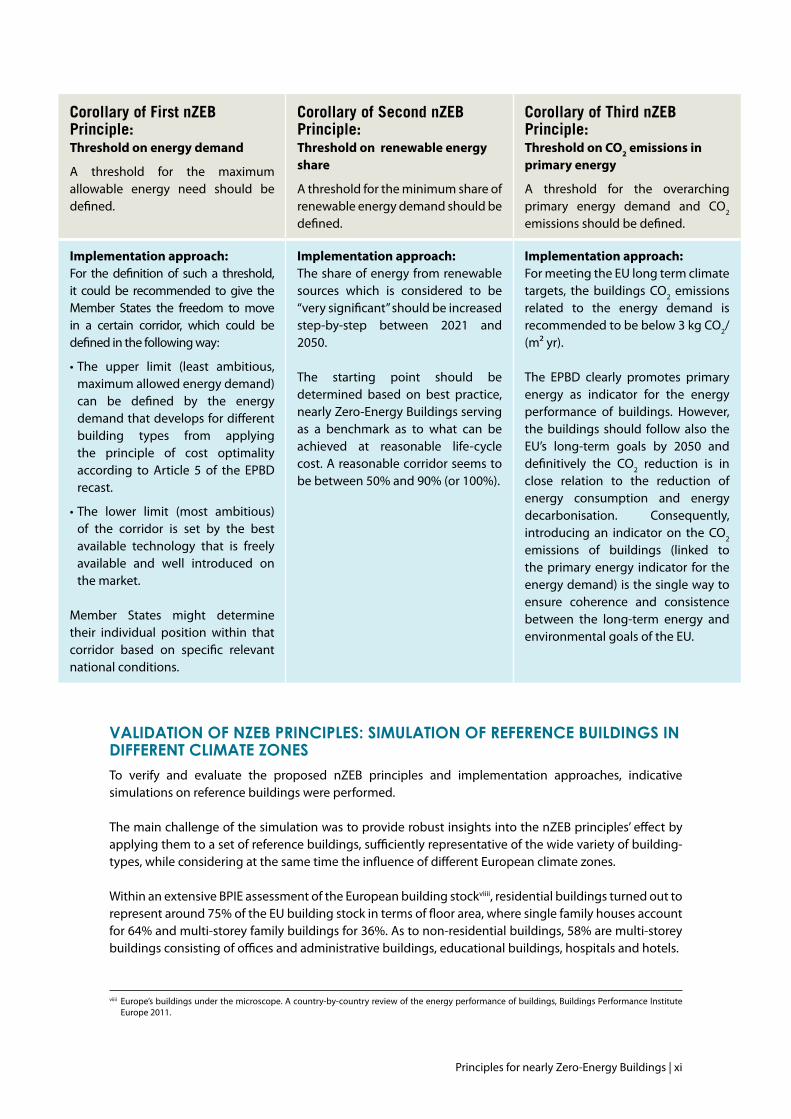
corollary of first nZeB Principle:Threshold on energy demand
A threshold for the maximum allowable energy need should be defined.
corollary of second nZeB Principle: Threshold on renewable energy share
A threshold for the minimum share of renewable energy demand should be defined.
corollary of third nZeB Principle:Threshold on CO2 emissions in primary energy
A threshold for the overarching primary energy demand and CO2 emissions should be defined.
Implementation approach: For the definition of such a threshold, it could be recommended to give the Member States the freedom to move in a certain corridor, which could be defined in the following way:
•The upper limit (least ambitious,maximum allowed energy demand) can be defined by the energy demand that develops for different building types from applying the principle of cost optimality according to Article 5 of the EPBD recast.
•The lower limit (most ambitious)of the corridor is set by the best available technology that is freely available and well introduced on the market.
Member States might determine their individual position within that corridor based on specific relevant national conditions.
Implementation approach: The share of energy from renewable sources which is considered to be “very significant” should be increased step-by-step between 2021 and 2050.
The starting point should be determined based on best practice, nearly Zero-Energy Buildings serving as a benchmark as to what can be achieved at reasonable life-cycle cost. A reasonable corridor seems to be between 50% and 90% (or 100%).
Implementation approach: For meeting the EU long term climate targets, the buildings CO2 emissions related to the energy demand is recommended to be below 3 kg CO2/(m² yr).
The EPBD clearly promotes primary energy as indicator for the energy performance of buildings. However, the buildings should follow also the EU’s long-term goals by 2050 and definitively the CO2 reduction is in close relation to the reduction of energy consumption and energy decarbonisation. Consequently, introducing an indicator on the CO2 emissions of buildings (linked to the primary energy indicator for the energy demand) is the single way to ensure coherence and consistence between the long-term energy and environmental goals of the EU.
xii | Principles for nearly Zero-Energy Buildings
This is a clear indication that the most representative European buildings are single family houses, multi-storey residential and multi-storey non-residential buildings. Moreover, it is likely that new buildings will follow the same typology as the existing building stock from today. Based on the above considerations, two reference buildings were selected:
• Newsinglefamilyresidentialbuilding(129m2 net floor area)
• Newmulti-storeynon-residentialbuilding(e.g.officebuilding)withasizethatalsocouldrepresentatypical multi-family building (1 600 m2 net floor area)
For each reference building, basic characteristics were defined in terms of geometry, technical systems and usage patterns.
The application of the nZEB principles is simulated by these two representative buildings and takes into consideration the following three locations which correspond to the main European climate zones:
• Copenhagen,(Denmark),coldclimate;
• Stuttgart(Germany),moderateclimate;
• Madrid(Spain),warmclimate.
Within the simulated application of nZEB principles on the reference buildings in different climate zones, the following parameters were considered and calculated:
• Specificprimaryenergydemanddetailedbybuildingservices,i.e.heating,domestichotwater(DHW),cooling, solar thermal domestic hot water, losses.
• Different technology options for providing a building’s heating, cooling and DHW: air source heatpump, brine source heat pump, biomass boiler, gas condensing boiler, district heating, micro-CHP gas, micro-CHP biomass, multi-split cooling units for residential (COP), central cooling system for offices.
• Finalenergydemandsinseveraltechnologyassumptionsanddetailedbybuildingservices(i.e.heating,domestic hot water, cooling, ventilation and auxiliary energy).
• Theprimaryenergydemand,therenewableenergyshareandtheassociatedGHGemissionsofthereference buildings were calculated for each climate zone in two situations with or without considering the electricity consumption of appliances and other building equipment outside the scope of the EPBD.
• Renewableenergy:Inadditiontothebasictechnicalsystempresentedabove,thesimulationconsideredseveral supplementary options such as:
- One on-site photovoltaic (PV) system of 2 kWp - Additional use of off-site “100%-green electricity”, which is assumed to have 100% share of renewable
energy and a CO2 emission-factor of 0 kg/kWh as well as a primary energy factor of 0 kWh/kWh.
• SpecificCO2 emissions and primary energy: In addition to the above-mentioned assumptions, a PV-compensation was considered to reach a 50% or 90% share of renewables.
• All analysed options assumed a well-sealed and insulated building shell with a highly efficientventilation system, leading to a very low energy demand.
Principles for nearly Zero-Energy Buildings | xiii
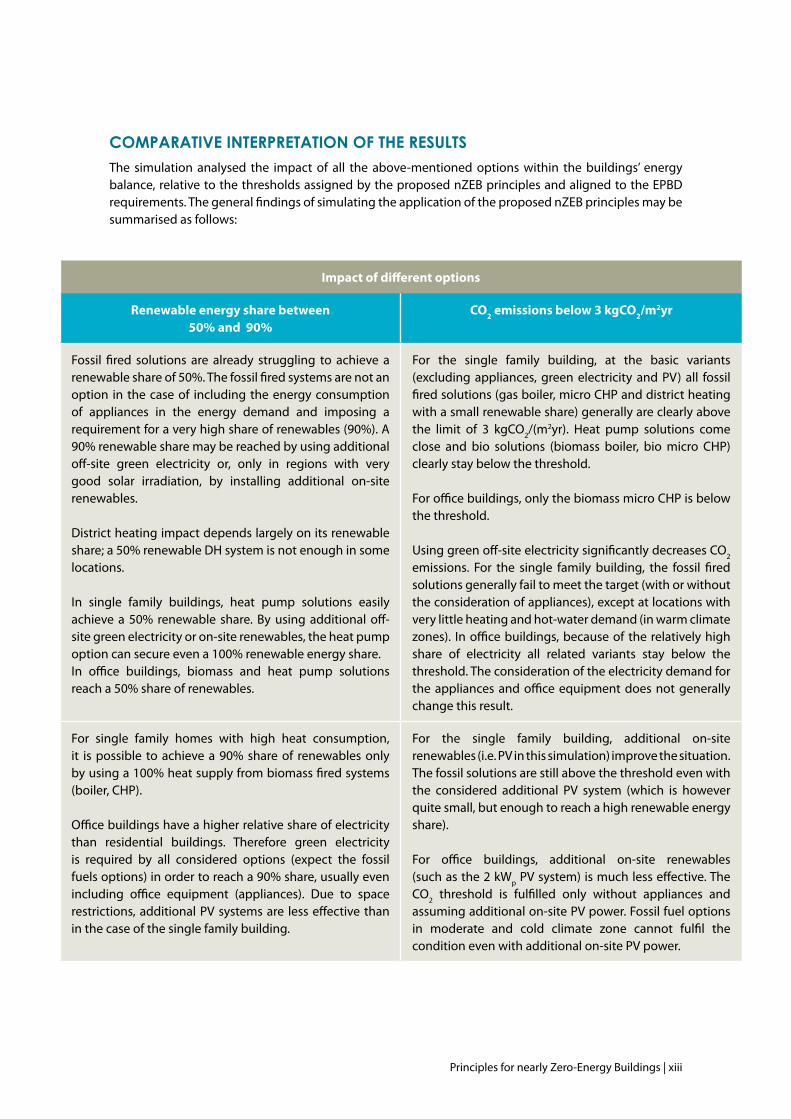
cOmparative interpretatiOn Of the resultsThe simulation analysed the impact of all the above-mentioned options within the buildings’ energy balance, relative to the thresholds assigned by the proposed nZEB principles and aligned to the EPBD requirements. The general findings of simulating the application of the proposed nZEB principles may be summarised as follows:
Impact of different options
Renewable energy share between 50% and 90%
CO2 emissions below 3 kgCO2/m2yr
Fossil fired solutions are already struggling to achieve a renewable share of 50%. The fossil fired systems are not an option in the case of including the energy consumption of appliances in the energy demand and imposing a requirement for a very high share of renewables (90%). A 90% renewable share may be reached by using additional off-site green electricity or, only in regions with very good solar irradiation, by installing additional on-site renewables.
District heating impact depends largely on its renewable share;a50%renewableDHsystemisnotenoughinsomelocations.
In single family buildings, heat pump solutions easily achieve a 50% renewable share. By using additional off-site green electricity or on-site renewables, the heat pump option can secure even a 100% renewable energy share. In office buildings, biomass and heat pump solutions reach a 50% share of renewables.
For the single family building, at the basic variants (excluding appliances, green electricity and PV) all fossil fired solutions (gas boiler, micro CHP and district heating with a small renewable share) generally are clearly above the limit of 3 kgCO2/(m2yr). Heat pump solutions come close and bio solutions (biomass boiler, bio micro CHP) clearly stay below the threshold.
For office buildings, only the biomass micro CHP is below the threshold.
Using green off-site electricity significantly decreases CO2 emissions. For the single family building, the fossil fired solutions generally fail to meet the target (with or without the consideration of appliances), except at locations with very little heating and hot-water demand (in warm climate zones). In office buildings, because of the relatively high share of electricity all related variants stay below the threshold. The consideration of the electricity demand for the appliances and office equipment does not generally change this result.
For single family homes with high heat consumption, it is possible to achieve a 90% share of renewables only by using a 100% heat supply from biomass fired systems (boiler, CHP).
Office buildings have a higher relative share of electricity than residential buildings. Therefore green electricity is required by all considered options (expect the fossil fuels options) in order to reach a 90% share, usually even including office equipment (appliances). Due to space restrictions, additional PV systems are less effective than in the case of the single family building.
For the single family building, additional on-site renewables (i.e. PV in this simulation) improve the situation. The fossil solutions are still above the threshold even with the considered additional PV system (which is however quite small, but enough to reach a high renewable energy share).
For office buildings, additional on-site renewables (such as the 2 kWp PV system) is much less effective. The CO2 threshold is fulfilled only without appliances and assuming additional on-site PV power. Fossil fuel options in moderate and cold climate zone cannot fulfil the condition even with additional on-site PV power.
xiv | Principles for nearly Zero-Energy Buildings
The average investment costs for using different heating technologies vary largely according to the local market circumstances, contract negotiations, sales volumes etc. and might differ substantially from one case to another. The investment costs identified within the study are in the range of EUR 6 300 - 55 600 for the reference single family building and in the range of EUR 12 400 - 224 000 for the reference multi-storeybuilding.Thecheapestoptionisthedistrictheating;themostexpensiveoptionisthebiomassmicro-CHP.
technOlOgical, financial and pOlicy implicatiOns Of the nZeb principlesWhile a definition of nearly Zero-Energy Buildings needs to deliver the framework for successful implementation of the related principles at building level, any final definition of nearly Zero-Energy Buildings needs to and will have implications at EU level.This last part of the study therefore analyses the actual status and implications of moving towards nZEB levels from a technical, financial and political point of view.
technology and resourcesThe simulations have shown that the proposed nZEB principles are feasible and reachable with already existing technologies. From the simulations performed within this study, most of the cases hint at the need for compensating measures such as green electricity or on-site renewable electricity (i.e. photovoltaic). Fossil fuel based technologies are not consistent with the ambition of the proposed nZEB principles. All-electric solutions (heat pumps) seem to be amongst the most suitable solutions, mainly due to the expected and continuous decarbonisation of the electricity sector and due to on-site renewable electricity. In particular biomass micro-CHPs have shown very good results but this technology needs further development. District heating systems have a great potential as well but only under the condition of higher shares of renewable energy (certainly higher than 50%) than assumed in the simulations.
Further improvements towards highly efficient thermal insulation materials and windows, as well as of heating, cooling and ventilation technologies, will enlarge the available options and will push the nZEB limits towards higher performances and potentially more affordable costs. But for achieving proper levels of market deployment for energy efficiency technologies it is necessary to up-scale the actual levels and to foster the market penetration of promising new technologies.
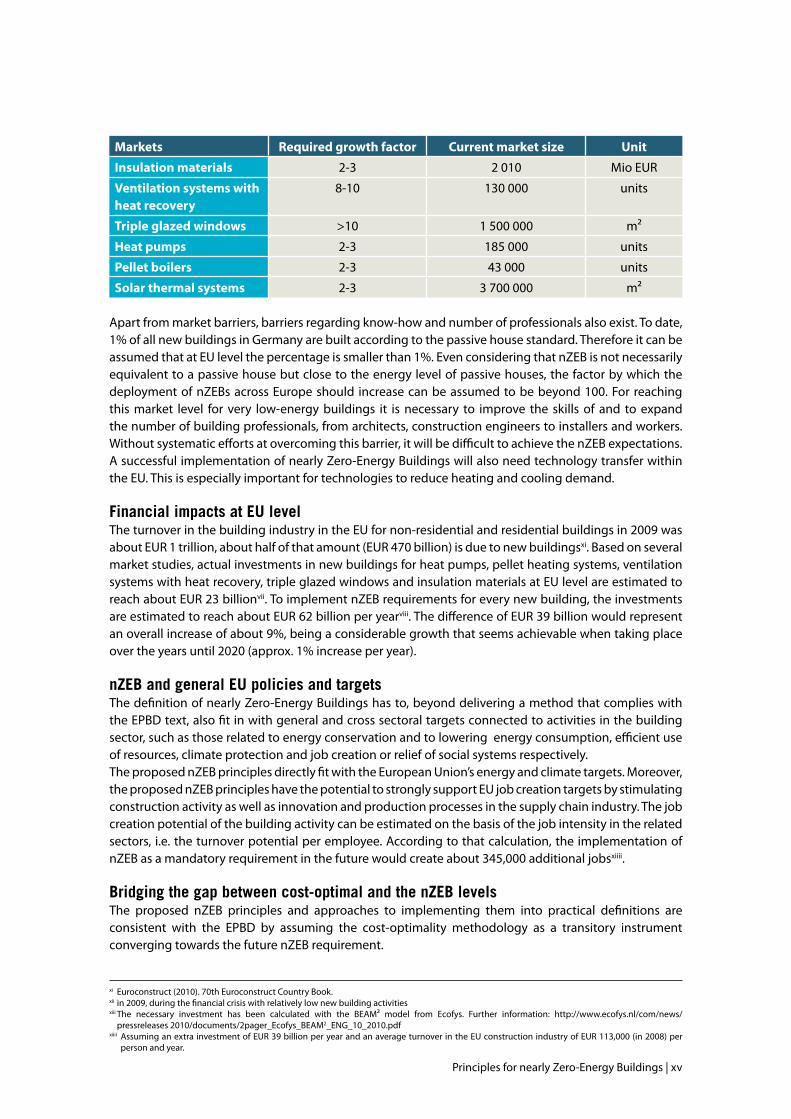
Based on the Ecofys Built Environment Analysis Model (BEAM²)x, the study analyses the future markets for energy efficient technologies and materials. The evaluation indicates that investments in new energy efficient technologies have to increase to satisfy the additional demand created by new nZEBs. However, there are significant differences regarding the different technologies and their barriers. The highest growth rates for achieving a well-developed nZEBs market were identified for ventilation systems with heat recovery and for triple glazed windows. For these components the actual market is really small compared to what it should be to satisfy the necessary demand for full nZEB implementation. As for the other nZEB related technologies, the gap between the actual market and the necessary future market size is smaller. To satisfy the calculated demand, the current market for insulation materials should grow by about two to three times. The market for heat pumps, pellet boilers and solar thermal systems should grow at least in the same range. The following table gives an overview of current market sizes and the factors which today’s markets should expand in order to satisfy future demand.
x Further information: http://www.ecofys.nl/com/news/pressreleases2010/documents/2pager_Ecofys_BEAM2_ENG_10_2010.pdf
Principles for nearly Zero-Energy Buildings | xv
Markets Required growth factor Current market size Unit
Insulation materials 2-3 2 010 Mio EUR
Ventilation systems with heat recovery
8-10 130 000 units
Triple glazed windows >10 1 500 000 m²
Heat pumps 2-3 185 000 units
Pellet boilers 2-3 43 000 units
Solar thermal systems 2-3 3 700 000 m²
Apart from market barriers, barriers regarding know-how and number of professionals also exist. To date, 1% of all new buildings in Germany are built according to the passive house standard. Therefore it can be assumed that at EU level the percentage is smaller than 1%. Even considering that nZEB is not necessarily equivalent to a passive house but close to the energy level of passive houses, the factor by which the deployment of nZEBs across Europe should increase can be assumed to be beyond 100. For reaching this market level for very low-energy buildings it is necessary to improve the skills of and to expand the number of building professionals, from architects, construction engineers to installers and workers. Without systematic efforts at overcoming this barrier, it will be difficult to achieve the nZEB expectations. A successful implementation of nearly Zero-Energy Buildings will also need technology transfer within the EU. This is especially important for technologies to reduce heating and cooling demand.
financial impacts at eu levelThe turnover in the building industry in the EU for non-residential and residential buildings in 2009 was about EUR 1 trillion, about half of that amount (EUR 470 billion) is due to new buildingsxi. Based on several market studies, actual investments in new buildings for heat pumps, pellet heating systems, ventilation systems with heat recovery, triple glazed windows and insulation materials at EU level are estimated to reach about EUR 23 billionvii. To implement nZEB requirements for every new building, the investments are estimated to reach about EUR 62 billion per yearviii. The difference of EUR 39 billion would represent an overall increase of about 9%, being a considerable growth that seems achievable when taking place over the years until 2020 (approx. 1% increase per year).
nZeB and general eu policies and targetsThe definition of nearly Zero-Energy Buildings has to, beyond delivering a method that complies with the EPBD text, also fit in with general and cross sectoral targets connected to activities in the building sector, such as those related to energy conservation and to lowering energy consumption, efficient use of resources, climate protection and job creation or relief of social systems respectively.The proposed nZEB principles directly fit with the European Union’s energy and climate targets. Moreover, the proposed nZEB principles have the potential to strongly support EU job creation targets by stimulating construction activity as well as innovation and production processes in the supply chain industry. The job creation potential of the building activity can be estimated on the basis of the job intensity in the related sectors, i.e. the turnover potential per employee. According to that calculation, the implementation of nZEB as a mandatory requirement in the future would create about 345,000 additional jobsxiiii.
Bridging the gap between cost-optimal and the nZeB levelsThe proposed nZEB principles and approaches to implementing them into practical definitions are consistent with the EPBD by assuming the cost-optimality methodology as a transitory instrument converging towards the future nZEB requirement.
xi Euroconstruct (2010). 70th Euroconstruct Country Book. xii in 2009, during the financial crisis with relatively low new building activitiesxiii The necessary investment has been calculated with the BEAM² model from Ecofys. Further information: http://www.ecofys.nl/com/news/
pressreleases 2010/documents/2pager_Ecofys_BEAM2_ENG_10_2010.pdfxiiii Assuming an extra investment of EUR 39 billion per year and an average turnover in the EU construction industry of EUR 113,000 (in 2008) per
person and year.
xvi | Principles for nearly Zero-Energy Buildings
While the simulation of the nZEB principles has been made considering the current situation and market conditions, the future evolution will be crucial for the financial gap between cost-optimality and nZEB requirements.
Depending on the specific context by 2021, the financial gap between cost-optimality and the binding nZEB requirements may need to be bridged by additional policies and support measures. This financial gap is highly influenced by the future evolution of numerous economic factors, the most important ones being technology costs as a reaction to more mature markets and larger production volumes.
nZeB implications for national policies of the eu member states To comply with the proposed nZEB principles, current national codes in general need to be gradually strengthened towards more ambitious levels. Moreover, beyond tightening the existing requirements it is necessary to adapt and improve the structure of the legal requirements supporting the market deployment of buildings-related energy efficient and renewable energy technologies. For example, in Germany the national building code (EnEV), the law on renewable heat in buildings (EEWärmeG) and the law that regulates feed in tariffs for grid connected renewables (EEG) coexist and investors need to comply with all related regulations. For supporting the nZEB implementation it would be useful to merge the regulations for renewable energy with the existing building regulations or to broaden the scope of the existing buildings regulations by introducing renewable energy requirements (also indicated by Article 13 of the Renewable Energy Directive, 2009/28/EU).Another example is Denmark, where current buildings regulations do not present a particular barrier to nZEB but have to be revised particularly by introducing renewable energy requirements. On the other hand,theDanishBuildingRegulationalreadyincludesa‘LowEnergyBuilding2020’target,whichisverywell in tune with the proposed nZEB principles in general and with the proposed renewable energy share in particular.
nZeBs and sustainable citiesThe effect of local aspects to the energy demand and supply of buildings is quite high especially in relation to new buildings. In a passive house and nZEB design, the free solar gains have a crucial influence on the heating and cooling energy demand of a building. However, solar gains may easily vary by around 25% at the same location, being strongly influenced by the orientation and by potential shading of the building facades. Therefore, before starting the construction of a new building, careful consideration of the positioning and orientation needs to be done in order to maximise or minimize respectively the solar gain.Typical specificities of an urban area, such as its density, are also very important for the energy supply of a building. The design of central energy supply and district heating systems should already encompass upcoming nZEB requirements. To further support the implementation of nZEBs, local utilities should play an important role in providing nearby renewable energy – heat, cold and power – to the future nZEBs. An integrated approach between the buildings’ and local utilities’ policies may facilitate a faster and cheaper implementation of nZEBs, compensating at the same time for the potential spatial constrictions of having on-site renewable generation for each building. As an example, the introduction of a “quota regulation” in favour of renewable energies for district heat and power will support simultaneously the market deployment of nZEBs and the predictable development of the district heat and power systems at local level.
Hence, the smart cities policies should consider and facilitate the introduction of nZEB by providing an energy system well-tailored to the future needs of buildings’. Therefore, the energy optimization of urban structures needs to be part of the sustainability concept for European cities. Knowledge about the huge potential lying within such optimization needs to be spread amongst all stakeholders involved in urban and centralised energy supply planning. Sustainable policies in European cities have to contribute to the paradigm shift from traditional sector-oriented approach to a more integrated approach which ensures the consistency between the district energy supply and urban development.
Principles for nearly Zero-Energy Buildings | xvii
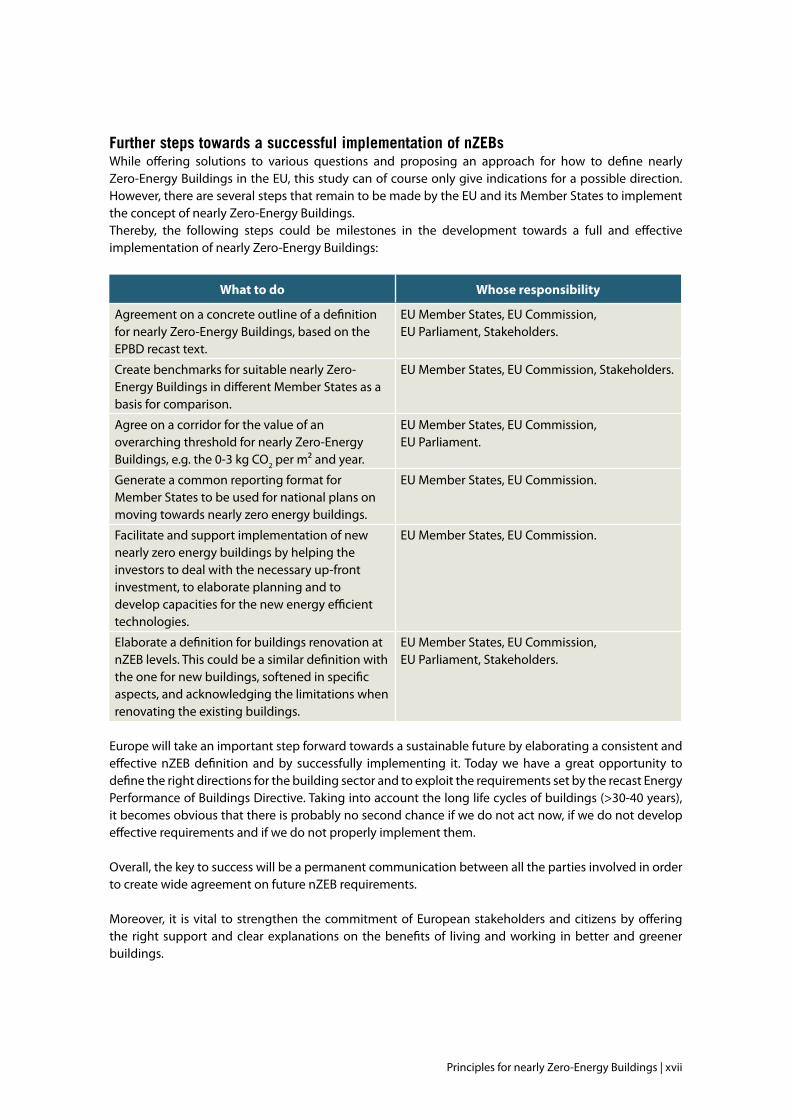
further steps towards a successful implementation of nZeBsWhile offering solutions to various questions and proposing an approach for how to define nearly Zero-Energy Buildings in the EU, this study can of course only give indications for a possible direction. However, there are several steps that remain to be made by the EU and its Member States to implement the concept of nearly Zero-Energy Buildings.Thereby, the following steps could be milestones in the development towards a full and effective implementation of nearly Zero-Energy Buildings:
What to do Whose responsibility
Agreement on a concrete outline of a definition for nearly Zero-Energy Buildings, based on the EPBD recast text.
EU Member States, EU Commission, EU Parliament, Stakeholders.
Create benchmarks for suitable nearly Zero-Energy Buildings in different Member States as a basis for comparison.
EU Member States, EU Commission, Stakeholders.
Agree on a corridor for the value of an overarching threshold for nearly Zero-Energy Buildings, e.g. the 0-3 kg CO2 per m² and year.
EU Member States, EU Commission, EU Parliament.
Generate a common reporting format for Member States to be used for national plans on moving towards nearly zero energy buildings.
EU Member States, EU Commission.
Facilitate and support implementation of new nearly zero energy buildings by helping the investors to deal with the necessary up-front investment, to elaborate planning and to develop capacities for the new energy efficient technologies.
EU Member States, EU Commission.
Elaborate a definition for buildings renovation at nZEB levels. This could be a similar definition with the one for new buildings, softened in specific aspects, and acknowledging the limitations when renovating the existing buildings.
EU Member States, EU Commission, EU Parliament, Stakeholders.
Europe will take an important step forward towards a sustainable future by elaborating a consistent and effective nZEB definition and by successfully implementing it. Today we have a great opportunity to define the right directions for the building sector and to exploit the requirements set by the recast Energy Performance of Buildings Directive. Taking into account the long life cycles of buildings (>30-40 years), it becomes obvious that there is probably no second chance if we do not act now, if we do not develop effective requirements and if we do not properly implement them.
Overall, the key to success will be a permanent communication between all the parties involved in order to create wide agreement on future nZEB requirements.
Moreover, it is vital to strengthen the commitment of European stakeholders and citizens by offering the right support and clear explanations on the benefits of living and working in better and greener buildings.
1
5
5566
121922
23
23
24
31
35
37
39
41
42
43
45
48
contents1 goals of tHe study
2 starting Point and first stePs forward 2.1 European policy framework2.1.1 Provisions of the recast EPBD2.1.2 Provisions of the Renewable Energy Directive 2.2 Zero and low energy buildings: Existing concepts and standards 2.3 Calculation methodologies for low energy buildings2.4 Comparative overview of the existing definitions 2.5 Common approaches and differences in current policies and
methodologies
3 nearly Zero-energy Buildings: main cHallenges and Potential solutions
3.1 Challenge N° 1: The required ambition level for reaching the current EU targets 3.2 Challenge N° 2: Relationship between nearly Zero-Energy and nearly zero CO2 3.3 Challenge N° 3: How to better assess the energy performance of a building? Local and
temporal disparities of renewable energy production 3.4 Challenge N° 4: Elaborating an open concept towards energy-positive buildings 3.5 Challenge N° 5: How to deal with different climate, building geometry and usage
conditions 3.6 Challenge N° 6: How to deal with household electricity 3.7 Challenge N° 7: How to deal with the production and disposal stage 3.8 Challenge N° 8: Single building scope vs. groups or networks 3.9 Challenge N° 9: Balance between energy demand and renewable energy 3.10 Challenge N° 10: Convergence between nearly Zero-Energy Buildings and cost-optimality
4 comPilation of a set of PrinciPles for nearly Zero-energy Buildings
55
57
6158
68
76
63
70
76
64
72
78
66
74
79
85
858787
91
929698
92
5 validation of nZeB PrinciPles: simulation of reference Buildings in different climate Zones5.1 Reference building no. 1: single-family residential building 5.2 Reference building no. 2: multi-storey non-residential building 5.3 Main parameters for reference buildings 5.4 Verification of nZEB principles for reference buildings
5.4.1 Simulation results: residential building Copenhagen 5.4.2 Simulation results: residential building Stuttgart 5.4.3 Simulation results: residential building Madrid 5.4.4 Simulation results: non-residential building Copenhagen 5.4.5 Simulation results: non-residential building Stuttgart 5.4.6 Simulation results: non-residential building Madrid
5.5 Comparative interpretation of the results 5.5.1 Renewable energy share in the energy balance 5.5.2 CO2 emissions
5.6 Financial results of implementing different options on reference buildings
6 tecHnological, financial and Policy imPlications at eu level
6.1 Technologies and resources 6.2 Financial impacts at EU level 6.3 Legal feasibility
7 furtHer stePs towards a successful imPlementation of nZeBs
annexes Annex 1: Definitions of low energy buildings in European countries Annex 2: Practical example, case 1 – Single family house Annex 3: Practical example, case 2 – Multi-family house
1 | Principles for nearly Zero-Energy Buildings
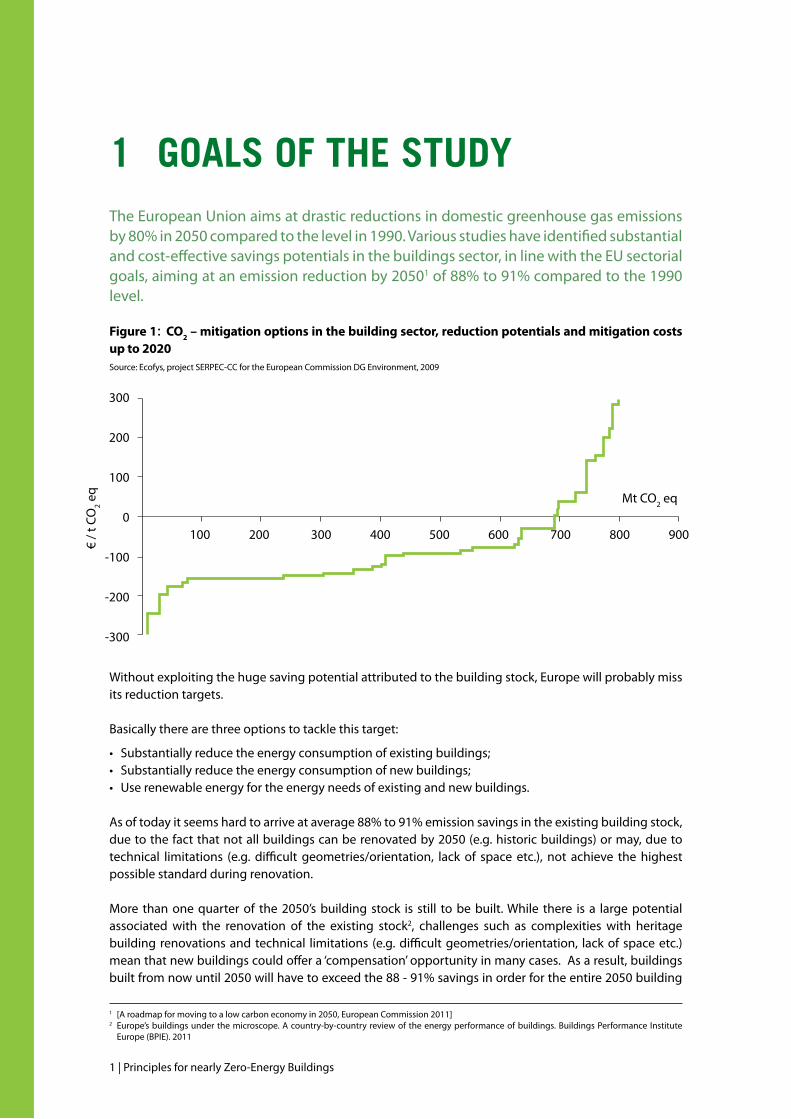
1 goals of tHe studyThe European Union aims at drastic reductions in domestic greenhouse gas emissions by 80% in 2050 compared to the level in 1990. Various studies have identified substantial and cost-effective savings potentials in the buildings sector, in line with the EU sectorial goals, aiming at an emission reduction by 20501 of 88% to 91% compared to the 1990 level.
Figure 1: CO2 – mitigation options in the building sector, reduction potentials and mitigation costs up to 2020Source: Ecofys, project SERPEC-CC for the European Commission DG Environment, 2009
Without exploiting the huge saving potential attributed to the building stock, Europe will probably miss its reduction targets.
Basically there are three options to tackle this target:
• Substantiallyreducetheenergyconsumptionofexistingbuildings;• Substantiallyreducetheenergyconsumptionofnewbuildings;• Userenewableenergyfortheenergyneedsofexistingandnewbuildings.
As of today it seems hard to arrive at average 88% to 91% emission savings in the existing building stock, due to the fact that not all buildings can be renovated by 2050 (e.g. historic buildings) or may, due to technical limitations (e.g. difficult geometries/orientation, lack of space etc.), not achieve the highest possible standard during renovation.
More than one quarter of the 2050’s building stock is still to be built. While there is a large potential associated with the renovation of the existing stock2, challenges such as complexities with heritage building renovations and technical limitations (e.g. difficult geometries/orientation, lack of space etc.) meanthatnewbuildingscouldoffera‘compensation’opportunityinmanycases.Asaresult,buildingsbuilt from now until 2050 will have to exceed the 88 - 91% savings in order for the entire 2050 building
300
200
100
0
-100
-200
-300
100 200 300 400 500 600 700 800 900
Mt CO2 eq
€ / t
CO
2 eq
1 [A roadmap for moving to a low carbon economy in 2050, European Commission 2011]2 Europe’s buildings under the microscope. A country-by-country review of the energy performance of buildings. Buildings Performance Institute
Europe (BPIE). 2011
Principles for nearly Zero-Energy Buildings | 2
stock to meet the desired climate goals. Therefore, the energy consumption and related GHG emissions of those new buildings need to be close to zero in order to reach the EU’s highly ambitious targets. This should happen as soon as possible in order to avoid missed opportunities and subsequent needs for stricter requirements.
The recast of the Energy Performance of Buildings Directive (EPBD) introduced, in Article 9, “nearly Zero -Energy buildings” (nZEB) as a future requirement to be implemented from 2019 onwards for public buildings and from 2021 onwards for all new buildings.
The EPBD defines a nearly Zero-Energy Building as follows: [A nearly Zero-Energy Building is a] “building that has a very high energy performance… [ ]. The nearly zero or very low amount of energy required should to a very significant extent be covered by energy from renewable sources, including renewable energy produced on-site or nearby.”
Acknowledging the variety in building culture and climate throughout the EU, the EPBD does not prescribe a uniform approach for implementing nearly Zero-Energy Buildings and neither does it describe a calculation methodology for the energy balance. To add flexibility, it requires Member States to draw up specifically designed national plans for increasing the number of nearly Zero-Energy Buildings reflecting national, regional or local conditions. The national plans will have to translate the concept of nearly Zero-Energy Buildings into practical and applicable measures and definitions to steadily increase the number of nearly Zero-Energy Buildings.
Throughout Europe there is a large variety of concepts and examples for very highly energy efficient buildings or climate neutral buildings: passive house, zero-energy, 3-litre, plus energy, Minergie, Effinergie etc. (detailed explanation of these concepts is provided in chapter 2.2). In addition, these definitions refer to different spheres: site energy, source energy, cost of emissions. Moreover there may be further variations of the definitions and requirements, whether is the case of new or existing, residential or non-residential buildings. In a nutshell, the views on how nearly Zero-Energy Buildings should be defined, on which sphere to make the basis, as well as on which means and techniques are adequate, differ greatly.Apart from that, such mostly abstract discussions must be linked to the implications, for example on industries, basic education and long-life training needs for architects, engineers, craftsmen, on necessary cross-sector collaboration, on financing schemes and on the role of the energy services companies, which are also affected by the maturity level of the different national building markets.
Due to this large variety in the context of the term, the newly created definition of “nearly Zero-Energy Buildings” in the EPBD recast has two sides:
• Flexibility:itstillenablesacommonunderstandingembracingmanyaspectsoftheabove-mentionedconceptsatthesametime;
• Uncertainty about the actual ambition level, related greenhouse gas emissions, the amount ofrenewable energy for such buildings and how and where it is produced and thus the risk of failing to achieve a common understanding.
Obviously the qualitative nature of criteria in the above-mentioned nZEB definition leaves room for interpretation. While illustrating the major pillars of future nZEB – drastically reduced energy demand and a major share of renewable energy supply - the terms “nearly zero or very low amount of energy”, “very significant extent” (to which the energy required should be covered by renewable energy sources), and “renewable energy produced on-site or nearby” require further examination and definition.
3 | Principles for nearly Zero-Energy Buildings
In addition to the flexibility of the general EPBD definition for nZEB, several questions arise concerning the practicalities of an nZEB definition:
• howtokeepthenZEBdefinitionsufficientlyflexiblesoastobuilduponexistinglow-energystandardsand enable energy-positive buildings?
• howtoproperlydefineandsettheshareofrenewableenergy?
• howtodeterminetheoptimalbalancebetweenenergyefficiencyandrenewableenergy?
• howto forgethenZEBdefinitionasa‘silverbullet’ for reachingthesame levelsofenergyandGHGreduction?
• how to link the nZEB definition to cost-optimality3 principles in order to have convergence and continuity?
At the present moment, the European Commission, EU Member States, stakeholders and experts are discussing the different aspects of nZEBs. Overall, there is an urgent need to establish common principles and methods to be taken into account by EU Member States for elaborating effective, practical and well thought-out nZEB definitions and to actually boost the market for nZEBs.
Therefore, the overarching objective of this study is to contribute to a common and cross-national understanding on:
• theneedforanambitious,cleardefinitionandfastuptakeofnearlyZero-EnergyBuildings inallEUMemberStates;
• theneedforprinciplesofsustainable,realisticnearlyZero-EnergyBuildings,bothnewandexisting;
• possibletechnicalsolutionsandtheirimplicationsfornationalbuildingmarkets,buildingsandmarketplayers.
The study builds on existing concepts and building standards, analyses the main methodological challenges and their implications for the nZEB definition, and compiles a possible set of principles and assesses their impact on reference buildings. Subsequently the technological, financial and policy implications of these results are evaluated. Finally, the study concludes by providing an outlook on necessary further steps towards a successful implementation of nearly Zero-Energy Buildings. The structure of the study is presented in Figure 2.
3 Cost-optimal methodology will be leading the improvement of the energy performance for new buildings before the implementation of the nZEBs approachin2021.Thecost-optimalmethodologyisrequiredbyArticle5oftherecastEPBD(Directive2010/31/EU)on‘calculationofcost-optimallevels of minimum energy performance requirements’.
Principles for nearly Zero-Energy Buildings | 4
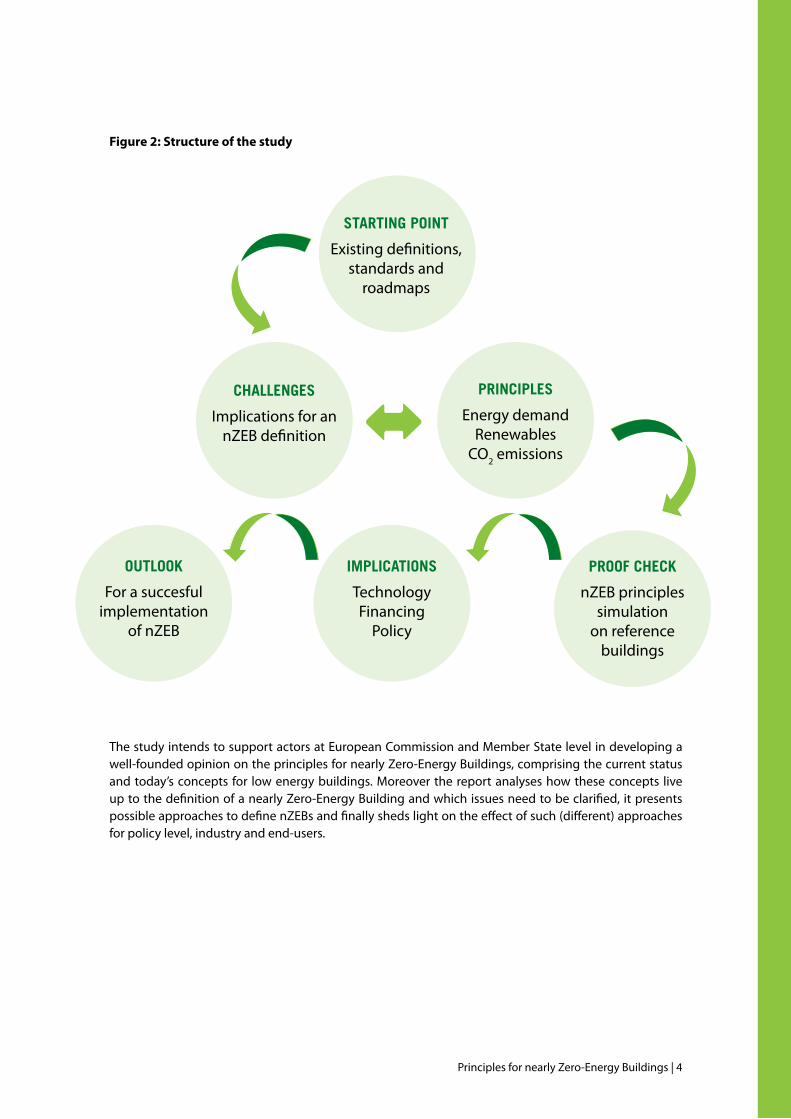
Figure 2: Structure of the study
The study intends to support actors at European Commission and Member State level in developing a well-founded opinion on the principles for nearly Zero-Energy Buildings, comprising the current status and today’s concepts for low energy buildings. Moreover the report analyses how these concepts live up to the definition of a nearly Zero-Energy Building and which issues need to be clarified, it presents possible approaches to define nZEBs and finally sheds light on the effect of such (different) approaches for policy level, industry and end-users.
starting Point
Existing definitions, standards and
roadmaps
PrinciPles
Energy demandRenewables
CO2 emissions
cHallenges
Implications for an nZEB definition
imPlications
Technology Financing
Policy
outlook
For a succesful implementation
of nZEB
Proof cHeck
nZEB principles simulation
on reference buildings
5 | Principles for nearly Zero-Energy Buildings
2 starting Point and first stePs forward
2.1 european policy framework The EU legislative framework has been significantly strengthened in recent years by the recast of the Energy Performance of Buildings (EPBD, 2010/31/EU)4 and by the Renewable Energy Directive (RED, 2009/28/EC)5. Both Directives set conditions for moving towards nearly Zero-Energy Buildings by 2020 and all Member States must integrate these requirements into national legislation as well as to set appropriate market instruments and financial frameworks for widely implementing these ambitious targets.
2.1.1 provisions of the recast epbdAccording to Article 2 (“Definitions”) part 2 of the recast Energy Performance of Buildings Directive, “nearly Zero-Energy Building means a building that has a very high energy performance, as determined in accordance with Annex I. The nearly zero or very low amount of energy required should be covered to a very significant extent by energy from renewable sources, including energy from renewable sources producedon-siteornearby;”
Article 9 of the recast Energy Performance of Buildings Directive (EPBD) stipulates in paragraph 1 that after 31 December 2018, new buildings occupied and owned by public authorities should be nearly Zero-Energy Buildings. By 31 December 2020, all new buildings should be nearly Zero-Energy Buildings. Member States shall draw up national plans for increasing the number of nearly Zero-Energy Buildings, potentially with targets differentiated according to the building categories. According to paragraph 3 of Article 9, these plans shall include:
• AdefinitionofnearlyZero-EnergyBuildings,reflectingnational,regionalorlocalconditionsandincludea numerical indicator of primary energy use, expressed in kWh/m² per year.
• Intermediatetargetsforimprovingtheenergyperformanceofnewbuildingsby2015.
• Informationonpolicies,financialorothermeasuresadoptedforthepromotionofnearlyZero-EnergyBuildings, including details on the use of renewable sources in new buildings and existing buildings undergoing major renovation (Article 13(4) of Directive 2009/28/EC and Articles 6 and 7 of Directive 2010/31/EU).
In addition, paragraph 2 of Article 9 asks Member States to show a leading example by developing particular policies and measures for refurbishing public buildings towards nearly zero-energy levels and to inform the Commission of national plans. The Commission shall evaluate the national plans, notably the adequacy of the measures envisaged by Member States in relation to the objectives of this Directive. The Commission, taking due account of the principle of subsidiarity, may request further specific information regarding the requirements set out in paragraphs 1, 2 and 3. In that case, the Member State concerned shall submit the requested information or propose amendments within nine months following the request from the Commission. Following its evaluation, the Commission may issue a recommendation.
4 Directive 2010/31/EU of the European Parliament and of the Council of 19 May 2010 on the energy performance of buildings (recast)5 Directive 2009/28/EC of the European Parliament and of the Council of 23 April 2009 on the promotion of the use of energy from renewable sources
and amending and subsequently repealing Directives 2001/77/EC and 2003/30/EC
Principles for nearly Zero-Energy Buildings | 6
The Commission shall, by 31 December 2012, and every three years thereafter publish a report on the progress of Member States in increasing the number of nearly Zero-Energy Buildings. On the basis of that report the Commission shall develop an action plan and, if necessary, propose measures to increase the number of those buildings and encourage best practices as regards the cost-effective transformation of existing buildings into nearly Zero-Energy Buildings.Member States may decide not to apply the requirements set out in points (a) and (b) of paragraph 1 in specific and justifiable cases where the cost-benefit analysis over the economic lifecycle of the building in question is negative. Member States shall inform the Commission of the principles of the relevant legislative regimes.
2.1.2 provisions of the renewable energy directiveParallel to the requirements of the EPBD, the Renewable Energy Directive (RED)6 also sets requirements related to buildings. The Renewable Energy Directive stipulates in Article 13 that:
• By31December2014MemberStatesshall,intheirbuildingregulationsandcodes,requiretheuseofminimum levels of energy from renewable sources in new buildings and in existing buildings that are subject to major renovation. Member States shall permit those minimum levels to be fulfilled, inter alia, through district heating and cooling produced using a significant proportion of renewable energy sources. Moreover, in establishing such measures or in their regional support schemes, Member States may take into account national measures relating to substantial increases in energy efficiency and relating to cogeneration and to passive, low or Zero-Energy Buildings.” (Article 13.4)
• MemberStatesshallensurethatnewandexistingpublicbuildingsthataresubjecttomajorrenovation,at national, regional and local level fulfil an exemplary role in the context of this Directive from 1 January 2012 onwards. Member States may, inter alia, allow that obligation to be fulfilled by complying with standards for zero-energy housing, or by providing that the roofs of public or mixed private-public buildings are used by third parties for installations that produce energy from renewable sources. (Article 13.5)
2.2 Zero and low energy buildings: existing concepts and standardsAs stated by Torcellini, Pless and Deru7, a zero-energy definition will affect how buildings are designed to achieve the goal, i.e. the emphasis of the definition will impact on which zero-Energy Buildings (ZEB) designs are chosen and developed for the future and therefore this initial choice is very important. Torcellini, Pless and Deru mention four general principles relating to ZEB definitions:
• NetZeroSiteEnergy:AsiteZEBproducesatleastasmuchenergyasitusesinayear,whenaccountedfor at the site.
• NetZeroSourceEnergy:A sourceZEBproducesat least asmuchenergyas ituses ina year,whenaccounted for at the source. Source energy refers to the primary energy used to generate and deliver the energy to the site. To calculate a building’s total source energy, imported and exported energy is multiplied by the appropriate site-to-source conversion multipliers.
• NetZero-EnergyCosts:InacostZEB,theamountofmoneytheutilitypaysthebuildingownerfortheenergy the building exports to the grid is at least equal to the amount the owner pays the utility for the energy services and energy used over the year.
• NetZero-EnergyEmissions:Anetzeroemissionsbuildingproducesat leastasmuchemissions-freerenewable energy as it uses from emissions-producing energy sources.
The advantages and disadvantages of using each of the above mentioned ZEB definitions are shown in Table 1 on the following page.
7 P. Torcellini, S. Pless, M. Deru, D. Crawley: Zero-Energy Buildings: A Critical Look at the Definition. Preprint, National Renewable Energy Laboratory. Presented at ACEEE Summer Study Pacific Grove, California August 14−18, 2006
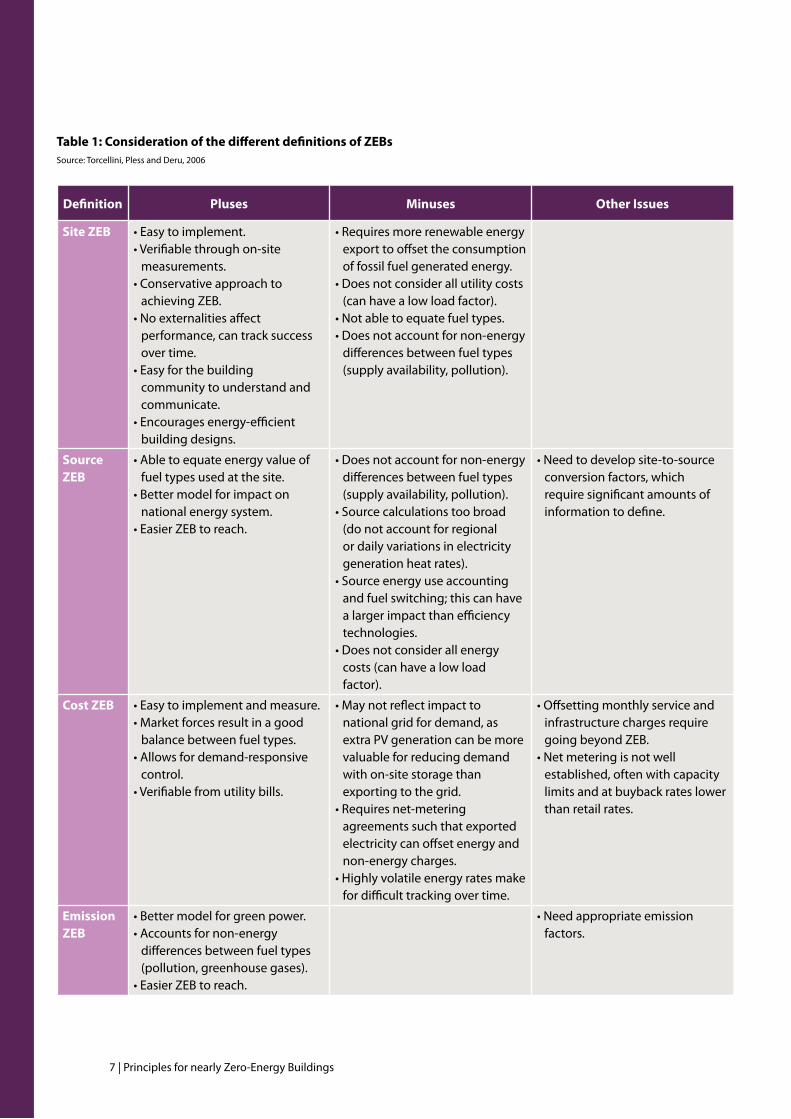
7 | Principles for nearly Zero-Energy Buildings
Table 1: Consideration of the different definitions of ZEBsSource: Torcellini, Pless and Deru, 2006
Definition Pluses Minuses Other Issues
Site ZEB •Easytoimplement.•Verifiablethroughon-site
measurements. •Conservativeapproachto
achieving ZEB. •Noexternalitiesaffect
performance, can track success over time.
•Easyforthebuildingcommunity to understand and communicate.
•Encouragesenergy-efficientbuilding designs.
•Requiresmorerenewableenergyexport to offset the consumption of fossil fuel generated energy.
•Doesnotconsiderallutilitycosts(can have a low load factor).
•Notabletoequatefueltypes.•Doesnotaccountfornon-energy
differences between fuel types (supply availability, pollution).
Source ZEB
•Abletoequateenergyvalueoffuel types used at the site.
•Bettermodelforimpactonnational energy system.
•EasierZEBtoreach.
•Doesnotaccountfornon-energydifferences between fuel types (supply availability, pollution).
•Sourcecalculationstoobroad(do not account for regional or daily variations in electricity generation heat rates).
•Sourceenergyuseaccountingandfuelswitching;thiscanhavea larger impact than efficiency technologies.
•Doesnotconsiderallenergycosts (can have a low load factor).
•Needtodevelopsite-to-sourceconversion factors, which require significant amounts of information to define.
Cost ZEB •Easytoimplementandmeasure.•Marketforcesresultinagood
balance between fuel types. •Allowsfordemand-responsive
control. •Verifiablefromutilitybills.
•Maynotreflectimpacttonational grid for demand, as extra PV generation can be more valuable for reducing demand with on-site storage than exporting to the grid.
•Requiresnet-meteringagreements such that exported electricity can offset energy and non-energy charges.
•Highlyvolatileenergyratesmakefor difficult tracking over time.
•Offsettingmonthlyserviceandinfrastructure charges require going beyond ZEB.
•Netmeteringisnotwellestablished, often with capacity limits and at buyback rates lower than retail rates.
EmissionZEB
•Bettermodelforgreenpower.•Accountsfornon-energy
differences between fuel types (pollution, greenhouse gases).
•EasierZEBtoreach.
•Needappropriateemissionfactors.
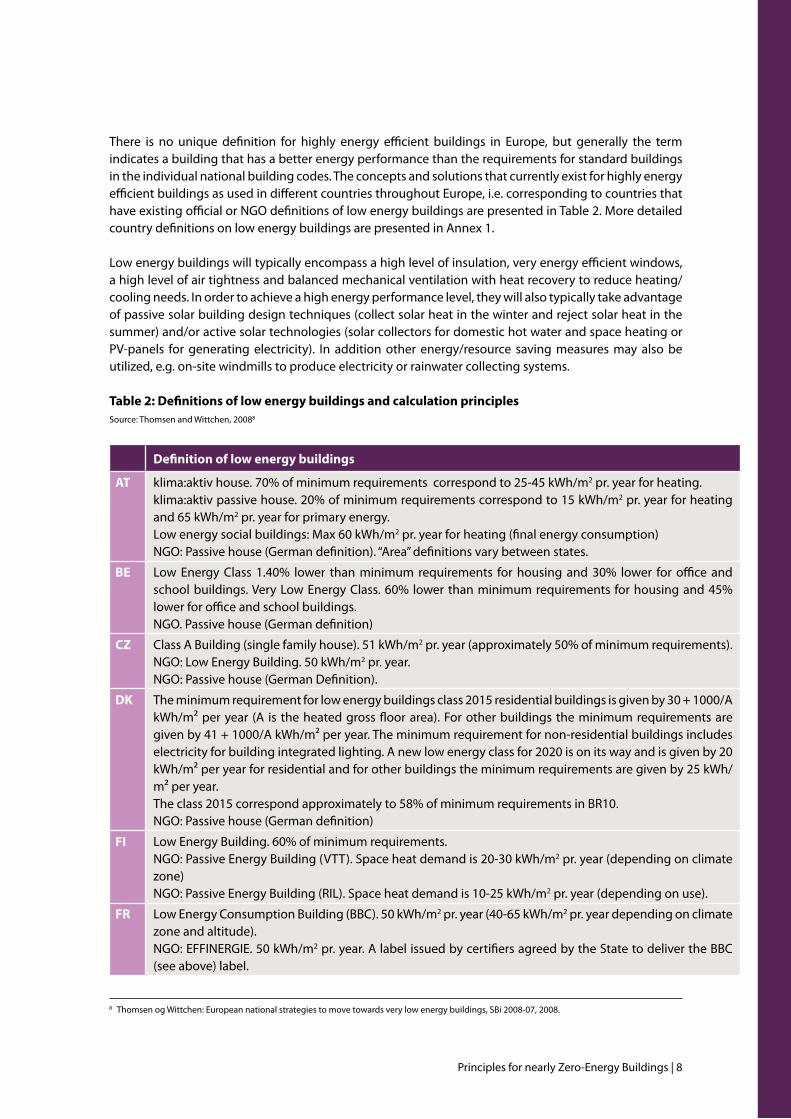
Principles for nearly Zero-Energy Buildings | 8
There is no unique definition for highly energy efficient buildings in Europe, but generally the term indicates a building that has a better energy performance than the requirements for standard buildings in the individual national building codes. The concepts and solutions that currently exist for highly energy efficient buildings as used in different countries throughout Europe, i.e. corresponding to countries that have existing official or NGO definitions of low energy buildings are presented in Table 2. More detailed country definitions on low energy buildings are presented in Annex 1.
Low energy buildings will typically encompass a high level of insulation, very energy efficient windows, a high level of air tightness and balanced mechanical ventilation with heat recovery to reduce heating/cooling needs. In order to achieve a high energy performance level, they will also typically take advantage of passive solar building design techniques (collect solar heat in the winter and reject solar heat in the summer) and/or active solar technologies (solar collectors for domestic hot water and space heating or PV-panels for generating electricity). In addition other energy/resource saving measures may also be utilized, e.g. on-site windmills to produce electricity or rainwater collecting systems.
Table 2: Definitions of low energy buildings and calculation principlesSource: Thomsen and Wittchen, 20088
Definition of low energy buildings
AT klima:aktiv house. 70% of minimum requirements correspond to 25-45 kWh/m2 pr. year for heating.klima:aktiv passive house. 20% of minimum requirements correspond to 15 kWh/m2 pr. year for heating and 65 kWh/m2 pr. year for primary energy.Low energy social buildings: Max 60 kWh/m2 pr. year for heating (final energy consumption)NGO: Passive house (German definition). “Area” definitions vary between states.
BE Low Energy Class 1.40% lower than minimum requirements for housing and 30% lower for office and school buildings. Very Low Energy Class. 60% lower than minimum requirements for housing and 45% lower for office and school buildings. NGO. Passive house (German definition)
CZ Class A Building (single family house). 51 kWh/m2 pr. year (approximately 50% of minimum requirements).NGO: Low Energy Building. 50 kWh/m2 pr. year.NGO: Passive house (German Definition).
DK The minimum requirement for low energy buildings class 2015 residential buildings is given by 30 + 1000/A kWh/m² per year (A is the heated gross floor area). For other buildings the minimum requirements are given by 41 + 1000/A kWh/m² per year. The minimum requirement for non-residential buildings includes electricity for building integrated lighting. A new low energy class for 2020 is on its way and is given by 20 kWh/m² per year for residential and for other buildings the minimum requirements are given by 25 kWh/m² per year.The class 2015 correspond approximately to 58% of minimum requirements in BR10.NGO: Passive house (German definition)
FI Low Energy Building. 60% of minimum requirements.NGO: Passive Energy Building (VTT). Space heat demand is 20-30 kWh/m2 pr. year (depending on climate zone)NGO: Passive Energy Building (RIL). Space heat demand is 10-25 kWh/m2 pr. year (depending on use).
FR Low Energy Consumption Building (BBC). 50 kWh/m2 pr. year (40-65 kWh/m2 pr. year depending on climate zone and altitude).NGO: EFFINERGIE. 50 kWh/m2 pr. year. A label issued by certifiers agreed by the State to deliver the BBC (see above) label.
8 Thomsen og Wittchen: European national strategies to move towards very low energy buildings, SBi 2008-07, 2008.
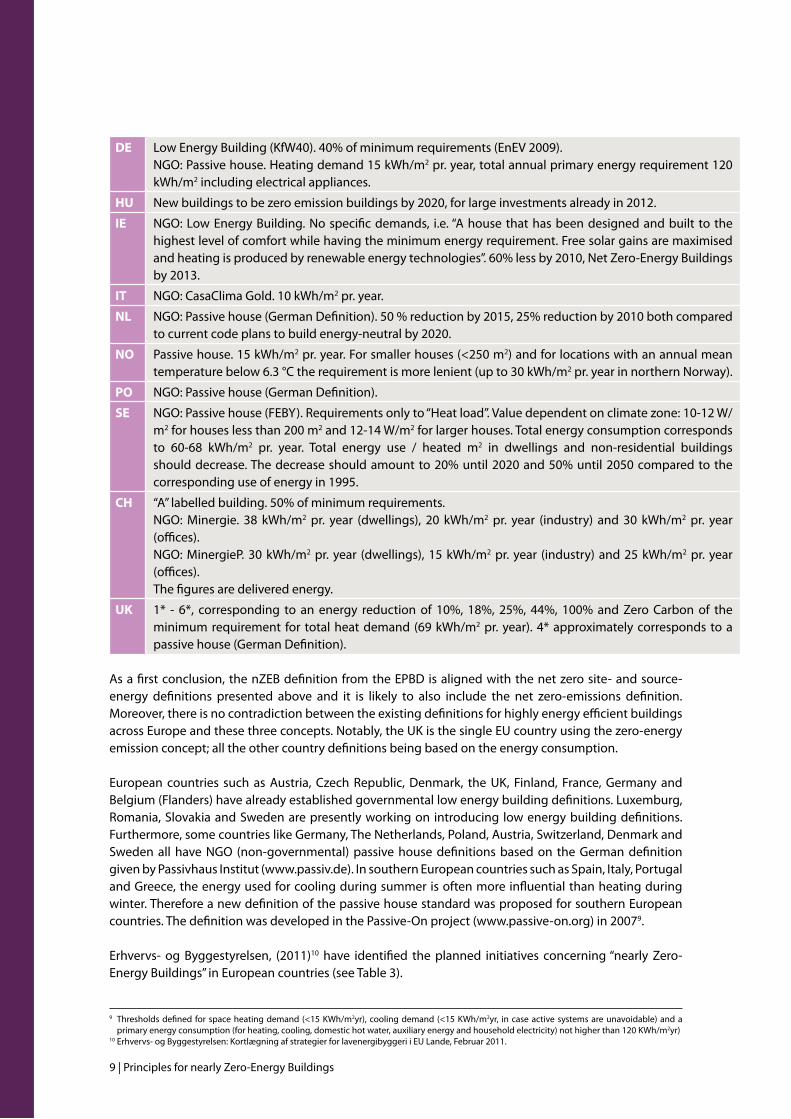
9 | Principles for nearly Zero-Energy Buildings
DE Low Energy Building (KfW40). 40% of minimum requirements (EnEV 2009).NGO: Passive house. Heating demand 15 kWh/m2 pr. year, total annual primary energy requirement 120 kWh/m2 including electrical appliances.
HU New buildings to be zero emission buildings by 2020, for large investments already in 2012.
IE NGO: Low Energy Building. No specific demands, i.e. “A house that has been designed and built to the highest level of comfort while having the minimum energy requirement. Free solar gains are maximised and heating is produced by renewable energy technologies”. 60% less by 2010, Net Zero-Energy Buildings by 2013.
IT NGO: CasaClima Gold. 10 kWh/m2 pr. year.
NL NGO: Passive house (German Definition). 50 % reduction by 2015, 25% reduction by 2010 both compared to current code plans to build energy-neutral by 2020.
NO Passive house. 15 kWh/m2 pr. year. For smaller houses (<250 m2) and for locations with an annual mean temperature below 6.3 °C the requirement is more lenient (up to 30 kWh/m2 pr. year in northern Norway).
PO NGO: Passive house (German Definition).
SE NGO: Passive house (FEBY). Requirements only to “Heat load”. Value dependent on climate zone: 10-12 W/m2 for houses less than 200 m2 and 12-14 W/m2 for larger houses. Total energy consumption corresponds to 60-68 kWh/m2 pr. year. Total energy use / heated m2 in dwellings and non-residential buildings should decrease. The decrease should amount to 20% until 2020 and 50% until 2050 compared to the corresponding use of energy in 1995.
CH “A” labelled building. 50% of minimum requirements.NGO: Minergie. 38 kWh/m2 pr. year (dwellings), 20 kWh/m2 pr. year (industry) and 30 kWh/m2 pr. year (offices).NGO: MinergieP. 30 kWh/m2 pr. year (dwellings), 15 kWh/m2 pr. year (industry) and 25 kWh/m2 pr. year (offices).The figures are delivered energy.
UK 1* - 6*, corresponding to an energy reduction of 10%, 18%, 25%, 44%, 100% and Zero Carbon of the minimum requirement for total heat demand (69 kWh/m2 pr. year). 4* approximately corresponds to a passive house (German Definition).
As a first conclusion, the nZEB definition from the EPBD is aligned with the net zero site- and source- energy definitions presented above and it is likely to also include the net zero-emissions definition. Moreover, there is no contradiction between the existing definitions for highly energy efficient buildings across Europe and these three concepts. Notably, the UK is the single EU country using the zero-energy emissionconcept;alltheothercountrydefinitionsbeingbasedontheenergyconsumption.
European countries such as Austria, Czech Republic, Denmark, the UK, Finland, France, Germany and Belgium (Flanders) have already established governmental low energy building definitions. Luxemburg, Romania, Slovakia and Sweden are presently working on introducing low energy building definitions. Furthermore, some countries like Germany, The Netherlands, Poland, Austria, Switzerland, Denmark and Sweden all have NGO (non-governmental) passive house definitions based on the German definition given by Passivhaus Institut (www.passiv.de). In southern European countries such as Spain, Italy, Portugal and Greece, the energy used for cooling during summer is often more influential than heating during winter. Therefore a new definition of the passive house standard was proposed for southern European countries. The definition was developed in the Passive-On project (www.passive-on.org) in 20079.
Erhvervs- og Byggestyrelsen, (2011)10 have identified the planned initiatives concerning “nearly Zero-Energy Buildings” in European countries (see Table 3).
9 Thresholds defined for space heating demand (<15 KWh/m2yr), cooling demand (<15 KWh/m2yr, in case active systems are unavoidable) and a primary energy consumption (for heating, cooling, domestic hot water, auxiliary energy and household electricity) not higher than 120 KWh/m2yr)
10 Erhvervs- og Byggestyrelsen: Kortlægning af strategier for lavenergibyggeri i EU Lande, Februar 2011.
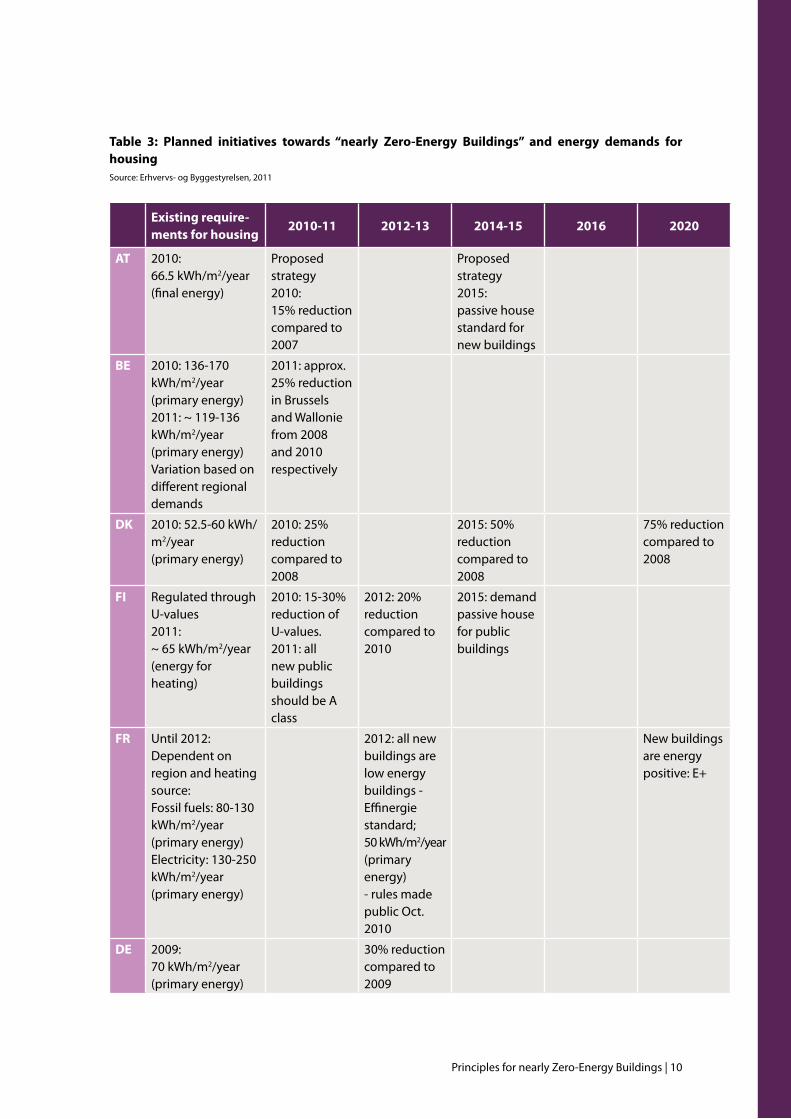
Principles for nearly Zero-Energy Buildings | 10
Table 3: Planned initiatives towards “nearly Zero-Energy Buildings” and energy demands for housingSource: Erhvervs- og Byggestyrelsen, 2011
Existing require-ments for housing
2010-11 2012-13 2014-15 2016 2020
AT 2010: 66.5 kWh/m2/year(final energy)
Proposed strategy2010: 15% reduction compared to 2007
Proposed strategy2015: passive house standard for new buildings
BE 2010: 136-170 kWh/m2/year(primary energy)2011: ~ 119-136 kWh/m2/year(primary energy)Variation based on different regional demands
2011: approx. 25% reduction in Brusselsand Walloniefrom 2008 and 2010 respectively
DK 2010: 52.5-60 kWh/m2/year(primary energy)
2010: 25% reduction compared to 2008
2015: 50%reduction compared to 2008
75% reduction compared to 2008
FI Regulated through U-values2011: ~ 65 kWh/m2/year(energy for heating)
2010: 15-30% reduction of U-values.2011: all new public buildings should be A class
2012: 20%reduction compared to 2010
2015: demand passive house for public buildings
FR Until 2012: Dependent on region and heating source:Fossil fuels: 80-130kWh/m2/year(primary energy)Electricity: 130-250kWh/m2/year(primary energy)
2012: all newbuildings are low energy buildings -Effinergie standard;50 kWh/m2/year(primary energy)- rules made public Oct. 2010
New buildings are energy positive: E+
DE 2009: 70 kWh/m2/year(primary energy)
30% reduction compared to 2009
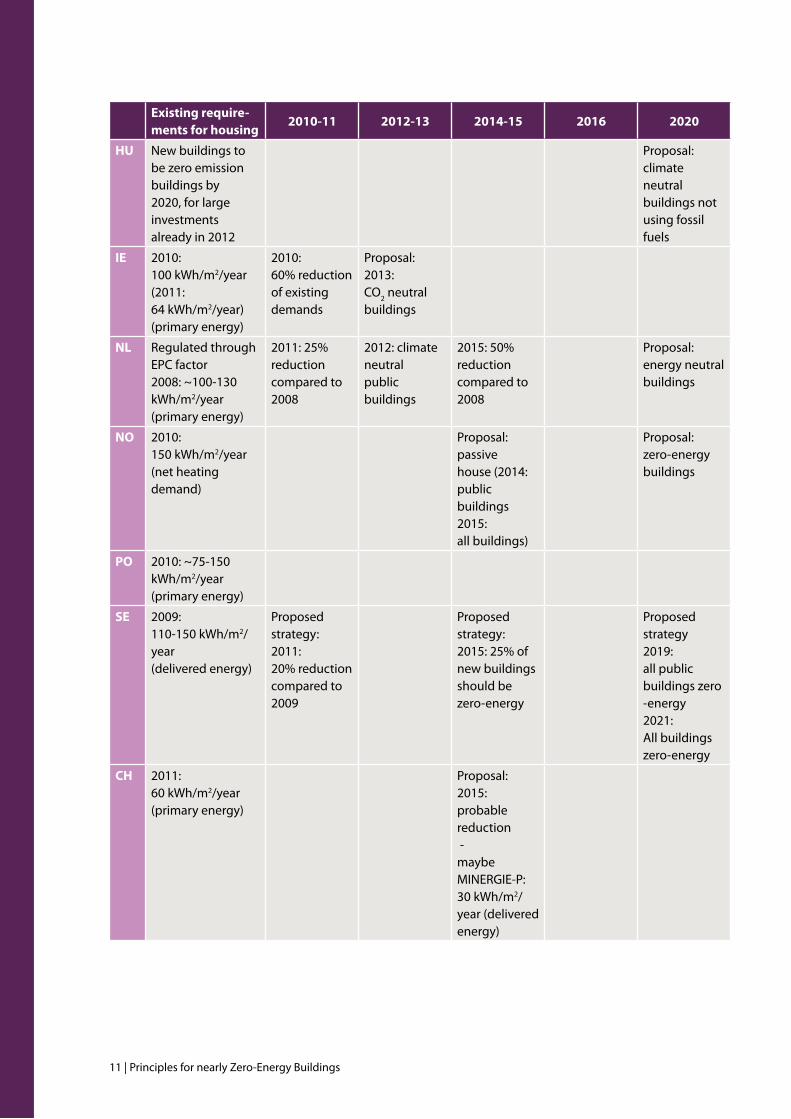
11 | Principles for nearly Zero-Energy Buildings
Existing require-ments for housing
2010-11 2012-13 2014-15 2016 2020
HU New buildings to be zero emission buildings by 2020, for large investments already in 2012
Proposal: climate neutral buildings not using fossil fuels
IE 2010: 100 kWh/m2/year(2011: 64 kWh/m2/year)(primary energy)
2010: 60% reduction of existing demands
Proposal: 2013:CO2 neutralbuildings
NL Regulated through EPC factor2008: ~100-130 kWh/m2/year(primary energy)
2011: 25%reduction compared to 2008
2012: climate neutralpublic buildings
2015: 50%reduction compared to 2008
Proposal:energy neutral buildings
NO 2010:150 kWh/m2/year(net heating demand)
Proposal: passivehouse (2014:public buildings2015: all buildings)
Proposal: zero-energy buildings
PO 2010: ~75-150 kWh/m2/year(primary energy)
SE 2009:110-150 kWh/m2/year(delivered energy)
Proposed strategy:2011: 20% reduction compared to 2009
Proposed strategy:2015: 25% of new buildings should be zero-energy
Proposed strategy2019: all public buildings zero -energy2021: All buildings zero-energy
CH 2011: 60 kWh/m2/year(primary energy)
Proposal: 2015:probable reduction -maybeMINERGIE-P:30 kWh/m2/year (delivered energy)
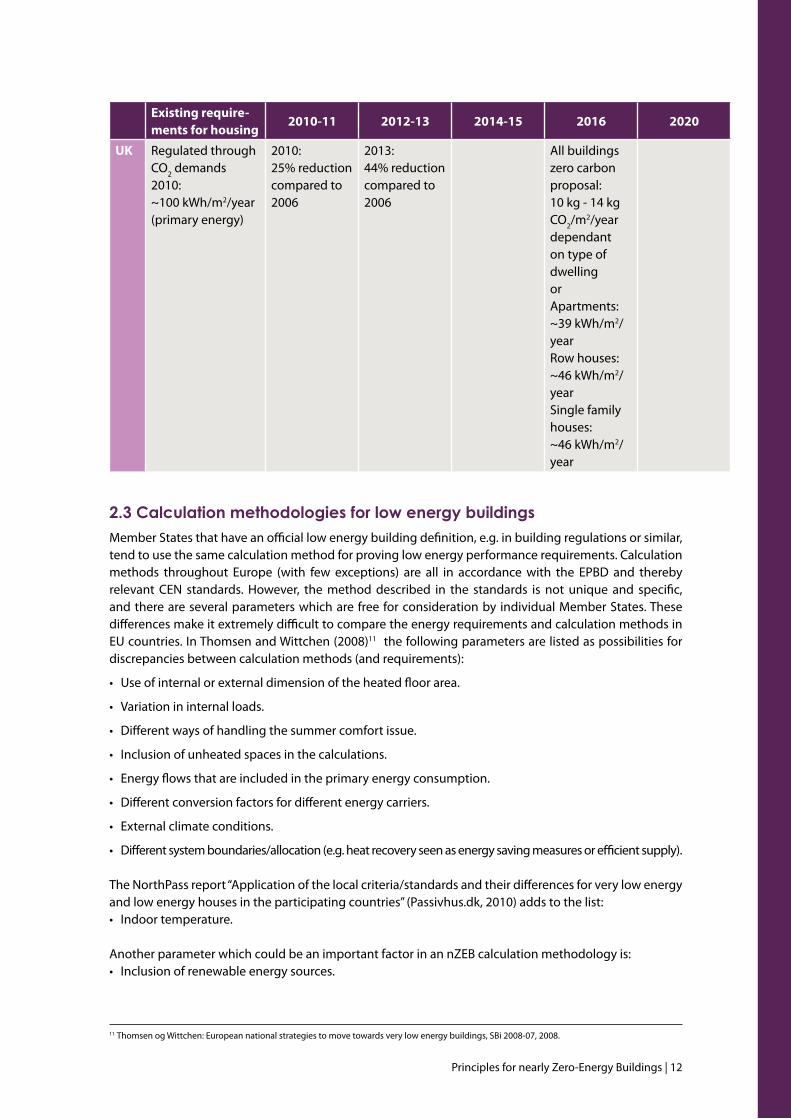
Principles for nearly Zero-Energy Buildings | 12
Existing require-ments for housing
2010-11 2012-13 2014-15 2016 2020
UK Regulated through CO2 demands2010: ~100 kWh/m2/year(primary energy)
2010: 25% reduction compared to 2006
2013: 44% reduction compared to 2006
All buildings zero carbonproposal:10 kg - 14 kgCO2/m2/year dependant on type of dwellingorApartments: ~39 kWh/m2/yearRow houses:~46 kWh/m2/yearSingle family houses:~46 kWh/m2/year
2.3 calculation methodologies for low energy buildingsMember States that have an official low energy building definition, e.g. in building regulations or similar, tend to use the same calculation method for proving low energy performance requirements. Calculation methods throughout Europe (with few exceptions) are all in accordance with the EPBD and thereby relevant CEN standards. However, the method described in the standards is not unique and specific, and there are several parameters which are free for consideration by individual Member States. These differences make it extremely difficult to compare the energy requirements and calculation methods in EU countries. In Thomsen and Wittchen (2008)11 the following parameters are listed as possibilities for discrepancies between calculation methods (and requirements):
• Useofinternalorexternaldimensionoftheheatedfloorarea.
• Variationininternalloads.
• Differentwaysofhandlingthesummercomfortissue.
• Inclusionofunheatedspacesinthecalculations.
• Energyflowsthatareincludedintheprimaryenergyconsumption.
• Differentconversionfactorsfordifferentenergycarriers.
• Externalclimateconditions.
• Differentsystemboundaries/allocation(e.g.heatrecoveryseenasenergysavingmeasuresorefficientsupply).
The NorthPass report “Application of the local criteria/standards and their differences for very low energy and low energy houses in the participating countries” (Passivhus.dk, 2010) adds to the list:• Indoortemperature.
Another parameter which could be an important factor in an nZEB calculation methodology is:• Inclusionofrenewableenergysources.
11 Thomsen og Wittchen: European national strategies to move towards very low energy buildings, SBi 2008-07, 2008.
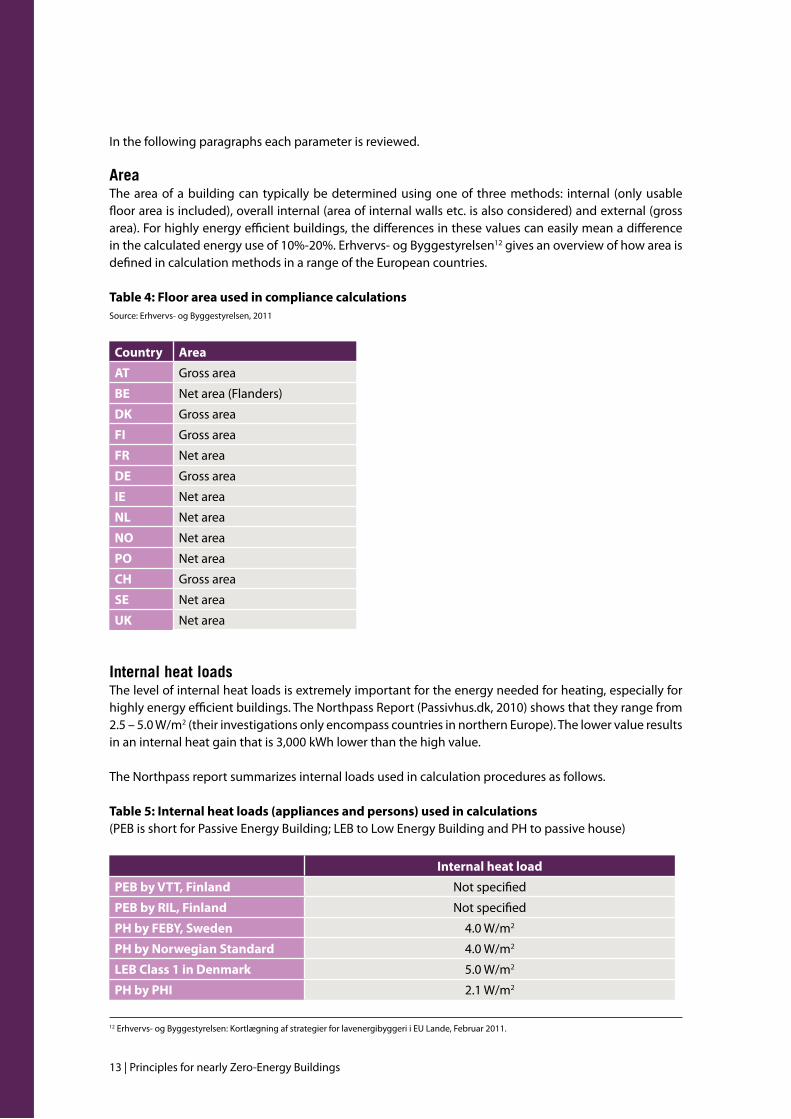
13 | Principles for nearly Zero-Energy Buildings
In the following paragraphs each parameter is reviewed.
areaThe area of a building can typically be determined using one of three methods: internal (only usable floor area is included), overall internal (area of internal walls etc. is also considered) and external (gross area). For highly energy efficient buildings, the differences in these values can easily mean a difference in the calculated energy use of 10%-20%. Erhvervs- og Byggestyrelsen12 gives an overview of how area is defined in calculation methods in a range of the European countries.
Table 4: Floor area used in compliance calculationsSource: Erhvervs- og Byggestyrelsen, 2011
Country Area
AT Gross area
BE Net area (Flanders)
DK Gross area
FI Gross area
FR Net area
DE Gross area
IE Net area
NL Net area
NO Net area
PO Net area
CH Gross area
SE Net area
UK Net area
internal heat loadsThe level of internal heat loads is extremely important for the energy needed for heating, especially for highly energy efficient buildings. The Northpass Report (Passivhus.dk, 2010) shows that they range from 2.5 – 5.0 W/m2 (their investigations only encompass countries in northern Europe). The lower value results in an internal heat gain that is 3,000 kWh lower than the high value.
The Northpass report summarizes internal loads used in calculation procedures as follows.
Table 5: Internal heat loads (appliances and persons) used in calculations(PEBisshortforPassiveEnergyBuilding;LEBtoLowEnergyBuildingandPHtopassivehouse)
Internal heat load
PEB by VTT, Finland Not specified
PEB by RIL, Finland Not specified
PH by FEBY, Sweden 4.0 W/m2
PH by Norwegian Standard 4.0 W/m2
LEB Class 1 in Denmark 5.0 W/m2
PH by PHI 2.1 W/m2
12 Erhvervs- og Byggestyrelsen: Kortlægning af strategier for lavenergibyggeri i EU Lande, Februar 2011.
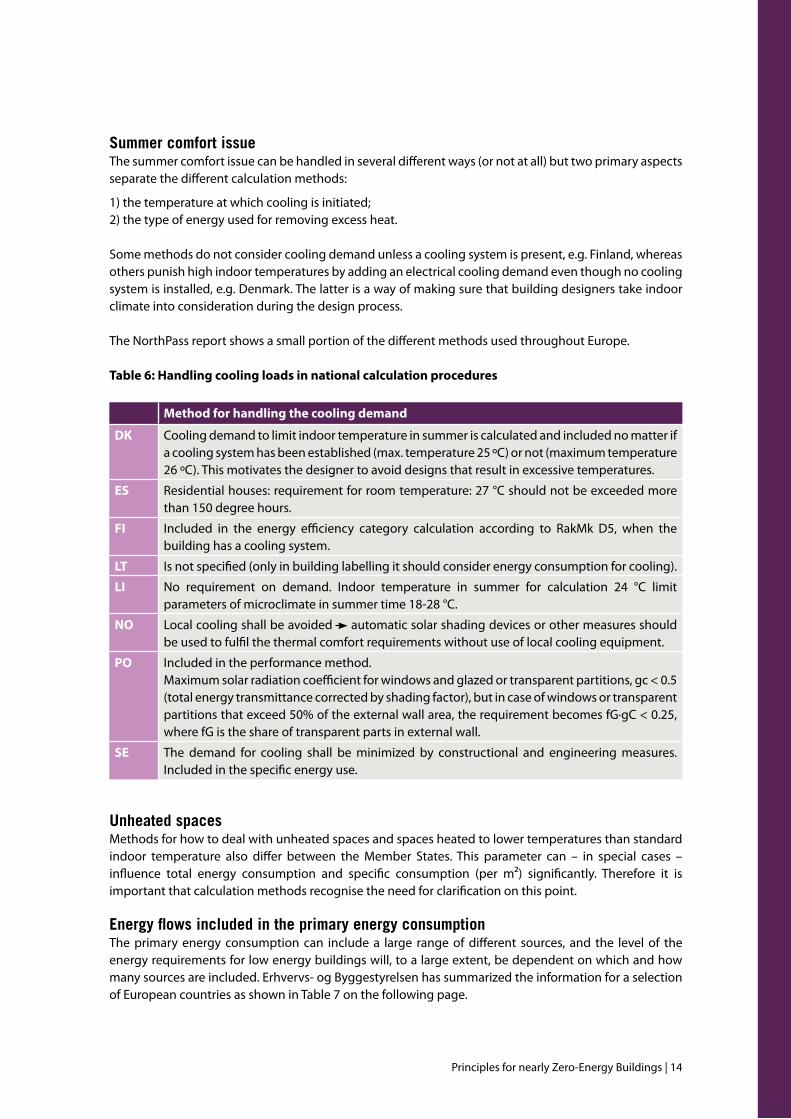
Principles for nearly Zero-Energy Buildings | 14
summer comfort issueThe summer comfort issue can be handled in several different ways (or not at all) but two primary aspects separate the different calculation methods:
1)thetemperatureatwhichcoolingisinitiated;2) the type of energy used for removing excess heat.
Some methods do not consider cooling demand unless a cooling system is present, e.g. Finland, whereas others punish high indoor temperatures by adding an electrical cooling demand even though no cooling system is installed, e.g. Denmark. The latter is a way of making sure that building designers take indoor climate into consideration during the design process.
The NorthPass report shows a small portion of the different methods used throughout Europe.
Table 6: Handling cooling loads in national calculation procedures
Method for handling the cooling demand
DK Cooling demand to limit indoor temperature in summer is calculated and included no matter if a cooling system has been established (max. temperature 25 ºC) or not (maximum temperature 26 ºC). This motivates the designer to avoid designs that result in excessive temperatures.
ES Residential houses: requirement for room temperature: 27 °C should not be exceeded more than 150 degree hours.
FI Included in the energy efficiency category calculation according to RakMk D5, when the building has a cooling system.
LT Is not specified (only in building labelling it should consider energy consumption for cooling).
LI No requirement on demand. Indoor temperature in summer for calculation 24 °C limit parameters of microclimate in summer time 18-28 °C.
NO Local cooling shall be avoided automatic solar shading devices or other measures should be used to fulfil the thermal comfort requirements without use of local cooling equipment.
PO Included in the performance method.Maximum solar radiation coefficient for windows and glazed or transparent partitions, gc < 0.5 (total energy transmittance corrected by shading factor), but in case of windows or transparent partitions that exceed 50% of the external wall area, the requirement becomes fG·gC < 0.25, where fG is the share of transparent parts in external wall.
SE The demand for cooling shall be minimized by constructional and engineering measures. Included in the specific energy use.
unheated spacesMethods for how to deal with unheated spaces and spaces heated to lower temperatures than standard indoor temperature also differ between the Member States. This parameter can – in special cases – influence total energy consumption and specific consumption (per m²) significantly. Therefore it is important that calculation methods recognise the need for clarification on this point.
energy flows included in the primary energy consumptionThe primary energy consumption can include a large range of different sources, and the level of the energy requirements for low energy buildings will, to a large extent, be dependent on which and how many sources are included. Erhvervs- og Byggestyrelsen has summarized the information for a selection of European countries as shown in Table 7 on the following page.
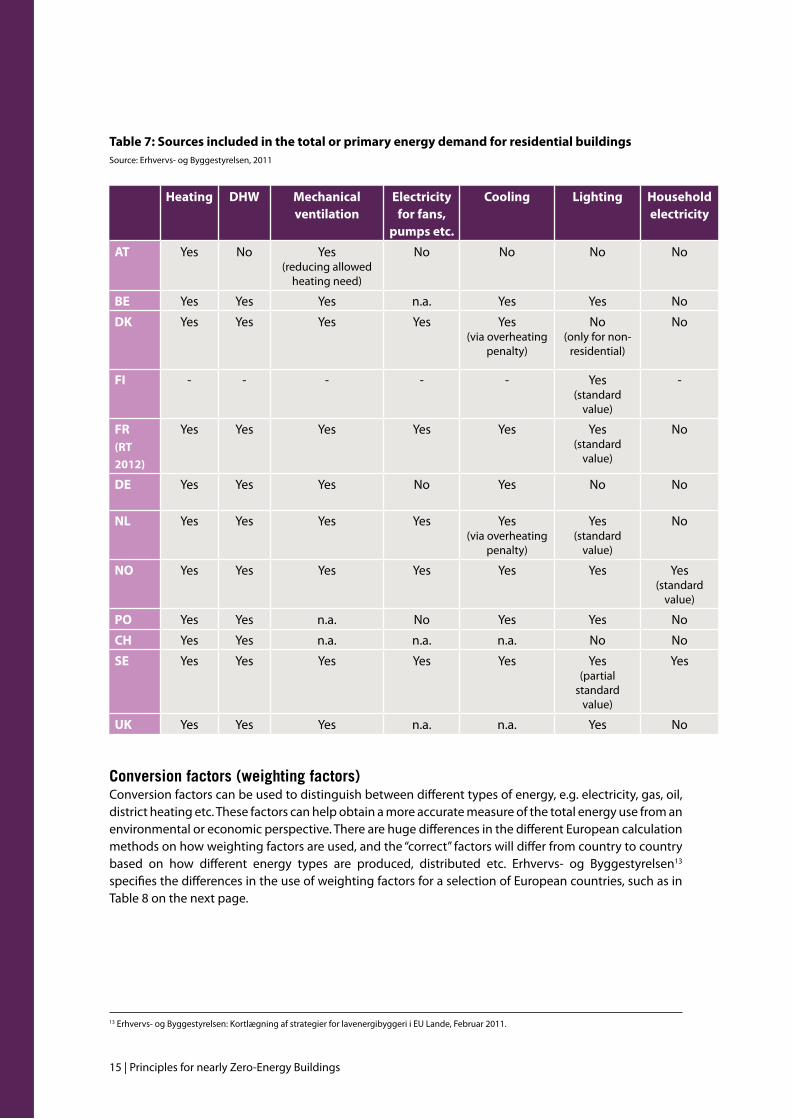
15 | Principles for nearly Zero-Energy Buildings
Table 7: Sources included in the total or primary energy demand for residential buildingsSource: Erhvervs- og Byggestyrelsen, 2011
Heating DHW Mechanical ventilation
Electricity for fans,
pumps etc.
Cooling Lighting Household electricity
AT Yes No Yes (reducing allowed
heating need)
No No No No
BE Yes Yes Yes n.a. Yes Yes No
DK Yes Yes Yes Yes Yes (via overheating
penalty)
No (only for non-
residential)
No
FI - - - - - Yes (standard
value)
-
FR (RT 2012)
Yes Yes Yes Yes Yes Yes (standard
value)
No
DE Yes Yes Yes No Yes No No
NL Yes Yes Yes Yes Yes (via overheating
penalty)
Yes (standard
value)
No
NO Yes Yes Yes Yes Yes Yes Yes (standard
value)
PO Yes Yes n.a. No Yes Yes No
CH Yes Yes n.a. n.a. n.a. No No
SE Yes Yes Yes Yes Yes Yes (partial
standard value)
Yes
UK Yes Yes Yes n.a. n.a. Yes No
conversion factors (weighting factors)Conversion factors can be used to distinguish between different types of energy, e.g. electricity, gas, oil, district heating etc. These factors can help obtain a more accurate measure of the total energy use from an environmental or economic perspective. There are huge differences in the different European calculation methods on how weighting factors are used, and the “correct” factors will differ from country to country based on how different energy types are produced, distributed etc. Erhvervs- og Byggestyrelsen13 specifies the differences in the use of weighting factors for a selection of European countries, such as in Table 8 on the next page.
13 Erhvervs- og Byggestyrelsen: Kortlægning af strategier for lavenergibyggeri i EU Lande, Februar 2011.
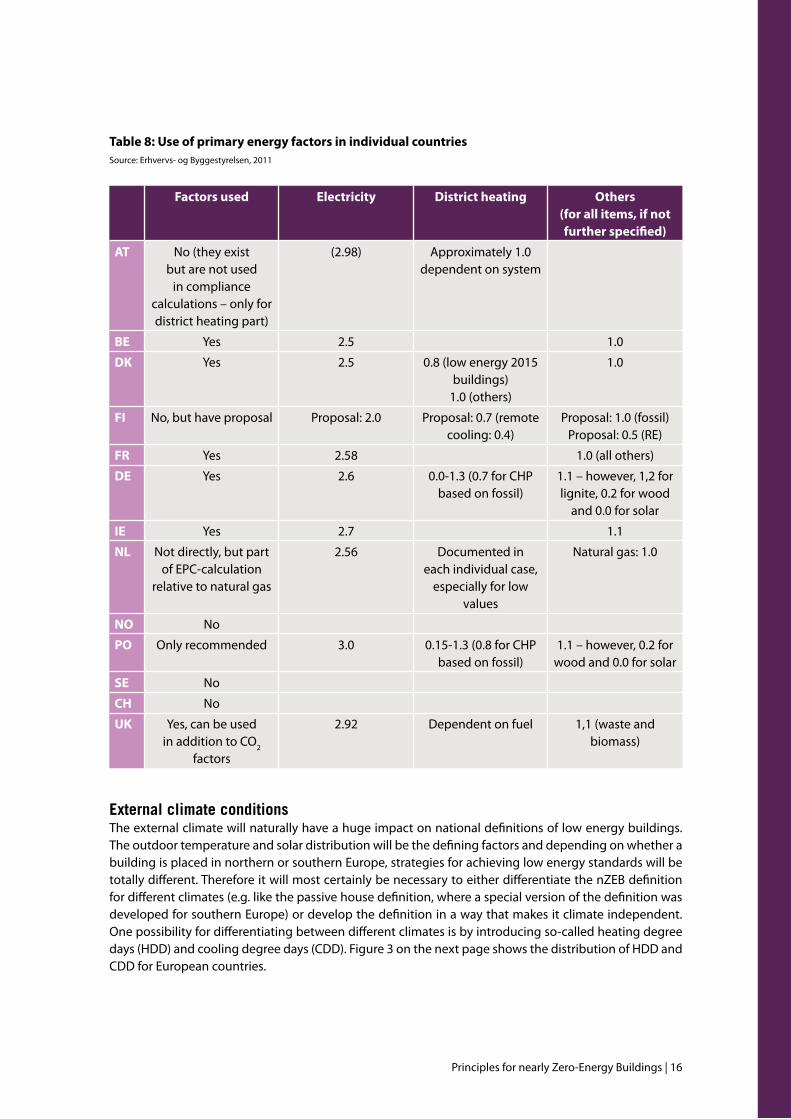
Principles for nearly Zero-Energy Buildings | 16
Table 8: Use of primary energy factors in individual countries Source: Erhvervs- og Byggestyrelsen, 2011
Factors used Electricity District heating Others (for all items, if not further specified)
AT No (they exist but are not used
in compliance calculations – only for district heating part)
(2.98) Approximately 1.0 dependent on system
BE Yes 2.5 1.0
DK Yes 2.5 0.8 (low energy 2015 buildings)
1.0 (others)
1.0
FI No, but have proposal Proposal: 2.0 Proposal: 0.7 (remote cooling: 0.4)
Proposal: 1.0 (fossil)Proposal: 0.5 (RE)
FR Yes 2.58 1.0 (all others)
DE Yes 2.6 0.0-1.3 (0.7 for CHP based on fossil)
1.1 – however, 1,2 for lignite, 0.2 for wood
and 0.0 for solar
IE Yes 2.7 1.1
NL Not directly, but part of EPC-calculation
relative to natural gas
2.56 Documented in each individual case,
especially for low values
Natural gas: 1.0
NO No
PO Only recommended 3.0 0.15-1.3 (0.8 for CHP based on fossil)
1.1 – however, 0.2 for wood and 0.0 for solar
SE No
CH No
UK Yes, can be used in addition to CO2
factors
2.92 Dependent on fuel 1,1 (waste and biomass)
external climate conditionsThe external climate will naturally have a huge impact on national definitions of low energy buildings. The outdoor temperature and solar distribution will be the defining factors and depending on whether a building is placed in northern or southern Europe, strategies for achieving low energy standards will be totally different. Therefore it will most certainly be necessary to either differentiate the nZEB definition for different climates (e.g. like the passive house definition, where a special version of the definition was developed for southern Europe) or develop the definition in a way that makes it climate independent. One possibility for differentiating between different climates is by introducing so-called heating degree days (HDD) and cooling degree days (CDD). Figure 3 on the next page shows the distribution of HDD and CDD for European countries.
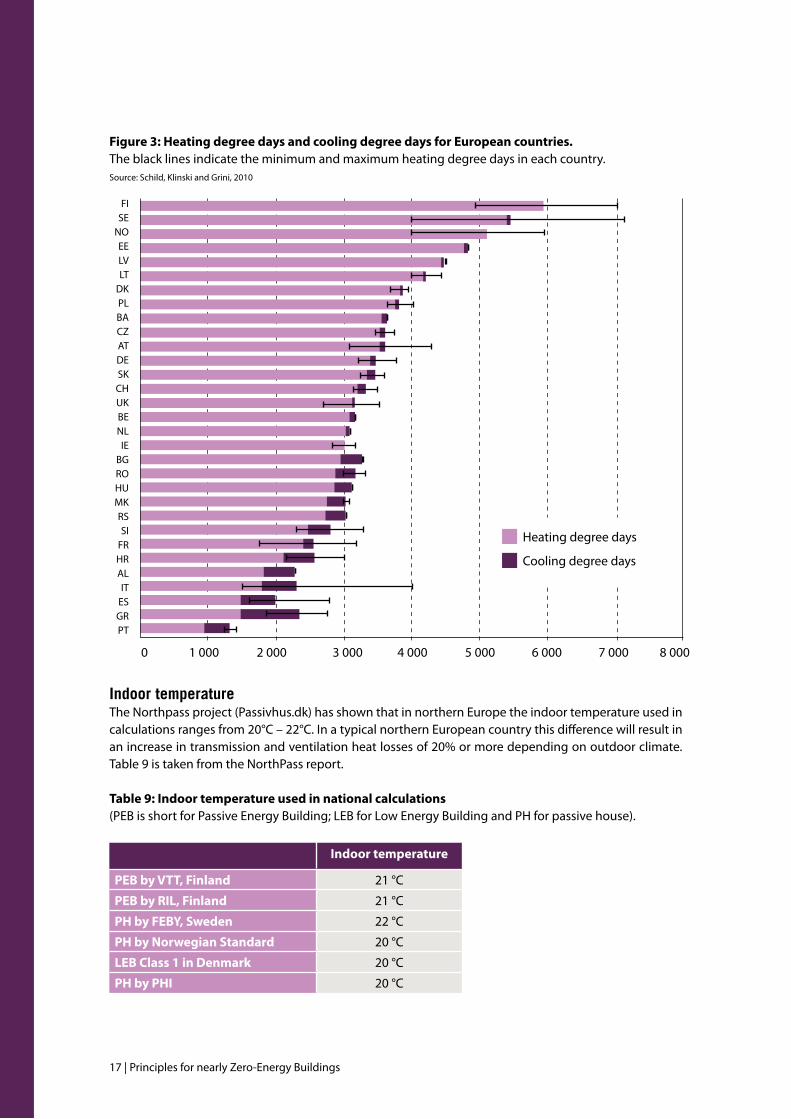
17 | Principles for nearly Zero-Energy Buildings
Figure 3: Heating degree days and cooling degree days for European countries. The black lines indicate the minimum and maximum heating degree days in each country.Source: Schild, Klinski and Grini, 2010
indoor temperatureThe Northpass project (Passivhus.dk) has shown that in northern Europe the indoor temperature used in calculations ranges from 20°C – 22°C. In a typical northern European country this difference will result in an increase in transmission and ventilation heat losses of 20% or more depending on outdoor climate. Table 9 is taken from the NorthPass report.
Table 9: Indoor temperature used in national calculations(PEBisshortforPassiveEnergyBuilding;LEBforLowEnergyBuildingandPHforpassivehouse).
Indoor temperature
PEB by VTT, Finland 21 °C
PEB by RIL, Finland 21 °C
PH by FEBY, Sweden 22 °C
PH by Norwegian Standard 20 °C
LEB Class 1 in Denmark 20 °C
PH by PHI 20 °C
FISE
NOEELVLT
DKPLBACZATDESKCHUKBENLIE
BGROHUMKRSSI
FRHRALIT
ESGRPT
0 1 000 2 000 3 000 4 000 5 000 6 000 7 000 8 000
Heating degree days
Cooling degree days
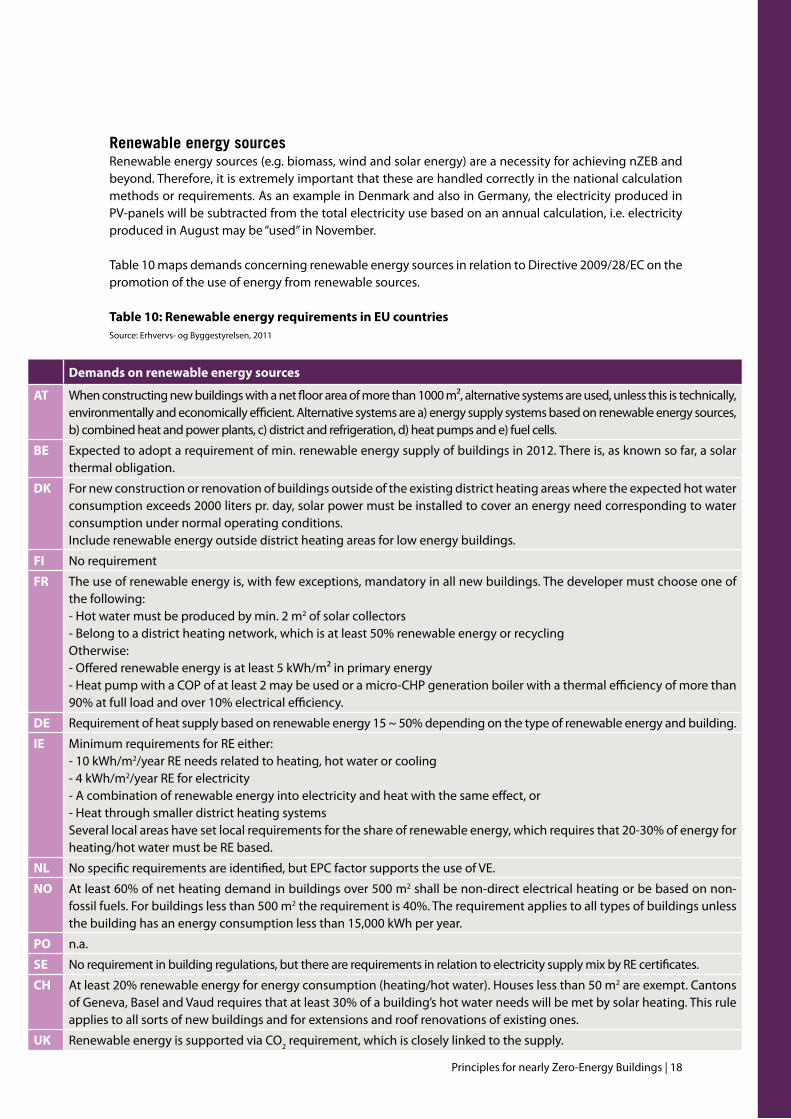
Principles for nearly Zero-Energy Buildings | 18
renewable energy sourcesRenewable energy sources (e.g. biomass, wind and solar energy) are a necessity for achieving nZEB and beyond. Therefore, it is extremely important that these are handled correctly in the national calculation methods or requirements. As an example in Denmark and also in Germany, the electricity produced in PV-panels will be subtracted from the total electricity use based on an annual calculation, i.e. electricity produced in August may be “used” in November.
Table 10 maps demands concerning renewable energy sources in relation to Directive 2009/28/EC on the promotion of the use of energy from renewable sources.
Table 10: Renewable energy requirements in EU countries Source: Erhvervs- og Byggestyrelsen, 2011
Demands on renewable energy sources
AT When constructing new buildings with a net floor area of more than 1000 m², alternative systems are used, unless this is technically, environmentally and economically efficient. Alternative systems are a) energy supply systems based on renewable energy sources, b) combined heat and power plants, c) district and refrigeration, d) heat pumps and e) fuel cells.
BE Expected to adopt a requirement of min. renewable energy supply of buildings in 2012. There is, as known so far, a solar thermal obligation.
DK For new construction or renovation of buildings outside of the existing district heating areas where the expected hot water consumption exceeds 2000 liters pr. day, solar power must be installed to cover an energy need corresponding to water consumption under normal operating conditions.Include renewable energy outside district heating areas for low energy buildings.
FI No requirement
FR The use of renewable energy is, with few exceptions, mandatory in all new buildings. The developer must choose one of the following:- Hot water must be produced by min. 2 m2 of solar collectors- Belong to a district heating network, which is at least 50% renewable energy or recyclingOtherwise:- Offered renewable energy is at least 5 kWh/m² in primary energy- Heat pump with a COP of at least 2 may be used or a micro-CHP generation boiler with a thermal efficiency of more than 90% at full load and over 10% electrical efficiency.
DE Requirement of heat supply based on renewable energy 15 ~ 50% depending on the type of renewable energy and building.
IE Minimum requirements for RE either:- 10 kWh/m2/year RE needs related to heating, hot water or cooling- 4 kWh/m2/year RE for electricity- A combination of renewable energy into electricity and heat with the same effect, or- Heat through smaller district heating systemsSeveral local areas have set local requirements for the share of renewable energy, which requires that 20-30% of energy for heating/hot water must be RE based.
NL No specific requirements are identified, but EPC factor supports the use of VE.
NO At least 60% of net heating demand in buildings over 500 m2 shall be non-direct electrical heating or be based on non-fossil fuels. For buildings less than 500 m2 the requirement is 40%. The requirement applies to all types of buildings unless the building has an energy consumption less than 15,000 kWh per year.
PO n.a.
SE No requirement in building regulations, but there are requirements in relation to electricity supply mix by RE certificates.
CH At least 20% renewable energy for energy consumption (heating/hot water). Houses less than 50 m2 are exempt. Cantons of Geneva, Basel and Vaud requires that at least 30% of a building’s hot water needs will be met by solar heating. This rule applies to all sorts of new buildings and for extensions and roof renovations of existing ones.
UK Renewable energy is supported via CO2 requirement, which is closely linked to the supply.
19 | Principles for nearly Zero-Energy Buildings
In Annex 1 there is a more detailed description of individual national definitions of low energy buildings in European countries (taken from Thomsen and Wittchen, 2008).
2.4 Comparative overview of the existing definitionsIn the previous chapters it has been shown that there is no unique definition of nZEB/low energy buildings within European countries. Almost every country has its own definition and therefore it is necessary to explain the differences and boundaries. Generally, a low energy/nearly Zero-Energy Building is defined relating to the specific energy demand (expressed in kWh/m²a) or/and total energy demand expressed in a percentage of or better than the minimum requirement in individual national building codes. The UK stands out by defining low energy buildings in relation to CO2 emissions.
The definitions, descriptions or recommendations concerning low energy buildings differ largely between the different countries. In some countries, the definition specifies a percentage that a low energy building must be below the minimum requirement for standard buildings in the individual national building code (weassumethatthisvaluereferstoprimaryenergy,as intheGermancase;howeverthesourcedoesnot always specify that). In other countries, the definition specifies a specific maximum energy demand per square metre. Finally, some countries specify both. In addition to these, one country specifies the maximum transmission heat loss dependent on building shape (H’T) and one recommends staying below certain values.
Significant differences also exist in terms of what energy use is covered by the definition. Some definitions ask for minimum energy requirements covering only energy for heating while others set energy requirements for all heating, cooling and water heating needs. Others again include electricity used for lighting (mainly for commercial buildings) and even the electricity consumption of appliances. Moreover, in some definitions the specific maximum energy demand is climate dependent and even altitude dependent (e.g. in France). Most of the countries’ definitions refer to new buildings, but there are some countries that have already established definitions for the renovation of buildings as well.
In general the definitions adopted within European countries refer mainly to the energy demand (percentage of minimum requirement or specific value) and only a few countries have a direct specification of the amount of energy that should come from renewable energy sources. Table 11 gives an overview of the countries that have a definition for low energy buildings and have specifics for these definitions.
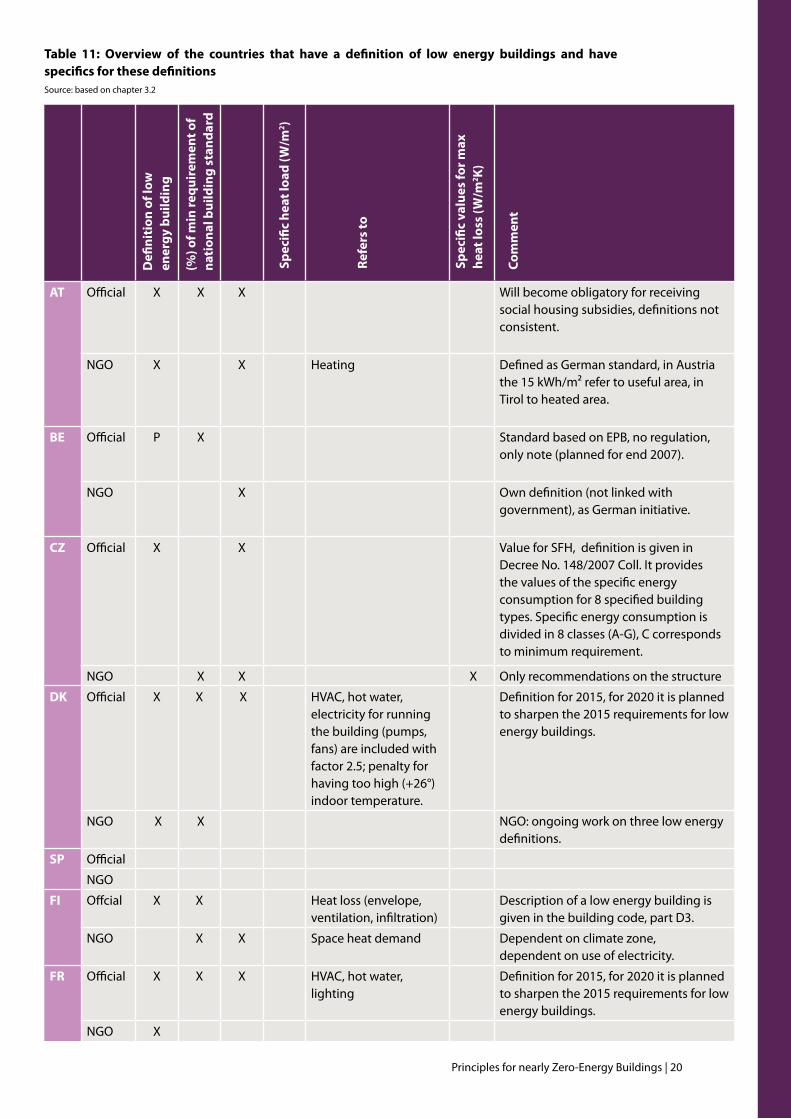
Principles for nearly Zero-Energy Buildings | 20
Table 11: Overview of the countries that have a definition of low energy buildings and have specifics for these definitions Source: based on chapter 3.2
AT Official X X X Will become obligatory for receiving social housing subsidies, definitions not consistent.
NGO X X Heating Defined as German standard, in Austria the 15 kWh/m² refer to useful area, in Tirol to heated area.
BE Official P X Standard based on EPB, no regulation, only note (planned for end 2007).
NGO X Own definition (not linked with government), as German initiative.
CZ Official X X Value for SFH, definition is given in Decree No. 148/2007 Coll. It provides the values of the specific energy consumption for 8 specified building types. Specific energy consumption is divided in 8 classes (A-G), C corresponds to minimum requirement.
NGO X X X Only recommendations on the structure
DK Official X X X HVAC, hot water, electricity for running the building (pumps, fans) are included with factor2.5;penaltyforhaving too high (+26°) indoor temperature.
Definition for 2015, for 2020 it is planned to sharpen the 2015 requirements for low energy buildings.
NGO X X NGO: ongoing work on three low energy definitions.
SP Official
NGO
FI Offcial X X Heat loss (envelope, ventilation, infiltration)
Description of a low energy building is given in the building code, part D3.
NGO X X Space heat demand Dependent on climate zone,dependent on use of electricity.
FR Official X X X HVAC, hot water, lighting
Definition for 2015, for 2020 it is planned to sharpen the 2015 requirements for low energy buildings.
NGO X
Defi
niti
on o
f low
en
ergy
bui
ldin
g
Spec
ific
heat
load
(W/m
2 )
Refe
rs to
Spec
ific
valu
es fo
r max
he
at lo
ss (W
/m2 K
)
Com
men
t
(%) o
f min
requ
irem
ent o
f na
tion
al b
uild
ing
stan
dard
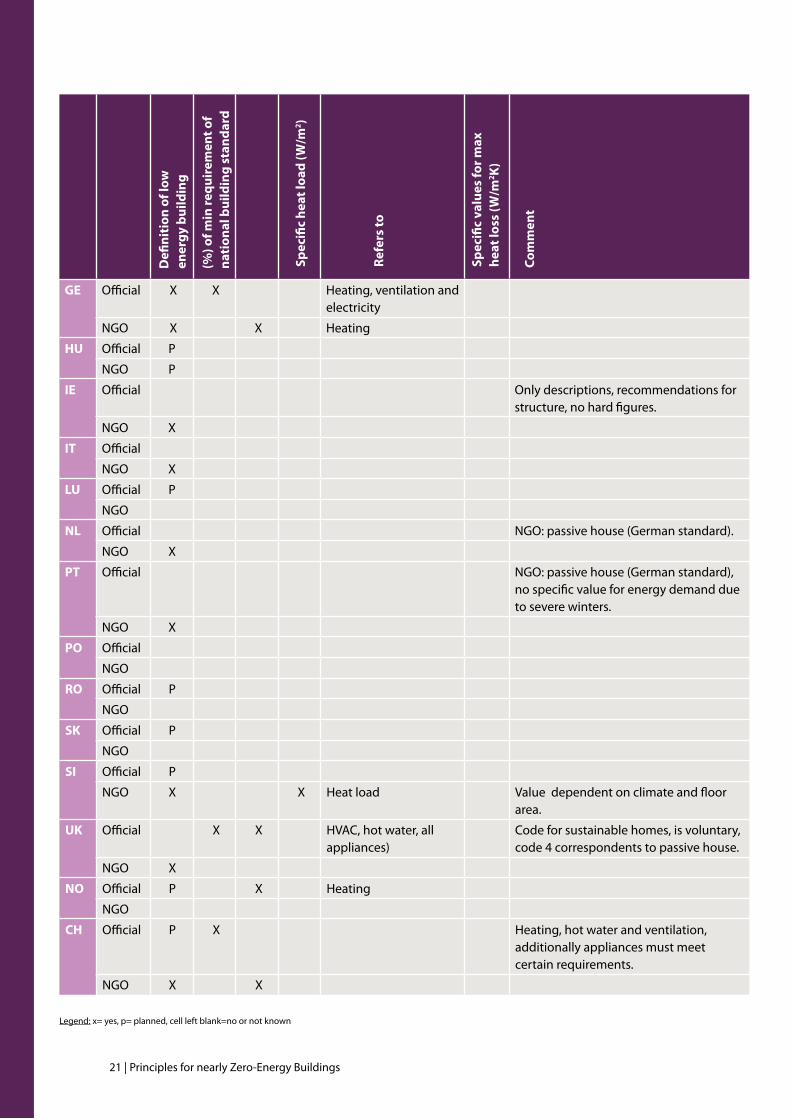
21 | Principles for nearly Zero-Energy Buildings
GE Official X X Heating, ventilation and electricity
NGO X X Heating
HU Official P
NGO P
IE Official Only descriptions, recommendations for structure, no hard figures.
NGO X
IT Official
NGO X
LU Official P
NGO
NL Official NGO: passive house (German standard).
NGO X
PT Official NGO: passive house (German standard), no specific value for energy demand due to severe winters.
NGO X
PO Official
NGO
RO Official P
NGO
SK Official P
NGO
SI Official P
NGO X X Heat load Value dependent on climate and floor area.
UK Official X X HVAC, hot water, all appliances)
Code for sustainable homes, is voluntary, code 4 correspondents to passive house.
NGO X
NO Official P X Heating
NGO
CH Official P X Heating, hot water and ventilation, additionally appliances must meet certain requirements.
NGO X X
Legend: x= yes, p= planned, cell left blank=no or not known
Defi
niti
on o
f low
en
ergy
bui
ldin
g
Spec
ific
heat
load
(W/m
2 )
Refe
rs to
Spec
ific
valu
es fo
r max
he
at lo
ss (W
/m2 K
)
Com
men
t
(%) o
f min
requ
irem
ent o
f na
tion
al b
uild
ing
stan
dard

Principles for nearly Zero-Energy Buildings | 22
2.5 common approaches and differences in current policies and methodologiesThe outcome of chapter 2.4 was compared to the requirements of the EPBD recast on nearly Zero-Energy Buildings with the view to identify to what extent current definitions would already fully suit the needs of the nearly zero-energy provision of the EPBD recast and its implementation at Member state level. The conclusions drawn are described below:
• MorethanhalfoftheMemberStatesdonothaveanofficiallyadopteddefinitionofloworZero-EnergyBuildings.
• Mostofthecountriesthathavedefinitionsspecifythemaximumprimaryenergypersquaremetreandyear as a percentage in relation to the existing national building regulations.
• In2009,variousMemberStatesalreadysetuplong-termstrategiesandtargetsforachievinglowenergyrequirements for new houses. Table 12 gives an overview of EU Member State policies on low energy buildings in 2009. The targets may overlap with more recent activities around the nZEBs requirements now given in the EPBD recast.
Table 12: Overview of EU Member State policies on low energy buildings in 200914
Low energy target
AT Planned: social housing subsidies only for passive buildings as of 2015.
DE By 2020 buildings should be operating without fossil fuel.
DK By 2020 all new buildings use 75% less energy than currently enshrined in code for new buildings. Interim steps: 50% less by 2015, 25% less by 2010 (base year=2006).
FI 30–40%lessby2010;passivehousestandardsby2015.
FR By 2012 all new buildings are low energy buildings (Effinergie standard), by 2020 new buildings are energy-positive.
HU New buildings to be zero emission buildings by 2020, for large investments already in 2012.
IE 60% less by 2010, Net Zero-Energy Buildings by 2013.
NL 50% reduction by 2015, 25% reduction by 2010 both compared to current code plans to build energy-neutral by 2020.
SE Total energy use / heated square metre in dwellings and non residential buildings should decrease. The decrease should amount to 20% until 2020 and 50% until 2050, compared to the corresponding use of energy in 1995.
UK 44 % better in 2013 (equivalent to passive house level) and zero carbon as of 2016.
• Thespecificvaluesdifferastowhatisincludedinthespecificenergydemand(fromheatdemandonly,to HVAC, hot water, lighting and electricity, different heated areas).
• Theexisting lowenergybuildingdefinitionsdonot includespecificsabout theshareof renewablesin the energy supply (as requested to happen by 2014 according to the RES Directive). Especially the lack of guidance for the share of renewables makes current regulations or definitions not fit with a definition needed in relation to the nearly zero-energy provision of the EPBD recast (although the law on renewable heat in Germany for example gives a minimum percentage of renewable energy to be supplied, differentiated by technology, but is connected to the current building regulation and is not a specific low or zero-energy definition).
• However, variouselementsof existing concepts canbeused for thedevelopmentof anearlyZero-Energy Buildings definition, e.g. the principle of working with overarching targets accompanied by “sub-thresholds” on specific issues (such as the passive house concept with its requirements on maximum primary energy demand and additional limits for heating energy demand).
14SBI(DanishBuildingInstitute),EuropeanStrategiestomovetowardsverylowenergybuildings,2008;plusothersources
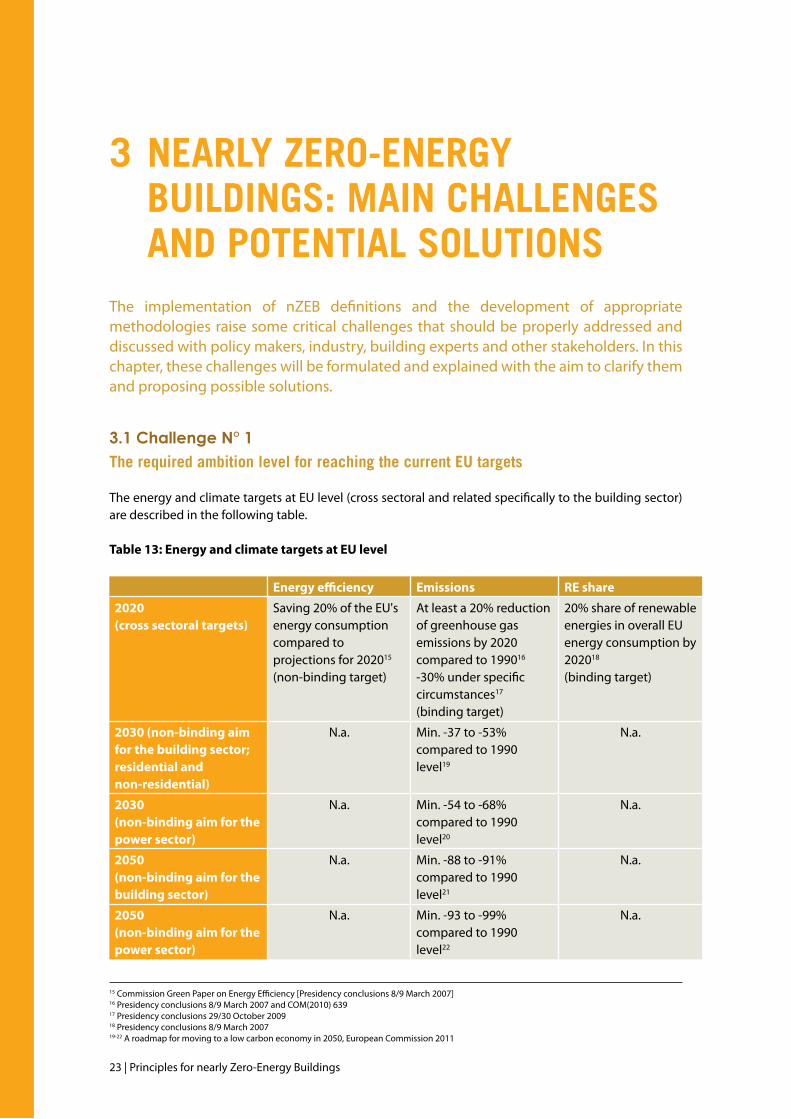
23 | Principles for nearly Zero-Energy Buildings
3 nearly Zero-energy Buildings: main cHallenges and Potential solutions
The implementation of nZEB definitions and the development of appropriate methodologies raise some critical challenges that should be properly addressed and discussed with policy makers, industry, building experts and other stakeholders. In this chapter, these challenges will be formulated and explained with the aim to clarify them and proposing possible solutions.
3.1 challenge n° 1the required ambition level for reaching the current eu targets
The energy and climate targets at EU level (cross sectoral and related specifically to the building sector) are described in the following table.
Table 13: Energy and climate targets at EU level
Energy efficiency Emissions RE share
2020 (cross sectoral targets)
Saving 20% of the EU's energy consumption compared to projections for 202015 (non-binding target)
At least a 20% reduction of greenhouse gas emissions by 2020 compared to 199016 -30% under specific circumstances17 (binding target)
20% share of renewable energies in overall EU energy consumption by 202018
(binding target)
2030 (non-binding aim for the building sector; residential and non-residential)
N.a. Min. -37 to -53% compared to 1990 level19
N.a.
2030 (non-binding aim for the power sector)
N.a. Min. -54 to -68% compared to 1990 level20
N.a.
2050 (non-binding aim for the building sector)
N.a. Min. -88 to -91% compared to 1990 level21
N.a.
2050 (non-binding aim for the power sector)
N.a. Min. -93 to -99% compared to 1990 level22
N.a.
15 Commission Green Paper on Energy Efficiency [Presidency conclusions 8/9 March 2007]16 Presidency conclusions 8/9 March 2007 and COM(2010) 63917 Presidency conclusions 29/30 October 200918 Presidency conclusions 8/9 March 200719-22 A roadmap for moving to a low carbon economy in 2050, European Commission 2011
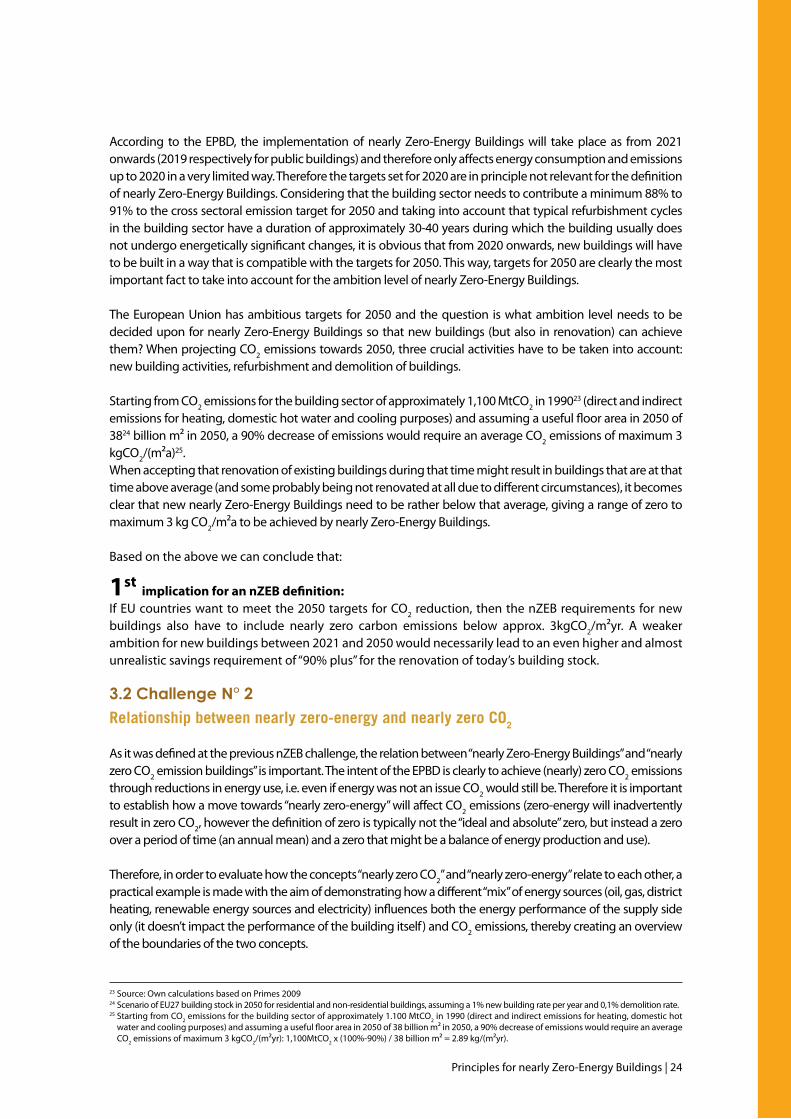
Principles for nearly Zero-Energy Buildings | 24
According to the EPBD, the implementation of nearly Zero-Energy Buildings will take place as from 2021 onwards (2019 respectively for public buildings) and therefore only affects energy consumption and emissions up to 2020 in a very limited way. Therefore the targets set for 2020 are in principle not relevant for the definition of nearly Zero-Energy Buildings. Considering that the building sector needs to contribute a minimum 88% to 91% to the cross sectoral emission target for 2050 and taking into account that typical refurbishment cycles in the building sector have a duration of approximately 30-40 years during which the building usually does not undergo energetically significant changes, it is obvious that from 2020 onwards, new buildings will have to be built in a way that is compatible with the targets for 2050. This way, targets for 2050 are clearly the most important fact to take into account for the ambition level of nearly Zero-Energy Buildings.
The European Union has ambitious targets for 2050 and the question is what ambition level needs to be decided upon for nearly Zero-Energy Buildings so that new buildings (but also in renovation) can achieve them? When projecting CO2 emissions towards 2050, three crucial activities have to be taken into account: new building activities, refurbishment and demolition of buildings.
Starting from CO2 emissions for the building sector of approximately 1,100 MtCO2 in 199023 (direct and indirect emissions for heating, domestic hot water and cooling purposes) and assuming a useful floor area in 2050 of 3824 billion m² in 2050, a 90% decrease of emissions would require an average CO2 emissions of maximum 3 kgCO2/(m²a)25. When accepting that renovation of existing buildings during that time might result in buildings that are at that time above average (and some probably being not renovated at all due to different circumstances), it becomes clear that new nearly Zero-Energy Buildings need to be rather below that average, giving a range of zero to maximum 3 kg CO2/m²a to be achieved by nearly Zero-Energy Buildings.
Based on the above we can conclude that:
1st implication for an nZEB definition: If EU countries want to meet the 2050 targets for CO2 reduction, then the nZEB requirements for new buildings also have to include nearly zero carbon emissions below approx. 3kgCO2/m²yr. A weaker ambition for new buildings between 2021 and 2050 would necessarily lead to an even higher and almost unrealistic savings requirement of “90% plus” for the renovation of today’s building stock.
3.2 challenge n° 2relationship between nearly zero-energy and nearly zero co2
As it was defined at the previous nZEB challenge, the relation between “nearly Zero-Energy Buildings” and “nearly zero CO2 emission buildings” is important. The intent of the EPBD is clearly to achieve (nearly) zero CO2 emissions through reductions in energy use, i.e. even if energy was not an issue CO2 would still be. Therefore it is important to establish how a move towards “nearly zero-energy” will affect CO2 emissions (zero-energy will inadvertently result in zero CO2, however the definition of zero is typically not the “ideal and absolute” zero, but instead a zero over a period of time (an annual mean) and a zero that might be a balance of energy production and use).
Therefore, in order to evaluate how the concepts “nearly zero CO2” and “nearly zero-energy” relate to each other, a practical example is made with the aim of demonstrating how a different “mix” of energy sources (oil, gas, district heating, renewable energy sources and electricity) influences both the energy performance of the supply side only (it doesn’t impact the performance of the building itself) and CO2 emissions, thereby creating an overview of the boundaries of the two concepts.
23 Source: Own calculations based on Primes 200924 Scenario of EU27 building stock in 2050 for residential and non-residential buildings, assuming a 1% new building rate per year and 0,1% demolition rate.25 Starting from CO2 emissions for the building sector of approximately 1.100 MtCO2 in 1990 (direct and indirect emissions for heating, domestic hot
water and cooling purposes) and assuming a useful floor area in 2050 of 38 billion m² in 2050, a 90% decrease of emissions would require an average CO2 emissions of maximum 3 kgCO2/(m²yr): 1,100MtCO2 x (100%-90%) / 38 billion m² = 2.89 kg/(m²yr).
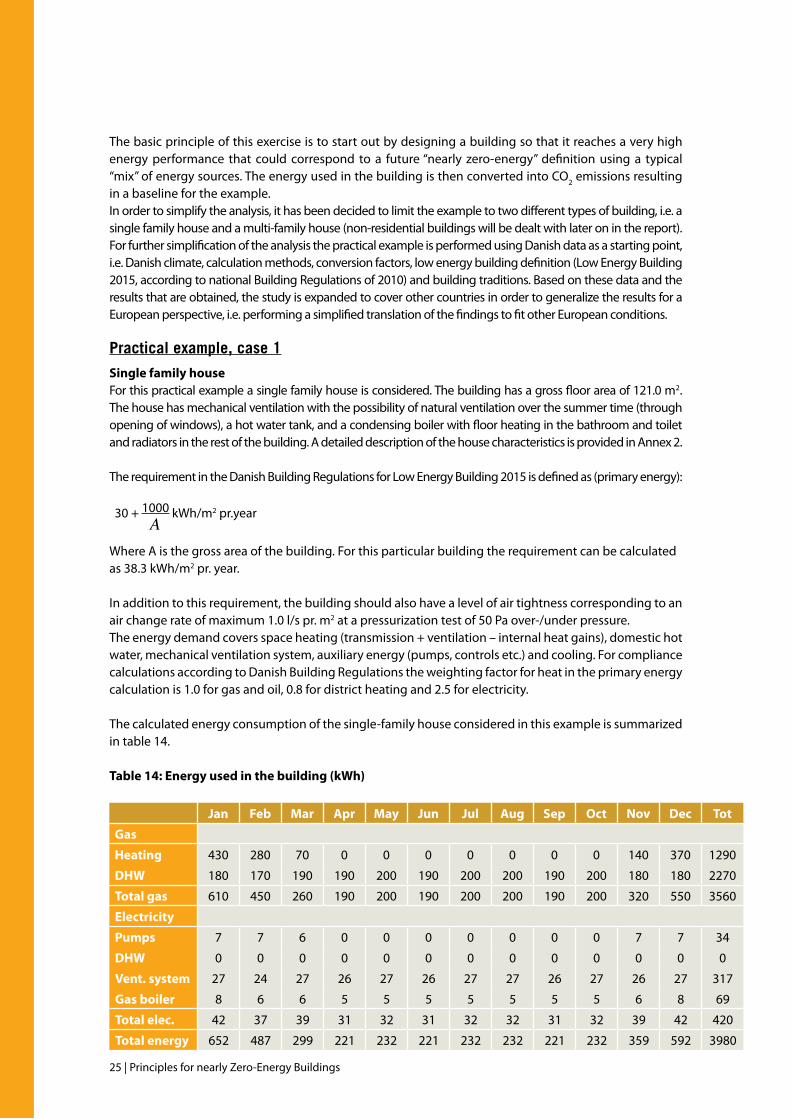
25 | Principles for nearly Zero-Energy Buildings
The basic principle of this exercise is to start out by designing a building so that it reaches a very high energy performance that could correspond to a future “nearly zero-energy” definition using a typical “mix” of energy sources. The energy used in the building is then converted into CO2 emissions resulting in a baseline for the example. In order to simplify the analysis, it has been decided to limit the example to two different types of building, i.e. a single family house and a multi-family house (non-residential buildings will be dealt with later on in the report). For further simplification of the analysis the practical example is performed using Danish data as a starting point, i.e. Danish climate, calculation methods, conversion factors, low energy building definition (Low Energy Building 2015, according to national Building Regulations of 2010) and building traditions. Based on these data and the results that are obtained, the study is expanded to cover other countries in order to generalize the results for a European perspective, i.e. performing a simplified translation of the findings to fit other European conditions.
Practical example, case 1
Single family houseFor this practical example a single family house is considered. The building has a gross floor area of 121.0 m2. The house has mechanical ventilation with the possibility of natural ventilation over the summer time (through opening of windows), a hot water tank, and a condensing boiler with floor heating in the bathroom and toilet and radiators in the rest of the building. A detailed description of the house characteristics is provided in Annex 2.
The requirement in the Danish Building Regulations for Low Energy Building 2015 is defined as (primary energy):
30 + 1000 kWh/m2 pr.year A
Where A is the gross area of the building. For this particular building the requirement can be calculated as 38.3 kWh/m2 pr. year.
In addition to this requirement, the building should also have a level of air tightness corresponding to an air change rate of maximum 1.0 l/s pr. m2 at a pressurization test of 50 Pa over-/under pressure.The energy demand covers space heating (transmission + ventilation – internal heat gains), domestic hot water, mechanical ventilation system, auxiliary energy (pumps, controls etc.) and cooling. For compliance calculations according to Danish Building Regulations the weighting factor for heat in the primary energy calculation is 1.0 for gas and oil, 0.8 for district heating and 2.5 for electricity.
The calculated energy consumption of the single-family house considered in this example is summarized in table 14.
Table 14: Energy used in the building (kWh)
Jan Feb Mar Apr May Jun Jul Aug Sep Oct Nov Dec Tot
Gas
Heating 430 280 70 0 0 0 0 0 0 0 140 370 1290
DHW 180 170 190 190 200 190 200 200 190 200 180 180 2270
Total gas 610 450 260 190 200 190 200 200 190 200 320 550 3560
Electricity
Pumps 7 7 6 0 0 0 0 0 0 0 7 7 34
DHW 0 0 0 0 0 0 0 0 0 0 0 0 0
Vent. system 27 24 27 26 27 26 27 27 26 27 26 27 317
Gas boiler 8 6 6 5 5 5 5 5 5 5 6 8 69
Total elec. 42 37 39 31 32 31 32 32 31 32 39 42 420
Total energy 652 487 299 221 232 221 232 232 221 232 359 592 3980
Principles for nearly Zero-Energy Buildings | 26
The total energy use (primary energy use) according to the Danish calculation method can be determined by adding the “total gas” and the “total electricity” multiplied by 2.5, i.e.:
3560kWh•1.0+420kWh•2.5 = 38.1 kWh/m2 pr.year 121m2
The building complies with the requirements for a Low Energy 2015 building.
The energy needed for the building can now be converted to CO2 emissions based on mean CO2 emission values for the different energy forms and primary energy use based on mean fuel factors. For the calculations mean CO2 emissions and mean fuel factors for Denmark are used. Values are given in Table 15.
Table 15: Mean values of CO2 emissions and primary energy factors for different energy sourcesSource: Danish Energy Agency
Energy source CO2 emission [kg/kWh]
Primary energy factor [kWh/kWh]
Gas 0.205 1.00
Electricity 0.567 2.18
District heating 0.177 0.80
Oil 0.265 1.00
Using the values from table 16 different scenarios can be calculated in order to evaluate how CO2-emissions and primary energy consumption vary depending on which energy sources are used for heating.
Figure 4: CO2 emission and primary energy use for the single-family house depending on which type of heating energy that is used in the house
2.75
2.50
2.25
2.00
1.75
1.50
1.25
1.00
0.75
0.50
0.25
0.00
11
10
9
8
7
6
5
4
3
2
1
0District Heating
denmark
CO2 e
mis
sion
(T)
Prim
ary
ener
gy u
se (M
Wh)
Heat pump Gas Oil Electricity
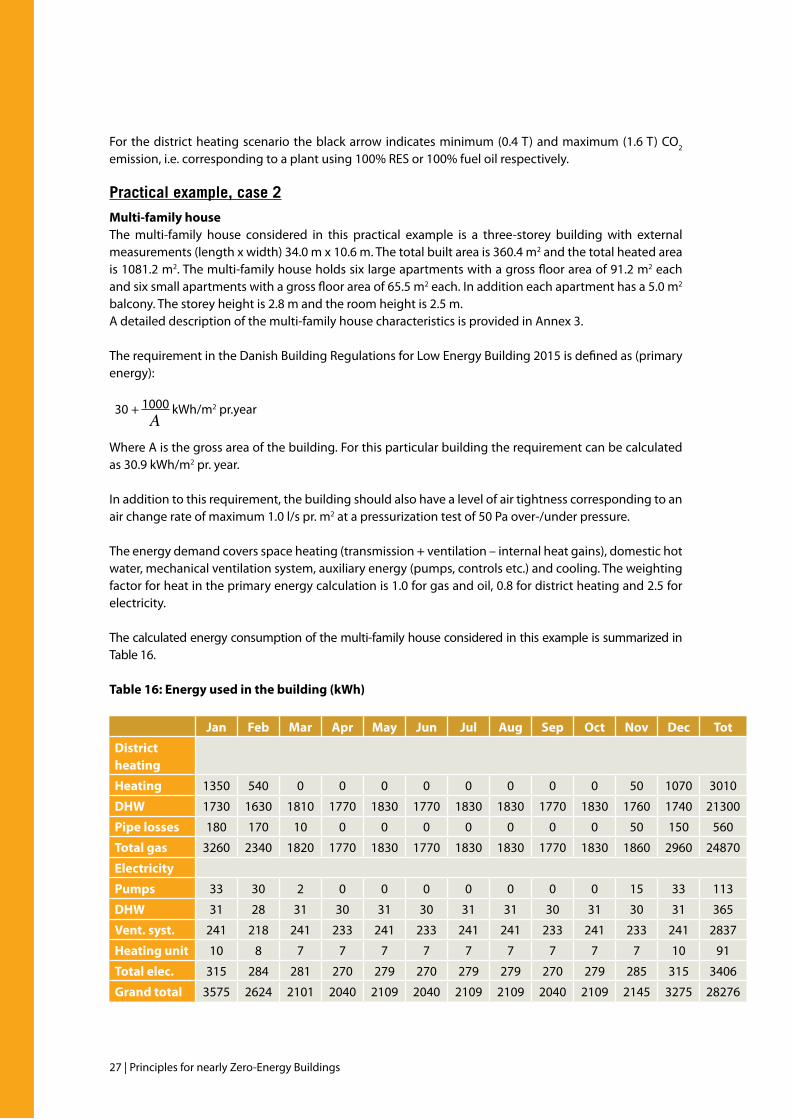
27 | Principles for nearly Zero-Energy Buildings
For the district heating scenario the black arrow indicates minimum (0.4 T) and maximum (1.6 T) CO2 emission, i.e. corresponding to a plant using 100% RES or 100% fuel oil respectively.
Practical example, case 2
Multi-family houseThe multi-family house considered in this practical example is a three-storey building with external measurements (length x width) 34.0 m x 10.6 m. The total built area is 360.4 m2 and the total heated area is 1081.2 m2. The multi-family house holds six large apartments with a gross floor area of 91.2 m2 each and six small apartments with a gross floor area of 65.5 m2 each. In addition each apartment has a 5.0 m2 balcony. The storey height is 2.8 m and the room height is 2.5 m. A detailed description of the multi-family house characteristics is provided in Annex 3.
The requirement in the Danish Building Regulations for Low Energy Building 2015 is defined as (primary energy):
30 + 1000 kWh/m2 pr.year A
Where A is the gross area of the building. For this particular building the requirement can be calculated as 30.9 kWh/m2 pr. year.
In addition to this requirement, the building should also have a level of air tightness corresponding to an air change rate of maximum 1.0 l/s pr. m2 at a pressurization test of 50 Pa over-/under pressure.
The energy demand covers space heating (transmission + ventilation – internal heat gains), domestic hot water, mechanical ventilation system, auxiliary energy (pumps, controls etc.) and cooling. The weighting factor for heat in the primary energy calculation is 1.0 for gas and oil, 0.8 for district heating and 2.5 for electricity.
The calculated energy consumption of the multi-family house considered in this example is summarized in Table 16.
Table 16: Energy used in the building (kWh)
Jan Feb Mar Apr May Jun Jul Aug Sep Oct Nov Dec Tot
District heating
Heating 1350 540 0 0 0 0 0 0 0 0 50 1070 3010
DHW 1730 1630 1810 1770 1830 1770 1830 1830 1770 1830 1760 1740 21300
Pipe losses 180 170 10 0 0 0 0 0 0 0 50 150 560
Total gas 3260 2340 1820 1770 1830 1770 1830 1830 1770 1830 1860 2960 24870
Electricity
Pumps 33 30 2 0 0 0 0 0 0 0 15 33 113
DHW 31 28 31 30 31 30 31 31 30 31 30 31 365
Vent. syst. 241 218 241 233 241 233 241 241 233 241 233 241 2837
Heating unit 10 8 7 7 7 7 7 7 7 7 7 10 91
Total elec. 315 284 281 270 279 270 279 279 270 279 285 315 3406
Grand total 3575 2624 2101 2040 2109 2040 2109 2109 2040 2109 2145 3275 28276

Principles for nearly Zero-Energy Buildings | 28
The total primary energy use according to the Danish calculation method can be determined by adding the “total district heating” multiplied by 0.8 and the “total electricity” multiplied by 2.5, i.e.:
24870kWh•1.0+3406kWh•2.5 = 30.9 kWh/m2 pr.year 1081.2 m2
The building complies with the requirements for a Low Energy 2015 building.
The energy needed for the building can now be converted to CO2 emissions. For the calculations, mean CO2 emissions for 2011 are used. Values are given in Table 16.
Using the values from Table 16 different scenarios can be calculated in order to evaluate how CO2 emissions and primary energy for the building vary depending on which energy sources are used for heating.
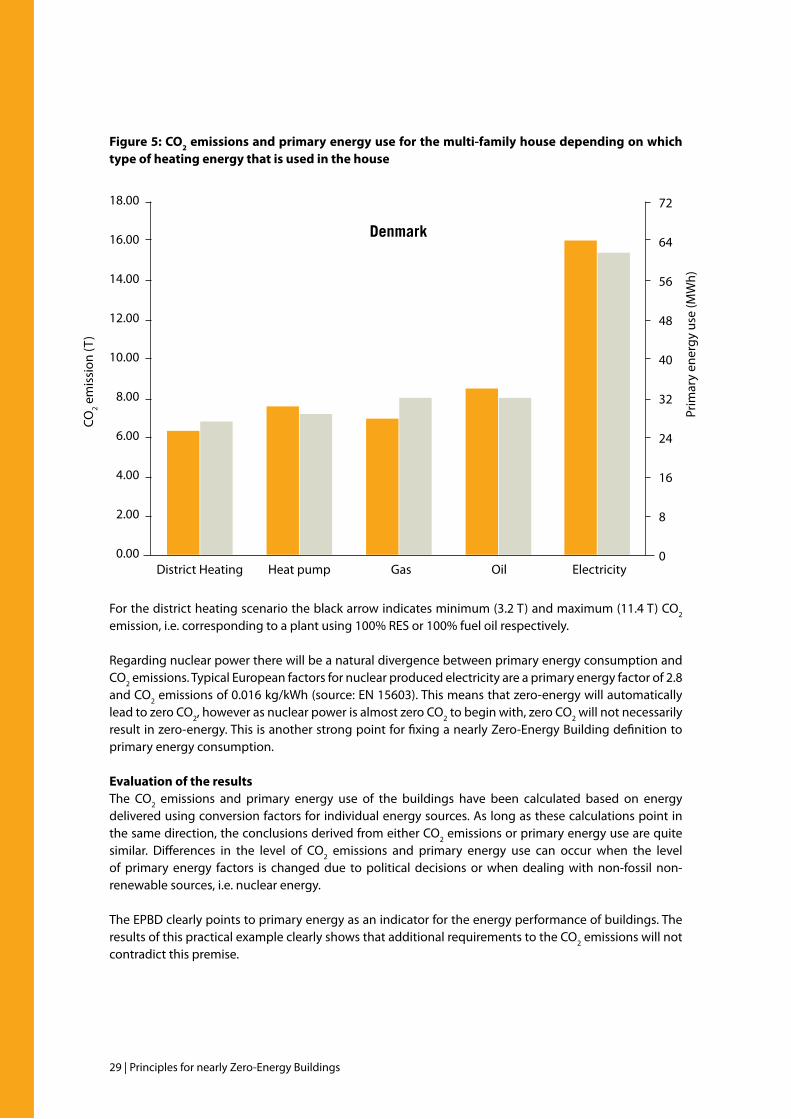
29 | Principles for nearly Zero-Energy Buildings
Figure 5: CO2 emissions and primary energy use for the multi-family house depending on which type of heating energy that is used in the house
For the district heating scenario the black arrow indicates minimum (3.2 T) and maximum (11.4 T) CO2 emission, i.e. corresponding to a plant using 100% RES or 100% fuel oil respectively.
Regarding nuclear power there will be a natural divergence between primary energy consumption and CO2 emissions. Typical European factors for nuclear produced electricity are a primary energy factor of 2.8 and CO2 emissions of 0.016 kg/kWh (source: EN 15603). This means that zero-energy will automatically lead to zero CO2, however as nuclear power is almost zero CO2 to begin with, zero CO2 will not necessarily result in zero-energy. This is another strong point for fixing a nearly Zero-Energy Building definition to primary energy consumption.
Evaluation of the resultsThe CO2 emissions and primary energy use of the buildings have been calculated based on energy delivered using conversion factors for individual energy sources. As long as these calculations point in the same direction, the conclusions derived from either CO2 emissions or primary energy use are quite similar. Differences in the level of CO2 emissions and primary energy use can occur when the level of primary energy factors is changed due to political decisions or when dealing with non-fossil non-renewable sources, i.e. nuclear energy.
The EPBD clearly points to primary energy as an indicator for the energy performance of buildings. The results of this practical example clearly shows that additional requirements to the CO2 emissions will not contradict this premise.
18.00
16.00
14.00
12.00
10.00
8.00
6.00
4.00
2.00
0.00
72
64
56
48
40
32
24
16
8
0District Heating
denmark
CO2 e
mis
sion
(T)
Prim
ary
ener
gy u
se (M
Wh)
Heat pump Gas Oil Electricity
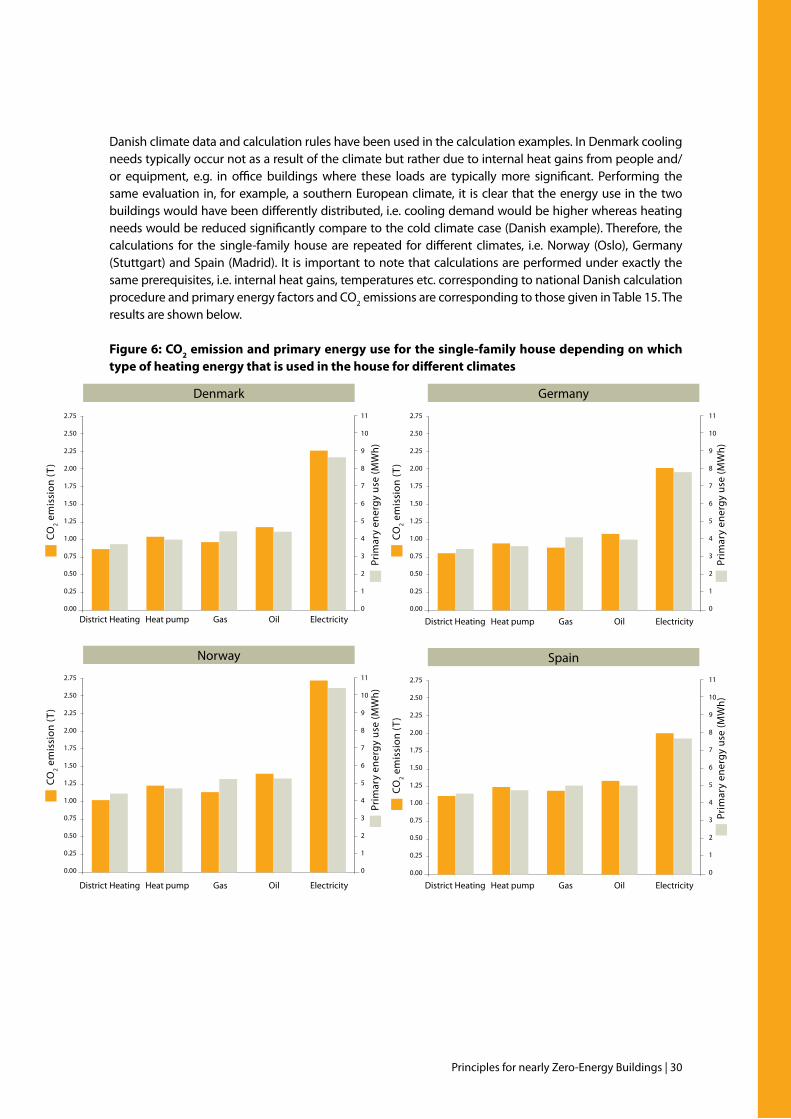
Principles for nearly Zero-Energy Buildings | 30
Danish climate data and calculation rules have been used in the calculation examples. In Denmark cooling needs typically occur not as a result of the climate but rather due to internal heat gains from people and/or equipment, e.g. in office buildings where these loads are typically more significant. Performing the same evaluation in, for example, a southern European climate, it is clear that the energy use in the two buildings would have been differently distributed, i.e. cooling demand would be higher whereas heating needs would be reduced significantly compare to the cold climate case (Danish example). Therefore, the calculations for the single-family house are repeated for different climates, i.e. Norway (Oslo), Germany (Stuttgart) and Spain (Madrid). It is important to note that calculations are performed under exactly the same prerequisites, i.e. internal heat gains, temperatures etc. corresponding to national Danish calculation procedure and primary energy factors and CO2 emissions are corresponding to those given in Table 15. The results are shown below.
Figure 6: CO2 emission and primary energy use for the single-family house depending on which type of heating energy that is used in the house for different climates
2.75
2.50
2.25
2.00
1.75
1.50
1.25
1.00
0.75
0.50
0.25
0.00
2.75
2.50
2.25
2.00
1.75
1.50
1.25
1.00
0.75
0.50
0.25
0.00
2.75
2.50
2.25
2.00
1.75
1.50
1.25
1.00
0.75
0.50
0.25
0.00
2.75
2.50
2.25
2.00
1.75
1.50
1.25
1.00
0.75
0.50
0.25
0.00
11
10
9
8
7
6
5
4
3
2
1
0
11
10
9
8
7
6
5
4
3
2
1
0
11
10
9
8
7
6
5
4
3
2
1
0
11
10
9
8
7
6
5
4
3
2
1
0
District Heating
Denmark
Norway
Germany
Spain
CO
2 em
issi
on (T
) C
O2 e
mis
sion
(T)
CO
2 em
issi
on (T
) C
O2 e
mis
sion
(T)
Pri
mar
y en
ergy
use
(MW
h) P
rim
ary
ener
gy u
se (M
Wh)
Pri
mar
y en
ergy
use
(MW
h) P
rim
ary
ener
gy u
se (M
Wh)
Heat pump Gas Oil Electricity
District Heating Heat pump Gas Oil Electricity District Heating Heat pump Gas Oil Electricity
District Heating Heat pump Gas Oil Electricity
31 | Principles for nearly Zero-Energy Buildings
Naturally, placing these specific buildings in a different climate would make no sense, as other climates (and cultures, building traditions etc.) would require a different construction practice. Therefore, the calculations cannot be readily extrapolated as done here but the results do represent an indication on how CO2 emissions would depend on climate. The reason for the high CO2 emissions calculated for Spain is that in this climate (for this particular building) cooling needs are quite severe, and the calculation methodology‘punishes’ this by introducing electrical cooling, i.e.multiplying the cooling need by afactor 2.5 as it cannot be covered by district heating, gas or oil.
Based on the above we can conclude that:
2nd implication for an nZEB definition:The first nZEB implication identified the need for a consistent definition, which should contribute at the same time to both energy and CO2 emission reductions. Hence, the minimum requirements for the energy performance of the building should use an energy indicator that can properly indicate both energy and CO2 emissions of the building and the reduced energy consumption should lead to a proportional reduction of CO2 emissions.
In general, the primary energy use of a building accurately reflects the depletion of fossil fuels and is sufficiently proportional to CO2 emissions. Proportions are only distorted when nuclear electricity is involved. Nevertheless, if a single indicator is to be adopted, then the energy performance of the building should be indicated in terms of primary energy, as in line with current EPBD. However, to reflect the climate relevance of a building’s operation, CO2 emissions should be added as supplementary information.
It should be noted that there are additional requirements for ensuring a match between nZEBs and climate targets. In particular, it is very important that the conversion factors from final to primary energy are based on reality and not influenced by political considerations or by an inaccurate approximation. Moreover the conversion factors should be adapted continuously to the real situation of the energy system.
3.3 challenge n° 3How to better assess the energy performance of a building? local and temporal disparities of renewable energy production
Local disparitiesIn Denmark, only renewable energy sources (RES) produced on-site are considered in the calculation of the building energy need, i.e. for compliance calculations reveal the consequences of not allowing for local disparities between supply and use of energy from renewable sources. This means that from a building owner’s perspective (micro perspective) it is quite difficult to reach a CO2 emission level corresponding to ”nearly zero” whereas from a societal perspective (macro perspective) it is quite easy.
The EPBD recast states that “The nearly zero or very low amount of energy required should be covered to a very significant extent by energy from renewable sources, including energy from renewable sources produced on-site or nearby”, i.e. according to the EPBD recast all these options including variations thereof seem to be possible:
1. On-site: Means that any renewable energy is produced on the cadastre, i.e. sun or wind power generated on-site or biomass transported to and used on-site.
2. On-site + nearby: As above but including nearby generation, i.e. common shared facilities built in conjunction with a larger group of buildings.
3. On-site + nearby + off-site: Including all renewable energy produced on-site, nearby or off-site, i.e. in the grid.
Principles for nearly Zero-Energy Buildings | 32
There are different opinions among stakeholders, experts and policy makers whether off-site (=grid) renewables are or should be included in this definition. However the EPBD text appears to be clear in saying that “the nearly zero or very low amount of energy required should be covered to a very significant extent by energy from renewable sources, including [but not saying: “being” or “limited to”] energy from renewable sources produced on-site or nearby”.
The advantage of using a calculation method based only on on-site energy production is that it ensures that any renewable energy taken into account in the initial calculation is strictly related to that particular building, i.e. changes in grid connections do not influence CO2 emissions for the building. For compliance calculations and comparisons to building regulations it is important to apply methods that are robust in this respect. The disadvantage is that for larger building projects (i.e. a large group of similar single-family houses) it is not possible to approve a common centralized RES production for individual buildings. Another disadvantage is the risk of missing the obvious possibilities and synergies that lie in sharing an installation where one building can produce energy while another uses energy.
The advantage of including nearby production is that a larger group of buildings could benefit from a common centralized RES production (e.g. district heat or cold) and this could also help even out some peak demands in the system. In order to avoid any changes in CO2 emissions however, this type of system would call for specific boundaries as to how this common RES production could be utilised in connection withfuturebuildings‘nearby’,i.e.soasnottounderminetheoriginallycalculatedCO2 emission levels.
All RES produced anywhere in the grid has the advantage of not blocking the opportunity of reaching zero CO2 emissions for any building, i.e. buildings in cities would typically not be able to produce significant amounts of RES on-site or nearby to reach zero CO2 emissions. However it must be ensured that fraud or double counting is not happening related to green energy taken from grids.
Temporal disparities – balance periodThe composition of the energy system is also extremely important. For instance, an energy system based on windmills will result in very uneven (fluctuating) energy production depending on when and how much wind is available. In other words, there will be periods with a lot of energy available and other periods with less. Furthermore, the system should be able to cope with peak demands when both private consumers and businesses use power simultaneously. In order to ensure consistency between energy supply and demand, the following methods should be contemplated:
• The energy system shouldbedesigned in close cooperationwith neighbouring countries throughthe expansion of electricity interconnections, so that national fluctuations in energy supply could be countered by other types of RES or storage capacities from neighbouring countries.
• Thenationalenergysystemshouldbedesignedtobeflexible.Windpowershouldbesupplementedwith other renewable energy sources, i.e. “virtual” power plants based on burning biomass, biogas and waste, heat pumps etc.
• Theconsumptionofpowershouldalsobemademoreflexibletoavoidfluctuationsandoptimisetheutilisation of electricity, i.e. where feasible, power should be used when it is created or demand be shifted to times of high supply.
The optimal energy supply mix also depends on how other countries’ energy systems can be expected to develop in the future. If neighbouring countries (in or outside the EU) are also pursuing ambitious climate policies (as they certainly are) it is expected that the demand for biomass will grow so strong that there will be pressure on both resources and prices. Developing a sustainable energy system therefore calls for careful planning both nationally and internationally.
33 | Principles for nearly Zero-Energy Buildings
There are different possibilities to allow for temporal disparities in the energy production/use of a building. Looking at hourly or daily balances would mean almost no allowance for disparities, whereas looking at yearly balances would mean more or less full allowance for disparities. Allowing no temporal disparities, i.e. considering an hourly or daily balance, will impose significant restrictions on the possibilities of utilising the grid as a buffer for energy resulting in a need for the building to produce significantly more renewable energy than would be necessary if larger temporal disparities were allowed. Ontheotherhand, ifyearlybalancesareallowed, itcanpresentaproblemthatmost‘production’willoccurduringcertainperiodsoftheyear,e.g.periodswithalotofsolarradiationorwind,whereas‘use’will occur in other periods, e.g. when no or very little renewable energy production occurs. This could presenttwoproblems,i.e.the‘overproduction’ofREcannotbeutilisedorstoredandinperiodswithlittleor no renewable energy production, energy will need to come from other sources. This would result in optimistic energy balances for individual buildings. Additionally, the CO2 emissions of the building in an annual balance varied largely according to the fuel mix of the grid energy used over the periods with less local renewable energy production.
In Denmark, time disparities between supply and demand of renewable energy sources is allowed for PV panels and windmills (placed on the building or the building site), i.e. renewable energy produced in January can be used in February and the total production over the year can be distributed as needed. However, total production cannot exceed total demand, i.e. if the building produces more electricity than it uses this surplus of electricity is “lost” in the calculation of the energy need. From the building owners perspective this is an advantage as it makes it possible to cover the entire electricity need of the building by renewable energy. From a societal perspective, however, it can present a problem as it may not be possible to utilise a surplus of energy at the time when it is produced. Furthermore, if production of energy by renewable energy is extended, everybody will produce energy at the same time resulting in peaks that may overload the electricity network and the energy will have to be discarded. However the larger the grid and the volume of consumers/producers connected to it, the more possibilities there are for balancing.
Whereas the previous thoughts mainly aim at electricity-driven heating or cooling systems, or a situation where electric appliances would be included in the balance, questions relating to local and time disparities can also be raised for heat produced on-site, nearby or off-site.
Compared to electricity, with today’s technology real off-site production of heat for buildings from renewable sources is not an option as long as large district heating networks are considered to be solutions where energy is produced “nearby”.This also means, that options for using on-site produced heat have to be found on-site or nearby, thus the number of these options is much lower for heat than for electricity where off-site is a viable option as well.
On a smaller scale than with electricity networks it has to be decided if central solutions or decentralised solutions should be preferred.
Generally a district heating (or cold) grid is attractive for an investor when stable and high enough demand can be expected for several years or decades. Otherwise the risk of never receiving a pay back from the infrastructure investment will prevent him from wanting to invest. There are already examples where district heating suppliers refuse to connect very low energy buildings to their grid for the stated reason of disadvantageous economics. Solutions currently being discussed therefore recommend an obligation for new buildings or new neighbourhoods to be connected to planned or existing district heating or cooling grids – but under the pre-condition that the supplier has to guarantee a minimum share of heat from renewable sources. There might also be an obligation to increase this share over time.
Principles for nearly Zero-Energy Buildings | 34
This means that in order to give a clear framework for achieving new nearly Zero-Energy Buildings, there must be clear responsibilities from the start of every building project:
1. Who is responsible for the “very high energy performance, as determined in accordance with Annex I. The nearly zero or very low amount of energy required” in a building?
2. Who is responsible for that “the nearly zero or very low amount of energy required should be covered to a very significant extent by energy from renewable sources, including energy from renewable sources produced on-site or nearby”?
Both situations can either be handled by one body or by different bodies. The recommendation that can be given is: for every place where a new nearly Zero-Energy Building is to be erected, the local regulations should make it very clear to the builder if he is to take care of only 1. (because there is an obligation to connect to a grid) or of both 1. and 2.
It also means: with the EPBD definition in mind, future obligations for builders to connect to a heat or cold grid must be backed up by an obligation for the grid operator and/or the heat provider to ensure a “very significant extent [of ] energy from renewable sources” in the heat or cold they deliver.
This also means: where new developments at neighbourhood level are planned, the general approach must be that the local administration or the project developer has to make a clear decision for decentralised (every single building) or district solutions for the area to be developed from the start. In this context solutions which are known from PV could be fixed beforehand: if it makes sense, a supplier might rent roof space from the building owners and build solar thermal power plants which feed into the grid in order to be the only one who produces energy on-site or nearby.
The extent to which local disparities matter in this context largely depends on the renewable energy used for the production of heating or cooling. In the case of solar energy the largest problems occur in cold climates, in winter time, when there is usually the highest demand and lowest production due to low solar irradiation. While individual solar thermal plants may be sufficient for summer domestic hot water (DHW) demand and might even feed surplus heat into the grid, additional energy is needed in winter from a central plant. Such a solution might be preferable when there is insufficient space for a central solar thermal plant. As long as the whole production is in one hand (and still several producers could compete at the start and be supervised by a control body) the financial attractiveness can be assessed with acceptable probability. Problems will occur when the central supplier would have to maintain it while the grid would only be needed during quite a short heating period. Apparently this is unattractive for a central supplier.
In the case of biomass-based heat production it does not seem to be advisable to have several decentralised boilers plus a grid, except when the grid distributes the renewable fuel (e.g. biogas) and not the renewable heat.
Time disparities are less critical – at least today – for heat than for electricity as there are more options for heat (or cold) storage for some hours, days, weeks or months. Also a heat grid itself has some storage capacity. But still the solutions are quite different for decentralised or centralised approaches. Again, this requires a clear and stable local framework towards central or decentralised solutions. Thus the upcoming era of nearly Zero-Energy Buildings calls for new packages of regulation for district supply of heat and/or cold.
35 | Principles for nearly Zero-Energy Buildings
Based on the above we can conclude that:
3rd implication for an nZEB definition: The nZEB definition should properly deal with local and temporal disparities of renewable energy production. This is necessary in order to, on the one hand, maximise the renewable energy share and the emission reductions and, on other hand, ensure a sustainable development of the local heating and cooling systems. Consequently the nZEB definition should consider the following:
• Astolocaldisparities,themostobviousandpracticalsolutionistoacceptandcountallon-site,nearbyand off-site production from renewable energy sources when calculating the primary energy use of the building. Allowing for only on-site and nearby renewable energy production could be a considerable barrier in implementing nZEB. Thus the nZEB definition should be flexible and adaptable to changes in local plans and strategies. For instance, a district heating connection should be mandatory for nZEBs when there are plans for a renewable powered district heating plant that offers supply at a reasonable price. Off-site renewable energy should be allowed as well because this offers more opportunities for ‘green’energyproduction,openingandnot restricting the futureprogress towardsenergy-positivebuildings26. However, off-site renewable energy has to be properly controlled and certified for avoiding fraud and double counting.
• TemporaldisparitiesinrenewableenergysupplymayinfluencetheassociatedGHGemissionsofthebuilding when off-site energy is used to compensate for periods with a lower renewable energy supply than the building’s actual energy demand. Therefore, the period over which the energy balance of the building is calculated is important. The practical solution, offering at the same time a reasonable compromise, is to accept either monthly or annual balances. If annual balances are allowed, it will be necessary to introduce an additional verification methodology to take into account the associated GHG emissions of the energy supply over the period. The monthly energy balances are short enough to offer a reasonable guarantee for the emissions associated with the energy supplied to the building. In order to keep the concept as simple as possible it seems preferable and sufficient to use for the time being an annual balance, but leave open the option for a more accurate yet demanding monthly energy balance in the future.
3.4 challenge n° 4elaborating an open concept towards energy-positive buildings
Existing systems “have become successful by having different elements that are self-reinforcing” (Eyre 2011, Unruh 2000). A lock-in situation is given, when systems resist fundamental external change (Eyre 2011). In this situation, a change in the system might not take place even if new technologies are available and their economic perspective might be positive.
A conclusion that can be drawn from these thoughts is that “nearly Zero-Energy Buildings” should not be regarded as an endpoint but only as an interim step towards even better buildings, e.g. so called “plus energy” or “energy positive” buildings. A future EPBD definition might define: “A building that has an outstanding high energy performance. The nearly zero amount of exergy required must be overcompensated by energy from renewable sources”. Exergy is the quality aspect of energy, i.e. electricity is high exergetic, 25ºC water is low exergetic.
A nearly zero-energy definition therefore must guide a process rather than aim at a fixed outcome, this means it must provide as much flexibility as possible and as much drive towards progress as necessary.
26 Energy-positive buildings are buildings with on-site renewable energy production higher than the building’s energy demand.
Principles for nearly Zero-Energy Buildings | 36
A prerequisite for moving from nearly zero-energy to positive energy buildings is an actual “near to” zero- energy demand. Otherwise it can be difficult to have a building constantly produce more renewable energy than it consumes (e.g. if the surface of the roof is not large enough to carry the necessary active solar systems).
As discussed in the previous chapter, very narrow system borders clearly restrict the options for nearly zero-energy demand to be covered to a very significant extent by energy from renewable sources. A narrow system boundary like the building shell or the cadastre would phase out the use of large-scale grid connected renewable energy and strongly enforce development of on-site solutions – thus increasing the chance of a lock-in as explained above.
The nearly zero-energy is usually derived by calculating a balance. In the previous chapter temporal and local disparities for determining this balance have been discussed. What was just mentioned for the local system border is also valid for the temporal dimension of the nearly zero-energy definition. Again a very narrow system border – like a real time equal balance for every second – would clearly restrict the options for nearly zero-energy demand to be covered to a very significant extent by energy from renewable sources. By extending the time interval for the balance, the options for achieving a close to zero balance rise.
Therefore it seems advisable to follow approaches such as annual or monthly balances. Nevertheless a drawback to increasing the time intervals is that an increasing share of energy from renewable sources produced on-site is in fact not used on-site but off-site because of the decreasing match between demand and supply loads in decreasing time intervals. Therefore the real share of grid power is higher than the annual balance shows and, thus, the real CO2 balance may as well be worse than the annual balance reveals – except when energy from the grid also stems from renewable sources and may be considered in the nZEB balance. This is another reason for interpreting the EPBD definition so as to include on-site, nearby and off-site energy from renewable sources.
But beyond the dimensions of time and space there is also the dimension of quality to be considered in the definition. The primary energy chain - final energy – useful energy – energy service is the issue. The further we move towards energy service, the less comparable things become as several different processes lead from one step to the next. For example, useful energy encompasses light and useful heat, final energy encompasses electricity and gas, primary energy gas and coal. The closer to the energy service the more different the quality or value of the energy spoken of may differ. Should, for example, a single-family home building that uses 500 kWh/a electricity for a heat pump but produces 500 kWh/a low exergy heat by means of solar thermal panels be regarded as “zero-energy”? Probably not. Hence, the quality of energy production should be considered as an important condition so as not to mislead the nZEB concept and leave it open for further developments towards energy positive buildings.
Regarding quality, a definition that at least includes a balance of input and output energies which are as close to the original source as possible seems to be advisable in order to not restrict options or foster misleading solutions by stimulating the balancing of “apples and pears”.
Therefore, a definition for nearly Zero-Energy Buildings must offer the possibility of expanding the concept in the future towards energy positive buildings. There are at least three dimensions that a definition for nearly Zero-Energy Buildings should consider:• Time;• Space;• Quality.
37 | Principles for nearly Zero-Energy Buildings
Based on the above we can conclude that:
4th implication for an nZEB definition:
In order to ensure maximum flexibility and to minimise the risk of lock-in situations the nZEB definition should take into account the following:
• Again,theevaluationofthebuildingsenergyperformanceshouldbebasedonanannualbalancebutmove towards a more accurate monthly balance in the future.
• Thesystemboundariesshouldnotbetootight,e.g.inclusionofrenewableenergyfromthegridshouldbe possible in specific cases when on-site/nearby capacities cannot be installed due to spatial and building geometry constrictions and/or weather conditions.
• Theenergybalancemusttakeintoaccountthequalityoftheenergyandbeassessedseparatelyforelectricity and heating. Hence, the quality of the energy production should be considered as being an important condition for avoiding a misleading nZEB concept with ineffective or counter-productive achievements.
3.5 challenge n° 5How to deal with different climate, building geometry and usage conditions
The European region is a very heterogeneous geographical zone with different climatic conditions, different building styles and cultural behaviours. When developing an nZEB definition, it is important to take these differences into account in a fair, yet simple way. The main conditions we have identified that could influence the nZEB definition or ambition are climate, building geometry and building use.
How to deal with different climatesThere are two different possible main approaches for defining a target benchmark for different climates:
• Defineafixed threshold formaximumallowedenergydemandor consumption forheatingand/orcooling (e.g. in kWh/m²a) independently from the Member State or climate conditions at the building location.- Pros: easy to communicate (one for all).- Cons: different efforts may be needed to fulfil requirements. This might be perceived as unfair.
• Defineathresholdformaximumallowedenergydemandorconsumptiondependentononeclimateindicator or several climate indicators, e.g. the sum of heating degree days (HDDs) and cooling degree days (CDDs).- Pros: threshold takes into account efforts to achieve target.- Cons: danger of (too) complex rules.
How to deal with different building geometriesAgain there are two different possible main approaches defining a target benchmark for different geometries:
• Define a fixed threshold formaximum allowed energy demand or consumption (e.g. in kWh/m²a)independently from the building’s geometry (incl. size).- Pros: easy to communicate (one for all).- Cons: different efforts to fulfil requirements can be perceived as unfair.
• Defineathresholdformaximumallowedenergydemandorconsumptiondependentonthegeometry(allow higher consumption of buildings with an unfavourable geometry).- Pros: threshold takes into account efforts to achieve target.- Cons: especially in the case of new buildings, the geometry of the building can be chosen by the
investor and it seems unfair to allow this e.g. higher energy consumption for buildings with an unfavourable geometry.
Principles for nearly Zero-Energy Buildings | 38
How to deal with different building uses (e.g. residential vs. non-residential)As to the use of buildings, there are many factors that might explain different energy requirements. A lab building will typically have much higher internal heat gains than a storage building. In a storage building or in a gym, lower indoor air temperatures are probably required than in a school building. Consequently, there are two different possible main approaches to defining a target benchmark for different building uses:
• Defineafixedthresholdformaximumallowedenergydemandorconsumption(e.g.inkWh/m²a).- Pros: easy to communicate.- Cons: different efforts to fulfil requirements can be perceived as unfair.
• Defineathresholdformaximumallowedenergydemandorconsumptiondependentontheuseofthebuilding (e.g. allow higher cooling demand in the case of high internal loads)- Pros: threshold takes into account efforts to achieve target.- Cons: there is a risk of imposing (too) complex rules.
Based on the above we can conclude that:
5th implication for an nZEB definition A proper nZEB definition should take into account the climate, building geometry and usage conditions as follows:
• Climate:TwooptionsaresuggestedfortakingintoaccountclimateconditionsinthenZEBdefinition:- A first option is to calculate the energy requirement for an average European building located
in an average European climate on the basis of the EU’s 2050 climate target. This average energy requirement may then be corrected and adapted at national/regional level, i.e. by using the relation of national/regional vs. European cooling degree days (CDD)+ heating degree days (HDD).
- A second option is to calculate and impose a fixed value, being zero or very close to zero, and the same for each country and all over Europe. Such option would be chosen in the event that the first option appears to be too complicated or it will be necessary to have an absolute zero-energy balance for all new European buildings in order to reach the climate targets.
• Geometry: It appears unfair for buildings with an “easy” shape to have to compensate for theunfavourable geometries of other buildings. Hence, for new buildings differences in geometry do not seem to be a striking argument for differences in energy requirements (e.g. in kWh/m²a) and the requirements should therefore be independent of geometry.27 On the other hand, for the existing building stock this might be seen differently and the geometry aspects should be further analysed in order to avoid additional unfair burdening of the building owners.
• Usage:Allresidentialbuildingsshouldmeetthesamerequirementsastheytypicallyhavethesameusagepatterns. In addition, non-residential buildings with a similar usage pattern as residential buildings may still have the same requirements as residential buildings. The other non-residential buildings should be classified in as few categories as possible (following the main criteria of indoor temperature, internal heat gains, required ventilation etc.) and should have particular energy performance requirements.
27 An exception might be made for single family homes with a very small floor area per capita as in the end it is the absolute [kWh/a] and not the specific consumption [kWh/m2a] that counts
39 | Principles for nearly Zero-Energy Buildings
3.6 challenge n° 6
How to deal with household electricity
The EPBD currently includes energy used for space heating, domestic hot water, space cooling, ventilation, lighting (only for non-residential buildings) and related auxiliary energy (electricity e.g. for pumps).
For a convincing guidance on a “nearly Zero-Energy Building” definition it may well be questioned if the EPBD list of energy uses represents a consistent and thus convincing selection that would actually lead to the ultimate goal of minimising building-related CO2 emissions.
Regarding the list of EPBD energy uses, there are several arguments for identifying potentially missing energy uses as well as “included but out of scope” uses. The energy covered by the EPBD is what in some countries (e.g. in the UK) is referred to as regulated energy. Usually the regulated energy consumption includes those forms of energy use covered in Building Regulations, comprising the fixed consumption inherent in the building such as space heating, water heating and fixed lighting. Non-regulated energy consumption relates to those energy uses not covered by Building Regulations such as the energy consumedby‘plug-in’appliances (e.g.computers,notfixed lamps,TVs).However, lookingonlyat theuse/operation phase28 of the building, it is possible to say that lighting and domestic hot water (DHW) arepartiallyregulated,withapartoftheirusageprofilebeingrelatedtothe‘buildingsystems’thatoffer‘buildingservices’,andtheotherpartisstronglyinfluencedbytheconsumptionpatternoftheoccupants.There are therefore some good reasons for discussing the need for potentially including all/other electricity consumption equipment in a building. There are three main arguments supporting this idea:
• TheEPBDtakes intoaccountsomeuseswhichare linkedto“integrated”equipment, i.e.equipmentusually fixed to the building, such as pumps or control equipment. This means that changing part of the equipment requires a “building construction measure”. Nevertheless, there is other integrated equipment which is missing and should, it could be argued, be taken into account, e.g. lifts, fire protection systems etc. Such equipment may even be mandatory by law. From this point of view there may be good reasons to complement the EPBD scope of energy uses by including all “integrated” or mandatory equipment.
• The EPBD includes lighting for non-residential buildings whereas it is not included for residentialbuildings. Convincing reasons for this difference are hard to find. Sufficient lighting is necessary in every building used for living or working. The existence of mandatory minimum requirements for lighting levels in non-residential buildings is not a convincing argument, as other mandatory energy using equipment is not included in the EPBD. On the other hand, maximising the daylight use and even the right placement of the lighting fixtures (according to the lighting services needed in the house/room) from the design and construction phase of a new building should be considered for all buildings because it refers to the building functions and it is difficult or less likely to be improved at a later stage.
• Domestichotwater isexplicitly included in theEPBD.Astrongargument for the inclusionofDHWis the fact that “(hot) water installations are fixed to the building” and quite often the water heating function is integrated in the same equipment (boiler) also providing heating energy or it is provided by the district heating (DH) systems at the same time with heat energy. Therefore it makes sense to be sure that the on-site equipment/DH has a high efficiency for both functions and consequently to include the hot water supply within the scope of the EPBD. Moreover, pre-installed hot water taps and showers reflect the expectations of reducing energy consumption. However, it still might also be regarded as outside of the scope. This can be concluded from asking “What does a building do?” and “What does the building do that for?” Answer: Using light, energy and air as inputs, a building is to
28 Production, construction and disposal phases of the buildings will be discussed in Chapter 3.7.
Principles for nearly Zero-Energy Buildings | 40
provide indoor conditions (light level, temperature, air quality), which fluctuate within a bandwidth and follow a schedule that is considered to be comfortable and acceptable by humans. The building performs these functions to protect humans from fluctuating ambient conditions: light, temperature, humidity.
Domestic hot water does not support this purpose but it provides comfort and this is one of the objectives of the buildings. The same is true for all inputs of electricity, heating, cooling, light and water which do not support these functions.
The use of domestic hot water largely depends on individual preferences and behavioural patterns. Therefore in many building codes DHW is just added as a fixed value. Another argument for the inclusion of DHW may be that hot water installations are fixed to the building.
As domestic hot water and lighting are considered in the EPBD, there are some good reasons to further include household electricity consumption, actually considered as being “beyond a building’s core functions“. For certain household electric equipment such as refrigeration appliances, energy consumption may be evaluated and regulated at least at the same level as the DHW. For instance in many Member States, including DHW, adding a fixed amount of energy demand to complex calculations of heating and cooling demand occurs. Analogously, a fixed amount of electricity could be part of the EPBD energy balance, e.g. as a default value per m².
Conclusion: electricity for appliances and other uses are not yet in the EPBD but are usually related to the standard use of a building. Therefore, it makes sense to add electricity for lighting to the scope of the EPBD, i.e. as with domestic hot water and lighting. From a logical point of view both may be within or outside of the scope.
To find a solution it should be kept in mind that the ultimate goal for European buildings is to minimize overall energy consumption. Only minimizing the uses currently included in the EPBD will impact on the highest share of the buildings’ energy consumption at the moment, but will not necessarily lead to a minimising of overall energy consumption or CO2 emissions. Moreover, by heading towards zero-energy consumption only on the actual regulated energy, it will make the actual non-regulated energy consumption become predominant in the future energy balance of a dwelling. The inclusion of household electricity and other energy uses omitted so far in the definition will promote an expanded use of renewable electricity, i.e. solar heating plants are significantly driven by the need for reducing DWH/heating consumption. Similarly, adding household electricity to the definition of nZEB will foster the market deployment and the further use of wind power or PV-panels and promote a more holistic approach to building energy consumption.
Based on the above we can conclude that:
6th implication for an nZEB definition
For providing convincing guidance on a nearly Zero-Energy Building definition, it may well be questioned if the EPBD lists all the relevant energy uses that are actually related to the ultimate goal of minimising building related CO2 emissions. Based on an extensive analysis, the following is proposed:
• AccordingtotheEPBDonlytheenergyuseofequipmentprovidingsomeselected“buildingservices”which are heating, cooling, ventilation and lighting is to be considered in an nZEB definition. Nevertheless there is some further integrated equipment providing building services, which may be even mandatory by law in most of the Member States, but which is missing in the EPBD and thus should be a part of it. For example lifts and fire protection systems are not within the scope of the nZEB definitionfromtheEPBD,butarepartofthedefault‘buildingservices’.
41 | Principles for nearly Zero-Energy Buildings
• Atthispointintime,includingelectricityforappliancesinthedefinitionofnZEBisnotrecommended,also because it is not in the current scope of the EPBD. However, in the long run, it is advisable to complement the energy uses currently mentioned in the EPBD by all other energy uses in the buildings. Household electricity or electricity for appliances should be included in a future version of the EPBD, e.g. via a given value per person or m² (similar to the approach regarding the need for domestic hot water in current regulations) and consequently in the nZEB definition.
• Afeasible interimsolutionforavoidingsub-optimisationmightbetosystemizeallenergyusesandclearly show the subset of uses currently included in the EPBD. The energy uses outside the scope of the EPBD do not necessarily need to be integrated in the same energy performance indicator, but they might be mentioned using the same unit along with the EPBD indicator in order to get the whole picture.
• ToachieveasustainablenZEBdefinitionitmaybeimportanttotakeintoaccountalltheenergyusesofa building for two main reasons:- In today’s very low-energy or passive houses the amount of household electricity or electricity for
appliances respectively has the same order of magnitude as that needed for space heating/cooling and domestic hot water. The same is true for the technical systems providing building services.
- In Europe, on average, electricity consumption represents comparatively high amounts of primary energy consumption and related carbon dioxide emissions. The same goes for energy use in the construction of the building and its supply systems as well as for disposal of the building.
3.7 challenge n° 7How to deal with the production and disposal stage
Up until now, only the implication of an nZEB definition according to the use/operational phase of the building has been discussed. Another question is where should the system boundary within the physical lifecycle of the socio-technical system be drawn? This life cycle stretches from the manufacturing of the technical system, continues with the use and ends with the disposal of the technical system. For passive houses, research shows that, depending on the construction type, even the bulk of primary energy and other environmental effects (acidification, eutrophication, greenhouse effect, summer smog etc.) may be considered for the manufacturing (embodied energy plus transport plus energy used on the construction site) and disposal stage. This contrasts sharply with the experience of typical European building stock samples where energy for construction and disposal are dwarfed by the energy for use.
Building designers determine the overall life cycle energy balance of a building through their building design. In order to achieve an optimal allocation of resources, the guidance associated with the EPBD should support the designer in realising where the break-even lies between the effort and cost of further reducing the energy in-use versus reducing the energy balance for manufacturing and disposal. Today there are some good tools available for determining the shares of manufacture, use and disposal during a building’s life cycle. Still, these tools may deliver very different results for the same building due to different assumptions and system boundaries. A mandatory calculation would probably cause results to converge. Another argument for having such tools as a standard design support is the question of “refurbish or rebuild”, which should also be answered from an energy point of view. Refurbishment of a building is only advantageous from the energy point of view if the amount of energy saved by undertaking refurbishment instead of demolition and building a new at (nearly) zero-energy level is not overcompensated by higher energy in-use.
The most ambitious solution would be to request “nearly zero-energy” for the whole life cycle or at least for production and use and request a design that avoids composites where no solution for recycling exists
Principles for nearly Zero-Energy Buildings | 42
today. Obviously this might require very different efforts from Member States depending on building traditions – wood having an advantage vs. massive constructions. Moreover an LCA approach would significantly increase the complexity of the nZEB methodology and implementation.
Based on the above we can conclude that:
7th implication for an nZEB definition
A life-cycle assessment (LCA) approach for nZEB is definitely far beyond the current intention of the EPBD, but might not be in a future recast. There are some practical recommendations to be considered for the time being:
• Energy consumption during the construction and disposal phases of a building becomes moreimportant the more the energy consumption during the use phase decreases.
• DuetoinsufficientconsistencyofresultsfromdifferentLCAtools itmaybetooearlytorequireLCAinformation as part of a threshold value. Nevertheless in principle it would make sense to include LCA information in the evaluation of a building’s energy performance.
• A practical solution for the near futurewould be to estimate the energy need for production anddisposal and require an informative mention of this value in addition to the indicator(s) reflecting the energy performance of the building. Including the information regarding energy consumption during the phases of construction and disposal of a building will underline the importance of each life cycle phase’s energy consumption. However, for the time being it is not suggested that life cycle energy consumption be included within the scope of the EPBD.
3.8 challenge n° 8single building scope vs. groups or networks
The EPBD clearly focuses on the energy performance of individual buildings. In this regard, energy demand and energy production/supply need to be analysed separately.
Energy demandIn the single building context, the energy demand of the building is defined by the properties of the buildings and is decided by the owner/investor in accordance with (or exceeding) national legislation. Due to specific circumstances (e.g. shading from landscape and thereby reduced solar gains) it might be the case that it is not possible or too costly to reach a very low energy demand. However, in such cases there may be the theoretical possibility to cluster several buildings to jointly achieve an energy demand goal set by the national definition of nZEBs, e.g. with some performing better and some worse than the allowed threshold. However this would mean that the owner of a building which is part of such a pool would depend on what is actually built and maintained by (several) other owners. Apparently things would become easier when having one owner for the whole new settlement.
Also owners of exceptionally well performing buildings may not be interested in balancing underperforming buildings unless there was for example a compensation for such a “service”. Compensation may be found in thevalueoftheground;comparablelocationswithdifferentpotentialfor,saypassiveuseofsolarenergy,may be sold at different prices. In functioning markets, ground that hampers passive solar use will be sold cheaper. The money saved can be spent on improving energy performance. In general, especially in the case of new buildings, there seems to be little evidence to explain why a demand threshold should not be reached at individual building level and synergies (energy related or financially) from pooling buildings are not obvious.
43 | Principles for nearly Zero-Energy Buildings
Energy production/supplyA different picture emerges regarding the production or supply of energy. Here central systems (one central system supplying several buildings nearby or in a network) as an alternative to individual systems per building can yield benefits in terms of investment savings, better efficiency and better possibilities for seasonal storage.
There seems to be no reason why shared or central systems should not be taken into account for individual buildings via the efficiency of the central system (including distribution and storage losses) – the rationale is similar to, for example, using nearby or off-site RES, where different buildings will be connected to the same grid. The proper functioning of the central system is then a joint responsibility of the building owners or of a third party service provider. This is in fact the current situation in the area of district heating or electricity, where the energy carrier arrives at the system boundary of the house with a certain environmental profile (primary energy or emission factor).
Based on the above we can conclude that:
8th implication for an nZEB definition:
The EPBD clearly focuses on the energy performance of individual buildings. However, there may be good reasons to address a group of buildings and to have a common energy balance for them. For assessing the opportunity of considering groups of buildings instead of a single building, the energy demand and the energy supply need to be analysed separately.
• As to the energy demand side, it may be a solution to compensate specific disadvantageouscircumstances affecting one or a few selected buildings within a group of buildings (e.g. shading from landscape and thereby reduced solar gains) that do not allow each of these selected buildings to achieve a required very low energy demand with an acceptable level of effort. However, this would mean that the owner of a building which is part of such a pool would depend on what is actually built and maintained by other owners. Apparently the situation is easier when having one owner for the whole new settlement, e.g. a building complex owned and rented by a real-estate company. However, especially in the case of new buildings, there seems to be little evidence to explain why a certain requiredthresholdshouldnotbereachedatthe levelofthe individualbuilding;theenergyrelatedor financial synergies from pooling buildings are not obvious. Consequently, there are no sufficiently strong reasons for clustering buildings.
• Astotheenergysupplyside,itisclearlywithintheEPBDscopetousenearby/on-sitecentralsystemsasan alternative to individual systems per building. Such central supply can yield benefits e.g. in terms of investment savings, better efficiency and better possibilities for seasonal storage.
3.9 challenge n° 9Balance between energy demand and renewable energy
For defining a proper nZEB concept it is vital to identify the right balance between efficiency measures for reducing the energy demand of the building and the necessary amount of renewable energy for ‘greening’theenergysupply.At the moment there are varied approaches, some more extreme than others, with pros and cons for each. On the one hand, renewable energy integration aiming towards supplying 100% of the energy demand will provide the lowest amount of greenhouse gas emissions, resulting in a theoretical 100% carbon free energy supply. The renewable energy market and industries have developed significantly over the last decade and, for most of the technologies, it will be possible to reach competitive prices in the near future and consequently to cover a much larger share of the energy demand. A building that would represent such a set-up could for example be a building with no insulation measures (e.g. a tent) equipped with
Principles for nearly Zero-Energy Buildings | 44
a biomass boiler to supply space heating and domestic hot water. However, there are very important constraints:
• Renewablesstillhaveapriceandsuchasolutioncanbesuboptimalintermsoffinancialperformancecompared to energy efficiency measures with a similar impact.
• Atagloballevel,thereseemstobeenoughpotentialinrenewableenergytosupplyanalmost100%renewable system by 2050, but in the context of a fast growing world population and related energy demand, this will only be possible by undertaking simultaneous and very ambitious energy savings measures (The Energy Report, WWF/Ecofys 2011). Moreover, renewable energy will still be scarce from a local perspective (e.g. solar energy in northern Europe) or regarding a certain quality (e.g. sustainable biomass). Electricity grids or district heating/cooling systems are a solution but this should be supported by lower demands and less severe peak loads.
• Renewablesmightalsoneedtobeimported(e.g.solarelectricityfromnorthernAfrica)whichcanleadto political and financial dependencies.
On the other hand, moving towards very low energy buildings by implementing energy efficiency measures may consistently reduce the energy demands of the building sector and may indirectly avoid building new energy capacities or using more energy resources, renewable or not. This is a very conservative approach and can be seen as a more sustainable option. Such a building may be a passive house equipped with an oil boiler to supply space heating and domestic hot water. However, this case has several constraints:
• Efficiencyhasitslimitsanditisnotpossibletodriveenergydemanddowntozero(e.g.therewillalwaysbe a demand for domestic hot water or lighting after dark).
• Energydemandmaybeveryclosetozeroaccordingtotheyear’sbalancebutactivesupplyalsoneedsto balance demand peaks over a year (e.g. more heating demand during the winter). Consequently a need for the energy supply will still remain, so carbon emissions will still be generated through the use of fossil fuels (indeed, very low emissions).
The conclusion of the above is that today we do not know exactly how much renewable energy will be available for supplying buildings by 2050. Therefore the precautionary principle requires taking measures for the worst case scenario if only a limited renewable capacity were available for buildings. Therefore, in order to maximise the chances of achieving a fully renewable energy supply by 2050 and to secure a sustainable future, the logical answer is to minimise the demand for renewables by implementing energy efficiency measures.
Overall, it seems to be reasonable to have a separate threshold for energy demand (to safeguard security of supply, reduce political/technical dependencies and have a security buffer to go beyond zero-energy (+ energy buildings).
Moreover, the reduction of energy demand is part of the EPBD definition of nZEB which is required to be‘abuildingthathasaveryhighenergyperformance’(asdeterminedinaccordancewithAnnexI).Inaddition,theEPBDdefinitionsaysthat‘thenearlyzeroorverylowamountofenergyrequiredshouldbecovered to a very significant extent by energy from renewable sources, including energy from renewable sources produced on-site or nearby’. This means that renewable energy should not compensate for the use of energy but that the remaining energy needs are supplied with energy of a certain quality (here: renewable energy).
The energy performance requirements should be somewhere between what is technically possible (level of measures) and current 2020 standards (derived from cost-optimality as requested by EPBD). It istobediscussedwherethethresholdshouldbeplacedinthisrangeor,bettersaid,‘corridor’andwhatmechanism could be used to define that point.
45 | Principles for nearly Zero-Energy Buildings
Based on the above we can conclude that:
9th implication for an nZEB definition
It is necessary and also in line with the EPBD’s nZEB definition to have a threshold for maximum energy demand as well as a requirement for the minimum percentage of renewables. For this reason, the renewable energy share should take into account only active supply systems such as solar systems, pellet boilers etc. The passive use of renewable energy, e.g. passive solar gains, is an important design element of nearly Zero-Energy Buildings, but it seems logical - and also in line with EPBD-related CEN standards - to take these into account for the reduction of gross energy needs.A threshold for energy demand could be set for each country in a given corridor, defined top-down at EU level according to the needs imposed by longer term climate targets and climate adjusted at country/regional level, e.g. based on HDD/ CDD.
The minimum share of renewables to cover the remaining nearly zero or very low energy demand of the building might be chosen in the range of 50%-90% in order to be consistent with EU energy and climate targets. Moreover, there are two more reasons for choosing a compulsory range of 50%-90%:
• TheproposedrangeisinlinewiththenZEBdefinitionfromtheEPBDwhichisaskingthattheenergydemand of the building be covered from renewable sources to a “very significant extent”.
• Theproposed range is likely to satisfy all thepotential requirements for achieving theoverarchingtargets for energy or GHG respectively.
The requirement proposed above for the renewable energy share would also contribute to a paradigm change moving from renewable energy being a minor substitute or complement a fossil fuels based energy system towards an energy system where renewable energy is dominant, while fossil systems exist only to a certain extent, e.g. to secure the supply during peak loads or as a backup source.Whereas the bandwidth of the necessary share of renewable energy supply can be derived from technical and financial boundary conditions, the exact share to be achieved at EU or country levels is likely to remain subject to political considerations. A possible practical solution is to start with a certain minimum requirement for the renewable energy share as part of the nZEB definition and to stimulate a further gradual increase of the share. 3.10 challenge n° 10convergence between nearly Zero-energy Buildings and cost-optimality
The recast EPBD requests that Member States ensure that minimum energy performance requirements for buildings are set “with a view to achieving cost-optimal levels”. The cost-optimal level shall be calculated in accordance with a comparative methodology.By June 2011, the Commission had to establish a comparative methodology for calculating cost-optimal levels of minimum energy performance requirements for buildings and building elements (e.g. the roof of a building). The methodology requires Member States to:
• definereferencebuildingsthatarerepresentativeintermsoffunctionalityandclimateconditions.Thereference buildings need to cover residential and non-residential buildings (e.g. offices), both for new andexisting;
• defineenergyefficiencymeasurestobeassessedforthereferencebuildings.Thesecanbemeasuresforbuildingsasawhole,forbuildingelements,orforacombinationofbuildingelements;
• assessthefinalandprimaryenergy29 needs of these reference buildings. The calculations must be done inaccordancewithrelevantEuropeanstandards;
Principles for nearly Zero-Energy Buildings | 46
• calculate the costs of the energy efficiency measures during the expected economic lifecycle ofthe reference buildings. Investment costs, maintenance and operating costs, earnings from energy produced and disposal costs (if applicable) need to be taken into consideration.
Whereas the Commission is to provide the principal methodology, individual Member States will do the calculations themselves at country level and need to compare the results with the minimum energy performance requirements in force. Beyond delivering information to update current requirements in the coming years, the methodology is also suitable for actively steering cost-optimal levels to the nZEB target by 2021. This means that the methodology for cost-optimal levels could also be used to, for example, calculate the necessary support (soft loans, subsidies etc.) or market developments (necessary reduction of costs of systems etc.) to push cost-optimal levels towards the ambition level of nZEB. This would facilitate a smooth transition in the regulations towards nearly Zero-Energy Buildings for new buildings after 2020.
Additionally, the system of cost-optimality could be very useful as an integral part of a nearly Zero-Energy Building definition. When fixing a threshold for the demand side of nearly Zero-Energy Buildings (e.g. energy need) it could be recommended to give Member States the freedom to move in a certain corridor regarding such thresholds, which could be defined in the following way:
• Theupper limit (leastambitious,maximumallowedenergydemand)canbedefinedby theenergydemand that develops for different building types from applying the principle of cost-optimality according to Article 5 of the EPBD recast.
• Thelowerlimitofthecorridorisnaturallysetbythebestavailabletechnologythatisfreelyavailableand well introduced on the market, such as, currently, triple glazing for windows.
Member States might determine their individual position within that corridor based on specific relevant national conditions.
Article 9.6 of the EPBD recast states that “Member States may decide not to apply the requirements set out in points (a) and (b) of paragraph 1 (i.e. the obligation to have all new buildings nearly Zero-Energy Buildings as from 2021/2019) in specific and justifiable cases where the cost-benefit analysis over the economic lifecycle of the building in question is negative. Member States shall inform the Commission of the principles of the relevant legislative regimes.” However the cost-benefit analysis mentioned does not equal the cost-optimal requirements, due to two logical arguments:
• Comparedtoacost-optimalreferenceeverythingbeyondoruptothatpointwouldbydefinitionbeless cost-effective than a cost optimum.
• NearlyZero-EnergyBuildingswouldbeequaltocost-optimalityandwould,inprinciple,notbeneeded. Consequently,thisarticleisonlyan‘opt-out’forMemberStatesnottoexclusivelyimplementnZEBif
there are extraordinary circumstances.
29 “Primary energy” means energy from renewable and non-renewable sources which has not undergone any conversion or transformation process.
47 | Principles for nearly Zero-Energy Buildings
Based on the above we can conclude that:
10th implication for an nZEB definition
The recast EPBD stipulates that the EU Member States shall ensure minimum energy performance requirements for buildings to be set ‘with a view to achieving cost-optimal levels30’. Whereas the Commission has to provide the comparative framework for a cost-optimal methodology, each EU Member State has to do the calculations at country level, to compare the results with its energy performance requirements in force and to improve those requirements accordingly if necessary.
Beyond delivering information for the update of current requirements over the coming years, the cost-optimal methodology is also suitable for gradually steering cost-optimal levels towards nZEB levels by 2021. Indeed, the cost-optimal methodology may also be used, for instance, to calculate the needed financial support (soft loans, subsidies etc.) and market developments (cost reduction for certain technology etc.) for facilitating a smooth and logical transition from today’s energy performance requirements towards nZEB levels in 2021.
Consequently, when fixing a threshold for the primary energy demand of an nZEB, it is recommended to leave some freedom for placing this threshold within a certain corridor, which could be defined as follows:
• Theupper–leastambitious-limit,definedbytheenergydemandofdifferentbuildingtypes,wouldresult from applying the cost-optimal levels according to Article 5 of the EPBD recast.
• Thelower–mostambitious-limitofthecorridor,wouldbesetbythebestavailabletechnologythatisfreely available and well introduced on the market, e.g. as, currently, triple glazing for windows.
The EU Member States may determine their national requirement for the buildings’ energy demand within the limits of the above corridor, according to the specific national context. Imposing a corridor and not a fixed threshold, will allow specific country solutions for achieving an overarching target (primary energy / CO2-emissions), based on the most convenient and affordable balance between minimum requirements for energy demand and renewable energy share.
Today we assume that, on the one hand, there may still be a gap to be bridged between cost-optimal levels and nZEB levels by 2021, at least in some EU Member States. On the other hand, in several Member States it is also possible to reach convergence between cost-optimal and nZEB levels by 2021, mainly due to the estimated increase in energy prices31 and expected decrease in technology costs32.
30 The cost-optimal level shall lie within the range of performance levels where the cost-benefit analysis calculated over the estimated economic lifecycle is positive. The cost-optimal level is defined in Article 2 and described in Article 5 of the EPBD (Directive 2010/31/EU)
31 Incl. the national energy tax system development as part of the national activities towards more economic solutions.32 Due to volume effects induced by the introduction of the nZEB requirement.
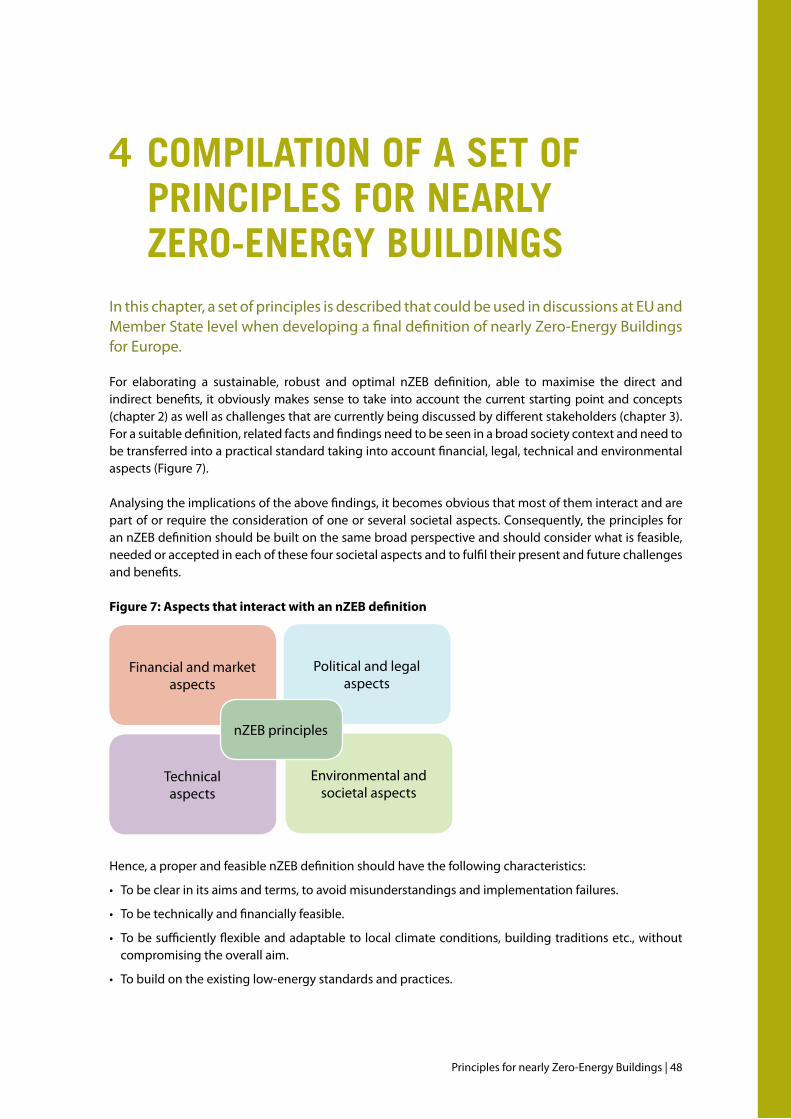
Principles for nearly Zero-Energy Buildings | 48
4 comPilation of a set of PrinciPles for nearly
Zero-energy BuildingsIn this chapter, a set of principles is described that could be used in discussions at EU and Member State level when developing a final definition of nearly Zero-Energy Buildings for Europe.
For elaborating a sustainable, robust and optimal nZEB definition, able to maximise the direct and indirect benefits, it obviously makes sense to take into account the current starting point and concepts (chapter 2) as well as challenges that are currently being discussed by different stakeholders (chapter 3). For a suitable definition, related facts and findings need to be seen in a broad society context and need to be transferred into a practical standard taking into account financial, legal, technical and environmental aspects (Figure 7).
Analysing the implications of the above findings, it becomes obvious that most of them interact and are part of or require the consideration of one or several societal aspects. Consequently, the principles for an nZEB definition should be built on the same broad perspective and should consider what is feasible, needed or accepted in each of these four societal aspects and to fulfil their present and future challenges and benefits.
Figure 7: Aspects that interact with an nZEB definition
Hence, a proper and feasible nZEB definition should have the following characteristics:
• Tobeclearinitsaimsandterms,toavoidmisunderstandingsandimplementationfailures.
• Tobetechnicallyandfinanciallyfeasible.
• Tobesufficientlyflexibleandadaptableto localclimateconditions,buildingtraditionsetc.,withoutcompromising the overall aim.
• Tobuildontheexistinglow-energystandardsandpractices.
Financial and market aspects
Technicalaspects
Political and legal aspects
Environmental and societal aspects
nZEB principles
49 | Principles for nearly Zero-Energy Buildings
• Toallowandevenfosteropencompetitionbetweendifferenttechnologies.
• Tobeambitiousintermsofenvironmentalimpactandtobeelaboratedasanopenconcept,abletokeep pace with the technology development.
• Tobeelaboratedbasedonawideagreementofthemainstakeholders(politicians,designers,industry,investors, users etc.).
• Tobeinspiringandtostimulatetheappetiteforfasteradoption.
This variety of issues shows that “nearly Zero-Energy Building” is a term that needs careful consideration. Being a new concept which implies a big change and represents a complex system to implement for the first time addressing many aspects of a building, it would be unrealistic to aim to find the perfect definition right from the beginning. Therefore a suitable approach to building an nZEB definition as an open concept is not to aim at one holistic and absolute formula concentrating on the entire complexity of the concept, but to provide a set of principles that define the boundary conditions for such buildings.
ThestartingpointfordistillingthebasicprinciplesfornZEBshouldbetheEPBDdefinitionfora‘nearlyZero-EnergyBuilding’,asking for‘abuildingthathasaveryhighenergyperformance’ (EPBD,Art.2.1),wheretheenergyperformanceisdefinedasbeing‘thecalculatedormeasuredamountofenergyneededto meet the energy demand associated with a typical use of the building, which includes, inter alia, energy used for heating, cooling, ventilation, hot water and lighting (n.b. lighting to be considered only for non-residential buildings)’ (EPBD, Art. 2.4).
Consequently, a basic principle of an nZEB definition should be related to the energy consumption of the buildings and should establish the conditions on how to assess it.
This observation leads to a first nZEB principle:
there should be a clearly defined boundary in the energy flow related to the operation of the building that defines the energy quality of the energy demand with clear guidance on how to assess corresponding values.
This indicator can be called ’energy need’ or ’energy demand’ of the building and it is defined as being the energy needed to fulfil the user’s requirements for heating, cooling, ventilation, domestic hot water and lighting plus losses for distribution and storage33. However, lighting is within the scope of EPBD only for non-residential buildings.
Within this study, it is proposed to broaden the term of energy needs to an “extended energy demand” to be defined as follows (see also description of energy flows in a building in Figure 8):the extended energy performance of the “building part” is defined as [3] plus losses for distribution and storage (as part of “system losses”) plus “electricity for other uses”.Heat recovery is considered according to EN ISO 13790, i.e. it reduces [3] rather than increasing [5], because it is considered as a loop of an internal heat flow.
33 The idea behind is, that distribution and storage is linked to infrastructure that is quite integrated in the building and not just an add-on delivered by a supply system. To judge the energy need of a buildings, such structures and their energy need may therefore be seen as part of the buildings (and less as part of the supply system). It is however important, that this view be supported (in the near future) by relevant CEN and ISO standards to make sure that the definition of nearly Zero-Energy Buildings is consistent with such frameworks.
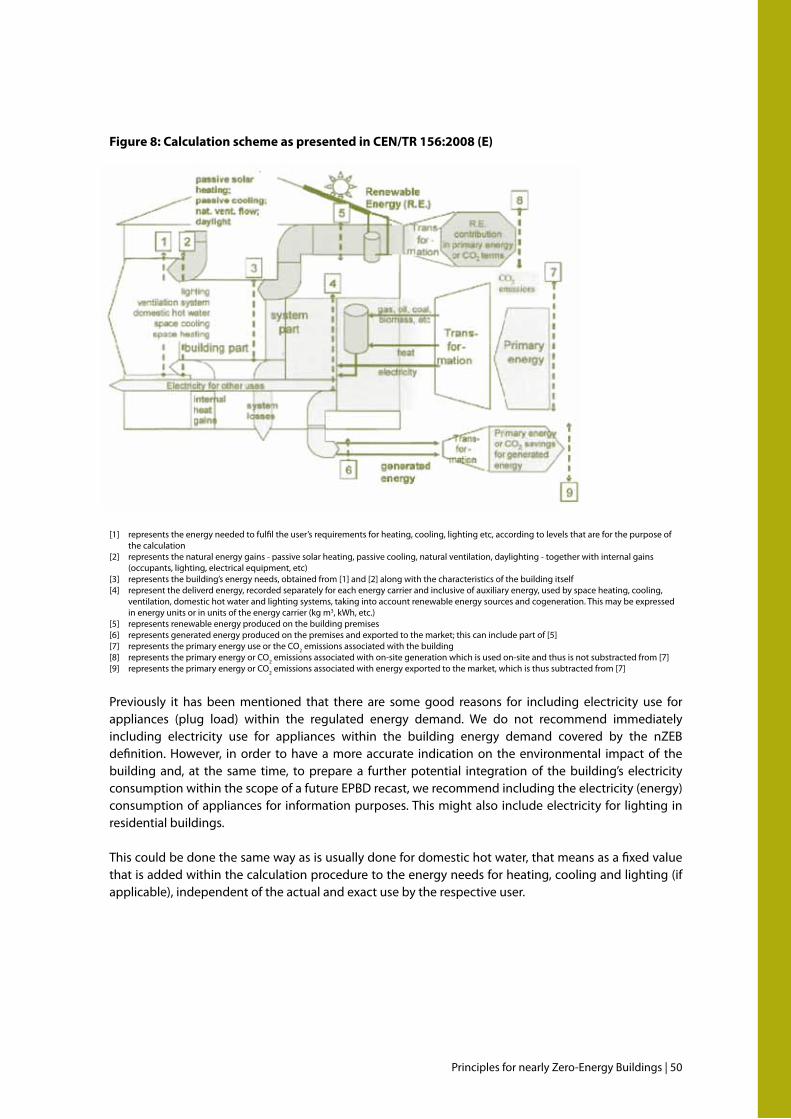
Principles for nearly Zero-Energy Buildings | 50
Figure 8: Calculation scheme as presented in CEN/TR 156:2008 (E)
[1] represents the energy needed to fulfil the user’s requirements for heating, cooling, lighting etc, according to levels that are for the purpose of the calculation
[2] represents the natural energy gains - passive solar heating, passive cooling, natural ventilation, daylighting - together with internal gains (occupants, lighting, electrical equipment, etc)
[3] represents the building’s energy needs, obtained from [1] and [2] along with the characteristics of the building itself[4] represent the deliverd energy, recorded separately for each energy carrier and inclusive of auxiliary energy, used by space heating, cooling,
ventilation, domestic hot water and lighting systems, taking into account renewable energy sources and cogeneration. This may be expressed in energy units or in units of the energy carrier (kg m3, kWh, etc.)
[5] represents renewable energy produced on the building premises[6] representsgeneratedenergyproducedonthepremisesandexportedtothemarket;thiscanincludepartof[5][7] represents the primary energy use or the CO2 emissions associated with the building[8] represents the primary energy or CO2 emissions associated with on-site generation which is used on-site and thus is not substracted from [7][9] represents the primary energy or CO2 emissions associated with energy exported to the market, which is thus subtracted from [7]
Previously it has been mentioned that there are some good reasons for including electricity use for appliances (plug load) within the regulated energy demand. We do not recommend immediately including electricity use for appliances within the building energy demand covered by the nZEB definition. However, in order to have a more accurate indication on the environmental impact of the building and, at the same time, to prepare a further potential integration of the building’s electricity consumption within the scope of a future EPBD recast, we recommend including the electricity (energy) consumption of appliances for information purposes. This might also include electricity for lighting in residential buildings.
This could be done the same way as is usually done for domestic hot water, that means as a fixed value that is added within the calculation procedure to the energy needs for heating, cooling and lighting (if applicable), independent of the actual and exact use by the respective user.
51 | Principles for nearly Zero-Energy Buildings
Having defined the energy need or demand within the scope of the nZEB definition, it is necessary to put a requirement on it. This leads to the next principle, in fact a Corollary of the first principle, which can be defined by the following:
a threshold for the maximum allowable energy need should be defined.
For defining such a threshold, it is recommended to leave the Members States with enough flexibility in elaborating the nZEB definition, and to set the maximum allowable energy need as a move in a certain corridor, which could be defined in the following way:
- Upper limit of the corridor (least ambitious, maximum allowed energy demand): the upper limit can be defined by the energy demand that develops for different building types from applying the principle of cost-optimality according to Article 5 of the EPBD recast. Thereby the results of calculations based on a societal perspective are proposed to be used.
- Lower limit of the corridor: the lower limit of the corridor is naturally set by the best available technology (BAT) that is freely available and well introduced on the market, such as, today, triple glazing for windows. The performance level of the BAT should be subject to regular updates, following the development of technologies and markets.
Member States might determine their individual position within that corridor based on specific relevant national conditions.
The second part of the EPBD states that a nearly Zero-Energy Building definition requires that the ’nearly zero or very low amount of energy … [to] be covered to a very significant extent by energy from renewable sources, including energy from renewable sources produced on-site or nearby’. Consequently a second nZEB principle needs to be related to the renewable energy supply of the building, similar to the first one defined for the energy demand such as in the following:
there should be a clearly defined boundary in the energy flow related to the operation of the building where the share of renewable energy is calculated or measured with clear guidance on how to assess this share.
This nZEB principle requires answers to two basic questions:- how to determine the extent or share of energy from renewable sources?- what ’very significant’ means in the context of EPBD definition?
In order to answer the first question, two issues need clarification in defining the share of renewables:1) theeligibleamountofenergytobedeliveredtothebuilding;2) the eligible amount of renewable energy Therefore, the renewable energy share is calculated as the amount of renewable energy divided by the amount of energy to be delivered to the building.
Part 1) - the eligible amount of energy to be delivered to the building is again derived from Figure 8. For the purpose of this study it is defined as [3] plus “system losses”, including electricity for pumps, fans etc. In the additional case of the “extended version”, it also includes energy for appliances. Part 2) - the eligible amount of renewable energy – is visualised in Figure 8 as [5] plus the renewable share in the purchased energy. Such approach also enables “plus energy buildings”.[5] symbolises energy produced on-site or nearby, for example solar thermal energy, electricity from photovoltaic systems and also the renewable share of heat pumps. The renewable share of heat pumps is calculated according to the Renewable Energies Directive 2009/28/EC Annex VII. This is the estimated total usable heat delivered by the heat pump minus the electric or thermal energy needed for operation. Assuming a heat pump with a seasonal energy efficiency ratio (SEER) of 3.0, the renewable share would be 2/3.
Principles for nearly Zero-Energy Buildings | 52
Additionally the energy supplied to the heat pump (or to other “system parts” in Figure 8) could be partly from renewable sources. Assuming a 50% renewable share in the electricity needed for supplying a heat pump, this would lead to a total renewable share of 5/6 in the previous heat pump example.Utmost attention has to be paid to avoiding double counting of renewable energy, mainly in the situation of taking into account the renewable energy generated off-site. Problems may easily occur when the purchased energy does not exclusively consists of energy from off-site renewable sources (risk of “grey” electricity being declared as “green”), but also energy that was fed into the grid from on-site/nearby sources like photovoltaic systems on the roof or small photovoltaic/wind turbines feeding a district or a group of buildings (risk of double counting).
Similarly, as for the energy demand, it is necessary to set a threshold for the minimum renewable energy share, which leads to a Corollary of the second nZEB principle:
a threshold for the minimum share of renewable energy demand should be defined. The given example indicates that a reasonable figure for a ’very significant share’ of renewable energy may be of the order of 50% or more. Having in mind the much longer lifetimes of the ’building part’ compared to the ’system part’ the following example hints at an approach that fits with the intention of the EPBD. A very high-performance building is erected by 2020. Major renovations on the ’building part’, which determine the energy needs of the building, will probably be taken beyond 2050. But most probably major elements of the “system parts” will be replaced once or several times up until 2050. Each replacement gives the opportunity to increase the share of renewable energy. Therefore it does not seem to be necessary to start out with a very high requirement for a lower share of renewable energies by 2020, but to increase the requirement step-by-step between 2020 and 2050. A reasonable corridor seems to be between 50% and 90% for new buildings.
The example of 50% to 90% represents a span which the authors consider:- compatible with the wording used by the EPBD when asking for a “significant extent” to which the
nearly zero or very low amount of energy required should be covered by energy from renewable sources.
- likely to include the actual share needed to achieve the overarching primary energy- or CO2 target.
In reality it will be up to national political decisions which the share of energy from renewable sources will be interpreted as being ’very significant’. However, the need for having a requirement for the renewable energy share in the building’s energy demand is not driven only by the EPBD or the Renewable Energy Directive’s requirements. The main benefits of such a requirement should lead the construction sector towards a faster appraisal and a better implementation of the renewable energy source in the built environment and, moreover, will drive renewable energy deployment and a faster reduction of corresponding market prices. The share of energy from renewable sources which is considered to be “very significant” is also proposed to be increased step-by-step between 2020 and 2050. The starting point should be determined based on best practice, nearly Zero-Energy Buildings serving as a benchmark as to what can be achieved at reasonable life cycle cost.
Within the previous chapters it has been demonstrated that even ambitious requirements for both the energy need and for the share of renewables may not necessarily lead to sufficient carbon dioxide savings. For example, a heat pump may provide a significant share of renewable energy but at the same time may not contribute to a similar reduction of the building’s GHG emission if powered with electricity generated by a coal-fired power plant without cogeneration (accompanied by a relatively high CO2 emission per
53 | Principles for nearly Zero-Energy Buildings
kWh electricity produced). Hence, for achieving GHG reductions simultaneously and proportional to the increase of the renewable energy share, it is necessary to include an additional third nZEB principle, similarly with the other for energy demand and renewable energy share of the building:
there should be a clearly defined boundary in the energy flow related to the operation of the building where the overarching primary energy demand and co2 emissions are calculated with clear guidance on how to assess these values.
This is the primary energy demand and CO2 emissions related to the total energy delivered into the building from active supply systems. However, it is necessary to set clear national rules on how to account for the net export of on-site or nearby renewable energy exceeding the building energy demand over a balance period.
A Corollary for the third nZEB principle should be formulated in a similar way was used for the first two principles:
a threshold for the overarching primary energy demand and co2 emissions should be defined.
A reasonable limit can be estimated from the long-term European targets for carbon emissions from the building stock. By 2050 the European building stock is supposed to emit 90% less carbon dioxide compared to the 1990 levels. Based on this information and estimations on the total floor area, by 2050 the average “allowed” carbon dioxide emissions can be calculated at about 3 kgCO2/(m²yr)34. Obviously new nearly Zero-Energy Buildings must emit less carbon dioxide than the average building stock.
According to the EPBD, primary energy has to be a leading factor for determining the energetic quality of a building. Primary energy was originally introduced as a main indicator for depletion of fossil resources. Therefore primary energy was linked to the fossil content of energy use, although today a primary energy value for the renewable share is given as well. Nowadays much more emphasis is given in political discussions to climate change than to the depletion of resources. Therefore it can be expected that in the long run carbon dioxide may even replace primary energy as the leading environmental indicator for buildings. In most cases, comparisons using carbon dioxide and primary energy as indicators come to the same conclusions. Only in cases without a close link between carbon dioxide and primary energy, for example when nuclear energy is involved, does the parallel use of both indicators really makes sense in the long run.
Based on the above descriptions, the following overview of the five principles and the proposal on how to set up a related definition is described in the following table.
34 Starting from CO2 emissions for the building sector of approximately 1.100 MtCO2 in 1990 (direct and indirect emissions for heating, domestic hot water and cooling purposes) and assuming a useful floor area in 2050 of 38 billion m² in 2050, a 90% decrease of emissions would require an average CO2 emissions of maximum 3 kgCO2/(m²yr).
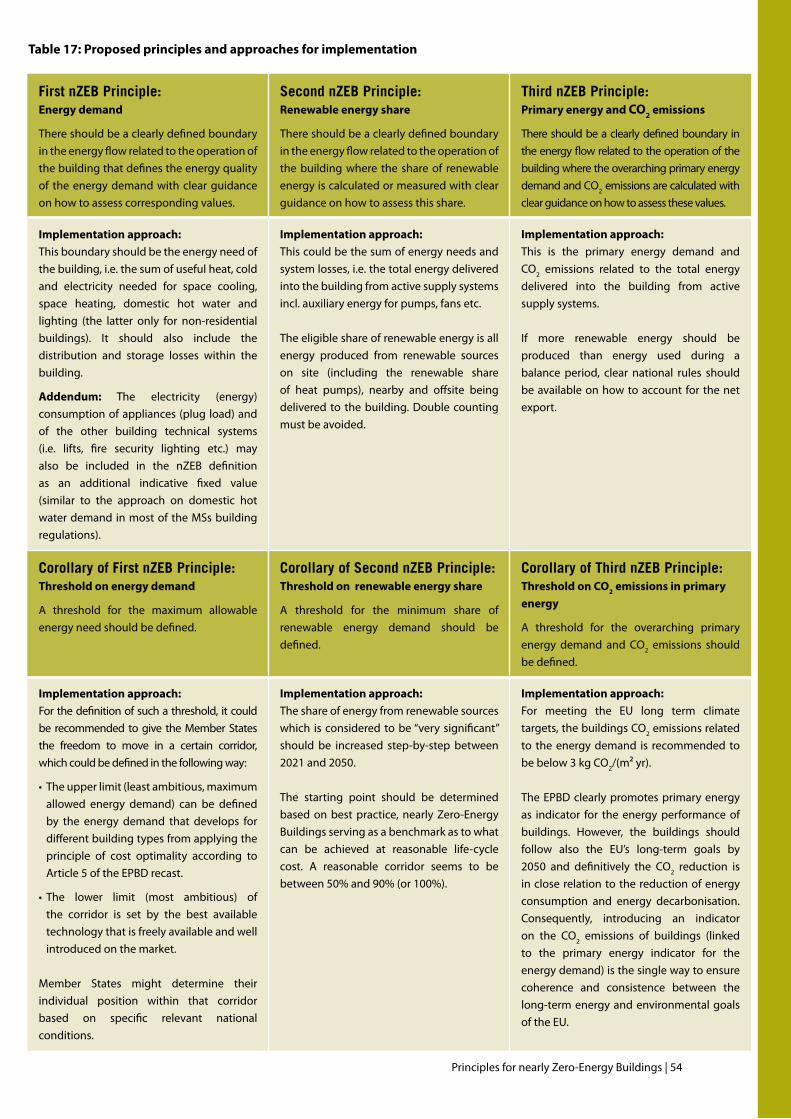
Principles for nearly Zero-Energy Buildings | 54
Table 17: Proposed principles and approaches for implementation
first nZeB Principle:Energy demand
There should be a clearly defined boundary in the energy flow related to the operation of the building that defines the energy quality of the energy demand with clear guidance on how to assess corresponding values.
second nZeB Principle:Renewable energy share
There should be a clearly defined boundary in the energy flow related to the operation of the building where the share of renewable energy is calculated or measured with clear guidance on how to assess this share.
third nZeB Principle:Primary energy and CO2 emissions
There should be a clearly defined boundary in the energy flow related to the operation of the building where the overarching primary energy demand and CO2 emissions are calculated with clear guidance on how to assess these values.
Implementation approach: This boundary should be the energy need of the building, i.e. the sum of useful heat, cold and electricity needed for space cooling, space heating, domestic hot water and lighting (the latter only for non-residential buildings). It should also include the distribution and storage losses within the building.
Addendum: The electricity (energy) consumption of appliances (plug load) and of the other building technical systems (i.e. lifts, fire security lighting etc.) may also be included in the nZEB definition as an additional indicative fixed value (similar to the approach on domestic hot water demand in most of the MSs building regulations).
Implementation approach: This could be the sum of energy needs and system losses, i.e. the total energy delivered into the building from active supply systems incl. auxiliary energy for pumps, fans etc.
The eligible share of renewable energy is all energy produced from renewable sources on site (including the renewable share of heat pumps), nearby and offsite being delivered to the building. Double counting must be avoided.
Implementation approach: This is the primary energy demand and CO2 emissions related to the total energy delivered into the building from active supply systems.
If more renewable energy should be produced than energy used during a balance period, clear national rules should be available on how to account for the net export.
corollary of first nZeB Principle:Threshold on energy demand
A threshold for the maximum allowable energy need should be defined.
corollary of second nZeB Principle: Threshold on renewable energy share
A threshold for the minimum share of renewable energy demand should be defined.
corollary of third nZeB Principle:Threshold on CO2 emissions in primary energy
A threshold for the overarching primary energy demand and CO2 emissions should be defined.
Implementation approach: For the definition of such a threshold, it could be recommended to give the Member States the freedom to move in a certain corridor, which could be defined in the following way:
• Theupperlimit(leastambitious,maximumallowed energy demand) can be defined by the energy demand that develops for different building types from applying the principle of cost optimality according to Article 5 of the EPBD recast.
• The lower limit (most ambitious) ofthe corridor is set by the best available technology that is freely available and well introduced on the market.
Member States might determine their individual position within that corridor based on specific relevant national conditions.
Implementation approach: The share of energy from renewable sources which is considered to be “very significant” should be increased step-by-step between 2021 and 2050.
The starting point should be determined based on best practice, nearly Zero-Energy Buildings serving as a benchmark as to what can be achieved at reasonable life-cycle cost. A reasonable corridor seems to be between 50% and 90% (or 100%).
Implementation approach: For meeting the EU long term climate targets, the buildings CO2 emissions related to the energy demand is recommended to be below 3 kg CO2/(m² yr).
The EPBD clearly promotes primary energy as indicator for the energy performance of buildings. However, the buildings should follow also the EU’s long-term goals by 2050 and definitively the CO2 reduction is in close relation to the reduction of energy consumption and energy decarbonisation. Consequently, introducing an indicator on the CO2 emissions of buildings (linked to the primary energy indicator for the energy demand) is the single way to ensure coherence and consistence between the long-term energy and environmental goals of the EU.
55 | Principles for nearly Zero-Energy Buildings
5 validation of nZeB PrinciPles: simulation of reference Buildings in different climate Zones
To verify and evaluate the proposed nZEB principles and implementation approaches, indicative simulations on reference buildings were performed. The main challenge of the simulation was to provide robust insights into the nZEB prin-ciples’ effect by applying them to a set of reference buildings, sufficiently representative of the wide variety of building-types, while considering at the same time the influence of different European climate zones.
Within an extensive BPIE assessment of the European building stock35, residential buildings turned out to represent around 75% of the EU building stock in terms of floor area, where single-family houses account for 64% and multi-storey family buildings for 36%. As to non-residential buildings, 58% are multi-storey buildings consisting of offices and administrative buildings, educational buildings, hospitals and hotels.
This is a clear indication that the most representative European buildings are single-family houses, multi-storey residential and multi-storey non-residential buildings. Moreover, it is likely that new buildings will follow the same typology as the existing building stock from today. Based on the above considerations, two reference buildings were selected:• Newsingle-familyresidentialbuilding(129m2 net floor area)• Newmulti-storeynon-residentialbuilding(e.g.officebuilding)withasizethatalsocouldrepresenta
typical multi-family building (1.600 m2 net floor area)
For each reference building, basic characteristics were defined in terms of geometry, technical systems and usage patterns.
The application of the nZEB principles is simulated by these two representative buildings and also takes into consideration the following three locations which correspond to the main European climate zones:• Copenhagen,(Denmark),coldclimate;• Stuttgart(Germany),moderateclimate;• Madrid(Spain),warmclimate.
Climate data for these three locations were taken as hourly values of a typical regional reference year from Meteonorm (Version 5.1.). The considered annual ambient temperature profiles of the three selected locations are shown in Figure 9.
35 Europe’s buildings under the microscope. A country-by-country review of the energy performance of buildings, Buildings Performance Institute Europe 2011
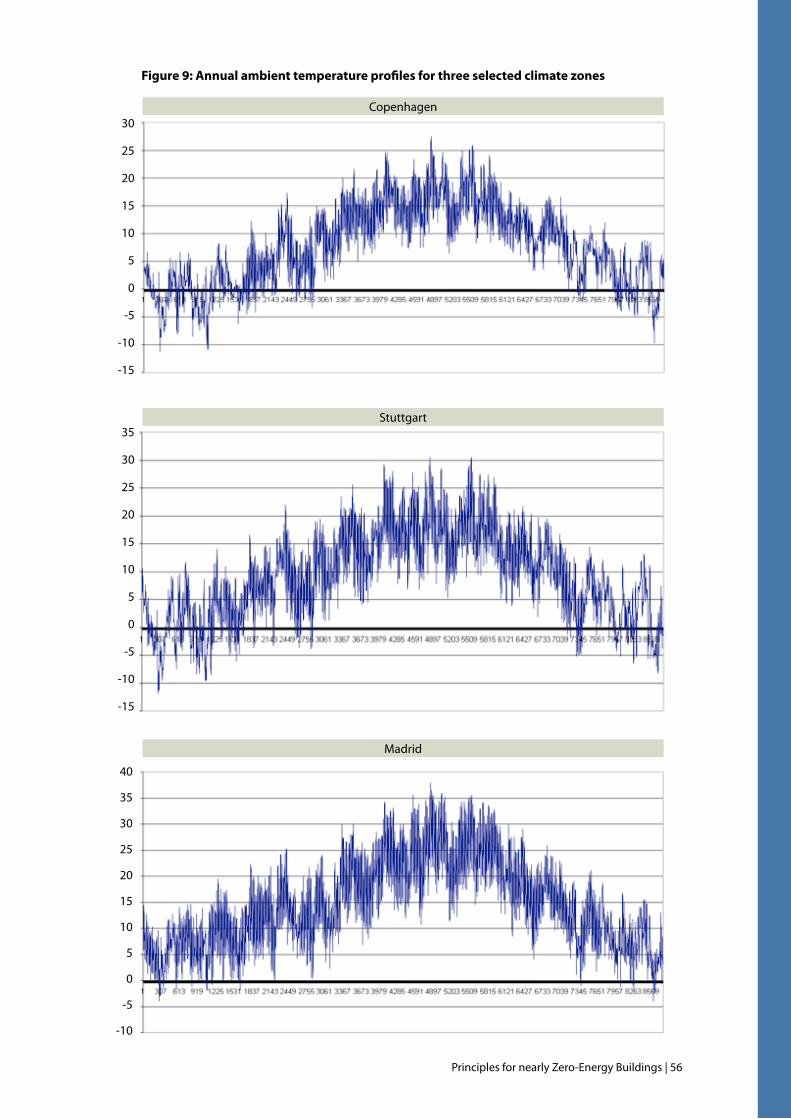
Principles for nearly Zero-Energy Buildings | 56
Figure 9: Annual ambient temperature profiles for three selected climate zones
30
25
20
15
10
5
0
-5
-10
-15
35
30
25
20
15
10
5
0
-5
-10
-15
40
35
30
25
20
15
10
5
0
-5
-10
Copenhagen
Stuttgart
Madrid
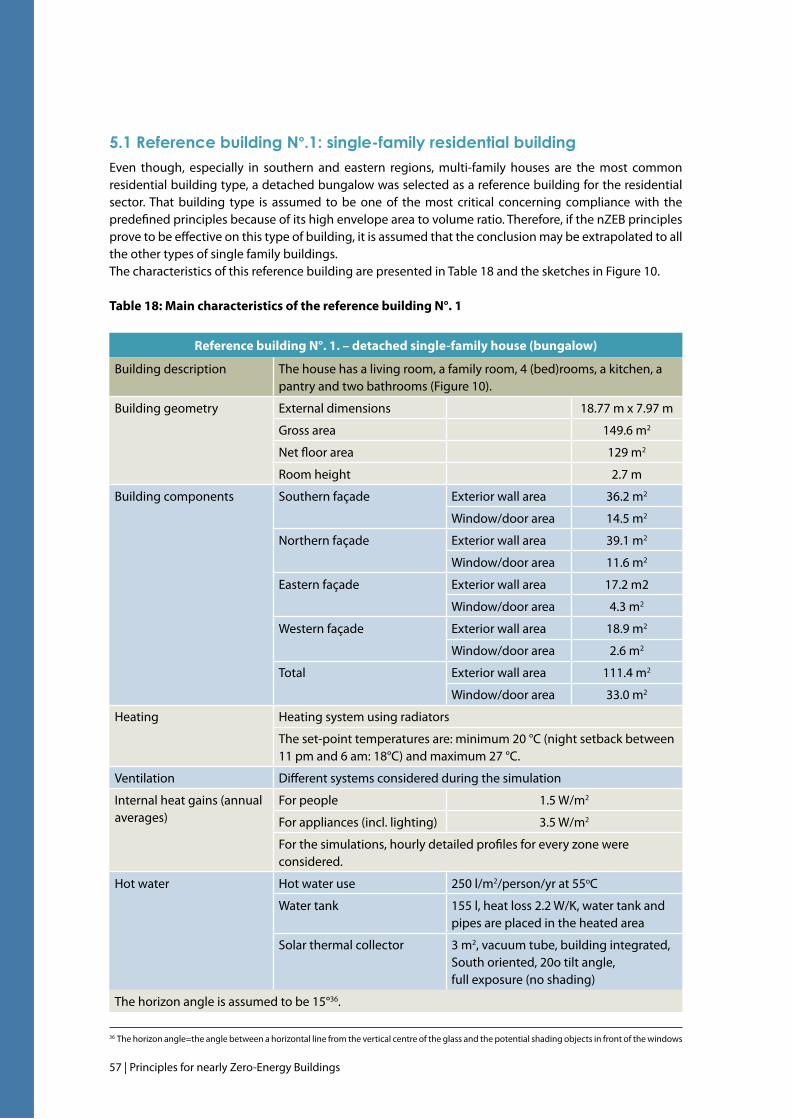
57 | Principles for nearly Zero-Energy Buildings
5.1 reference building n°.1: single-family residential building Even though, especially in southern and eastern regions, multi-family houses are the most common residential building type, a detached bungalow was selected as a reference building for the residential sector. That building type is assumed to be one of the most critical concerning compliance with the predefined principles because of its high envelope area to volume ratio. Therefore, if the nZEB principles prove to be effective on this type of building, it is assumed that the conclusion may be extrapolated to all the other types of single family buildings. The characteristics of this reference building are presented in Table 18 and the sketches in Figure 10.
Table 18: Main characteristics of the reference building N°. 1
Reference building N°. 1. – detached single-family house (bungalow)
Building description The house has a living room, a family room, 4 (bed)rooms, a kitchen, a pantry and two bathrooms (Figure 10).
Building geometry External dimensions 18.77 m x 7.97 m
Gross area 149.6 m2
Net floor area 129 m2
Room height 2.7 m
Building components Southern façade Exterior wall area 36.2 m2
Window/door area 14.5 m2
Northern façade Exterior wall area 39.1 m2
Window/door area 11.6 m2
Eastern façade Exterior wall area 17.2 m2
Window/door area 4.3 m2
Western façade Exterior wall area 18.9 m2
Window/door area 2.6 m2
Total Exterior wall area 111.4 m2
Window/door area 33.0 m2
Heating Heating system using radiators
The set-point temperatures are: minimum 20 °C (night setback between 11 pm and 6 am: 18°C) and maximum 27 °C.
Ventilation Different systems considered during the simulation
Internal heat gains (annual averages)
For people 1.5 W/m2
For appliances (incl. lighting) 3.5 W/m2
For the simulations, hourly detailed profiles for every zone were considered.
Hot water Hot water use 250 l/m2/person/yr at 55oC
Water tank 155 l, heat loss 2.2 W/K, water tank and pipes are placed in the heated area
Solar thermal collector 3 m2, vacuum tube, building integrated, South oriented, 20o tilt angle, full exposure (no shading)
The horizon angle is assumed to be 15°36.
36 The horizon angle=the angle between a horizontal line from the vertical centre of the glass and the potential shading objects in front of the windows
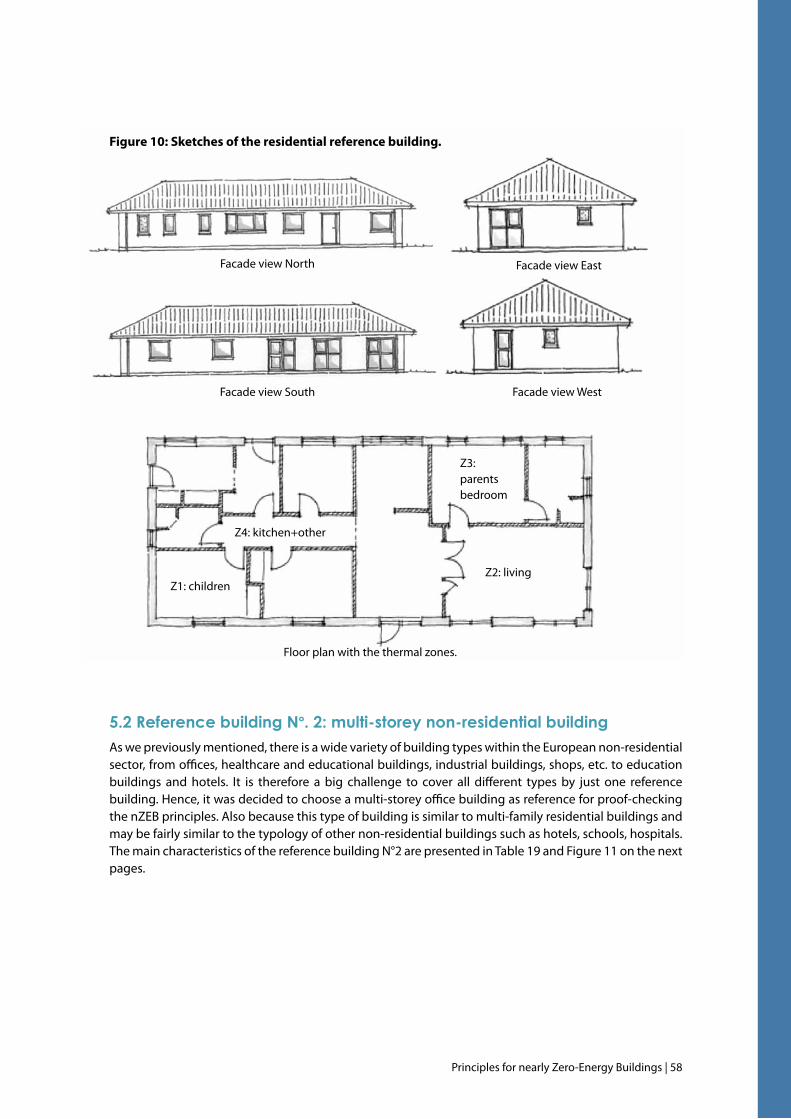
Principles for nearly Zero-Energy Buildings | 58
Facade view North Facade view East
Facade view South Facade view West
Floor plan with the thermal zones.
Z3: parents bedroom
Z1: childrenZ2: living
Z4: kitchen+other
Figure 10: Sketches of the residential reference building.
5.2 reference building n°. 2: multi-storey non-residential buildingAs we previously mentioned, there is a wide variety of building types within the European non-residential sector, from offices, healthcare and educational buildings, industrial buildings, shops, etc. to education buildings and hotels. It is therefore a big challenge to cover all different types by just one reference building. Hence, it was decided to choose a multi-storey office building as reference for proof-checking the nZEB principles. Also because this type of building is similar to multi-family residential buildings and may be fairly similar to the typology of other non-residential buildings such as hotels, schools, hospitals. The main characteristics of the reference building N°2 are presented in Table 19 and Figure 11 on the next pages.
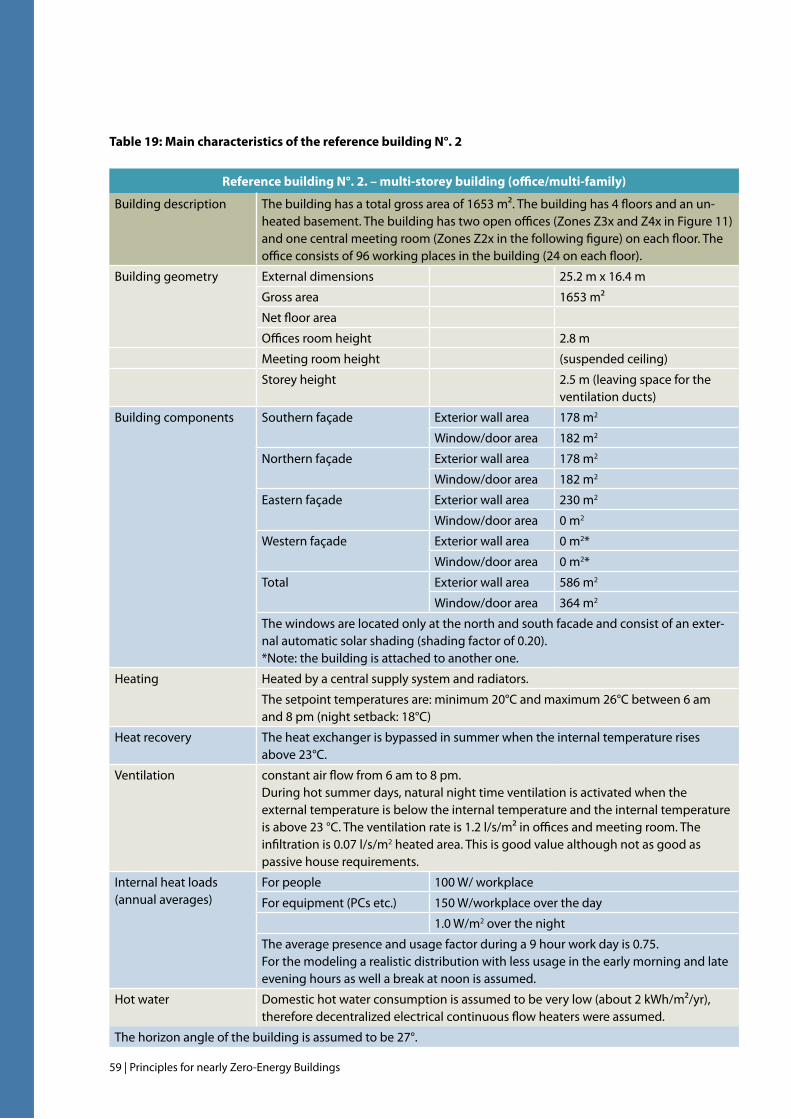
59 | Principles for nearly Zero-Energy Buildings
Table 19: Main characteristics of the reference building N°. 2
Reference building N°. 2. – multi-storey building (office/multi-family)
Building description The building has a total gross area of 1653 m². The building has 4 floors and an un-heated basement. The building has two open offices (Zones Z3x and Z4x in Figure 11) and one central meeting room (Zones Z2x in the following figure) on each floor. The office consists of 96 working places in the building (24 on each floor).
Building geometry External dimensions 25.2 m x 16.4 m
Gross area 1653 m²
Net floor area
Offices room height 2.8 m
Meeting room height (suspended ceiling)
Storey height 2.5 m (leaving space for the ventilation ducts)
Building components Southern façade Exterior wall area 178 m2
Window/door area 182 m2
Northern façade Exterior wall area 178 m2
Window/door area 182 m2
Eastern façade Exterior wall area 230 m2
Window/door area 0 m2
Western façade Exterior wall area 0 m2*
Window/door area 0 m2*
Total Exterior wall area 586 m2
Window/door area 364 m2
The windows are located only at the north and south facade and consist of an exter-nal automatic solar shading (shading factor of 0.20).*Note: the building is attached to another one.
Heating Heated by a central supply system and radiators.
The setpoint temperatures are: minimum 20°C and maximum 26°C between 6 am and 8 pm (night setback: 18°C)
Heat recovery The heat exchanger is bypassed in summer when the internal temperature rises above 23°C.
Ventilation constant air flow from 6 am to 8 pm. During hot summer days, natural night time ventilation is activated when the external temperature is below the internal temperature and the internal temperature is above 23 °C. The ventilation rate is 1.2 l/s/m² in offices and meeting room. The infiltration is 0.07 l/s/m2 heated area. This is good value although not as good as passive house requirements.
Internal heat loads (annual averages)
For people 100 W/ workplace
For equipment (PCs etc.) 150 W/workplace over the day
1.0 W/m2 over the night
The average presence and usage factor during a 9 hour work day is 0.75. For the modeling a realistic distribution with less usage in the early morning and late evening hours as well a break at noon is assumed.
Hot water Domestic hot water consumption is assumed to be very low (about 2 kWh/m²/yr), therefore decentralized electrical continuous flow heaters were assumed.
The horizon angle of the building is assumed to be 27°.
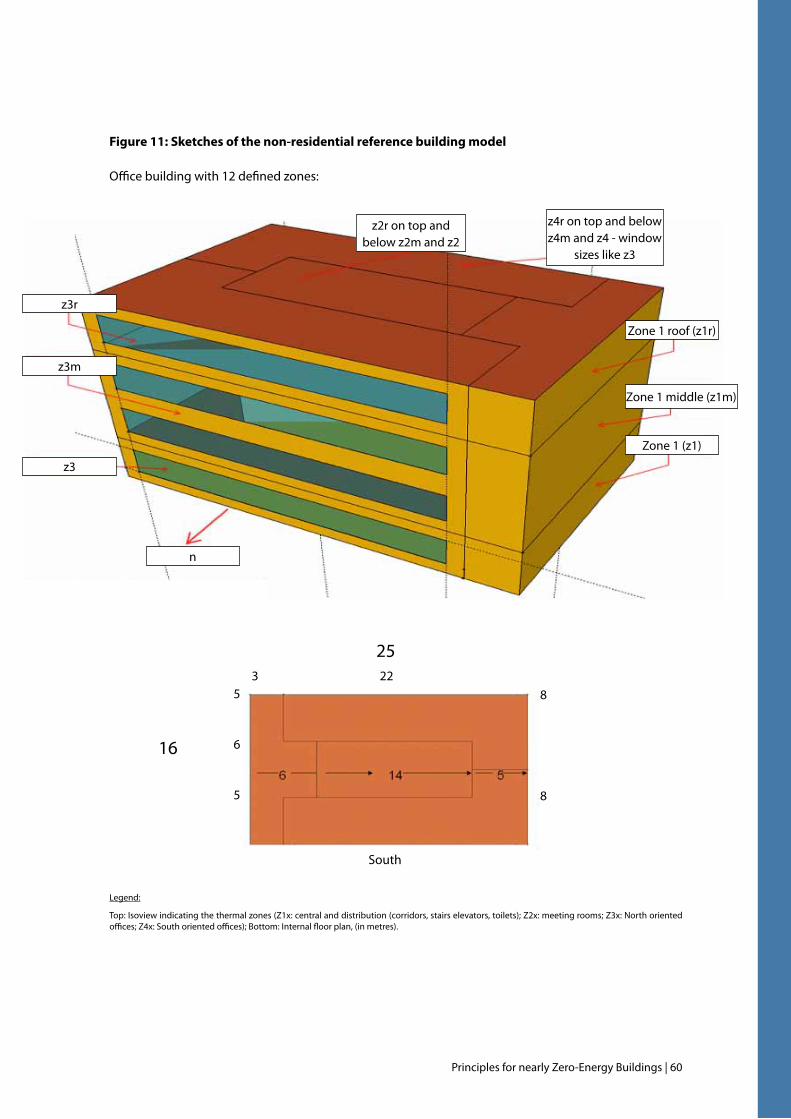
Principles for nearly Zero-Energy Buildings | 60
Figure 11: Sketches of the non-residential reference building model
Office building with 12 defined zones:
Legend:
Top:Isoviewindicatingthethermalzones(Z1x:centralanddistribution(corridors,stairselevators,toilets);Z2x:meetingrooms;Z3x:Northorientedoffices;Z4x:Southorientedoffices);Bottom:Internalfloorplan,(inmetres).
z3
n
z3m
z3r
Zone 1 roof (z1r)
Zone 1 middle (z1m)
Zone 1 (z1)
z2r on top and below z2m and z2
z4r on top and below z4m and z4 - window
sizes like z3
5
6
5
8
8
25
16
South
3 22
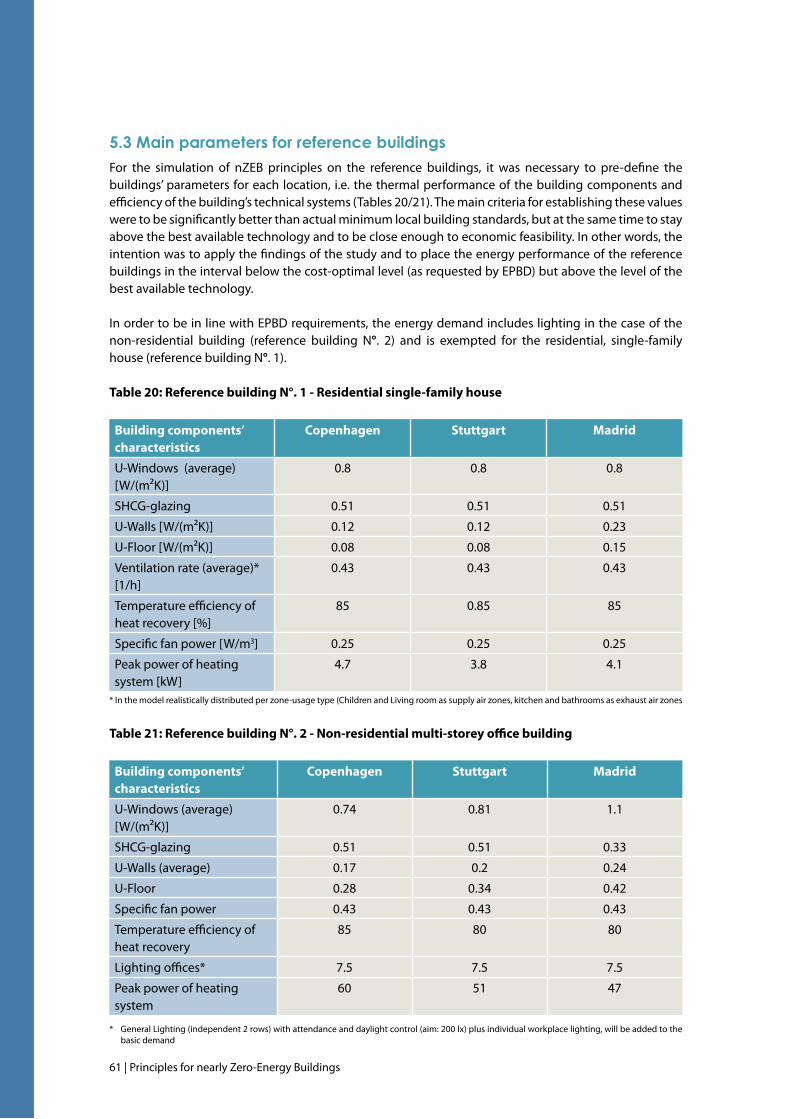
61 | Principles for nearly Zero-Energy Buildings
5.3 main parameters for reference buildings For the simulation of nZEB principles on the reference buildings, it was necessary to pre-define the buildings’ parameters for each location, i.e. the thermal performance of the building components and efficiency of the building’s technical systems (Tables 20/21). The main criteria for establishing these values were to be significantly better than actual minimum local building standards, but at the same time to stay above the best available technology and to be close enough to economic feasibility. In other words, the intention was to apply the findings of the study and to place the energy performance of the reference buildings in the interval below the cost-optimal level (as requested by EPBD) but above the level of the best available technology.
In order to be in line with EPBD requirements, the energy demand includes lighting in the case of the non-residential building (reference building N°. 2) and is exempted for the residential, single-family house (reference building N°. 1).
Table 20: Reference building N°. 1 - Residential single-family house
Building components’ characteristics
Copenhagen Stuttgart Madrid
U-Windows (average) [W/(m²K)]
0.8 0.8 0.8
SHCG-glazing 0.51 0.51 0.51
U-Walls [W/(m²K)] 0.12 0.12 0.23
U-Floor [W/(m²K)] 0.08 0.08 0.15
Ventilation rate (average)* [1/h]
0.43 0.43 0.43
Temperature efficiency of heat recovery [%]
85 0.85 85
Specific fan power [W/m3] 0.25 0.25 0.25
Peak power of heating system [kW]
4.7 3.8 4.1
* In the model realistically distributed per zone-usage type (Children and Living room as supply air zones, kitchen and bathrooms as exhaust air zones
Table 21: Reference building N°. 2 - Non-residential multi-storey office building
Building components’ characteristics
Copenhagen Stuttgart Madrid
U-Windows (average)[W/(m²K)]
0.74 0.81 1.1
SHCG-glazing 0.51 0.51 0.33
U-Walls (average) 0.17 0.2 0.24
U-Floor 0.28 0.34 0.42
Specific fan power 0.43 0.43 0.43
Temperature efficiency of heat recovery
85 80 80
Lighting offices* 7.5 7.5 7.5
Peak power of heating system
60 51 47
* General Lighting (independent 2 rows) with attendance and daylight control (aim: 200 lx) plus individual workplace lighting, will be added to the basic demand
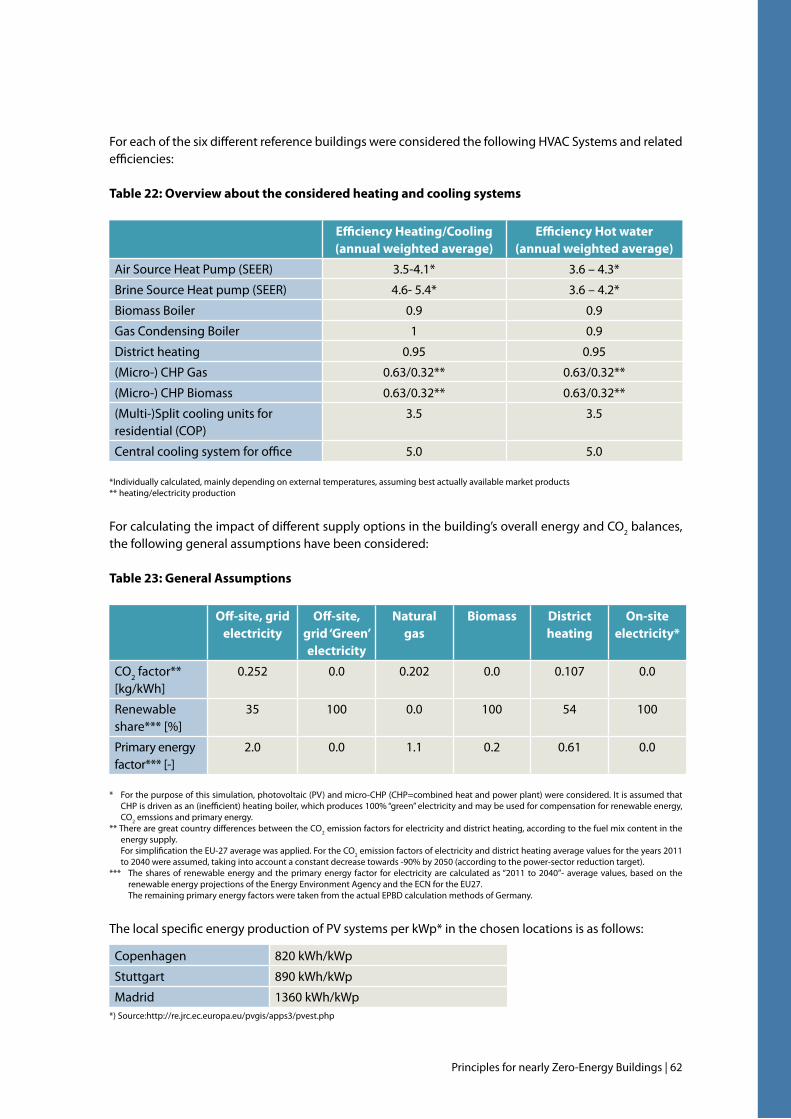
Principles for nearly Zero-Energy Buildings | 62
For each of the six different reference buildings were considered the following HVAC Systems and related efficiencies:
Table 22: Overview about the considered heating and cooling systems
Efficiency Heating/Cooling (annual weighted average)
Efficiency Hot water(annual weighted average)
Air Source Heat Pump (SEER) 3.5-4.1* 3.6 – 4.3*
Brine Source Heat pump (SEER) 4.6- 5.4* 3.6 – 4.2*
Biomass Boiler 0.9 0.9
Gas Condensing Boiler 1 0.9
District heating 0.95 0.95
(Micro-) CHP Gas 0.63/0.32** 0.63/0.32**
(Micro-) CHP Biomass 0.63/0.32** 0.63/0.32**
(Multi-)Split cooling units for residential (COP)
3.5 3.5
Central cooling system for office 5.0 5.0
*Individually calculated, mainly depending on external temperatures, assuming best actually available market products** heating/electricity production
For calculating the impact of different supply options in the building’s overall energy and CO2 balances, the following general assumptions have been considered:
Table 23: General Assumptions
Off-site, grid electricity
Off-site, grid ‘Green’ electricity
Natural gas
Biomass District heating
On-site electricity*
CO2 factor** [kg/kWh]
0.252 0.0 0.202 0.0 0.107 0.0
Renewable share*** [%]
35 100 0.0 100 54 100
Primary energy factor*** [-]
2.0 0.0 1.1 0.2 0.61 0.0
* For the purpose of this simulation, photovoltaic (PV) and micro-CHP (CHP=combined heat and power plant) were considered. It is assumed that CHP is driven as an (inefficient) heating boiler, which produces 100% “green” electricity and may be used for compensation for renewable energy, CO2 emssions and primary energy.
** There are great country differences between the CO2 emission factors for electricity and district heating, according to the fuel mix content in the energy supply.
For simplification the EU-27 average was applied. For the CO2 emission factors of electricity and district heating average values for the years 2011 to 2040 were assumed, taking into account a constant decrease towards -90% by 2050 (according to the power-sector reduction target).
*** The shares of renewable energy and the primary energy factor for electricity are calculated as “2011 to 2040”- average values, based on the renewable energy projections of the Energy Environment Agency and the ECN for the EU27.
The remaining primary energy factors were taken from the actual EPBD calculation methods of Germany.
The local specific energy production of PV systems per kWp* in the chosen locations is as follows:
Copenhagen 820 kWh/kWp
Stuttgart 890 kWh/kWp
Madrid 1360 kWh/kWp*) Source:http://re.jrc.ec.europa.eu/pvgis/apps3/pvest.php
63 | Principles for nearly Zero-Energy Buildings
5.4 Verification of nZEB principles on reference buildings In this chapter the results of the simulations on the reference buildings are illustrated.Within the simulated application of nZEB principles on the reference buildings in different climate zones, the following parameters were considered and calculated:
• Specificprimaryenergydemanddetailedbybuildingservices,i.e.heating,domestichotwater(DHW),cooling, solar thermal domestic hot water, losses.
• Different technology options for providing a building’s heating, cooling and DHW: air source heatpump, brine source heat pump, biomass boiler, gas condensing boiler, district heating, micro-CHP gas, micro-CHP biomass, multi-split cooling units for residential (COP), central cooling system for offices.
• Finalenergydemandsinseveraltechnologyassumptionsanddetailedbybuildingservices(i.e.heating,domestic hot water, cooling, ventilation and auxiliary energy).
• Theprimaryenergydemand,therenewableenergyshareandtheassociatedGHGemissionsofthereference buildings were calculated for each climate zone in two situations with or without considering the electricity consumption of appliances and other building equipment outside the scope of the EPBD.
• Renewableenergy:Inadditiontothebasictechnicalsystempresentedabove,thesimulationconsideredseveral supplementary options such as:- One on-site photovoltaic (PV) system of 2kWp.- Additional use of off-site “100%-green electricity”, which is assumed to have 100% share of renewable
energy and a CO2 emission-facor of 0 kg/kWh as well as a primary energy factor of 0 kWh/kWh.
• SpecificCO2 emissions and primary energy: In addition to the above-mentioned assumptions, a PV-compensation was considered to reach a 50% or 90% share of renewables.
• All analysed options assumed a well-sealed and insulated building shell with a highly efficientventilation system, leading to a very low energy demand.
All specific values are related to the net floor area of 129 m² for a single-family house and 1.600 m2 internal floor area for the office building.
The following sets of graphs for each climate and building type show the results for the basic variant, without any PV on-site electricity production and usage of off-site green electricity, as well as for the variants considering those two possible improvement options:
1. Top: Share of energy from renewable sources (red lines within the graph indicate the 50% and the 100% borders). The shares were equally counted, meaning independently from the type of energy
(e.g. renewable heat counts as much as renewable electricity).
2. Middle: Specific CO2 emissions (dotted line indicates the 3 kg/(m²a), which is the limit for reaching the 2050 objective (see also chapter 5).
3. Bottom: Specific primary energy demands.
Remarks: As the electricity produced by PV and CHP systems, was calculated as a negative contribution, assuming the CO2 emission and primary energy factors of conventional grid electricity, negative values for the CO2 emissions and primary energy for those variants are possible. In case the on-site renewable energy production systems (PV and biogas CHP) produce more energy than the annual demand ( plus energy buildings) a share of renewable energy above 100% is possible.
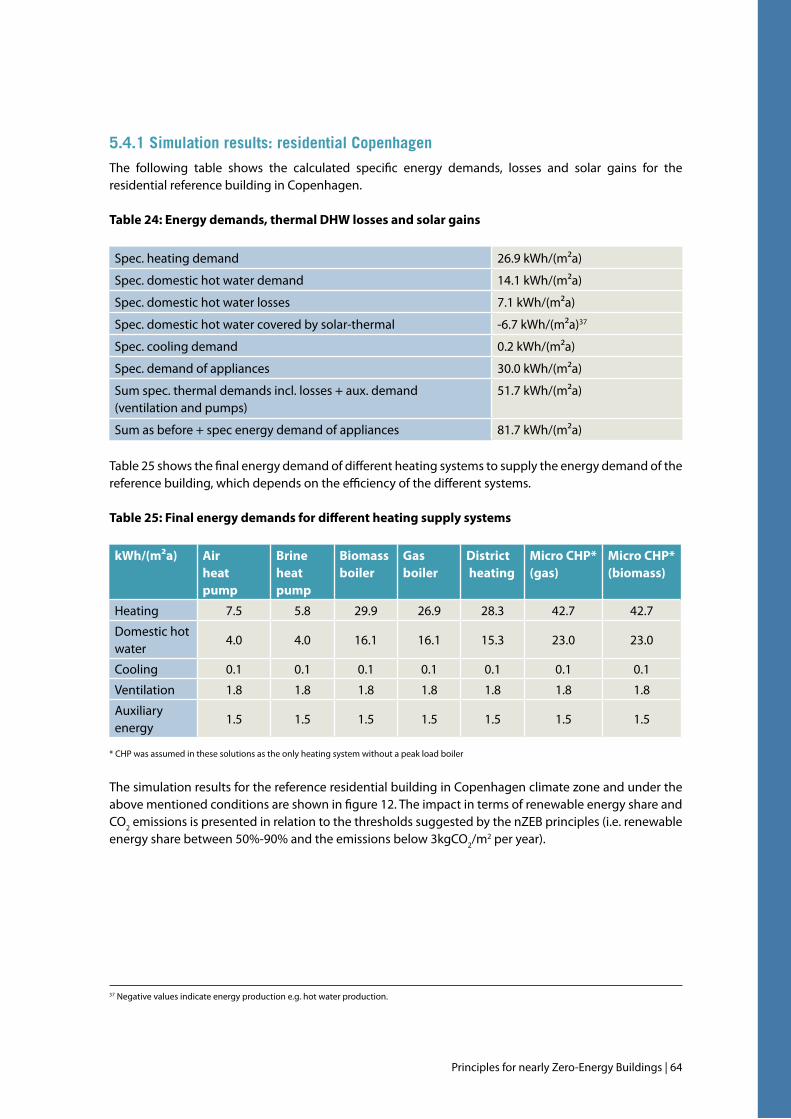
Principles for nearly Zero-Energy Buildings | 64
5.4.1 simulation results: residential copenhagen
The following table shows the calculated specific energy demands, losses and solar gains for the residential reference building in Copenhagen.
Table 24: Energy demands, thermal DHW losses and solar gains
Spec. heating demand 26.9 kWh/(m²a)
Spec. domestic hot water demand 14.1 kWh/(m²a)
Spec. domestic hot water losses 7.1 kWh/(m²a)
Spec. domestic hot water covered by solar-thermal -6.7 kWh/(m²a)37
Spec. cooling demand 0.2 kWh/(m²a)
Spec. demand of appliances 30.0 kWh/(m²a)
Sum spec. thermal demands incl. losses + aux. demand (ventilation and pumps)
51.7 kWh/(m²a)
Sum as before + spec energy demand of appliances 81.7 kWh/(m²a)
Table 25 shows the final energy demand of different heating systems to supply the energy demand of the reference building, which depends on the efficiency of the different systems.
Table 25: Final energy demands for different heating supply systems
kWh/(m²a) Air heat pump
Brine heat pump
Biomass boiler
Gas boiler
District heating
Micro CHP* (gas)
Micro CHP* (biomass)
Heating 7.5 5.8 29.9 26.9 28.3 42.7 42.7
Domestic hot water
4.0 4.0 16.1 16.1 15.3 23.0 23.0
Cooling 0.1 0.1 0.1 0.1 0.1 0.1 0.1
Ventilation 1.8 1.8 1.8 1.8 1.8 1.8 1.8
Auxiliary energy
1.5 1.5 1.5 1.5 1.5 1.5 1.5
* CHP was assumed in these solutions as the only heating system without a peak load boiler
The simulation results for the reference residential building in Copenhagen climate zone and under the above mentioned conditions are shown in figure 12. The impact in terms of renewable energy share and CO2 emissions is presented in relation to the thresholds suggested by the nZEB principles (i.e. renewable energy share between 50%-90% and the emissions below 3kgCO2/m2 per year).
37 Negative values indicate energy production e.g. hot water production.
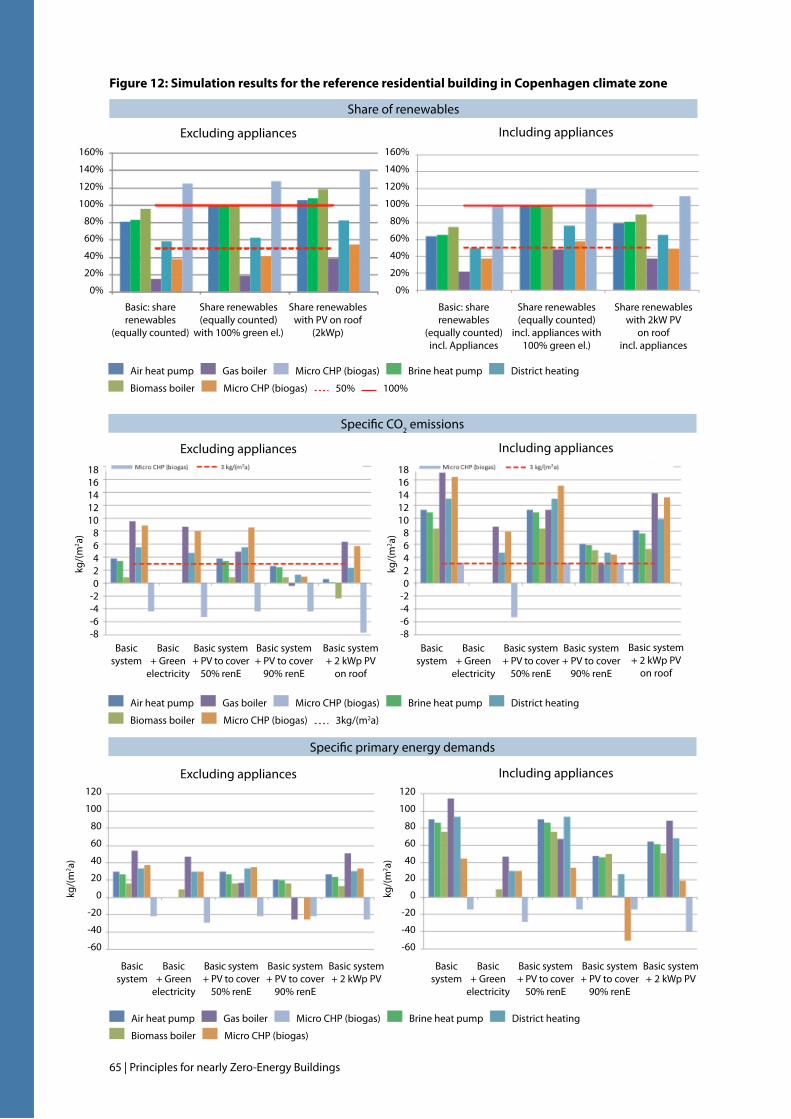
65 | Principles for nearly Zero-Energy Buildings
Share of renewables
Specific primary energy demands
160%
140%
120%
100%
80%
60%
40%
20%
0%
120
100
80
60
40
20
0
-20
-40
-60
120
100
80
60
40
20
0
-20
-40
-60
1816141210
86420
-2-4-6-8
1816141210
86420
-2-4-6-8
160%
140%
120%
100%
80%
60%
40%
20%
0%
Basic: share renewables
(equally counted)
Basic: share renewables
(equally counted) incl. Appliances
Share renewables(equally counted)
with 100% green el.)
Share renewables(equally counted)
incl. appliances with 100% green el.)
Share renewableswith PV on roof
(2kWp)
Share renewableswith 2kW PV
on roof incl. appliances
Air heat pump Gas boiler Micro CHP (biogas) Brine heat pump District heating
Biomass boiler Micro CHP (biogas) 50% 100%
Air heat pump Gas boiler Micro CHP (biogas) Brine heat pump District heating
Biomass boiler Micro CHP (biogas) 3kg/(m2a)
Air heat pump Gas boiler Micro CHP (biogas) Brine heat pump District heating
Biomass boiler Micro CHP (biogas)
kg/(
m2 a)
kg/(
m2 a)
kg/(
m2 a)
kg/(
m2 a)
Basic system
Basic system
Basic system
Basic system
Basic+ Green
electricity
Basic+ Green
electricity
Basic+ Green
electricity
Basic+ Green
electricity
Basic system+ PV to cover
50% renE
Basic system+ PV to cover
50% renE
Basic system+ PV to cover
50% renE
Basic system+ PV to cover
50% renE
Basic system+ PV to cover
90% renE
Basic system+ PV to cover
90% renE
Basic system+ PV to cover
90% renE
Basic system+ PV to cover
90% renE
Basic system+ 2 kWp PV
on roof
Basic system+ 2 kWp PV
Basic system+ 2 kWp PV
Basic system+ 2 kWp PV
on roof
Specific CO2 emissions
Excluding appliances Including appliances
Excluding appliances Including appliances
Excluding appliances Including appliances
Figure 12: Simulation results for the reference residential building in Copenhagen climate zone
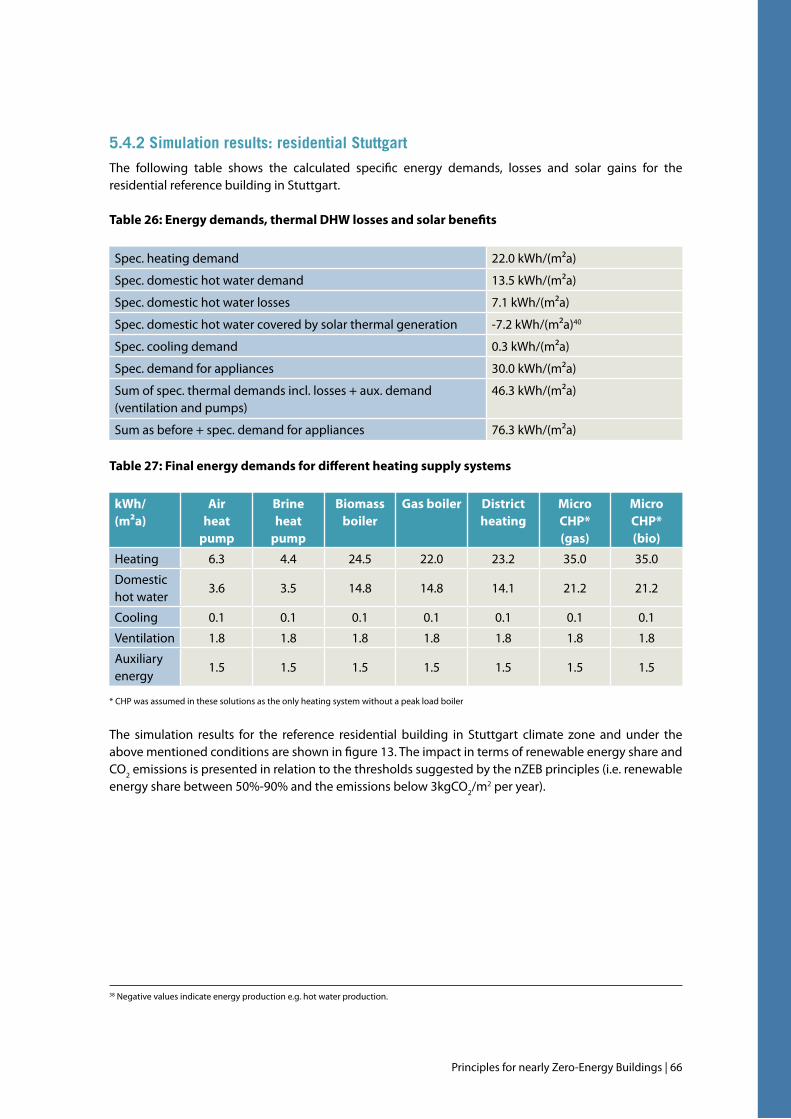
Principles for nearly Zero-Energy Buildings | 66
5.4.2 simulation results: residential stuttgart
The following table shows the calculated specific energy demands, losses and solar gains for the residential reference building in Stuttgart.
Table 26: Energy demands, thermal DHW losses and solar benefits
Spec. heating demand 22.0 kWh/(m²a)
Spec. domestic hot water demand 13.5 kWh/(m²a)
Spec. domestic hot water losses 7.1 kWh/(m²a)
Spec. domestic hot water covered by solar thermal generation -7.2 kWh/(m²a)40
Spec. cooling demand 0.3 kWh/(m²a)
Spec. demand for appliances 30.0 kWh/(m²a)
Sum of spec. thermal demands incl. losses + aux. demand (ventilation and pumps)
46.3 kWh/(m²a)
Sum as before + spec. demand for appliances 76.3 kWh/(m²a)
Table 27: Final energy demands for different heating supply systems
kWh/(m²a)
Air heat
pump
Brine heat
pump
Biomass boiler
Gas boiler Districtheating
Micro CHP* (gas)
Micro CHP* (bio)
Heating 6.3 4.4 24.5 22.0 23.2 35.0 35.0
Domestic hot water
3.6 3.5 14.8 14.8 14.1 21.2 21.2
Cooling 0.1 0.1 0.1 0.1 0.1 0.1 0.1
Ventilation 1.8 1.8 1.8 1.8 1.8 1.8 1.8
Auxiliary energy
1.5 1.5 1.5 1.5 1.5 1.5 1.5
* CHP was assumed in these solutions as the only heating system without a peak load boiler
The simulation results for the reference residential building in Stuttgart climate zone and under the above mentioned conditions are shown in figure 13. The impact in terms of renewable energy share and CO2 emissions is presented in relation to the thresholds suggested by the nZEB principles (i.e. renewable energy share between 50%-90% and the emissions below 3kgCO2/m2 per year).
38 Negative values indicate energy production e.g. hot water production.
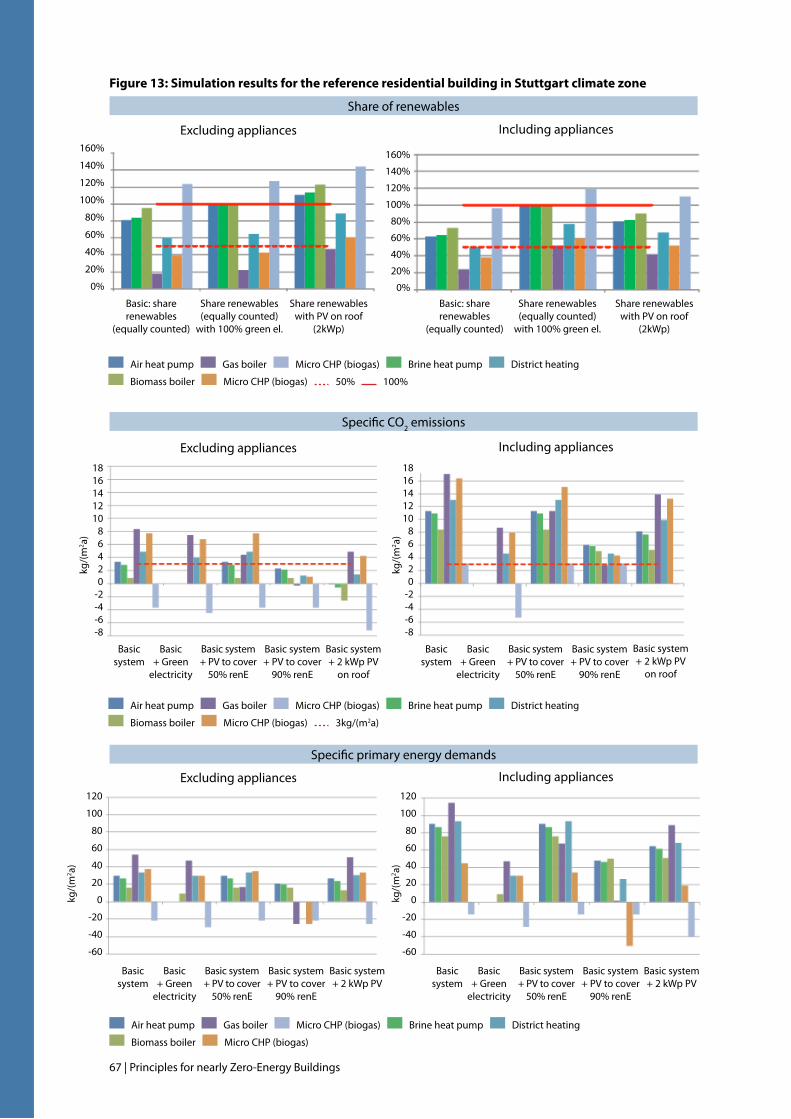
67 | Principles for nearly Zero-Energy Buildings
Share of renewables
Specific CO2 emissions
Specific primary energy demands
160%
140%
120%
100%
80%
60%
40%
20%
0%
160%
140%
120%
100%
80%
60%
40%
20%
0%Basic: share renewables
(equally counted)
Basic: share renewables
(equally counted)
Share renewables(equally counted)
with 100% green el.
Share renewables(equally counted)
with 100% green el.
Share renewableswith PV on roof
(2kWp)
Share renewableswith PV on roof
(2kWp)
Air heat pump Gas boiler Micro CHP (biogas) Brine heat pump District heating
Biomass boiler Micro CHP (biogas) 50% 100%
1816141210
86420
-2-4-6-8
1816141210
86420
-2-4-6-8
kg/(
m2 a)
kg/(
m2 a)
Basic system
Basic system
Basic+ Green
electricity
Basic+ Green
electricity
Basic system+ PV to cover
50% renE
Basic system+ PV to cover
50% renE
Basic system+ PV to cover
90% renE
Basic system+ PV to cover
90% renE
Basic system+ 2 kWp PV
on roof
Basic system+ 2 kWp PV
on roof
Air heat pump Gas boiler Micro CHP (biogas) Brine heat pump District heating
Biomass boiler Micro CHP (biogas) 3kg/(m2a)
120
100
80
60
40
20
0
-20
-40
-60
120
100
80
60
40
20
0
-20
-40
-60
kg/(
m2 a)
kg/(
m2 a)
Basic system
Basic system
Basic+ Green
electricity
Basic+ Green
electricity
Basic system+ PV to cover
50% renE
Basic system+ PV to cover
50% renE
Basic system+ PV to cover
90% renE
Basic system+ PV to cover
90% renE
Basic system+ 2 kWp PV
Basic system+ 2 kWp PV
Air heat pump Gas boiler Micro CHP (biogas) Brine heat pump District heating
Biomass boiler Micro CHP (biogas)
Excluding appliances Including appliances
Excluding appliances Including appliances
Excluding appliances Including appliances
Figure 13: Simulation results for the reference residential building in Stuttgart climate zone
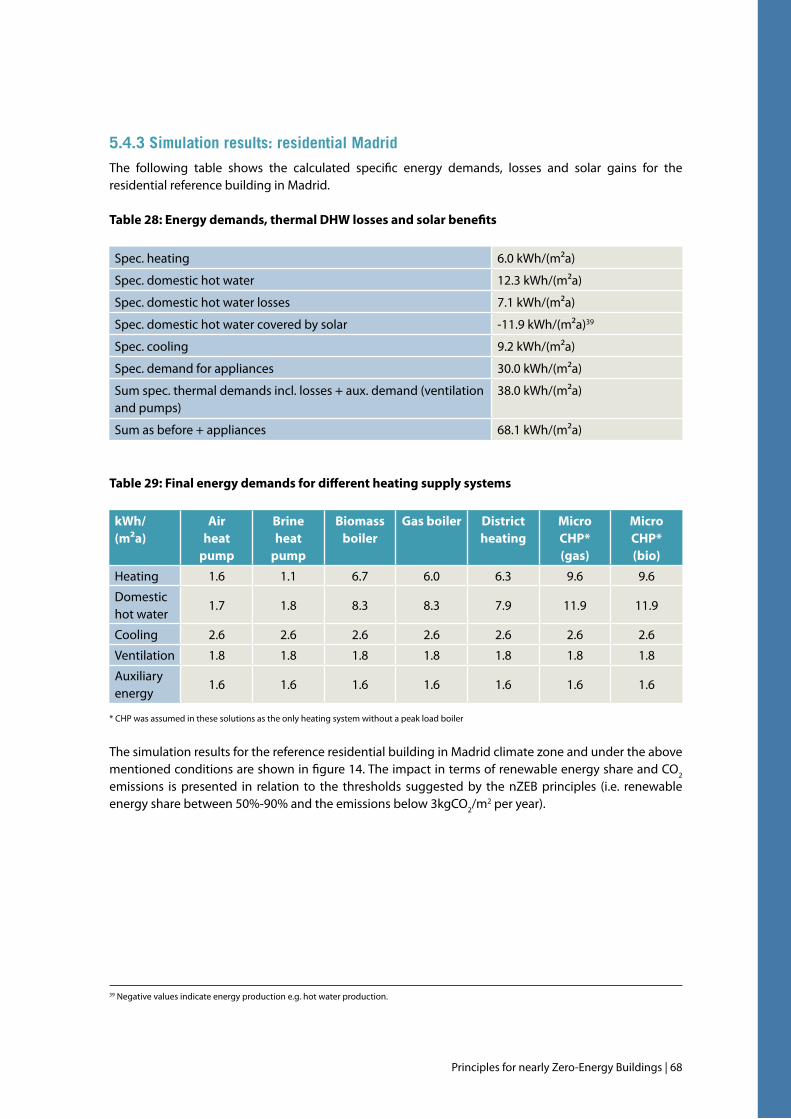
Principles for nearly Zero-Energy Buildings | 68
5.4.3 simulation results: residential madrid
The following table shows the calculated specific energy demands, losses and solar gains for the residential reference building in Madrid.
Table 28: Energy demands, thermal DHW losses and solar benefits
Spec. heating 6.0 kWh/(m²a)
Spec. domestic hot water 12.3 kWh/(m²a)
Spec. domestic hot water losses 7.1 kWh/(m²a)
Spec. domestic hot water covered by solar -11.9 kWh/(m²a)39
Spec. cooling 9.2 kWh/(m²a)
Spec. demand for appliances 30.0 kWh/(m²a)
Sum spec. thermal demands incl. losses + aux. demand (ventilation and pumps)
38.0 kWh/(m²a)
Sum as before + appliances 68.1 kWh/(m²a)
Table 29: Final energy demands for different heating supply systems
kWh/(m²a)
Air heat
pump
Brine heat
pump
Biomass boiler
Gas boiler Districtheating
Micro CHP* (gas)
Micro CHP* (bio)
Heating 1.6 1.1 6.7 6.0 6.3 9.6 9.6
Domestic hot water
1.7 1.8 8.3 8.3 7.9 11.9 11.9
Cooling 2.6 2.6 2.6 2.6 2.6 2.6 2.6
Ventilation 1.8 1.8 1.8 1.8 1.8 1.8 1.8
Auxiliary energy
1.6 1.6 1.6 1.6 1.6 1.6 1.6
* CHP was assumed in these solutions as the only heating system without a peak load boiler
The simulation results for the reference residential building in Madrid climate zone and under the above mentioned conditions are shown in figure 14. The impact in terms of renewable energy share and CO2 emissions is presented in relation to the thresholds suggested by the nZEB principles (i.e. renewable energy share between 50%-90% and the emissions below 3kgCO2/m2 per year).
39 Negative values indicate energy production e.g. hot water production.
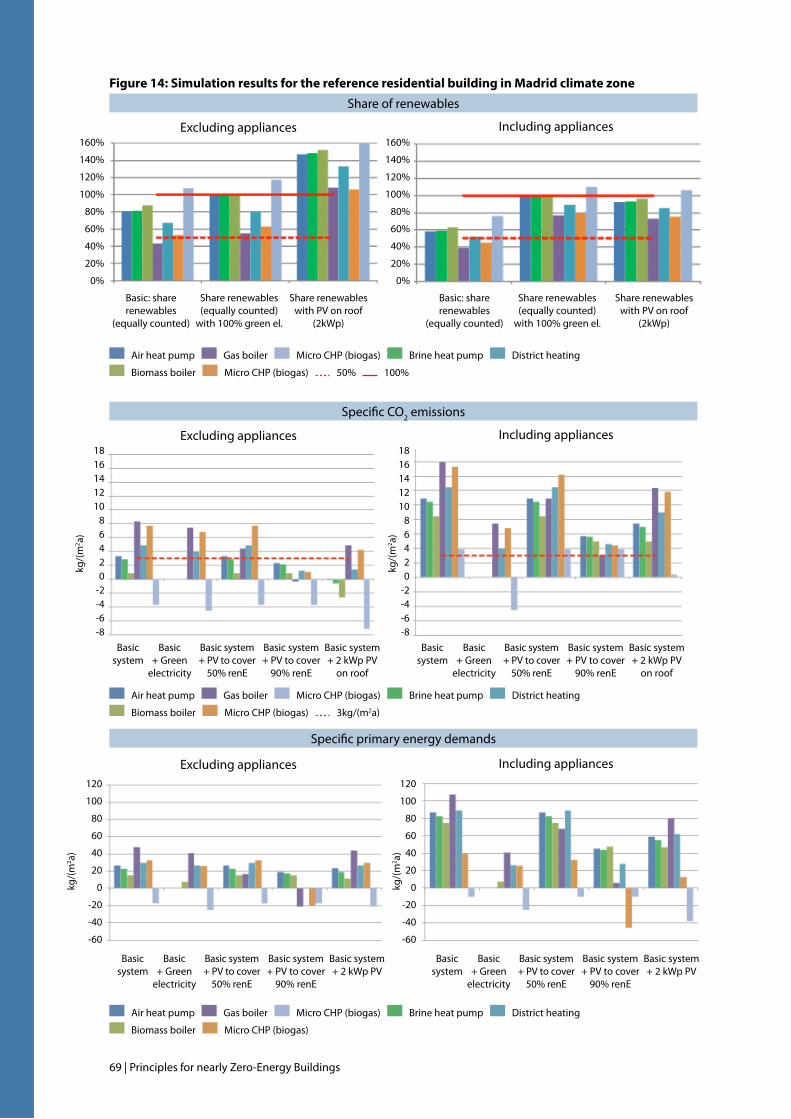
69 | Principles for nearly Zero-Energy Buildings
Share of renewables
160%
140%
120%
100%
80%
60%
40%
20%
0%
160%
140%
120%
100%
80%
60%
40%
20%
0%
Basic: share renewables
(equally counted)
Basic: share renewables
(equally counted)
Share renewables(equally counted)
with 100% green el.
Share renewables(equally counted)
with 100% green el.
Share renewableswith PV on roof
(2kWp)
Share renewableswith PV on roof
(2kWp)
Specific CO2 emissions
Specific primary energy demands
Air heat pump Gas boiler Micro CHP (biogas) Brine heat pump District heating
Biomass boiler Micro CHP (biogas) 50% 100%
1816141210
86420
-2-4-6-8
1816141210
86420
-2-4-6-8
kg/(
m2 a)
kg/(
m2 a)
Basic system
Basic system
Basic+ Green
electricity
Basic+ Green
electricity
Basic system+ PV to cover
50% renE
Basic system+ PV to cover
50% renE
Basic system+ PV to cover
90% renE
Basic system+ PV to cover
90% renE
Basic system+ 2 kWp PV
on roof
Basic system+ 2 kWp PV
on roof
Air heat pump Gas boiler Micro CHP (biogas) Brine heat pump District heating
Biomass boiler Micro CHP (biogas) 3kg/(m2a)
120
100
80
60
40
20
0
-20
-40
-60
120
100
80
60
40
20
0
-20
-40
-60
kg/(
m2 a)
kg/(
m2 a)
Basic system
Basic system
Basic+ Green
electricity
Basic+ Green
electricity
Basic system+ PV to cover
50% renE
Basic system+ PV to cover
50% renE
Basic system+ PV to cover
90% renE
Basic system+ PV to cover
90% renE
Basic system+ 2 kWp PV
Basic system+ 2 kWp PV
Air heat pump Gas boiler Micro CHP (biogas) Brine heat pump District heating
Biomass boiler Micro CHP (biogas)
Excluding appliances Including appliances
Excluding appliances Including appliances
Excluding appliances Including appliances
Figure 14: Simulation results for the reference residential building in Madrid climate zone
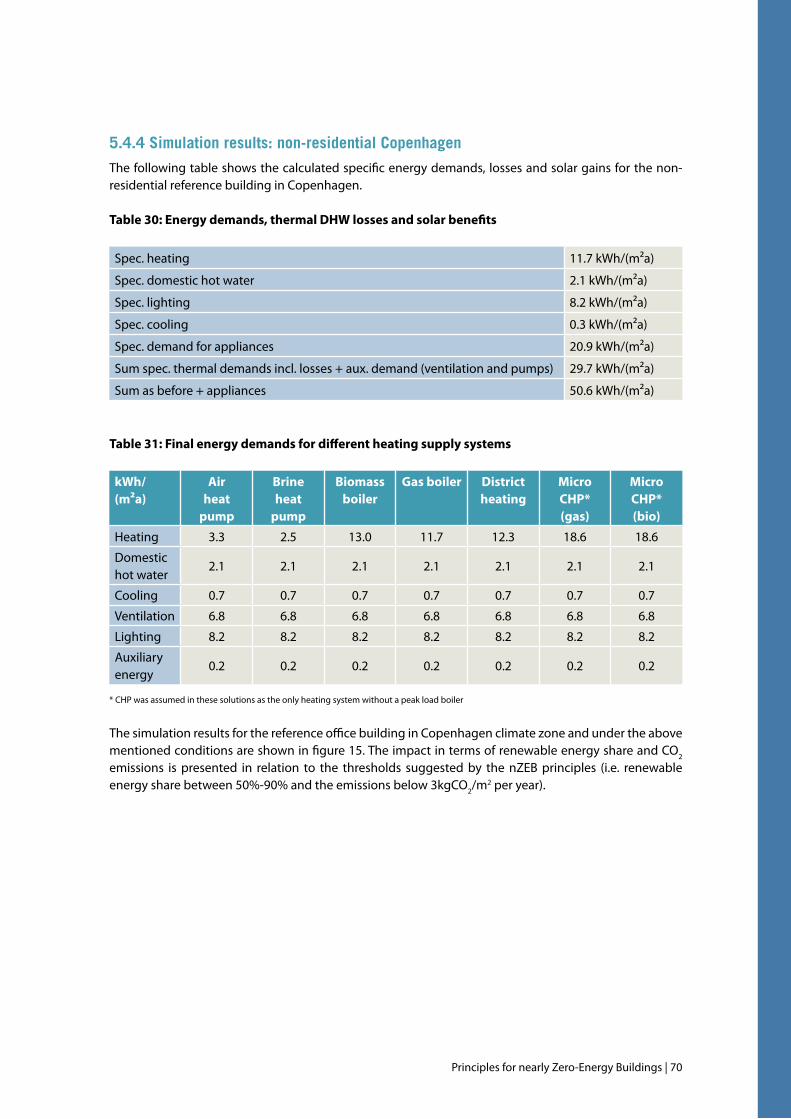
Principles for nearly Zero-Energy Buildings | 70
5.4.4 simulation results: non-residential copenhagen
The following table shows the calculated specific energy demands, losses and solar gains for the non-residential reference building in Copenhagen.
Table 30: Energy demands, thermal DHW losses and solar benefits
Spec. heating 11.7 kWh/(m²a)
Spec. domestic hot water 2.1 kWh/(m²a)
Spec. lighting 8.2 kWh/(m²a)
Spec. cooling 0.3 kWh/(m²a)
Spec. demand for appliances 20.9 kWh/(m²a)
Sum spec. thermal demands incl. losses + aux. demand (ventilation and pumps) 29.7 kWh/(m²a)
Sum as before + appliances 50.6 kWh/(m²a)
Table 31: Final energy demands for different heating supply systems
kWh/(m²a)
Air heat
pump
Brine heat
pump
Biomass boiler
Gas boiler Districtheating
Micro CHP* (gas)
Micro CHP* (bio)
Heating 3.3 2.5 13.0 11.7 12.3 18.6 18.6
Domestic hot water
2.1 2.1 2.1 2.1 2.1 2.1 2.1
Cooling 0.7 0.7 0.7 0.7 0.7 0.7 0.7
Ventilation 6.8 6.8 6.8 6.8 6.8 6.8 6.8
Lighting 8.2 8.2 8.2 8.2 8.2 8.2 8.2
Auxiliary energy
0.2 0.2 0.2 0.2 0.2 0.2 0.2
* CHP was assumed in these solutions as the only heating system without a peak load boiler
The simulation results for the reference office building in Copenhagen climate zone and under the above mentioned conditions are shown in figure 15. The impact in terms of renewable energy share and CO2 emissions is presented in relation to the thresholds suggested by the nZEB principles (i.e. renewable energy share between 50%-90% and the emissions below 3kgCO2/m2 per year).
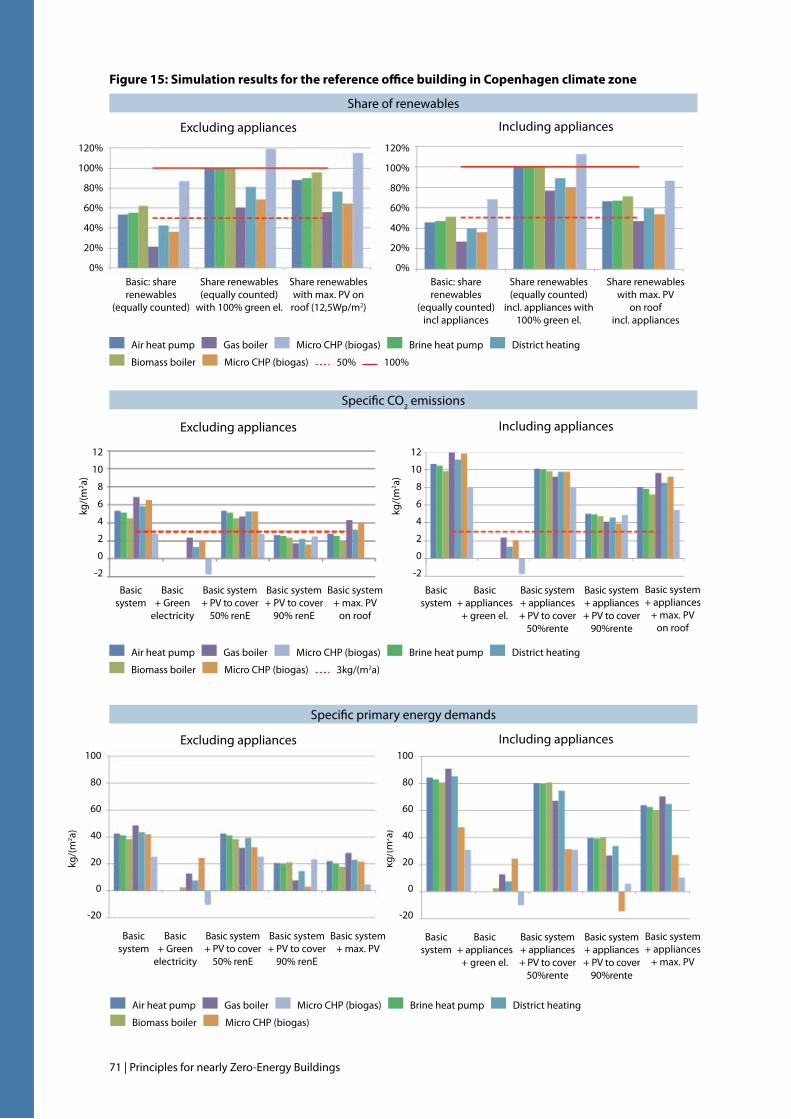
71 | Principles for nearly Zero-Energy Buildings
Share of renewables
12
10
8
6
4
2
0
-2
12
10
8
6
4
2
0
-2
kg/(
m2 a)
kg/(
m2 a)
Basic system
Basic system
Basic+ Green
electricity
Basic+ appliances
+ green el.
Basic system+ PV to cover
50% renE
Basic system+ appliances + PV to cover
50%rente
Basic system+ PV to cover
90% renE
Basic system+ appliances + PV to cover
90%rente
Basic system+ max. PV
on roof
Basic system+ appliances
+ max. PV on roof
Specific CO2 emissions
Specific primary energy demands
120%
100%
80%
60%
40%
20%
0%
120%
100%
80%
60%
40%
20%
0%Basic: share renewables
(equally counted)
Basic: share renewables
(equally counted)incl appliances
Share renewables(equally counted)
with 100% green el.
Share renewables(equally counted)
incl. appliances with 100% green el.
Share renewableswith max. PV on
roof (12,5Wp/m2)
Share renewableswith max. PV
on roof incl. appliances
Air heat pump Gas boiler Micro CHP (biogas) Brine heat pump District heating
Biomass boiler Micro CHP (biogas) 50% 100%
Air heat pump Gas boiler Micro CHP (biogas) Brine heat pump District heating
Biomass boiler Micro CHP (biogas) 3kg/(m2a)
Basic system
Basic+ appliances
+ green el.
Basic system+ appliances + PV to cover
50%rente
Basic system+ appliances + PV to cover
90%rente
Basic system+ appliances
+ max. PV
100
80
60
40
20
0
-20
100
80
60
40
20
0
-20
kg/(
m2 a)
kg/(
m2 a)
Basic system
Basic+ Green
electricity
Basic system+ PV to cover
50% renE
Basic system+ PV to cover
90% renE
Basic system+ max. PV
Air heat pump Gas boiler Micro CHP (biogas) Brine heat pump District heating
Biomass boiler Micro CHP (biogas)
Excluding appliances Including appliances
Excluding appliances Including appliances
Excluding appliances Including appliances
Figure 15: Simulation results for the reference office building in Copenhagen climate zone
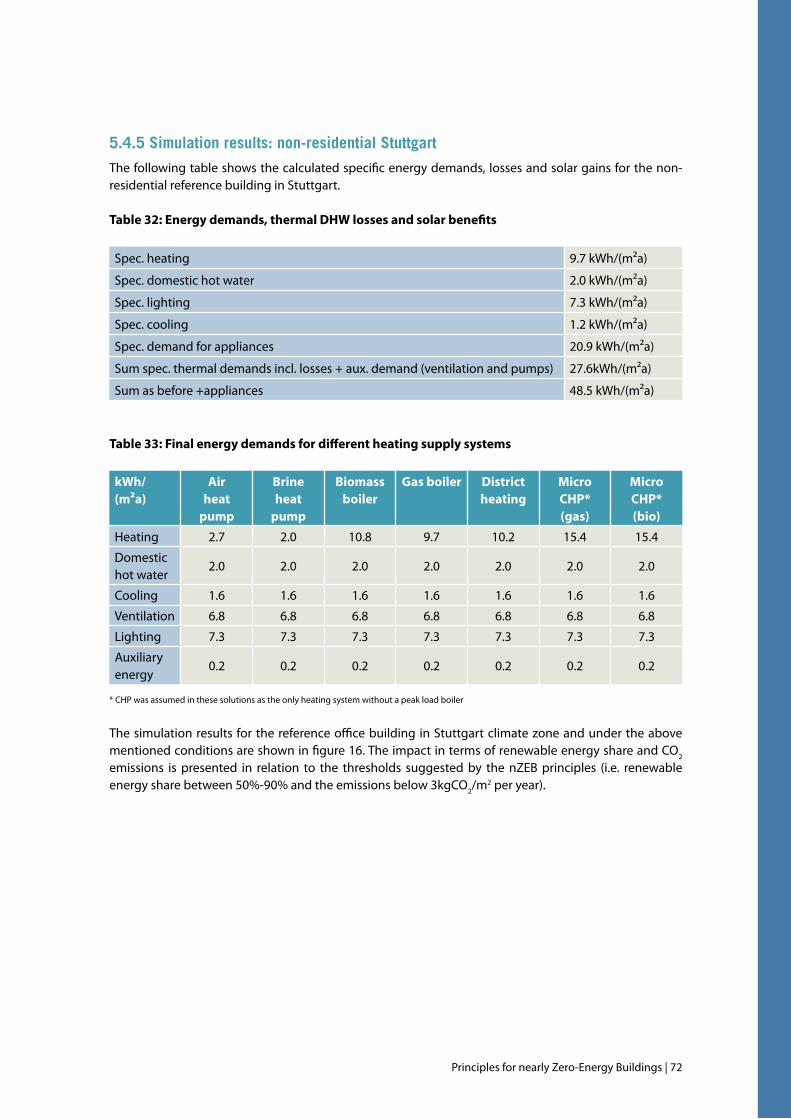
Principles for nearly Zero-Energy Buildings | 72
5.4.5 simulation results: non-residential stuttgart
The following table shows the calculated specific energy demands, losses and solar gains for the non-residential reference building in Stuttgart.
Table 32: Energy demands, thermal DHW losses and solar benefits
Spec. heating 9.7 kWh/(m²a)
Spec. domestic hot water 2.0 kWh/(m²a)
Spec. lighting 7.3 kWh/(m²a)
Spec. cooling 1.2 kWh/(m²a)
Spec. demand for appliances 20.9 kWh/(m²a)
Sum spec. thermal demands incl. losses + aux. demand (ventilation and pumps) 27.6kWh/(m²a)
Sum as before +appliances 48.5 kWh/(m²a)
Table 33: Final energy demands for different heating supply systems
kWh/(m²a)
Air heat
pump
Brine heat
pump
Biomass boiler
Gas boiler Districtheating
Micro CHP* (gas)
Micro CHP* (bio)
Heating 2.7 2.0 10.8 9.7 10.2 15.4 15.4
Domestic hot water
2.0 2.0 2.0 2.0 2.0 2.0 2.0
Cooling 1.6 1.6 1.6 1.6 1.6 1.6 1.6
Ventilation 6.8 6.8 6.8 6.8 6.8 6.8 6.8
Lighting 7.3 7.3 7.3 7.3 7.3 7.3 7.3
Auxiliary energy
0.2 0.2 0.2 0.2 0.2 0.2 0.2
* CHP was assumed in these solutions as the only heating system without a peak load boiler
The simulation results for the reference office building in Stuttgart climate zone and under the above mentioned conditions are shown in figure 16. The impact in terms of renewable energy share and CO2 emissions is presented in relation to the thresholds suggested by the nZEB principles (i.e. renewable energy share between 50%-90% and the emissions below 3kgCO2/m2 per year).
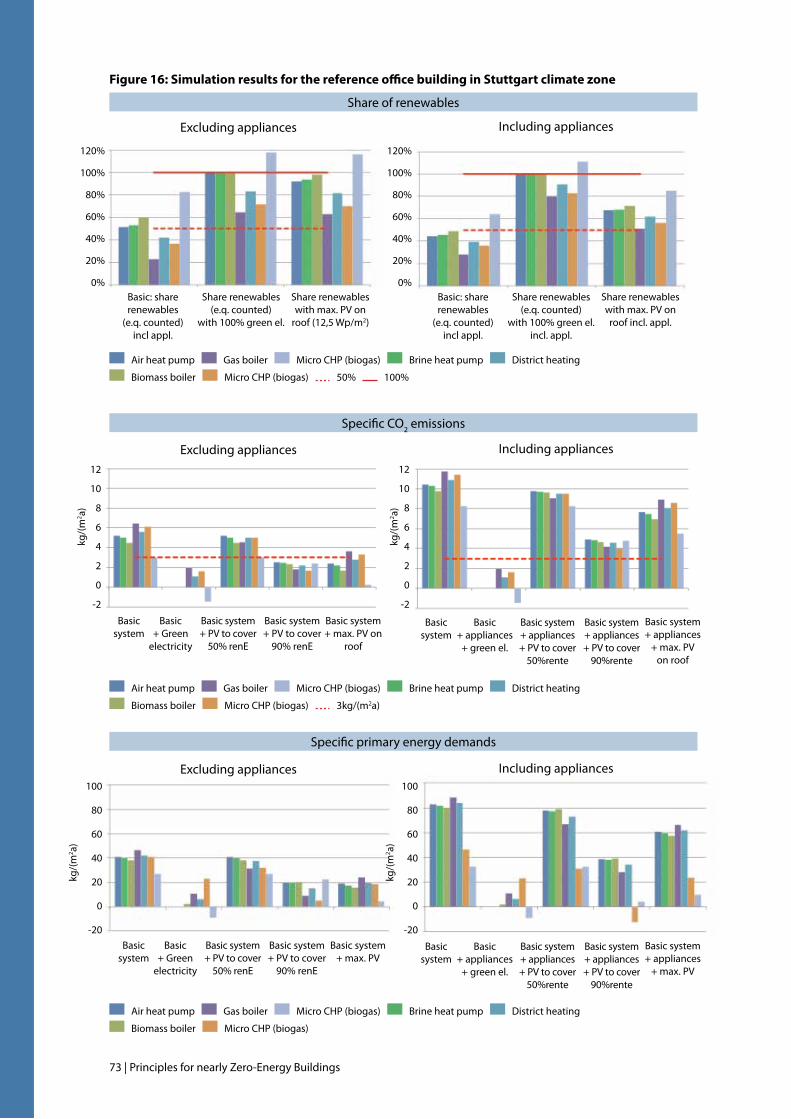
73 | Principles for nearly Zero-Energy Buildings
120%
100%
80%
60%
40%
20%
0%
120%
100%
80%
60%
40%
20%
0%Basic: share renewables
(e.q. counted) incl appl.
Basic: share renewables
(e.q. counted) incl appl.
Share renewables(e.q. counted)
with 100% green el.
Share renewables(e.q. counted)
with 100% green el. incl. appl.
Share renewableswith max. PV on
roof (12,5 Wp/m2)
Share renewableswith max. PV on roof incl. appl.
12
10
8
6
4
2
0
-2
12
10
8
6
4
2
0
-2
kg/(
m2 a)
kg/(
m2 a)
Basic system
Basic+ Green
electricity
Basic system+ PV to cover
50% renE
Basic system+ PV to cover
90% renE
Basic system+ max. PV on
roof
Share of renewables
Specific CO2 emissions
Specific primary energy demands
Air heat pump Gas boiler Micro CHP (biogas) Brine heat pump District heating
Biomass boiler Micro CHP (biogas) 50% 100%
Air heat pump Gas boiler Micro CHP (biogas) Brine heat pump District heating
Biomass boiler Micro CHP (biogas) 3kg/(m2a)
Basic system
Basic+ appliances
+ green el.
Basic system+ appliances + PV to cover
50%rente
Basic system+ appliances + PV to cover
90%rente
Basic system+ appliances
+ max. PV on roof
100
80
60
40
20
0
-20
100
80
60
40
20
0
-20
kg/(
m2 a)
kg/(
m2 a)
Air heat pump Gas boiler Micro CHP (biogas) Brine heat pump District heating
Biomass boiler Micro CHP (biogas)
Basic system
Basic+ appliances
+ green el.
Basic system+ appliances + PV to cover
50%rente
Basic system+ appliances + PV to cover
90%rente
Basic system+ appliances
+ max. PV
Basic system
Basic+ Green
electricity
Basic system+ PV to cover
50% renE
Basic system+ PV to cover
90% renE
Basic system+ max. PV
Excluding appliances Including appliances
Excluding appliances Including appliances
Excluding appliances Including appliances
Figure 16: Simulation results for the reference office building in Stuttgart climate zone
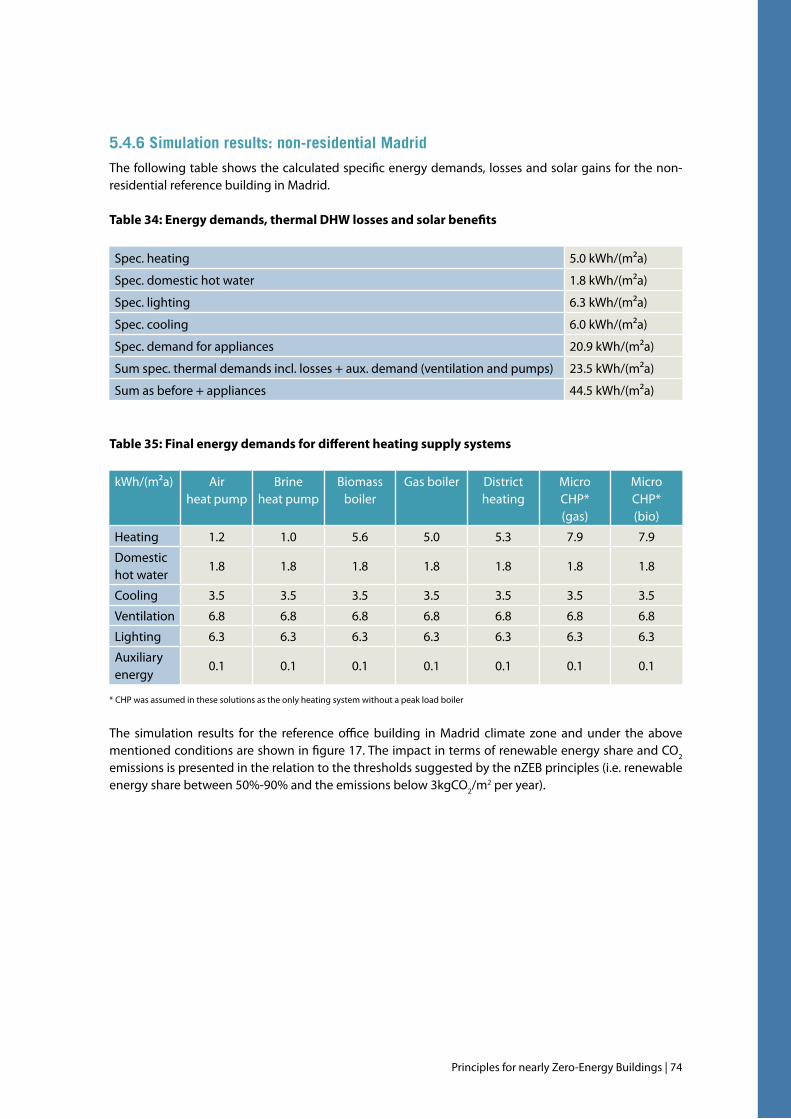
Principles for nearly Zero-Energy Buildings | 74
5.4.6 simulation results: non-residential madrid
The following table shows the calculated specific energy demands, losses and solar gains for the non-residential reference building in Madrid.
Table 34: Energy demands, thermal DHW losses and solar benefits
Spec. heating 5.0 kWh/(m²a)
Spec. domestic hot water 1.8 kWh/(m²a)
Spec. lighting 6.3 kWh/(m²a)
Spec. cooling 6.0 kWh/(m²a)
Spec. demand for appliances 20.9 kWh/(m²a)
Sum spec. thermal demands incl. losses + aux. demand (ventilation and pumps) 23.5 kWh/(m²a)
Sum as before + appliances 44.5 kWh/(m²a)
Table 35: Final energy demands for different heating supply systems
kWh/(m²a) Air heat pump
Brine heat pump
Biomass boiler
Gas boiler Districtheating
Micro CHP* (gas)
Micro CHP* (bio)
Heating 1.2 1.0 5.6 5.0 5.3 7.9 7.9
Domestic hot water
1.8 1.8 1.8 1.8 1.8 1.8 1.8
Cooling 3.5 3.5 3.5 3.5 3.5 3.5 3.5
Ventilation 6.8 6.8 6.8 6.8 6.8 6.8 6.8
Lighting 6.3 6.3 6.3 6.3 6.3 6.3 6.3
Auxiliary energy
0.1 0.1 0.1 0.1 0.1 0.1 0.1
* CHP was assumed in these solutions as the only heating system without a peak load boiler
The simulation results for the reference office building in Madrid climate zone and under the above mentioned conditions are shown in figure 17. The impact in terms of renewable energy share and CO2 emissions is presented in the relation to the thresholds suggested by the nZEB principles (i.e. renewable energy share between 50%-90% and the emissions below 3kgCO2/m2 per year).
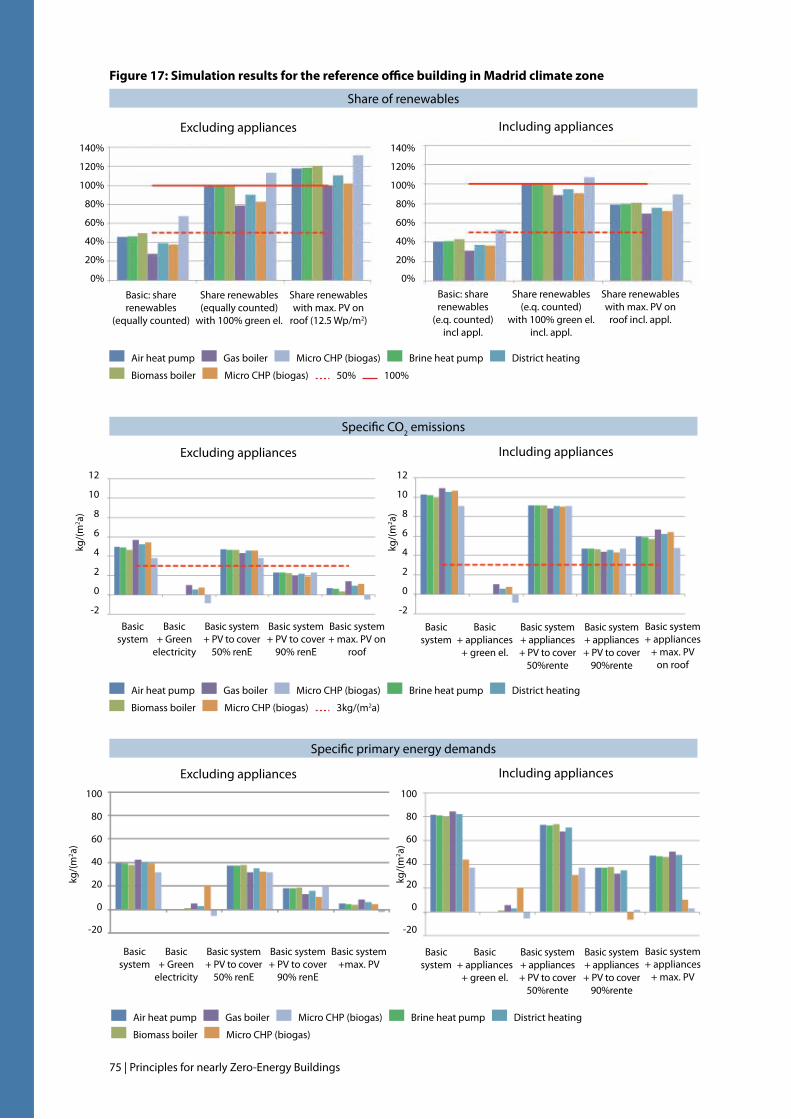
75 | Principles for nearly Zero-Energy Buildings
12
10
8
6
4
2
0
-2
12
10
8
6
4
2
0
-2
kg/(
m2 a)
kg/(
m2 a)
Basic system
Basic+ Green
electricity
Basic system+ PV to cover
50% renE
Basic system+ PV to cover
90% renE
Basic system+ max. PV on
roof
Share of renewables
Specific CO2 emissions
Specific primary energy demands
Air heat pump Gas boiler Micro CHP (biogas) Brine heat pump District heating
Biomass boiler Micro CHP (biogas) 3kg/(m2a)
140%
120%
100%
80%
60%
40%
20%
0%
140%
120%
100%
80%
60%
40%
20%
0%
Basic: share renewables
(equally counted)
Share renewables(equally counted)
with 100% green el.
Share renewableswith max. PV on
roof (12.5 Wp/m2)
Air heat pump Gas boiler Micro CHP (biogas) Brine heat pump District heating
Biomass boiler Micro CHP (biogas) 50% 100%
Basic: share renewables
(e.q. counted) incl appl.
Share renewables(e.q. counted)
with 100% green el. incl. appl.
Share renewableswith max. PV on roof incl. appl.
Basic system
Basic+ appliances
+ green el.
Basic system+ appliances + PV to cover
50%rente
Basic system+ appliances + PV to cover
90%rente
Basic system+ appliances
+ max. PV on roof
100
80
60
40
20
0
-20
100
80
60
40
20
0
-20
kg/(
m2 a)
Basic system
Basic+ Green
electricity
Basic system+ PV to cover
50% renE
Basic system+ PV to cover
90% renE
Basic system+max. PV
kg/(
m2 a)
Air heat pump Gas boiler Micro CHP (biogas) Brine heat pump District heating
Biomass boiler Micro CHP (biogas)
Basic system
Basic+ appliances
+ green el.
Basic system+ appliances + PV to cover
50%rente
Basic system+ appliances + PV to cover
90%rente
Basic system+ appliances
+ max. PV
Excluding appliances Including appliances
Excluding appliances Including appliances
Excluding appliances Including appliances
Figure 17: Simulation results for the reference office building in Madrid climate zone
Principles for nearly Zero-Energy Buildings | 76
5.5 comparative interpretation of the resultsIn this chapter, the conclusions that can be drawn from the results of the calculations at building level related to environmental indicators are described. All variants examined consist of a well-sealed and insulated building shell and a highly efficient ventilation system to insure a very low residual energy demand. With this necessary precondition, specific attention is paid to the items that specific thresholds have been assigned to in the proposed principles for nZEBs, being a share of renewable energy and CO2 (CO2 being important as an indicator for the necessary ambition level, whereas the indicator in national building codes is assumed to be in line with the EPBD primary energy consumption).
5.5.1 renewable energy share in the energy balance
The share of renewable energy was defined in this study as the ratio between the amounts of energy produced by renewable resources and the total energy demand (independent of the type of final energy) of the building. As further described in chapter 5, a reasonable corridor seems to be between 50% and 90% (or 100) %.
Reference building N°1: Single family home (Including a typically sized solar thermal system for domestic hot water).
Main conclusions after the simulation:
• Fossil-firedoptions(gasboiler,gasfiredmicroCHP)eitherdonotorstruggletoreachtheproposedminimum 50% renewable energy share in the building’s energy consumption. A conventional gas boiler system alone will never reach the minimum level of renewable share. The gas micro-CHP system, is slightly below the 50% threshold and may fulfil the proposed requirement by additional import of off-site grid electricity or if complemented by a 2kWp PV system. The fossil fired options fail to reach the 50% threshold energy consumption in the considered energy demand, whether including or excluding the appliances.
• Incoldandwarmclimatezones,thedistrictheating(DH)optionfulfilstherequirementforminimum50% renewable share in the building energy consumption. However, in moderate climate zones the DH option falls short of the threshold. In order to reach the minimum requirement, the DH in the moderate zone should have had CO2 emissions below the one considered for this simulation then the renewable share could be increased accordingly. Another option to fulfil the 50% renewable share is to complement the DH supply with an additional on-site 2kWp PV system.
• Allotheranalysedon-siterenewableoptions(airheatpump,brineheatpump,biomassboiler,biomassfired micro-CHP) exceed the proposed 50% renewables share, even when including the energy consumption of appliances in the considered energy demand.
• Theneedfor100%off-sitegreenelectricityappearsonlyinafewexceptionalcases,i.e.asresultedfromthe simulation for the Madrid site, where there is high electricity demand for cooling, not covered by the on-site gas boiler. The additional import of off-site green electricity together with the on-site gas boiler exceeds the 50% limit. However, the alternative of installing an on-site 2kWp PV system avoids green electricity imports.
• A share of 90% energy from renewable sources (excluding appliances)without further supportingmeasures is clearly achieved by the biomass-fired micro-CHP and just achieved by the biomass boiler. Using 100% green electricity as a further supporting measure, improves all the on-site options and also helps the heat pump solutions reach the 90% target.
• Ifonlyhalfofthedistrictheatingstemsfromrenewablesources(asassumedforthissimulation)thiswill prevent the district heating solution from reaching the 90% target in any of the locations. To reach ahighshareofrenewablesitisnecessaryto‘green’muchmoreofthedistrictheating.
77 | Principles for nearly Zero-Energy Buildings
• Inregionswithahighsolarpotential(e.g.Madridandsimilar),adding2kWpofphotovoltaicsmakesall the on-site options exceed the 90% share. In regions with low solar irradiation (e.g. Stuttgart, Copenhagen and similar) even this measure does not cause the fossil-fired supply options to reach the 90% renewable share. Only the biomass boiler and the biomass fired micro-CHP may reach a 90% renewable share with the support of the additional PV. The district heating option complemented by an additional 2kWp PV system just reaches the 90% renewable threshold in regions with very good solar irradiation (e.g. Madrid).
• Oneambitiousaimofthisdemonstrationistoprovethatitispossibletoreacha90%shareofrenewableenergy while even including appliances in the energy balance of the building. Obviously using 100% off-site green electricity helps to achieve this target. The only situation where even this measure is insufficient in reaching a 90% share is again the situation of choosing the fossil-fired options (i.e. gas boiler, gas micro-CHP and district heating with insufficient renewable share).
General conclusions for the reference building N°1: Single family home
• Even for single-family homeswhere heat has a very high share in the total energy balance of thebuilding, it is possible to achieve a 90% share of renewables only by using a 100% heat supply from biomass fired systems (boiler, CHP).
• Heatpumpsolutionseasilyachievea50%renewableshare.Byusingadditionaloff-sitegreenelectricityor an on-site 2kWp PV system, the heat pump option can secure even a 100% renewable energy share.
• Thedistrictheatingimpactdependslargelyonitsrenewableshare.A50%renewableDHsystemisnotenough in some locations.
• Fossil-fired solutionsare already strugglingwitha renewable shareof 50%.The fossil-fired systemsare not an option when including the energy consumption of appliances in the energy demand and imposing a requirement for a very high share of renewables (90%). A 90% renewable share may be reached by using additional off-site green electricity or, only in regions with very good solar irradiation, by installing an additional 2 kWp PV system.
Reference building N°2: A multi-storey office building
• Onlythebiomassboilerandbiomassfiredmicro-CHPvariantsexceedthe50%shareeasily.Theheatpump solutions are reaching close to the 50% share.
• Duetothehigherrelativeshareofelectricityintheofficebuilding(lighting!),additionalconsiderationof100% green electricity helps all variants exceed the 50% share. The same goes for adding an additional 2 kW of photovoltaics.
• Ifappliancesareincludedintheanalysis,onlythebiomass-firedMicroCHPreachesthe50%shareatall locations. In locations with cold winters, because of the higher relative share of heating energy, the biomass boiler variant also reaches the 50% share. District heating would need a significantly higher share of renewables than assumed for this study (54%) to reach the 50% share.
• A share of 90% energy from renewable sources (excluding appliances)without further supportingmeasures is not achieved by any of the variants. Additional consideration of 100% green electricity helps all variants except the gas boiler, the gas fired micro CHP and district heating solution to reach or exceed the 90% share. An improved district heating solution may also reach a 90% renewable energy share. Adding maximum amounts of PV on the roofs is more effective in very sunny regions than in less sunny regions. Thus in Madrid all variants reach the 90% share.
• A share of 90% energy from renewable sources (including appliances) without further supportingmeasures is not achieved by any of the variants. Additional consideration of using off-site green
Principles for nearly Zero-Energy Buildings | 78
electricity makes all variants except the gas boiler, the gas-fired micro CHP and district heating exceed the 90% share. An improved district heating solution may also reach a 90% renewable energy share. Due to space restrictions, adding maximum PV on the roof is less effective. None of the variants reaches the 90% share.
General conclusions for the reference building N°2: A multi-story office building
• Inofficebuildings,biomassandheatpumpsolutionsreacha50%shareofrenewables.
• Officebuildingshaveahigherrelativeshareofelectricitythanresidentialbuildings.Thereforegreenelectricity is very advantageous for all variants – except the fossil-fired variants - to reach a 90% share, usually even including appliances. Due to usual space restrictions, adding PV is less effective.
5.5.2 co2 emissions
In order to make sure that climate targets are met by buildings, the maximum allowable CO2 emissions of an nZEB should be as low as possible (below 3kgCO2/(m²yr), see chapter 5).
Reference building N°1: Single family home
• With thebasicvariants (excludingappliances,greenelectricityandPV)all fossil-firedsolutions (gasboiler, micro CHP and district heating with a small renewable share) are generally clearly above the limit of 3 kg/(m2yr). Heat pump solutions come close and bio solutions (biomass boiler, bio micro CHP) clearly stay below that limit.
• Using green off-site electricity significantly decreases CO2 emissions. Still the fossil-fired solutions generally fail the target, except at locations with very little heating and DHW demand (Madrid). Taking the appliances into account does not change the conclusion above.
• Addingon-sitePVimprovesthesituation.Thefossilsolutionsarestillbelowthe3kg/(m2yr) limit as a small PV (to achieve 90%) renewable share is considered.
• Includingelectricitydemandforappliances,theon-sitePVelectricityproductionapproachonlystaysbelow the limit when it is assumed to be implemented to a maximum extent and in combination with a biomass Micro CHP. An easier solution is to use green electricity, although this alone is not enough for the fossil heat generation solutions.
Reference building N°2: A multi-storey office building
• Withthebasicvariants(excludingappliances,greenelectricityandPV)allsolutionsexceptthebiomassmicro CHP exceed the limit of 3 kg/(m2yr).
• Usingoff-site green electricity significantly decreasesCO2 emissions. Because of the relatively high share of electricity in office buildings all related variants stay below 3 kg/(m2yr). Including the electricity demand of the appliances does not generally change this result.
• AddingPVismuchlesseffectivethaninthecaseofsingle-familyhouse.SpecificCO2 emissions below 3 kg/(m2yr) may be achieved, only without appliances, assuming an appropriate amount of additional on-site PV. In some cases (especially fossil heating systems in less sunny places) even this may not be possible.
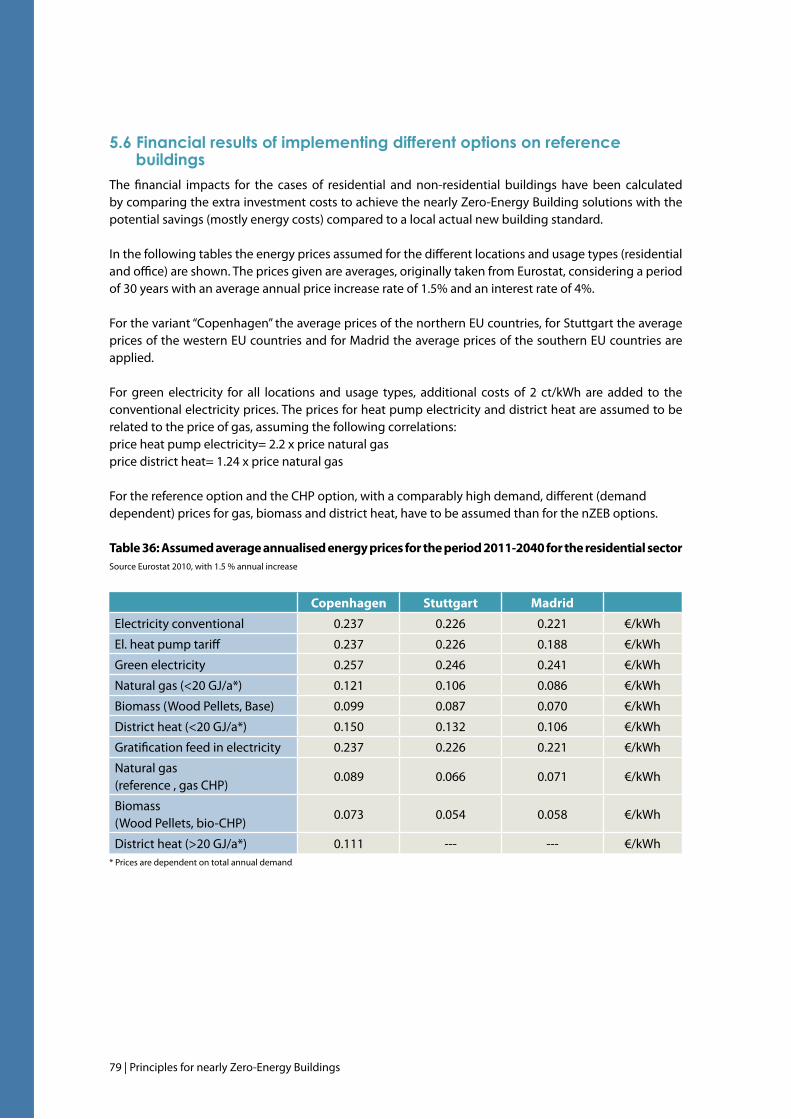
79 | Principles for nearly Zero-Energy Buildings
5.6 financial results of implementing different options on reference buildings
The financial impacts for the cases of residential and non-residential buildings have been calculated by comparing the extra investment costs to achieve the nearly Zero-Energy Building solutions with the potential savings (mostly energy costs) compared to a local actual new building standard.
In the following tables the energy prices assumed for the different locations and usage types (residential and office) are shown. The prices given are averages, originally taken from Eurostat, considering a period of 30 years with an average annual price increase rate of 1.5% and an interest rate of 4%.
For the variant “Copenhagen” the average prices of the northern EU countries, for Stuttgart the average prices of the western EU countries and for Madrid the average prices of the southern EU countries are applied.
For green electricity for all locations and usage types, additional costs of 2 ct/kWh are added to the conventional electricity prices. The prices for heat pump electricity and district heat are assumed to be related to the price of gas, assuming the following correlations: price heat pump electricity= 2.2 x price natural gasprice district heat= 1.24 x price natural gas
For the reference option and the CHP option, with a comparably high demand, different (demanddependent) prices for gas, biomass and district heat, have to be assumed than for the nZEB options.
Table 36: Assumed average annualised energy prices for the period 2011-2040 for the residential sector Source Eurostat 2010, with 1.5 % annual increase
Copenhagen Stuttgart Madrid
Electricity conventional 0.237 0.226 0.221 €/kWh
El. heat pump tariff 0.237 0.226 0.188 €/kWh
Green electricity 0.257 0.246 0.241 €/kWh
Natural gas (<20 GJ/a*) 0.121 0.106 0.086 €/kWh
Biomass (Wood Pellets, Base) 0.099 0.087 0.070 €/kWh
District heat (<20 GJ/a*) 0.150 0.132 0.106 €/kWh
Gratification feed in electricity 0.237 0.226 0.221 €/kWh
Natural gas (reference , gas CHP)
0.089 0.066 0.071 €/kWh
Biomass (Wood Pellets, bio-CHP)
0.073 0.054 0.058 €/kWh
District heat (>20 GJ/a*) 0.111 --- --- €/kWh* Prices are dependent on total annual demand
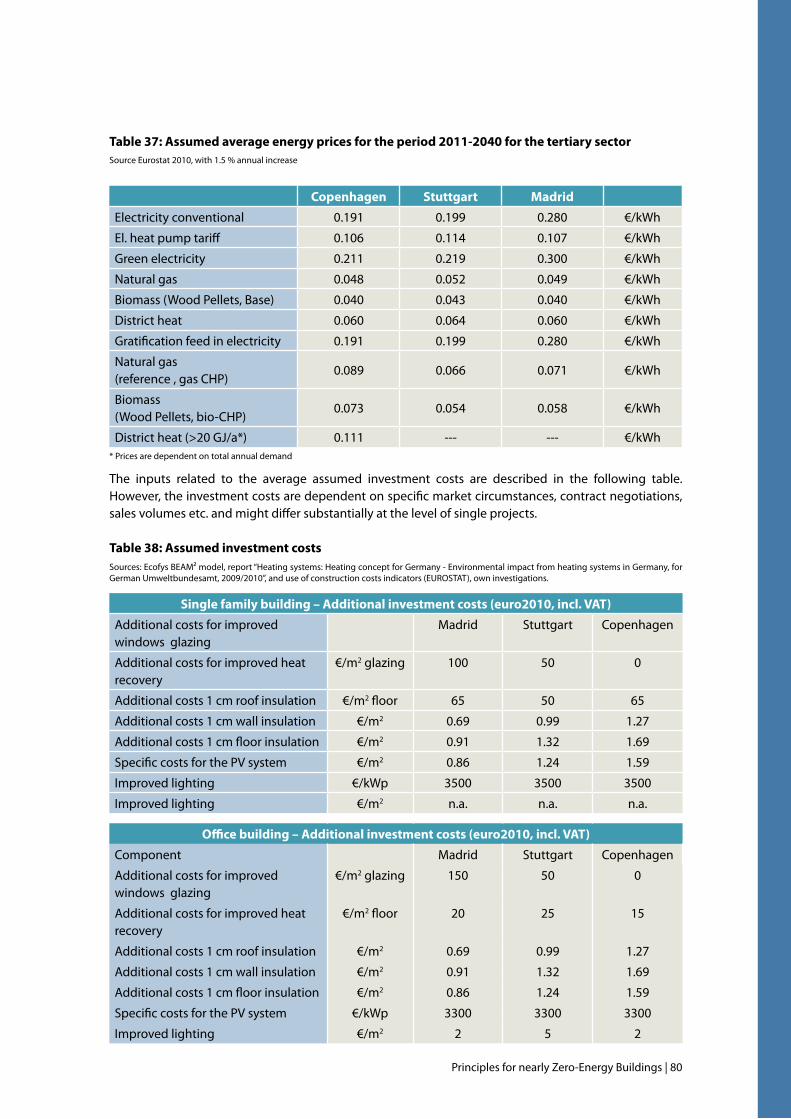
Principles for nearly Zero-Energy Buildings | 80
Table 37: Assumed average energy prices for the period 2011-2040 for the tertiary sectorSource Eurostat 2010, with 1.5 % annual increase
Copenhagen Stuttgart Madrid
Electricity conventional 0.191 0.199 0.280 €/kWh
El. heat pump tariff 0.106 0.114 0.107 €/kWh
Green electricity 0.211 0.219 0.300 €/kWh
Natural gas 0.048 0.052 0.049 €/kWh
Biomass (Wood Pellets, Base) 0.040 0.043 0.040 €/kWh
District heat 0.060 0.064 0.060 €/kWh
Gratification feed in electricity 0.191 0.199 0.280 €/kWh
Natural gas (reference , gas CHP)
0.089 0.066 0.071 €/kWh
Biomass (Wood Pellets, bio-CHP)
0.073 0.054 0.058 €/kWh
District heat (>20 GJ/a*) 0.111 --- --- €/kWh* Prices are dependent on total annual demand
The inputs related to the average assumed investment costs are described in the following table. However, the investment costs are dependent on specific market circumstances, contract negotiations, sales volumes etc. and might differ substantially at the level of single projects.
Table 38: Assumed investment costsSources: Ecofys BEAM² model, report “Heating systems: Heating concept for Germany - Environmental impact from heating systems in Germany, for German Umweltbundesamt, 2009/2010”, and use of construction costs indicators (EUROSTAT), own investigations.
Single family building – Additional investment costs (euro2010, incl. VAT)
Additional costs for improved windows glazing
Madrid Stuttgart Copenhagen
Additional costs for improved heat recovery
€/m2 glazing 100 50 0
Additional costs 1 cm roof insulation €/m2 floor 65 50 65
Additional costs 1 cm wall insulation €/m2 0.69 0.99 1.27
Additional costs 1 cm floor insulation €/m2 0.91 1.32 1.69
Specific costs for the PV system €/m2 0.86 1.24 1.59
Improved lighting €/kWp 3500 3500 3500
Improved lighting €/m2 n.a. n.a. n.a.
Office building – Additional investment costs (euro2010, incl. VAT)
Component Madrid Stuttgart Copenhagen
Additional costs for improved windows glazing
€/m2 glazing 150 50 0
Additional costs for improved heat recovery
€/m2 floor 20 25 15
Additional costs 1 cm roof insulation €/m2 0.69 0.99 1.27
Additional costs 1 cm wall insulation €/m2 0.91 1.32 1.69
Additional costs 1 cm floor insulation €/m2 0.86 1.24 1.59
Specific costs for the PV system €/kWp 3300 3300 3300
Improved lighting €/m2 2 5 2
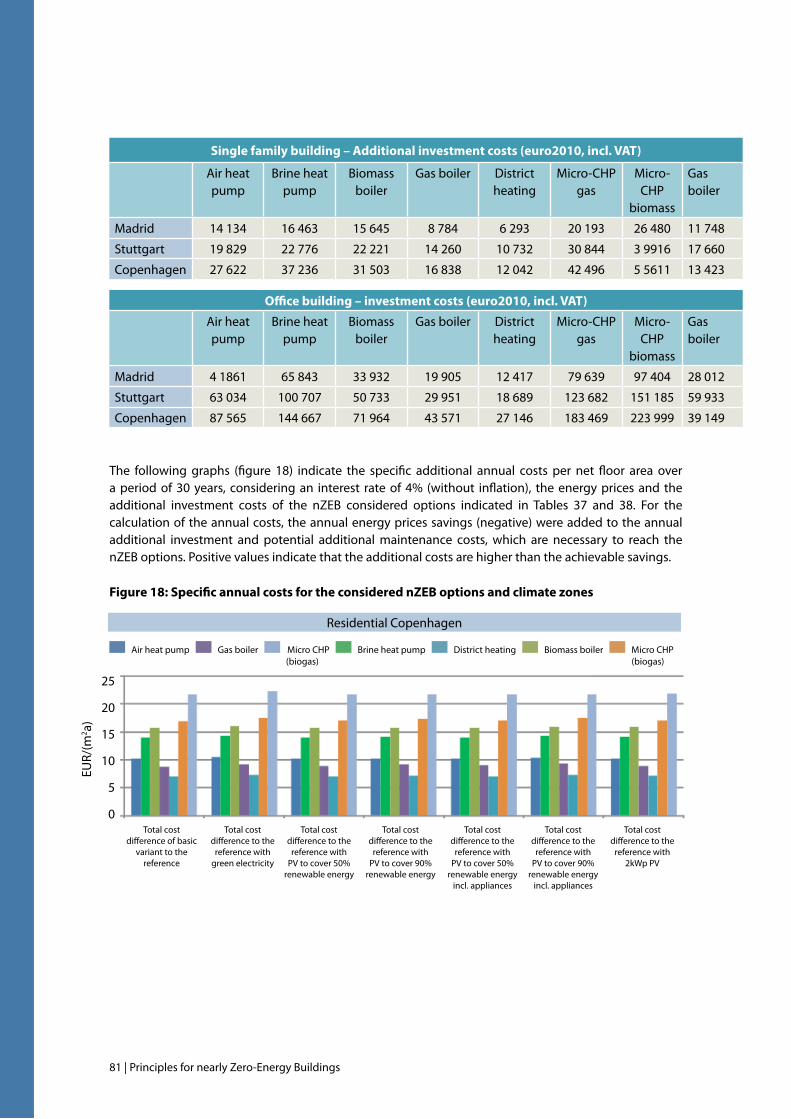
81 | Principles for nearly Zero-Energy Buildings
Single family building – Additional investment costs (euro2010, incl. VAT)
Air heat pump
Brine heat pump
Biomass boiler
Gas boiler District heating
Micro-CHP gas
Micro-CHP
biomass
Gas boiler
Madrid 14 134 16 463 15 645 8 784 6 293 20 193 26 480 11 748
Stuttgart 19 829 22 776 22 221 14 260 10 732 30 844 3 9916 17 660
Copenhagen 27 622 37 236 31 503 16 838 12 042 42 496 5 5611 13 423
Office building – investment costs (euro2010, incl. VAT)
Air heat pump
Brine heat pump
Biomass boiler
Gas boiler District heating
Micro-CHP gas
Micro-CHP
biomass
Gas boiler
Madrid 4 1861 65 843 33 932 19 905 12 417 79 639 97 404 28 012
Stuttgart 63 034 100 707 50 733 29 951 18 689 123 682 151 185 59 933
Copenhagen 87 565 144 667 71 964 43 571 27 146 183 469 223 999 39 149
The following graphs (figure 18) indicate the specific additional annual costs per net floor area over a period of 30 years, considering an interest rate of 4% (without inflation), the energy prices and the additional investment costs of the nZEB considered options indicated in Tables 37 and 38. For the calculation of the annual costs, the annual energy prices savings (negative) were added to the annual additional investment and potential additional maintenance costs, which are necessary to reach the nZEB options. Positive values indicate that the additional costs are higher than the achievable savings.
Residential Copenhagen
25
20
15
10
5
0
EUR/
(m2 a)
Total cost difference of basic
variant to the reference
Total cost difference to the
reference with green electricity
Total cost difference to the
reference with PV to cover 50%
renewable energy
Total cost difference to the
reference with 2kWp PV
Total cost difference to the
reference with PV to cover 90%
renewable energy
Total cost difference to the
reference with PV to cover 50%
renewable energy incl. appliances
Total cost difference to the
reference with PV to cover 90%
renewable energy incl. appliances
Air heat pump Gas boiler Micro CHP Brine heat pump District heating Biomass boiler Micro CHP (biogas) (biogas)
Figure 18: Specific annual costs for the considered nZEB options and climate zones
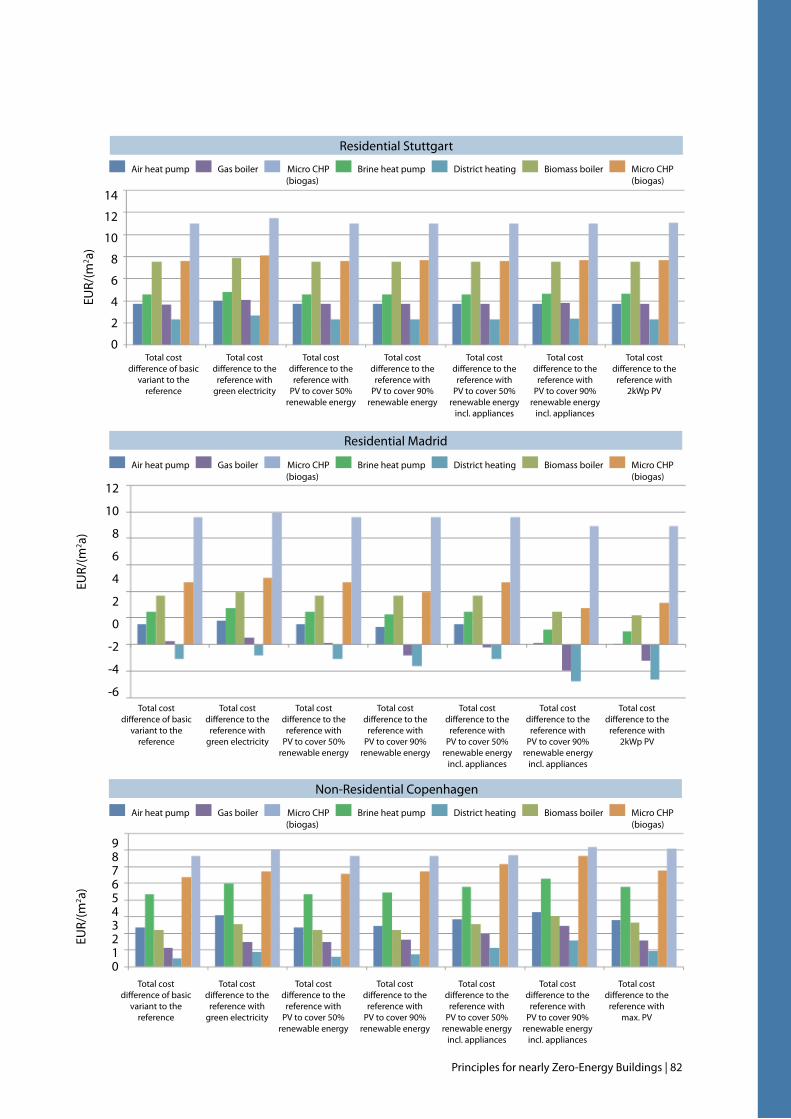
Principles for nearly Zero-Energy Buildings | 82
Residential Stuttgart
EUR/
(m2 a)
Total cost difference of basic
variant to the reference
Total cost difference to the
reference with green electricity
Total cost difference to the
reference with PV to cover 50%
renewable energy
Total cost difference to the
reference with 2kWp PV
Total cost difference to the
reference with PV to cover 90%
renewable energy
Total cost difference to the
reference with PV to cover 50%
renewable energy incl. appliances
Total cost difference to the
reference with PV to cover 90%
renewable energy incl. appliances
14
12
10
8
6
4
2
0
Residential Madrid
EUR/
(m2 a)
Total cost difference of basic
variant to the reference
Total cost difference to the
reference with green electricity
Total cost difference to the
reference with PV to cover 50%
renewable energy
Total cost difference to the
reference with 2kWp PV
Total cost difference to the
reference with PV to cover 90%
renewable energy
Total cost difference to the
reference with PV to cover 50%
renewable energy incl. appliances
Total cost difference to the
reference with PV to cover 90%
renewable energy incl. appliances
12
10
8
6
4
2
0
-2
-4
-6
Non-Residential Copenhagen
EUR/
(m2 a)
Total cost difference of basic
variant to the reference
Total cost difference to the
reference with green electricity
Total cost difference to the
reference with PV to cover 50%
renewable energy
Total cost difference to the
reference with max. PV
Total cost difference to the
reference with PV to cover 90%
renewable energy
Total cost difference to the
reference with PV to cover 50%
renewable energy incl. appliances
Total cost difference to the
reference with PV to cover 90%
renewable energy incl. appliances
9876543210
Air heat pump Gas boiler Micro CHP Brine heat pump District heating Biomass boiler Micro CHP (biogas) (biogas)
Air heat pump Gas boiler Micro CHP Brine heat pump District heating Biomass boiler Micro CHP (biogas) (biogas)
Air heat pump Gas boiler Micro CHP Brine heat pump District heating Biomass boiler Micro CHP (biogas) (biogas)
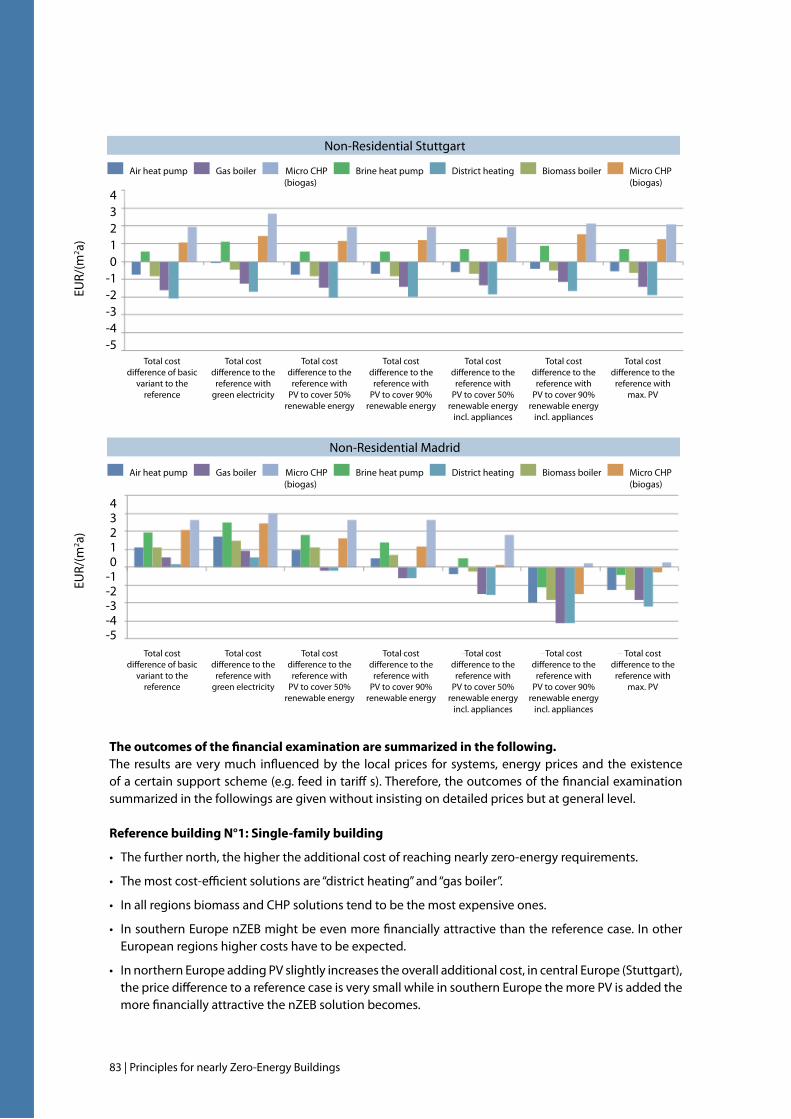
83 | Principles for nearly Zero-Energy Buildings
The outcomes of the financial examination are summarized in the following.The results are very much influenced by the local prices for systems, energy prices and the existence of a certain support scheme (e.g. feed in tariff s). Therefore, the outcomes of the financial examination summarized in the followings are given without insisting on detailed prices but at general level.
Reference building N°1: Single-family building
• Thefurthernorth,thehighertheadditionalcostofreachingnearlyzero-energyrequirements.
• Themostcost-efficientsolutionsare“districtheating”and“gasboiler”.
• InallregionsbiomassandCHPsolutionstendtobethemostexpensiveones.
• InsouthernEuropenZEBmightbeevenmorefinanciallyattractivethanthereferencecase.InotherEuropean regions higher costs have to be expected.
• InnorthernEuropeaddingPVslightlyincreasestheoveralladditionalcost,incentralEurope(Stuttgart),the price difference to a reference case is very small while in southern Europe the more PV is added the more financially attractive the nZEB solution becomes.
Non-Residential Stuttgart
Non-Residential Madrid
EUR/
(m2 a)
EUR/
(m2 a)
Total cost difference of basic
variant to the reference
Total cost difference of basic
variant to the reference
Total cost difference to the
reference with green electricity
Total cost difference to the
reference with green electricity
Total cost difference to the
reference with PV to cover 50%
renewable energy
Total cost difference to the
reference with PV to cover 50%
renewable energy
Total cost difference to the
reference with max. PV
Total cost difference to the
reference with max. PV
Total cost difference to the
reference with PV to cover 90%
renewable energy
Total cost difference to the
reference with PV to cover 90%
renewable energy
Total cost difference to the
reference with PV to cover 50%
renewable energy incl. appliances
Total cost difference to the
reference with PV to cover 50%
renewable energy incl. appliances
Total cost difference to the
reference with PV to cover 90%
renewable energy incl. appliances
Total cost difference to the
reference with PV to cover 90%
renewable energy incl. appliances
43210
-1-2-3-4-5
43210
-1-2-3-4-5
Air heat pump Gas boiler Micro CHP Brine heat pump District heating Biomass boiler Micro CHP (biogas) (biogas)
Air heat pump Gas boiler Micro CHP Brine heat pump District heating Biomass boiler Micro CHP (biogas) (biogas)

Principles for nearly Zero-Energy Buildings | 84
Reference building N°2: Multi-storey office building
• Pricedifferencesbetweensolutionsaresmallerthanforaresidentialsingle-familyhouse.Theabsoluteadditional cost to achieve nZEB is significantly smaller than for a residential single-family house.
• CHPsolutionstendtobemostexpensive.
• EspeciallyinsouthernbutalsoincentralEurope,nZEBmightbeevenmorefinanciallyattractivethanthe reference case. In northern Europe higher costs have to be expected.
• InnorthernEuropeaddingPVincreasestheoveralladditionalcost, incentralEurope(Stuttgart),theprice difference to a reference case is very small while in southern Europe the more PV is added the more financially attractive the nZEB solution becomes.
85 | Principles for nearly Zero-Energy Buildings
6 tecHnological, financial and Policy imPlications at eu level
While a definition of nearly Zero-Energy Buildings needs to deliver the framework for successful implementation of the related principles at building level, any final definition of nearly Zero-Energy Buildings needs to and will also have implications at EU level.This last part of the study therefore intends to analyse the actual status and implications of moving towards nZEB levels from the technical, financial and political point of view.
6.1 technologies and resourcesApplicable solutions, limitations and development needsThe simulations have shown that a new-built nearly Zero-Energy Building standard based on the suggested principles and findings from this study (allowing compensation for renewable energy produced on-site or green electricity) is achievable with existing technologies. The assumptions used in the simulations provided, especially very ambitious aims, like a share of renewable energies of minimum 90% or specific CO2 emissions close to zero or at least significantly below 3 kg CO2/(m²yr) lead to the need for compensating measures such as green electricity or PV. Fossil fuel based technologies are not consistent with those ambitious definitions. All-electric solutions (heat pumps) seem to be the most suitable, because of the continuous, “automatic” improvement due to the expected greening of grid electricity and the possibility of direct compensation by electricity produced on-site. Especially (micro) bio CHPs have shown very good results. This technology needs further development. Big potential is also evident in district heating systems with higher shares of renewable energy than assumed in the simulations.
A further improvement of the thermal building skin insulation can be expected by establishing new materials such as vacuum technology (opaque and transparent parts). The efficiency of actual high efficient heat pumps and compression chillers, fans and pumps is already very close to the theoretical achievable optimum. Solutions such as deep geothermal energy or seasonal solar storages, which are still far away from being standard cost-effective solutions, are not indispensible for achieving nearly zero- energy requirements. Nevertheless they may for example play a role in boosting the renewable share of district heating or cooling systems. In particular, further developments (leading to a price decrease and an efficiency increase) at decentralised renewable energy productions systems such as PV systems would be very advantageous for nearly Zero-Energy Buildings. This also would help achieve a similar standard in major renovations, where no (heat) grids are in place that could be used for efficient distribution of renewable heat on a larger scale.
Barriers regarding availability of systems, resources, and know-howPossible barriers to the availability of systems and resources may be a market that is not able to satisfy the increasing demand for new technologies. A comparison between the actual market and the demand in the case that all new buildings were built according to nZEB principles gives an initial idea about how much the actual market would have to grow in order to satisfy the increased demand. Actual market data for
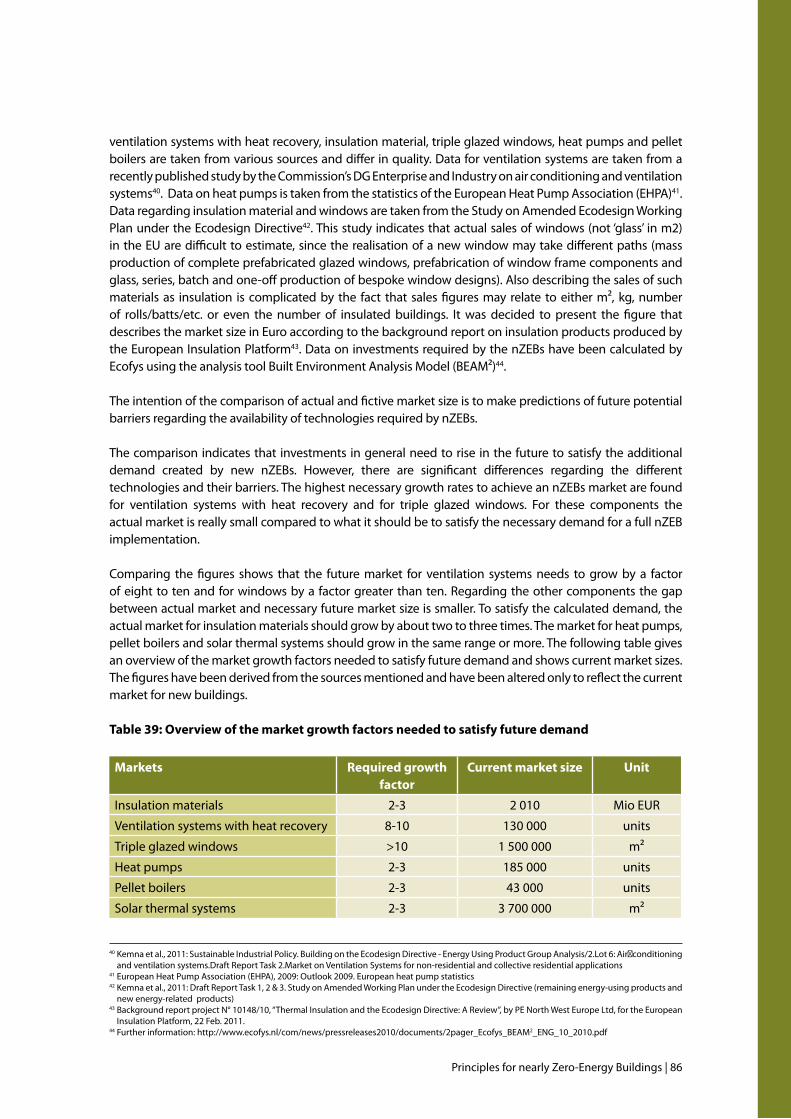
Principles for nearly Zero-Energy Buildings | 86
ventilation systems with heat recovery, insulation material, triple glazed windows, heat pumps and pellet boilers are taken from various sources and differ in quality. Data for ventilation systems are taken from a recently published study by the Commission’s DG Enterprise and Industry on air conditioning and ventilation systems40. Data on heat pumps is taken from the statistics of the European Heat Pump Association (EHPA)41. Data regarding insulation material and windows are taken from the Study on Amended Ecodesign Working Plan under the Ecodesign Directive42.Thisstudyindicatesthatactualsalesofwindows(not‘glass’ inm2)in the EU are difficult to estimate, since the realisation of a new window may take different paths (mass production of complete prefabricated glazed windows, prefabrication of window frame components and glass, series, batch and one-off production of bespoke window designs). Also describing the sales of such materials as insulation is complicated by the fact that sales figures may relate to either m², kg, number of rolls/batts/etc. or even the number of insulated buildings. It was decided to present the figure that describes the market size in Euro according to the background report on insulation products produced by the European Insulation Platform43. Data on investments required by the nZEBs have been calculated by Ecofys using the analysis tool Built Environment Analysis Model (BEAM²)44.
The intention of the comparison of actual and fictive market size is to make predictions of future potential barriers regarding the availability of technologies required by nZEBs.
The comparison indicates that investments in general need to rise in the future to satisfy the additional demand created by new nZEBs. However, there are significant differences regarding the different technologies and their barriers. The highest necessary growth rates to achieve an nZEBs market are found for ventilation systems with heat recovery and for triple glazed windows. For these components the actual market is really small compared to what it should be to satisfy the necessary demand for a full nZEB implementation.
Comparing the figures shows that the future market for ventilation systems needs to grow by a factor of eight to ten and for windows by a factor greater than ten. Regarding the other components the gap between actual market and necessary future market size is smaller. To satisfy the calculated demand, the actual market for insulation materials should grow by about two to three times. The market for heat pumps, pellet boilers and solar thermal systems should grow in the same range or more. The following table gives an overview of the market growth factors needed to satisfy future demand and shows current market sizes. The figures have been derived from the sources mentioned and have been altered only to reflect the current market for new buildings.
Table 39: Overview of the market growth factors needed to satisfy future demand
Markets Required growth factor
Current market size Unit
Insulation materials 2-3 2 010 Mio EUR
Ventilation systems with heat recovery 8-10 130 000 units
Triple glazed windows >10 1 500 000 m²
Heat pumps 2-3 185 000 units
Pellet boilers 2-3 43 000 units
Solar thermal systems 2-3 3 700 000 m²
40 Kemna et al., 2011: Sustainable Industrial Policy. Building on the Ecodesign Directive - Energy Using Product Group Analysis/2.Lot 6: Air‐conditioning and ventilation systems.Draft Report Task 2.Market on Ventilation Systems for non-residential and collective residential applications
41 European Heat Pump Association (EHPA), 2009: Outlook 2009. European heat pump statistics 42 Kemna et al., 2011: Draft Report Task 1, 2 & 3. Study on Amended Working Plan under the Ecodesign Directive (remaining energy-using products and
new energy-related products)43 Background report project N° 10148/10, “Thermal Insulation and the Ecodesign Directive: A Review”, by PE North West Europe Ltd, for the European
Insulation Platform, 22 Feb. 2011.44 Further information: http://www.ecofys.nl/com/news/pressreleases2010/documents/2pager_Ecofys_BEAM2_ENG_10_2010.pdf
87 | Principles for nearly Zero-Energy Buildings
Apart from market barriers, barriers regarding the know-how of professionals also exist. To date, one percent of all new buildings in Germany are built according to the passive house standard, therefore it can be assumed that at EU level the percentage is smaller than one percent. The factor by which that should increase is therefore bigger than 100. A question that arises is whether the number of architects and installers that are able to deal with new technologies and standards will (have to) increase to satisfy the demand or not. In the EU there are about 1,500 certified passive house planners45 and 35 passive house certifiers46. In the next few years, there will be about 2.0 million residential and non-residential buildings newly built per year in the EU47. Depending on the size of the project an expert can manage various projectsperyear;howeverthegapisaconsiderablebarriertoimplementingthenZEBrequirementsforallnewbuildingsinthenearfuture.TechnicallyeveryarchitectshouldbeabletobuildannZEB;howeverin practice that requires keeping up with standards and requirements that have to be fulfilled to build at nZEB levels.
Training programs could overcome this barrier. A good example is the EU project Training for Rebuilding Europe that shows that a large number of professionals, property owners and local authorities can be trained on the process for retrofitting buildings. This project provides training for retrofitting buildings andforimplementingnZEBatEUlevel;howeveritshowshowtrainingpeopleatEUlevelmaywork.Theproject is based on an analysis of the training initiatives and toolkits already existing at European and national level in this field and aims at their practical deployment at pan-European level. In a two year phase, 10,000 professionals have been trained and a toolkit, divided into four modules (policy, finance, technologies and project implementation and citizen awareness-raising)48 has been developed.
Successful implementation of nearly Zero-Energy Buildings will also need technology transfer within the EU. This especially relates to technologies to reduce heating demand (technology transfer needed from northern/western Europe to southern and eastern Europe) and regarding technologies to reduce cooling demand.
6.2 financial impacts at eu levelThe turnover of the EU’s building industry for non-residential and residential buildings in 2009 was about EUR 1 trillion, about half of that amount (EUR 470 billion ) is due to new buildings49. Based on the market studies citied in chapter (7.1.) actual investments in new buildings for heat pumps, pellet heating systems, ventilation systems with heat recovery, triple glazed windows and insulation materials on EU level are estimated to reach about EUR 23 billion (in 2009, during the financial crisis with relatively low new building activities). To implement nZEB requirements for every new building the investments are estimated to reach about EUR 62 billion per year50. These EUR 39 billion would represent an overall increase of about 9%, being a considerable growth that seems achievable when taking place over the years up until 2020 (approx. 1% increase per year).
6.3 legal feasibilityLink to general EU policies and targetsThe definition of nearly Zero-Energy Buildings needs (beyond delivering a method that complies with the EPBD text) to also fit with general and cross sectoral targets, of which the conservation of energy and related reductions of (political and financial) dependencies, climate protection and job creation/relief of social system, are especially connected to activities in the building sector.The concept described for nearly Zero-Energy Buildings clearly fits with the target of lowering energy demands. The connection to climate protection is especially evident as the concept has been shaped around a maximum allowable CO2 emission (< 3 kgCO2/m²yr).
45Passivhausplaner,accessed:09.08.2011;http://www.passivhausplaner.eu/index.html46 Passive House Institute 2011. Certifier’s Almanac. A collection of information for building certifiers. Internal document.47 Euroconstruct (2010). 70th Euroconstruct Country Book. 48Trainrebuild(2010):TrainingforRebuildingEurope,accessed:10.08.2011;http://trainrebuild.eu/49 Euroconstruct (2010). 70th Euroconstruct Country Book. 50 The necessary investment has been calculated with the BEAM² model from Ecofys. Further information: http://www.ecofys.nl/com/news/
pressreleases2010/documents/2pager_Ecofys_BEAM2_ENG_10_2010.pdf
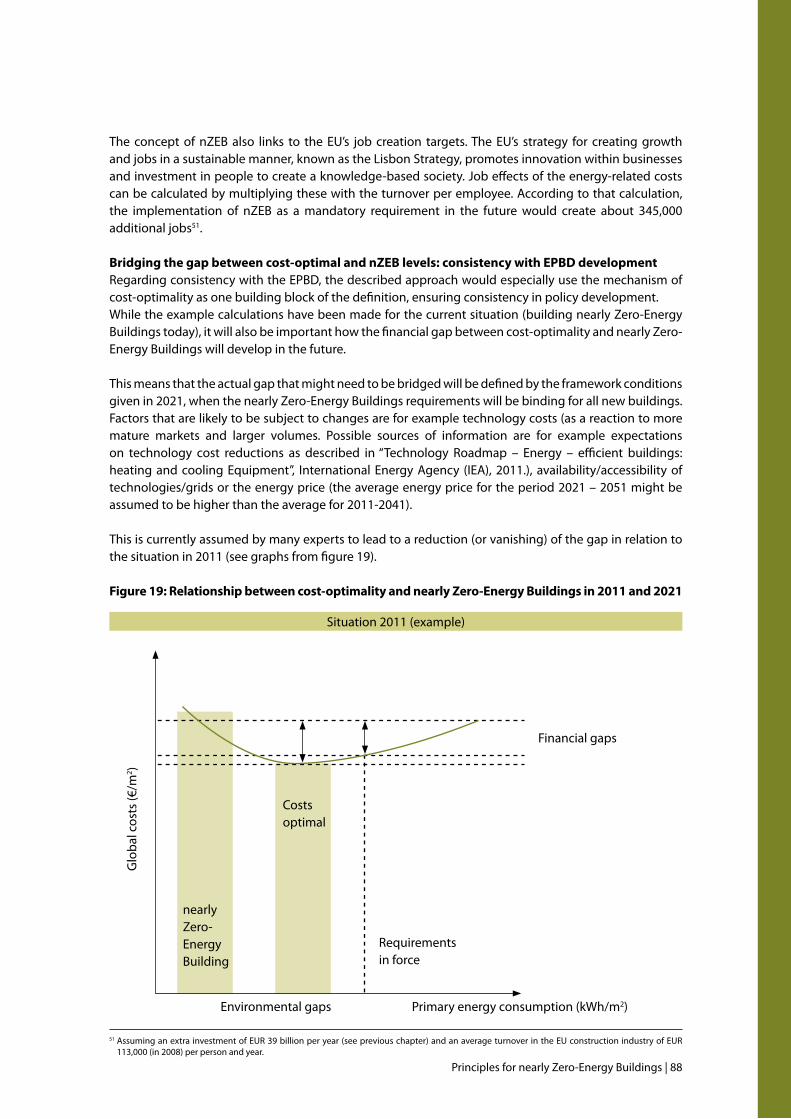
Principles for nearly Zero-Energy Buildings | 88
The concept of nZEB also links to the EU’s job creation targets. The EU’s strategy for creating growth and jobs in a sustainable manner, known as the Lisbon Strategy, promotes innovation within businesses and investment in people to create a knowledge-based society. Job effects of the energy-related costs can be calculated by multiplying these with the turnover per employee. According to that calculation, the implementation of nZEB as a mandatory requirement in the future would create about 345,000 additional jobs51.
Bridging the gap between cost-optimal and nZEB levels: consistency with EPBD developmentRegarding consistency with the EPBD, the described approach would especially use the mechanism of cost-optimality as one building block of the definition, ensuring consistency in policy development.While the example calculations have been made for the current situation (building nearly Zero-Energy Buildings today), it will also be important how the financial gap between cost-optimality and nearly Zero-Energy Buildings will develop in the future.
This means that the actual gap that might need to be bridged will be defined by the framework conditions given in 2021, when the nearly Zero-Energy Buildings requirements will be binding for all new buildings. Factors that are likely to be subject to changes are for example technology costs (as a reaction to more mature markets and larger volumes. Possible sources of information are for example expectations on technology cost reductions as described in “Technology Roadmap – Energy – efficient buildings: heating and cooling Equipment”, International Energy Agency (IEA), 2011.), availability/accessibility of technologies/grids or the energy price (the average energy price for the period 2021 – 2051 might be assumed to be higher than the average for 2011-2041).
This is currently assumed by many experts to lead to a reduction (or vanishing) of the gap in relation to the situation in 2011 (see graphs from figure 19).
Figure 19: Relationship between cost-optimality and nearly Zero-Energy Buildings in 2011 and 2021
Glo
bal c
osts
(€/m
2 )
Costsoptimal
Requirementsin force
Environmental gaps Primary energy consumption (kWh/m2)
Financial gaps
Situation 2011 (example)
nearly Zero-Energy Building
51 Assuming an extra investment of EUR 39 billion per year (see previous chapter) and an average turnover in the EU construction industry of EUR 113,000 (in 2008) per person and year.
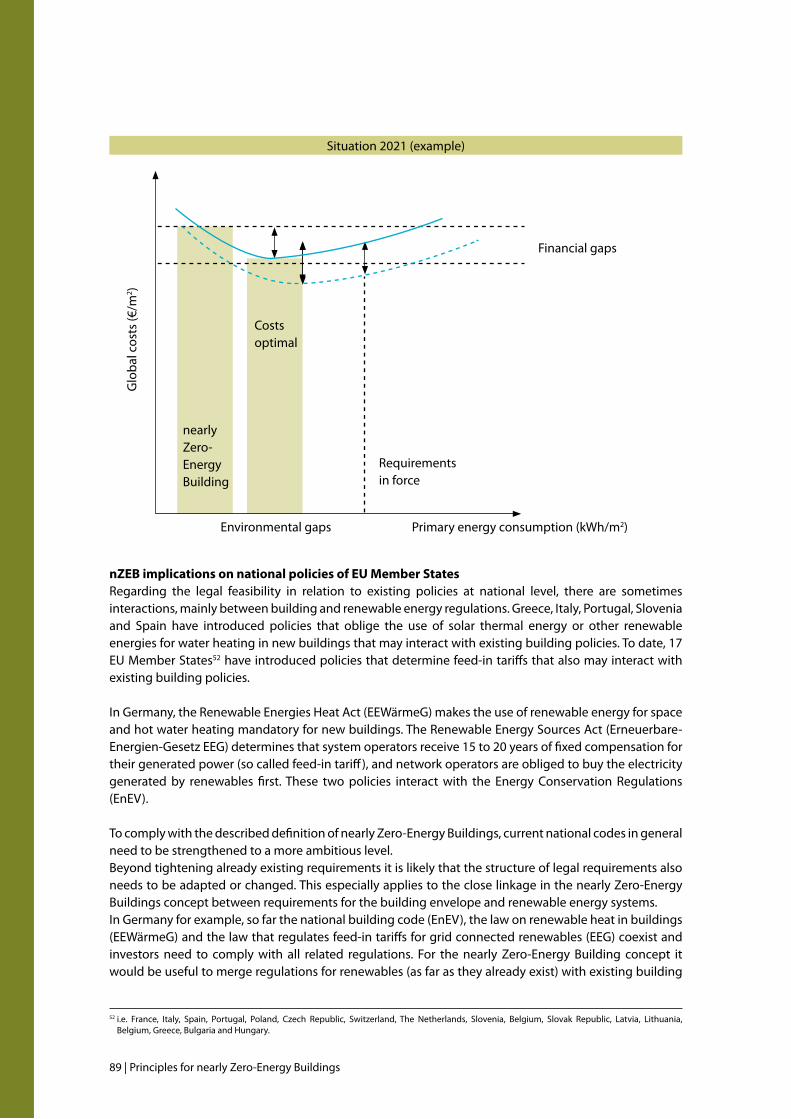
89 | Principles for nearly Zero-Energy Buildings
nZEB implications on national policies of EU Member States Regarding the legal feasibility in relation to existing policies at national level, there are sometimes interactions, mainly between building and renewable energy regulations. Greece, Italy, Portugal, Slovenia and Spain have introduced policies that oblige the use of solar thermal energy or other renewable energies for water heating in new buildings that may interact with existing building policies. To date, 17 EU Member States52 have introduced policies that determine feed-in tariffs that also may interact with existing building policies.
In Germany, the Renewable Energies Heat Act (EEWärmeG) makes the use of renewable energy for space and hot water heating mandatory for new buildings. The Renewable Energy Sources Act (Erneuerbare-Energien-Gesetz EEG) determines that system operators receive 15 to 20 years of fixed compensation for their generated power (so called feed-in tariff), and network operators are obliged to buy the electricity generated by renewables first. These two policies interact with the Energy Conservation Regulations (EnEV).
To comply with the described definition of nearly Zero-Energy Buildings, current national codes in general need to be strengthened to a more ambitious level.Beyond tightening already existing requirements it is likely that the structure of legal requirements also needs to be adapted or changed. This especially applies to the close linkage in the nearly Zero-Energy Buildings concept between requirements for the building envelope and renewable energy systems.In Germany for example, so far the national building code (EnEV), the law on renewable heat in buildings (EEWärmeG) and the law that regulates feed-in tariffs for grid connected renewables (EEG) coexist and investors need to comply with all related regulations. For the nearly Zero-Energy Building concept it would be useful to merge regulations for renewables (as far as they already exist) with existing building
Glo
bal c
osts
(€/m
2 )
Costsoptimal
Requirementsin force
Environmental gaps Primary energy consumption (kWh/m2)
Financial gaps
Situation 2021 (example)
nearly Zero-Energy Building
52 i.e. France, Italy, Spain, Portugal, Poland, Czech Republic, Switzerland, The Netherlands, Slovenia, Belgium, Slovak Republic, Latvia, Lithuania, Belgium, Greece, Bulgaria and Hungary.
Principles for nearly Zero-Energy Buildings | 90
regulations or to broaden the scope of regulations more towards renewables where this has not already happened.
In Denmark the current legislation will not present any direct barriers concerning the adoption of a nearly Zero-Energy Building definition as described above. There will be a need for a revision of the Building Regulations especially concerning the introduction of direct requirements concerning RES and also in respect to the specific definitions of “energy need” or “energy demand”. The existing Danish Building Regulations, including the intermediate target defined as Low Energy Building 2020, is well tuned to both the nZEB definition in general but also with regard to the ambition levels concerning energy use and RES share.
Integration of nZEBs into sustainability concepts for citiesThe effect of local situations on the energy demand and supply of buildings, especially on new buildings, is quite high. The share of passive solar gains, for example for passive houses, can vary by around 25% depending on the orientation and the shadowing of the building facades. This is why increased solar gains can be regarded as a crucial contribution to the heat supply of a building providing heat free of charge and without any technical setups. However, for planning passive houses or even nZEBs, greater consideration of passive solar energy is essential.
Also important for the energy supply of an urban agglomeration is its density and the characteristics of its urban structure. Considering the increased efficiency of central energy supply systems, this can be only understood within optimised urban structures providing sufficient energy demand per land unit. With respect to the very low energy demand of nZEBs the density of district heat qualified structures need to be high.
To further support the implementation of nZEBs, local utilities could also play an important role providing renewable energy - heat and power – to the tenants of nZEBs.
The amount of renewable energy provided by a distribution network can guarantee compliance with the nearly zero-energy requirements for new buildings with less options to generate renewable energy within the threshold of the building itself due to its position in the urban environment or its dedicated use. To encourage the integration of nZEBs at a local level a “quota regulation” in favour of renewable energies for district heat and power could be an option.
Hence, smart cities should provide an applicable energy system qualified for the needs of the future energy standards to ease the introduction of nZEBs.
Furthermore the energy related optimisation of urban structures needs to be part of the energy or sustainability concept for European cities. The knowledge about the potential of this optimisation needs to be spread among the stakeholder of the planning process and the parties in charge of energy supply. To ensure the eligibility of newly developed urban structures for nZEBs, European cities have to take the effects of the urban fabric into account. The perspective of a traditional design-based approach has to change towards a more integrated approach, which also includes energy related aspects. It is time to recognise that this does not contradict with high level urban planning.
As a result, not only the building level needs to be considered. The urban level should also be prepared to ensure its imminent qualification for low or zero-energy.
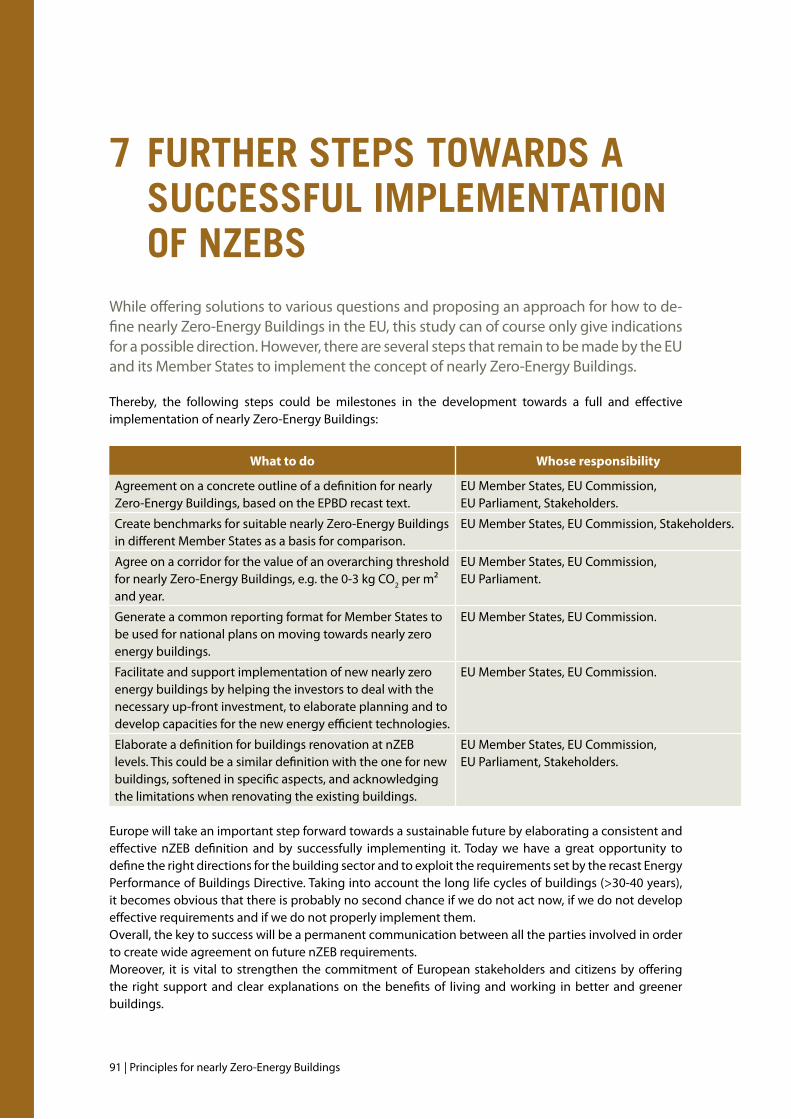
91 | Principles for nearly Zero-Energy Buildings
7 furtHer stePs towards a successful imPlementation of nZeBs
While offering solutions to various questions and proposing an approach for how to de-fine nearly Zero-Energy Buildings in the EU, this study can of course only give indications for a possible direction. However, there are several steps that remain to be made by the EU and its Member States to implement the concept of nearly Zero-Energy Buildings.
Thereby, the following steps could be milestones in the development towards a full and effective implementation of nearly Zero-Energy Buildings:
What to do Whose responsibility
Agreement on a concrete outline of a definition for nearly Zero-Energy Buildings, based on the EPBD recast text.
EU Member States, EU Commission, EU Parliament, Stakeholders.
Create benchmarks for suitable nearly Zero-Energy Buildings in different Member States as a basis for comparison.
EU Member States, EU Commission, Stakeholders.
Agree on a corridor for the value of an overarching threshold for nearly Zero-Energy Buildings, e.g. the 0-3 kg CO2 per m² and year.
EU Member States, EU Commission, EU Parliament.
Generate a common reporting format for Member States to be used for national plans on moving towards nearly zero energy buildings.
EU Member States, EU Commission.
Facilitate and support implementation of new nearly zero energy buildings by helping the investors to deal with the necessary up-front investment, to elaborate planning and to develop capacities for the new energy efficient technologies.
EU Member States, EU Commission.
Elaborate a definition for buildings renovation at nZEB levels. This could be a similar definition with the one for new buildings, softened in specific aspects, and acknowledging the limitations when renovating the existing buildings.
EU Member States, EU Commission, EU Parliament, Stakeholders.
Europe will take an important step forward towards a sustainable future by elaborating a consistent and effective nZEB definition and by successfully implementing it. Today we have a great opportunity to define the right directions for the building sector and to exploit the requirements set by the recast Energy Performance of Buildings Directive. Taking into account the long life cycles of buildings (>30-40 years), it becomes obvious that there is probably no second chance if we do not act now, if we do not develop effective requirements and if we do not properly implement them. Overall, the key to success will be a permanent communication between all the parties involved in order to create wide agreement on future nZEB requirements. Moreover, it is vital to strengthen the commitment of European stakeholders and citizens by offering the right support and clear explanations on the benefits of living and working in better and greener buildings.
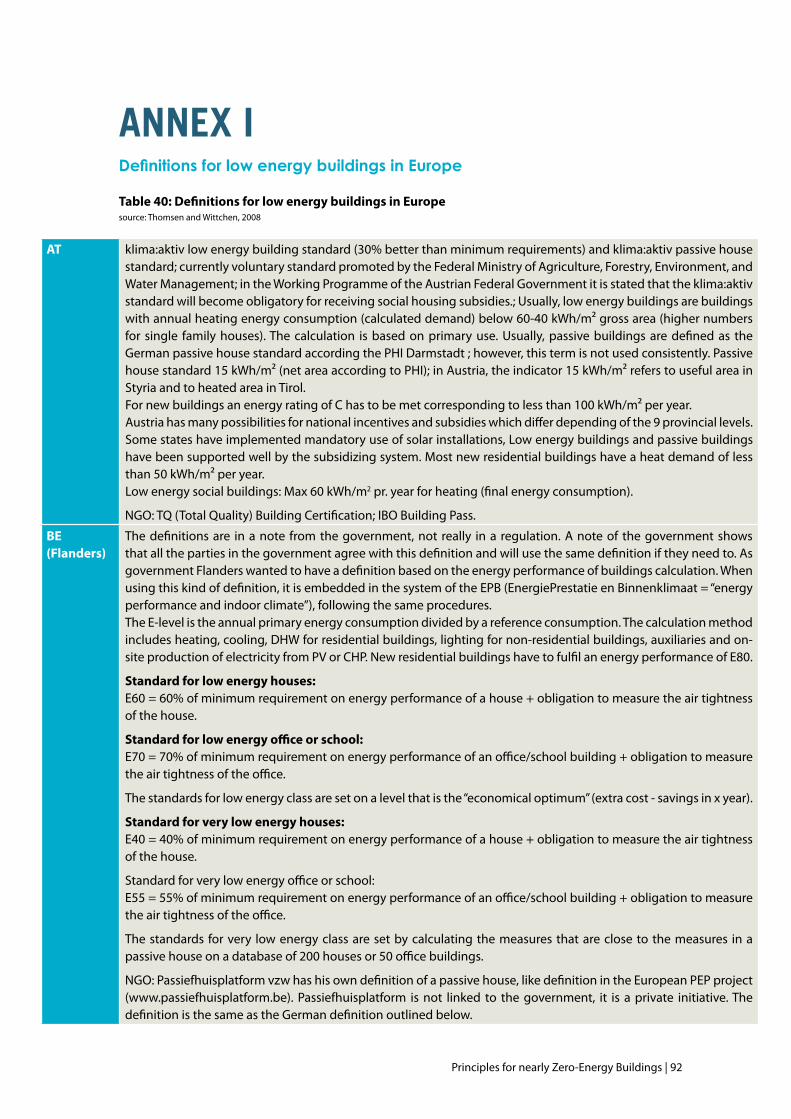
Principles for nearly Zero-Energy Buildings | 92
annex iDefinitions for low energy buildings in Europe
Table 40: Definitions for low energy buildings in Europesource: Thomsen and Wittchen, 2008
AT klima:aktiv low energy building standard (30% better than minimum requirements) and klima:aktiv passive house standard;currentlyvoluntarystandardpromotedbytheFederalMinistryofAgriculture,Forestry,Environment,andWaterManagement;intheWorkingProgrammeoftheAustrianFederalGovernmentitisstatedthattheklima:aktivstandardwillbecomeobligatoryforreceivingsocialhousingsubsidies.;Usually,lowenergybuildingsarebuildingswith annual heating energy consumption (calculated demand) below 60-40 kWh/m² gross area (higher numbers for single family houses). The calculation is based on primary use. Usually, passive buildings are defined as the GermanpassivehousestandardaccordingthePHIDarmstadt;however,thistermisnotusedconsistently.Passivehousestandard15kWh/m²(netareaaccordingtoPHI);inAustria,theindicator15kWh/m²referstousefulareainStyria and to heated area in Tirol. For new buildings an energy rating of C has to be met corresponding to less than 100 kWh/m² per year.Austria has many possibilities for national incentives and subsidies which differ depending of the 9 provincial levels. Some states have implemented mandatory use of solar installations, Low energy buildings and passive buildings have been supported well by the subsidizing system. Most new residential buildings have a heat demand of less than 50 kWh/m² per year.Low energy social buildings: Max 60 kWh/m2 pr. year for heating (final energy consumption).
NGO:TQ(TotalQuality)BuildingCertification;IBOBuildingPass.
BE(Flanders)
The definitions are in a note from the government, not really in a regulation. A note of the government shows that all the parties in the government agree with this definition and will use the same definition if they need to. As government Flanders wanted to have a definition based on the energy performance of buildings calculation. When using this kind of definition, it is embedded in the system of the EPB (EnergiePrestatie en Binnenklimaat = “energy performance and indoor climate”), following the same procedures. The E-level is the annual primary energy consumption divided by a reference consumption. The calculation method includes heating, cooling, DHW for residential buildings, lighting for non-residential buildings, auxiliaries and on-site production of electricity from PV or CHP. New residential buildings have to fulfil an energy performance of E80.
Standard for low energy houses:E60 = 60% of minimum requirement on energy performance of a house + obligation to measure the air tightness of the house.
Standard for low energy office or school:E70 = 70% of minimum requirement on energy performance of an office/school building + obligation to measure the air tightness of the office.
The standards for low energy class are set on a level that is the “economical optimum” (extra cost - savings in x year).
Standard for very low energy houses:E40 = 40% of minimum requirement on energy performance of a house + obligation to measure the air tightness of the house.
Standard for very low energy office or school:E55 = 55% of minimum requirement on energy performance of an office/school building + obligation to measure the air tightness of the office.
The standards for very low energy class are set by calculating the measures that are close to the measures in a passive house on a database of 200 houses or 50 office buildings.
NGO: Passiefhuisplatform vzw has his own definition of a passive house, like definition in the European PEP project (www.passiefhuisplatform.be). Passiefhuisplatform is not linked to the government, it is a private initiative. The definition is the same as the German definition outlined below.
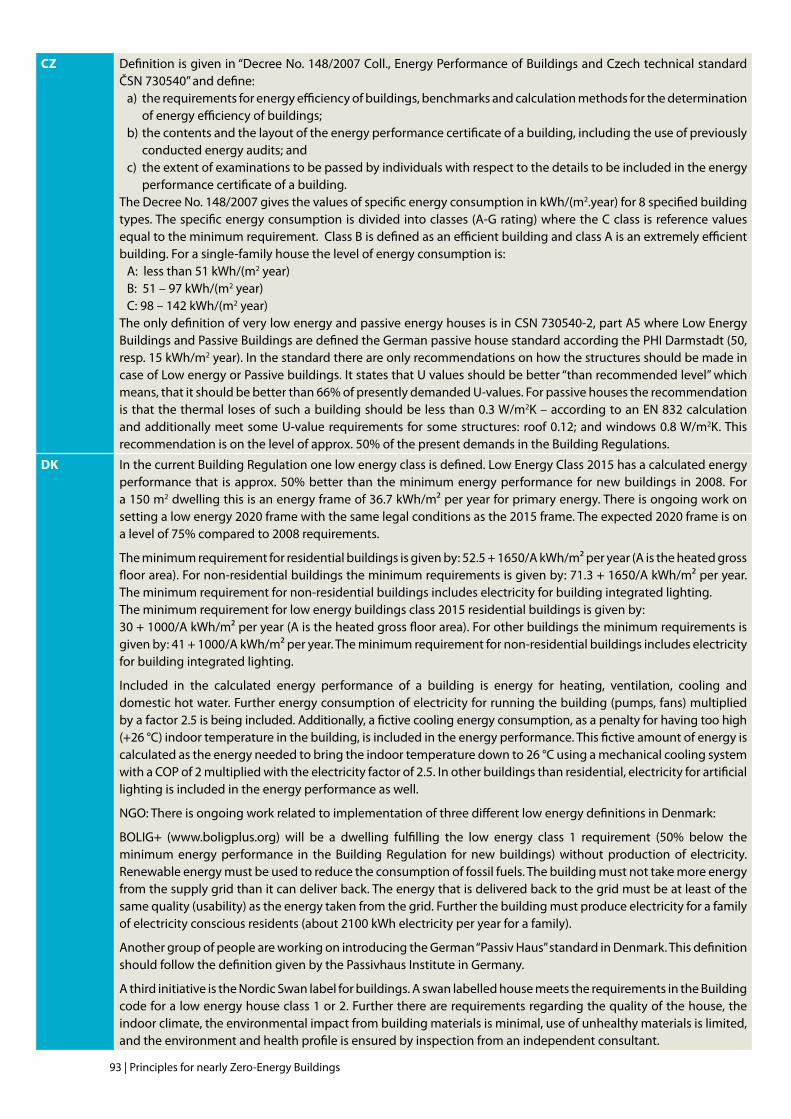
93 | Principles for nearly Zero-Energy Buildings
CZ Definition is given in “Decree No. 148/2007 Coll., Energy Performance of Buildings and Czech technical standard ČSN 730540” and define:
a) the requirements for energy efficiency of buildings, benchmarks and calculation methods for the determination ofenergyefficiencyofbuildings;
b) the contents and the layout of the energy performance certificate of a building, including the use of previously conductedenergyaudits;and
c) the extent of examinations to be passed by individuals with respect to the details to be included in the energy performance certificate of a building.
The Decree No. 148/2007 gives the values of specific energy consumption in kWh/(m2.year) for 8 specified building types. The specific energy consumption is divided into classes (A-G rating) where the C class is reference values equal to the minimum requirement. Class B is defined as an efficient building and class A is an extremely efficient building. For a single-family house the level of energy consumption is:
A: less than 51 kWh/(m2 year)B: 51 – 97 kWh/(m2 year)C: 98 – 142 kWh/(m2 year)
The only definition of very low energy and passive energy houses is in CSN 730540-2, part A5 where Low Energy Buildings and Passive Buildings are defined the German passive house standard according the PHI Darmstadt (50, resp. 15 kWh/m2 year). In the standard there are only recommendations on how the structures should be made in case of Low energy or Passive buildings. It states that U values should be better “than recommended level” which means, that it should be better than 66% of presently demanded U-values. For passive houses the recommendation is that the thermal loses of such a building should be less than 0.3 W/m2K – according to an EN 832 calculation andadditionallymeetsomeU-valuerequirements forsomestructures: roof0.12;andwindows0.8W/m2K. This recommendation is on the level of approx. 50% of the present demands in the Building Regulations.
DK In the current Building Regulation one low energy class is defined. Low Energy Class 2015 has a calculated energy performance that is approx. 50% better than the minimum energy performance for new buildings in 2008. For a 150 m2 dwelling this is an energy frame of 36.7 kWh/m² per year for primary energy. There is ongoing work on setting a low energy 2020 frame with the same legal conditions as the 2015 frame. The expected 2020 frame is on a level of 75% compared to 2008 requirements.
The minimum requirement for residential buildings is given by: 52.5 + 1650/A kWh/m² per year (A is the heated gross floor area). For non-residential buildings the minimum requirements is given by: 71.3 + 1650/A kWh/m² per year. The minimum requirement for non-residential buildings includes electricity for building integrated lighting. The minimum requirement for low energy buildings class 2015 residential buildings is given by: 30 + 1000/A kWh/m² per year (A is the heated gross floor area). For other buildings the minimum requirements is given by: 41 + 1000/A kWh/m² per year. The minimum requirement for non-residential buildings includes electricity for building integrated lighting.
Included in the calculated energy performance of a building is energy for heating, ventilation, cooling and domestic hot water. Further energy consumption of electricity for running the building (pumps, fans) multiplied by a factor 2.5 is being included. Additionally, a fictive cooling energy consumption, as a penalty for having too high (+26 °C) indoor temperature in the building, is included in the energy performance. This fictive amount of energy is calculated as the energy needed to bring the indoor temperature down to 26 °C using a mechanical cooling system with a COP of 2 multiplied with the electricity factor of 2.5. In other buildings than residential, electricity for artificial lighting is included in the energy performance as well.
NGO: There is ongoing work related to implementation of three different low energy definitions in Denmark:
BOLIG+ (www.boligplus.org) will be a dwelling fulfilling the low energy class 1 requirement (50% below the minimum energy performance in the Building Regulation for new buildings) without production of electricity. Renewable energy must be used to reduce the consumption of fossil fuels. The building must not take more energy from the supply grid than it can deliver back. The energy that is delivered back to the grid must be at least of the same quality (usability) as the energy taken from the grid. Further the building must produce electricity for a family of electricity conscious residents (about 2100 kWh electricity per year for a family).
Another group of people are working on introducing the German “Passiv Haus” standard in Denmark. This definition should follow the definition given by the Passivhaus Institute in Germany.
A third initiative is the Nordic Swan label for buildings. A swan labelled house meets the requirements in the Building code for a low energy house class 1 or 2. Further there are requirements regarding the quality of the house, the indoor climate, the environmental impact from building materials is minimal, use of unhealthy materials is limited, and the environment and health profile is ensured by inspection from an independent consultant.
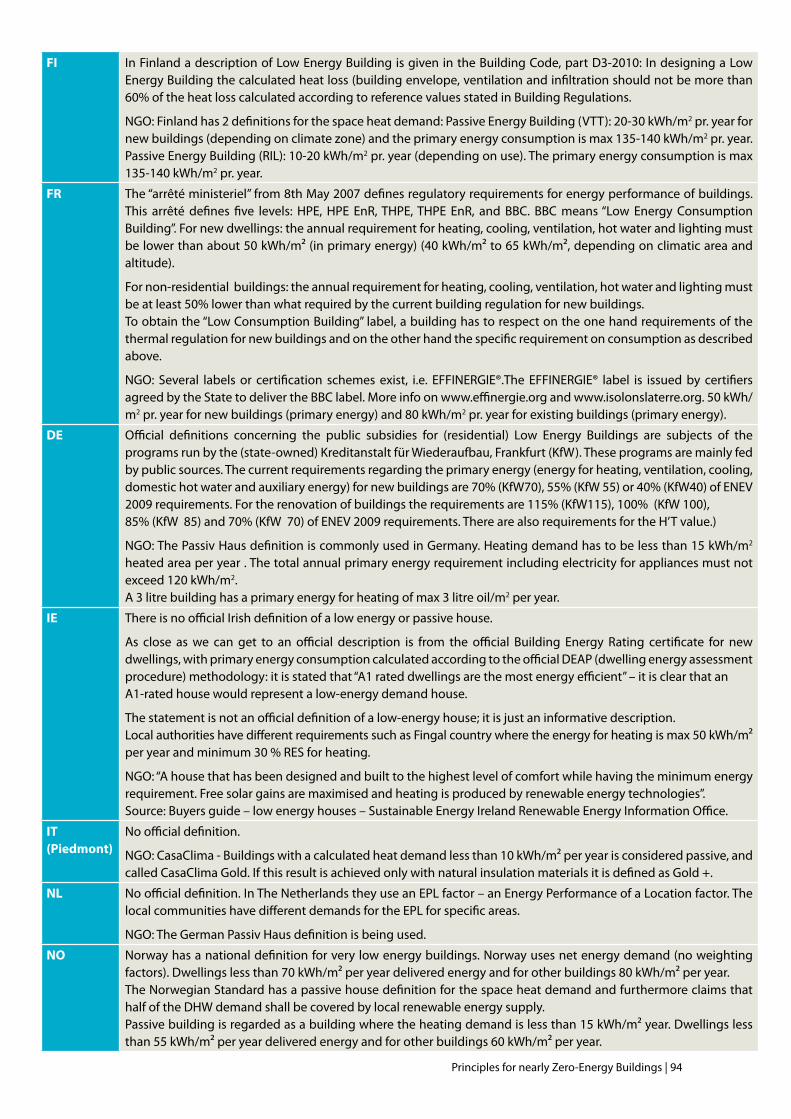
Principles for nearly Zero-Energy Buildings | 94
CZ Definition is given in “Decree No. 148/2007 Coll., Energy Performance of Buildings and Czech technical standard ČSN 730540” and define:
a) the requirements for energy efficiency of buildings, benchmarks and calculation methods for the determination ofenergyefficiencyofbuildings;
b) the contents and the layout of the energy performance certificate of a building, including the use of previously conductedenergyaudits;and
c) the extent of examinations to be passed by individuals with respect to the details to be included in the energy performance certificate of a building.
The Decree No. 148/2007 gives the values of specific energy consumption in kWh/(m2.year) for 8 specified building types. The specific energy consumption is divided into classes (A-G rating) where the C class is reference values equal to the minimum requirement. Class B is defined as an efficient building and class A is an extremely efficient building. For a single-family house the level of energy consumption is:
A: less than 51 kWh/(m2 year)B: 51 – 97 kWh/(m2 year)C: 98 – 142 kWh/(m2 year)
The only definition of very low energy and passive energy houses is in CSN 730540-2, part A5 where Low Energy Buildings and Passive Buildings are defined the German passive house standard according the PHI Darmstadt (50, resp. 15 kWh/m2 year). In the standard there are only recommendations on how the structures should be made in case of Low energy or Passive buildings. It states that U values should be better “than recommended level” which means, that it should be better than 66% of presently demanded U-values. For passive houses the recommendation is that the thermal loses of such a building should be less than 0.3 W/m2K – according to an EN 832 calculation andadditionallymeetsomeU-valuerequirements forsomestructures: roof0.12;andwindows0.8W/m2K. This recommendation is on the level of approx. 50% of the present demands in the Building Regulations.
DK In the current Building Regulation one low energy class is defined. Low Energy Class 2015 has a calculated energy performance that is approx. 50% better than the minimum energy performance for new buildings in 2008. For a 150 m2 dwelling this is an energy frame of 36.7 kWh/m² per year for primary energy. There is ongoing work on setting a low energy 2020 frame with the same legal conditions as the 2015 frame. The expected 2020 frame is on a level of 75% compared to 2008 requirements.
The minimum requirement for residential buildings is given by: 52.5 + 1650/A kWh/m² per year (A is the heated gross floor area). For non-residential buildings the minimum requirements is given by: 71.3 + 1650/A kWh/m² per year. The minimum requirement for non-residential buildings includes electricity for building integrated lighting. The minimum requirement for low energy buildings class 2015 residential buildings is given by: 30 + 1000/A kWh/m² per year (A is the heated gross floor area). For other buildings the minimum requirements is given by: 41 + 1000/A kWh/m² per year. The minimum requirement for non-residential buildings includes electricity for building integrated lighting.
Included in the calculated energy performance of a building is energy for heating, ventilation, cooling and domestic hot water. Further energy consumption of electricity for running the building (pumps, fans) multiplied by a factor 2.5 is being included. Additionally, a fictive cooling energy consumption, as a penalty for having too high (+26 °C) indoor temperature in the building, is included in the energy performance. This fictive amount of energy is calculated as the energy needed to bring the indoor temperature down to 26 °C using a mechanical cooling system with a COP of 2 multiplied with the electricity factor of 2.5. In other buildings than residential, electricity for artificial lighting is included in the energy performance as well.
NGO: There is ongoing work related to implementation of three different low energy definitions in Denmark:
BOLIG+ (www.boligplus.org) will be a dwelling fulfilling the low energy class 1 requirement (50% below the minimum energy performance in the Building Regulation for new buildings) without production of electricity. Renewable energy must be used to reduce the consumption of fossil fuels. The building must not take more energy from the supply grid than it can deliver back. The energy that is delivered back to the grid must be at least of the same quality (usability) as the energy taken from the grid. Further the building must produce electricity for a family of electricity conscious residents (about 2100 kWh electricity per year for a family).
Another group of people are working on introducing the German “Passiv Haus” standard in Denmark. This definition should follow the definition given by the Passivhaus Institute in Germany.
A third initiative is the Nordic Swan label for buildings. A swan labelled house meets the requirements in the Building code for a low energy house class 1 or 2. Further there are requirements regarding the quality of the house, the indoor climate, the environmental impact from building materials is minimal, use of unhealthy materials is limited, and the environment and health profile is ensured by inspection from an independent consultant.
FI In Finland a description of Low Energy Building is given in the Building Code, part D3-2010: In designing a Low Energy Building the calculated heat loss (building envelope, ventilation and infiltration should not be more than 60% of the heat loss calculated according to reference values stated in Building Regulations.
NGO: Finland has 2 definitions for the space heat demand: Passive Energy Building (VTT): 20-30 kWh/m2 pr. year for new buildings (depending on climate zone) and the primary energy consumption is max 135-140 kWh/m2 pr. year.Passive Energy Building (RIL): 10-20 kWh/m2 pr. year (depending on use). The primary energy consumption is max 135-140 kWh/m2 pr. year.
FR The “arrêté ministeriel” from 8th May 2007 defines regulatory requirements for energy performance of buildings. This arrêté defines five levels: HPE, HPE EnR, THPE, THPE EnR, and BBC. BBC means “Low Energy Consumption Building”. For new dwellings: the annual requirement for heating, cooling, ventilation, hot water and lighting must be lower than about 50 kWh/m² (in primary energy) (40 kWh/m² to 65 kWh/m², depending on climatic area and altitude).
For non-residential buildings: the annual requirement for heating, cooling, ventilation, hot water and lighting must be at least 50% lower than what required by the current building regulation for new buildings.To obtain the “Low Consumption Building” label, a building has to respect on the one hand requirements of the thermal regulation for new buildings and on the other hand the specific requirement on consumption as described above.
NGO: Several labels or certification schemes exist, i.e. EFFINERGIE®.The EFFINERGIE® label is issued by certifiers agreed by the State to deliver the BBC label. More info on www.effinergie.org and www.isolonslaterre.org. 50 kWh/m2 pr. year for new buildings (primary energy) and 80 kWh/m2 pr. year for existing buildings (primary energy).
DE Official definitions concerning the public subsidies for (residential) Low Energy Buildings are subjects of the programs run by the (state-owned) Kreditanstalt für Wiederaufbau, Frankfurt (KfW). These programs are mainly fed by public sources. The current requirements regarding the primary energy (energy for heating, ventilation, cooling, domestic hot water and auxiliary energy) for new buildings are 70% (KfW70), 55% (KfW 55) or 40% (KfW40) of ENEV 2009 requirements. For the renovation of buildings the requirements are 115% (KfW115), 100% (KfW 100), 85% (KfW 85) and 70% (KfW 70) of ENEV 2009 requirements. There are also requirements for the H’T value.)
NGO: The Passiv Haus definition is commonly used in Germany. Heating demand has to be less than 15 kWh/m2 heated area per year . The total annual primary energy requirement including electricity for appliances must not exceed 120 kWh/m2.A 3 litre building has a primary energy for heating of max 3 litre oil/m2 per year.
IE There is no official Irish definition of a low energy or passive house.
As close as we can get to an official description is from the official Building Energy Rating certificate for new dwellings, with primary energy consumption calculated according to the official DEAP (dwelling energy assessment procedure) methodology: it is stated that “A1 rated dwellings are the most energy efficient” – it is clear that an A1-rated house would represent a low-energy demand house.
Thestatementisnotanofficialdefinitionofalow-energyhouse;itisjustaninformativedescription.Local authorities have different requirements such as Fingal country where the energy for heating is max 50 kWh/m² per year and minimum 30 % RES for heating.
NGO: “A house that has been designed and built to the highest level of comfort while having the minimum energy requirement. Free solar gains are maximised and heating is produced by renewable energy technologies”.Source: Buyers guide – low energy houses – Sustainable Energy Ireland Renewable Energy Information Office.
IT(Piedmont)
No official definition.
NGO: CasaClima - Buildings with a calculated heat demand less than 10 kWh/m² per year is considered passive, and called CasaClima Gold. If this result is achieved only with natural insulation materials it is defined as Gold +.
NL No official definition. In The Netherlands they use an EPL factor – an Energy Performance of a Location factor. The local communities have different demands for the EPL for specific areas.
NGO: The German Passiv Haus definition is being used.
NO Norway has a national definition for very low energy buildings. Norway uses net energy demand (no weighting factors). Dwellings less than 70 kWh/m² per year delivered energy and for other buildings 80 kWh/m² per year.The Norwegian Standard has a passive house definition for the space heat demand and furthermore claims that half of the DHW demand shall be covered by local renewable energy supply. Passive building is regarded as a building where the heating demand is less than 15 kWh/m² year. Dwellings less than 55 kWh/m² per year delivered energy and for other buildings 60 kWh/m² per year.
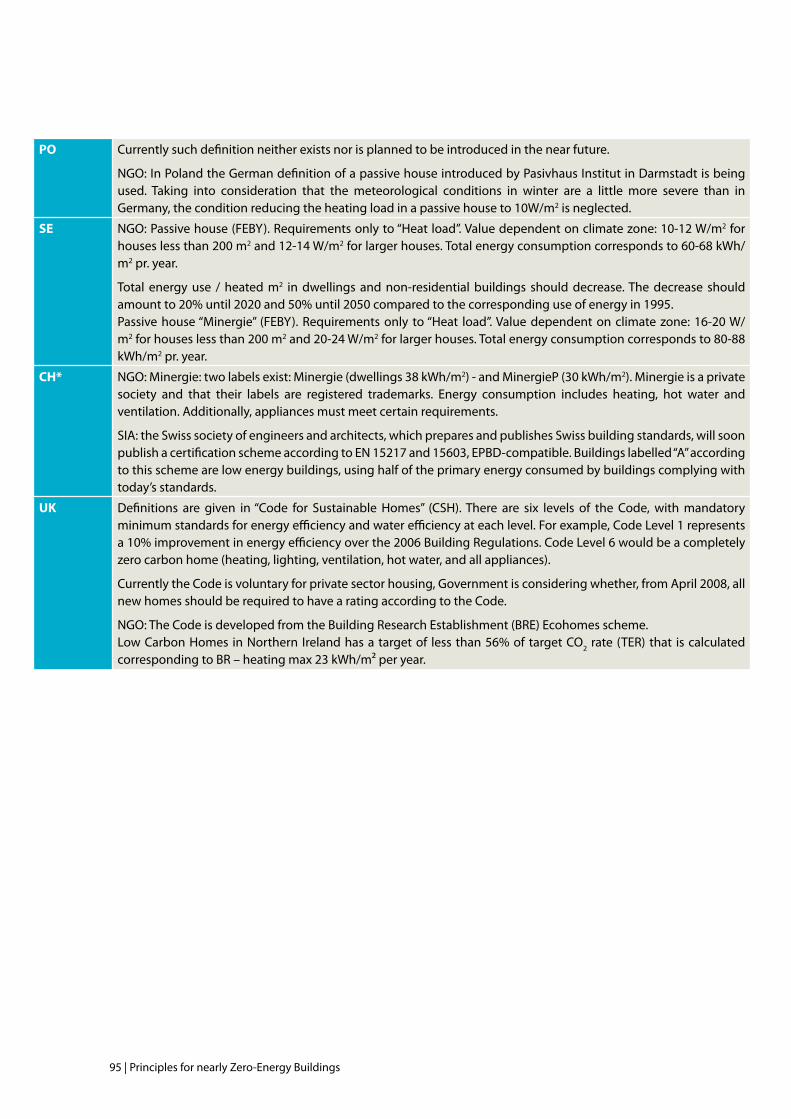
95 | Principles for nearly Zero-Energy Buildings
PO Currently such definition neither exists nor is planned to be introduced in the near future. NGO: In Poland the German definition of a passive house introduced by Pasivhaus Institut in Darmstadt is being used. Taking into consideration that the meteorological conditions in winter are a little more severe than in Germany, the condition reducing the heating load in a passive house to 10W/m2 is neglected.
SE NGO: Passive house (FEBY). Requirements only to “Heat load”. Value dependent on climate zone: 10-12 W/m2 for houses less than 200 m2 and 12-14 W/m2 for larger houses. Total energy consumption corresponds to 60-68 kWh/m2 pr. year. Total energy use / heated m2 in dwellings and non-residential buildings should decrease. The decrease should amount to 20% until 2020 and 50% until 2050 compared to the corresponding use of energy in 1995.Passive house “Minergie” (FEBY). Requirements only to “Heat load”. Value dependent on climate zone: 16-20 W/m2 for houses less than 200 m2 and 20-24 W/m2 for larger houses. Total energy consumption corresponds to 80-88 kWh/m2 pr. year.
CH* NGO: Minergie: two labels exist: Minergie (dwellings 38 kWh/m2) - and MinergieP (30 kWh/m2). Minergie is a private society and that their labels are registered trademarks. Energy consumption includes heating, hot water and ventilation. Additionally, appliances must meet certain requirements. SIA: the Swiss society of engineers and architects, which prepares and publishes Swiss building standards, will soon publish a certification scheme according to EN 15217 and 15603, EPBD-compatible. Buildings labelled “A” according to this scheme are low energy buildings, using half of the primary energy consumed by buildings complying with today’s standards.
UK Definitions are given in “Code for Sustainable Homes” (CSH). There are six levels of the Code, with mandatory minimum standards for energy efficiency and water efficiency at each level. For example, Code Level 1 represents a 10% improvement in energy efficiency over the 2006 Building Regulations. Code Level 6 would be a completely zero carbon home (heating, lighting, ventilation, hot water, and all appliances). Currently the Code is voluntary for private sector housing, Government is considering whether, from April 2008, all new homes should be required to have a rating according to the Code. NGO: The Code is developed from the Building Research Establishment (BRE) Ecohomes scheme.Low Carbon Homes in Northern Ireland has a target of less than 56% of target CO2 rate (TER) that is calculated corresponding to BR – heating max 23 kWh/m² per year.
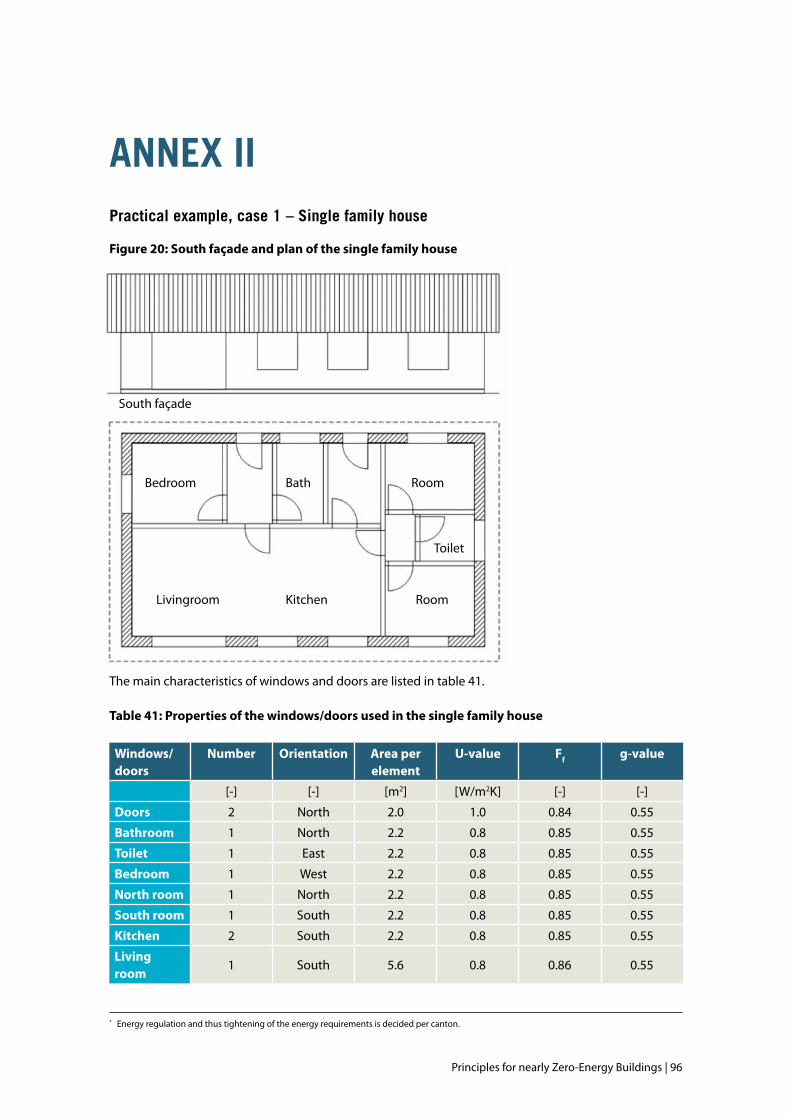
Principles for nearly Zero-Energy Buildings | 96
PO Currently such definition neither exists nor is planned to be introduced in the near future. NGO: In Poland the German definition of a passive house introduced by Pasivhaus Institut in Darmstadt is being used. Taking into consideration that the meteorological conditions in winter are a little more severe than in Germany, the condition reducing the heating load in a passive house to 10W/m2 is neglected.
SE NGO: Passive house (FEBY). Requirements only to “Heat load”. Value dependent on climate zone: 10-12 W/m2 for houses less than 200 m2 and 12-14 W/m2 for larger houses. Total energy consumption corresponds to 60-68 kWh/m2 pr. year. Total energy use / heated m2 in dwellings and non-residential buildings should decrease. The decrease should amount to 20% until 2020 and 50% until 2050 compared to the corresponding use of energy in 1995.Passive house “Minergie” (FEBY). Requirements only to “Heat load”. Value dependent on climate zone: 16-20 W/m2 for houses less than 200 m2 and 20-24 W/m2 for larger houses. Total energy consumption corresponds to 80-88 kWh/m2 pr. year.
CH* NGO: Minergie: two labels exist: Minergie (dwellings 38 kWh/m2) - and MinergieP (30 kWh/m2). Minergie is a private society and that their labels are registered trademarks. Energy consumption includes heating, hot water and ventilation. Additionally, appliances must meet certain requirements. SIA: the Swiss society of engineers and architects, which prepares and publishes Swiss building standards, will soon publish a certification scheme according to EN 15217 and 15603, EPBD-compatible. Buildings labelled “A” according to this scheme are low energy buildings, using half of the primary energy consumed by buildings complying with today’s standards.
UK Definitions are given in “Code for Sustainable Homes” (CSH). There are six levels of the Code, with mandatory minimum standards for energy efficiency and water efficiency at each level. For example, Code Level 1 represents a 10% improvement in energy efficiency over the 2006 Building Regulations. Code Level 6 would be a completely zero carbon home (heating, lighting, ventilation, hot water, and all appliances). Currently the Code is voluntary for private sector housing, Government is considering whether, from April 2008, all new homes should be required to have a rating according to the Code. NGO: The Code is developed from the Building Research Establishment (BRE) Ecohomes scheme.Low Carbon Homes in Northern Ireland has a target of less than 56% of target CO2 rate (TER) that is calculated corresponding to BR – heating max 23 kWh/m² per year.
* Energy regulation and thus tightening of the energy requirements is decided per canton.
annex iiPractical example, case 1 – single family house
Figure 20: South façade and plan of the single family house
The main characteristics of windows and doors are listed in table 41.
Table 41: Properties of the windows/doors used in the single family house
Windows/doors
Number Orientation Area per element
U-value Ff g-value
[-] [-] [m2] [W/m2K] [-] [-]
Doors 2 North 2.0 1.0 0.84 0.55
Bathroom 1 North 2.2 0.8 0.85 0.55
Toilet 1 East 2.2 0.8 0.85 0.55
Bedroom 1 West 2.2 0.8 0.85 0.55
North room 1 North 2.2 0.8 0.85 0.55
South room 1 South 2.2 0.8 0.85 0.55
Kitchen 2 South 2.2 0.8 0.85 0.55
Living room
1 South 5.6 0.8 0.86 0.55
South façade
Bedroom Bath Room
Livingroom Kitchen Room
Toilet
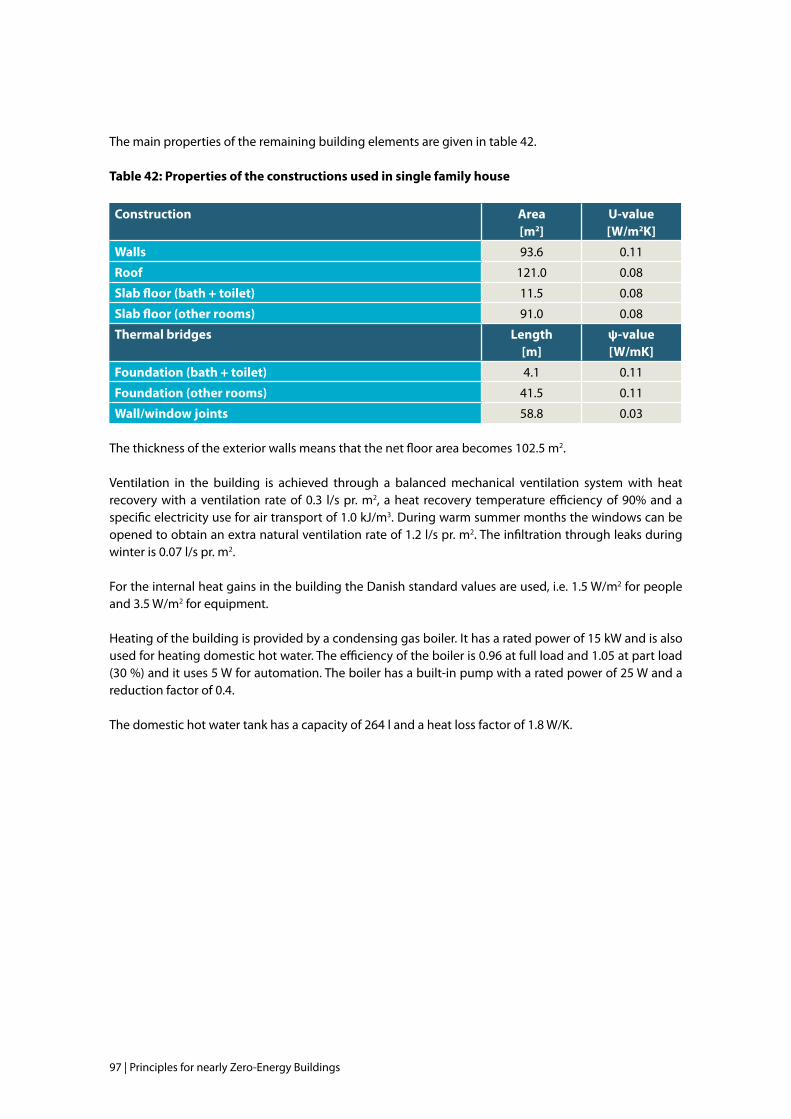
97 | Principles for nearly Zero-Energy Buildings
The main properties of the remaining building elements are given in table 42.
Table 42: Properties of the constructions used in single family house
Construction Area[m2]
U-value[W/m2K]
Walls 93.6 0.11
Roof 121.0 0.08
Slab floor (bath + toilet) 11.5 0.08
Slab floor (other rooms) 91.0 0.08
Thermal bridges Length[m]
ψ-value[W/mK]
Foundation (bath + toilet) 4.1 0.11
Foundation (other rooms) 41.5 0.11
Wall/window joints 58.8 0.03
The thickness of the exterior walls means that the net floor area becomes 102.5 m2.
Ventilation in the building is achieved through a balanced mechanical ventilation system with heat recovery with a ventilation rate of 0.3 l/s pr. m2, a heat recovery temperature efficiency of 90% and a specific electricity use for air transport of 1.0 kJ/m3. During warm summer months the windows can be opened to obtain an extra natural ventilation rate of 1.2 l/s pr. m2. The infiltration through leaks during winter is 0.07 l/s pr. m2.
For the internal heat gains in the building the Danish standard values are used, i.e. 1.5 W/m2 for people and 3.5 W/m2 for equipment.
Heating of the building is provided by a condensing gas boiler. It has a rated power of 15 kW and is also used for heating domestic hot water. The efficiency of the boiler is 0.96 at full load and 1.05 at part load (30 %) and it uses 5 W for automation. The boiler has a built-in pump with a rated power of 25 W and a reduction factor of 0.4.
The domestic hot water tank has a capacity of 264 l and a heat loss factor of 1.8 W/K.
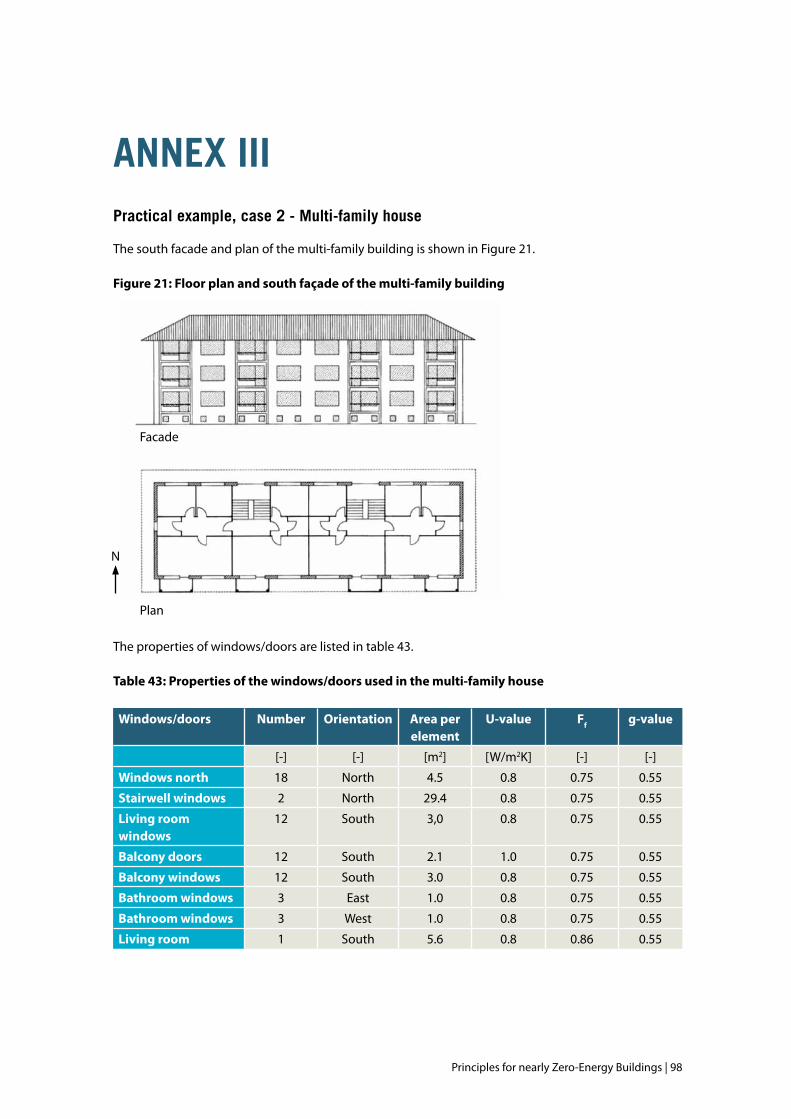
Principles for nearly Zero-Energy Buildings | 98
annex iiiPractical example, case 2 - multi-family house
The south facade and plan of the multi-family building is shown in Figure 21.
Figure 21: Floor plan and south façade of the multi-family building
The properties of windows/doors are listed in table 43.
Table 43: Properties of the windows/doors used in the multi-family house
Windows/doors Number Orientation Area per element
U-value Ff g-value
[-] [-] [m2] [W/m2K] [-] [-]
Windows north 18 North 4.5 0.8 0.75 0.55
Stairwell windows 2 North 29.4 0.8 0.75 0.55
Living room windows
12 South 3,0 0.8 0.75 0.55
Balcony doors 12 South 2.1 1.0 0.75 0.55
Balcony windows 12 South 3.0 0.8 0.75 0.55
Bathroom windows 3 East 1.0 0.8 0.75 0.55
Bathroom windows 3 West 1.0 0.8 0.75 0.55
Living room 1 South 5.6 0.8 0.86 0.55
Facade
Plan
N
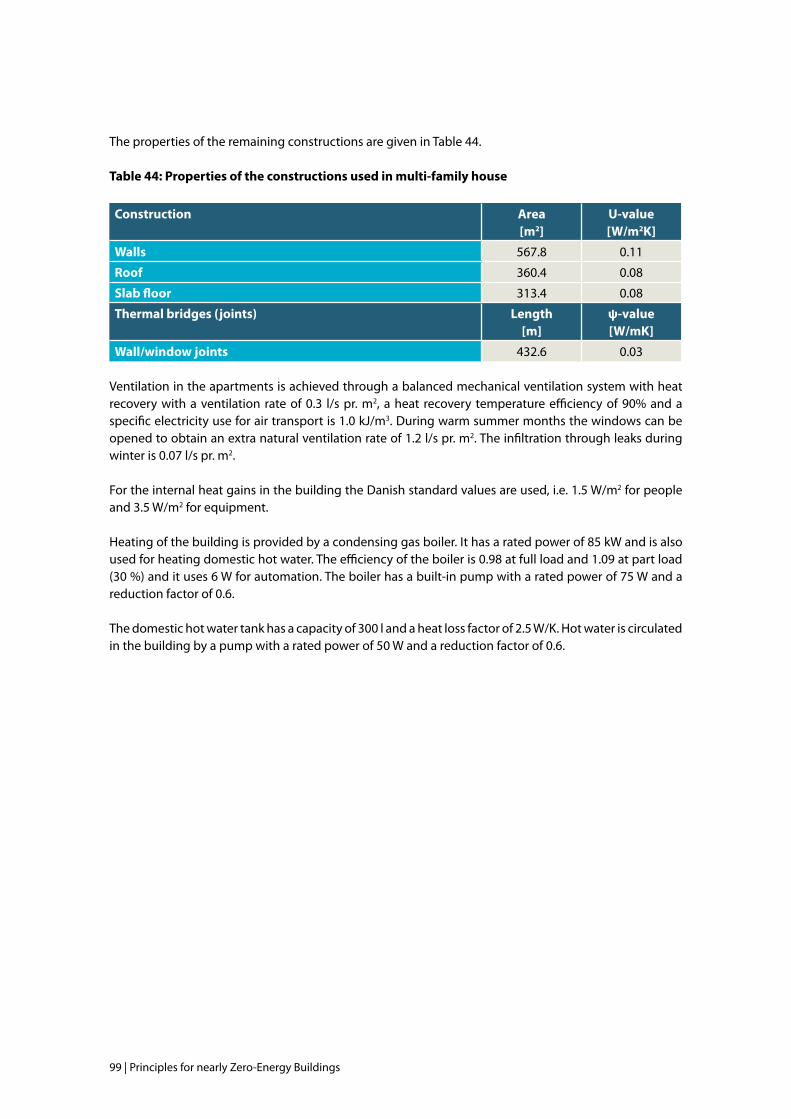
99 | Principles for nearly Zero-Energy Buildings
The properties of the remaining constructions are given in Table 44.
Table 44: Properties of the constructions used in multi-family house
Construction Area[m2]
U-value[W/m2K]
Walls 567.8 0.11
Roof 360.4 0.08
Slab floor 313.4 0.08
Thermal bridges (joints) Length[m]
ψ-value[W/mK]
Wall/window joints 432.6 0.03
Ventilation in the apartments is achieved through a balanced mechanical ventilation system with heat recovery with a ventilation rate of 0.3 l/s pr. m2, a heat recovery temperature efficiency of 90% and a specific electricity use for air transport is 1.0 kJ/m3. During warm summer months the windows can be opened to obtain an extra natural ventilation rate of 1.2 l/s pr. m2. The infiltration through leaks during winter is 0.07 l/s pr. m2.
For the internal heat gains in the building the Danish standard values are used, i.e. 1.5 W/m2 for people and 3.5 W/m2 for equipment.
Heating of the building is provided by a condensing gas boiler. It has a rated power of 85 kW and is also used for heating domestic hot water. The efficiency of the boiler is 0.98 at full load and 1.09 at part load (30 %) and it uses 6 W for automation. The boiler has a built-in pump with a rated power of 75 W and a reduction factor of 0.6.
The domestic hot water tank has a capacity of 300 l and a heat loss factor of 2.5 W/K. Hot water is circulated in the building by a pump with a rated power of 50 W and a reduction factor of 0.6.


ISBN: 9789491143021Buildings Performance Institute Europe (BPIE)
Rue de Stassart 48 box 81050 BrusselBelgiumwww.bpie.eu