towards nearly zero energy buildings
TRANSCRIPT
Dr. Andreas Hermelink 23/01/2014
TOWARDS NEARLY ZERO-ENERGY BUILDINGS
Webinar
© ECOFYS | |
Content
> Introduction
> Nearly Zero-Energy Buildings (nZEB)
> Reporting template and analytical framework for Member States
> Specific issues around the nZEB definition
> Benchmarks for nZEB
> Convergence between cost-optimality and nZEB?
> Conclusions and Recommendations
23/01/2014 Dr. Andreas Hermelink 2

© ECOFYS | |
Introduction – What‘s the issue?
> Emissions gap report Cancún: Scenarios that give the world a
chance to stay below 2 °C have:
> World GHG Emissions peak before 2020
> World GHG Emissions in 2050 50-60% below 1990 level
> Due to the high share of industrialized countries in GHG emissions, Europe has a target of 80%-95% GHG reductions.
23/01/2014 Dr. Andreas Hermelink 3

© ECOFYS | |
A roadmap for moving to a low carbon economy in 2050, EC 2011, Minimum Reduction vs. 1990
23/01/2014 Dr. Andreas Hermelink 4
-20%
-54%
-37%
-80%
-93% -88%
-100%
-90%
-80%
-70%
-60%
-50%
-40%
-30%
-20%
-10%
0% Cross sectoral Power Buildings
2020 2030 2050

© ECOFYS | |
A roadmap for moving to a low carbon economy in 2050, EC 2011, Maximum Reduction vs. 1990
23/01/2014 Dr. Andreas Hermelink 5
-30%
-68%
-53%
-95% -99%
-91%
-100%
-90%
-80%
-70%
-60%
-50%
-40%
-30%
-20%
-10%
0% Cross sectoral Power Buildings
2020 2030 2050

© ECOFYS | |
Content
> Introduction
> Nearly Zero-Energy Buildings (nZEB)
> Reporting template and analytical framework for Member States
> Specific issues around the nZEB definition
> Benchmarks for nZEB
> Convergence between cost-optimality and nZEB?
> Conclusions and Recommendations
23/01/2014 Dr. Andreas Hermelink 6

© ECOFYS | |
Definition of Nearly Zero-Energy Buildings
> Energy Performance of Buildings Directive’s (EPBD), Article 9: – [A nearly Zero-Energy Building is a] “building that has a very high
energy performance… [ ]. The nearly zero or very low amount of energy required should to a very significant extent be covered by energy from renewable sources, including renewable energy produced on-site or nearby.”
23/01/2014 Dr. Andreas Hermelink 7
2019/2021 today building stock

© ECOFYS | |
Nearly Zero-Energy Buildings: Key Questions
23/01/2014 Dr. Andreas Hermelink 8
2019/2021 today building stock
> Burning questions – Options to achieve nearly zero-energy buildings? – What about the share of renewables? – What is “nearly zero”? – Do nZEB need to be cost-optimal?
© ECOFYS | |
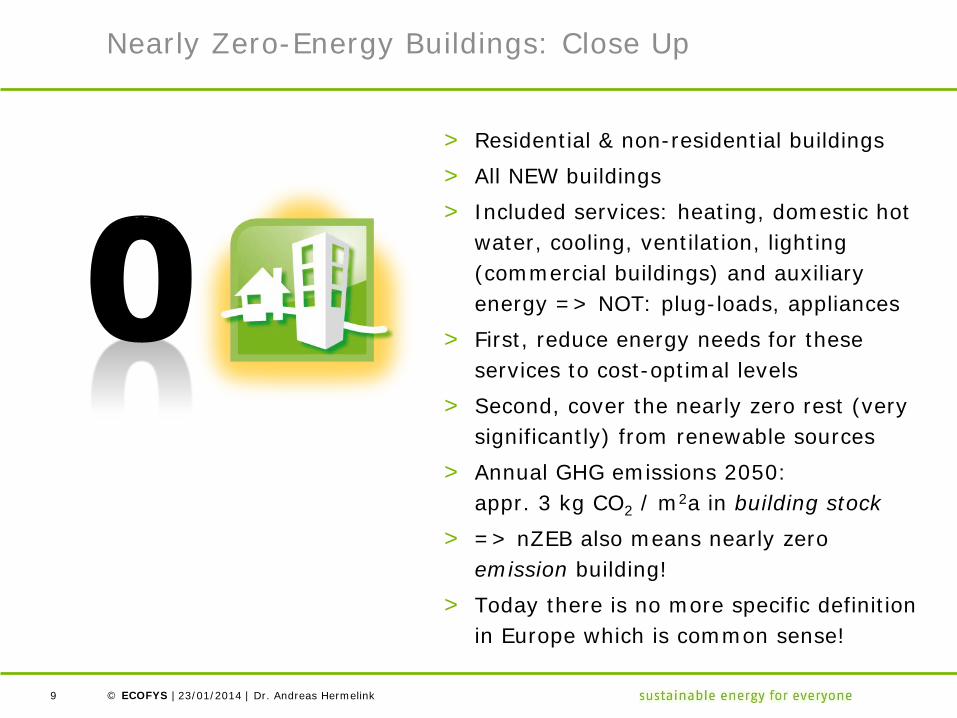
Nearly Zero-Energy Buildings: Close Up
> Residential & non-residential buildings > All NEW buildings > Included services: heating, domestic hot
water, cooling, ventilation, lighting (commercial buildings) and auxiliary energy => NOT: plug-loads, appliances
> First, reduce energy needs for these services to cost-optimal levels
> Second, cover the nearly zero rest (very significantly) from renewable sources
> Annual GHG emissions 2050: appr. 3 kg CO2 / m2a in building stock
> => nZEB also means nearly zero emission building!
> Today there is no more specific definition in Europe which is common sense!
23/01/2014 Dr. Andreas Hermelink 9

© ECOFYS | |
Content
> Introduction > Nearly Zero-Energy Buildings (nZEB)
> Reporting template and analytical framework for Member
States
> Specific issues around the nZEB definition
> Benchmarks for nZEB > Convergence between cost-optimality and nZEB? > Conclusions and Recommendations
23/01/2014 Dr. Andreas Hermelink 10

© ECOFYS | |
Request for National nZEB Plans
> Member States shall draw up national plans for increasing the number of nearly zero-energy buildings (EPBD Article 9 paragraph 1).
> The National plans shall include: – Application in practice of the national definition of nearly zero
energy buildings – Intermediate targets – Policies and financial or other measures for the promotion of
nZEB > “The Commission shall evaluate the national plans … notably the adequacy
of the measures envisaged by the Member States… .” (EPBD Article 9, paragraph 4).
> After having received the national plan the Commission “… may request further specific information regarding the requirements set out in paragraphs 1,2 and 3”
=> common reporting format on nZEB is helpful
23/01/2014 Dr. Andreas Hermelink 11

© ECOFYS | |
Template for National Plans
> Reporting template – provided by the European Commission to MS; developed by Ecofys – Also serves the Commission as an analytical framework.
> Categories included – Starting point – Application of the definition of nearly zero-energy building – Intermediate targets (qualitative and quantitative) – Intermediate targets also for new buildings occupied and owned by
public authorities (by 31 December 2018) – Policies and measures for the promotion of all new buildings being
nearly zero-energy buildings after 31 December 2018 resp. – Additional information – Possible improvements (self-assessment and possible improvements)
23/01/2014 Dr. Andreas Hermelink 12

© ECOFYS | |
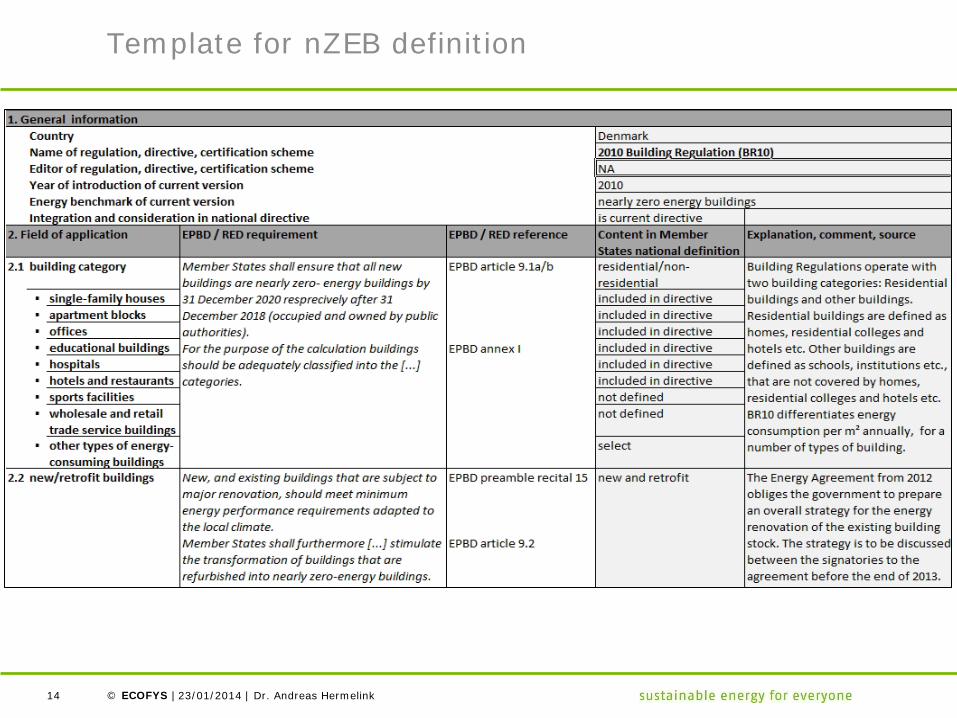
Template for nZEB definition
> How do member states define the nearly zero-energy buildings? Do they fulfill the EPBD/RED requirements?
> Table for reporting the detailed
application of the definition of nearly zero-energy buildings in practice.
23/01/2014 Dr. Andreas Hermelink 13
© ECOFYS | |
Template for nZEB definition
23/01/2014 Dr. Andreas Hermelink 14
© ECOFYS | |
Content
> Introduction > Nearly Zero-Energy Buildings (nZEB)
> Reporting template and analytical framework for Member States
> Specific issues around the nZEB definition
> Benchmarks for nZEB > Convergence between cost-optimality and nZEB? > Conclusions and Recommendations
23/01/2014 Dr. Andreas Hermelink 15
© ECOFYS | |
off-site nearby
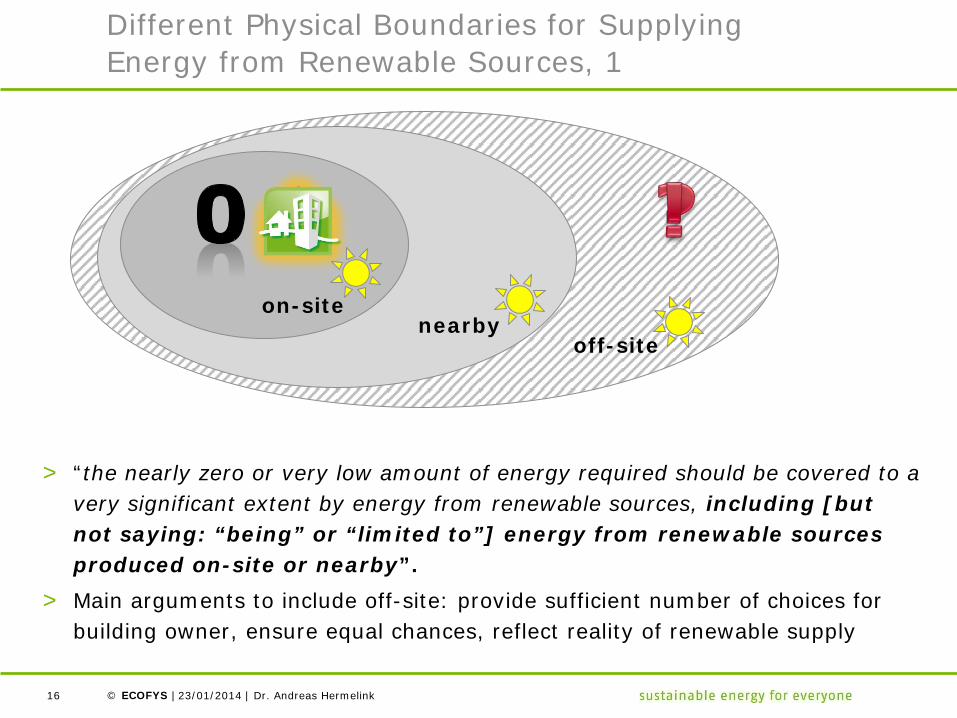
Different Physical Boundaries for Supplying Energy from Renewable Sources, 1
> “the nearly zero or very low amount of energy required should be covered to a very significant extent by energy from renewable sources, including [but not saying: “being” or “limited to”] energy from renewable sources produced on-site or nearby”.
> Main arguments to include off-site: provide sufficient number of choices for building owner, ensure equal chances, reflect reality of renewable supply
23/01/2014 Dr. Andreas Hermelink 16
on-site

© ECOFYS | |
Single Building and Off-Site Supply
> Two different physical boundaries for demand and supply
> Balancing import and export
> Balance gets easier when focus switches to building owner as „legal system“
=> high share of RE possible without any on-site renewables
23/01/2014 Dr. Andreas Hermelink 18
off-site nearby
on-site
import
export

© ECOFYS | |
Metric and Period of the Balance
> EPBD requires national nZEB definition to include a numerical indicator for the energy performance. Which metric to use? – Delivered energy => primary energy factors
(PEF) => Primary energy – PEF sometimes intransparent, for electricity
steep decrease forecasted – Switch to CO2 might happen in the future
> Period of the balance – EPBD: Net balance over one year (include
heating & cooling) – Question of length of sub-intervals – The shorter the sub-interval, the more
ambitious it is to achieve (nearly) zero-energy balances => aim: less stress for (electricity) grids
23/01/2014 Dr. Andreas Hermelink 19

© ECOFYS | |
Period of the Balance – „Load Match Index“
> Result: The net ZEB can only “live” without importing energy for 25% of a year’s hours; e.g. all nocturnal hours need energy imports.
> Annual sub-interval over-estimates renewable share > Currently monthly balances seem to be a viable solution.
23/01/2014 Dr. Andreas Hermelink 20
source: Koch et al. 2011
> Different sub-intervals for a 1 year period: – 1 year – 1 month – 1 day – 1 hour
> Balancing „PV on the roof“-export with import from grid;
> PV system sized for annual „net 0“

© ECOFYS | |
Variations in nZEB definitions
> 71 nZEB definitions from 17 EU and 2 countries beyond have been analysed > graph shows which boundary is explicitly allowed/forbidden/not mentioned
for renewable energy (heat & electricity)
23/01/2014 Dr. Andreas Hermelink 21
0
10
20
30
40
50
60
70
80
option1:footprint option2:on-site option3:off-site generation
option4:off-site green electricity
Nu
mb
er o
f av
aila
ble
d
efin
itio
ns/l
abel
s
not defined
no
yes
© ECOFYS | |
Content
> Introduction
> Nearly Zero-Energy Buildings (nZEB)
> Reporting template and analytical framework for Member States incl.
specific issues around the nZEB definition
> Benchmarks for nZEB
> Convergence between cost-optimality and nZEB?
> Conclusions and Recommendations
23/01/2014 Dr. Andreas Hermelink 22
© ECOFYS | |
Approach for deriving benchmarks
> Cost-optimality methodology
> Dynamic simulation of multiple variants (office, single, 4 climate
zones/cities, new/retrofit, 2010/2020, private/societal
perspective) => clouds of variants
> Defining primary energy benchmark area
> Calculation of renewable share within benchmark area
> Classification of energy needs within benchmark area
> Feedback-loop with global cost
23/01/2014 Dr. Andreas Hermelink 23
© ECOFYS | | 23/01/2014 Dr. Andreas Hermelink 24
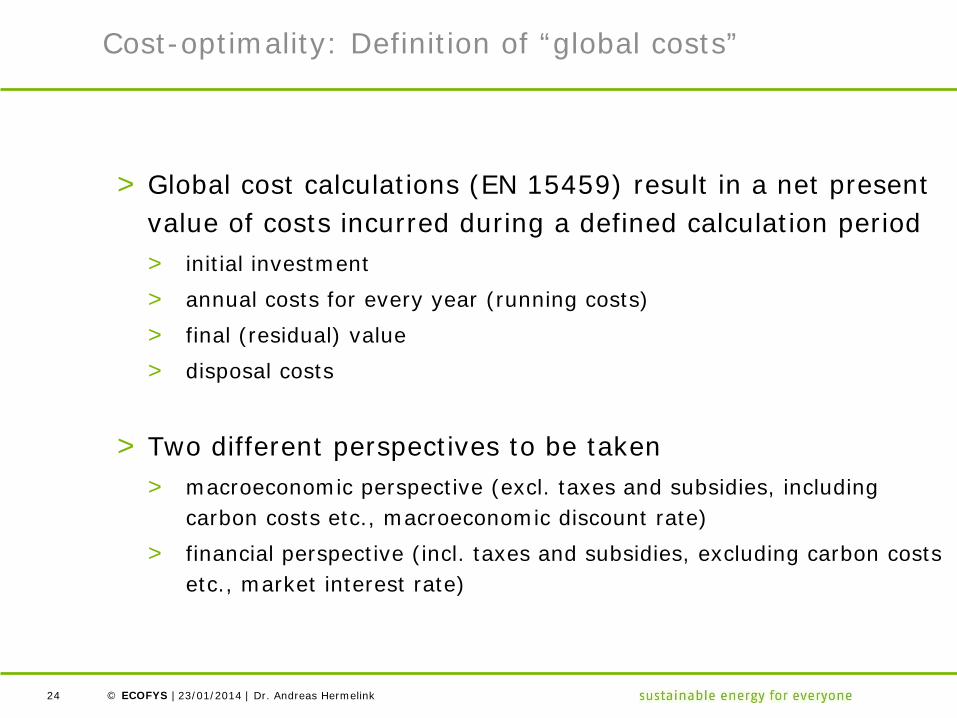
Cost-optimality: Definition of “global costs”
> Global cost calculations (EN 15459) result in a net present value of costs incurred during a defined calculation period > initial investment > annual costs for every year (running costs) > final (residual) value > disposal costs
> Two different perspectives to be taken > macroeconomic perspective (excl. taxes and subsidies, including
carbon costs etc., macroeconomic discount rate) > financial perspective (incl. taxes and subsidies, excluding carbon costs
etc., market interest rate)

© ECOFYS | |
Economic optimum
kWh/m2a
€/m2
1
6 5 4 3 2
„Cost optimal range“
Derivation of cost optimal level
Dr. Andreas Hermelink 25 23/01/2014
© ECOFYS | | 23/01/2014 Dr. Andreas Hermelink 26
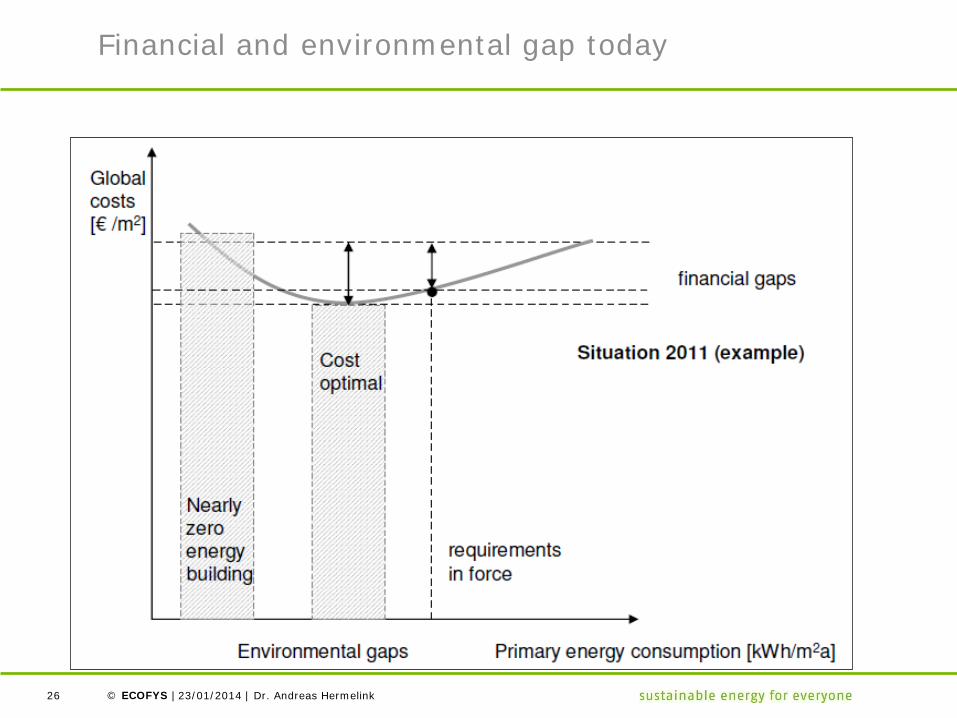
Financial and environmental gap today

© ECOFYS | |
Defining the primary energy benchmark area
23/01/2014 Dr. Andreas Hermelink 27

© ECOFYS | |
Defining the primary energy benchmark area
23/01/2014 Dr. Andreas Hermelink 28
The “benchmark area” is determined in the following way: • Determine the variant with minimum net primary energy, • Consider an increase of 15 to 25 kWh/m2y, • At this new level of net primary determine the variant with minimum global cost, • Increase global cost by 15-25%

© ECOFYS | |
Results net primary energy ranges
Simulated net primary energy ranges in different European regions and building categories
23/01/2014 Dr. Andreas Hermelink 29
© ECOFYS | |
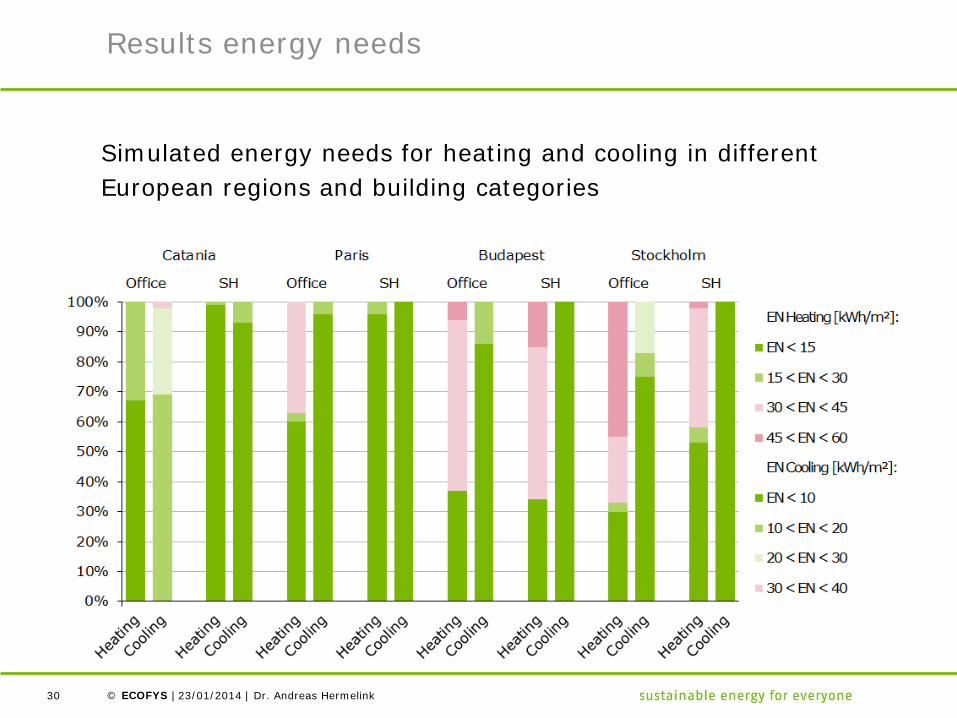
Results energy needs
Simulated energy needs for heating and cooling in different European regions and building categories
23/01/2014 Dr. Andreas Hermelink 30
© ECOFYS | |
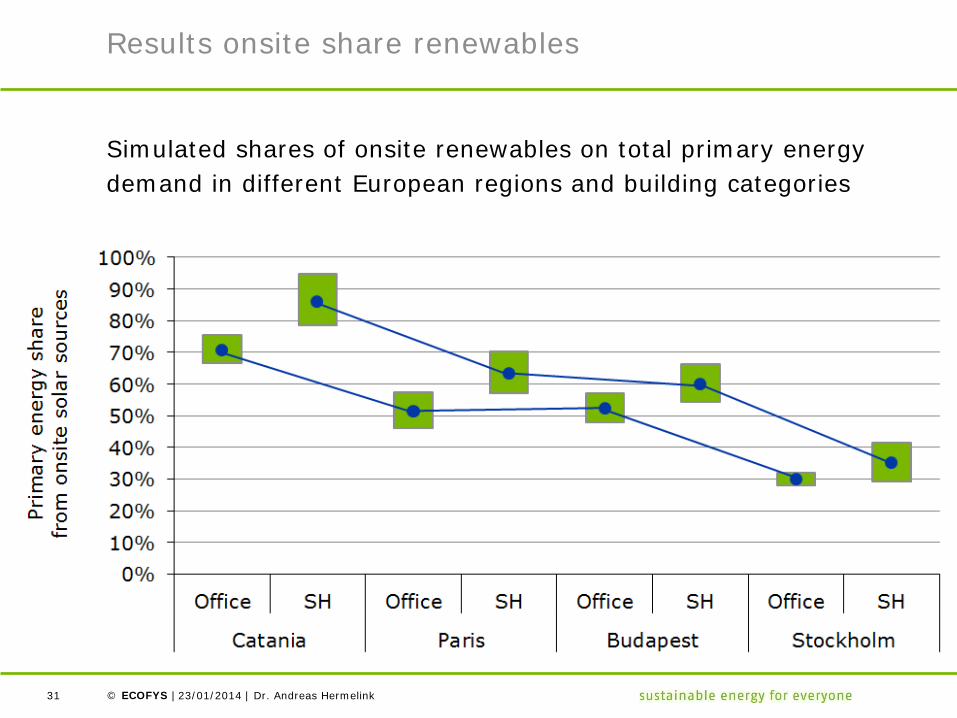
Results onsite share renewables
Simulated shares of onsite renewables on total primary energy demand in different European regions and building categories
23/01/2014 Dr. Andreas Hermelink 31

© ECOFYS | |
Feedback loop with global cost
23/01/2014 Dr. Andreas Hermelink 32
0
500
1000
1500
2000
2500
3000
3500
0%
20%
40%
60%
80%
100%
EN < 15kWh/m2
15 < EN < 30kWh/m2
30 < EN < 45kWh/m2
45 < EN < 60kWh/m2
60 < EN < 75kWh/m2
EN > 75kWh/m2
Glob
al C
ost -
30 y
ears
[€/m
2]
% o
f Bui
ldin
g Va
riant
s with
in c
lass
es o
f En
ergy
Nee
ds fo
r Hea
ting
and
Cool
ing
Paris - Office - New Building - 2010Financial Persp. (RIR = 4%, Tax included)

© ECOFYS | |
Summary results energy needs
Energy needs (being the sum of heating and cooling) turned out to be in the following low ranges for the following climate zones:
> Zone 1: Catania (others: Athens, Larnaca, Luga, Seville, Palermo): 15-45 kWh/m2a (new office), 15-30 kWh/m2a (new SFH)
> Zone 2: Budapest (others: Bratislava, Ljubjana, Milan, Vienna): 15-45 kWh/m2a (new office), <15 kWh/m2a (new SFH)
> Zone 3: Paris (others: Amsterdam, Berlin, Brussels, Copenhagen, Dublin, London, Macon, Nancy, Prague, Warszawa): 30-45 kWh/m2a (new office), here variants having the same average global cost were found in the classes <15 kWh/m2a and 15-30 kWh/m2a as well; <15 kWh/m2a (new SFH)
> Zone 4: Stockholm (Helsinki, Riga, Stockholm, Gdansk, Tovarene): 15-30 kWh/m2a (office), <25 kWh/m2a (SFH)
23/01/2014 Dr. Andreas Hermelink 33

© ECOFYS | |
Content
> Introduction
> Nearly Zero-Energy Buildings (nZEB)
> Reporting template and analytical framework for Member States > Specific issues around the nZEB definition
> Benchmarks for nZEB
> Convergence between cost-optimality and nZEB?
> Conclusions and Recommendations
23/01/2014 Dr. Andreas Hermelink 34

© ECOFYS | |
Cost-opt vs. nZEB – The Commission‘s view
> After 2013, all new buildings and renovations shall be based on cost optimal requirements.
> How is it with cost optimality of nZEB after 2020? Do they have to be cost optimal as well? (i.e. what if the technologies necessary for reaching nZEB will not be cost optimal?)
23/01/2014 Dr. Andreas Hermelink 35

© ECOFYS | |
Cost-opt vs. nZEB – The Commission‘s answer
> Basically cost optimality and nearly zero energy buildings are two different concepts. Nevertheless, the minimum energy performance requirements for new buildings after 2020 (i.e. NZEB) will have to be cost optimal as well. In best case (depending on circumstances, like investment costs and energy prices and depending on the exact definition of nearly zero energy buildings by the respective Member State) the technical requirements derived from the two systems get close to each other around 2020 to allow a smooth transition.
23/01/2014 Dr. Andreas Hermelink 36
© ECOFYS | |
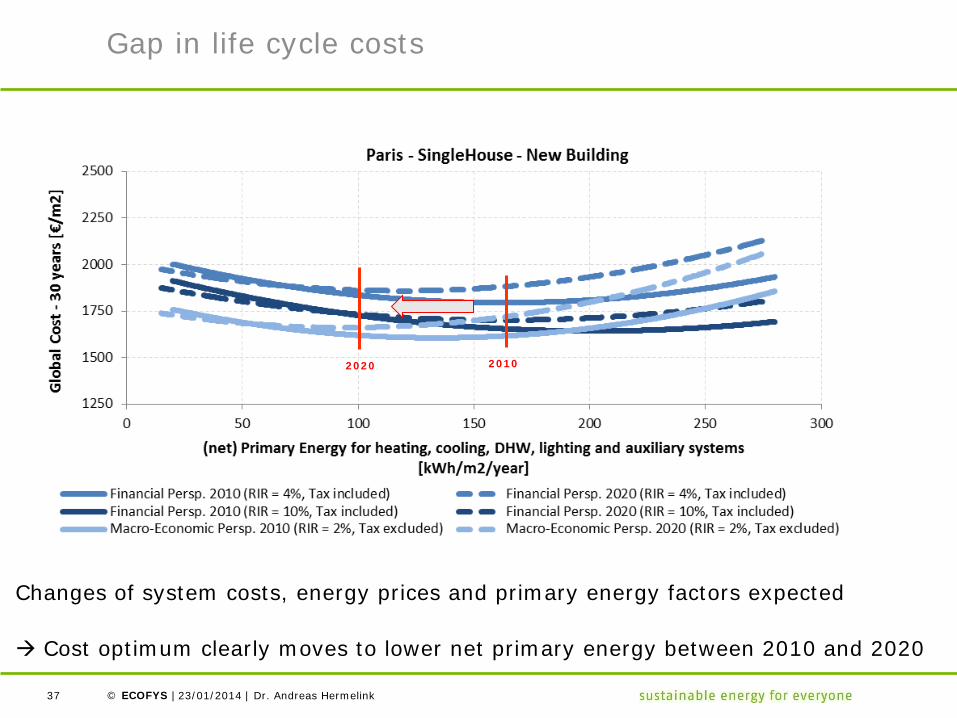
Gap in life cycle costs
23/01/2014 Dr. Andreas Hermelink 37
Financial and environmental gaps between nearly zero-energy building,
cost optimality and current requirements in 2011
Financial and environmental gap between nearly zero-energy building
and cost optimality in 2021
2010 2020
Changes of system costs, energy prices and primary energy factors expected
Cost optimum clearly moves to lower net primary energy between 2010 and 2020
© ECOFYS | |
Content
> Introduction
> Nearly Zero-Energy Buildings (nZEB)
> Reporting template and analytical framework for Member States > Specific issues around the nZEB definition
> Benchmarks for nZEB
> Convergence between cost-optimality and nZEB?
> Conclusions and Recommendations
23/01/2014 Dr. Andreas Hermelink 38

© ECOFYS | |
Conclusions and Recommendations
> nZEB usually are correlated with very low energy needs (close or equal to Passive House)
> Buildings constructed with very low energy needs have global costs over 30 years lower or comparable to buildings with high energy needs
> These results seem relatively robust towards changes in various economic parameters, e.g. the assumed interest rates
> The economic attractiveness of low energy need buildings grows when considering the scenario of constructing a building in 2020
> The cost optimum in all cases moves towards zero > This result is reinforced in case energy prices would rise more
significantly than assumed
23/01/2014 Dr. Andreas Hermelink 39

© ECOFYS | |
Conclusions and Recommendations
> It is likely to be a good economic investment to continue support for innovation and to completely close the gap between cost-optimal and zero energy
> Not to forget: Buildings with low energy needs have supplementary benefits like higher thermal and visual comfort
> nZEB as a cornerstone for EU 2050 climate targets
> On-site RE currently in the focus, but
> Off-site RE must get a viable nZEB option as well
– Equality, even chances, avoid discrimination
– Community and large scale production
> Only demand reduction and RE will succeed
23/01/2014 Dr. Andreas Hermelink 40

© ECOFYS | |
Please contact us for more information
Dr. Andreas Hermelink Ecofys Germany GmbH Am Karlsbad 11 10785 Berlin Germany T: +49 30 297 735 79-50 E: [email protected] I: www.ecofys.com
23/01/2014 Dr. Andreas Hermelink 41