print account mar13 condensed 14may 1012
TRANSCRIPT

www.jpmorganam.com.hk
JPMorgan Funds(Unit Trust Range)
Unaudited Semi-Annual Report31 March 2013
Consolidated(305.5x210)Co.ai 1 15/05/2013 10:26 AMConsolidated(305.5x210)Co.ai 1 15/05/2013 10:26 AM

These reports do not constitute an offer of units in any funds forming the subject matter of this document.
Subscriptions are only valid if made on the basis of the current explanatory memoranda (or equivalent),
supplemented by the most recent financial reports, if available.
Notice to U.K. residents: This document is only directed to persons believed by JPMorgan Asset
Management (U.K.) Limited to be investment professionals as defined in Article 19 of the Financial Services
and Markets Act 2000 (Financial Promotion) Order 2005, high net worth companies, unincorporated
associations and other persons as defined in Article 49 of that Order and to others to whom it can lawfully
be distributed or given, inside the United Kingdom, without approval by an authorised person. Persons who
do not have professional experience in matters relating to investments should not rely on it and any other
person should not act on such information.
This document is issued in the U.K. by JPMorgan Asset Management (U.K.) Limited and has been approved
solely for the purposes of section 21(2)(b) of the Financial Services and Markets Act 2000 by JPMorgan Asset
Management (U.K.) Limited which is authorised and regulated in the U.K. by the Financial Conduct Authority.
Registered in England No. 01161446. Registered address: 125 London Wall, London EC2Y 5AY.
Although JPMorgan Asset Management (Europe) S.à r.l., under certain administrative services agreements,
provides services to the funds covered in this document, the funds are not subject to the laws of
Luxembourg nor are they subject to supervision by any supervisory authority in Luxembourg.
Consolidated(305.5x210)Co.ai 2 15/05/2013 10:26 AMConsolidated(305.5x210)Co.ai 2 15/05/2013 10:26 AM
JPMJPMJPMJPMORGAN ORGAN ORGAN ORGAN FUNDSFUNDSFUNDSFUNDS SemiSemiSemiSemi----annual report for theannual report for theannual report for theannual report for the
period ended 31 March 2013period ended 31 March 2013period ended 31 March 2013period ended 31 March 2013
ContentsContentsContentsContents PagePagePagePage
JPMorgan ASEAN Fund ................................................................................................................................................ 1
JPMorgan Asia Domestic Opportunities Fund ............................................................................................................. 9
JPMorgan Asia New Frontiers Fund ............................................................................................................................. 16
JPMorgan Asia Resources Fund ................................................................................................................................... 23
JPMorgan Asian Total Return Bond Fund .................................................................................................................... 30
JPMorgan AsiaOne Fund .............................................................................................................................................. 41
JPMorgan Australia Fund ............................................................................................................................................. 47
JPMorgan China New Generation Fund ....................................................................................................................... 55
JPMorgan China Pioneer A-Share Fund ...................................................................................................................... 63
JPMorgan Eastern Fund ............................................................................................................................................... 71
JPMorgan Eastern Smaller Companies Fund .............................................................................................................. 78
JPMorgan Evergreen Fund ........................................................................................................................................... 86
JPMorgan Global Bond and Currency Fund ................................................................................................................. 92
JPMorgan Global Property Income Fund ..................................................................................................................... 101
JPMorgan Greater China Smaller Companies Fund .................................................................................................... 109
JPMorgan India Fund ................................................................................................................................................... 116
JPMorgan India Smaller Companies Fund ................................................................................................................... 123
JPMorgan Indonesia Fund ............................................................................................................................................ 130
JPMorgan Japan (Yen) Fund ........................................................................................................................................ 137
JPMorgan Japan OTC Fund ........................................................................................................................................... 144
JPMorgan Japan Smaller Company (Yen) Fund ........................................................................................................... 152
JPMorgan Japan Technology Fund .............................................................................................................................. 159
JPMorgan Korea Fund .................................................................................................................................................. 166
JPMorgan Malaysia Fund ............................................................................................................................................. 174
JPMorgan Money Fund ................................................................................................................................................. 181
JPMorgan Multi Income Fund ...................................................................................................................................... 187
JPMorgan Pacific Securities Fund ................................................................................................................................ 219
JPMorgan Pacific Technology Fund ............................................................................................................................. 227
JPMorgan Philippine Fund ........................................................................................................................................... 234
JPMorgan Thailand Fund ............................................................................................................................................. 241
JPMorgan Vietnam Opportunities Fund ...................................................................................................................... 248

JPMORGAN ASEAN FUNDJPMORGAN ASEAN FUNDJPMORGAN ASEAN FUNDJPMORGAN ASEAN FUND (Formerly known as JF ASEAN Fund)(Formerly known as JF ASEAN Fund)(Formerly known as JF ASEAN Fund)(Formerly known as JF ASEAN Fund)
SemiSemiSemiSemi----annual report for theannual report for theannual report for theannual report for the
period ended 31 March 2013period ended 31 March 2013period ended 31 March 2013period ended 31 March 2013
- 1 -
Distributor StatusDistributor StatusDistributor StatusDistributor Status
The Fund has been certified by HMRC in the UK as a
distributing fund in respect of the period from 1 January
1984 to 30 September 2010. The principal effect of this
certification is that for unitholders resident or ordinarily
resident in the UK for taxation purposes any gains accruing
on the sale, redemption or other disposal of units during
the period will be taxed in the UK as a capital gain and not
as income. This treatment will continue under the new UK
reporting fund regime provided the Fund does not invest
more than 5% of its assets in other offshore funds which
are not themselves reporting funds. There will be no need
to formally apply for reporting fund status as the Fund is
transparent for UK tax purposes and therefore considered
out of scope of the requirements of this new regime.
As noted, the Fund is transparent for UK income tax
purposes and UK investors are subject to UK capital gains
tax on disposal of their units. UK investors are subject to tax
on their share of income of the Fund on an arising basis.
Information has been provided to UK investors of the
amount of their share of the underlying income, expenses
and overseas tax suffered.
Investment PortfolioInvestment PortfolioInvestment PortfolioInvestment Portfolio
As at 31 March 2013As at 31 March 2013As at 31 March 2013As at 31 March 2013 (Unaudited)(Unaudited)(Unaudited)(Unaudited)
HoldingHoldingHoldingHolding
FairFairFairFair
valuevaluevaluevalue
US$US$US$US$
% of% of% of% of
netnetnetnet
assetsassetsassetsassets
Listed/Quoted InvestmentsListed/Quoted InvestmentsListed/Quoted InvestmentsListed/Quoted Investments (97.2%)
(I) Equities(I) Equities(I) Equities(I) Equities (97.2%)
Hong KongHong KongHong KongHong Kong (1.2%)
Jardine Matheson Hldgs 411,030 26,758,053 1.2
IndonesiaIndonesiaIndonesiaIndonesia (19.9%)
Alam Sutera Realty 175,491,500 19,323,479 0.9
Astra Intl 72,481,500 58,552,073 2.6
Bank Central Asia 66,003,000 74,374,359 3.3
Bank Mandiri (Persero) 37,293,613 38,377,785 1.7
Bank Negara Indonesia
(Persero) 55,424,500 28,517,880 1.3
Bank Rakyat Indonesia
Persero 12,089,000 10,823,185 0.5
Ciputra Development 127,880,000 14,212,544 0.6
Erajaya Swasembada 62,748,000 21,793,105 1.0
Indocement Tunggal Prakarsa 4,763,000 11,371,402 0.5
Indosiar Karya Media 129,600,000 16,937,690 0.7
Jasa Marga (Persero) 15,199,000 9,228,104 0.4
Kalbe Farma 96,000,000 12,250,064 0.5
Matahari Department Store 12,344,000 13,973,141 0.6
Semen Indonesia Persero 15,464,000 28,166,998 1.2
Surya Citra Media 64,902,000 18,032,971 0.8
Telekomunikasi Indonesia 'B' 47,118,000 52,609,241 2.3
Tempo Scan Pacific 58,010,500 22,237,109 1.0
MalaysiaMalaysiaMalaysiaMalaysia (13.3%)
Axiata Group 4,858,500 10,355,595 0.5
CapitaMalls Malaysia Trust 39,934,500 23,729,850 1.0
CIMB Group Hldgs 12,698,700 31,208,496 1.4
(Continued)
HoldingHoldingHoldingHolding
FairFairFairFair
valuevaluevaluevalue
US$US$US$US$
% of% of% of% of
netnetnetnet
assetsassetsassetsassets
Dialog Group 16,180,000 12,331,600 0.5
Digi.com Bhd 7,650,000 11,438,560 0.5
Gamuda Bhd 14,087,100 18,333,930 0.8
Genting Bhd 6,225,200 20,083,884 0.9
Genting Malaysia 12,783,300 14,861,902 0.7
IHH Healthcare-MY List 5,789,900 6,974,431 0.3
Malayan Banking 8,888,075 26,809,178 1.2
Petronas Chemicals 4,254,500 8,765,933 0.4
Petronas Gas 3,426,200 20,978,767 0.9
SapuraKencana Petroleum 39,146,800 37,926,821 1.7
Sime Darby 6,496,700 19,407,226 0.9
SP Setia 8,443,900 8,971,559 0.4
Tenaga Nasional 4,700,000 10,898,111 0.5
UEM Land Hldgs 19,314,500 16,841,321 0.7
PhilippinesPhilippinesPhilippinesPhilippines (5.9%)
ABS-CBN Hldgs PDR 11,724,800 11,808,118 0.5
Alliance Global Group 18,794,800 9,740,505 0.4
Ayala Land 14,979,500 11,819,160 0.5
GT Capital Hldgs 857,732 15,405,968 0.7
Manila Electric 2,330,000 18,555,501 0.8
Philippine Long Distance
Telephone 339,000 24,654,545 1.1
Puregold Price Club 13,320,900 13,056,506 0.6
Rizal Commercial Banking 3,442,440 5,862,523 0.3
SM Investments 863,315 23,587,264 1.0
SingaporeSingaporeSingaporeSingapore (30.4%)
Ascendas Real Estate Inv Trust 5,102,000 10,651,443 0.5
Cache Logistics 6,380,000 6,685,475 0.3
CapitaCommercial Trust 5,171,000 6,606,509 0.3
CapitaLand Ltd 20,720,000 58,956,634 2.6
CapitaMall Trust 6,065,000 10,217,516 0.5
CapitaMalls Asia 25,703,000 42,472,312 1.9
DBS Group Hldgs 7,631,377 98,114,188 4.3
Fibrechem Technologies 27,671,000 0 0.0
Frasers Centrepoint 4,016,000 6,862,744 0.3
Genting Singapore 26,677,000 32,039,924 1.4
Guocoland Ltd (CDP) 5,024,000 9,354,699 0.4
Hutchison Port Hldgs
Trust-USD 16,085,000 13,672,250 0.6
Jardine Cycle & Carriage 354,000 14,584,024 0.6
Keppel Corp 4,671,000 42,169,273 1.9
M1 Ltd 7,063,000 16,851,910 0.7
Neptune Orient Lines (CDP) 15,765,000 15,058,460 0.7
Noble Group 9,051,481 8,828,222 0.4
Oversea-Chinese Bkg (CDP) 6,175,546 52,715,647 2.3
Overseas Union
Enterprise (CDP) 15,999,000 39,591,270 1.8
Sembcorp Industries (CDP) 2,117,000 8,839,320 0.4
Singapore Telecom 11,834,000 34,244,769 1.5
Suntec REIT 13,245,000 19,163,933 0.8
Thai Beverage 71,267,000 35,041,810 1.5
United Overseas Bank 4,858,835 79,818,681 3.5
UOL Group (CDP) 1,200,000 6,751,572 0.3
Wilmar Intl 7,089,000 19,713,888 0.9
ThailandThailandThailandThailand (26.1%)
Advanced Information (F) 3,769,200 30,889,807 1.4
Airports of Thailand (F) 2,999,400 12,392,945 0.5
JPMORGAN ASEAN FUNDJPMORGAN ASEAN FUNDJPMORGAN ASEAN FUNDJPMORGAN ASEAN FUND (Formerly known as JF ASEAN Fund)(Formerly known as JF ASEAN Fund)(Formerly known as JF ASEAN Fund)(Formerly known as JF ASEAN Fund)
SemiSemiSemiSemi----annual report for theannual report for theannual report for theannual report for the
period ended 31 March 2013period ended 31 March 2013period ended 31 March 2013period ended 31 March 2013
- 2 -
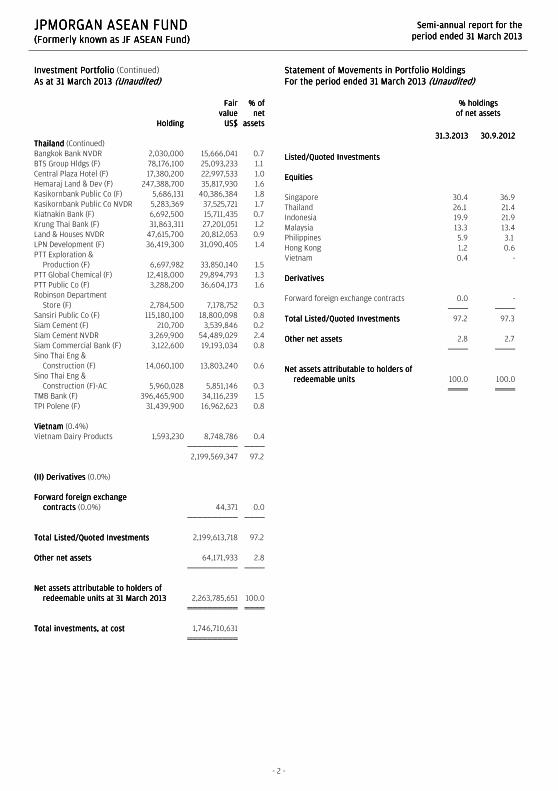
Investment PortfolioInvestment PortfolioInvestment PortfolioInvestment Portfolio (Continued)
As at 31 March 2013As at 31 March 2013As at 31 March 2013As at 31 March 2013 (Unaudited)(Unaudited)(Unaudited)(Unaudited)
HoldingHoldingHoldingHolding
FairFairFairFair
valuevaluevaluevalue
US$US$US$US$
% of% of% of% of
netnetnetnet
assetsassetsassetsassets
ThailandThailandThailandThailand (Continued)
Bangkok Bank NVDR 2,030,000 15,666,041 0.7
BTS Group Hldgs (F) 78,176,100 25,093,233 1.1
Central Plaza Hotel (F) 17,380,200 22,997,533 1.0
Hemaraj Land & Dev (F) 247,388,700 35,817,930 1.6
Kasikornbank Public Co (F) 5,686,131 40,386,384 1.8
Kasikornbank Public Co NVDR 5,283,369 37,525,721 1.7
Kiatnakin Bank (F) 6,692,500 15,711,435 0.7
Krung Thai Bank (F) 31,863,311 27,201,051 1.2
Land & Houses NVDR 47,615,700 20,812,053 0.9
LPN Development (F) 36,419,300 31,090,405 1.4
PTT Exploration &
Production (F) 6,697,982 33,850,140 1.5
PTT Global Chemical (F) 12,418,000 29,894,793 1.3
PTT Public Co (F) 3,288,200 36,604,173 1.6
Robinson Department
Store (F) 2,784,500 7,178,752 0.3
Sansiri Public Co (F) 115,180,100 18,800,098 0.8
Siam Cement (F) 210,700 3,539,846 0.2
Siam Cement NVDR 3,269,900 54,489,029 2.4
Siam Commercial Bank (F) 3,122,600 19,193,034 0.8
Sino Thai Eng &
Construction (F) 14,060,100 13,803,240 0.6
Sino Thai Eng &
Construction (F)-AC 5,960,028 5,851,146 0.3
TMB Bank (F) 396,465,900 34,116,239 1.5
TPI Polene (F) 31,439,900 16,962,623 0.8
VietnamVietnamVietnamVietnam (0.4%)
Vietnam Dairy Products 1,593,230 8,748,786 0.4
2,199,569,347 97.2
(II) Derivatives(II) Derivatives(II) Derivatives(II) Derivatives (0.0%)
Forward foreign exchangeForward foreign exchangeForward foreign exchangeForward foreign exchange
contracts contracts contracts contracts (0.0%) 44,371 0.0
Total Listed/Quoted InvestmentsTotal Listed/Quoted InvestmentsTotal Listed/Quoted InvestmentsTotal Listed/Quoted Investments 2,199,613,718 97.2
Other net assetsOther net assetsOther net assetsOther net assets 64,171,933 2.8
Net assets attributable to holders of Net assets attributable to holders of Net assets attributable to holders of Net assets attributable to holders of
redeemable units at 31 March 2013redeemable units at 31 March 2013redeemable units at 31 March 2013redeemable units at 31 March 2013 2,263,785,651 100.0
Total investments, at costTotal investments, at costTotal investments, at costTotal investments, at cost 1,746,710,631
Statement Statement Statement Statement of Movements in Portfolio Holdingsof Movements in Portfolio Holdingsof Movements in Portfolio Holdingsof Movements in Portfolio Holdings
For the period ended 31 March 2013For the period ended 31 March 2013For the period ended 31 March 2013For the period ended 31 March 2013 (Unaudited)(Unaudited)(Unaudited)(Unaudited)
% holdings% holdings% holdings% holdings
of net assetsof net assetsof net assetsof net assets
31.3.201331.3.201331.3.201331.3.2013 30.9.201230.9.201230.9.201230.9.2012
Listed/Quoted InvestmentsListed/Quoted InvestmentsListed/Quoted InvestmentsListed/Quoted Investments
EquitiesEquitiesEquitiesEquities
Singapore 30.4 36.9
Thailand 26.1 21.4
Indonesia 19.9 21.9
Malaysia 13.3 13.4
Philippines 5.9 3.1
Hong Kong 1.2 0.6
Vietnam 0.4 -
DerivativesDerivativesDerivativesDerivatives
Forward foreign exchange contracts 0.0 -
Total Listed/Quoted InvestmentsTotal Listed/Quoted InvestmentsTotal Listed/Quoted InvestmentsTotal Listed/Quoted Investments 97.2 97.3
Other net assetsOther net assetsOther net assetsOther net assets 2.8 2.7
Net assets Net assets Net assets Net assets attributable to holders of attributable to holders of attributable to holders of attributable to holders of
redeemable unitsredeemable unitsredeemable unitsredeemable units 100.0 100.0

JPMORGAN ASEAN FUNDJPMORGAN ASEAN FUNDJPMORGAN ASEAN FUNDJPMORGAN ASEAN FUND (Formerly known as JF ASEAN Fund)(Formerly known as JF ASEAN Fund)(Formerly known as JF ASEAN Fund)(Formerly known as JF ASEAN Fund)
SemiSemiSemiSemi----annual report for theannual report for theannual report for theannual report for the
period ended 31 March 2013period ended 31 March 2013period ended 31 March 2013period ended 31 March 2013
The notes on pages 5 to 8 form part of these financial statements.
- 3 -
Statement of Statement of Statement of Statement of Financial PositionFinancial PositionFinancial PositionFinancial Position
As at 31 March 2013As at 31 March 2013As at 31 March 2013As at 31 March 2013 (Unaudited)(Unaudited)(Unaudited)(Unaudited)
31.3.201331.3.201331.3.201331.3.2013 30.9.201230.9.201230.9.201230.9.2012
US$US$US$US$ US$US$US$US$
AssetsAssetsAssetsAssets
Cash at banks 21,937,075 2,521,791
Short term deposits 17,901,262 33,804,016
Amounts due from brokers 16,694,338 15,240,718
Amounts receivable on allotment 33,700,731 21,332,408
Derivatives [Note 3] 44,371 -
Investments [Note 3] 2,199,569,347 2,045,680,956
Dividend and other accounts
receivable 6,088,820 11,361,778
TotalTotalTotalTotal assetsassetsassetsassets 2,295,935,944 2,129,941,667
---------- ----------
LiabilitiesLiabilitiesLiabilitiesLiabilities
Amounts due to brokers 16,978,712 9,825,457
Amounts payable on redemption 25,169,381 15,242,460
Other accounts payable 2,599,470 2,773,226
Liabilities (excluding net assets Liabilities (excluding net assets Liabilities (excluding net assets Liabilities (excluding net assets
attributable to holders of attributable to holders of attributable to holders of attributable to holders of
redeemable units)redeemable units)redeemable units)redeemable units) 44,747,563 27,841,143
---------- ----------
Net assets attributable to holders Net assets attributable to holders Net assets attributable to holders Net assets attributable to holders
of redeemable units of redeemable units of redeemable units of redeemable units
(before fair value adjustment)(before fair value adjustment)(before fair value adjustment)(before fair value adjustment)
classified as financial classified as financial classified as financial classified as financial
liability/equityliability/equityliability/equityliability/equity [Note 3] 2,251,188,381 2,102,100,524
Fair value adjustment of units of
the Fund [Note 3] 12,597,270 -
Net assets attributable toNet assets attributable toNet assets attributable toNet assets attributable to holders holders holders holders
of redeemable unitsof redeemable unitsof redeemable unitsof redeemable units
(after fair value adjustment)(after fair value adjustment)(after fair value adjustment)(after fair value adjustment)
classified as financial classified as financial classified as financial classified as financial
liability/equityliability/equityliability/equityliability/equity [Note 3] 2,263,785,651 2,102,100,524
Statement of Comprehensive IncomeStatement of Comprehensive IncomeStatement of Comprehensive IncomeStatement of Comprehensive Income
For the period ended 31 For the period ended 31 For the period ended 31 For the period ended 31 March 2013March 2013March 2013March 2013 (Unaudited)(Unaudited)(Unaudited)(Unaudited)
1.10.20121.10.20121.10.20121.10.2012
totototo
31.3.201331.3.201331.3.201331.3.2013
1.10.20111.10.20111.10.20111.10.2011
totototo
31.3.201231.3.201231.3.201231.3.2012
US$US$US$US$ US$US$US$US$
IncomeIncomeIncomeIncome
Net gains on investments and
derivatives [Note 4] 326,175,131 361,452,759
Dividend income 15,497,709 12,571,903
Interest on deposits 25,231 195,108
Net foreign currency exchange
(losses)/gains (1,134,777) 132,167
Other income - 298
340,563,294 374,352,235
---------- ----------
ExpensesExpensesExpensesExpenses
Management fee 15,647,318 14,379,839
Transaction costs 3,369,057 4,526,523
Safe custody and bank charges 214,006 245,346
Registrar's fee 197,021 173,805
Trustee's fee 187,877 172,558
Auditor's fee 22,360 22,718
Printing and publication expenses 10,615 11,021
Legal and professional expenses 129 4,419
Other operating expenses 19,478 10,439
19,667,861 19,546,668
---------- ----------
Net operating profitNet operating profitNet operating profitNet operating profit 320,895,433 354,805,567
Finance costsFinance costsFinance costsFinance costs
Interest paid (44) -
Profit before taxationProfit before taxationProfit before taxationProfit before taxation 320,895,389 354,805,567
Taxation (1,232,971) (944,282)
319,662,418 353,861,285
Change in cumulative difference
arising from the fair value
adjustment of units of the
Fund 12,597,270 -
Increase in net assets Increase in net assets Increase in net assets Increase in net assets
attributable to holders of attributable to holders of attributable to holders of attributable to holders of
redeemable units and total redeemable units and total redeemable units and total redeemable units and total
comprehensive incomecomprehensive incomecomprehensive incomecomprehensive income 332,259,688 353,861,285

JPMORGAN ASEAN FUNDJPMORGAN ASEAN FUNDJPMORGAN ASEAN FUNDJPMORGAN ASEAN FUND (Formerly known as JF ASEAN Fund)(Formerly known as JF ASEAN Fund)(Formerly known as JF ASEAN Fund)(Formerly known as JF ASEAN Fund)
SemiSemiSemiSemi----annual report for theannual report for theannual report for theannual report for the
period ended 31 March 2013period ended 31 March 2013period ended 31 March 2013period ended 31 March 2013
The notes on pages 5 to 8 form part of these financial statements.
- 4 -
Statement of Changes in Net Assets Attributable to Holders Statement of Changes in Net Assets Attributable to Holders Statement of Changes in Net Assets Attributable to Holders Statement of Changes in Net Assets Attributable to Holders
of Redeemable Unitsof Redeemable Unitsof Redeemable Unitsof Redeemable Units
For the period ended 31 For the period ended 31 For the period ended 31 For the period ended 31 March 2013March 2013March 2013March 2013 (Unaudited)(Unaudited)(Unaudited)(Unaudited)
1.10.20121.10.20121.10.20121.10.2012
totototo
31.3.201331.3.201331.3.201331.3.2013
1.10.20111.10.20111.10.20111.10.2011
totototo
31.3.201231.3.201231.3.201231.3.2012
US$US$US$US$ US$US$US$US$
Net assets attributable to holders Net assets attributable to holders Net assets attributable to holders Net assets attributable to holders
of redeemable units at the of redeemable units at the of redeemable units at the of redeemable units at the
beginning of the periodbeginning of the periodbeginning of the periodbeginning of the period 2,102,100,524 1,748,286,001
---------- ----------
Allotment of redeemable units 577,006,453 384,514,295
Redemption of redeemable units (747,581,014) (419,840,139)
Net redemptionNet redemptionNet redemptionNet redemption (170,574,561) (35,325,844)
---------- ----------
1,931,525,963 1,712,960,157
Increase in net assets Increase in net assets Increase in net assets Increase in net assets
attributable to holders of attributable to holders of attributable to holders of attributable to holders of
redeemable units and total redeemable units and total redeemable units and total redeemable units and total
comprehensive incomecomprehensive incomecomprehensive incomecomprehensive income 332,259,688 353,861,285
Net assets attributable to holders Net assets attributable to holders Net assets attributable to holders Net assets attributable to holders
of redeemable units at the end of redeemable units at the end of redeemable units at the end of redeemable units at the end
of the periodof the periodof the periodof the period 2,263,785,651 2,066,821,442
Statement of Cash FlowsStatement of Cash FlowsStatement of Cash FlowsStatement of Cash Flows
For the period ended 31 March 2013For the period ended 31 March 2013For the period ended 31 March 2013For the period ended 31 March 2013 (Unaudited)(Unaudited)(Unaudited)(Unaudited)
1.10.20121.10.20121.10.20121.10.2012
totototo
31.3.201331.3.201331.3.201331.3.2013
1.10.20111.10.20111.10.20111.10.2011
totototo
31.3.201231.3.201231.3.201231.3.2012
US$US$US$US$ US$US$US$US$
Operating activitiesOperating activitiesOperating activitiesOperating activities
Purchase of investments and
derivatives (654,981,331) (1,192,339,288)
Proceeds from disposal of
investments and derivatives 841,209,504 1,124,284,090
Dividend received 12,494,798 11,079,168
Interest received 25,054 196,694
Trustee's fee paid (185,958) (170,279)
Registrar's fee paid (373,165) (355,809)
Tax paid (1,232,971) (944,282)
Transaction costs paid (3,362,475) (4,423,664)
Management fee paid (15,488,770) (14,189,932)
Others (1,569,679) (179,080)
Net cash inflow/(outflow) from Net cash inflow/(outflow) from Net cash inflow/(outflow) from Net cash inflow/(outflow) from
operating activitiesoperating activitiesoperating activitiesoperating activities 176,535,007 (77,042,382)
---------- ----------
Financing activitiesFinancing activitiesFinancing activitiesFinancing activities
Interest paid (44) -
Receipts on allotment of
redeemable units 564,638,130 379,090,781
Payments on redemption of
redeemable units (737,654,093) (420,738,168)
NetNetNetNet cash outflow from cash outflow from cash outflow from cash outflow from
financing activitiesfinancing activitiesfinancing activitiesfinancing activities (173,016,007) (41,647,387)
---------- ----------
Increase/(decrease) in cash and Increase/(decrease) in cash and Increase/(decrease) in cash and Increase/(decrease) in cash and
cash equivalentscash equivalentscash equivalentscash equivalents 3,519,000 (118,689,769)
Cash and cash equivalents at the
beginning of the period 36,325,807 157,679,007
Exchange (losses)/gains on cash
and cash equivalents (6,470) 12
Cash and cash equivalents at Cash and cash equivalents at Cash and cash equivalents at Cash and cash equivalents at
the end of the periodthe end of the periodthe end of the periodthe end of the period 39,838,337 38,989,250
Analysis of balances of cash and cash equivalents:Analysis of balances of cash and cash equivalents:Analysis of balances of cash and cash equivalents:Analysis of balances of cash and cash equivalents:
Cash at banks 21,937,075 12,235,409
Short term deposits 17,901,262 26,753,841
39,838,337 38,989,250
JPMORGAN ASEAN FUNDJPMORGAN ASEAN FUNDJPMORGAN ASEAN FUNDJPMORGAN ASEAN FUND (Formerly known as JF ASEAN Fund)(Formerly known as JF ASEAN Fund)(Formerly known as JF ASEAN Fund)(Formerly known as JF ASEAN Fund)
SemiSemiSemiSemi----annual report for theannual report for theannual report for theannual report for the
period ended 31 March 2013period ended 31 March 2013period ended 31 March 2013period ended 31 March 2013
- 5 -
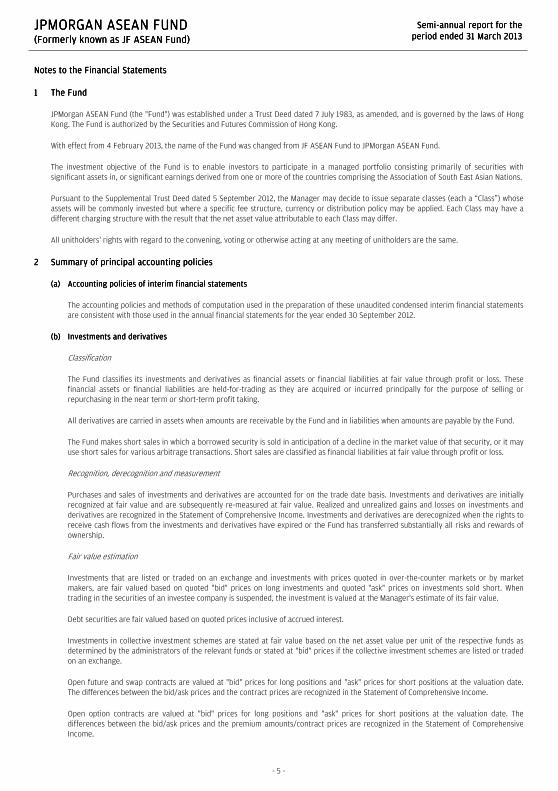
Notes to the Financial StatementsNotes to the Financial StatementsNotes to the Financial StatementsNotes to the Financial Statements
1111 The FundThe FundThe FundThe Fund
JPMorgan ASEAN Fund (the "Fund") was established under a Trust Deed dated 7 July 1983, as amended, and is governed by the laws of Hong
Kong. The Fund is authorized by the Securities and Futures Commission of Hong Kong.
With effect from 4 February 2013, the name of the Fund was changed from JF ASEAN Fund to JPMorgan ASEAN Fund.
The investment objective of the Fund is to enable investors to participate in a managed portfolio consisting primarily of securities with
significant assets in, or significant earnings derived from one or more of the countries comprising the Association of South East Asian Nations.
Pursuant to the Supplemental Trust Deed dated 5 September 2012, the Manager may decide to issue separate classes (each a “Class”) whose
assets will be commonly invested but where a specific fee structure, currency or distribution policy may be applied. Each Class may have a
different charging structure with the result that the net asset value attributable to each Class may differ.
All unitholders' rights with regard to the convening, voting or otherwise acting at any meeting of unitholders are the same.
2222 Summary of principal accounting policiesSummary of principal accounting policiesSummary of principal accounting policiesSummary of principal accounting policies
(a)(a)(a)(a) Accounting policies of interim financial statAccounting policies of interim financial statAccounting policies of interim financial statAccounting policies of interim financial statementsementsementsements
The accounting policies and methods of computation used in the preparation of these unaudited condensed interim financial statements
are consistent with those used in the annual financial statements for the year ended 30 September 2012.
(b)(b)(b)(b) Investments Investments Investments Investments and derivativesand derivativesand derivativesand derivatives
Classification
The Fund classifies its investments and derivatives as financial assets or financial liabilities at fair value through profit or loss. These
financial assets or financial liabilities are held-for-trading as they are acquired or incurred principally for the purpose of selling or
repurchasing in the near term or short-term profit taking.
All derivatives are carried in assets when amounts are receivable by the Fund and in liabilities when amounts are payable by the Fund.
The Fund makes short sales in which a borrowed security is sold in anticipation of a decline in the market value of that security, or it may
use short sales for various arbitrage transactions. Short sales are classified as financial liabilities at fair value through profit or loss.
Recognition, derecognition and measurement
Purchases and sales of investments and derivatives are accounted for on the trade date basis. Investments and derivatives are initially
recognized at fair value and are subsequently re-measured at fair value. Realized and unrealized gains and losses on investments and
derivatives are recognized in the Statement of Comprehensive Income. Investments and derivatives are derecognized when the rights to
receive cash flows from the investments and derivatives have expired or the Fund has transferred substantially all risks and rewards of
ownership.
Fair value estimation
Investments that are listed or traded on an exchange and investments with prices quoted in over-the-counter markets or by market
makers, are fair valued based on quoted "bid" prices on long investments and quoted "ask" prices on investments sold short. When
trading in the securities of an investee company is suspended, the investment is valued at the Manager's estimate of its fair value.
Debt securities are fair valued based on quoted prices inclusive of accrued interest.
Investments in collective investment schemes are stated at fair value based on the net asset value per unit of the respective funds as
determined by the administrators of the relevant funds or stated at "bid" prices if the collective investment schemes are listed or traded
on an exchange.
Open future and swap contracts are valued at "bid" prices for long positions and "ask" prices for short positions at the valuation date.
The differences between the bid/ask prices and the contract prices are recognized in the Statement of Comprehensive Income.
Open option contracts are valued at "bid" prices for long positions and "ask" prices for short positions at the valuation date. The
differences between the bid/ask prices and the premium amounts/contract prices are recognized in the Statement of Comprehensive
Income.

JPMORGAN ASEAN FUNDJPMORGAN ASEAN FUNDJPMORGAN ASEAN FUNDJPMORGAN ASEAN FUND (Formerly known as JF ASEAN Fund)(Formerly known as JF ASEAN Fund)(Formerly known as JF ASEAN Fund)(Formerly known as JF ASEAN Fund)
SemiSemiSemiSemi----annual report for theannual report for theannual report for theannual report for the
period ended 31 March 2013period ended 31 March 2013period ended 31 March 2013period ended 31 March 2013
- 6 -
Forward foreign exchange contracts are valued at the forward rates ruling at the valuation date. The differences between the forward
rates and the contract rates are recognized in the Statement of Comprehensive Income.
(c)(c)(c)(c) Securities borrowingSecurities borrowingSecurities borrowingSecurities borrowing
The Fund may enter into securities borrowing arrangements for short sale purposes. Short positions represent obligations to deliver
securities sold but not yet purchased, and are accounted for as investments and valued at their fair value. Securities borrowed during the
period/year are off-balance sheet transactions and are therefore not included in the investment portfolio of the Fund. Collateral placed
for the purpose of securities borrowed generally consist of cash collateral and are included in the Statement of Financial Position
separately.
(d)(d)(d)(d) Foreign currency translationForeign currency translationForeign currency translationForeign currency translation
Functional and presentation currency
The Fund has adopted United States dollar as its functional and presentation currency.
Transactions and balances
Foreign currency transactions are translated into the functional currency using the exchange rates prevailing at the dates of the
transactions.
Foreign exchange gains and losses resulting from the settlement of such transactions and from the translation of assets and liabilities
denominated in foreign currencies at period/year end exchange rates are recognized in the Statement of Comprehensive Income.
Foreign exchange gains and losses relating to cash and cash equivalents are presented in the Statement of Comprehensive Income
within "Net foreign currency exchange gains/losses". Foreign exchange gains and losses relating to the financial assets and liabilities
carried at fair value through profit or loss are presented in the Statement of Comprehensive Income within "Net gains/losses on
investments and derivatives".
(e)(e)(e)(e) Proceeds and payments on allotment and redemption of unitsProceeds and payments on allotment and redemption of unitsProceeds and payments on allotment and redemption of unitsProceeds and payments on allotment and redemption of units
The net asset value per unit is computed for each dealing day. The price at which units are allotted or redeemed is calculated by
reference to the net asset value per unit as at the close of business on the relevant dealing day in accordance with the provisions of the
Fund's Trust Deed dated 7 July 1983, as amended, which may be different from the accounting policies stated in the financial statements.
Units of the Fund are redeemable at the option of the holders of redeemable units and are classified as a financial liability in the
Statement of Financial Position which represents the net assets attributable to holders of redeemable units (or "net asset value" or "net
assets" or "NAV") and is carried at the redemption amount that would be payable at the Statement of Financial Position date if the
holders of redeemable units exercised the right to redeem units of the Fund.
3333 Net assets attributable to holders of redeemable units and number of units in issueNet assets attributable to holders of redeemable units and number of units in issueNet assets attributable to holders of redeemable units and number of units in issueNet assets attributable to holders of redeemable units and number of units in issue
Fair value adjustment of units of the Fund
As at 31 March 2013, there were three classes in the Fund. The net assets attributable to the holders of redeemable units was classified as a
financial liability which carried at the redemption amount that would be payable at the Statement of Financial Position date, if the holders of
redeemable units exercised the right to redeem units of the Fund. The redemption amount is determined based on the net assets attributable
to holders of redeemable units calculated in accordance with the provisions of the Fund's Trust Deed dated 7 July 1983, as amended ("Trust
Deed NAV").
31.3.2013
US$
Net assets attributable to holders of redeemable units (before fair value adjustment) 2,251,188,381
Fair value adjustment of units of the Fund:
Difference between bid/ask prices and last traded prices basis in valuing investments and
derivatives as at the end of the period [Note 3(a)] 12,597,270
Net assets attributable to holders of redeemable units (after fair value adjustment) 2,263,,785,651
JPMORGAN ASEAN FUNDJPMORGAN ASEAN FUNDJPMORGAN ASEAN FUNDJPMORGAN ASEAN FUND (Formerly known as JF ASEAN Fund)(Formerly known as JF ASEAN Fund)(Formerly known as JF ASEAN Fund)(Formerly known as JF ASEAN Fund)
SemiSemiSemiSemi----annual report for theannual report for theannual report for theannual report for the
period ended 31 March 2013period ended 31 March 2013period ended 31 March 2013period ended 31 March 2013
- 7 -
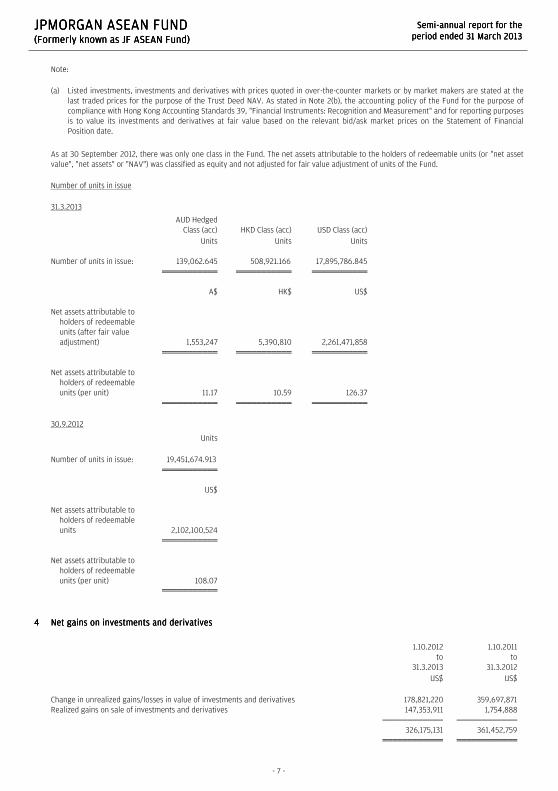
Note:
(a) Listed investments, investments and derivatives with prices quoted in over-the-counter markets or by market makers are stated at the
last traded prices for the purpose of the Trust Deed NAV. As stated in Note 2(b), the accounting policy of the Fund for the purpose of
compliance with Hong Kong Accounting Standards 39, "Financial Instruments: Recognition and Measurement" and for reporting purposes
is to value its investments and derivatives at fair value based on the relevant bid/ask market prices on the Statement of Financial
Position date.
As at 30 September 2012, there was only one class in the Fund. The net assets attributable to the holders of redeemable units (or "net asset
value", "net assets" or "NAV") was classified as equity and not adjusted for fair value adjustment of units of the Fund.
Number of units in issue
31.3.2013
AUD Hedged
Class (acc) HKD Class (acc) USD Class (acc)
Units Units Units
Number of units in issue: 139,062.645 508,921.166 17,895,786.845
A$ HK$ US$
Net assets attributable to
holders of redeemable
units (after fair value
adjustment) 1,553,247 5,390,810 2,261,471,858
Net assets attributable to
holders of redeemable
units (per unit) 11.17 10.59 126.37
30.9.2012
Units
Number of units in issue: 19,451,674.913
US$
Net assets attributable to
holders of redeemable
units 2,102,100,524
Net assets attributable to
holders of redeemable
units (per unit) 108.07
4444 Net gains on investments and derivativesNet gains on investments and derivativesNet gains on investments and derivativesNet gains on investments and derivatives
1.10.2012
to
31.3.2013
1.10.2011
to
31.3.2012
US$ US$
Change in unrealized gains/losses in value of investments and derivatives 178,821,220 359,697,871
Realized gains on sale of investments and derivatives 147,353,911 1,754,888
326,175,131 361,452,759

JPMORGAN ASEAN FUNDJPMORGAN ASEAN FUNDJPMORGAN ASEAN FUNDJPMORGAN ASEAN FUND (Formerly known as JF ASEAN Fund)(Formerly known as JF ASEAN Fund)(Formerly known as JF ASEAN Fund)(Formerly known as JF ASEAN Fund)
SemiSemiSemiSemi----annual report for theannual report for theannual report for theannual report for the
period ended 31 March 2013period ended 31 March 2013period ended 31 March 2013period ended 31 March 2013
- 8 -
5555 Soft commission Soft commission Soft commission Soft commission arrangementsarrangementsarrangementsarrangements
The Investment Manager has entered into soft commission arrangements with brokers under which certain goods and services used to
support investment decision making are received by the Investment Manager. The Investment Manager does not make direct payment for
these services but transacts an agreed amount of business with the brokers on behalf of the Fund. Commission is paid from the Fund on these
transactions.
The goods and services must be of demonstrable benefit to the Fund and may include research and advisory services; economic and political
analysis; portfolio analysis, including valuation and performance measurement; market analysis, data and quotation services, computer
hardware and software incidental to the above goods and services; clearing and custodian services and investment-related publications.
6666 DistributionDistributionDistributionDistribution
No distribution was made during the period (31 March 2012: nil).

JPMORGAN ASIA DOMESTIC OPPORTUNITIES FUNDJPMORGAN ASIA DOMESTIC OPPORTUNITIES FUNDJPMORGAN ASIA DOMESTIC OPPORTUNITIES FUNDJPMORGAN ASIA DOMESTIC OPPORTUNITIES FUND (Formerly known as JF Asia Domestic Opportunities Fund)(Formerly known as JF Asia Domestic Opportunities Fund)(Formerly known as JF Asia Domestic Opportunities Fund)(Formerly known as JF Asia Domestic Opportunities Fund)
SemiSemiSemiSemi----annual report for theannual report for theannual report for theannual report for the
period ended 31 March 2013period ended 31 March 2013period ended 31 March 2013period ended 31 March 2013
- 9 -
Investment PortfolioInvestment PortfolioInvestment PortfolioInvestment Portfolio
As at 31 March 2013As at 31 March 2013As at 31 March 2013As at 31 March 2013 (Unaudited)(Unaudited)(Unaudited)(Unaudited)
HoldingHoldingHoldingHolding
FairFairFairFair
valuevaluevaluevalue
US$US$US$US$
% of% of% of% of
netnetnetnet
assetsassetsassetsassets
Listed/Quoted InvestmentsListed/Quoted InvestmentsListed/Quoted InvestmentsListed/Quoted Investments (101.4%)
EquitiesEquitiesEquitiesEquities (101.4%)
ChinaChinaChinaChina (35.7%)
Baidu Inc ADR 20,568 1,803,814 0.5
Belle Intl Hldgs 4,633,000 7,687,200 2.2
China Eastern Airlines 'H' 20,520,000 8,881,915 2.5
China Minsheng Banking 'H' 6,642,500 8,462,874 2.4
China National Bldg
Material 'H' 4,340,000 5,456,693 1.5
China Petroleum &
Chemical 'H' 6,278,000 7,375,749 2.1
China Resources Gas Group 3,874,000 10,679,807 3.0
China Resources Land 1,634,000 4,557,220 1.3
China Shipping
Development 'H' 5,178,000 2,501,401 0.7
China Vanke 'B' 5,073,709 9,797,543 2.8
CITIC Securities 'H' 3,148,000 6,788,599 1.9
Geely Automobile Hldgs 12,090,000 5,871,616 1.6
Great Wall Motor 'H' 2,043,000 6,895,403 1.9
Intime Department
Store (Group) 8,368,000 9,486,245 2.7
New China Life Insurance 'H' 1,978,600 6,716,277 1.9
Tencent Hldgs 465,000 14,771,887 4.2
Want Want China Hldgs 5,912,000 9,047,756 2.5
Hong KongHong KongHong KongHong Kong (22.0%)
AIA Group 2,445,600 10,680,095 3.0
Galaxy Entertainment Group 2,208,000 9,201,600 2.6
Jardine Matheson Hldgs 106,400 6,926,640 1.9
Lifestyle Intl Hldgs 3,445,500 7,616,572 2.1
Midland Hldgs 5,934,000 2,614,349 0.7
New World Development 5,413,477 9,163,506 2.6
Prada SpA 1,226,700 12,357,627 3.5
Sands China 1,560,400 8,060,655 2.3
Trinity Ltd 6,770,000 3,436,172 1.0
Wharf (Hldgs) 913,000 8,127,160 2.3
IndiaIndiaIndiaIndia (7.1%)
ACC Ltd 158,000 3,366,403 1.0
Ambuja Cements 1,800,000 5,756,026 1.6
Housing Development Finance 538,374 8,146,931 2.3
Mahindra & Mahindra 252,500 4,001,440 1.1
Maruti Suzuki India 167,195 3,924,591 1.1
IndonesiaIndonesiaIndonesiaIndonesia (4.0%)
Alam Sutera Realty 32,000,000 3,523,540 1.0
Bank Central Asia 2,130,000 2,400,154 0.7
Berlian Laju Tanker-SG List 100,000,000 0 0.0
Ciputra Surya 7,203,500 2,075,616 0.6
Indosiar Karya Media 17,760,000 2,321,091 0.6
Matahari Department Store 1,366,000 1,546,282 0.4
Tempo Scan Pacific 6,434,000 2,466,339 0.7
(Continued)
HoldingHoldingHoldingHolding
FairFairFairFair
valuevaluevaluevalue
US$US$US$US$
% of% of% of% of
netnetnetnet
assetsassetsassetsassets
KoreaKoreaKoreaKorea (11.2%)
E-MART Co 12,994 2,569,369 0.7
Hyundai Motor 28,028 5,630,288 1.6
KB Financial Group 53,660 1,808,601 0.5
KIA Motors 116,943 5,843,997 1.6
LG Household & Healthcare 6,762 3,737,758 1.1
Lotte Shopping 11,126 4,085,000 1.2
Samsung C&T 80,925 4,982,350 1.4
Samsung Electronics 4,709 6,458,686 1.8
Samsung Engineering 40,371 4,717,086 1.3
SingaporeSingaporeSingaporeSingapore (5.7%)
Courts Asia 5,865,000 4,680,276 1.3
Guocoland Ltd (CDP) 1,567,000 2,917,758 0.8
Noble Group 1,936,000 1,888,248 0.6
Overseas Education 6,546,000 3,799,065 1.1
Overseas Union
Enterprise (CDP) 1,415,000 3,501,572 1.0
Thai Beverage 6,693,000 3,290,932 0.9
TaiwanTaiwanTaiwanTaiwan (8.1%)
Cheng Shin Rubber Industry 687,000 2,019,473 0.5
Prince Housing &
Development 9,344,643 6,640,704 1.9
Ruentex Development 5,788,000 11,787,951 3.3
Uni-President Enterprises 4,448,630 8,420,448 2.4
ThailandThailandThailandThailand (7.6%)
Kasikornbank Public Co NVDR 891,000 6,328,428 1.8
LPN Development NVDR 12,418,800 10,601,673 3.0
Siam Cement NVDR 378,000 6,298,924 1.8
TMB Bank NVDR 41,091,300 3,535,943 1.0
Total Listed/Quoted InvestmentsTotal Listed/Quoted InvestmentsTotal Listed/Quoted InvestmentsTotal Listed/Quoted Investments 360,039,318 101.4
Other net Other net Other net Other net liabilitiesliabilitiesliabilitiesliabilities (5,123,227) (1.4)
Net assets attributable to holders of Net assets attributable to holders of Net assets attributable to holders of Net assets attributable to holders of
redeemable units at 31 March 2013redeemable units at 31 March 2013redeemable units at 31 March 2013redeemable units at 31 March 2013 354,916,091 100.0
Total investments, at costTotal investments, at costTotal investments, at costTotal investments, at cost 292,128,174

JPMORGAN ASIA DOMESTIC OPPORTUNITIES FUNDJPMORGAN ASIA DOMESTIC OPPORTUNITIES FUNDJPMORGAN ASIA DOMESTIC OPPORTUNITIES FUNDJPMORGAN ASIA DOMESTIC OPPORTUNITIES FUND (Formerly known as JF Asia Domestic Opportunities Fund)(Formerly known as JF Asia Domestic Opportunities Fund)(Formerly known as JF Asia Domestic Opportunities Fund)(Formerly known as JF Asia Domestic Opportunities Fund)
SemiSemiSemiSemi----annual report for theannual report for theannual report for theannual report for the
period ended 31 March 2013period ended 31 March 2013period ended 31 March 2013period ended 31 March 2013
- 10 -
Statement of Movements in Statement of Movements in Statement of Movements in Statement of Movements in Portfolio HoldingsPortfolio HoldingsPortfolio HoldingsPortfolio Holdings
For the period ended 31 March 2013For the period ended 31 March 2013For the period ended 31 March 2013For the period ended 31 March 2013 (Unaudited)(Unaudited)(Unaudited)(Unaudited)
% holdings% holdings% holdings% holdings
of net assetsof net assetsof net assetsof net assets
31.3.201331.3.201331.3.201331.3.2013 30.9.201230.9.201230.9.201230.9.2012
Listed/Quoted InvestmentsListed/Quoted InvestmentsListed/Quoted InvestmentsListed/Quoted Investments
EquitiesEquitiesEquitiesEquities
China 35.7 36.3
Hong Kong 22.0 19.6
Korea 11.2 7.9
Taiwan 8.1 8.7
Thailand 7.6 7.5
India 7.1 7.6
Singapore 5.7 5.6
Indonesia 4.0 5.8
Collective Investment SchemesCollective Investment SchemesCollective Investment SchemesCollective Investment Schemes
China - 2.1
Total Listed/Quoted InvestmentsTotal Listed/Quoted InvestmentsTotal Listed/Quoted InvestmentsTotal Listed/Quoted Investments 101.4 101.1
Other net liabilitiesOther net liabilitiesOther net liabilitiesOther net liabilities (1.4) (1.1)
Net assets attributable to Net assets attributable to Net assets attributable to Net assets attributable to holders of holders of holders of holders of
redeemable unitsredeemable unitsredeemable unitsredeemable units 100.0 100.0

JPMORGAN ASIA DOMESTIC OPPORTUNITIES FUNDJPMORGAN ASIA DOMESTIC OPPORTUNITIES FUNDJPMORGAN ASIA DOMESTIC OPPORTUNITIES FUNDJPMORGAN ASIA DOMESTIC OPPORTUNITIES FUND (Formerly known as JF Asia Domestic Opportunities Fund)(Formerly known as JF Asia Domestic Opportunities Fund)(Formerly known as JF Asia Domestic Opportunities Fund)(Formerly known as JF Asia Domestic Opportunities Fund)
SemiSemiSemiSemi----annual report for theannual report for theannual report for theannual report for the
period ended 31 March 2013period ended 31 March 2013period ended 31 March 2013period ended 31 March 2013
The notes on pages 13 to 15 form part of these financial statements.
- 11 -
Statement of Financial PositionStatement of Financial PositionStatement of Financial PositionStatement of Financial Position
As at 31 March 2013As at 31 March 2013As at 31 March 2013As at 31 March 2013 (Unaudited)(Unaudited)(Unaudited)(Unaudited)
31.3.201331.3.201331.3.201331.3.2013 30.9.201230.9.201230.9.201230.9.2012
US$US$US$US$ US$US$US$US$
AssetsAssetsAssetsAssets
Cash at banks 69,319 129,924
Amounts due from brokers 1,726,017 575,205
Amounts receivable on allotment 295,482 186,719
Investments 360,039,318 366,503,214
Dividend and other accounts
receivable 1,958,037 1,205,421
Total assetsTotal assetsTotal assetsTotal assets 364,088,173 368,600,483
---------- ----------
LiabilitiesLiabilitiesLiabilitiesLiabilities
Short term bank loans - unsecured 6,988,659 4,320,664
Amounts payable on redemption 1,743,034 925,526
Other accounts payable 440,389 752,182
Total liabilitiesTotal liabilitiesTotal liabilitiesTotal liabilities 9,172,082 5,998,372
---------- ----------
Net assets attributable to holders Net assets attributable to holders Net assets attributable to holders Net assets attributable to holders
of redeemable units of redeemable units of redeemable units of redeemable units [Note 3] 354,916,091 362,602,111
EquityEquityEquityEquity 354,916,091 362,602,111
Statement of Comprehensive IncomeStatement of Comprehensive IncomeStatement of Comprehensive IncomeStatement of Comprehensive Income
For the period ended 31 March 2013For the period ended 31 March 2013For the period ended 31 March 2013For the period ended 31 March 2013 (Unaudited)(Unaudited)(Unaudited)(Unaudited)
1.10.20121.10.20121.10.20121.10.2012
totototo
31.3.201331.3.201331.3.201331.3.2013
1.10.20111.10.20111.10.20111.10.2011
totototo
31.3.201231.3.201231.3.201231.3.2012
US$US$US$US$ US$US$US$US$
IncomeIncomeIncomeIncome
Net gains on investments and
derivatives [Note 4] 42,117,245 58,396,065
Dividend income 1,593,676 2,605,828
Interest on deposits 183 13,468
Net foreign currency exchange
losses (210,587) (348,774)
Other income 255,902 -
43,756,419 60,666,587
---------- ----------
ExpensesExpensesExpensesExpenses
Management fee 2,690,962 3,028,394
Transaction costs 751,107 1,085,138
Trustee's fee 54,603 69,120
Registrar's fee 52,490 56,235
Safe custody and bank charges 47,497 67,556
Auditor's fee 13,879 14,341
Legal and professional expenses 10,168 11,401
Valuation fee 8,400 8,610
Printing and publication expenses 3,177 3,857
Other operating expenses 7,123 4,281
3,639,406 4,348,933
---------- ----------
Net operating profitNet operating profitNet operating profitNet operating profit 40,117,013 56,317,654
Finance costsFinance costsFinance costsFinance costs
Interest paid (29,908) (204)
Profit before taxationProfit before taxationProfit before taxationProfit before taxation 40,087,105 56,317,450
Taxation (188,071) (272,097)
Increase in net assets Increase in net assets Increase in net assets Increase in net assets
attributable to holders of attributable to holders of attributable to holders of attributable to holders of
redeemable units and total redeemable units and total redeemable units and total redeemable units and total
comprehensive incomecomprehensive incomecomprehensive incomecomprehensive income 39,899,034 56,045,353

JPMORGAN ASIA DOMESTIC OPPORTUNITIES FUNDJPMORGAN ASIA DOMESTIC OPPORTUNITIES FUNDJPMORGAN ASIA DOMESTIC OPPORTUNITIES FUNDJPMORGAN ASIA DOMESTIC OPPORTUNITIES FUND (Formerly known as JF Asia Domestic Opportunities Fund)(Formerly known as JF Asia Domestic Opportunities Fund)(Formerly known as JF Asia Domestic Opportunities Fund)(Formerly known as JF Asia Domestic Opportunities Fund)
SemiSemiSemiSemi----annual report for theannual report for theannual report for theannual report for the
period ended 31 March 2013period ended 31 March 2013period ended 31 March 2013period ended 31 March 2013
The notes on pages 13 to 15 form part of these financial statements.
- 12 -
Statement of Changes in Net Assets Attributable to Holders Statement of Changes in Net Assets Attributable to Holders Statement of Changes in Net Assets Attributable to Holders Statement of Changes in Net Assets Attributable to Holders
of Redeemable of Redeemable of Redeemable of Redeemable UnitsUnitsUnitsUnits
For the period ended 31 March 2013For the period ended 31 March 2013For the period ended 31 March 2013For the period ended 31 March 2013 (Unaudited)(Unaudited)(Unaudited)(Unaudited)
1.10.20121.10.20121.10.20121.10.2012
totototo
31.3.201331.3.201331.3.201331.3.2013
1.10.20111.10.20111.10.20111.10.2011
totototo
31.3.201231.3.201231.3.201231.3.2012
US$US$US$US$ US$US$US$US$
Net assets attributable to holders Net assets attributable to holders Net assets attributable to holders Net assets attributable to holders
of redeemable units at the of redeemable units at the of redeemable units at the of redeemable units at the
beginning of the periodbeginning of the periodbeginning of the periodbeginning of the period 362,602,111 401,206,565
---------- ----------
Allotment of redeemable units 16,393,141 9,977,928
Redemption of redeemable units (63,978,195) (61,710,494)
Net redemptionNet redemptionNet redemptionNet redemption (47,585,054) (51,732,566)
---------- ----------
315,017,057 349,473,999
Increase in net Increase in net Increase in net Increase in net assets assets assets assets
attributable to holders of attributable to holders of attributable to holders of attributable to holders of
redeemable units and total redeemable units and total redeemable units and total redeemable units and total
comprehensive incomecomprehensive incomecomprehensive incomecomprehensive income 39,899,034 56,045,353
Net assets attributable to holders Net assets attributable to holders Net assets attributable to holders Net assets attributable to holders
of redeemable units at the end of redeemable units at the end of redeemable units at the end of redeemable units at the end
of the periodof the periodof the periodof the period 354,916,091 405,519,352
Statement of Cash FlowsStatement of Cash FlowsStatement of Cash FlowsStatement of Cash Flows
For the period ended 31 March 2013For the period ended 31 March 2013For the period ended 31 March 2013For the period ended 31 March 2013 (Unaudited)(Unaudited)(Unaudited)(Unaudited)
1.10.20121.10.20121.10.20121.10.2012
totototo
31.3.201331.3.201331.3.201331.3.2013
1.10.20111.10.20111.10.20111.10.2011
totototo
31.3.201231.3.201231.3.201231.3.2012
US$US$US$US$ US$US$US$US$
Operating activitiesOperating activitiesOperating activitiesOperating activities
Purchase of investments and
derivatives (108,150,814) (173,523,517)
Proceeds from disposal of
investments and derivatives 155,369,456 216,228,469
Dividend received 1,049,877 2,590,677
Interest received 182 13,593
Trustee's fee paid (54,452) (74,587)
Registrar's fee paid (101,571) (118,795)
Tax paid (188,071) (331,571)
Transaction costs paid (750,332) (1,072,545)
Management fee paid (2,672,036) (3,087,332)
Others (324,870) (495,047)
Net cash inflow from operating Net cash inflow from operating Net cash inflow from operating Net cash inflow from operating
activitiesactivitiesactivitiesactivities 44,177,369 40,129,345
---------- ----------
Financing activitiesFinancing activitiesFinancing activitiesFinancing activities
Interest paid (29,575) (204)
Receipts on allotment of
redeemable units 16,284,378 9,823,012
Payments on redemption of
redeemable units (63,160,687) (60,782,296)
Net cash outflow from Net cash outflow from Net cash outflow from Net cash outflow from
financing activitiesfinancing activitiesfinancing activitiesfinancing activities (46,905,884) (50,959,488)
---------- ----------
Decrease in cash and cash Decrease in cash and cash Decrease in cash and cash Decrease in cash and cash
equivalentsequivalentsequivalentsequivalents (2,728,515) (10,830,143)
Cash and cash equivalents at the
beginning of the period (4,190,740) 11,620,678
Exchange (losses)/gains on cash
and cash equivalents (85) 7,875
Cash and cash equivalents at Cash and cash equivalents at Cash and cash equivalents at Cash and cash equivalents at
the end of the periodthe end of the periodthe end of the periodthe end of the period (6,919,340) 798,410
Analysis of balances of cash and cash equivalents:Analysis of balances of cash and cash equivalents:Analysis of balances of cash and cash equivalents:Analysis of balances of cash and cash equivalents:
Cash at banks 69,319 798,410
Short term bank loans -
unsecured (6,988,659) -
(6,919,340) 798,410
JPMORGAN ASIA DOMESTIC OPPORTUNITIES FUNDJPMORGAN ASIA DOMESTIC OPPORTUNITIES FUNDJPMORGAN ASIA DOMESTIC OPPORTUNITIES FUNDJPMORGAN ASIA DOMESTIC OPPORTUNITIES FUND ((((Formerly known as JF Asia Domestic Opportunities FundFormerly known as JF Asia Domestic Opportunities FundFormerly known as JF Asia Domestic Opportunities FundFormerly known as JF Asia Domestic Opportunities Fund))))
SemiSemiSemiSemi----annual report for theannual report for theannual report for theannual report for the
period ended 31 March 2013period ended 31 March 2013period ended 31 March 2013period ended 31 March 2013
- 13 -
Notes to the Financial StatementsNotes to the Financial StatementsNotes to the Financial StatementsNotes to the Financial Statements
1111 The FundThe FundThe FundThe Fund
JPMorgan Asia Domestic Opportunities Fund (the "Fund") was established under a Trust Deed dated 11 May 2007, as amended, and is
governed by the laws of Hong Kong. The Fund is authorized by the Securities and Futures Commission of Hong Kong.
With effect from and including 1 October 2012, the performance fee currently received by the Manager in respect of the Fund was removed.
Any cumulative performance fee accrued on each dealing day up to 28 September 2012 would be crystallised on 28 September 2012 and
became payable to the Manager (if any). On 28 September 2012, no performance fee was crystallised in relation to the Fund.
With effect from 4 February 2013, the name of the Fund was changed from JF Asia Domestic Opportunities Fund to JPMorgan Asia Domestic
Opportunities Fund.
The investment objective of the Fund is to provide investors with long-term capital appreciation by investing primarily in securities of
companies whose predominant business will benefit from, or is related to, the domestic growth in Asian economies excluding Japan but
including Australia and New Zealand. This may include, but is not limited to, companies predominantly engaged in the production, distribution,
marketing or retail sale of staple goods, such as food, beverages, household products, cosmetics, tobacco, automobiles, also companies
primarily engaged in the development of properties and infrastructure projects including building materials, building services, property
developers, ports/railways/roads builders and operators as well as insurance companies and financial companies.
Pursuant to the supplemental Trust Deed dated 31 August 2012, the Manager may decide to issue separate classes (each a “Class”) whose
assets will be commonly invested but where a specific fee structure, currency or distribution policy may be applied. Each class may have a
different charging structure with the result that the net asset value attributable to each Class may differ.
All unitholders' rights with regard to the convening, voting or otherwise acting at any meeting of unitholders are the same.
2222 Summary of principal accounting policiesSummary of principal accounting policiesSummary of principal accounting policiesSummary of principal accounting policies
(a)(a)(a)(a) Accounting policies of interim financial statementsAccounting policies of interim financial statementsAccounting policies of interim financial statementsAccounting policies of interim financial statements
The accounting policies and methods of computation used in the preparation of these unaudited condensed interim financial statements
are consistent with those used in the annual financial statements for the year ended 30 September 2012.
(b)(b)(b)(b) Investments and derivativesInvestments and derivativesInvestments and derivativesInvestments and derivatives
Classification
The Fund classifies its investments and derivatives as financial assets or financial liabilities at fair value through profit or loss. These
financial assets or financial liabilities are held-for-trading as they are acquired or incurred principally for the purpose of selling or
repurchasing in the near term or short-term profit taking.
All derivatives are carried in assets when amounts are receivable by the Fund and in liabilities when amounts are payable by the Fund.
The Fund makes short sales in which a borrowed security is sold in anticipation of a decline in the market value of that security, or it may
use short sales for various arbitrage transactions. Short sales are classified as financial liabilities at fair value through profit or loss.
Recognition, derecognition and measurement
Purchases and sales of investments and derivatives are accounted for on the trade date basis. Investments and derivatives are initially
recognized at fair value and are subsequently re-measured at fair value. Realized and unrealized gains and losses on investments and
derivatives are recognized in the Statement of Comprehensive Income. Investments and derivatives are derecognized when the rights to
receive cash flows from the investments and derivatives have expired or the Fund has transferred substantially all risks and rewards of
ownership.
Fair value estimation
Investments that are listed or traded on an exchange and investments with prices quoted in over-the-counter markets or by market
makers, are fair valued based on quoted "bid" prices on long investments and quoted "ask" prices on investments sold short. When
trading in the securities of an investee company is suspended, the investment is valued at the Manager's estimate of its fair value.

JPMORGAN ASIA DOMESTIC OPPORTUNITIES FUNDJPMORGAN ASIA DOMESTIC OPPORTUNITIES FUNDJPMORGAN ASIA DOMESTIC OPPORTUNITIES FUNDJPMORGAN ASIA DOMESTIC OPPORTUNITIES FUND ((((Formerly known as JF Asia Domestic Opportunities FundFormerly known as JF Asia Domestic Opportunities FundFormerly known as JF Asia Domestic Opportunities FundFormerly known as JF Asia Domestic Opportunities Fund))))
SemiSemiSemiSemi----annual report for theannual report for theannual report for theannual report for the
period ended 31 March 2013period ended 31 March 2013period ended 31 March 2013period ended 31 March 2013
- 14 -
Debt securities are fair valued based on quoted prices inclusive of accrued interest.
Investments in collective investment schemes are stated at fair value based on the net asset value per unit of the respective funds as
determined by the administrators of the relevant funds or stated at "bid" prices if the collective investment schemes are listed or traded
on an exchange.
Open future and swap contracts are valued at "bid" prices for long positions and "ask" prices for short positions at the valuation date.
The differences between the bid/ask prices and the contract prices are recognized in the Statement of Comprehensive Income.
Open option contracts are valued at "bid" prices for long positions and "ask" prices for short positions at the valuation date. The
differences between the bid/ask prices and the premium amounts/contract prices are recognized in the Statement of Comprehensive
Income.
Forward foreign exchange contracts are valued at the forward rates ruling at the valuation date. The differences between the forward
rates and the contract rates are recognized in the Statement of Comprehensive Income.
(c)(c)(c)(c) Securities borrowingSecurities borrowingSecurities borrowingSecurities borrowing
The Fund may enter into securities borrowing arrangements for short sale purposes. Short positions represent obligations to deliver
securities sold but not yet purchased, and are accounted for as investments and valued at their fair value. Securities borrowed during the
period/year are off-balance sheet transactions and are therefore not included in the investment portfolio of the Fund. Collateral placed
for the purpose of securities borrowed generally consist of cash collateral and are included in the Statement of Financial Position
separately.
(d)(d)(d)(d) Foreign currency translationForeign currency translationForeign currency translationForeign currency translation
Functional and presentation currency
The Fund has adopted United States dollar as its functional and presentation currency.
Transactions and balances
Foreign currency transactions are translated into the functional currency using the exchange rates prevailing at the dates of the
transactions.
Foreign exchange gains and losses resulting from the settlement of such transactions and from the translation of assets and liabilities
denominated in foreign currencies at period/year end exchange rates are recognized in the Statement of Comprehensive Income.
Foreign exchange gains and losses relating to cash and cash equivalents are presented in the Statement of Comprehensive Income
within "Net foreign currency exchange gains/losses". Foreign exchange gains and losses relating to the financial assets and liabilities
carried at fair value through profit or loss are presented in the Statement of Comprehensive Income within "Net gains/losses on
investments and derivatives".
(e)(e)(e)(e) Proceeds and payments on allotment and redemption of unitsProceeds and payments on allotment and redemption of unitsProceeds and payments on allotment and redemption of unitsProceeds and payments on allotment and redemption of units
The net asset value per unit is computed for each dealing day. The price at which units are allotted or redeemed is calculated by
reference to the net asset value per unit as at the close of business on the relevant dealing day in accordance with the provisions of the
Fund's Trust Deed dated 11 May 2007, as amended, which may be different from the accounting policies stated in the financial
statements.
3333 Number of units in issue and net assets attributable to holders of redeemable units (per unit)Number of units in issue and net assets attributable to holders of redeemable units (per unit)Number of units in issue and net assets attributable to holders of redeemable units (per unit)Number of units in issue and net assets attributable to holders of redeemable units (per unit)
30.9.2012
31.3.2013 Class A
Units Units
Number of units in issue 34,774,952.489 39,604,599.875

JPMORGAN ASIA DOMESTIC OPPORTUNITIES FUNDJPMORGAN ASIA DOMESTIC OPPORTUNITIES FUNDJPMORGAN ASIA DOMESTIC OPPORTUNITIES FUNDJPMORGAN ASIA DOMESTIC OPPORTUNITIES FUND ((((Formerly known as JF Asia Domestic Opportunities FundFormerly known as JF Asia Domestic Opportunities FundFormerly known as JF Asia Domestic Opportunities FundFormerly known as JF Asia Domestic Opportunities Fund))))
SemiSemiSemiSemi----annual report for theannual report for theannual report for theannual report for the
period ended 31 March 2013period ended 31 March 2013period ended 31 March 2013period ended 31 March 2013
- 15 -
US$ US$
Net assets attributable to holders of redeemable units 354,916,091 362,602,111
Net assets attributable to holders of redeemable units (per unit) 10.21 9.16
4444 Net gains on investments and derivativesNet gains on investments and derivativesNet gains on investments and derivativesNet gains on investments and derivatives
1.10.2012
to
31.3.2013
1.10.2011
to
31.3.2012
US$ US$
Change in unrealized gains/losses in value of investments and derivatives 20,895,381 89,682,046
Realized gains/(losses) on sale of investments and derivatives 21,221,864 (31,285,981)
42,117,245 58,396,065
5555 Soft commission arrangementsSoft commission arrangementsSoft commission arrangementsSoft commission arrangements
The Investment Manager has entered into soft commission arrangements with brokers under which certain goods and services used to
support investment decision making are received by the Investment Manager. The Investment Manager does not make direct payment for
these services but transacts an agreed amount of business with the brokers on behalf of the Fund. Commission is paid from the Fund on these
transactions.
The goods and services must be of demonstrable benefit to the Fund and may include research and advisory services; economic and political
analysis; portfolio analysis, including valuation and performance measurement; market analysis, data and quotation services, computer
hardware and software incidental to the above goods and services; clearing and custodian services and investment-related publications.
6666 DistribDistribDistribDistributionutionutionution
No distribution was made during the period (31 March 2012: nil).

JPMORGAN ASIA NEW FRONTIERS FUNDJPMORGAN ASIA NEW FRONTIERS FUNDJPMORGAN ASIA NEW FRONTIERS FUNDJPMORGAN ASIA NEW FRONTIERS FUND (Formerly known as JF Asia New Frontiers Fund)(Formerly known as JF Asia New Frontiers Fund)(Formerly known as JF Asia New Frontiers Fund)(Formerly known as JF Asia New Frontiers Fund)
SemiSemiSemiSemi----annual report for theannual report for theannual report for theannual report for the
period ended 31 March 2013period ended 31 March 2013period ended 31 March 2013period ended 31 March 2013
- 16 -
Investment PortfolioInvestment PortfolioInvestment PortfolioInvestment Portfolio
As at 31 March 2013As at 31 March 2013As at 31 March 2013As at 31 March 2013 (Unaudited)(Unaudited)(Unaudited)(Unaudited)
HoldingHoldingHoldingHolding
FairFairFairFair
valuevaluevaluevalue
US$US$US$US$
% of% of% of% of
netnetnetnet
assetsassetsassetsassets
Listed/Quoted InvestmentsListed/Quoted InvestmentsListed/Quoted InvestmentsListed/Quoted Investments (100.9%)
EquitiesEquitiesEquitiesEquities (100.9%)
AustraliaAustraliaAustraliaAustralia (3.3%)
Oil Search 58,114 447,736 3.3
BangladeshBangladeshBangladeshBangladesh (2.8%)
Bata Shoe (Bangladesh) 5,000 32,578 0.2
Grameenphone Ltd 111,400 209,602 1.6
Marico Bangladesh 30,000 135,139 1.0
ChinaChinaChinaChina (1.1%)
Beijing Enterprises Hldgs 20,000 153,298 1.1
Hong KongHong KongHong KongHong Kong (2.4%)
NagaCorp Ltd 387,313 326,310 2.4
KazakhstanKazakhstanKazakhstanKazakhstan (12.6%)
Halyk Savings Bank GDR-RegS 62,408 448,089 3.3
KazMunaiGas Exploration GDR-
RegS 66,852 1,266,846 9.3
KoreaKoreaKoreaKorea (7.8%)
Kolao Hldgs 7,850 192,616 1.4
Kolao Hldgs Await Cert 623 15,287 0.1
LG Chem 698 167,819 1.2
Orion Corp 411 400,066 3.0
Youngone Corp 7,470 283,331 2.1
MalaysiaMalaysiaMalaysiaMalaysia (3.3%)
Axiata Group 211,900 451,652 3.3
PakistanPakistanPakistanPakistan (1.0%)
Pakistan Oil Fields 28,400 130,888 1.0
PhilippinesPhilippinesPhilippinesPhilippines (37.7%)
Alliance Global Group 1,286,500 666,735 4.9
BDO Unibank 255,778 562,198 4.1
Cebu Hldgs 2,742,000 309,071 2.3
DMCI Hldgs 236,000 315,168 2.3
Energy Development-PH List 911,650 144,309 1.1
Manila Water 396,300 387,949 2.9
Megaworld Corp 5,354,000 509,030 3.7
Pepsi-Cola Products
Philippines 3,801,000 583,981 4.3
Philippine Long Distance
Telephone 4,150 301,818 2.2
Philippine Seven 147,350 317,736 2.3
Phoenix Petroleum Philippines 1,744,700 408,279 3.0
RFM Corp 1,399,000 161,805 1.2
Security Bank 102,566 457,413 3.4
Sri LankaSri LankaSri LankaSri Lanka (8.4%)
Aitken Spence & Co 141,500 132,960 1.0
Commercial Bank of Ceylon 347,205 306,800 2.2
Dialog Axiata 2,800,000 198,817 1.4
John Keells Hldgs 138,333 267,389 2.0
National Development Bank 188,400 243,768 1.8
(Continued)
HoldingHoldingHoldingHolding
FairFairFairFair
valuevaluevaluevalue
US$US$US$US$
% of% of% of% of
netnetnetnet
assetsassetsassetsassets
ThailandThailandThailandThailand (6.2%)
Italian Thai Dev NVDR 1,559,300 404,667 3.0
PTT Exploration & Production
(F) 87,371 441,554 3.2
United KingdomUnited KingdomUnited KingdomUnited Kingdom (2.0%)
Dragon Oil 20,645 203,608 1.5
Steppe Cement 150,935 68,756 0.5
VietnamVietnamVietnamVietnam (12.3%)
FPT Corp 80,000 144,395 1.0
Petrovietnam Drilling & Well
Serv 85,676 173,459 1.3
Vietnam Dairy Products 197,655 1,085,368 8.0
Vietnam Export-Import Comm
JS Bank 397,800 275,426 2.0
Total Listed/Quoted InvestmentsTotal Listed/Quoted InvestmentsTotal Listed/Quoted InvestmentsTotal Listed/Quoted Investments 13,733,716 100.9
Other net liabilitiesOther net liabilitiesOther net liabilitiesOther net liabilities (125,720) (0.9)
Net assets attributable to holders of Net assets attributable to holders of Net assets attributable to holders of Net assets attributable to holders of
redeemable units at 31 March 2013redeemable units at 31 March 2013redeemable units at 31 March 2013redeemable units at 31 March 2013 13,607,996 100.0
Total investments, at costTotal investments, at costTotal investments, at costTotal investments, at cost 10,264,963

JPMORGAN ASIA NEW FRONTIERS FUNDJPMORGAN ASIA NEW FRONTIERS FUNDJPMORGAN ASIA NEW FRONTIERS FUNDJPMORGAN ASIA NEW FRONTIERS FUND (Formerly known as JF Asia New Frontiers Fund)(Formerly known as JF Asia New Frontiers Fund)(Formerly known as JF Asia New Frontiers Fund)(Formerly known as JF Asia New Frontiers Fund)
SemiSemiSemiSemi----annual report for theannual report for theannual report for theannual report for the
period ended 31 March 2013period ended 31 March 2013period ended 31 March 2013period ended 31 March 2013
- 17 -
Statement of Statement of Statement of Statement of Movements in Portfolio HoldingsMovements in Portfolio HoldingsMovements in Portfolio HoldingsMovements in Portfolio Holdings
For the period ended 31 March 2013For the period ended 31 March 2013For the period ended 31 March 2013For the period ended 31 March 2013 (Unaudited)(Unaudited)(Unaudited)(Unaudited)
% holdings% holdings% holdings% holdings
of net assetsof net assetsof net assetsof net assets
31.3.201331.3.201331.3.201331.3.2013 30.9.201230.9.201230.9.201230.9.2012
Listed/Quoted InvestmentsListed/Quoted InvestmentsListed/Quoted InvestmentsListed/Quoted Investments
EquitiesEquitiesEquitiesEquities
Philippines 37.7 32.1
Kazakhstan 12.6 12.6
Vietnam 12.3 9.2
Sri Lanka 8.4 8.0
Korea 7.8 10.8
Thailand 6.2 4.6
Malaysia 3.3 3.8
Australia 3.3 3.3
Bangladesh 2.8 2.3
Hong Kong 2.4 1.6
United Kingdom 2.0 2.0
China 1.1 -
Pakistan 1.0 -
India - 2.1
Total Listed/Quoted InvestmentsTotal Listed/Quoted InvestmentsTotal Listed/Quoted InvestmentsTotal Listed/Quoted Investments 100.9 92.4
OtherOtherOtherOther net (liabilities)/assetsnet (liabilities)/assetsnet (liabilities)/assetsnet (liabilities)/assets (0.9) 7.6
Net assets attributable to holders of Net assets attributable to holders of Net assets attributable to holders of Net assets attributable to holders of
redeemable unitsredeemable unitsredeemable unitsredeemable units 100.0 100.0
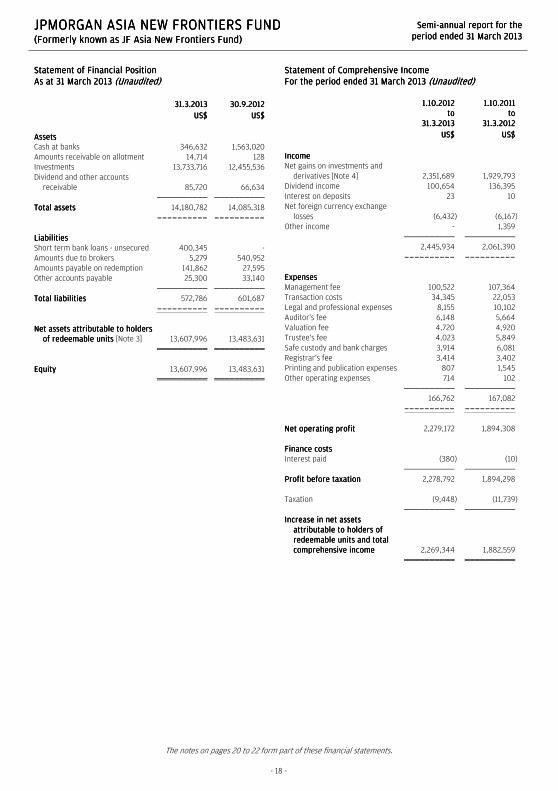
JPMORGAN ASIA NEW FRONTIERS FUNDJPMORGAN ASIA NEW FRONTIERS FUNDJPMORGAN ASIA NEW FRONTIERS FUNDJPMORGAN ASIA NEW FRONTIERS FUND (Formerly known as JF Asia New Frontiers Fund)(Formerly known as JF Asia New Frontiers Fund)(Formerly known as JF Asia New Frontiers Fund)(Formerly known as JF Asia New Frontiers Fund)
SemiSemiSemiSemi----annual report for theannual report for theannual report for theannual report for the
period ended 31 March 2013period ended 31 March 2013period ended 31 March 2013period ended 31 March 2013
The notes on pages 20 to 22 form part of these financial statements.
- 18 -
Statement of Financial PositionStatement of Financial PositionStatement of Financial PositionStatement of Financial Position
As at 31 March 2013As at 31 March 2013As at 31 March 2013As at 31 March 2013 (Unaudited)(Unaudited)(Unaudited)(Unaudited)
31.3.201331.3.201331.3.201331.3.2013 30.9.201230.9.201230.9.201230.9.2012
US$US$US$US$ US$US$US$US$
AssetsAssetsAssetsAssets
Cash at banks 346,632 1,563,020
Amounts receivable on allotment 14,714 128
Investments 13,733,716 12,455,536
Dividend and other accounts
receivable 85,720 66,634
Total assetsTotal assetsTotal assetsTotal assets 14,180,782 14,085,318
---------- ----------
LiabilitiesLiabilitiesLiabilitiesLiabilities
Short term bank loans - unsecured 400,345 -
Amounts due to brokers 5,279 540,952
Amounts payable on redemption 141,862 27,595
Other accounts payable 25,300 33,140
Total liabilitiesTotal liabilitiesTotal liabilitiesTotal liabilities 572,786 601,687
---------- ----------
Net assets attributable to holders Net assets attributable to holders Net assets attributable to holders Net assets attributable to holders
of redeemable units of redeemable units of redeemable units of redeemable units [Note 3] 13,607,996 13,483,631
EquityEquityEquityEquity 13,607,996 13,483,631
Statement of Comprehensive IncomeStatement of Comprehensive IncomeStatement of Comprehensive IncomeStatement of Comprehensive Income
For the period ended 31 For the period ended 31 For the period ended 31 For the period ended 31 March 2013March 2013March 2013March 2013 (Unaudited)(Unaudited)(Unaudited)(Unaudited)
1.10.20121.10.20121.10.20121.10.2012
totototo
31.3.201331.3.201331.3.201331.3.2013
1.10.20111.10.20111.10.20111.10.2011
totototo
31.3.201231.3.201231.3.201231.3.2012
US$US$US$US$ US$US$US$US$
IncomeIncomeIncomeIncome
Net gains on investments and
derivatives [Note 4] 2,351,689 1,929,793
Dividend income 100,654 136,395
Interest on deposits 23 10
Net foreign currency exchange
losses (6,432) (6,167)
Other income - 1,359
2,445,934 2,061,390
---------- ----------
ExpensesExpensesExpensesExpenses
Management fee 100,522 107,364
Transaction costs 34,345 22,053
Legal and professional expenses 8,155 10,102
Auditor's fee 6,148 5,664
Valuation fee 4,720 4,920
Trustee's fee 4,023 5,849
Safe custody and bank charges 3,914 6,081
Registrar's fee 3,414 3,402
Printing and publication expenses 807 1,545
Other operating expenses 714 102
166,762 167,082
---------- ----------
Net operating profitNet operating profitNet operating profitNet operating profit 2,279,172 1,894,308
Finance costsFinance costsFinance costsFinance costs
Interest paid (380) (10)
Profit before taxationProfit before taxationProfit before taxationProfit before taxation 2,278,792 1,894,298
Taxation (9,448) (11,739)
Increase in net assets Increase in net assets Increase in net assets Increase in net assets
attributable to holders of attributable to holders of attributable to holders of attributable to holders of
redeemable units and total redeemable units and total redeemable units and total redeemable units and total
comprehensive incomecomprehensive incomecomprehensive incomecomprehensive income 2,269,344 1,882,559

JPMORGAN ASIA NEW FRONTIERS FUNDJPMORGAN ASIA NEW FRONTIERS FUNDJPMORGAN ASIA NEW FRONTIERS FUNDJPMORGAN ASIA NEW FRONTIERS FUND (Formerly known as JF Asia New Frontiers Fund)(Formerly known as JF Asia New Frontiers Fund)(Formerly known as JF Asia New Frontiers Fund)(Formerly known as JF Asia New Frontiers Fund)
SemiSemiSemiSemi----annual report for theannual report for theannual report for theannual report for the
period ended 31 March 2013period ended 31 March 2013period ended 31 March 2013period ended 31 March 2013
The notes on pages 20 to 22 form part of these financial statements.
- 19 -
Statement of Changes in Net Assets Attributable to Holders Statement of Changes in Net Assets Attributable to Holders Statement of Changes in Net Assets Attributable to Holders Statement of Changes in Net Assets Attributable to Holders
of Redeemable of Redeemable of Redeemable of Redeemable UnitsUnitsUnitsUnits
For the period ended 31 March 2013For the period ended 31 March 2013For the period ended 31 March 2013For the period ended 31 March 2013 (Unaudited)(Unaudited)(Unaudited)(Unaudited)
1.10.20121.10.20121.10.20121.10.2012
totototo
31.3.201331.3.201331.3.201331.3.2013
1.10.20111.10.20111.10.20111.10.2011
totototo
31.3.201231.3.201231.3.201231.3.2012
US$US$US$US$ US$US$US$US$
Net assets attributable to holders Net assets attributable to holders Net assets attributable to holders Net assets attributable to holders
of redeemable units at the of redeemable units at the of redeemable units at the of redeemable units at the
beginning of the periodbeginning of the periodbeginning of the periodbeginning of the period 13,483,631 13,674,845
---------- ----------
Allotment of redeemable units 868,904 184,520
Redemption of redeemable units (3,013,883) (727,034)
Net redemptionNet redemptionNet redemptionNet redemption (2,144,979) (542,514)
---------- ----------
11,338,652 13,132,331
Increase in net assets Increase in net assets Increase in net assets Increase in net assets
attributable to holders of attributable to holders of attributable to holders of attributable to holders of
redeemable units and total redeemable units and total redeemable units and total redeemable units and total
comprehensive incomecomprehensive incomecomprehensive incomecomprehensive income 2,269,344 1,882,559
Net assets attributable to holders Net assets attributable to holders Net assets attributable to holders Net assets attributable to holders
of redeemable units at the end of redeemable units at the end of redeemable units at the end of redeemable units at the end
of the periodof the periodof the periodof the period 13,607,996 15,014,890
Statement of Cash FlowsStatement of Cash FlowsStatement of Cash FlowsStatement of Cash Flows
For the period ended 31 March 2013For the period ended 31 March 2013For the period ended 31 March 2013For the period ended 31 March 2013 (Unaudited)(Unaudited)(Unaudited)(Unaudited)
1.10.20121.10.20121.10.20121.10.2012
totototo
31.3.201331.3.201331.3.201331.3.2013
1.10.20111.10.20111.10.20111.10.2011
totototo
31.3.201231.3.201231.3.201231.3.2012
US$US$US$US$ US$US$US$US$
Operating activitiesOperating activitiesOperating activitiesOperating activities
Purchase of investments and
derivatives (2,930,741) (4,107,608)
Proceeds from disposal of
investments and derivatives 3,477,262 1,958,215
Dividend received 73,992 106,912
Interest received 20 10
Performance fee paid - (16,082)
Trustee's fee paid (3,995) (6,622)
Registrar's fee paid (6,707) (6,942)
Tax paid (11,304) (19,459)
Transaction costs paid (36,211) (23,788)
Management fee paid (99,836) (106,940)
Others (33,013) (40,414)
Net cash inflow/(outflow) from Net cash inflow/(outflow) from Net cash inflow/(outflow) from Net cash inflow/(outflow) from
operating activitiesoperating activitiesoperating activitiesoperating activities 429,467 (2,262,718)
---------- ----------
Financing activitiesFinancing activitiesFinancing activitiesFinancing activities
Interest paid (344) (10)
Receipts on allotment of
redeemable units 854,318 184,520
Payments on redemption of
redeemable units (2,899,616) (802,017)
Net cash outflow from Net cash outflow from Net cash outflow from Net cash outflow from
financing activitiesfinancing activitiesfinancing activitiesfinancing activities (2,045,642) (617,507)
---------- ----------
Decrease in cash and cash Decrease in cash and cash Decrease in cash and cash Decrease in cash and cash
equivalentsequivalentsequivalentsequivalents (1,616,175) (2,880,225)
Cash and cash equivalents at the
beginning of the period 1,563,020 3,071,160
Exchange (losses)/gains on cash
and cash equivalents (558) 26
Cash and cash Cash and cash Cash and cash Cash and cash equivalents at equivalents at equivalents at equivalents at
the end of the periodthe end of the periodthe end of the periodthe end of the period (53,713) 190,961
Analysis of balances of cash and cash equivalents:Analysis of balances of cash and cash equivalents:Analysis of balances of cash and cash equivalents:Analysis of balances of cash and cash equivalents:
Cash at banks 346,632 190,961
Short term bank loans -
unsecured (400,345) -
(53,713) 190,961

JPMORGAN ASIA NEW FRONTIERS FJPMORGAN ASIA NEW FRONTIERS FJPMORGAN ASIA NEW FRONTIERS FJPMORGAN ASIA NEW FRONTIERS FUNDUNDUNDUND (Formerly known as JF Asia New Frontiers Fund)(Formerly known as JF Asia New Frontiers Fund)(Formerly known as JF Asia New Frontiers Fund)(Formerly known as JF Asia New Frontiers Fund)
SemiSemiSemiSemi----annual report for theannual report for theannual report for theannual report for the
period ended 31 March 2013period ended 31 March 2013period ended 31 March 2013period ended 31 March 2013
- 20 -
Notes to the Financial StatementsNotes to the Financial StatementsNotes to the Financial StatementsNotes to the Financial Statements
1111 The FundThe FundThe FundThe Fund
JPMorgan Asia New Frontiers Fund (the "Fund") was established under a Trust Deed dated 9 August 2007, as amended, and is governed by
the laws of Hong Kong. The Fund is authorized by the Securities and Futures Commission of Hong Kong.
With effect from and including 1 October 2012, the performance fee currently received by the Manager in respect of the Fund was removed.
Any cumulative performance fee accrued on each dealing day up to 28 September 2012 was crystallised on 28 September 2012 and became
payable to the Manager (if any). On 28 September 2012, no performance fee was crystallised in relation to the Fund.
With effect from 4 February 2013, the name of the Fund was changed from JF Asia New Frontiers Fund to JPMorgan Asia New Frontiers Fund.
The investment objective of the Fund is to provide investors with long-term capital growth by investing primarily in securities of companies (i)
domiciled or listed on a stock exchange in developing countries in Asia ("Asia New Frontiers"), or (ii) with actual or prospective operations,
assets or investments, direct or indirect, in Asia New Frontiers in an aggregate amount of not less than either US$50 million or 10 per cent. Of
the gross assets of the investing company (albeit such operations, assets or investments may at the time of investment be immaterial to the
financial results of such company), or (iii) whose performance is linked to the economies of Asia New Frontiers.
Pursuant to the Supplemental Trust Deed dated 31 August 2012, the Manager may decide to issue separate classes (each a "Class") whose
assets will be commonly invested but where a specific fee structure, currency or distribution policy may be applied. Each Class may have a
different charging structure with the result that the net asset value attributable to each Class may differ.
All unitholders' rights with regard to the convening, voting or otherwise acting at any meeting of unitholders are the same.
2222 Summary of principal accounting policiesSummary of principal accounting policiesSummary of principal accounting policiesSummary of principal accounting policies
(a)(a)(a)(a) Accounting policies of interim financial statementsAccounting policies of interim financial statementsAccounting policies of interim financial statementsAccounting policies of interim financial statements
The accounting policies and methods of computation used in the preparation of these unaudited condensed interim financial statements
are consistent with those used in the annual financial statements for the year ended 30 September 2012.
(b)(b)(b)(b) Investments and derivatives Investments and derivatives Investments and derivatives Investments and derivatives
Classification
The Fund classifies its investments and derivatives as financial assets or financial liabilities at fair value through profit or loss. These
financial assets or financial liabilities are held-for-trading as they are acquired or incurred principally for the purpose of selling or
repurchasing in the near term or short-term profit taking.
All derivatives are carried in assets when amounts are receivable by the Fund and in liabilities when amounts are payable by the Fund.
The Fund makes short sales in which a borrowed security is sold in anticipation of a decline in the market value of that security, or it may
use short sales for various arbitrage transactions. Short sales are classified as financial liabilities at fair value through profit or loss.
Recognition, derecognition and measurement
Purchases and sales of investments and derivatives are accounted for on the trade date basis. Investments and derivatives are initially
recognized at fair value and are subsequently re-measured at fair value. Realized and unrealized gains and losses on investments and
derivatives are recognized in the Statement of Comprehensive Income. Investments and derivatives are derecognized when the rights to
receive cash flows from the investments and derivatives have expired or the Fund has transferred substantially all risks and rewards of
ownership.
Fair value estimation
Investments that are listed or traded on an exchange and investments with prices quoted in over-the-counter markets or by market
makers, are fair valued based on quoted "bid" prices on long investments and quoted "ask" prices on investments sold short. When
trading in the securities of an investee company is suspended, the investment is valued at the Manager's estimate of its fair value.
Debt securities are fair valued based on quoted prices inclusive of accrued interest.
Investments in collective investment schemes are stated at fair value based on the net asset value per unit of the respective funds as
determined by the administrators of the relevant funds or stated at "bid" prices if the collective investment schemes are listed or traded
on an exchange.

JPMORGAN ASIA NEW FRONTIERS FJPMORGAN ASIA NEW FRONTIERS FJPMORGAN ASIA NEW FRONTIERS FJPMORGAN ASIA NEW FRONTIERS FUNDUNDUNDUND (Formerly known as JF Asia New Frontiers Fund)(Formerly known as JF Asia New Frontiers Fund)(Formerly known as JF Asia New Frontiers Fund)(Formerly known as JF Asia New Frontiers Fund)
SemiSemiSemiSemi----annual report for theannual report for theannual report for theannual report for the
period ended 31 March 2013period ended 31 March 2013period ended 31 March 2013period ended 31 March 2013
- 21 -
Open future and swap contracts are valued at "bid" prices for long positions and "ask" prices for short positions at the valuation date.
The differences between the bid/ask prices and the contract prices are recognized in the Statement of Comprehensive Income.
Open option contracts are valued at "bid" prices for long positions and "ask" prices for short positions at the valuation date. The
differences between the bid/ask prices and the premium amounts/contract prices are recognized in the Statement of Comprehensive
Income.
Forward foreign exchange contracts are valued at the forward rates ruling at the valuation date. The differences between the forward
rates and the contract rates are recognized in the Statement of Comprehensive Income.
(c)(c)(c)(c) Securities bSecurities bSecurities bSecurities borrowingorrowingorrowingorrowing
The Fund may enter into securities borrowing arrangements for short sale purposes. Short positions represent obligations to deliver
securities sold but not yet purchased, and are accounted for as investments and valued at their fair value. Securities borrowed during the
period/year are off-balance sheet transactions and are therefore not included in the investment portfolio of the Fund. Collateral placed
for the purpose of securities borrowed generally consist of cash collateral and are included in the Statement of Financial Position
separately.
(d)(d)(d)(d) Foreign currency translationForeign currency translationForeign currency translationForeign currency translation
Functional and presentation currency
The Fund has adopted United States dollar as its functional and presentation currency.
Transactions and balances
Foreign currency transactions are translated into the functional currency using the exchange rates prevailing at the dates of the
transactions.
Foreign exchange gains and losses resulting from the settlement of such transactions and from the translation of assets and liabilities
denominated in foreign currencies at period/year end exchange rates are recognized in the Statement of Comprehensive Income.
Foreign exchange gains and losses relating to cash and cash equivalents are presented in the Statement of Comprehensive Income
within "Net foreign currency exchange gains/losses". Foreign exchange gains and losses relating to the financial assets and liabilities
carried at fair value through profit or loss are presented in the Statement of Comprehensive Income within "Net gains/losses on
investments and derivatives".
(e)(e)(e)(e) Proceeds and payments on allotment and redemption of unitsProceeds and payments on allotment and redemption of unitsProceeds and payments on allotment and redemption of unitsProceeds and payments on allotment and redemption of units
The net asset value per unit is computed for each dealing day. The price at which units are allotted or redeemed is calculated by
reference to the net asset value per unit as at the close of business on the relevant dealing day in accordance with the provisions of the
Fund's Trust Deed dated 9 August 2007, as amended, which may be different from the accounting policies stated in the financial
statements.
3333 Number of unNumber of unNumber of unNumber of units in issue and net assets attributable to holders of redeemable units (per unit)its in issue and net assets attributable to holders of redeemable units (per unit)its in issue and net assets attributable to holders of redeemable units (per unit)its in issue and net assets attributable to holders of redeemable units (per unit)
31.3.2013 30.9.2012
Class A
Units Units
Number of units in issue 1,293,179.832 1,517,542.797
US$ US$
Net assets attributable to holders of redeemable units 13,607,996 13,483,631
Net assets attributable to holders of redeemable units (per unit) 10.52 8.89

JPMORGAN ASIA NEW FRONTIERS FJPMORGAN ASIA NEW FRONTIERS FJPMORGAN ASIA NEW FRONTIERS FJPMORGAN ASIA NEW FRONTIERS FUNDUNDUNDUND (Formerly known as JF Asia New Frontiers Fund)(Formerly known as JF Asia New Frontiers Fund)(Formerly known as JF Asia New Frontiers Fund)(Formerly known as JF Asia New Frontiers Fund)
SemiSemiSemiSemi----annual report for theannual report for theannual report for theannual report for the
period ended 31 March 2013period ended 31 March 2013period ended 31 March 2013period ended 31 March 2013
- 22 -
4444 Net gains on investments and derivatives Net gains on investments and derivatives Net gains on investments and derivatives Net gains on investments and derivatives
1.10.2012
to
31.3.2013
1.10.2011
to
31.3.2012
US$ US$
Change in unrealized gains/losses in value of investments and derivatives 1,968,051 2,169,674
Realized gains/(losses) on sale of investments and derivatives 383,638 (239,881)
2,351,689 1,929,793
5555 Soft commission arrangementsSoft commission arrangementsSoft commission arrangementsSoft commission arrangements
The Investment Manager has entered into soft commission arrangements with brokers under which certain goods and services used to
support investment decision making are received by the Investment Manager. The Investment Manager does not make direct payment for
these services but transacts an agreed amount of business with the brokers on behalf of the Fund. Commission is paid from the Fund on these
transactions.
The goods and services must be of demonstrable benefit to the Fund and may include research and advisory services; economic and political
analysis; portfolio analysis, including valuation and performance measurement; market analysis, data and quotation services, computer
hardware and software incidental to the above goods and services; clearing and custodian services and investment-related publications.
6666 Distribution Distribution Distribution Distribution
No distribution was made during the period (31 March 2012: nil).

JPMORGAN ASIA RESOURCES FUNDJPMORGAN ASIA RESOURCES FUNDJPMORGAN ASIA RESOURCES FUNDJPMORGAN ASIA RESOURCES FUND (Formerly known as JF Five Elements Fund)(Formerly known as JF Five Elements Fund)(Formerly known as JF Five Elements Fund)(Formerly known as JF Five Elements Fund)
SemiSemiSemiSemi----annual report for theannual report for theannual report for theannual report for the
period ended 31 March 2013period ended 31 March 2013period ended 31 March 2013period ended 31 March 2013
- 23 -
Investment PortfolioInvestment PortfolioInvestment PortfolioInvestment Portfolio
As at 31 March 2013As at 31 March 2013As at 31 March 2013As at 31 March 2013 (Unaudited)(Unaudited)(Unaudited)(Unaudited)
HoldingHoldingHoldingHolding
FairFairFairFair
valuevaluevaluevalue
US$US$US$US$
% of% of% of% of
netnetnetnet
assetsassetsassetsassets
Listed/Quoted InvestmentsListed/Quoted InvestmentsListed/Quoted InvestmentsListed/Quoted Investments (95.2%)
(I) Equities and Warrants(I) Equities and Warrants(I) Equities and Warrants(I) Equities and Warrants (93.2%)
AustraliaAustraliaAustraliaAustralia (23.2%)
Aurora Oil & Gas 186,216 640,660 2.2
Australian Agricultural 220,000 288,995 1.0
Bathurst Resources 845,874 268,969 0.9
BHP Billiton 19,415 662,896 2.2
Drillsearch Energy 436,740 539,558 1.8
Endeavour Mining CDI 92,821 135,479 0.5
Iluka Resources (63,000) (616,085) (2.1)
Indochine Mining 1,750,000 169,675 0.6
MACA Ltd 40,000 119,268 0.4
Metals X 52,995 8,287 0.0
Mineral Resources 40,801 448,341 1.5
Newcrest Mining 26,588 555,772 1.9
Northern Star Resources 414,000 448,880 1.5
Oil Search 99,443 766,153 2.6
PanAust Ltd 70,096 179,043 0.6
Perseus Mining-AU List 223,323 416,757 1.4
PMI Gold CDI 221,047 142,881 0.5
Resource & Investment Opt
31/05/13 30,000 313 0.0
Rio Tinto-AU List 13,434 801,121 2.7
Sandfire Resources 66,872 417,607 1.4
Silver Lake Resources 65,690 144,504 0.5
Tiger Resources 913,404 295,204 1.0
Tigers Realm Coal 210,112 41,620 0.1
CanadaCanadaCanadaCanada (1.1%)
St Augustine Gold & Copper 334,020 83,838 0.3
Strata-X Energy CDI 750,000 250,212 0.8
ChinaChinaChinaChina (15.8%)
Anton Oilfield Services Group 1,168,000 811,001 2.7
Beijing Enterprises Water
Group 3,780,000 1,119,978 3.8
China Merchants Hldgs 176,000 575,886 2.0
China Metal Recycling Hldgs 626,400 760,945 2.6
China National Bldg Material
'H' 192,000 241,402 0.8
China Resources Power Hldgs 388,000 1,162,104 3.9
IndiaIndiaIndiaIndia (9.0%)
ACC Ltd 12,737 271,379 0.9
Ambuja Cements 293,836 939,626 3.2
HeidelbergCement India 987,885 664,346 2.2
Shree Cement 10,816 801,001 2.7
IndonesiaIndonesiaIndonesiaIndonesia (12.8%)
Holcim Indonesia 2,267,500 834,197 2.8
Indocement Tunggal Prakarsa 265,500 633,867 2.2
Semen Indonesia Persero 441,000 803,262 2.7
Total Bangun Persada 5,680,000 602,048 2.0
Wijaya Karya 4,507,000 927,605 3.1
JapanJapanJapanJapan (5.5%)
JGC Corp 19,000 480,355 1.6
Kubota Corp 81,000 1,151,851 3.9
(Continued)
HoldingHoldingHoldingHolding
FairFairFairFair
valuevaluevaluevalue
US$US$US$US$
% of% of% of% of
netnetnetnet
assetsassetsassetsassets
KoreaKoreaKoreaKorea (1.7%)
POSCO 1,741 509,343 1.7
MalaysiaMalaysiaMalaysiaMalaysia (2.8%)
Lafarge Malayan Cement 259,400 827,667 2.8
PhilippinesPhilippinesPhilippinesPhilippines (2.8%)
Manila Water 857,100 839,038 2.8
ThailandThailandThailandThailand (15.0%)
PTT Public Co (F) 25,600 284,979 1.0
Siam Cement (F) 61,200 1,028,185 3.5
Siam City Cement NVDR 43,900 725,546 2.4
Thai Tap Water Supply (F) 2,769,100 1,030,671 3.5
Thai Union Frozen Products
NVDR 325,040 707,574 2.4
TPI Polene NVDR 1,218,400 657,358 2.2
United StatesUnited StatesUnited StatesUnited States (1.5%)
Turquoise Hill Resources-
US List 69,137 439,711 1.5
VietnamVietnamVietnamVietnam (2.0%)
Vietnam Dairy Prod PN
24/10/17(JPM)* 105,000 576,579 2.0
27,617,452 93.2
--------- ----
(II) Collective Investment Schemes(II) Collective Investment Schemes(II) Collective Investment Schemes(II) Collective Investment Schemes (2.0%)
United StatesUnited StatesUnited StatesUnited States (2.0%)
ETFS Palladium Trust
ETFS Platinum Trust
4,325
1,822
325,456
280,588
1.1
0.9
606,044 2.0
--------- ----
Total Listed/Quoted InvestmentsTotal Listed/Quoted InvestmentsTotal Listed/Quoted InvestmentsTotal Listed/Quoted Investments 28,223,496 95.2
Other net assetsOther net assetsOther net assetsOther net assets 1,436,157 4.8
Net assets attributable to holders of Net assets attributable to holders of Net assets attributable to holders of Net assets attributable to holders of
redeemable units at 31 March 2013redeemable units at 31 March 2013redeemable units at 31 March 2013redeemable units at 31 March 2013 29,659,653 100.0
Total investments, at cost less proceeds Total investments, at cost less proceeds Total investments, at cost less proceeds Total investments, at cost less proceeds
on short positionson short positionson short positionson short positions 24,415,728
* Issued by a Connected Person of the Manager

JPMORGAN ASIA RESOURCES FUNDJPMORGAN ASIA RESOURCES FUNDJPMORGAN ASIA RESOURCES FUNDJPMORGAN ASIA RESOURCES FUND (Formerly known as JF Five Elements Fund)(Formerly known as JF Five Elements Fund)(Formerly known as JF Five Elements Fund)(Formerly known as JF Five Elements Fund)
SemiSemiSemiSemi----annual report for theannual report for theannual report for theannual report for the
period ended 31 March 2013period ended 31 March 2013period ended 31 March 2013period ended 31 March 2013
- 24 -
Statement of Movements in Portfolio HoldingsStatement of Movements in Portfolio HoldingsStatement of Movements in Portfolio HoldingsStatement of Movements in Portfolio Holdings
For the period ended 31 March 2013For the period ended 31 March 2013For the period ended 31 March 2013For the period ended 31 March 2013 (Unaudited)(Unaudited)(Unaudited)(Unaudited)
% holdings% holdings% holdings% holdings
of net assetsof net assetsof net assetsof net assets
31.3.201331.3.201331.3.201331.3.2013 30.9.201230.9.201230.9.201230.9.2012
Listed/Quoted InvestmentsListed/Quoted InvestmentsListed/Quoted InvestmentsListed/Quoted Investments
Equities and WarrantsEquities and WarrantsEquities and WarrantsEquities and Warrants
Australia 23.2 34.4
China 15.8 9.8
Thailand 15.0 8.9
Indonesia 12.8 8.2
India 9.0 6.0
Japan 5.5 8.4
Philippines 2.8 3.1
Malaysia 2.8 2.3
Vietnam 2.0 -
Korea
United States
1.7
1.5
3.5
1.0
Canada 1.1 -
Singapore - 4.5
Collective Investment SchemesCollective Investment SchemesCollective Investment SchemesCollective Investment Schemes
United States 2.0 -
Total Listed/Quoted InvestmentsTotal Listed/Quoted InvestmentsTotal Listed/Quoted InvestmentsTotal Listed/Quoted Investments 95.2 90.1
Other net assetsOther net assetsOther net assetsOther net assets 4.8 9.9
Net assets attributable to holders of Net assets attributable to holders of Net assets attributable to holders of Net assets attributable to holders of
redeemable unitsredeemable unitsredeemable unitsredeemable units 100.0 100.0
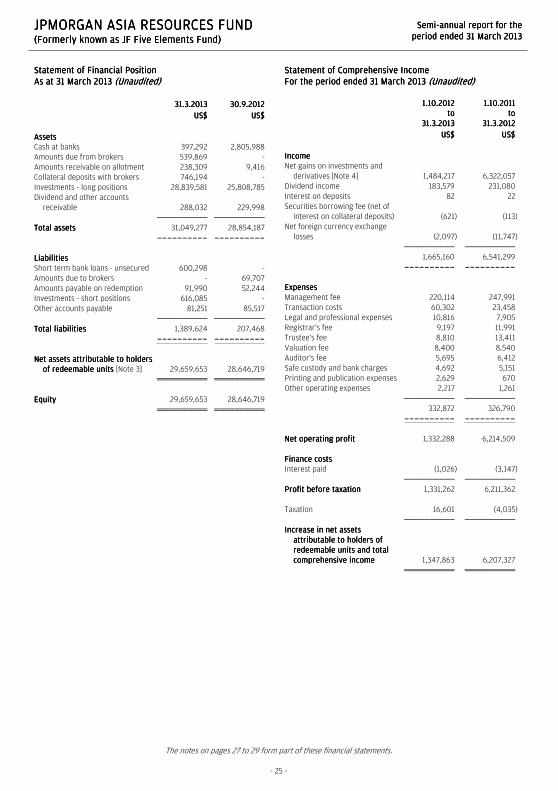
JPMORGAN ASIA RESOURCES FUNDJPMORGAN ASIA RESOURCES FUNDJPMORGAN ASIA RESOURCES FUNDJPMORGAN ASIA RESOURCES FUND (Formerly known as JF Five Elements Fund)(Formerly known as JF Five Elements Fund)(Formerly known as JF Five Elements Fund)(Formerly known as JF Five Elements Fund)
SemiSemiSemiSemi----annual report for theannual report for theannual report for theannual report for the
period ended 31 March 2013period ended 31 March 2013period ended 31 March 2013period ended 31 March 2013
The notes on pages 27 to 29 form part of these financial statements.
- 25 -
Statement of Financial PositionStatement of Financial PositionStatement of Financial PositionStatement of Financial Position
As at 31 March 2013As at 31 March 2013As at 31 March 2013As at 31 March 2013 (Unaudited)(Unaudited)(Unaudited)(Unaudited)
31.3.201331.3.201331.3.201331.3.2013 30.9.201230.9.201230.9.201230.9.2012
US$US$US$US$ US$US$US$US$
AssetsAssetsAssetsAssets
Cash at banks 397,292 2,805,988
Amounts due from brokers 539,869 -
Amounts receivable on allotment 238,309 9,416
Collateral deposits with brokers 746,194 -
Investments - long positions 28,839,581 25,808,785
Dividend and other accounts
receivable 288,032 229,998
Total assetsTotal assetsTotal assetsTotal assets 31,049,277 28,854,187
---------- ----------
LiabilitiesLiabilitiesLiabilitiesLiabilities
Short term bank loans - unsecured 600,298 -
Amounts due to brokers - 69,707
Amounts payable on redemption 91,990 52,244
Investments - short positions 616,085 -
Other accounts payable 81,251 85,517
Total liabilitiesTotal liabilitiesTotal liabilitiesTotal liabilities 1,389,624 207,468
---------- ----------
Net assets attributable to holders Net assets attributable to holders Net assets attributable to holders Net assets attributable to holders
of redeemable units of redeemable units of redeemable units of redeemable units [Note 3] 29,659,653 28,646,719
EquityEquityEquityEquity 29,659,653 28,646,719
Statement ofStatement ofStatement ofStatement of Comprehensive IncomeComprehensive IncomeComprehensive IncomeComprehensive Income
For the period ended 31 March 2013For the period ended 31 March 2013For the period ended 31 March 2013For the period ended 31 March 2013 (Unaudited)(Unaudited)(Unaudited)(Unaudited)
1.10.20121.10.20121.10.20121.10.2012
totototo
31.3.201331.3.201331.3.201331.3.2013
1.10.20111.10.20111.10.20111.10.2011
totototo
31.3.201231.3.201231.3.201231.3.2012
US$US$US$US$ US$US$US$US$
IncomeIncomeIncomeIncome
Net gains on investments and
derivatives [Note 4] 1,484,217 6,322,057
Dividend income 183,579 231,080
Interest on deposits 82 22
Securities borrowing fee (net of
interest on collateral deposits) (621) (113)
Net foreign currency exchange
losses (2,097) (11,747)
1,665,160 6,541,299
---------- ----------
ExpensesExpensesExpensesExpenses
Management fee 220,114 247,991
Transaction costs 60,302 23,458
Legal and professional expenses 10,816 7,905
Registrar's fee 9,197 11,991
Trustee's fee 8,810 13,411
Valuation fee 8,400 8,540
Auditor's fee 5,695 6,412
Safe custody and bank charges 4,692 5,151
Printing and publication expenses 2,629 670
Other operating expenses 2,217 1,261
332,872 326,790
---------- ----------
Net operating profitNet operating profitNet operating profitNet operating profit 1,332,288 6,214,509
Finance costsFinance costsFinance costsFinance costs
Interest paid (1,026) (3,147)
Profit before taxationProfit before taxationProfit before taxationProfit before taxation 1,331,262 6,211,362
Taxation 16,601 (4,035)
Increase in net assets Increase in net assets Increase in net assets Increase in net assets
attributable to holders of attributable to holders of attributable to holders of attributable to holders of
redeemable units and total redeemable units and total redeemable units and total redeemable units and total
comprehensive incomecomprehensive incomecomprehensive incomecomprehensive income 1,347,863 6,207,327
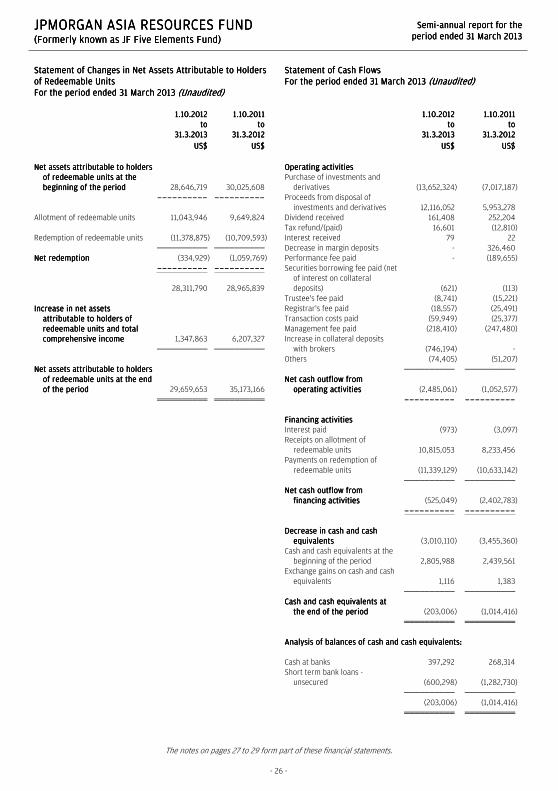
JPMORGAN ASIA RESOURCES FUNDJPMORGAN ASIA RESOURCES FUNDJPMORGAN ASIA RESOURCES FUNDJPMORGAN ASIA RESOURCES FUND (Formerly known as JF Five Elements Fund)(Formerly known as JF Five Elements Fund)(Formerly known as JF Five Elements Fund)(Formerly known as JF Five Elements Fund)
SemiSemiSemiSemi----annual report for theannual report for theannual report for theannual report for the
period ended 31 March 2013period ended 31 March 2013period ended 31 March 2013period ended 31 March 2013
The notes on pages 27 to 29 form part of these financial statements.
- 26 -
Statement of Changes in Net Assets Attributable to Holders Statement of Changes in Net Assets Attributable to Holders Statement of Changes in Net Assets Attributable to Holders Statement of Changes in Net Assets Attributable to Holders
of Redeemable Unitsof Redeemable Unitsof Redeemable Unitsof Redeemable Units
For the period ended 31 March 2013For the period ended 31 March 2013For the period ended 31 March 2013For the period ended 31 March 2013 (Unaudited)(Unaudited)(Unaudited)(Unaudited)
1.10.20121.10.20121.10.20121.10.2012
totototo
31.3.201331.3.201331.3.201331.3.2013
1.10.20111.10.20111.10.20111.10.2011
totototo
31.3.201231.3.201231.3.201231.3.2012
US$US$US$US$ US$US$US$US$
Net assets attributable to holders Net assets attributable to holders Net assets attributable to holders Net assets attributable to holders
of redeemable of redeemable of redeemable of redeemable units at the units at the units at the units at the
beginning of the periodbeginning of the periodbeginning of the periodbeginning of the period 28,646,719 30,025,608
---------- ----------
Allotment of redeemable units 11,043,946 9,649,824
Redemption of redeemable units (11,378,875) (10,709,593)
Net redemptionNet redemptionNet redemptionNet redemption (334,929) (1,059,769)
---------- ----------
28,311,790 28,965,839
Increase in net assets Increase in net assets Increase in net assets Increase in net assets
attributable to holders of attributable to holders of attributable to holders of attributable to holders of
redeemable units and total redeemable units and total redeemable units and total redeemable units and total
comprehensive incomecomprehensive incomecomprehensive incomecomprehensive income 1,347,863 6,207,327
Net assets attributable to holders Net assets attributable to holders Net assets attributable to holders Net assets attributable to holders
of of of of redeemable units at the end redeemable units at the end redeemable units at the end redeemable units at the end
of the periodof the periodof the periodof the period 29,659,653 35,173,166
Statement of Cash FlowsStatement of Cash FlowsStatement of Cash FlowsStatement of Cash Flows
For the period ended 31 March 2013For the period ended 31 March 2013For the period ended 31 March 2013For the period ended 31 March 2013 (Unaudited)(Unaudited)(Unaudited)(Unaudited)
1.10.20121.10.20121.10.20121.10.2012
totototo
31.3.201331.3.201331.3.201331.3.2013
1.10.20111.10.20111.10.20111.10.2011
totototo
31.3.201231.3.201231.3.201231.3.2012
US$US$US$US$ US$US$US$US$
Operating activitiesOperating activitiesOperating activitiesOperating activities
Purchase of investments and
derivatives (13,652,324) (7,017,187)
Proceeds from disposal of
investments and derivatives 12,116,052 5,953,278
Dividend received 161,408 252,204
Tax refund/(paid) 16,601 (12,810)
Interest received 79 22
Decrease in margin deposits - 326,460
Performance fee paid - (189,655)
Securities borrowing fee paid (net
of interest on collateral
deposits) (621) (113)
Trustee's fee paid (8,741) (15,221)
Registrar's fee paid (18,557) (25,491)
Transaction costs paid (59,949) (25,377)
Management fee paid (218,410) (247,480)
Increase in collateral deposits
with brokers (746,194) -
Others (74,405) (51,207)
Net cash outflow from Net cash outflow from Net cash outflow from Net cash outflow from
operating activitiesoperating activitiesoperating activitiesoperating activities (2,485,061) (1,052,577)
---------- ----------
Financing Financing Financing Financing activitiesactivitiesactivitiesactivities
Interest paid (973) (3,097)
Receipts on allotment of
redeemable units 10,815,053 8,233,456
Payments on redemption of
redeemable units (11,339,129) (10,633,142)
Net cash outflow from Net cash outflow from Net cash outflow from Net cash outflow from
financing activitiesfinancing activitiesfinancing activitiesfinancing activities (525,049) (2,402,783)
---------- ----------
Decrease in cash and cash Decrease in cash and cash Decrease in cash and cash Decrease in cash and cash
equivalentsequivalentsequivalentsequivalents (3,010,110) (3,455,360)
Cash and cash equivalents at the
beginning of the period 2,805,988 2,439,561
Exchange gains on cash and cash
equivalents 1,116 1,383
Cash and cash equivalents at Cash and cash equivalents at Cash and cash equivalents at Cash and cash equivalents at
the end of the periodthe end of the periodthe end of the periodthe end of the period (203,006) (1,014,416)
Analysis of balances of cash and cash equivalents:Analysis of balances of cash and cash equivalents:Analysis of balances of cash and cash equivalents:Analysis of balances of cash and cash equivalents:
Cash at banks 397,292 268,314
Short term bank loans -
unsecured (600,298) (1,282,730)
(203,006) (1,014,416)

JPMORGAN ASIA RESOURCES FUNDJPMORGAN ASIA RESOURCES FUNDJPMORGAN ASIA RESOURCES FUNDJPMORGAN ASIA RESOURCES FUND (Formerly known as JF Five Elements Fund)(Formerly known as JF Five Elements Fund)(Formerly known as JF Five Elements Fund)(Formerly known as JF Five Elements Fund)
SemiSemiSemiSemi----annual report for theannual report for theannual report for theannual report for the
period ended 31 March 2013period ended 31 March 2013period ended 31 March 2013period ended 31 March 2013
- 27 -
Notes to the Financial StatementsNotes to the Financial StatementsNotes to the Financial StatementsNotes to the Financial Statements
1111 The FundThe FundThe FundThe Fund
JPMorgan Asia Resources Fund (the "Fund") was established under a Trust Deed dated 28 February 2008, as amended, and is governed by the
laws of Hong Kong. The Fund is authorized by the Securities and Futures Commission of Hong Kong.
With effect from and including 1 October 2012, the performance fee currently received by the Manager in respect of the Fund was removed.
Any cumulative performance fee accrued on each dealing day up to 28 September 2012 was crystallised on 28 September 2012 and became
payable to the Manager (if any). On 28 September 2012, no performance fee was crystallised in relation to the Fund.
With effect from 3 October 2012, the name of the Fund was changed from JF Five Elements Fund to JF Asia Resources Fund.
With effect from 4 February 2013, the name of the Fund was changed from JF Asia Resources Fund to JPMorgan Asia Resources Fund.
The investment objective of the Fund is to provide investors with long-term capital growth by investing primarily in securities of companies in
natural resources and commodities sectors in Asia (including Australia and New Zealand). This may include, but is not limited to, companies
predominantly engaged in the extraction, refinement, development, production, distribution, marketing or retail sale of natural resources,
commodities and their secondary products such as agriculture, energy, forestry, timber, paper, water, metals, basic materials, mining,
construction and infrastructure.
Pursuant to the Supplemental Trust Deed dated 31 August 2012, the Manager may also decide to issue separate classes (each a "Class") whose
assets will be commonly invested but where a specific fee structure, currency or distribution policy may be applied. Each Class may have a
different charging structure with the result that the net asset value attributable to each Class may differ.
All unitholders' rights with regard to the convening, voting or otherwise acting at any meeting of unitholders are the same.
2222 Summary of principal accounting policiesSummary of principal accounting policiesSummary of principal accounting policiesSummary of principal accounting policies
(a)(a)(a)(a) Accounting policies of interim financial statementsAccounting policies of interim financial statementsAccounting policies of interim financial statementsAccounting policies of interim financial statements
The accounting policies and methods of computation used in the preparation of these unaudited condensed interim financial statements
are consistent with those used in the annual financial statements for the year ended 30 September 2012.
(b)(b)(b)(b) Investments and derivatives Investments and derivatives Investments and derivatives Investments and derivatives
Classification
The Fund classifies its investments and derivatives as financial assets or financial liabilities at fair value through profit or loss. These
financial assets or financial liabilities are held-for-trading as they are acquired or incurred principally for the purpose of selling or
repurchasing in the near term or short-term profit taking.
All derivatives are carried in assets when amounts are receivable by the Fund and in liabilities when amounts are payable by the Fund.
The Fund makes short sales in which a borrowed security is sold in anticipation of a decline in the market value of that security, or it may
use short sales for various arbitrage transactions. Short sales are classified as financial liabilities at fair value through profit or loss.
Recognition, derecognition and measurement
Purchases and sales of investments and derivatives are accounted for on the trade date basis. Investments and derivatives are initially
recognized at fair value and are subsequently re-measured at fair value. Realized and unrealized gains and losses on investments and
derivatives are recognized in the Statement of Comprehensive Income. Investments and derivatives are derecognized when the rights to
receive cash flows from the investments and derivatives have expired or the Fund has transferred substantially all risks and rewards of
ownership.

JPMORGAN ASIA RESOURCES FUNDJPMORGAN ASIA RESOURCES FUNDJPMORGAN ASIA RESOURCES FUNDJPMORGAN ASIA RESOURCES FUND (Formerly known as JF Five Elements Fund)(Formerly known as JF Five Elements Fund)(Formerly known as JF Five Elements Fund)(Formerly known as JF Five Elements Fund)
SemiSemiSemiSemi----annual report for theannual report for theannual report for theannual report for the
period ended 31 March 2013period ended 31 March 2013period ended 31 March 2013period ended 31 March 2013
- 28 -
Fair value estimation
Investments that are listed or traded on an exchange and investments with prices quoted in over-the-counter markets or by market
makers, are fair valued based on quoted "bid" prices on long investments and quoted "ask" prices on investments sold short. When
trading in the securities of an investee company is suspended, the investment is valued at the Manager's estimate of its fair value.
Debt securities are fair valued based on quoted prices inclusive of accrued interest.
Investments in collective investment schemes are stated at fair value based on the net asset value per unit of the respective funds as
determined by the administrators of the relevant funds or stated at "bid" prices if the collective investment schemes are listed or traded
on an exchange.
Open future and swap contracts are valued at "bid" prices for long positions and "ask" prices for short positions at the valuation date.
The differences between the bid/ask prices and the contract prices are recognized in the Statement of Comprehensive Income.
Open option contracts are valued at "bid" prices for long positions and "ask" prices for short positions at the valuation date. The
differences between the bid/ask prices and the premium amounts/contract prices are recognized in the Statement of Comprehensive
Income.
Forward foreign exchange contracts are valued at the forward rates ruling at the valuation date. The differences between the forward
rates and the contract rates are recognized in the Statement of Comprehensive Income.
(c)(c)(c)(c) Securities lending Securities lending Securities lending Securities lending and borrowing and borrowing and borrowing and borrowing
Securities lenders' agreements are entered into with institutions of appropriate financial standing who engage in such arrangements
acceptable to the Trustee and on arm's length commercial terms. Securities lent are included in the investment portfolio of the Fund.
Relevant securities lending income entitled by the Fund is accounted for in the Statement of Comprehensive Income. Collateral received
for the purpose of securities lent generally consist of non-cash collateral which are off-balance sheet transactions and are therefore not
included in the financial statements.
The Fund may enter into securities borrowing arrangements for short sale purposes. Short positions represent obligations to deliver
securities sold but not yet purchased, and are accounted for as investments and valued at their fair value. Securities borrowed during the
period/year are off-balance sheet transactions and are therefore not included in the investment portfolio of the Fund. Collateral placed
for the purpose of securities borrowed generally consist of cash collateral and are included in the Statement of Financial Position
separately.
(d)(d)(d)(d) Foreign currency translationForeign currency translationForeign currency translationForeign currency translation
Functional and presentation currency
The Fund has adopted United States dollar as its functional and presentation currency.
Transactions and balances
Foreign currency transactions are translated into the functional currency using the exchange rates prevailing at the dates of the
transactions.
Foreign exchange gains and losses resulting from the settlement of such transactions and from the translation of assets and liabilities
denominated in foreign currencies at period/year end exchange rates are recognized in the Statement of Comprehensive Income.
Foreign exchange gains and losses relating to cash and cash equivalents are presented in the Statement of Comprehensive Income
within "Net foreign currency exchange gains/losses". Foreign exchange gains and losses relating to the financial assets and liabilities
carried at fair value through profit or loss are presented in the Statement of Comprehensive Income within "Net gains/losses on
investments and derivatives".
(e)(e)(e)(e) Proceeds and payments on allotment and redemption of unitsProceeds and payments on allotment and redemption of unitsProceeds and payments on allotment and redemption of unitsProceeds and payments on allotment and redemption of units
The net asset value per unit is computed for each dealing day. The price at which units are allotted or redeemed is calculated by
reference to the net asset value per unit as at the close of business on the relevant dealing day in accordance with the provisions of the
Fund's Trust Deed dated 28 February 2008, as amended, which may be different from the accounting policies stated in the financial
statements.

JPMORGAN ASIA RESOURCES FUNDJPMORGAN ASIA RESOURCES FUNDJPMORGAN ASIA RESOURCES FUNDJPMORGAN ASIA RESOURCES FUND (Formerly known as JF Five Elements Fund)(Formerly known as JF Five Elements Fund)(Formerly known as JF Five Elements Fund)(Formerly known as JF Five Elements Fund)
SemiSemiSemiSemi----annual report for theannual report for theannual report for theannual report for the
period ended 31 March 2013period ended 31 March 2013period ended 31 March 2013period ended 31 March 2013
- 29 -
3333 Number of units in issue and net assets attributable to holders of redeemable units (per unit)Number of units in issue and net assets attributable to holders of redeemable units (per unit)Number of units in issue and net assets attributable to holders of redeemable units (per unit)Number of units in issue and net assets attributable to holders of redeemable units (per unit)
31.3.2013 30.9.2012
Class A
Units Units
Number of units in issue 3,451,159.168 3,491,614.504
US$ US$
Net assets attributable to holders of redeemable units 29,659,653 28,646,719
Net assets attributable to holders of redeemable units (per unit) 8.59 8.20
4444 Net gains on investments and derivatives Net gains on investments and derivatives Net gains on investments and derivatives Net gains on investments and derivatives
1.10.2012
to
31.3.2013
1.10.2011
to
31.3.2012
US$ US$
Change in unrealized gains/losses in value of investments and derivatives 2,945,581 7,581,415
Realized losses on sale of investments and derivatives (1,461,364) (1,259,358)
1,484,217 6,322,057
5555 Soft commission arrangementsSoft commission arrangementsSoft commission arrangementsSoft commission arrangements
The Investment Manager has entered into soft commission arrangements with brokers under which certain goods and services used to
support investment decision making are received by the Investment Manager. The Investment Manager does not make direct payment for
these services but transacts an agreed amount of business with the brokers on behalf of the Fund. Commission is paid from the Fund on these
transactions.
The goods and services must be of demonstrable benefit to the Fund and may include research and advisory services; economic and political
analysis; portfolio analysis, including valuation and performance measurement; market analysis, data and quotation services, computer
hardware and software incidental to the above goods and services; clearing and custodian services and investment-related publications.
6666 Distribution Distribution Distribution Distribution
No distribution was made during the period (31 March 2012: nil).

JPMORGAN ASIAN TOTAL RETURN BOND FUNDJPMORGAN ASIAN TOTAL RETURN BOND FUNDJPMORGAN ASIAN TOTAL RETURN BOND FUNDJPMORGAN ASIAN TOTAL RETURN BOND FUND (Formerly known as JPM Asian Total Return Bond Fund)(Formerly known as JPM Asian Total Return Bond Fund)(Formerly known as JPM Asian Total Return Bond Fund)(Formerly known as JPM Asian Total Return Bond Fund)
SemiSemiSemiSemi----annual report for theannual report for theannual report for theannual report for the
period ended 31 March 2013period ended 31 March 2013period ended 31 March 2013period ended 31 March 2013
- 30 -
Investment PortfolioInvestment PortfolioInvestment PortfolioInvestment Portfolio
As at 31As at 31As at 31As at 31 March 2013March 2013March 2013March 2013 (Unaudited)(Unaudited)(Unaudited)(Unaudited)
HoldingHoldingHoldingHolding
FairFairFairFair
valuevaluevaluevalue
US$US$US$US$
% of% of% of% of
netnetnetnet
assetsassetsassetsassets
Listed/Quoted InvestmentsListed/Quoted InvestmentsListed/Quoted InvestmentsListed/Quoted Investments (95.6%)
(I) Convertibles(I) Convertibles(I) Convertibles(I) Convertibles (7.9%)
AustraliaAustraliaAustraliaAustralia (1.2%)
QBE Fund Trt CB(QBE)
0%12/5/30-RegS USD4,000,000 2,615,600 1.2
ChinaChinaChinaChina (4.5%)
Bright North EB
(Tianjin) 1.25%4/16 CNY11,000,000 1,760,829 0.8
China Power Intl CB
2.75% 18/09/17 CNY8,000,000 1,441,894 0.7
ENN Energy Hldgs CB
0% 26/02/18 USD2,000,000 2,218,520 1.0
Intime Dept Store CB
1.75% 27/10/13 HKD4,000,000 549,263 0.2
Shui On Land CB 4.5%
29/09/15 CNY10,000,000 1,662,303 0.8
Tong Jie EB (Shanghai
Ind) 0% 02/18 HKD17,000,000 2,211,326 1.0
IndiaIndiaIndiaIndia (1.7%)
Larsen & Toubro CB
3.5% 22/10/14 USD1,300,000 1,357,597 0.6
Tata Steel CB 4.5%
21/11/14 USD2,400,000 2,478,180 1.1
SingaporeSingaporeSingaporeSingapore (0.5%)
CapitaLand Ltd CB
2.1% 15/11/16 SGD1,250,000 1,019,297 0.5
17,314,809 7.9
--------- ----
(II) Debt Securities(II) Debt Securities(II) Debt Securities(II) Debt Securities (87.7%)
AustraliaAustraliaAustraliaAustralia (2.1%)
Australian Govt IL
No15CI 4%20/8/15 AUD1,000,000 1,889,278 0.9
Leighton Fin USA
5.95%13/11/22-
RegS USD2,400,000 2,576,337 1.2
BermudaBermudaBermudaBermuda (0.5%)
BW Group 6.625%
28/06/17-RegS USD1,000,000 1,081,099 0.5
BrazilBrazilBrazilBrazil (0.7%)
Banco BTG Pactual
4.1% 26/03/16 CNY10,000,000 1,608,013 0.7
Cayman IslandsCayman IslandsCayman IslandsCayman Islands (12.0%)
Central China 8%
28/01/20-RegS USD1,200,000 1,252,570 0.6
Champion MTN 3.75%
17/01/23 USD1,600,000 1,541,780 0.7
China Shanshui Cem
6.5% 22/07/14 CNY6,000,000 997,781 0.5
(Continued)
HoldingHoldingHoldingHolding
FairFairFairFair
valuevaluevaluevalue
US$US$US$US$
% of% of% of% of
netnetnetnet
assetsassetsassetsassets
China Shanshui Cem
8.5%25/5/16-RegS USD1,300,000 1,419,192 0.6
China State Const
3.125% 04/18-RegS USD1,800,000 1,790,280 0.8
Country Garden 7.5%
10/01/23-RegS USD1,200,000 1,252,780 0.6
Dorsett Hospitality 6%
03/04/18 CNY7,000,000 1,124,849 0.5
Hutchison Wha Int11
4.625%1/22-RegS USD1,500,000 1,656,674 0.8
Hutchison Wha Int12
VRN6% Perp-RegS USD1,650,000 1,805,705 0.8
Kaisa Group 10.25%
08/01/20-RegS USD1,400,000 1,489,483 0.7
Kaisa Group 8.875%
19/03/18-RegS USD800,000 821,284 0.4
KWG Property 13.25%
22/03/17 USD1,800,000 2,139,805 1.0
Longfor Prop 6.875%
18/10/19 USD2,000,000 2,190,239 1.0
MCE Finance 5%
15/02/21-RegS USD1,400,000 1,421,194 0.6
Shimao Property
6.625% 14/01/20 USD2,000,000 1,968,708 0.9
Shui On Dev Hldg VRN
10.125% Perp USD1,600,000 1,652,640 0.8
Yuzhou Prop 11.75%
25/10/17-RegS USD1,400,000 1,639,740 0.7
ChinaChinaChinaChina (1.5%)
China Railway Res
3.85% 05/02/23 USD1,600,000 1,644,153 0.8
HSBC Bank (China)
FRN 10/01/15 CNY5,600,000 917,769 0.4
Huaneng Power Intl
3.85% 05/02/16 CNY3,800,000 621,836 0.3
Hong KongHong KongHong KongHong Kong (12.8%)
China CITIC Bank Intl
6.875%24/6/20 USD2,000,000 2,390,831 1.1
China CITIC Bank
VRN3.875%
28/09/22 USD1,400,000 1,431,123 0.6
Chinatrust C Bk
VRN5.625% Perp-
RegS USD1,500,000 1,552,266 0.7
Chong Hing Bank 6%
04/11/20 USD2,600,000 2,997,791 1.4
CITIC Pacific 6.8%
17/01/23-RegS USD1,600,000 1,616,587 0.7
CITIC Pacific 6.875%
21/01/18 USD1,400,000 1,509,703 0.7
CITIC Pacific VRN
7.875% Perp USD1,000,000 1,009,631 0.5
Dah Sing Bk VRN
4.875% 9/02/22-
RegS SGD1,750,000 1,487,220 0.7
Gemdale Intl Inv
7.125% 16/11/17 USD2,400,000 2,560,840 1.2
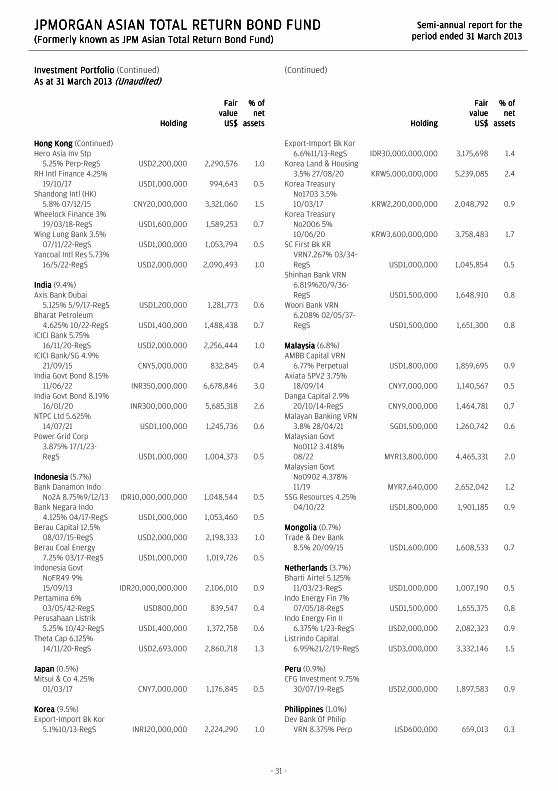
JPMORGAN ASIAN TOTAL RETURN BOND FUNDJPMORGAN ASIAN TOTAL RETURN BOND FUNDJPMORGAN ASIAN TOTAL RETURN BOND FUNDJPMORGAN ASIAN TOTAL RETURN BOND FUND (Formerly known as JPM Asian Total Return Bond Fund)(Formerly known as JPM Asian Total Return Bond Fund)(Formerly known as JPM Asian Total Return Bond Fund)(Formerly known as JPM Asian Total Return Bond Fund)
SemiSemiSemiSemi----annual report for theannual report for theannual report for theannual report for the
period ended 31 March 2013period ended 31 March 2013period ended 31 March 2013period ended 31 March 2013
- 31 -
Investment PortfolioInvestment PortfolioInvestment PortfolioInvestment Portfolio (Continued)
As at 31 March 2013As at 31 March 2013As at 31 March 2013As at 31 March 2013 (Unaudited)(Unaudited)(Unaudited)(Unaudited)
HoldingHoldingHoldingHolding
FairFairFairFair
valuevaluevaluevalue
US$US$US$US$
% of% of% of% of
netnetnetnet
assetsassetsassetsassets
Hong KongHong KongHong KongHong Kong (Continued)
Hero Asia Inv Stp
5.25% Perp-RegS USD2,200,000 2,290,576 1.0
RH Intl Finance 4.25%
19/10/17 USD1,000,000 994,643 0.5
Shandong Intl (HK)
5.8% 07/12/15 CNY20,000,000 3,321,060 1.5
Wheelock Finance 3%
19/03/18-RegS USD1,600,000 1,589,253 0.7
Wing Lung Bank 3.5%
07/11/22-RegS USD1,000,000 1,053,794 0.5
Yancoal Intl Res 5.73%
16/5/22-RegS USD2,000,000 2,090,493 1.0
IndiaIndiaIndiaIndia (9.4%)
Axis Bank Dubai
5.125% 5/9/17-RegS USD1,200,000 1,281,773 0.6
Bharat Petroleum
4.625% 10/22-RegS USD1,400,000 1,488,438 0.7
ICICI Bank 5.75%
16/11/20-RegS USD2,000,000 2,256,444 1.0
ICICI Bank/SG 4.9%
21/09/15 CNY5,000,000 832,845 0.4
India Govt Bond 8.15%
11/06/22 INR350,000,000 6,678,846 3.0
India Govt Bond 8.19%
16/01/20 INR300,000,000 5,685,318 2.6
NTPC Ltd 5.625%
14/07/21 USD1,100,000 1,245,736 0.6
Power Grid Corp
3.875% 17/1/23-
RegS USD1,000,000 1,004,373 0.5
IndonesiaIndonesiaIndonesiaIndonesia (5.7%)
Bank Danamon Indo
No2A 8.75%9/12/13 IDR10,000,000,000 1,048,544 0.5
Bank Negara Indo
4.125% 04/17-RegS USD1,000,000 1,053,460 0.5
Berau Capital 12.5%
08/07/15-RegS USD2,000,000 2,198,333 1.0
Berau Coal Energy
7.25% 03/17-RegS USD1,000,000 1,019,726 0.5
Indonesia Govt
NoFR49 9%
15/09/13 IDR20,000,000,000 2,106,010 0.9
Pertamina 6%
03/05/42-RegS USD800,000 839,547 0.4
Perusahaan Listrik
5.25% 10/42-RegS USD1,400,000 1,372,758 0.6
Theta Cap 6.125%
14/11/20-RegS USD2,693,000 2,860,718 1.3
JapanJapanJapanJapan (0.5%)
Mitsui & Co 4.25%
01/03/17 CNY7,000,000 1,176,845 0.5
KoreaKoreaKoreaKorea (9.5%)
Export-Import Bk Kor
5.1%10/13-RegS INR120,000,000 2,224,290 1.0
(Continued)
HoldingHoldingHoldingHolding
FairFairFairFair
valuevaluevaluevalue
US$US$US$US$
% of% of% of% of
netnetnetnet
assetsassetsassetsassets
Export-Import Bk Kor
6.6%11/13-RegS IDR30,000,000,000 3,175,698 1.4
Korea Land & Housing
3.5% 27/08/20 KRW5,000,000,000 5,239,085 2.4
Korea Treasury
No1703 3.5%
10/03/17 KRW2,200,000,000 2,048,792 0.9
Korea Treasury
No2006 5%
10/06/20 KRW3,600,000,000 3,758,483 1.7
SC First Bk KR
VRN7.267% 03/34-
RegS USD1,000,000 1,045,854 0.5
Shinhan Bank VRN
6.819%20/9/36-
RegS USD1,500,000 1,648,910 0.8
Woori Bank VRN
6.208% 02/05/37-
RegS USD1,500,000 1,651,300 0.8
MalaysiaMalaysiaMalaysiaMalaysia (6.8%)
AMBB Capital VRN
6.77% Perpetual USD1,800,000 1,859,695 0.9
Axiata SPV2 3.75%
18/09/14 CNY7,000,000 1,140,567 0.5
Danga Capital 2.9%
20/10/14-RegS CNY9,000,000 1,464,781 0.7
Malayan Banking VRN
3.8% 28/04/21 SGD1,500,000 1,260,742 0.6
Malaysian Govt
No0112 3.418%
08/22 MYR13,800,000 4,465,331 2.0
Malaysian Govt
No0902 4.378%
11/19 MYR7,640,000 2,652,042 1.2
SSG Resources 4.25%
04/10/22 USD1,800,000 1,901,185 0.9
MongoliaMongoliaMongoliaMongolia (0.7%)
Trade & Dev Bank
8.5% 20/09/15 USD1,600,000 1,608,533 0.7
NetherlandsNetherlandsNetherlandsNetherlands (3.7%)
Bharti Airtel 5.125%
11/03/23-RegS USD1,000,000 1,007,190 0.5
Indo Energy Fin 7%
07/05/18-RegS USD1,500,000 1,655,375 0.8
Indo Energy Fin II
6.375% 1/23-RegS USD2,000,000 2,082,323 0.9
Listrindo Capital
6.95%21/2/19-RegS USD3,000,000 3,332,146 1.5
PeruPeruPeruPeru (0.9%)
CFG Investment 9.75%
30/07/19-RegS USD2,000,000 1,897,583 0.9
PhilippinesPhilippinesPhilippinesPhilippines (1.0%)
Dev Bank Of Philip
VRN 8.375% Perp USD600,000 659,013 0.3

JPMORGAN ASIAN TOTAL RETURN BOND FUNDJPMORGAN ASIAN TOTAL RETURN BOND FUNDJPMORGAN ASIAN TOTAL RETURN BOND FUNDJPMORGAN ASIAN TOTAL RETURN BOND FUND (Formerly known as JPM Asian Total Return Bond Fund)(Formerly known as JPM Asian Total Return Bond Fund)(Formerly known as JPM Asian Total Return Bond Fund)(Formerly known as JPM Asian Total Return Bond Fund)
SemiSemiSemiSemi----annual report for theannual report for theannual report for theannual report for the
period ended 31 March 2013period ended 31 March 2013period ended 31 March 2013period ended 31 March 2013
- 32 -
Investment PortfolioInvestment PortfolioInvestment PortfolioInvestment Portfolio (Continued)
As at 31 March 2013As at 31 March 2013As at 31 March 2013As at 31 March 2013 (Unaudited)(Unaudited)(Unaudited)(Unaudited)
HoldingHoldingHoldingHolding
FairFairFairFair
valuevaluevaluevalue
US$US$US$US$
% of% of% of% of
netnetnetnet
assetsassetsassetsassets
PhilippinesPhilippinesPhilippinesPhilippines (Continued)
SM Investments 4.25%
17/10/19 USD1,400,000 1,432,591 0.7
SingaporeSingaporeSingaporeSingapore (3.5%)
Alam Synergy Pte
6.95% 27/3/20-
RegS USD200,000 202,573 0.1
Capitaland Try
4.076% 20/09/22 USD2,000,000 2,037,517 0.9
ITNL Offshore 5.75%
26/04/15 CNY16,100,000 2,742,078 1.2
TBG Global 4.625%
03/04/18-RegS USD800,000 798,320 0.4
United Over Bk VRN
3.45% 01/04/21 SGD2,250,000 1,898,001 0.9
Sri LankaSri LankaSri LankaSri Lanka (1.0%)
Sri Lanka Govt 8.5%
01/04/18-Ser C LKR300,000,000 2,214,613 1.0
ThailandThailandThailandThailand (7.6%)
Bangkok Bank HK
3.875% 27/9/22-
RegS USD2,000,000 2,051,076 0.9
Krung Thai Bank
2.25% 11/09/18 USD2,800,000 2,800,595 1.3
PTT Global Chem
4.25% 19/09/22-
RegS USD1,600,000 1,680,376 0.8
Thailand Govt 3.65%
17/12/21 THB267,000,000 9,359,178 4.3
Thailand Govt IL 1.25%
12/03/28 THB22,000,000 772,166 0.3
United KingdomUnited KingdomUnited KingdomUnited Kingdom (1.0%)
Vedanta Res 8.25%
07/06/21-RegS USD1,800,000 2,104,118 1.0
United StatesUnited StatesUnited StatesUnited States (1.7%)
Reliance Hldgs USA
5.4% 02/22-RegS USD1,500,000 1,685,100 0.8
Westpac Cap VRN
5.819% Perp-RegS USD2,000,000 2,077,190 0.9
Virgin IslandsVirgin IslandsVirgin IslandsVirgin Islands (5.1%)
Big Will Inv 7%
29/04/14-RegS CNY8,000,000 1,355,823 0.6
FPC Finance 6%
28/06/19 USD1,800,000 1,992,540 0.9
Rainbow Days 3%
30/06/16-RegS CNY8,500,000 1,359,013 0.6
SmarTone Finance
3.875% 8/4/23-
RegS USD2,000,000 1,966,600 0.9
Sparkle Assets 6.875%
30/01/20 USD1,400,000 1,396,276 0.6
Star Energy 6.125%
27/03/20-RegS USD800,000 802,144 0.4
(Continued)
HoldingHoldingHoldingHolding
FairFairFairFair
valuevaluevaluevalue
US$US$US$US$
% of% of% of% of
netnetnetnet
assetsassetsassetsassets
Wiseyear Hldgs
5.875% 06/04/21 USD2,000,000 2,318,844 1.1
191,374,364 87.7
--------- ----
(III) Derivatives(III) Derivatives(III) Derivatives(III) Derivatives (-0.0%)
Forward foreign exchangeForward foreign exchangeForward foreign exchangeForward foreign exchange
contracts contracts contracts contracts (-0.0%) (15,518) (0.0)
FuturesFuturesFuturesFutures (-0.0%)
US 10Yr Note (CBT)
Fut 06/13 (108) (48,938) (0.0)
US Long Bond (CBT)
Fut 06/13 (21) (7,383) (0.0)
(71,839) (0.0)
--------- ----
Total Total Total Total Listed/Quoted InvestmentsListed/Quoted InvestmentsListed/Quoted InvestmentsListed/Quoted Investments 208,617,334 95.6
Other net assetsOther net assetsOther net assetsOther net assets 9,658,366 4.4
Net assets attributable to holders of Net assets attributable to holders of Net assets attributable to holders of Net assets attributable to holders of
redeemable units at 31 March 2013redeemable units at 31 March 2013redeemable units at 31 March 2013redeemable units at 31 March 2013 218,275,700 100.0
Total investments, at costTotal investments, at costTotal investments, at costTotal investments, at cost 198,421,991
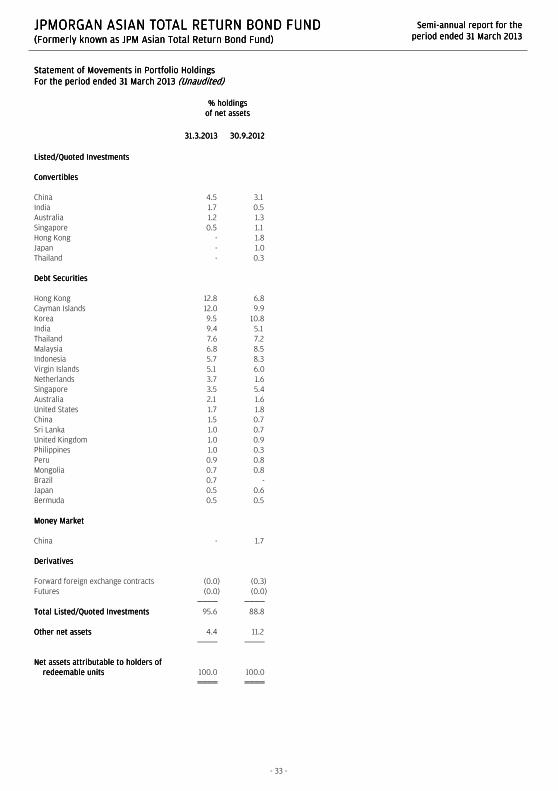
JPMORGAN ASIAN TOTAL RETURN BOND FUNDJPMORGAN ASIAN TOTAL RETURN BOND FUNDJPMORGAN ASIAN TOTAL RETURN BOND FUNDJPMORGAN ASIAN TOTAL RETURN BOND FUND (Formerly known as JPM Asian Total Return Bond Fund)(Formerly known as JPM Asian Total Return Bond Fund)(Formerly known as JPM Asian Total Return Bond Fund)(Formerly known as JPM Asian Total Return Bond Fund)
SemiSemiSemiSemi----annual report for theannual report for theannual report for theannual report for the
period ended 31 March 2013period ended 31 March 2013period ended 31 March 2013period ended 31 March 2013
- 33 -
Statement of Movements in Portfolio HoldingsStatement of Movements in Portfolio HoldingsStatement of Movements in Portfolio HoldingsStatement of Movements in Portfolio Holdings
For the period ended 31 March 2013For the period ended 31 March 2013For the period ended 31 March 2013For the period ended 31 March 2013 (Unaudited)(Unaudited)(Unaudited)(Unaudited)
% holdings% holdings% holdings% holdings
of net assetsof net assetsof net assetsof net assets
31.3.201331.3.201331.3.201331.3.2013 30.9.201230.9.201230.9.201230.9.2012
Listed/Quoted InvestmentsListed/Quoted InvestmentsListed/Quoted InvestmentsListed/Quoted Investments
ConvertiblesConvertiblesConvertiblesConvertibles
China 4.5 3.1
India 1.7 0.5
Australia 1.2 1.3
Singapore 0.5 1.1
Hong Kong - 1.8
Japan - 1.0
Thailand - 0.3
Debt SecuritiesDebt SecuritiesDebt SecuritiesDebt Securities
Hong Kong 12.8 6.8
Cayman Islands 12.0 9.9
Korea 9.5 10.8
India 9.4 5.1
Thailand 7.6 7.2
Malaysia 6.8 8.5
Indonesia 5.7 8.3
Virgin Islands 5.1 6.0
Netherlands 3.7 1.6
Singapore 3.5 5.4
Australia 2.1 1.6
United States 1.7 1.8
China 1.5 0.7
Sri Lanka 1.0 0.7
United Kingdom 1.0 0.9
Philippines 1.0 0.3
Peru 0.9 0.8
Mongolia 0.7 0.8
Brazil 0.7 -
Japan 0.5 0.6
Bermuda 0.5 0.5
Money MarketMoney MarketMoney MarketMoney Market
China - 1.7
DerivativesDerivativesDerivativesDerivatives
Forward foreign exchange contracts (0.0) (0.3)
Futures (0.0) (0.0)
Total Listed/Quoted InvestmentsTotal Listed/Quoted InvestmentsTotal Listed/Quoted InvestmentsTotal Listed/Quoted Investments 95.6 88.8
Other net assetsOther net assetsOther net assetsOther net assets 4.4 11.2
Net assets Net assets Net assets Net assets attributable to holders of attributable to holders of attributable to holders of attributable to holders of
redeemable unitsredeemable unitsredeemable unitsredeemable units 100.0 100.0

JPMORGAN ASIAN TOTAL RETURN BOND FUNDJPMORGAN ASIAN TOTAL RETURN BOND FUNDJPMORGAN ASIAN TOTAL RETURN BOND FUNDJPMORGAN ASIAN TOTAL RETURN BOND FUND (Formerly known as JPM Asian Total Return Bond Fund)(Formerly known as JPM Asian Total Return Bond Fund)(Formerly known as JPM Asian Total Return Bond Fund)(Formerly known as JPM Asian Total Return Bond Fund)
SemiSemiSemiSemi----annual report for theannual report for theannual report for theannual report for the
period ended 31 March 2013period ended 31 March 2013period ended 31 March 2013period ended 31 March 2013
The notes on pages 36 to 40 form part of these financial statements.
- 34 -
Statement of Financial PositionStatement of Financial PositionStatement of Financial PositionStatement of Financial Position
As at 31 March 2013As at 31 March 2013As at 31 March 2013As at 31 March 2013 (Unaudited)(Unaudited)(Unaudited)(Unaudited)
31.3.201331.3.201331.3.201331.3.2013 30.9.201230.9.201230.9.201230.9.2012
US$US$US$US$ US$US$US$US$
AssetsAssetsAssetsAssets
Cash at banks 2,060,286 5,477,048
Short term deposits 9,048,595 19,587,568
Amounts due from brokers 3,224,605 5,611,374
Amounts receivable on allotment 2,639,746 3,190,503
Margin deposits 433,591 532,337
Investments [Note 3] 208,689,173 181,608,368
Interest and other accounts
receivable 86,711 940
Total assetsTotal assetsTotal assetsTotal assets 226,182,707 216,008,138
---------- ----------
LiabilitiesLiabilitiesLiabilitiesLiabilities
Amounts due to brokers 5,697,524 10,171,404
Amounts payable on redemption 1,330,998 760,724
Distribution payable [Note 5] 766,826 591,490
Derivatives [Note 3] 71,839 673,223
Other accounts payable 405,838 400,528
Liabilities (excluding net assets Liabilities (excluding net assets Liabilities (excluding net assets Liabilities (excluding net assets
attributable to holders of attributable to holders of attributable to holders of attributable to holders of
redeemable units)redeemable units)redeemable units)redeemable units) 8,273,025 12,597,369
---------- ----------
Net assets attributable to holders Net assets attributable to holders Net assets attributable to holders Net assets attributable to holders
of redeemable units of redeemable units of redeemable units of redeemable units
(before fair value adjustment) (before fair value adjustment) (before fair value adjustment) (before fair value adjustment)
[Note 3] 217,909,682 203,410,769
Fair value adjustment of units of
the Fund [Note 3] 366,018 328,913
Net assets attributable to holders Net assets attributable to holders Net assets attributable to holders Net assets attributable to holders
of redeemable unitsof redeemable unitsof redeemable unitsof redeemable units
(after fair value adjustment) (after fair value adjustment) (after fair value adjustment) (after fair value adjustment)
[Note 3] 218,275,700 203,739,682
Statement of Comprehensive IncomeStatement of Comprehensive IncomeStatement of Comprehensive IncomeStatement of Comprehensive Income
For the period endedFor the period endedFor the period endedFor the period ended 31 March 201331 March 201331 March 201331 March 2013 (Unaudited)(Unaudited)(Unaudited)(Unaudited)
1.10.20121.10.20121.10.20121.10.2012
totototo
31.3.201331.3.201331.3.201331.3.2013
1.10.20111.10.20111.10.20111.10.2011
totototo
31.3.201231.3.201231.3.201231.3.2012
US$US$US$US$ US$US$US$US$
IncomeIncomeIncomeIncome
Net gains on investments and
derivatives [Note 4] 8,106,844 20,267,869
Interest on deposits 16,205 22,778
Net foreign currency exchange
losses (180,130) (118,420)
Other income 167,857 63,500
8,110,776 20,235,727
---------- ----------
ExpensesExpensesExpensesExpenses
Management fee 1,098,180 978,788
Registrar's fee 69,589 61,064
Trustee's fee 36,644 33,696
Safe custody and bank charges 21,135 22,002
Valuation fee 8,400 8,610
Auditor's fee 5,695 6,512
Transaction costs 5,434 4,344
Legal and professional expenses 4,725 2,379
Printing and publication expenses 1,744 4,098
Other operating expenses 3,433 943
1,254,979 1,122,436
---------- ----------
Net operating profitNet operating profitNet operating profitNet operating profit 6,855,797 19,113,291
---------- ----------
Finance costsFinance costsFinance costsFinance costs
Distribution [Note 5] (4,312,810) (3,690,030)
Interest paid (6) -
(4,312,816) (3,690,030)
---------- ----------
Profit before taxationProfit before taxationProfit before taxationProfit before taxation 2,542,981 15,423,261
Taxation (239,875) (216,106)
2,303,106 15,207,155
Change in cumulative difference
arising from the fair value
adjustment of units of the
Fund 37,105 (802,405)
Increase in net assets Increase in net assets Increase in net assets Increase in net assets
attributable to holders of attributable to holders of attributable to holders of attributable to holders of
redeemable units and total redeemable units and total redeemable units and total redeemable units and total
comprehensive incomecomprehensive incomecomprehensive incomecomprehensive income 2,340,211 14,404,750

JPMORGAN ASIAN TOTAL RETURN BOND FUNDJPMORGAN ASIAN TOTAL RETURN BOND FUNDJPMORGAN ASIAN TOTAL RETURN BOND FUNDJPMORGAN ASIAN TOTAL RETURN BOND FUND (Formerly known as JPM Asian Total Return Bond Fund)(Formerly known as JPM Asian Total Return Bond Fund)(Formerly known as JPM Asian Total Return Bond Fund)(Formerly known as JPM Asian Total Return Bond Fund)
SemiSemiSemiSemi----annual report for theannual report for theannual report for theannual report for the
period ended 31 March 2013period ended 31 March 2013period ended 31 March 2013period ended 31 March 2013
The notes on pages 36 to 40 form part of these financial statements.
- 35 -
Statement of Statement of Statement of Statement of Changes in Net Assets Attributable to Holders Changes in Net Assets Attributable to Holders Changes in Net Assets Attributable to Holders Changes in Net Assets Attributable to Holders
of Redeemable Unitsof Redeemable Unitsof Redeemable Unitsof Redeemable Units
For the period ended 31 March 2013For the period ended 31 March 2013For the period ended 31 March 2013For the period ended 31 March 2013 (Unaudited)(Unaudited)(Unaudited)(Unaudited)
1.10.20121.10.20121.10.20121.10.2012
totototo
31.3.201331.3.201331.3.201331.3.2013
1.10.20111.10.20111.10.20111.10.2011
totototo
31.3.201231.3.201231.3.201231.3.2012
US$US$US$US$ US$US$US$US$
Net assets attributable to holders Net assets attributable to holders Net assets attributable to holders Net assets attributable to holders
of redeemable units at the of redeemable units at the of redeemable units at the of redeemable units at the
beginning of the beginning of the beginning of the beginning of the periodperiodperiodperiod 203,739,682 189,051,826
---------- ----------
Allotment of redeemable units 86,950,619 27,138,151
Redemption of redeemable units (74,754,812) (27,821,408)
Net allotment/(redemption)Net allotment/(redemption)Net allotment/(redemption)Net allotment/(redemption) 12,195,807 (683,257)
---------- ----------
215,935,489 188,368,569
Increase in net assets Increase in net assets Increase in net assets Increase in net assets
attributable to holders of attributable to holders of attributable to holders of attributable to holders of
redeemable units and total redeemable units and total redeemable units and total redeemable units and total
comprehensive incomecomprehensive incomecomprehensive incomecomprehensive income 2,340,211 14,404,750
Net assets attributable to holders Net assets attributable to holders Net assets attributable to holders Net assets attributable to holders
of redeemable of redeemable of redeemable of redeemable units at the end units at the end units at the end units at the end
of the periodof the periodof the periodof the period 218,275,700 202,773,319
Statement of Cash FlowsStatement of Cash FlowsStatement of Cash FlowsStatement of Cash Flows
For the period ended 31 March 2013For the period ended 31 March 2013For the period ended 31 March 2013For the period ended 31 March 2013 (Unaudited)(Unaudited)(Unaudited)(Unaudited)
1.10.20121.10.20121.10.20121.10.2012
totototo
31.3.201331.3.201331.3.201331.3.2013
1.10.20111.10.20111.10.20111.10.2011
totototo
31.3.201231.3.201231.3.201231.3.2012
US$US$US$US$ US$US$US$US$
Operating activitiesOperating activitiesOperating activitiesOperating activities
Purchase of investments and
derivatives (129,597,309) (120,919,364)
Proceeds from disposal of
investments and derivatives 107,934,853 138,909,216
Decrease/(increase) in margin
deposits 98,746 (854,402)
Interest received 16,633 22,517
Transaction costs paid (5,699) (4,849)
Trustee's fee paid (36,323) (33,692)
Registrar's fee paid (60,815) (55,476)
Tax paid (246,592) (265,641)
Management fee paid (1,085,367) (978,651)
Others (176,207) (109,048)
Net cash (outflow)/inflow from Net cash (outflow)/inflow from Net cash (outflow)/inflow from Net cash (outflow)/inflow from
operating operating operating operating activitiesactivitiesactivitiesactivities (23,158,080) 15,710,610
---------- ----------
Financing activitiesFinancing activitiesFinancing activitiesFinancing activities
Interest paid (6) -
Receipts on allotment of
redeemable units 87,501,376 27,785,461
Payments on redemption of
redeemable units (74,184,538) (31,921,961)
Distribution paid (4,137,474) (3,692,259)
Net cash inflow/(outflow) from Net cash inflow/(outflow) from Net cash inflow/(outflow) from Net cash inflow/(outflow) from
financing activitiesfinancing activitiesfinancing activitiesfinancing activities 9,179,358 (7,828,759)
---------- ----------
(Decrease)/increase in cash (Decrease)/increase in cash (Decrease)/increase in cash (Decrease)/increase in cash
and cash equivalentsand cash equivalentsand cash equivalentsand cash equivalents (13,978,722) 7,881,851
Cash and cash equivalents at the
beginning of the period 25,064,616 28,051,612
Exchange gains on cash and cash
equivalents 22,987 2,272
Cash and cash equivalents at Cash and cash equivalents at Cash and cash equivalents at Cash and cash equivalents at
the end of the periodthe end of the periodthe end of the periodthe end of the period 11,108,881 35,935,735
Analysis of balances of cash and cash equivalents:Analysis of balances of cash and cash equivalents:Analysis of balances of cash and cash equivalents:Analysis of balances of cash and cash equivalents:
Cash at banks 2,060,286 6,932,916
Short term deposits 9,048,595 29,002,819
11,108,881 35,935,735

JPMORGAN ASIAN TOTAL RETURN BOND FUNDJPMORGAN ASIAN TOTAL RETURN BOND FUNDJPMORGAN ASIAN TOTAL RETURN BOND FUNDJPMORGAN ASIAN TOTAL RETURN BOND FUND (Formerly known as JPM Asian Total Return Bond Fund)(Formerly known as JPM Asian Total Return Bond Fund)(Formerly known as JPM Asian Total Return Bond Fund)(Formerly known as JPM Asian Total Return Bond Fund)
SemiSemiSemiSemi----annual report for theannual report for theannual report for theannual report for the
period ended 31 March 2013period ended 31 March 2013period ended 31 March 2013period ended 31 March 2013
- 36 -
Notes to the Financial StatementsNotes to the Financial StatementsNotes to the Financial StatementsNotes to the Financial Statements
1111 The FundThe FundThe FundThe Fund
JPMorgan Asian Total Return Bond Fund (the "Fund") was established under a Trust Deed dated 30 November 2004, as amended, and is
governed by the laws of Hong Kong. The Fund is authorized by the Securities and Futures Commission of Hong Kong.
With effect from 4 February 2013, the name of the Fund was changed from JPM Asian Total Return Bond Fund to JPMorgan Asian Total Return
Bond Fund.
The investment objective of the Fund is to achieve a competitive total return, consisting of capital growth and regular dividend income,
through an actively managed portfolio investing primarily in Asian bonds and other debt securities.
Pursuant to the Supplemental Trust Deed dated 27 February 2012, the Manager may decide to issue separate classes (each a “Class”) whose
assets will be commonly invested but where a specific fee structure, currency or distribution policy may be applied. Each Class may have a
different charging structure with the result that the net asset value attributable to each Class may differ.
All unitholders' rights with regard to the convening, voting or otherwise acting at any meeting of unitholders are the same.
2222 Summary of principal accounting policiesSummary of principal accounting policiesSummary of principal accounting policiesSummary of principal accounting policies
(a)(a)(a)(a) Accounting policies of interim financial statementsAccounting policies of interim financial statementsAccounting policies of interim financial statementsAccounting policies of interim financial statements
The accounting policies and methods of computation used in the preparation of these unaudited condensed interim financial statements
are consistent with those used in the annual financial statements for the year ended 30 September 2012.
(b)(b)(b)(b) Investments and derivativesInvestments and derivativesInvestments and derivativesInvestments and derivatives
Classification
The Fund classifies its investments and derivatives as financial assets or financial liabilities at fair value through profit or loss. These
financial assets or financial liabilities are held-for-trading as they are acquired or incurred principally for the purpose of selling or
repurchasing in the near term or short-term profit taking.
All derivatives are carried in assets when amounts are receivable by the Fund and in liabilities when amounts are payable by the Fund.
Recognition, derecognition and measurement
Purchases and sales of investments and derivatives are accounted for on the trade date basis. Investments and derivatives are initially
recognized at fair value and are subsequently re-measured at fair value. Realized and unrealized gains and losses on investments and
derivatives are recognized in the Statement of Comprehensive Income. Investments and derivatives are derecognized when the rights to
receive cash flows from the investments and derivatives have expired or the Fund has transferred substantially all risks and rewards of
ownership.
Fair value estimation
Investments that are listed or traded on an exchange and investments with prices quoted in over-the-counter markets or by market
makers, are fair valued based on quoted "bid" prices on long investments and quoted "ask" prices on investments sold short. When
trading in the securities of an investee company is suspended, the investment is valued at the Manager's estimate of its fair value.
Debt securities are fair valued based on quoted prices inclusive of accrued interest.
Investments in collective investment schemes are stated at fair value based on the net asset value per unit of the respective funds as
determined by the administrators of the relevant funds or stated at "bid" prices if the collective investment schemes are listed or traded
on an exchange.
Open future and swap contracts are valued at "bid" prices for long positions and "ask" prices for short positions at the valuation date.
The differences between the bid/ask prices and the contract prices are recognized in the Statement of Comprehensive Income.
Open option contracts are valued at "bid" prices for long positions and "ask" prices for short positions at the valuation date. The
differences between the bid/ask prices and the premium amounts/contract prices are recognized in the Statement of Comprehensive
Income.
Credit default swaps are marked to market daily based upon quotations from the market makers and the change in value, if any, is
recorded as an unrealized gain or loss in the Statement of Comprehensive Income.

JPMORGAN ASIAN TOTAL RETURN BOND FUNDJPMORGAN ASIAN TOTAL RETURN BOND FUNDJPMORGAN ASIAN TOTAL RETURN BOND FUNDJPMORGAN ASIAN TOTAL RETURN BOND FUND (Formerly known as JPM Asian Total Return Bond Fund)(Formerly known as JPM Asian Total Return Bond Fund)(Formerly known as JPM Asian Total Return Bond Fund)(Formerly known as JPM Asian Total Return Bond Fund)
SemiSemiSemiSemi----annual report for theannual report for theannual report for theannual report for the
period ended 31 March 2013period ended 31 March 2013period ended 31 March 2013period ended 31 March 2013
- 37 -
Forward foreign exchange contracts are valued at the forward rates ruling at the valuation date. The differences between the forward
rates and the contract rates are recognized in the Statement of Comprehensive Income.
(c)(c)(c)(c) Foreign currency translationForeign currency translationForeign currency translationForeign currency translation
Functional and presentation currency
The Fund has adopted United States dollar as its functional and presentation currency.
Transactions and balances
Foreign currency transactions are translated into the functional currency using the exchange rates prevailing at the dates of the
transactions.
Foreign exchange gains and losses resulting from the settlement of such transactions and from the translation of assets and liabilities
denominated in foreign currencies at period/year end exchange rates are recognized in the Statement of Comprehensive Income.
Foreign exchange gains and losses relating to cash and cash equivalents are presented in the Statement of Comprehensive Income
within "Net foreign currency exchange gains/losses". Foreign exchange gains and losses relating to the financial assets and liabilities
carried at fair value through profit or loss are presented in the Statement of Comprehensive Income within "Net gains/losses on
investments and derivatives".
(d)(d)(d)(d) Proceeds and payments on allotment and redemptionProceeds and payments on allotment and redemptionProceeds and payments on allotment and redemptionProceeds and payments on allotment and redemption of unitsof unitsof unitsof units
The net asset value per unit is computed for each dealing day. The price at which units are allotted or redeemed is calculated by
reference to the net asset value per unit as at the close of business on the relevant dealing day in accordance with the provisions of the
Fund's Trust Deed dated 30 November 2004, as amended, which may be different from the accounting policies stated in the financial
statements.
Units of the Fund are redeemable at the option of the holders of redeemable units and are classified as a financial liability in the
Statement of Financial Position which represents the net assets attributable to holders of redeemable units (or "net asset value" or "net
assets" or "NAV") and is carried at the redemption amount that would be payable at the Statement of Financial Position date if the
holders of redeemable units exercised the right to redeem units of the Fund.
3333 Net assets attributable to holders of redeemable units and number of units in issueNet assets attributable to holders of redeemable units and number of units in issueNet assets attributable to holders of redeemable units and number of units in issueNet assets attributable to holders of redeemable units and number of units in issue
Fair value adjustment of units of the Fund
As stated in Note 2(d), units of the Fund are redeemable at the option of the holders of redeemable units and are classified as a financial
liability in the Statement of Financial Position which represents the net assets attributable to the holders of redeemable units and is carried at
the redemption amount that would be payable at the Statement of Financial Position date, if the holders of redeemable units exercised the
right to redeem units of the Fund. The redemption amount is determined based on the net assets attributable to holders of redeemable units
calculated in accordance with the provisions of the Fund's Trust Deed dated 30 November 2004, as amended ("Trust Deed NAV").
31.3.2013 30.9.2012
US$ US$
Net assets attributable to holders of redeemable units (before fair value adjustment) 217,909,682 203,410,769
Fair value adjustment of units of the Fund:
Difference between bid/ask prices and last traded prices basis in valuing investments and
derivatives as at the end of the period [Note 3(a)] 366,018 328,913
Net assets attributable to holders of redeemable units (after fair value adjustment) 218,275,700 203,739,682
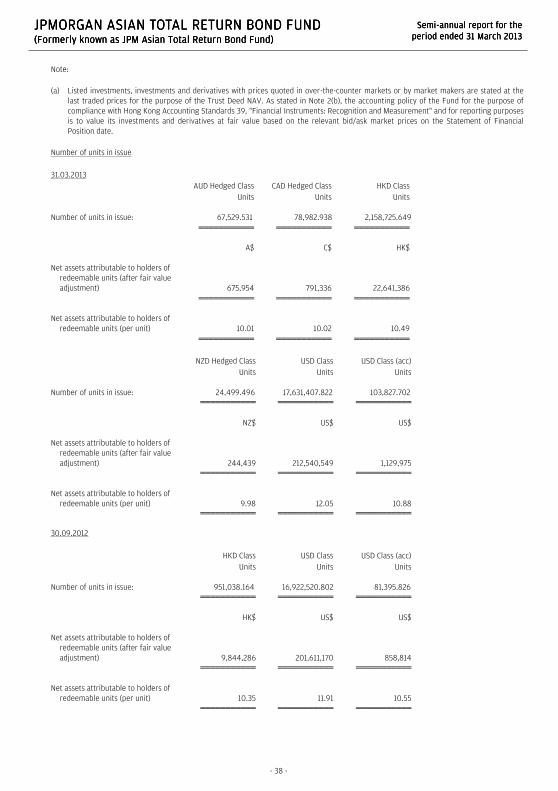
JPMORGAN ASIAN TOTAL RETURN BOND FUNDJPMORGAN ASIAN TOTAL RETURN BOND FUNDJPMORGAN ASIAN TOTAL RETURN BOND FUNDJPMORGAN ASIAN TOTAL RETURN BOND FUND (Formerly known as JPM Asian Total Return Bond Fund)(Formerly known as JPM Asian Total Return Bond Fund)(Formerly known as JPM Asian Total Return Bond Fund)(Formerly known as JPM Asian Total Return Bond Fund)
SemiSemiSemiSemi----annual report for theannual report for theannual report for theannual report for the
period ended 31 March 2013period ended 31 March 2013period ended 31 March 2013period ended 31 March 2013
- 38 -
Note:
(a) Listed investments, investments and derivatives with prices quoted in over-the-counter markets or by market makers are stated at the
last traded prices for the purpose of the Trust Deed NAV. As stated in Note 2(b), the accounting policy of the Fund for the purpose of
compliance with Hong Kong Accounting Standards 39, "Financial Instruments: Recognition and Measurement" and for reporting purposes
is to value its investments and derivatives at fair value based on the relevant bid/ask market prices on the Statement of Financial
Position date.
Number of units in issue
31.03.2013
AUD Hedged Class CAD Hedged Class HKD Class
Units Units Units
Number of units in issue: 67,529.531 78,982.938 2,158,725.649
A$ C$ HK$
Net assets attributable to holders of
redeemable units (after fair value
adjustment) 675,954 791,336 22,641,386
Net assets attributable to holders of
redeemable units (per unit) 10.01 10.02 10.49
NZD Hedged Class USD Class USD Class (acc)
Units Units Units
Number of units in issue: 24,499.496 17,631,407.822 103,827.702
NZ$ US$ US$
Net assets attributable to holders of
redeemable units (after fair value
adjustment)
244,439
212,540,549
1,129,975
Net assets attributable to holders of
redeemable units (per unit)
9.98
12.05
10.88
30.09.2012
HKD Class USD Class USD Class (acc)
Units Units Units
Number of units in issue: 951,038.164 16,922,520.802 81,395.826
HK$ US$ US$
Net assets attributable to holders of
redeemable units (after fair value
adjustment)
9,844,286
201,611,170
858,814
Net assets attributable to holders of
redeemable units (per unit)
10.35
11.91
10.55

JPMORGAN ASIAN TOTAL RETURN BOND FUNDJPMORGAN ASIAN TOTAL RETURN BOND FUNDJPMORGAN ASIAN TOTAL RETURN BOND FUNDJPMORGAN ASIAN TOTAL RETURN BOND FUND (Formerly known as JPM Asian Total Return Bond Fund)(Formerly known as JPM Asian Total Return Bond Fund)(Formerly known as JPM Asian Total Return Bond Fund)(Formerly known as JPM Asian Total Return Bond Fund)
SemiSemiSemiSemi----annual report for theannual report for theannual report for theannual report for the
period ended 31 March 2013period ended 31 March 2013period ended 31 March 2013period ended 31 March 2013
- 39 -
4444 Net gains on investments and derivatives Net gains on investments and derivatives Net gains on investments and derivatives Net gains on investments and derivatives
1.10.2012
to
31.3.2013
1.10.2011
to
31.3.2012
US$ US$
Change in unrealized gains/losses in value of investments and derivatives 1,963,467 9,944,964
Realized gains on sale of investments and derivatives 6,143,377 10,322,905
8,106,844 20,267,869
5555 Distribution Distribution Distribution Distribution
In accordance with the Explanatory Memorandum of the Fund, in respect of each accounting period, the Fund will distribute at least 85% of
the net operating profit of the Fund after making certain adjustments to the holders of redeemable units. The distribution is included under
finance costs in the Statement of Comprehensive Income.
1.10.2012
to
31.3.2013
1.10.2011
to
31.3.2012
US$ US$
Net operating profit 6,855,797 19,113,291
Adjustments:
Net gains on investments and derivatives (8,106,844) (20,267,869)
Interest income included in net gains on investments and derivatives (at coupon rate) 5,305,460 5,176,051
Net foreign currency exchange losses 180,130 118,420
Transaction costs 5,434 4,344
Interest paid (6) -
Taxation (239,875) (216,106)
Capital gains tax 60,701 116,724
Amount available for distribution 4,060,797 4,044,855
Distribution of
HK$0.0304 per unit on 1,258,681.661 units ex on 31 October 2012 and pay
on 8 November 2012 (4,937)
US$0.0350 per unit on 17,336,773.116 units ex on 31 October 2012 and pay
on 8 November 2012 (606,787)
(2012: US$0.0350 per unit on 17,552,619.982 units ex on 31 October 2011 and pay
on 8 November 2011)
(614,342)
HK$0.0304 per unit on 2,142,318.582 units ex on 30 November 2012 and pay
on 10 December 2012 (8,403)
US$0.0350 per unit on 18,901,729.440 units ex on 30 November 2012 and pay
on 10 December 2012 (661,561)
(2012: US$0.0350 per unit on 17,419,181.058 units ex on 30 November 2011 and pay
on 8 December 2011)
(609,671)
HK$0.0304 per unit on 2,321,626.100 units ex on 31 December 2012 and pay
on 9 January 2013 (9,106)
US$0.0350 per unit on 18,910,378.767 units ex on 31 December 2012 and pay
on 9 January 2013 (661,863)
(2012: US$0.0350 per unit on 17,564,723.353 units ex on 30 December 2011 and pay
on 10 January 2012)
(614,765)
A$0.0594 per unit on 33,178.463 units ex on 31 January 2013 and pay
on 8 February 2013 (2,056)
C$0.0420 per unit on 19,942.856 units ex on 31 January 2013 and pay
on 8 February 2013 (839)
HK$0.0369 per unit on 2,404,601.802 units ex on 31 January 2013 and pay
on 8 February 2013 (11,441)
NZ$0.0562 per unit on 24,230.676 units ex on 31 January 2013 and pay
on 8 February 2013 (1,144)
US$0.0425 per unit on 19,393,101.617 units ex on 31 January 2013 and pay on 8 February 2013 (824,207)

JPMORGAN ASIAN TOTAL RETURN BOND FUNDJPMORGAN ASIAN TOTAL RETURN BOND FUNDJPMORGAN ASIAN TOTAL RETURN BOND FUNDJPMORGAN ASIAN TOTAL RETURN BOND FUND (Formerly known as JPM Asian Total Return Bond Fund)(Formerly known as JPM Asian Total Return Bond Fund)(Formerly known as JPM Asian Total Return Bond Fund)(Formerly known as JPM Asian Total Return Bond Fund)
SemiSemiSemiSemi----annual report for theannual report for theannual report for theannual report for the
period ended 31 March 2013period ended 31 March 2013period ended 31 March 2013period ended 31 March 2013
- 40 -
1.10.2012
to
31.3.2013
1.10.2011
to
31.3.2012
US$ US$
(2012: US$0.0350 per unit on 17,637,282.137 units ex on 31 January 2012 and pay
on 8 February 2012)
(617,305)
A$0.0569 per unit on 25,571.172 units ex on 28 February 2013 and pay
on 8 March 2013 (1,490)
C$0.0413 per unit on 34,679.059 units ex on 28 February 2013 and pay
on 8 March 2013 (1,393)
HK$0.0369 per unit on 2,137,833.294 units ex on 28 February 2013 and pay
on 8 March 2013 (10,172)
NZ$0.0541 per unit on 24,367.536 units ex on 28 February 2013 and pay
on 8 March 2013 (1,093)
US$0.0425 per unit on 17,399,816.813 units ex on 28 February 2013 and pay
on 8 March 2013 (739,492)
(2012: US$0.0350 per unit on 17,606,238.991 units ex on 29 February 2012 and pay
on 8 March 2012)
(616,218)
A$0.0590 per unit on 67,529.531 units ex on 28 March 2013 and pay
on 10 April 2013 (4,154)
C$0.0420 per unit on 78,982.938 units ex on 28 March 2013 and pay
on 10 April 2013 (3,265)
HK$0.0369 per unit on 2,177,682.994 units ex on 28 March 2013 and pay
on 10 April 2013 (10,352)
NZ$0.0561 per unit on 24,499.496 units ex on 28 March 2013 and pay
on 10 April 2013 (1,152)
US$0.0425 per unit on 17,597,725.720 units ex on 28 March 2013 and pay
on 10 April 2013 (747,903)
(2012: US$0.0350 per unit on 17,649,390.981 units ex on 30 March 2012 and pay
on 12 April 2012)
(617,729)
Total distribution to holders of redeemable units (4,312,810) (3,690,030)
In the event that the amount available for distribution is insufficient to pay distributions as the Fund declares, the Manager may in its
discretion determine that such distributions be paid from capital.
6666 Soft commission Soft commission Soft commission Soft commission arrangementsarrangementsarrangementsarrangements
The Investment Manager has entered into soft commission arrangements with brokers under which certain goods and services used to
support investment decision making are received by the Investment Manager. The Investment Manager does not make direct payment for
these services but transacts an agreed amount of business with the brokers on behalf of the Fund. Commission is paid from the Fund on these
transactions.
The goods and services must be of demonstrable benefit to the Fund and may include research and advisory services; economic and political
analysis; portfolio analysis, including valuation and performance measurement; market analysis, data and quotation services, computer
hardware and software incidental to the above goods and services; clearing and custodian services and investment-related publications.
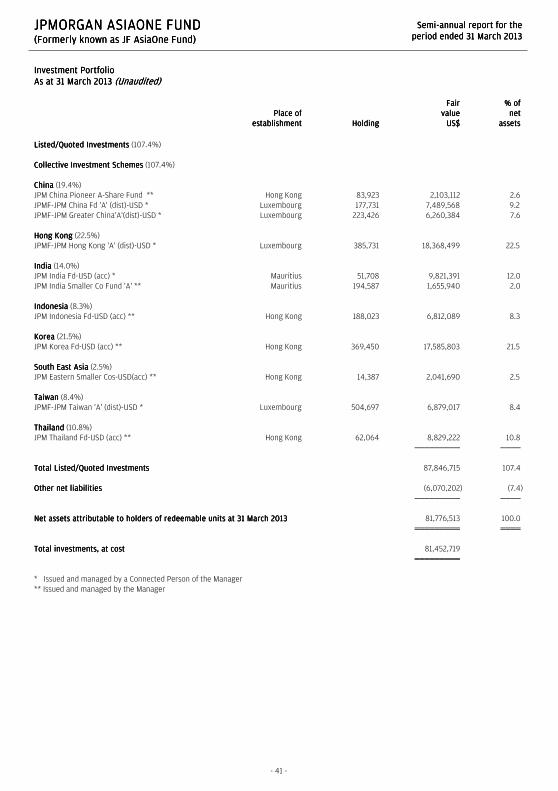
JPMORGAN ASIAONE FUNDJPMORGAN ASIAONE FUNDJPMORGAN ASIAONE FUNDJPMORGAN ASIAONE FUND (Formerly known as JF AsiaOne Fund)(Formerly known as JF AsiaOne Fund)(Formerly known as JF AsiaOne Fund)(Formerly known as JF AsiaOne Fund)
SemiSemiSemiSemi----annual report for theannual report for theannual report for theannual report for the
period ended 31 March 2013period ended 31 March 2013period ended 31 March 2013period ended 31 March 2013
- 41 -
Investment PortfolioInvestment PortfolioInvestment PortfolioInvestment Portfolio
As at 31 March 2013As at 31 March 2013As at 31 March 2013As at 31 March 2013 (Unaudited)(Unaudited)(Unaudited)(Unaudited)
Place ofPlace ofPlace ofPlace of
establishmentestablishmentestablishmentestablishment HoldingHoldingHoldingHolding
FairFairFairFair
valuevaluevaluevalue
US$US$US$US$
% of% of% of% of
netnetnetnet
assetsassetsassetsassets
Listed/Quoted InvestmentsListed/Quoted InvestmentsListed/Quoted InvestmentsListed/Quoted Investments (107.4%)
Collective Investment SchemesCollective Investment SchemesCollective Investment SchemesCollective Investment Schemes (107.4%)
ChinaChinaChinaChina (19.4%)
JPM China Pioneer A-Share Fund ** Hong Kong 83,923 2,103,112 2.6
JPMF-JPM China Fd 'A' (dist)-USD * Luxembourg 177,731 7,489,568 9.2
JPMF-JPM Greater China'A'(dist)-USD * Luxembourg 223,426 6,260,384 7.6
Hong KongHong KongHong KongHong Kong (22.5%)
JPMF-JPM Hong Kong 'A' (dist)-USD * Luxembourg 385,731 18,368,499 22.5
IndiaIndiaIndiaIndia (14.0%)
JPM India Fd-USD (acc) * Mauritius 51,708 9,821,391 12.0
JPM India Smaller Co Fund 'A' ** Mauritius 194,587 1,655,940 2.0
IndonesiaIndonesiaIndonesiaIndonesia (8.3%)
JPM Indonesia Fd-USD (acc) ** Hong Kong 188,023 6,812,089 8.3
KoreaKoreaKoreaKorea (21.5%)
JPM Korea Fd-USD (acc) ** Hong Kong 369,450 17,585,803 21.5
South East AsiaSouth East AsiaSouth East AsiaSouth East Asia (2.5%)
JPM Eastern Smaller Cos-USD(acc) ** Hong Kong 14,387 2,041,690 2.5
TaiwanTaiwanTaiwanTaiwan (8.4%)
JPMF-JPM Taiwan 'A' (dist)-USD * Luxembourg 504,697 6,879,017 8.4
ThailandThailandThailandThailand (10.8%)
JPM Thailand Fd-USD (acc) ** Hong Kong 62,064 8,829,222 10.8
Total Listed/Quoted InvestmentsTotal Listed/Quoted InvestmentsTotal Listed/Quoted InvestmentsTotal Listed/Quoted Investments 87,846,715 107.4
Other net Other net Other net Other net liabilitiesliabilitiesliabilitiesliabilities (6,070,202) (7.4)
Net assets attributable to holders of redeemable units at 31 March 2013Net assets attributable to holders of redeemable units at 31 March 2013Net assets attributable to holders of redeemable units at 31 March 2013Net assets attributable to holders of redeemable units at 31 March 2013 81,776,513 100.0
Total investments, at costTotal investments, at costTotal investments, at costTotal investments, at cost 81,452,719
* Issued and managed by a Connected Person of the Manager
** Issued and managed by the Manager

JPMORGAN ASIAONE FUNDJPMORGAN ASIAONE FUNDJPMORGAN ASIAONE FUNDJPMORGAN ASIAONE FUND (Formerly known as JF AsiaOne Fund)(Formerly known as JF AsiaOne Fund)(Formerly known as JF AsiaOne Fund)(Formerly known as JF AsiaOne Fund)
SemiSemiSemiSemi----annual report for theannual report for theannual report for theannual report for the
period ended 31 March 2013period ended 31 March 2013period ended 31 March 2013period ended 31 March 2013
- 42 -
Statement of Movements in Portfolio HoldingsStatement of Movements in Portfolio HoldingsStatement of Movements in Portfolio HoldingsStatement of Movements in Portfolio Holdings
For the period ended 31 March 2013For the period ended 31 March 2013For the period ended 31 March 2013For the period ended 31 March 2013 (Unaudited)(Unaudited)(Unaudited)(Unaudited)
% holdings% holdings% holdings% holdings
of net assetsof net assetsof net assetsof net assets
31.3.201331.3.201331.3.201331.3.2013 30.9.201230.9.201230.9.201230.9.2012
Listed/Quoted InvestmentsListed/Quoted InvestmentsListed/Quoted InvestmentsListed/Quoted Investments
Collective Investment SchemesCollective Investment SchemesCollective Investment SchemesCollective Investment Schemes
Hong Kong 22.5 18.8
Korea 21.5 20.1
China 19.4 12.1
India 14.0 13.5
Thailand 10.8 10.6
Taiwan 8.4 13.5
Indonesia 8.3 9.8
South East Asia 2.5 -
Philippines - 1.0
Total Listed/Quoted InvestmentsTotal Listed/Quoted InvestmentsTotal Listed/Quoted InvestmentsTotal Listed/Quoted Investments 107.4 99.4
Other net (liabilities)/assetsOther net (liabilities)/assetsOther net (liabilities)/assetsOther net (liabilities)/assets (7.4) 0.6
Net assets attributable to holders of redeemable unitsNet assets attributable to holders of redeemable unitsNet assets attributable to holders of redeemable unitsNet assets attributable to holders of redeemable units 100.0 100.0

JPMORGAN ASIAONE FUNDJPMORGAN ASIAONE FUNDJPMORGAN ASIAONE FUNDJPMORGAN ASIAONE FUND (Formerly known as JF AsiaOne Fund)(Formerly known as JF AsiaOne Fund)(Formerly known as JF AsiaOne Fund)(Formerly known as JF AsiaOne Fund)
SemiSemiSemiSemi----annual report for theannual report for theannual report for theannual report for the
period ended 31 March 2013period ended 31 March 2013period ended 31 March 2013period ended 31 March 2013
The notes on pages 45 to 46 form part of these financial statements.
- 43 -
Statement of Financial PositionStatement of Financial PositionStatement of Financial PositionStatement of Financial Position
As at 31 March 2013As at 31 March 2013As at 31 March 2013As at 31 March 2013 (Unaudited)(Unaudited)(Unaudited)(Unaudited)
31.3.201331.3.201331.3.201331.3.2013 30.9.201230.9.201230.9.201230.9.2012
US$US$US$US$ US$US$US$US$
AssetsAssetsAssetsAssets
Cash at banks 41,540 1,081,343
Amounts due from brokers - 6,976,548
Amounts receivable on allotment 95,993 1,660
Margin deposits 1,335 1,332
Investments 87,846,715 87,169,967
Interest receivable 1 27
Total assetsTotal assetsTotal assetsTotal assets 87,985,584 95,230,877
---------- ----------
LiabilitiesLiabilitiesLiabilitiesLiabilities
Short term bank loans - unsecured 5,655,792 -
Amounts due to brokers - 6,976,548
Amounts payable on redemption 505,413 491,060
Other accounts payable 47,866 86,123
Total liabilitiesTotal liabilitiesTotal liabilitiesTotal liabilities 6,209,071 7,553,731
---------- ----------
Net assets attributable to holders Net assets attributable to holders Net assets attributable to holders Net assets attributable to holders
of redeemable units of redeemable units of redeemable units of redeemable units [Note 3] 81,776,513 87,677,146
EquityEquityEquityEquity 81,776,513 87,677,146
Statement Statement Statement Statement of Comprehensive Incomeof Comprehensive Incomeof Comprehensive Incomeof Comprehensive Income
For the period ended 31 March 2013For the period ended 31 March 2013For the period ended 31 March 2013For the period ended 31 March 2013 (Unaudited)(Unaudited)(Unaudited)(Unaudited)
1.10.20121.10.20121.10.20121.10.2012
totototo
31.3.201331.3.201331.3.201331.3.2013
1.10.20111.10.20111.10.20111.10.2011
totototo
31.3.201231.3.201231.3.201231.3.2012
US$US$US$US$ US$US$US$US$
IncomeIncomeIncomeIncome
Net gains on investments and
derivatives [Note 4] 7,098,897 8,673,030
Interest on deposits 20 19,732
Net foreign currency exchange
gains 1 49,675
Other income - 103
7,098,918 8,742,540
---------- ----------
ExpensesExpensesExpensesExpenses
Management fee 213,150 241,755
Registrar's fee 24,384 28,435
Trustee's fee 12,789 19,410
Auditor's fee 12,041 10,645
Valuation fee 8,330 8,610
Printing and publication expenses 2,873 1,588
Safe custody and bank charges 1,714 3,914
Transaction costs 300 10,844
Legal and professional expenses 225 84
Other operating expenses 494 2,523
276,300 327,808
---------- ----------
Net operating profitNet operating profitNet operating profitNet operating profit 6,822,618 8,414,732
Finance costsFinance costsFinance costsFinance costs
Interest paid (7,889) -
Profit before taxationProfit before taxationProfit before taxationProfit before taxation 6,814,729 8,414,732
Taxation - (118)
Increase in net assets Increase in net assets Increase in net assets Increase in net assets
attributable to holders of attributable to holders of attributable to holders of attributable to holders of
redeemable units and total redeemable units and total redeemable units and total redeemable units and total
comprehensive incomecomprehensive incomecomprehensive incomecomprehensive income 6,814,729 8,414,614

JPMORGAN ASIAONE FUNDJPMORGAN ASIAONE FUNDJPMORGAN ASIAONE FUNDJPMORGAN ASIAONE FUND (Formerly known as JF AsiaOne Fund)(Formerly known as JF AsiaOne Fund)(Formerly known as JF AsiaOne Fund)(Formerly known as JF AsiaOne Fund)
SemiSemiSemiSemi----annual report for theannual report for theannual report for theannual report for the
period ended 31 March 2013period ended 31 March 2013period ended 31 March 2013period ended 31 March 2013
The notes on pages 45 to 46 form part of these financial statements.
- 44 -
Statement of Changes in Net Assets Attributable to Holders Statement of Changes in Net Assets Attributable to Holders Statement of Changes in Net Assets Attributable to Holders Statement of Changes in Net Assets Attributable to Holders
of Redeemable Unitsof Redeemable Unitsof Redeemable Unitsof Redeemable Units
For the period ended 31 March 2013For the period ended 31 March 2013For the period ended 31 March 2013For the period ended 31 March 2013 (Unaudited)(Unaudited)(Unaudited)(Unaudited)
1.10.20121.10.20121.10.20121.10.2012
totototo
31.3.201331.3.201331.3.201331.3.2013
1.10.20111.10.20111.10.20111.10.2011
totototo
31.3.201231.3.201231.3.201231.3.2012
US$US$US$US$ US$US$US$US$
Net assets attributable to holders Net assets attributable to holders Net assets attributable to holders Net assets attributable to holders
of redeemable units at the of redeemable units at the of redeemable units at the of redeemable units at the
beginning of the periodbeginning of the periodbeginning of the periodbeginning of the period 87,677,146 96,112,139
---------- ----------
Allotment of redeemable units 2,842,666 2,680,368
Redemption of redeemable units (15,558,028) (12,474,062)
Net redemptionNet redemptionNet redemptionNet redemption (12,715,362) (9,793,694)
---------- ----------
74,961,784 86,318,445
Increase in net Increase in net Increase in net Increase in net assets assets assets assets
attributable to holders of attributable to holders of attributable to holders of attributable to holders of
redeemable units and total redeemable units and total redeemable units and total redeemable units and total
comprehensive incomecomprehensive incomecomprehensive incomecomprehensive income 6,814,729 8,414,614
Net assets attributable to holders Net assets attributable to holders Net assets attributable to holders Net assets attributable to holders
of redeemable units at the end of redeemable units at the end of redeemable units at the end of redeemable units at the end
of the periodof the periodof the periodof the period 81,776,513 94,733,059
Statement of Cash FlowsStatement of Cash FlowsStatement of Cash FlowsStatement of Cash Flows
For the period ended 31 March 2013For the period ended 31 March 2013For the period ended 31 March 2013For the period ended 31 March 2013 (Unaudited)(Unaudited)(Unaudited)(Unaudited)
1.10.20121.10.20121.10.20121.10.2012
totototo
31.3.201331.3.201331.3.201331.3.2013
1.10.20111.10.20111.10.20111.10.2011
totototo
31.3.201231.3.201231.3.201231.3.2012
US$US$US$US$ US$US$US$US$
Operating activitiesOperating activitiesOperating activitiesOperating activities
Purchase of investments and
derivatives (14,434,230) (19,580,262)
Proceeds from disposal of
investments and derivatives 20,856,379 15,767,033
Interest received 46 20,327
Tax paid - (220)
(Increase)/decrease in margin
deposits (3) 2,547,080
Transaction costs paid (560) (10,844)
Trustee's fee paid (12,855) (22,159)
Registrar's fee paid (49,128) (59,115)
Management fee paid (214,255) (244,787)
Others (38,257) 7,834
Net cash inflow/(outflow) from Net cash inflow/(outflow) from Net cash inflow/(outflow) from Net cash inflow/(outflow) from
operating activitiesoperating activitiesoperating activitiesoperating activities 6,107,137 (1,575,113)
---------- ----------
Financing activitiesFinancing activitiesFinancing activitiesFinancing activities
Interest paid (7,386) -
Receipts on allotment of
redeemable units 2,748,333 2,678,286
Payments on redemption of
redeemable units (15,543,675) (12,888,290)
Net cash outflow from Net cash outflow from Net cash outflow from Net cash outflow from
financing activitiesfinancing activitiesfinancing activitiesfinancing activities (12,802,728) (10,210,004)
---------- ----------
Decrease in cash and cash Decrease in cash and cash Decrease in cash and cash Decrease in cash and cash
equivalentsequivalentsequivalentsequivalents (6,695,591) (11,785,117)
Cash and cash equivalents at the
beginning of the period 1,081,343 15,889,983
Exchange (losses)/gains on cash
and cash equivalents (4) 169
Cash and cash Cash and cash Cash and cash Cash and cash equivalents at equivalents at equivalents at equivalents at
the end of the periodthe end of the periodthe end of the periodthe end of the period (5,614,252) 4,105,035
Analysis of balances of cash and cash equivalents:Analysis of balances of cash and cash equivalents:Analysis of balances of cash and cash equivalents:Analysis of balances of cash and cash equivalents:
Cash at banks 41,540 4,105,035
Short term bank loans -
unsecured (5,655,792) -
(5,614,252) 4,105,035
JPMORGAN ASIAONE FUNDJPMORGAN ASIAONE FUNDJPMORGAN ASIAONE FUNDJPMORGAN ASIAONE FUND (Formerly kno(Formerly kno(Formerly kno(Formerly known as JF AsiaOne Fund)wn as JF AsiaOne Fund)wn as JF AsiaOne Fund)wn as JF AsiaOne Fund)
SemiSemiSemiSemi----annual report for theannual report for theannual report for theannual report for the
period ended 31 March 2013period ended 31 March 2013period ended 31 March 2013period ended 31 March 2013
- 45 -
Notes to the Financial StatementsNotes to the Financial StatementsNotes to the Financial StatementsNotes to the Financial Statements
1111 The FundThe FundThe FundThe Fund
JPMorgan AsiaOne Fund (the "Fund") was established under a Trust Deed dated 22 August 2006, as amended, and is governed by the laws of
Hong Kong. The Fund is authorized by the Securities and Futures Commission of Hong Kong.
With effect from 4 February 2013, the name of the Fund was changed from JF AsiaOne Fund to JPMorgan AsiaOne Fund.
The investment objective of the Fund is to seek to produce a competitive total return in different market conditions. The Fund seeks to
achieve this primarily through an actively managed portfolio of collective investment schemes managed by the Manager or its connected
persons (as defined in the SFC Code) which are linked to the economies of Asian countries (including Australia) ("Underlying Funds"). The
allocation to the Underlying Funds will be continually monitored and reviewed and changes will be made as considered appropriate to better
achieve the Fund's objective. In other words, the Fund may invest up to all of its assets in equity funds when the Investment Manager believes
market conditions and opportunities favour equities. When the Investment Manager believes market conditions and opportunities do not
favour equities the Fund may invest up to all of its assets in fixed income and money market funds and other funds with a low correlation to
equities. The Investment Manager may invest in a range of funds whose underlying assets embrace the full spectrum of the risk return trade
off from low to high risk. The Investment Manager may carry out hedging activities via financial futures.
All unitholders' rights with regard to the convening, voting or otherwise acting at any meeting of unitholders are the same.
2222 Summary of principal accounting policiesSummary of principal accounting policiesSummary of principal accounting policiesSummary of principal accounting policies
(a)(a)(a)(a) Accounting policies of interim financial statementsAccounting policies of interim financial statementsAccounting policies of interim financial statementsAccounting policies of interim financial statements
The accounting policies and methods of computation used in the preparation of these unaudited condensed interim financial statements
are consistent with those used in the annual financial statements for the year ended 30 September 2012.
(b)(b)(b)(b) Investments and derivativesInvestments and derivativesInvestments and derivativesInvestments and derivatives
Classification
The Fund classifies its investments and derivatives as financial assets or financial liabilities at fair value through profit or loss. These
financial assets or financial liabilities are held-for-trading as they are acquired or incurred principally for the purpose of selling or
repurchasing in the near term or short-term profit taking.
All derivatives are carried in assets when amounts are receivable by the Fund and in liabilities when amounts are payable by the Fund.
Recognition, derecognition and measurement
Purchases and sales of investments and derivatives are accounted for on the trade date basis. Investments and derivatives are initially
recognized at fair value and are subsequently re-measured at fair value. Realized and unrealized gains and losses on investments and
derivatives are recognized in the Statement of Comprehensive Income. Investments and derivatives are derecognized when the rights to
receive cash flows from the investments and derivatives have expired or the Fund has transferred substantially all risks and rewards of
ownership.
Fair value estimation
Investments that are listed or traded on an exchange and investments with prices quoted in over-the-counter markets or by market
makers, are fair valued based on quoted "bid" prices on long investments and quoted "ask" prices on investments sold short. When
trading in the securities of an investee company is suspended, the investment is valued at the Manager's estimate of its fair value.
Investments in collective investment schemes are stated at fair value based on the net asset value per unit of the respective funds as
determined by the administrators of the relevant funds or stated at "bid" prices if the collective investment schemes are listed or traded
on an exchange.
Open future and swap contracts are valued at "bid" prices for long positions and "ask" prices for short positions at the valuation date.
The differences between the bid/ask prices and the contract prices are recognized in the Statement of Comprehensive Income.
(c)(c)(c)(c) Foreign currency translationForeign currency translationForeign currency translationForeign currency translation
Functional and presentation currency
The Fund has adopted United States dollar as its functional and presentation currency.

JPMORGAN ASIAONE FUNDJPMORGAN ASIAONE FUNDJPMORGAN ASIAONE FUNDJPMORGAN ASIAONE FUND (Formerly kno(Formerly kno(Formerly kno(Formerly known as JF AsiaOne Fund)wn as JF AsiaOne Fund)wn as JF AsiaOne Fund)wn as JF AsiaOne Fund)
SemiSemiSemiSemi----annual report for theannual report for theannual report for theannual report for the
period ended 31 March 2013period ended 31 March 2013period ended 31 March 2013period ended 31 March 2013
- 46 -
Transactions and balances
Foreign currency transactions are translated into the functional currency using the exchange rates prevailing at the dates of the
transactions.
Foreign exchange gains and losses resulting from the settlement of such transactions and from the translation of assets and liabilities
denominated in foreign currencies at period/year end exchange rates are recognized in the Statement of Comprehensive Income.
Foreign exchange gains and losses relating to cash and cash equivalents are presented in the Statement of Comprehensive Income
within "Net foreign currency exchange gains/losses". Foreign exchange gains and losses relating to the financial assets and liabilities
carried at fair value through profit or loss are presented in the Statement of Comprehensive Income within "Net gains/losses on
investments and derivatives".
(d)(d)(d)(d) Proceeds and payments on allotment and redemption of unitsProceeds and payments on allotment and redemption of unitsProceeds and payments on allotment and redemption of unitsProceeds and payments on allotment and redemption of units
The net asset value per unit is computed for each dealing day. The price at which units are allotted or redeemed is calculated by
reference to the net asset value per unit as at the close of business on the relevant dealing day in accordance with the provisions of the
Fund's Trust Deed dated 22 August 2006, as amended, which may be different from the accounting policies stated in the financial
statements.
3333 Number of units in issue and net assets attributable to holders of redeemable units (per unit)Number of units in issue and net assets attributable to holders of redeemable units (per unit)Number of units in issue and net assets attributable to holders of redeemable units (per unit)Number of units in issue and net assets attributable to holders of redeemable units (per unit)
31.3.2013 30.9.2012
Units Units
Number of units in issue 5,781,635.565 6,706,118.168
US$ US$
Net assets attributable to holders of redeemable units 81,776,513 87,677,146
Net assets attributable to holders of redeemable units (per unit) 14.14 13.07
4444 Net gains on investments and derivativesNet gains on investments and derivativesNet gains on investments and derivativesNet gains on investments and derivatives
1.10.2012
to
31.3.2013
1.10.2011
to
31.3.2012
US$ US$
Change in unrealized gains/losses in value of investments and derivatives 6,682,296 12,325,559
Realized gains/(losses) on sale of investments and derivatives 416,601 (3,652,529)
7,098,897 8,673,030
5555 Soft commission arrangementsSoft commission arrangementsSoft commission arrangementsSoft commission arrangements
During the period, the Investment Manager and its associates did not enter into any soft commission arrangements in connection with
directing transactions of the Fund through a broker or dealer (31 March 2012: nil).
6666 DistributionDistributionDistributionDistribution
No distribution was made during the period (31 March 2012: nil).

JPMORGAN AUSTRALIA FUNDJPMORGAN AUSTRALIA FUNDJPMORGAN AUSTRALIA FUNDJPMORGAN AUSTRALIA FUND (Formerly known as JF Australia Fund)(Formerly known as JF Australia Fund)(Formerly known as JF Australia Fund)(Formerly known as JF Australia Fund)
SemiSemiSemiSemi----annual report for theannual report for theannual report for theannual report for the
period ended 31 March 2013period ended 31 March 2013period ended 31 March 2013period ended 31 March 2013
- 47 -
Distributor StatusDistributor StatusDistributor StatusDistributor Status
The Fund has been certified by HMRC in the UK as a
distributing fund in respect of the period from 1 January
1984 to 30 September 2010. The principal effect of this
certification is that for unitholders resident or ordinarily
resident in the UK for taxation purposes any gains accruing
on the sale, redemption or other disposal of units during
the period will be taxed in the UK as a capital gain and not
as income. This treatment will continue under the new UK
reporting fund regime provided the Fund does not invest
more than 5% of its assets in other offshore funds which
are not themselves reporting funds. There will be no need
to formally apply for reporting fund status as the Fund is
transparent for UK tax purposes and therefore considered
out of scope of the requirements of this new regime.
As noted, the Fund is transparent for UK income tax
purposes and UK investors are subject to UK capital gains
tax on disposal of their units. UK investors are subject to tax
on their share of income of the Fund on an arising basis.
Information has been provided to UK investors of the
amount of their share of the underlying income, expenses
and overseas tax suffered.
Investment PortfolioInvestment PortfolioInvestment PortfolioInvestment Portfolio
As at 31 March 2013As at 31 March 2013As at 31 March 2013As at 31 March 2013 (Unaudited)(Unaudited)(Unaudited)(Unaudited)
HoldingHoldingHoldingHolding
FairFairFairFair
valuevaluevaluevalue
US$US$US$US$
% of% of% of% of
netnetnetnet
assetsassetsassetsassets
Listed/Quoted InvestmentsListed/Quoted InvestmentsListed/Quoted InvestmentsListed/Quoted Investments (99.8%)
EquitiesEquitiesEquitiesEquities (99.8%)
AustraliaAustraliaAustraliaAustralia (95.7%)
BanksBanksBanksBanks (27.3%)
Australia & NZ Bkg Group-AU
List 132,810 3,947,525 5.8
Commonwealth Bank of
Australia 77,500 5,494,239 8.0
National Australia Bank 90,200 2,896,371 4.2
Westpac Banking 199,000 6,358,877 9.3
BeveragesBeveragesBeveragesBeverages (4.3%)
Treasury Wine Estates 497,389 2,945,380 4.3
Commercial Services & SuppliesCommercial Services & SuppliesCommercial Services & SuppliesCommercial Services & Supplies (6.7%)
Brambles Ltd 305,230 2,653,934 3.9
Computershare Ltd 183,270 1,912,592 2.8
Containers & Containers & Containers & Containers & PackagingPackagingPackagingPackaging (2.8%)
Amcor Ltd 199,000 1,904,551 2.8
DistributorsDistributorsDistributorsDistributors (2.2%)
G8 Education 699,830 1,524,880 2.2
Diversified Telecommunication ServicesDiversified Telecommunication ServicesDiversified Telecommunication ServicesDiversified Telecommunication Services (6.7%)
Telstra Corp 967,000 4,546,738 6.7
Financial ServicesFinancial ServicesFinancial ServicesFinancial Services (1.0%)
Henderson Group CDI 290,000 698,404 1.0
(Continued)
HoldingHoldingHoldingHolding
FairFairFairFair
valuevaluevaluevalue
US$US$US$US$
% of% of% of% of
netnetnetnet
assetsassetsassetsassets
Food ProductsFood ProductsFood ProductsFood Products (1.2%)
Goodman Fielder 1,124,000 831,997 1.2
Gas UtilitiesGas UtilitiesGas UtilitiesGas Utilities (2.5%)
APA Group Stapled Sec 277,908 1,715,219 2.5
Hotels Restaurants & LeisureHotels Restaurants & LeisureHotels Restaurants & LeisureHotels Restaurants & Leisure (2.2%)
Ainsworth Game Technology 406,243 1,507,762 2.2
InsuranceInsuranceInsuranceInsurance (5.2%)
Insurance Australia Group 592,571 3,521,374 5.2
Metals & MiningMetals & MiningMetals & MiningMetals & Mining (11.5%)
BHP Billiton 193,800 6,617,013 9.7
Rio Tinto-AU List 20,528 1,224,164 1.8
Oil & GasOil & GasOil & GasOil & Gas (4.9%)
Oil Search 435,377 3,354,338 4.9
PharmaceuticalsPharmaceuticalsPharmaceuticalsPharmaceuticals (5.8%)
CSL Ltd 64,137 3,958,469 5.8
Real EstateReal EstateReal EstateReal Estate (1.7%)
Stockland Stapled Sec 314,000 1,194,867 1.7
Road & RailRoad & RailRoad & RailRoad & Rail (3.7%)
Aurizon Holdings 601,715 2,528,091 3.7
Specialty Specialty Specialty Specialty RetailRetailRetailRetail (1.8%)
Super Retail Group 96,784 1,228,988 1.8
Transportation InfrastructureTransportation InfrastructureTransportation InfrastructureTransportation Infrastructure (4.2%)
Asciano Ltd 502,773 2,872,430 4.2
United StatesUnited StatesUnited StatesUnited States (4.1%)
Broadcasting (Tv, Radio & Cable)Broadcasting (Tv, Radio & Cable)Broadcasting (Tv, Radio & Cable)Broadcasting (Tv, Radio & Cable) (4.1%)
News Corp CDI 93,600 2,825,019 4.1
Total Listed/Quoted InvestmentsTotal Listed/Quoted InvestmentsTotal Listed/Quoted InvestmentsTotal Listed/Quoted Investments 68,263,222 99.8
Other net assetsOther net assetsOther net assetsOther net assets 142,302 0.2
Net assets attributable to holders of Net assets attributable to holders of Net assets attributable to holders of Net assets attributable to holders of
redeemable units at 31 March 2013redeemable units at 31 March 2013redeemable units at 31 March 2013redeemable units at 31 March 2013 68,405,524 100.0
Total Total Total Total investments, at costinvestments, at costinvestments, at costinvestments, at cost 51,634,354

JPMORGAN AUSTRALIA FUNDJPMORGAN AUSTRALIA FUNDJPMORGAN AUSTRALIA FUNDJPMORGAN AUSTRALIA FUND (Formerly known as JF Australia Fund)(Formerly known as JF Australia Fund)(Formerly known as JF Australia Fund)(Formerly known as JF Australia Fund)
SemiSemiSemiSemi----annual report for theannual report for theannual report for theannual report for the
period ended 31 March 2013period ended 31 March 2013period ended 31 March 2013period ended 31 March 2013
- 48 -
Statement of Movements in Portfolio HoldingsStatement of Movements in Portfolio HoldingsStatement of Movements in Portfolio HoldingsStatement of Movements in Portfolio Holdings
For the period ended 31 March 2013For the period ended 31 March 2013For the period ended 31 March 2013For the period ended 31 March 2013 (Unaudited)(Unaudited)(Unaudited)(Unaudited)
% holdings% holdings% holdings% holdings
of net assetsof net assetsof net assetsof net assets
31.3.201331.3.201331.3.201331.3.2013 30.9.201230.9.201230.9.201230.9.2012
Listed/Quoted InvestmentsListed/Quoted InvestmentsListed/Quoted InvestmentsListed/Quoted Investments
EquitiesEquitiesEquitiesEquities
AustraliaAustraliaAustraliaAustralia
Banks 27.3 24.0
Metals & Mining 11.5 10.5
Commercial Services & Supplies 6.7 5.0
Diversified Telecommunication Services 6.7 6.8
Pharmaceuticals 5.8 5.0
Insurance 5.2 3.9
Oil & Gas 4.9 4.1
Beverages 4.3 4.3
Transportation Infrastructure 4.2 7.8
Road & Rail 3.7 2.7
Containers & Packaging 2.8 1.9
Gas Utilities 2.5 2.8
Distributors 2.2 -
Hotels Restaurants & Leisure 2.2 0.9
Specialty Retail 1.8 1.4
Real Estate 1.7 -
Food Products 1.2 -
Financial Services 1.0 -
Energy Equipment & Services - 2.8
Industrial Conglomerates - 2.6
Gold - 2.3
Health Care Equipment & Supplies - 2.2
Diversified Financials - 0.6
United StatesUnited StatesUnited StatesUnited States
Broadcasting (Tv, Radio & Cable) 4.1 2.6
Total Listed/Quoted InvestmentsTotal Listed/Quoted InvestmentsTotal Listed/Quoted InvestmentsTotal Listed/Quoted Investments 99.8 94.2
Other net assetsOther net assetsOther net assetsOther net assets 0.2 5.8
Net assets attributable to holders of Net assets attributable to holders of Net assets attributable to holders of Net assets attributable to holders of
redeemable unitsredeemable unitsredeemable unitsredeemable units 100.0 100.0

JPMORGAN AUSTRALIA FUNDJPMORGAN AUSTRALIA FUNDJPMORGAN AUSTRALIA FUNDJPMORGAN AUSTRALIA FUND (Formerly known as JF Australia Fund)(Formerly known as JF Australia Fund)(Formerly known as JF Australia Fund)(Formerly known as JF Australia Fund)
SemiSemiSemiSemi----annual report for theannual report for theannual report for theannual report for the
period ended 31 March 2013period ended 31 March 2013period ended 31 March 2013period ended 31 March 2013
The notes on pages 51 to 54 form part of these financial statements.
- 49 -
Statement of Financial PositionStatement of Financial PositionStatement of Financial PositionStatement of Financial Position
As at 31 March 2013As at 31 March 2013As at 31 March 2013As at 31 March 2013 (Unaudited)(Unaudited)(Unaudited)(Unaudited)
31.3.201331.3.201331.3.201331.3.2013 30.9.201230.9.201230.9.201230.9.2012
US$US$US$US$ US$US$US$US$
AssetsAssetsAssetsAssets
Cash at banks 204,627 374,468
Short term deposits - 1,352,137
Amounts due from brokers 428,688 719,021
Amounts receivable on allotment 250,776 2,035,733
Investments [Note 3] 68,263,222 77,381,424
Dividend and other accounts
receivable 519,331 922,962
Total assetsTotal assetsTotal assetsTotal assets 69,666,644 82,785,745
---------- ----------
LiabilitiesLiabilitiesLiabilitiesLiabilities
Short term bank loans - unsecured 900,223 -
Amounts due to brokers - 321,081
Amounts payable on redemption 548,627 222,905
Other accounts payable 93,305 136,688
LiabilitiesLiabilitiesLiabilitiesLiabilities (excluding net assets (excluding net assets (excluding net assets (excluding net assets
attributable to holders of attributable to holders of attributable to holders of attributable to holders of
redeemable units)redeemable units)redeemable units)redeemable units) 1,542,155 680,674
---------- ----------
Net assets attributable to holders Net assets attributable to holders Net assets attributable to holders Net assets attributable to holders
of redeemable units of redeemable units of redeemable units of redeemable units
(before fair value adjustment)(before fair value adjustment)(before fair value adjustment)(before fair value adjustment)
classified as financial classified as financial classified as financial classified as financial
liability/equityliability/equityliability/equityliability/equity [Note 3] 68,124,489 82,105,071
Fair value adjustment of units of
the Fund [Note 3] 281,035 -
Net assets attributable to holders Net assets attributable to holders Net assets attributable to holders Net assets attributable to holders
of redeemable unitsof redeemable unitsof redeemable unitsof redeemable units
(after fair value adjustment)(after fair value adjustment)(after fair value adjustment)(after fair value adjustment)
classified as financial classified as financial classified as financial classified as financial
liability/equityliability/equityliability/equityliability/equity [Note 3] 68,405,524 82,105,071
Statement of Comprehensive IncomeStatement of Comprehensive IncomeStatement of Comprehensive IncomeStatement of Comprehensive Income
For the period ended 31 March 2013For the period ended 31 March 2013For the period ended 31 March 2013For the period ended 31 March 2013 (Unaudited)(Unaudited)(Unaudited)(Unaudited)
1.10.20121.10.20121.10.20121.10.2012
totototo
31.3.201331.3.201331.3.201331.3.2013
1.10.20111.10.20111.10.20111.10.2011
totototo
31.3.201231.3.201231.3.201231.3.2012
US$US$US$US$ US$US$US$US$
IncomeIncomeIncomeIncome
Net gains on investments and
derivatives [Note 4] 11,980,706 16,557,821
Dividend income 1,434,764 2,144,217
Net foreign currency exchange
gains 34,191 277,221
Interest on deposits 13,775 33,856
Other income - 929
13,463,436 19,014,044
---------- ----------
ExpensesExpensesExpensesExpenses
Management fee 568,746 856,118
Transaction costs 74,392 172,310
Registrar's fee 27,230 24,849
Trustee's fee 18,655 30,174
Safe custody and bank charges 11,074 13,195
Valuation fee 8,330 8,540
Auditor's fee 6,439 8,011
Printing and publication expenses 1,569 1,773
Legal and professional expenses 219 96
Other operating expenses 384 243
717,038 1,115,309
---------- ----------
Net operating profitNet operating profitNet operating profitNet operating profit 12,746,398 17,898,735
Finance costsFinance costsFinance costsFinance costs
Interest paid (1,330) (1,459)
Profit before taxationProfit before taxationProfit before taxationProfit before taxation 12,745,068 17,897,276
Taxation (52,573) (52,349)
12,692,495 17,844,927
Change in cumulative difference
arising from the fair value
adjustment of units of the
Fund 281,035 -
Increase in net assets Increase in net assets Increase in net assets Increase in net assets
attributable to holders of attributable to holders of attributable to holders of attributable to holders of
redeemable units andredeemable units andredeemable units andredeemable units and total total total total
comprehensive incomecomprehensive incomecomprehensive incomecomprehensive income 12,973,530 17,844,927
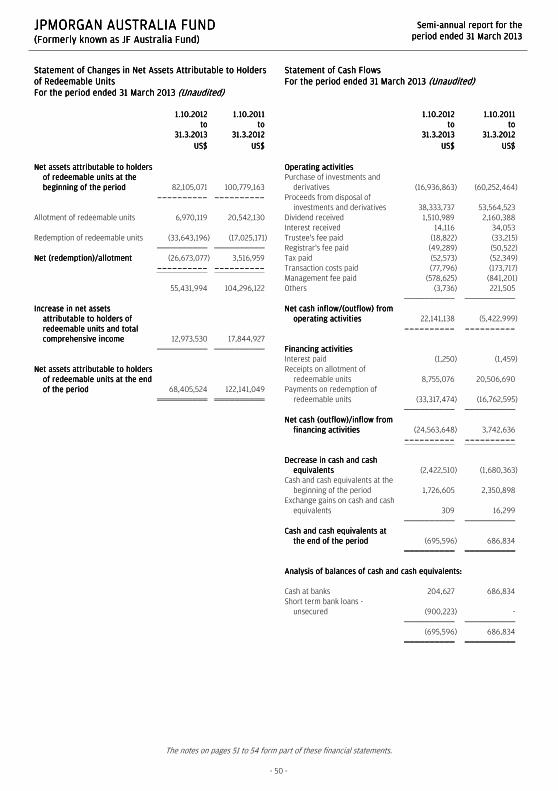
JPMORGAN AUSTRALIA FUNDJPMORGAN AUSTRALIA FUNDJPMORGAN AUSTRALIA FUNDJPMORGAN AUSTRALIA FUND (Formerly known as JF Australia Fund)(Formerly known as JF Australia Fund)(Formerly known as JF Australia Fund)(Formerly known as JF Australia Fund)
SemiSemiSemiSemi----annual report for theannual report for theannual report for theannual report for the
period ended 31 March 2013period ended 31 March 2013period ended 31 March 2013period ended 31 March 2013
The notes on pages 51 to 54 form part of these financial statements.
- 50 -
Statement of Changes in Net Assets Attributable to Holders Statement of Changes in Net Assets Attributable to Holders Statement of Changes in Net Assets Attributable to Holders Statement of Changes in Net Assets Attributable to Holders
of Redeemable Unitsof Redeemable Unitsof Redeemable Unitsof Redeemable Units
For the period ended 31 March 2013For the period ended 31 March 2013For the period ended 31 March 2013For the period ended 31 March 2013 (Unaudited)(Unaudited)(Unaudited)(Unaudited)
1.10.20121.10.20121.10.20121.10.2012
totototo
31.3.201331.3.201331.3.201331.3.2013
1.10.20111.10.20111.10.20111.10.2011
totototo
31.3.201231.3.201231.3.201231.3.2012
US$US$US$US$ US$US$US$US$
Net assets attributable to holders Net assets attributable to holders Net assets attributable to holders Net assets attributable to holders
of redeemable units at the of redeemable units at the of redeemable units at the of redeemable units at the
beginning of the periodbeginning of the periodbeginning of the periodbeginning of the period 82,105,071 100,779,163
---------- ----------
Allotment of redeemable units 6,970,119 20,542,130
Redemption of redeemable units (33,643,196) (17,025,171)
Net (redemption)/allotmentNet (redemption)/allotmentNet (redemption)/allotmentNet (redemption)/allotment (26,673,077) 3,516,959
---------- ----------
55,431,994 104,296,122
Increase in net assets Increase in net assets Increase in net assets Increase in net assets
attributable to holders of attributable to holders of attributable to holders of attributable to holders of
redeemable units and total redeemable units and total redeemable units and total redeemable units and total
comprehensive incomecomprehensive incomecomprehensive incomecomprehensive income 12,973,530 17,844,927
Net assets attributable to holders Net assets attributable to holders Net assets attributable to holders Net assets attributable to holders
of redeemable units at the end of redeemable units at the end of redeemable units at the end of redeemable units at the end
of the periodof the periodof the periodof the period 68,405,524 122,141,049
Statement of Cash FlowsStatement of Cash FlowsStatement of Cash FlowsStatement of Cash Flows
For the period ended 31 March 2013For the period ended 31 March 2013For the period ended 31 March 2013For the period ended 31 March 2013 (Unaudited)(Unaudited)(Unaudited)(Unaudited)
1.10.20121.10.20121.10.20121.10.2012
totototo
31.3.201331.3.201331.3.201331.3.2013
1.10.20111.10.20111.10.20111.10.2011
totototo
31.3.201231.3.201231.3.201231.3.2012
US$US$US$US$ US$US$US$US$
Operating activitiesOperating activitiesOperating activitiesOperating activities
Purchase of investments and
derivatives (16,936,863) (60,252,464)
Proceeds from disposal of
investments and derivatives 38,333,737 53,564,523
Dividend received 1,510,989 2,160,388
Interest received 14,116 34,053
Trustee's fee paid (18,822) (33,215)
Registrar's fee paid (49,289) (50,522)
Tax paid (52,573) (52,349)
Transaction costs paid (77,796) (173,717)
Management fee paid (578,625) (841,201)
Others (3,736) 221,505
Net cash inflow/(outflow) from Net cash inflow/(outflow) from Net cash inflow/(outflow) from Net cash inflow/(outflow) from
operating activitiesoperating activitiesoperating activitiesoperating activities 22,141,138 (5,422,999)
---------- ----------
Financing activitiesFinancing activitiesFinancing activitiesFinancing activities
Interest paid (1,250) (1,459)
Receipts on allotment of
redeemable units 8,755,076 20,506,690
Payments on redemption of
redeemable units (33,317,474) (16,762,595)
Net cash (outflow)/inflow from Net cash (outflow)/inflow from Net cash (outflow)/inflow from Net cash (outflow)/inflow from
financing activitiesfinancing activitiesfinancing activitiesfinancing activities (24,563,648) 3,742,636
---------- ----------
Decrease in cash and cash Decrease in cash and cash Decrease in cash and cash Decrease in cash and cash
equivalentsequivalentsequivalentsequivalents (2,422,510) (1,680,363)
Cash and cash equivalents at the
beginning of the period 1,726,605 2,350,898
Exchange gains on cash and cash
equivalents 309 16,299
Cash and cash equivalents at Cash and cash equivalents at Cash and cash equivalents at Cash and cash equivalents at
the end of the periodthe end of the periodthe end of the periodthe end of the period (695,596) 686,834
Analysis of balances of cash and cash equivalents:Analysis of balances of cash and cash equivalents:Analysis of balances of cash and cash equivalents:Analysis of balances of cash and cash equivalents:
Cash at banks 204,627 686,834
Short term bank loans -
unsecured (900,223) -
(695,596) 686,834

JPMORGAN AUSTRALIA FUNDJPMORGAN AUSTRALIA FUNDJPMORGAN AUSTRALIA FUNDJPMORGAN AUSTRALIA FUND (Formerly known as JF Australia Fund)(Formerly known as JF Australia Fund)(Formerly known as JF Australia Fund)(Formerly known as JF Australia Fund)
SemiSemiSemiSemi----annual report for theannual report for theannual report for theannual report for the
period ended 31 March 2013period ended 31 March 2013period ended 31 March 2013period ended 31 March 2013
- 51 -
Notes to the Financial StatementsNotes to the Financial StatementsNotes to the Financial StatementsNotes to the Financial Statements
1111 The FundThe FundThe FundThe Fund
JPMorgan Australia Fund (the "Fund") was established under a Trust Deed dated 5 June 1981, as amended, and is governed by the laws of
Hong Kong. The Fund is authorized by the Securities and Futures Commission of Hong Kong.
With effect from 4 February 2013, the name of the Fund was changed from JF Australia Fund to JPMorgan Australia Fund.
The investment objective of the Fund is to provide investors with long-term capital growth by investing primarily in Australian securities.
Pursuant to the Supplemental Trust Deed dated 31 August 2012, the Manager may decide to issue separate classes (each a “Class”) whose
assets will be commonly invested but where a specific fee structure, currency or distribution policy may be applied. Each Class may have a
different charging structure with the result that the net asset value attributable to each Class may differ.
All unitholders' rights with regard to the convening, voting or otherwise acting at any meeting of unitholders are the same.
2222 Summary of principal accounting policiesSummary of principal accounting policiesSummary of principal accounting policiesSummary of principal accounting policies
(a)(a)(a)(a) Accounting policies of interim financial statementsAccounting policies of interim financial statementsAccounting policies of interim financial statementsAccounting policies of interim financial statements
The accounting policies and methods of computation used in the preparation of these unaudited condensed interim financial statements
are consistent with those used in the annual financial statements for the year ended 30 September 2012.
(b)(b)(b)(b) Investments and derivatives Investments and derivatives Investments and derivatives Investments and derivatives
Classification
The Fund classifies its investments and derivatives as financial assets or financial liabilities at fair value through profit or loss. These
financial assets or financial liabilities are held-for-trading as they are acquired or incurred principally for the purpose of selling or
repurchasing in the near term or short-term profit taking.
All derivatives are carried in assets when amounts are receivable by the Fund and in liabilities when amounts are payable by the Fund.
The Fund makes short sales in which a borrowed security is sold in anticipation of a decline in the market value of that security, or it may
use short sales for various arbitrage transactions. Short sales are classified as financial liabilities at fair value through profit or loss.
Recognition, derecognition and measurement
Purchases and sales of investments and derivatives are accounted for on the trade date basis. Investments and derivatives are initially
recognized at fair value and are subsequently re-measured at fair value. Realized and unrealized gains and losses on investments and
derivatives are recognized in the Statement of Comprehensive Income. Investments and derivatives are derecognized when the rights to
receive cash flows from the investments and derivatives have expired or the Fund has transferred substantially all risks and rewards of
ownership.
Fair value estimation
Investments that are listed or traded on an exchange and investments with prices quoted in over-the-counter markets or by market
makers, are fair valued based on quoted "bid" prices on long investments and quoted "ask" prices on investments sold short. When
trading in the securities of an investee company is suspended, the investment is valued at the Manager's estimate of its fair value.
Debt securities are fair valued based on quoted prices inclusive of accrued interest.
Investments in collective investment schemes are stated at fair value based on the net asset value per unit of the respective funds as
determined by the administrators of the relevant funds or stated at "bid" prices if the collective investment schemes are listed or traded
on an exchange.
Open future and swap contracts are valued at "bid" prices for long positions and "ask" prices for short positions at the valuation date.
The differences between the bid/ask prices and the contract prices are recognized in the Statement of Comprehensive Income.
Open option contracts are valued at "bid" prices for long positions and "ask" prices for short positions at the valuation date. The
differences between the bid/ask prices and the premium amounts/contract prices are recognized in the Statement of Comprehensive
Income.

JPMORGAN AUSTRALIA FUNDJPMORGAN AUSTRALIA FUNDJPMORGAN AUSTRALIA FUNDJPMORGAN AUSTRALIA FUND (Formerly known as JF Australia Fund)(Formerly known as JF Australia Fund)(Formerly known as JF Australia Fund)(Formerly known as JF Australia Fund)
SemiSemiSemiSemi----annual report for theannual report for theannual report for theannual report for the
period ended 31 March 2013period ended 31 March 2013period ended 31 March 2013period ended 31 March 2013
- 52 -
Forward foreign exchange contracts are valued at the forward rates ruling at the valuation date. The differences between the forward
rates and the contract rates are recognized in the Statement of Comprehensive Income.
(c)(c)(c)(c) SeSeSeSecurities lending and borrowing curities lending and borrowing curities lending and borrowing curities lending and borrowing
Securities lenders' agreements are entered into with institutions of appropriate financial standing who engage in such arrangements
acceptable to the Trustee and on arm's length commercial terms. Securities lent are included in the investment portfolio of the Fund.
Relevant securities lending income entitled by the Fund is accounted for in the Statement of Comprehensive Income. Collateral received
for the purpose of securities lent generally consist of non-cash collateral which are off-balance sheet transactions and are therefore not
included in the financial statements.
The Fund may enter into securities borrowing arrangements for short sale purposes. Short positions represent obligations to deliver
securities sold but not yet purchased, and are accounted for as investments and valued at their fair value. Securities borrowed during the
period/year are off-balance sheet transactions and are therefore not included in the investment portfolio of the Fund. Collateral placed
for the purpose of securities borrowed generally consist of cash collateral and are included in the Statement of Financial Position
separately.
(d)(d)(d)(d) Foreign currency translationForeign currency translationForeign currency translationForeign currency translation
Functional and presentation currency
The Fund has adopted United States dollar as its functional and presentation currency.
Transactions and balances
Foreign currency transactions are translated into the functional currency using the exchange rates prevailing at the dates of the
transactions.
Foreign exchange gains and losses resulting from the settlement of such transactions and from the translation of assets and liabilities
denominated in foreign currencies at period/year end exchange rates are recognized in the Statement of Comprehensive Income.
Foreign exchange gains and losses relating to cash and cash equivalents are presented in the Statement of Comprehensive Income
within "Net foreign currency exchange gains/losses". Foreign exchange gains and losses relating to the financial assets and liabilities
carried at fair value through profit or loss are presented in the Statement of Comprehensive Income within "Net gains/losses on
investments and derivatives".
(e)(e)(e)(e) Proceeds and payments on allotment and redemption of unitsProceeds and payments on allotment and redemption of unitsProceeds and payments on allotment and redemption of unitsProceeds and payments on allotment and redemption of units
The net asset value per unit is computed for each dealing day. The price at which units are allotted or redeemed is calculated by
reference to the net asset value per unit as at the close of business on the relevant dealing day in accordance with the provisions of the
Fund's Trust Deed dated 5 June 1981, as amended, which may be different from the accounting policies stated in the financial statements.
Units of the Fund are redeemable at the option of the holders of redeemable units and are classified as a financial liability in the
Statement of Financial Position which represents the net assets attributable to holders of redeemable units (or "net asset value" or "net
assets" or "NAV") and is carried at the redemption amount that would be payable at the Statement of Financial Position date if the
holders of redeemable units exercised the right to redeem units of the Fund.
3333 Net assets attributable to holders of redeemable units and number of units in issueNet assets attributable to holders of redeemable units and number of units in issueNet assets attributable to holders of redeemable units and number of units in issueNet assets attributable to holders of redeemable units and number of units in issue
Fair value adjustment of units of the Fund
As at 31 March 2013, there were two classes in the Fund. The net assets attributable to the holders of redeemable units was classified as a
financial liability which carried at the redemption amount that would be payable at the Statement of Financial Position date, if the holders of
redeemable units exercised the right to redeem units of the Fund. The redemption amount is determined based on the net assets attributable
to holders of redeemable units calculated in accordance with the provisions of the Fund's Trust Deed dated 5 June 1981, as amended ("Trust
Deed NAV").

JPMORGAN AUSTRALIA FUNDJPMORGAN AUSTRALIA FUNDJPMORGAN AUSTRALIA FUNDJPMORGAN AUSTRALIA FUND (Formerly known as JF Australia Fund)(Formerly known as JF Australia Fund)(Formerly known as JF Australia Fund)(Formerly known as JF Australia Fund)
SemiSemiSemiSemi----annual report for theannual report for theannual report for theannual report for the
period ended 31 March 2013period ended 31 March 2013period ended 31 March 2013period ended 31 March 2013
- 53 -
31.3.2013
US$
Net assets attributable to holders of redeemable units (before fair value adjustment) 68,124,489
Fair value adjustment of units of the Fund:
Difference between bid/ask prices and last traded prices basis in valuing investments and
derivatives as at the end of the period [Note 3(a)] 281,035
Net assets attributable to holders of redeemable units (after fair value adjustment) 68,405,524
Note:
(a) Listed investments, investments and derivatives with prices quoted in over-the-counter markets or by market makers are stated at the
last traded prices for the purpose of the Trust Deed NAV. As stated in Note 2(b), the accounting policy of the Fund for the purpose of
compliance with Hong Kong Accounting Standards 39, "Financial Instruments: Recognition and Measurement" and for reporting purposes
is to value its investments and derivatives at fair value based on the relevant bid/ask market prices on the Statement of Financial
Position date.
As at 30 September 2012, there was only one class in the Fund. The net assets attributable to the holders of redeemable units (or "net asset
value", "net assets" or "NAV") was classified as equity and not adjusted for fair value adjustment of units of the Fund.
Number of units in issue
31.3.2013
AUD Class (acc) USD Class (acc)
Units Units
Number of units in issue: 51,862.936 1,838,007.444
A$ US$
Net assets attributable to
holders of redeemable
units (after fair value
adjustment) 567,479 67,812,242
Net assets attributable to
holders of redeemable
units (per unit) 10.94 36.89
30.9.2012
Units
Number of units in issue: 2,633,784.161
US$
Net assets attributable to
holders of redeemable
units 82,105,071
Net assets attributable to
holders of redeemable
units (per unit) 31.17

JPMORGAN AUSTRALIA FUNDJPMORGAN AUSTRALIA FUNDJPMORGAN AUSTRALIA FUNDJPMORGAN AUSTRALIA FUND (Formerly known as JF Australia Fund)(Formerly known as JF Australia Fund)(Formerly known as JF Australia Fund)(Formerly known as JF Australia Fund)
SemiSemiSemiSemi----annual report for theannual report for theannual report for theannual report for the
period ended 31 March 2013period ended 31 March 2013period ended 31 March 2013period ended 31 March 2013
- 54 -
4444 Net gains on investments and derivatives Net gains on investments and derivatives Net gains on investments and derivatives Net gains on investments and derivatives
1.10.2012
to
31.3.2013
1.10.2011
to
31.3.2012
US$ US$
Change in unrealized gains/losses in value of investments and derivatives 5,955,725 17,658,578
Realized gains/(losses) on sale of investments and derivatives 6,024,981 (1,100,757)
11,980,706 16,557,821
5555 Soft commission arrangementsSoft commission arrangementsSoft commission arrangementsSoft commission arrangements
The Investment Manager has entered into soft commission arrangements with brokers under which certain goods and services used to
support investment decision making are received by the Investment Manager. The Investment Manager does not make direct payment for
these services but transacts an agreed amount of business with the brokers on behalf of the Fund. Commission is paid from the Fund on these
transactions.
The goods and services must be of demonstrable benefit to the Fund and may include research and advisory services; economic and political
analysis; portfolio analysis, including valuation and performance measurement; market analysis, data and quotation services, computer
hardware and software incidental to the above goods and services; clearing and custodian services and investment-related publications.
6666 Distribution Distribution Distribution Distribution
No distribution was made during the period (31 March 2012: nil).

JPMORGAN CHINA NEW GENERATION FUNDJPMORGAN CHINA NEW GENERATION FUNDJPMORGAN CHINA NEW GENERATION FUNDJPMORGAN CHINA NEW GENERATION FUND (Formerly known as JF (Formerly known as JF (Formerly known as JF (Formerly known as JF China New GenerationChina New GenerationChina New GenerationChina New Generation Fund)Fund)Fund)Fund)
SemiSemiSemiSemi----annual report for theannual report for theannual report for theannual report for the
period ended 31 March 2013period ended 31 March 2013period ended 31 March 2013period ended 31 March 2013
- 55 -
Investment PortfolioInvestment PortfolioInvestment PortfolioInvestment Portfolio
As at 31 March 2013As at 31 March 2013As at 31 March 2013As at 31 March 2013 (Unaudited)(Unaudited)(Unaudited)(Unaudited)
HoldingHoldingHoldingHolding
FairFairFairFair
valuevaluevaluevalue
US$US$US$US$
% of% of% of% of
netnetnetnet
assetsassetsassetsassets
Listed/Quoted InvestmentsListed/Quoted InvestmentsListed/Quoted InvestmentsListed/Quoted Investments (99.0%)
(I) Equities and Convertibles(I) Equities and Convertibles(I) Equities and Convertibles(I) Equities and Convertibles (94.7%)
ChinaChinaChinaChina (92.0%)
Agricultural Bank of China
'H' 3,700,000 1,773,106 1.4
Bank of China CB Step Cpn
02/06/16 CNY750,000 123,791 0.1
Bank of Communications
'A' 3,519,963 2,667,883 2.0
Bank of Nanjing 'A' 1,999,948 2,899,688 2.2
Baoxin Auto Group 900,000 691,001 0.5
Beijing SL Pharmaceutical
'A' 189,843 1,909,336 1.5
Belle Intl Hldgs 500,000 829,614 0.6
Bright Dairy & Food 'A' 869,876 1,989,112 1.5
China Construction Bank
'A' 4,315,000 3,180,197 2.4
China Merchants Property
Dev 'B' 579,890 1,789,127 1.4
China Minsheng Banking
'A' 2,009,940 3,117,941 2.4
China Minsheng Banking
'H' 2,946,000 3,753,350 2.9
China Modern Dairy Hldgs 1,000,000 332,361 0.3
China Pacific Insurance
(Group) 'A' 836,918 2,463,227 1.9
China Resources Double
Crane 'A' 559,862 2,208,168 1.7
China Vanke 'A' 2,701,533 4,677,678 3.6
Chongqing Changan
Automobile 'B' 829,871 811,414 0.6
CITIC Securities Co 'A' 1,749,825 3,426,833 2.6
Gemdale Corp 'A' 3,099,896 3,262,366 2.5
Goertek Inc 'A' 202,833 1,644,715 1.3
Great Wall Motor 'A' 114,863 599,980 0.5
Great Wall Motor 'H' 310,000 1,046,292 0.8
Gree Electric Appliances
'A' 919,710 4,226,851 3.2
Guangzhou Friendship
Group 'A' 444,795 768,011 0.6
Haier Electronics Group 1,425,000 2,272,613 1.7
Haitong Securities 'A' 2,949,793 4,794,250 3.7
Haitong Securities 'H' 2,237,600 3,072,767 2.4
Hangzhou Hik-Vision
Digital 'A' 164,890 1,022,619 0.8
Industrial Bank 'A' 2,723,163 7,581,017 5.8
Inner Mongolia Yili Ind 'A' 822,806 4,190,626 3.2
Intime Department Store
(Group) 383,000 434,182 0.3
Jiangsu Hengrui Medicine
'A' 189,899 1,026,151 0.8
Kweichow Moutai 'A' 90,137 2,444,489 1.9
Ping An Insurance (Group)
'A' 509,757 3,392,747 2.6
SAIC Motor Corp 'A' 1,230,730 2,929,131 2.2
Shanghai Intl Airport 'A' 1,519,903 3,292,067 2.5
Shanghai Jinjiang Intl Ind
'B' 839,948 670,279 0.5
(Continued)
HoldingHoldingHoldingHolding
FairFairFairFair
valuevaluevaluevalue
US$US$US$US$
% of% of% of% of
netnetnetnet
assetsassetsassetsassets
Shanghai Pudong Dev
Bank 'A' * 5,785,000 9,430,192 7.2
Shenzhen Overseas
Chinese Town 'A' 1,919,939 1,795,029 1.4
SPG Land (Hldgs) 243,125 86,756 0.1
Sunac China Hldgs 149,000 104,610 0.1
Tasly Pharmaceutical
Group 'A' 369,947 4,160,066 3.2
Tencent Hldgs 141,000 4,479,218 3.4
Tong Ren Tang Tech 'H' 475,000 1,615,428 1.2
Tsingtao Brewery 'A' 471,951 2,797,849 2.1
Wuhan Department Store
Group 'A' 619,903 1,037,444 0.8
Yashili Intl Hldgs 2,100,000 711,484 0.5
Yonghui Superstores 'A' 124,938 546,452 0.4
Yunnan Baiyao Group 'A' 324,709 4,462,313 3.4
Zhejiang Dahua
Technology 'A' 152,791 1,708,551 1.3
Hong KongHong KongHong KongHong Kong (2.7%)
AAC Technologies Hldgs 221,000 1,060,495 0.8
L'Occitane Intl 300,000 912,060 0.7
Prada SpA 81,300 819,006 0.6
Termbray Petro-King
Oilfield Serv 241,000 136,292 0.1
Wharf (Hldgs) 70,000 623,112 0.5
123,801,337 94.7
--------- ----
(II) Debt Securities(II) Debt Securities(II) Debt Securities(II) Debt Securities (4.3%)
ChinaChinaChinaChina (4.3%)
Beijing Capital 6.5%
24/09/14 CNY1,500,000 251,506 0.2
China Govt Bond No1213
2.6% 20/9/17 CNY6,000,000 942,492 0.7
China Govt Bond No1303
3.4% 17/4/23 CNY4,187,000 668,690 0.5
China Govt Bond No1308
3.02%17/9/13 CNY10,000,000 1,640,276 1.3
China Govt Bond No1501
4.44%28/2/15 CNY4,640,000 776,825 0.6
China Petro & Chem 4.61%
24/02/14 CNY266,000 42,999 0.0
China Petro & Chem0.8%
02/14-SerWW CNY1,225,000 192,095 0.2
China Vanke VRN 7%
05/09/13 CNY1,500,000 254,073 0.2
Citic Guoan Info 1.2%
14/9/13-SerWW CNY956,000 152,356 0.1
Cosco Shipping 0.8%
28/01/14-SerWW CNY1,000,000 156,797 0.1
Daqin Railway 5.48%
18/08/13 CNY1,000,000 167,425 0.1
Jiangxi Copper 1%
22/09/16-SerWW CNY1,000,000 142,982 0.1
Poly Real Estate Group 7%
11/07/13 CNY600,000 102,251 0.1
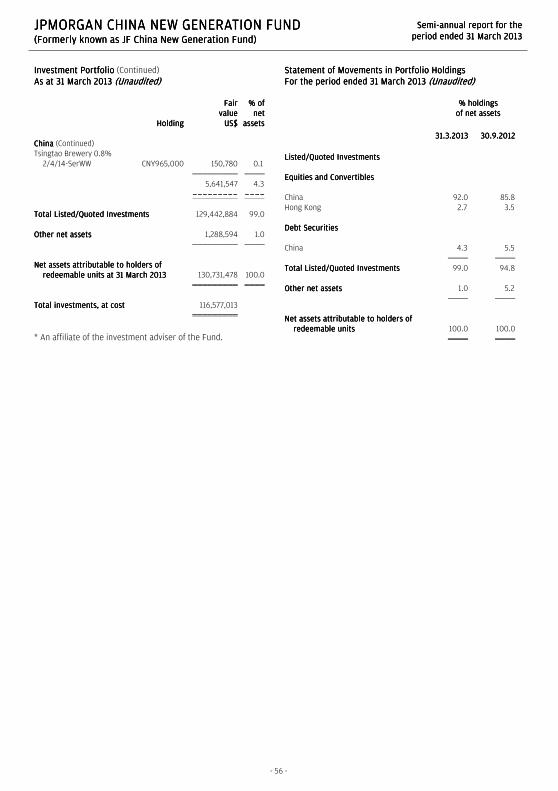
JPMORGAN CHINA NEW GENERATION FUNDJPMORGAN CHINA NEW GENERATION FUNDJPMORGAN CHINA NEW GENERATION FUNDJPMORGAN CHINA NEW GENERATION FUND (Formerly known as JF (Formerly known as JF (Formerly known as JF (Formerly known as JF China New GenerationChina New GenerationChina New GenerationChina New Generation Fund)Fund)Fund)Fund)
SemiSemiSemiSemi----annual report for theannual report for theannual report for theannual report for the
period ended 31 March 2013period ended 31 March 2013period ended 31 March 2013period ended 31 March 2013
- 56 -
Investment PortfolioInvestment PortfolioInvestment PortfolioInvestment Portfolio (Continued)
As at 31 March 2013As at 31 March 2013As at 31 March 2013As at 31 March 2013 (Unaudited)(Unaudited)(Unaudited)(Unaudited)
HoldingHoldingHoldingHolding
FairFairFairFair
valuevaluevaluevalue
US$US$US$US$
% of% of% of% of
netnetnetnet
assetsassetsassetsassets
ChinaChinaChinaChina (Continued)
Tsingtao Brewery 0.8%
2/4/14-SerWW CNY965,000 150,780 0.1
5,641,547 4.3
--------- ----
Total Listed/Quoted InvestmentsTotal Listed/Quoted InvestmentsTotal Listed/Quoted InvestmentsTotal Listed/Quoted Investments 129,442,884 99.0
Other net assetsOther net assetsOther net assetsOther net assets 1,288,594 1.0
Net assets attributable to holders of Net assets attributable to holders of Net assets attributable to holders of Net assets attributable to holders of
redeemable units at 31 March 2013redeemable units at 31 March 2013redeemable units at 31 March 2013redeemable units at 31 March 2013 130,731,478 100.0
Total Total Total Total investments, at costinvestments, at costinvestments, at costinvestments, at cost 116,577,013
* An affiliate of the investment adviser of the Fund.
Statement of Movements in Portfolio HoldingsStatement of Movements in Portfolio HoldingsStatement of Movements in Portfolio HoldingsStatement of Movements in Portfolio Holdings
For the period ended 31 March 2013For the period ended 31 March 2013For the period ended 31 March 2013For the period ended 31 March 2013 (Unaudited)(Unaudited)(Unaudited)(Unaudited)
% holdings% holdings% holdings% holdings
of net assetsof net assetsof net assetsof net assets
31.3.201331.3.201331.3.201331.3.2013 30.9.201230.9.201230.9.201230.9.2012
Listed/Quoted InvestmentsListed/Quoted InvestmentsListed/Quoted InvestmentsListed/Quoted Investments
Equities and ConvertiblesEquities and ConvertiblesEquities and ConvertiblesEquities and Convertibles
China 92.0 85.8
Hong Kong 2.7 3.5
Debt SecuritiesDebt SecuritiesDebt SecuritiesDebt Securities
China 4.3 5.5
Total Listed/Quoted InvestmentsTotal Listed/Quoted InvestmentsTotal Listed/Quoted InvestmentsTotal Listed/Quoted Investments 99.0 94.8
Other net assetsOther net assetsOther net assetsOther net assets 1.0 5.2
Net assets Net assets Net assets Net assets attributable to holders of attributable to holders of attributable to holders of attributable to holders of
redeemable unitsredeemable unitsredeemable unitsredeemable units 100.0 100.0
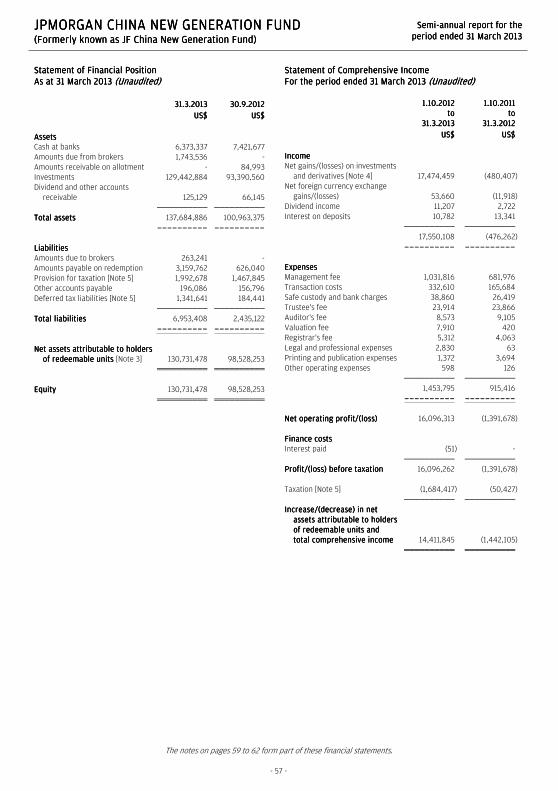
JPMORGAN CHINA NEW GENERATION FUNDJPMORGAN CHINA NEW GENERATION FUNDJPMORGAN CHINA NEW GENERATION FUNDJPMORGAN CHINA NEW GENERATION FUND (Formerly known as JF (Formerly known as JF (Formerly known as JF (Formerly known as JF China New GenerationChina New GenerationChina New GenerationChina New Generation Fund)Fund)Fund)Fund)
SemiSemiSemiSemi----annual report for theannual report for theannual report for theannual report for the
period ended 31 March 2013period ended 31 March 2013period ended 31 March 2013period ended 31 March 2013
The notes on pages 59 to 62 form part of these financial statements.
- 57 -
Statement of Financial PositionStatement of Financial PositionStatement of Financial PositionStatement of Financial Position
As at 31 March 2013As at 31 March 2013As at 31 March 2013As at 31 March 2013 (Unaudited)(Unaudited)(Unaudited)(Unaudited)
31.3.201331.3.201331.3.201331.3.2013 30.9.201230.9.201230.9.201230.9.2012
US$US$US$US$ US$US$US$US$
AssetsAssetsAssetsAssets
Cash at banks 6,373,337 7,421,677
Amounts due from brokers 1,743,536 -
Amounts receivable on allotment - 84,993
Investments 129,442,884 93,390,560
Dividend and other accounts
receivable 125,129 66,145
Total assetsTotal assetsTotal assetsTotal assets 137,684,886 100,963,375
---------- ----------
LiabilitiesLiabilitiesLiabilitiesLiabilities
Amounts due to brokers 263,241 -
Amounts payable on redemption 3,159,762 626,040
Provision for taxation [Note 5] 1,992,678 1,467,845
Other accounts payable 196,086 156,796
Deferred tax liabilities [Note 5] 1,341,641 184,441
Total liabilitiesTotal liabilitiesTotal liabilitiesTotal liabilities 6,953,408 2,435,122
---------- ----------
Net assets attributable to holders Net assets attributable to holders Net assets attributable to holders Net assets attributable to holders
of redeemable units of redeemable units of redeemable units of redeemable units [Note 3] 130,731,478 98,528,253
EquityEquityEquityEquity 130,731,478 98,528,253
Statement of Comprehensive IncomeStatement of Comprehensive IncomeStatement of Comprehensive IncomeStatement of Comprehensive Income
For the period ended 31 March 2013For the period ended 31 March 2013For the period ended 31 March 2013For the period ended 31 March 2013 (Unaudited)(Unaudited)(Unaudited)(Unaudited)
1.10.20121.10.20121.10.20121.10.2012
totototo
31.3.201331.3.201331.3.201331.3.2013
1.10.20111.10.20111.10.20111.10.2011
totototo
31.3.201231.3.201231.3.201231.3.2012
US$US$US$US$ US$US$US$US$
IncomeIncomeIncomeIncome
Net gains/(losses) on investments
and derivatives [Note 4] 17,474,459 (480,407)
Net foreign currency exchange
gains/(losses) 53,660 (11,918)
Dividend income 11,207 2,722
Interest on deposits 10,782 13,341
17,550,108 (476,262)
---------- ----------
ExpensesExpensesExpensesExpenses
Management fee 1,031,816 681,976
Transaction costs 332,610 165,684
Safe custody and bank charges 38,860 26,419
Trustee's fee 23,914 23,866
Auditor's fee 8,573 9,105
Valuation fee 7,910 420
Registrar's fee 5,312 4,063
Legal and professional expenses 2,830 63
Printing and publication expenses 1,372 3,694
Other operating expenses 598 126
1,453,795 915,416
---------- ----------
Net operating profit/(loss)Net operating profit/(loss)Net operating profit/(loss)Net operating profit/(loss) 16,096,313 (1,391,678)
Finance costsFinance costsFinance costsFinance costs
Interest paid (51) -
Profit/(loss) before taxationProfit/(loss) before taxationProfit/(loss) before taxationProfit/(loss) before taxation 16,096,262 (1,391,678)
Taxation [Note 5] (1,684,417) (50,427)
Increase/(decrease) in net Increase/(decrease) in net Increase/(decrease) in net Increase/(decrease) in net
assets attributable to holdersassets attributable to holders assets attributable to holdersassets attributable to holders
of redeemable units and of redeemable units and of redeemable units and of redeemable units and
total total total total comprehensive incomecomprehensive incomecomprehensive incomecomprehensive income 14,411,845 (1,442,105)
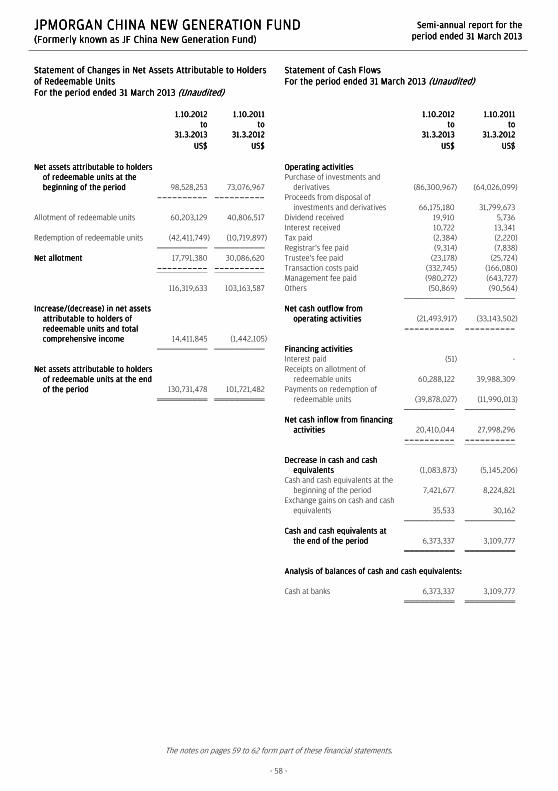
JPMORGAN CHINA NEW GENERATION FUNDJPMORGAN CHINA NEW GENERATION FUNDJPMORGAN CHINA NEW GENERATION FUNDJPMORGAN CHINA NEW GENERATION FUND (Formerly known as JF (Formerly known as JF (Formerly known as JF (Formerly known as JF China New GenerationChina New GenerationChina New GenerationChina New Generation Fund)Fund)Fund)Fund)
SemiSemiSemiSemi----annual report for theannual report for theannual report for theannual report for the
period ended 31 March 2013period ended 31 March 2013period ended 31 March 2013period ended 31 March 2013
The notes on pages 59 to 62 form part of these financial statements.
- 58 -
Statement of Changes in Net Assets Attributable to Holders Statement of Changes in Net Assets Attributable to Holders Statement of Changes in Net Assets Attributable to Holders Statement of Changes in Net Assets Attributable to Holders
of Redeemable Unitsof Redeemable Unitsof Redeemable Unitsof Redeemable Units
For the period ended 31 March 2013For the period ended 31 March 2013For the period ended 31 March 2013For the period ended 31 March 2013 (Unaudited)(Unaudited)(Unaudited)(Unaudited)
1.10.20121.10.20121.10.20121.10.2012
totototo
31.3.201331.3.201331.3.201331.3.2013
1.10.20111.10.20111.10.20111.10.2011
totototo
31.3.201231.3.201231.3.201231.3.2012
US$US$US$US$ US$US$US$US$
Net assets attributable to holders Net assets attributable to holders Net assets attributable to holders Net assets attributable to holders
of redeemable units at the of redeemable units at the of redeemable units at the of redeemable units at the
beginning of the periodbeginning of the periodbeginning of the periodbeginning of the period 98,528,253 73,076,967
---------- ----------
Allotment of redeemable units 60,203,129 40,806,517
Redemption of redeemable units (42,411,749) (10,719,897)
Net allotmentNet allotmentNet allotmentNet allotment 17,791,380 30,086,620
---------- ----------
116,319,633 103,163,587
Increase/(decrease) in net assets Increase/(decrease) in net assets Increase/(decrease) in net assets Increase/(decrease) in net assets
attributable to holders of attributable to holders of attributable to holders of attributable to holders of
redeemable units and total redeemable units and total redeemable units and total redeemable units and total
comprehensive incomecomprehensive incomecomprehensive incomecomprehensive income 14,411,845 (1,442,105)
Net assets attributable to holders Net assets attributable to holders Net assets attributable to holders Net assets attributable to holders
of redeemable units at the end of redeemable units at the end of redeemable units at the end of redeemable units at the end
of the periodof the periodof the periodof the period 130,731,478 101,721,482
Statement of Cash FlowsStatement of Cash FlowsStatement of Cash FlowsStatement of Cash Flows
For the period ended 31 March 2013For the period ended 31 March 2013For the period ended 31 March 2013For the period ended 31 March 2013 (Unaudited)(Unaudited)(Unaudited)(Unaudited)
1.10.20121.10.20121.10.20121.10.2012
totototo
31.3.201331.3.201331.3.201331.3.2013
1.10.20111.10.20111.10.20111.10.2011
totototo
31.3.201231.3.201231.3.201231.3.2012
US$US$US$US$ US$US$US$US$
Operating activitiesOperating activitiesOperating activitiesOperating activities
Purchase of investments and
derivatives (86,300,967) (64,026,099)
Proceeds from disposal of
investments and derivatives 66,175,180 31,799,673
Dividend received 19,910 5,736
Interest received 10,722 13,341
Tax paid (2,384) (2,220)
Registrar's fee paid (9,314) (7,838)
Trustee's fee paid (23,178) (25,724)
Transaction costs paid (332,745) (166,080)
Management fee paid (980,272) (643,727)
Others (50,869) (90,564)
Net Net Net Net cash outflow from cash outflow from cash outflow from cash outflow from
operating activitiesoperating activitiesoperating activitiesoperating activities (21,493,917) (33,143,502)
---------- ----------
Financing activitiesFinancing activitiesFinancing activitiesFinancing activities
Interest paid (51) -
Receipts on allotment of
redeemable units 60,288,122 39,988,309
Payments on redemption of
redeemable units (39,878,027) (11,990,013)
Net cash inflow from financing Net cash inflow from financing Net cash inflow from financing Net cash inflow from financing
activitiesactivitiesactivitiesactivities 20,410,044 27,998,296
---------- ----------
Decrease in cash and cash Decrease in cash and cash Decrease in cash and cash Decrease in cash and cash
equivalentsequivalentsequivalentsequivalents (1,083,873) (5,145,206)
Cash and cash equivalents at the
beginning of the period 7,421,677 8,224,821
Exchange gains on cash and cash
equivalents 35,533 30,162
Cash and cash equivalents at Cash and cash equivalents at Cash and cash equivalents at Cash and cash equivalents at
the end of the periodthe end of the periodthe end of the periodthe end of the period 6,373,337 3,109,777
Analysis of balances of cash and cash Analysis of balances of cash and cash Analysis of balances of cash and cash Analysis of balances of cash and cash equivalents:equivalents:equivalents:equivalents:
Cash at banks 6,373,337 3,109,777
JPMORGAN CHINA NEW GENERATION FUNDJPMORGAN CHINA NEW GENERATION FUNDJPMORGAN CHINA NEW GENERATION FUNDJPMORGAN CHINA NEW GENERATION FUND (Formerly known as JF (Formerly known as JF (Formerly known as JF (Formerly known as JF China New GenerationChina New GenerationChina New GenerationChina New Generation Fund)Fund)Fund)Fund)
SemiSemiSemiSemi----annual report for theannual report for theannual report for theannual report for the
period ended 31 March 2013period ended 31 March 2013period ended 31 March 2013period ended 31 March 2013
- 59 -
Notes to the Financial StatementsNotes to the Financial StatementsNotes to the Financial StatementsNotes to the Financial Statements
1111 The FundThe FundThe FundThe Fund
JPMorgan China New Generation Fund (the "Fund") was established under a Trust Deed dated 21 May 2009, as amended, and is governed by
the laws of Hong Kong. The Fund is authorized by the Securities and Futures Commission of Hong Kong.
With effect from 4 February 2013, the name of the Fund was changed from JF China New Generation Fund to JPMorgan China New Generation
Fund.
The investment objective of the Fund is to provide investors with long-term capital growth by investing primarily in the People's Republic of
China ("PRC") securities, including but not limited to A-Shares, of companies whose predominant business will benefit from, or is related to,
growth of the domestic consumption sector in the PRC. The Fund may also invest in fixed income instruments denominated in Renminbi
issued or listed in or outside the PRC, including debt securities issued by the central government of the PRC, any public or local authorities in
the PRC, any quasi-governmental organizations or any corporates.
All unitholders' rights with regard to the convening, voting or otherwise acting at any meeting of unitholders are the same.
2222 Summary of principal accounting policiesSummary of principal accounting policiesSummary of principal accounting policiesSummary of principal accounting policies
(a)(a)(a)(a) Accounting policies of interim financial Accounting policies of interim financial Accounting policies of interim financial Accounting policies of interim financial statementsstatementsstatementsstatements
The accounting policies and methods of computation used in the preparation of these unaudited condensed interim financial statements
are consistent with those used in the annual financial statements for the year ended 30 September 2012.
(b)(b)(b)(b) InvestmeInvestmeInvestmeInvestments and derivativesnts and derivativesnts and derivativesnts and derivatives
Classification
The Fund classifies its investments and derivatives as financial assets or financial liabilities at fair value through profit or loss. These
financial assets or financial liabilities are held-for-trading as they are acquired or incurred principally for the purpose of selling or
repurchasing in the near term or short-term profit taking.
All derivatives are carried in assets when amounts are receivable by the Fund and in liabilities when amounts are payable by the Fund.
Recognition, derecognition and measurement
Purchases and sales of investments and derivatives are accounted for on the trade date basis. Investments and derivatives are initially
recognized at fair value and are subsequently re-measured at fair value. Realized and unrealized gains and losses on investments and
derivatives are recognized in the Statement of Comprehensive Income. Investments and derivatives are derecognized when the rights to
receive cash flows from the investments and derivatives have expired or the Fund has transferred substantially all risks and rewards of
ownership.
Fair value estimation
Investments that are listed or traded on an exchange and investments with prices quoted in over-the-counter markets or by market
makers, are fair valued based on quoted "bid" prices on long investments and quoted "ask" prices on investments sold short. When
trading in the securities of an investee company is suspended, the investment is valued at the Manager's estimate of its fair value.
Debt securities are fair valued based on quoted prices inclusive of accrued interest.
Investments in collective investment schemes are stated at fair value based on the net asset value per unit of the respective funds as
determined by the administrators of the relevant funds or stated at "bid" prices if the collective investment schemes are listed or traded
on an exchange.
Open future and swap contracts are valued at "bid" prices for long positions and "ask" prices for short positions at the valuation date.
The differences between the bid/ask prices and the contract prices are recognized in the Statement of Comprehensive Income.
Open option contracts are valued at "bid" prices for long positions and "ask" prices for short positions at the valuation date. The
differences between the bid/ask prices and the premium amounts/contract prices are recognized in the Statement of Comprehensive
Income.
Forward foreign exchange contracts are valued at the forward rates ruling at the valuation date. The differences between the forward
rates and the contract rates are recognized in the Statement of Comprehensive Income.

JPMORGAN CHINA NEW GENERATION FUNDJPMORGAN CHINA NEW GENERATION FUNDJPMORGAN CHINA NEW GENERATION FUNDJPMORGAN CHINA NEW GENERATION FUND (Formerly known as JF (Formerly known as JF (Formerly known as JF (Formerly known as JF China New GenerationChina New GenerationChina New GenerationChina New Generation Fund)Fund)Fund)Fund)
SemiSemiSemiSemi----annual report for theannual report for theannual report for theannual report for the
period ended 31 March 2013period ended 31 March 2013period ended 31 March 2013period ended 31 March 2013
- 60 -
(c)(c)(c)(c) Foreign currency translationForeign currency translationForeign currency translationForeign currency translation
Functional and presentation currency
The Fund has adopted United States dollar as its functional and presentation currency.
Transactions and balances
Foreign currency transactions are translated into the functional currency using the exchange rates prevailing at the dates of the
transactions.
Foreign exchange gains and losses resulting from the settlement of such transactions and from the translation of assets and liabilities
denominated in foreign currencies at period/year end exchange rates are recognized in the Statement of Comprehensive Income.
Foreign exchange gains and losses relating to cash and cash equivalents are presented in the Statement of Comprehensive Income
within "Net foreign currency exchange gains/losses". Foreign exchange gains and losses relating to the financial assets and liabilities
carried at fair value through profit or loss are presented in the Statement of Comprehensive Income within "Net gains/losses on
investments and derivatives".
(d)(d)(d)(d) Proceeds and payments on allotment and redemption of unitsProceeds and payments on allotment and redemption of unitsProceeds and payments on allotment and redemption of unitsProceeds and payments on allotment and redemption of units
The net asset value per unit is computed for each dealing day. The price at which units are allotted or redeemed is calculated by
reference to the net asset value per unit as at the close of business on the relevant dealing day in accordance with the provisions of the
Fund's Trust Deed dated 21 May 2009, as amended, which may be different from the accounting policies stated in the financial
statements.
(e)(e)(e)(e) TaxationTaxationTaxationTaxation
Deferred income tax is provided, using the liability method, on temporary differences arising between the tax bases of assets and
liabilities and their carrying amounts in the financial statements. However, the deferred income tax is not accounted for if it arises from
initial recognition of an asset or liability in a transaction that at the time of the transaction affects neither accounting nor taxable profit
or loss. Deferred income tax is determined using tax rates (and laws) that have been enacted or substantially enacted by the statement
of financial position date and are expected to apply when the related deferred income tax asset is realized or the deferred income tax
liability is settled.
Deferred income tax assets are recognized to the extent that it is probable that future taxable profit will be available against which the
temporary differences can be utilized.
3333 Number of units in issue and net assets attributable to holders of redeemable units (per unit)Number of units in issue and net assets attributable to holders of redeemable units (per unit)Number of units in issue and net assets attributable to holders of redeemable units (per unit)Number of units in issue and net assets attributable to holders of redeemable units (per unit)
31.3.2013 30.9.2012
Units Units
Number of units in issue 13,962,387.821 11,901,161.018
US$ US$
Net assets attributable to holders of redeemable units 130,731,478 98,528,253
Net assets attributable to holders of redeemable units (per unit) 9.36 8.28

JPMORGAN CHINA NEW GENERATION FUNDJPMORGAN CHINA NEW GENERATION FUNDJPMORGAN CHINA NEW GENERATION FUNDJPMORGAN CHINA NEW GENERATION FUND (Formerly known as JF (Formerly known as JF (Formerly known as JF (Formerly known as JF China New GenerationChina New GenerationChina New GenerationChina New Generation Fund)Fund)Fund)Fund)
SemiSemiSemiSemi----annual report for theannual report for theannual report for theannual report for the
period ended 31 March 2013period ended 31 March 2013period ended 31 March 2013period ended 31 March 2013
- 61 -
4444 Net gains/(losses) on investments and derivatives Net gains/(losses) on investments and derivatives Net gains/(losses) on investments and derivatives Net gains/(losses) on investments and derivatives
1.10.2012
to
31.3.2013
1.10.2011
to
31.3.2012
US$ US$
Change in unrealized gains/losses in value of investments and derivatives 14,495,370 2,696,031
Realized gains/(losses) on sale of investments and derivatives 2,979,089 (3,176,438)
17,474,459 (480,407)
5555 Taxation Taxation Taxation Taxation
The amount of taxation charged to the Statement of Comprehensive Income represents:
1.10.2012
to
31.3.2013
1.10.2011
To
31.3.2012
US$ US$
Withholding tax
- Dividend and interest income (4,783) (3,459)
Capital gains tax (522,434) (18,517)
Deferred tax liabilities (1,157,200) (28,451)
Taxation (1,684,417) (50,427)
The movement in deferred tax liabilities is as follows:
1.10.2012
To
31.3.2013
1.10.2011
To
30.9.2012
US$ US$
At the beginning of the period/year 184,441 6,404
Deferred tax liabilities charged to the Statement of Comprehensive Income 1,157,200 178,037
At the end of the period/year 1,341,641 184,441
The movement in provision for taxation is as follows:
1.10.2012
To
31.3.2013
1.10.2011
To
30.9.2012
US$ US$
At the beginning of the period/year 1,467,845 1,236,109
Taxation charged to the Statement of Comprehensive Income 527,217 386,263
Tax paid (2,384) (154,527)
At the end of the period/year 1,992,678 1,467,845

JPMORGAN CHINA NEW GENERATION FUNDJPMORGAN CHINA NEW GENERATION FUNDJPMORGAN CHINA NEW GENERATION FUNDJPMORGAN CHINA NEW GENERATION FUND (Formerly known as JF (Formerly known as JF (Formerly known as JF (Formerly known as JF China New GenerationChina New GenerationChina New GenerationChina New Generation Fund)Fund)Fund)Fund)
SemiSemiSemiSemi----annual report for theannual report for theannual report for theannual report for the
period ended 31 March 2013period ended 31 March 2013period ended 31 March 2013period ended 31 March 2013
- 62 -
(a)(a)(a)(a) The Fund held A-shares of PRC listed companies through the QFII quota of the Investment Manager and certain investment in other PRC
securities. Tax provisioning of 10% is made for PRC sourced dividends and interest (except for Government bond interest which is tax
exempt). The PRC taxation of gains on PRC securities is however presently unclear. Under current PRC tax law, a 10% tax may be
payable on gains derived from the sale of PRC securities by foreign investors. Up to the issuance date of these financial statements, it is
uncertain as to whether the State Administration of Taxation ("SAT") will collect this tax in respect of the gains on PRC securities.
However, the Manager is of the view that it is possible that the SAT may start to collect this tax retrospectively from the launch of the
Fund. The Manager has assessed the likelihood of such exposure and has made a provision of US$3,330,385 as at 31 March 2013 (30
September 2012: US$1,650,750) based on its best estimate of the potential taxation liability and the probability of such gains
crystallizing. The Manager estimates that the potential taxation liability ranges from nil to US$3,330,385 as at 31 March 2013 (30
September 2012: from nil to US$1,650,750). However the Manager would like to highlight that there is a possibility that some or all of
the tax provided as at 31 March 2013 for gains on PRC securities in the amount of US$3,330,385 (30 September 2012: US$1,650,750) will
not be payable and may be released. The Manager is regularly monitoring the position.
(b)(b)(b)(b) No provision for Hong Kong profits tax has been made as the Fund was authorized as a collective investment scheme under Section 104
of the Securities and Futures Ordinance and is therefore exempt from profits tax under Section 26A(1A) of the Inland Revenue Ordinance.
Overseas withholding tax was charged on certain dividend income received during the period.
6666 Soft commission arrangementsSoft commission arrangementsSoft commission arrangementsSoft commission arrangements
The Investment Manager has entered into soft commission arrangements with brokers under which certain goods and services used to
support investment decision making are received by the Investment Manager. The Investment Manager does not make direct payment for
these services but transacts an agreed amount of business with the brokers on behalf of the Fund. Commission is paid from the Fund on these
transactions.
The goods and services must be of demonstrable benefit to the Fund and may include research and advisory services; economic and political
analysis; portfolio analysis, including valuation and performance measurement; market analysis, data and quotation services, computer
hardware and software incidental to the above goods and services; clearing and custodian services and investment-related publications.
7777 Distribution Distribution Distribution Distribution
No distribution was made during the period (31 March 2012: nil).
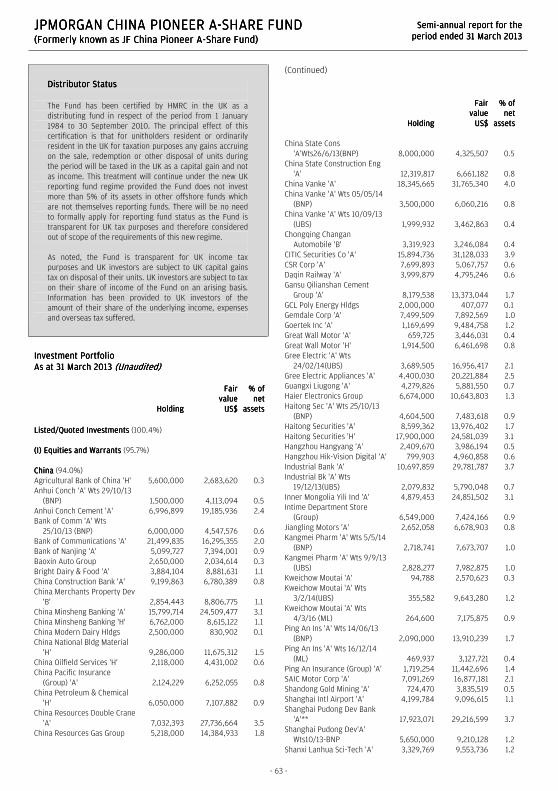
JPMORGAN CHINA PIONEER AJPMORGAN CHINA PIONEER AJPMORGAN CHINA PIONEER AJPMORGAN CHINA PIONEER A----SHARE FUNDSHARE FUNDSHARE FUNDSHARE FUND (Formerly known as JF China Pioneer A(Formerly known as JF China Pioneer A(Formerly known as JF China Pioneer A(Formerly known as JF China Pioneer A----Share Fund)Share Fund)Share Fund)Share Fund)
SemiSemiSemiSemi----annual report for theannual report for theannual report for theannual report for the
period ended 31 March 2013period ended 31 March 2013period ended 31 March 2013period ended 31 March 2013
- 63 -
Distributor StatusDistributor StatusDistributor StatusDistributor Status
The Fund has been certified by HMRC in the UK as a
distributing fund in respect of the period from 1 January
1984 to 30 September 2010. The principal effect of this
certification is that for unitholders resident or ordinarily
resident in the UK for taxation purposes any gains accruing
on the sale, redemption or other disposal of units during
the period will be taxed in the UK as a capital gain and not
as income. This treatment will continue under the new UK
reporting fund regime provided the Fund does not invest
more than 5% of its assets in other offshore funds which
are not themselves reporting funds. There will be no need
to formally apply for reporting fund status as the Fund is
transparent for UK tax purposes and therefore considered
out of scope of the requirements of this new regime.
As noted, the Fund is transparent for UK income tax
purposes and UK investors are subject to UK capital gains
tax on disposal of their units. UK investors are subject to tax
on their share of income of the Fund on an arising basis.
Information has been provided to UK investors of the
amount of their share of the underlying income, expenses
and overseas tax suffered.
Investment PortfolioInvestment PortfolioInvestment PortfolioInvestment Portfolio
As at 31 March 2013As at 31 March 2013As at 31 March 2013As at 31 March 2013 (Unaudited)(Unaudited)(Unaudited)(Unaudited)
HoldingHoldingHoldingHolding
FairFairFairFair
valuevaluevaluevalue
US$US$US$US$
% of% of% of% of
netnetnetnet
assetsassetsassetsassets
Listed/Quoted InvestmentsListed/Quoted InvestmentsListed/Quoted InvestmentsListed/Quoted Investments (100.4%)
(I) Equities and Warrants(I) Equities and Warrants(I) Equities and Warrants(I) Equities and Warrants (95.7%)
ChinaChinaChinaChina (94.0%)
Agricultural Bank of China 'H' 5,600,000 2,683,620 0.3
Anhui Conch 'A' Wts 29/10/13
(BNP) 1,500,000 4,113,094 0.5
Anhui Conch Cement 'A' 6,996,899 19,185,936 2.4
Bank of Comm 'A' Wts
25/10/13 (BNP) 6,000,000 4,547,576 0.6
Bank of Communications 'A' 21,499,835 16,295,355 2.0
Bank of Nanjing 'A' 5,099,727 7,394,001 0.9
Baoxin Auto Group 2,650,000 2,034,614 0.3
Bright Dairy & Food 'A' 3,884,104 8,881,631 1.1
China Construction Bank 'A' 9,199,863 6,780,389 0.8
China Merchants Property Dev
'B' 2,854,443 8,806,775 1.1
China Minsheng Banking 'A' 15,799,714 24,509,477 3.1
China Minsheng Banking 'H' 6,762,000 8,615,122 1.1
China Modern Dairy Hldgs 2,500,000 830,902 0.1
China National Bldg Material
'H' 9,286,000 11,675,312 1.5
China Oilfield Services 'H' 2,118,000 4,431,002 0.6
China Pacific Insurance
(Group) 'A' 2,124,229 6,252,055 0.8
China Petroleum & Chemical
'H' 6,050,000 7,107,882 0.9
China Resources Double Crane
'A' 7,032,393 27,736,664 3.5
China Resources Gas Group 5,218,000 14,384,933 1.8
(Continued)
HoldingHoldingHoldingHolding
FairFairFairFair
valuevaluevaluevalue
US$US$US$US$
% of% of% of% of
netnetnetnet
assetsassetsassetsassets
China State Cons
'A'Wts26/6/13(BNP) 8,000,000 4,325,507 0.5
China State Construction Eng
'A' 12,319,817 6,661,182 0.8
China Vanke 'A' 18,345,665 31,765,340 4.0
China Vanke 'A' Wts 05/05/14
(BNP) 3,500,000 6,060,216 0.8
China Vanke 'A' Wts 10/09/13
(UBS) 1,999,932 3,462,863 0.4
Chongqing Changan
Automobile 'B' 3,319,923 3,246,084 0.4
CITIC Securities Co 'A' 15,894,736 31,128,033 3.9
CSR Corp 'A' 7,699,893 5,067,757 0.6
Daqin Railway 'A' 3,999,879 4,795,246 0.6
Gansu Qilianshan Cement
Group 'A' 8,179,538 13,373,044 1.7
GCL Poly Energy Hldgs 2,000,000 407,077 0.1
Gemdale Corp 'A' 7,499,509 7,892,569 1.0
Goertek Inc 'A' 1,169,699 9,484,758 1.2
Great Wall Motor 'A' 659,725 3,446,031 0.4
Great Wall Motor 'H' 1,914,500 6,461,698 0.8
Gree Electric 'A' Wts
24/02/14(UBS) 3,689,505 16,956,417 2.1
Gree Electric Appliances 'A' 4,400,030 20,221,884 2.5
Guangxi Liugong 'A' 4,279,826 5,881,550 0.7
Haier Electronics Group 6,674,000 10,643,803 1.3
Haitong Sec 'A' Wts 25/10/13
(BNP) 4,604,500 7,483,618 0.9
Haitong Securities 'A' 8,599,362 13,976,402 1.7
Haitong Securities 'H' 17,900,000 24,581,039 3.1
Hangzhou Hangyang 'A' 2,409,670 3,986,194 0.5
Hangzhou Hik-Vision Digital 'A' 799,903 4,960,858 0.6
Industrial Bank 'A' 10,697,859 29,781,787 3.7
Industrial Bk 'A' Wts
19/12/13(UBS) 2,079,832 5,790,048 0.7
Inner Mongolia Yili Ind 'A' 4,879,453 24,851,502 3.1
Intime Department Store
(Group) 6,549,000 7,424,166 0.9
Jiangling Motors 'A' 2,652,058 6,678,903 0.8
Kangmei Pharm 'A' Wts 5/5/14
(BNP) 2,718,741 7,673,707 1.0
Kangmei Pharm 'A' Wts 9/9/13
(UBS) 2,828,277 7,982,875 1.0
Kweichow Moutai 'A' 94,788 2,570,623 0.3
Kweichow Moutai 'A' Wts
3/2/14(UBS) 355,582 9,643,280 1.2
Kweichow Moutai 'A' Wts
4/3/16 (ML) 264,600 7,175,875 0.9
Ping An Ins 'A' Wts 14/06/13
(BNP) 2,090,000 13,910,239 1.7
Ping An Ins 'A' Wts 16/12/14
(ML) 469,937 3,127,721 0.4
Ping An Insurance (Group) 'A' 1,719,254 11,442,696 1.4
SAIC Motor Corp 'A' 7,091,269 16,877,181 2.1
Shandong Gold Mining 'A' 724,470 3,835,519 0.5
Shanghai Intl Airport 'A' 4,199,784 9,096,615 1.1
Shanghai Pudong Dev Bank
'A'** 17,923,071 29,216,599 3.7
Shanghai Pudong Dev'A'
Wts10/13-BNP 5,650,000 9,210,128 1.2
Shanxi Lanhua Sci-Tech 'A' 3,329,769 9,553,736 1.2

JPMORGAN CHINA PIONEER AJPMORGAN CHINA PIONEER AJPMORGAN CHINA PIONEER AJPMORGAN CHINA PIONEER A----SHARE FUNDSHARE FUNDSHARE FUNDSHARE FUND (Formerly known as JF China Pioneer A(Formerly known as JF China Pioneer A(Formerly known as JF China Pioneer A(Formerly known as JF China Pioneer A----Share Fund)Share Fund)Share Fund)Share Fund)
SemiSemiSemiSemi----annual report for theannual report for theannual report for theannual report for the
period ended 31 March 2013period ended 31 March 2013period ended 31 March 2013period ended 31 March 2013
- 64 -
Investment PortfolioInvestment PortfolioInvestment PortfolioInvestment Portfolio (Continued)
As at 31 March 2013As at 31 March 2013As at 31 March 2013As at 31 March 2013 (Unaudited)(Unaudited)(Unaudited)(Unaudited)
HoldingHoldingHoldingHolding
FairFairFairFair
valuevaluevaluevalue
US$US$US$US$
% of% of% of% of
netnetnetnet
assetsassetsassetsassets
ChinaChinaChinaChina (Continued)
Shenzhen Overseas Chinese
Town 'A' 8,199,773 7,666,299 1.0
SPG Land (Hldgs) 4,445,150 1,586,194 0.2
Sunac China Hldgs 2,969,000 2,084,475 0.3
Suzhou Gold Mantis Const 'A' 389,886 2,177,083 0.3
Tasly Pharmaceutical Group
'A' 569,800 6,407,419 0.8
Tencent Hldgs 707,100 22,462,801 2.8
Tsingtao Brewery 'A' 1,819,696 10,787,635 1.3
Weifu High-Technology Group
'B' 1,224,873 4,743,185 0.6
Wuhan Department Store
Group 'A' 3,697,496 6,187,979 0.8
Yantai Jereh Oilfield Services
'A' 1,419,768 17,829,634 2.2
Yonghui Superstores 'A' 599,934 2,623,981 0.3
Yunnan Baiyao Group 'A' 399,318 5,487,626 0.7
Zhejiang Dahua Technology 'A' 707,870 7,915,596 1.0
Zoomlion Heavy Industry 'H' 5,500,000 6,631,756 0.8
Hong KongHong KongHong KongHong Kong (1.7%)
AAC Technologies Hldgs 2,434,500 11,682,238 1.5
Termbray Petro-King Oilfield
Serv 2,410,000 1,362,924 0.2
766,015,535 95.7
---------- ----
(II) Collective Investment Schemes(II) Collective Investment Schemes(II) Collective Investment Schemes(II) Collective Investment Schemes (4.7%)
ChinaChinaChinaChina (4.7%)
db x-trackers CSI300 UCITS
ETF (2D) 11,041,200 8,647,884 1.1
JPM China New Generation
Fund* 3,109,255 29,195,909 3.6
37,843,793 4.7
---------- ----
Total Listed/Quoted InvestmentsTotal Listed/Quoted InvestmentsTotal Listed/Quoted InvestmentsTotal Listed/Quoted Investments 803,859,328 100.4
Other net Other net Other net Other net liabilitiesliabilitiesliabilitiesliabilities (3,044,889) (0.4)
Net assets attributable to holders of Net assets attributable to holders of Net assets attributable to holders of Net assets attributable to holders of
redeemable units at 31 March 2013redeemable units at 31 March 2013redeemable units at 31 March 2013redeemable units at 31 March 2013 800,814,439 100.0
Total investments, at costTotal investments, at costTotal investments, at costTotal investments, at cost 721,633,238
* Issued and managed by a Connected Person of the manager
** An affiliate of the investment adviser of the Fund
Statement of Movements in Portfolio HoldingsStatement of Movements in Portfolio HoldingsStatement of Movements in Portfolio HoldingsStatement of Movements in Portfolio Holdings
For the period ended 31 March 2013For the period ended 31 March 2013For the period ended 31 March 2013For the period ended 31 March 2013 (Unaudited)(Unaudited)(Unaudited)(Unaudited)
% holdings% holdings% holdings% holdings
of net assetsof net assetsof net assetsof net assets
31.3.201331.3.201331.3.201331.3.2013 30.9.201230.9.201230.9.201230.9.2012
Listed/Quoted Listed/Quoted Listed/Quoted Listed/Quoted InvestmentsInvestmentsInvestmentsInvestments
Equities and WarrantsEquities and WarrantsEquities and WarrantsEquities and Warrants
China 94.0 93.5
Hong Kong 1.7 1.1
Collective Investment SchemesCollective Investment SchemesCollective Investment SchemesCollective Investment Schemes
China 4.7 3.9
Total Listed/Quoted InvestmentsTotal Listed/Quoted InvestmentsTotal Listed/Quoted InvestmentsTotal Listed/Quoted Investments 100.4 98.5
Other net (liabilities)/assetsOther net (liabilities)/assetsOther net (liabilities)/assetsOther net (liabilities)/assets (0.4) 1.5
Net assets attributable to holders of Net assets attributable to holders of Net assets attributable to holders of Net assets attributable to holders of
redeemable unitsredeemable unitsredeemable unitsredeemable units 100.0 100.0

JPMORGAN CHINA PIONEER AJPMORGAN CHINA PIONEER AJPMORGAN CHINA PIONEER AJPMORGAN CHINA PIONEER A----SHARE FUNDSHARE FUNDSHARE FUNDSHARE FUND (Formerly known as JF China Pioneer A(Formerly known as JF China Pioneer A(Formerly known as JF China Pioneer A(Formerly known as JF China Pioneer A----Share Fund)Share Fund)Share Fund)Share Fund)
SemiSemiSemiSemi----annual report for theannual report for theannual report for theannual report for the
period ended 31 March 2013period ended 31 March 2013period ended 31 March 2013period ended 31 March 2013
The notes on pages 67 to 70 form part of these financial statements.
- 65 -
Statement of Financial PositionStatement of Financial PositionStatement of Financial PositionStatement of Financial Position
As at 31 March 2013As at 31 March 2013As at 31 March 2013As at 31 March 2013 (Unaudited)(Unaudited)(Unaudited)(Unaudited)
31.3.201331.3.201331.3.201331.3.2013 30.9.201230.9.201230.9.201230.9.2012
US$US$US$US$ US$US$US$US$
AssetsAssetsAssetsAssets
Cash at banks 72,653,598 66,953,715
Short term deposits - 13,000,339
Amounts due from brokers 4,065,189 9,688,510
Amounts receivable on allotment 666,688 5,135,084
Investments 803,859,328 651,585,579
Dividend and other accounts
receivable 823,611 698,942
Total assetsTotal assetsTotal assetsTotal assets 882,068,414 747,062,169
---------- ----------
LiabilitiesLiabilitiesLiabilitiesLiabilities
Amounts due to brokers 3,475,302 21,048,734
Amounts payable on redemption 11,325,404 6,623,760
Provision for taxation [Note 5] 57,760,508 54,573,272
Other accounts payable 1,102,509 888,925
Deferred tax liabilities [Note 5] 7,590,252 2,119,791
Total liabilitiesTotal liabilitiesTotal liabilitiesTotal liabilities 81,253,975 85,254,482
---------- ----------
Net assets attributable to holders Net assets attributable to holders Net assets attributable to holders Net assets attributable to holders
of redeemable units of redeemable units of redeemable units of redeemable units [Note 3] 800,814,439 661,807,687
EquityEquityEquityEquity 800,814,439 661,807,687
Statement of Comprehensive IncomeStatement of Comprehensive IncomeStatement of Comprehensive IncomeStatement of Comprehensive Income
For the period ended 31 March 2013For the period ended 31 March 2013For the period ended 31 March 2013For the period ended 31 March 2013 (Unaudited)(Unaudited)(Unaudited)(Unaudited)
1.10.20121.10.20121.10.20121.10.2012
totototo
31.3.201331.3.201331.3.201331.3.2013
1.10.20111.10.20111.10.20111.10.2011
totototo
31.3.201231.3.201231.3.201231.3.2012
US$US$US$US$ US$US$US$US$
IncomeIncomeIncomeIncome
Net gains on investments and
derivatives [Note 4] 104,800,229 7,414,981
Net foreign currency exchange
gains 587,857 1,095,744
Dividend income 126,155 356,333
Interest on deposits 115,071 205,990
105,629,312 9,073,048
---------- ----------
ExpensesExpensesExpensesExpenses
Management fee 6,716,603 5,057,225
Transaction costs 1,668,151 1,448,955
Safe custody and bank charges 171,714 157,265
Trustee's fee 108,578 92,798
Registrar's fee 33,106 21,658
Auditor's fee 10,159 10,750
Valuation fee 7,910 8,120
Printing and publication expenses 3,989 5,677
Legal and professional expenses 1,940 485
Other operating expenses 4,995 8,020
8,727,145 6,810,953
---------- ----------
Profit before taxationProfit before taxationProfit before taxationProfit before taxation 96,902,167 2,262,095
Taxation [Note 5] (8,667,479) (519,252)
Increase in net assets Increase in net assets Increase in net assets Increase in net assets
attributable to holders of attributable to holders of attributable to holders of attributable to holders of
redeemable units and total redeemable units and total redeemable units and total redeemable units and total
comprehensive incomecomprehensive incomecomprehensive incomecomprehensive income 88,234,688 1,742,843

JPMORGAN CHINA PIONEER AJPMORGAN CHINA PIONEER AJPMORGAN CHINA PIONEER AJPMORGAN CHINA PIONEER A----SHARE FUNDSHARE FUNDSHARE FUNDSHARE FUND (Formerly known as JF China Pioneer A(Formerly known as JF China Pioneer A(Formerly known as JF China Pioneer A(Formerly known as JF China Pioneer A----Share Fund)Share Fund)Share Fund)Share Fund)
SemiSemiSemiSemi----annual report for theannual report for theannual report for theannual report for the
period ended 31 March 2013period ended 31 March 2013period ended 31 March 2013period ended 31 March 2013
The notes on pages 67 to 70 form part of these financial statements.
- 66 -
Statement of Changes in Net Assets Attributable to Holders Statement of Changes in Net Assets Attributable to Holders Statement of Changes in Net Assets Attributable to Holders Statement of Changes in Net Assets Attributable to Holders
of Redeemable Unitsof Redeemable Unitsof Redeemable Unitsof Redeemable Units
For the period ended 31 March 2013For the period ended 31 March 2013For the period ended 31 March 2013For the period ended 31 March 2013 (Unaudited)(Unaudited)(Unaudited)(Unaudited)
1.10.20121.10.20121.10.20121.10.2012
totototo
31.3.201331.3.201331.3.201331.3.2013
1.10.20111.10.20111.10.20111.10.2011
totototo
31.3.201231.3.201231.3.201231.3.2012
US$US$US$US$ US$US$US$US$
Net assets attributable to holders Net assets attributable to holders Net assets attributable to holders Net assets attributable to holders
of redeemable units at the of redeemable units at the of redeemable units at the of redeemable units at the
beginning of the periodbeginning of the periodbeginning of the periodbeginning of the period 661,807,687 552,209,480
---------- ----------
Allotment of redeemable units 136,372,344 154,734,379
Redemption of redeemable units (85,600,280) (65,072,052)
Net allotmentNet allotmentNet allotmentNet allotment 50,772,064 89,662,327
---------- ----------
712,579,751 641,871,807
Increase in net assets Increase in net assets Increase in net assets Increase in net assets
attributable to holders of attributable to holders of attributable to holders of attributable to holders of
redeemable units and total redeemable units and total redeemable units and total redeemable units and total
comprehensive incomecomprehensive incomecomprehensive incomecomprehensive income 88,234,688 1,742,843
Net assets attributable to holders Net assets attributable to holders Net assets attributable to holders Net assets attributable to holders
of redeemable units at the end of redeemable units at the end of redeemable units at the end of redeemable units at the end
of the periodof the periodof the periodof the period 800,814,439 643,614,650
Statement of Cash FlowsStatement of Cash FlowsStatement of Cash FlowsStatement of Cash Flows
For the period ended 31 March 2013For the period ended 31 March 2013For the period ended 31 March 2013For the period ended 31 March 2013 (Unaudited)(Unaudited)(Unaudited)(Unaudited)
1.10.20121.10.20121.10.20121.10.2012
totototo
31.3.201331.3.201331.3.201331.3.2013
1.10.20111.10.20111.10.20111.10.2011
totototo
31.3.201231.3.201231.3.201231.3.2012
US$US$US$US$ US$US$US$US$
Operating activitiesOperating activitiesOperating activitiesOperating activities
Purchase of investments and
derivatives (450,749,772) (412,809,585)
Proceeds from disposal of
investments and derivatives 391,118,248 334,470,860
Dividend received 228,868 373,342
Interest received 115,212 205,758
Tax paid (9,782) (42,114)
Registrar's fee paid (56,882) (44,395)
Trustee's fee paid (104,855) (97,053)
Transaction costs paid (1,689,266) (1,445,117)
Management fee paid (6,462,164) (5,016,814)
Others (290,009) 91,886
Net cash outflow from Net cash outflow from Net cash outflow from Net cash outflow from
operating activitiesoperating activitiesoperating activitiesoperating activities (67,900,402) (84,313,232)
---------- ----------
Financing activitiesFinancing activitiesFinancing activitiesFinancing activities
Receipts on allotment of
redeemable units 140,840,740 150,909,112
Payments on redemption of
redeemable units (80,898,636) (78,938,338)
Net cash inflow from financing Net cash inflow from financing Net cash inflow from financing Net cash inflow from financing
activitiesactivitiesactivitiesactivities 59,942,104 71,970,774
---------- ----------
Decrease in cash and cash Decrease in cash and cash Decrease in cash and cash Decrease in cash and cash
equivalentsequivalentsequivalentsequivalents (7,958,298) (12,342,458)
Cash and cash equivalents at the
beginning of the period 79,954,054 105,720,036
Exchange gains on cash and cash
equivalents 657,842 798,841
Cash and cash equivalents at Cash and cash equivalents at Cash and cash equivalents at Cash and cash equivalents at
the end of the periodthe end of the periodthe end of the periodthe end of the period 72,653,598 94,176,419
Analysis of balances of cash and Analysis of balances of cash and Analysis of balances of cash and Analysis of balances of cash and cash equivalents:cash equivalents:cash equivalents:cash equivalents:
Cash at banks 72,653,598 64,168,611
Short term deposits - 30,007,808
72,653,598 94,176,419

JPMORGAN CHJPMORGAN CHJPMORGAN CHJPMORGAN CHINA PIONEER AINA PIONEER AINA PIONEER AINA PIONEER A----SHARE FUNDSHARE FUNDSHARE FUNDSHARE FUND (Formerly known as JF China Pioneer A(Formerly known as JF China Pioneer A(Formerly known as JF China Pioneer A(Formerly known as JF China Pioneer A----Share Fund)Share Fund)Share Fund)Share Fund)
SemiSemiSemiSemi----annual report for theannual report for theannual report for theannual report for the
period ended 31 March 2013period ended 31 March 2013period ended 31 March 2013period ended 31 March 2013
- 67 -
Notes to the Financial StatementsNotes to the Financial StatementsNotes to the Financial StatementsNotes to the Financial Statements
1111 The FundThe FundThe FundThe Fund
JPMorgan China Pioneer A-Share Fund (the "Fund") was established under a Trust Deed dated 14 June 2006, as amended, and is governed by
the laws of Hong Kong. The Fund is authorized by the Securities and Futures Commission of Hong Kong.
With effect from 4 February 2013, the name of the Fund was changed from JF China Pioneer A-Share Fund to JPMorgan China Pioneer A-Share
Fund.
The investment objective and policy of the Fund is to achieve long-term capital growth by investing primarily in the People's Republic of China
("PRC") securities, including but not limited to A-Shares.
All unitholders' rights with regard to the convening, voting or otherwise acting at any meeting of unitholders are the same.
2222 Summary of principal accounting policiesSummary of principal accounting policiesSummary of principal accounting policiesSummary of principal accounting policies
(a)(a)(a)(a) Accounting policies of interim financial statementsAccounting policies of interim financial statementsAccounting policies of interim financial statementsAccounting policies of interim financial statements
The accounting policies and methods of computation used in the preparation of these unaudited condensed interim financial statements
are consistent with those used in the annual financial statements for the year ended 30 September 2012.
(b)(b)(b)(b) Investments and derivativesInvestments and derivativesInvestments and derivativesInvestments and derivatives
Classification
The Fund classifies its investments and derivatives as financial assets or financial liabilities at fair value through profit or loss. These
financial assets or financial liabilities are held-for-trading as they are acquired or incurred principally for the purpose of selling or
repurchasing in the near term or short-term profit taking.
All derivatives are carried in assets when amounts are receivable by the Fund and in liabilities when amounts are payable by the Fund.
Recognition, derecognition and measurement
Purchases and sales of investments and derivatives are accounted for on the trade date basis. Investments and derivatives are initially
recognized at fair value and are subsequently re-measured at fair value. Realized and unrealized gains and losses on investments and
derivatives are recognized in the Statement of Comprehensive Income. Investments and derivatives are derecognized when the rights to
receive cash flows from the investments and derivatives have expired or the Fund has transferred substantially all risks and rewards of
ownership.
Fair value estimation
Investments that are listed or traded on an exchange and investments with prices quoted in over-the-counter markets or by market
makers, are fair valued based on quoted "bid" prices on long investments and quoted "ask" prices on investments sold short. When
trading in the securities of an investee company is suspended, the investment is valued at the Manager's estimate of its fair value.
Debt securities are fair valued based on quoted prices inclusive of accrued interest.
Investments in collective investment schemes are stated at fair value based on the net asset value per unit of the respective funds as
determined by the administrators of the relevant funds or stated at "bid" prices if the collective investment schemes are listed or traded
on an exchange.
Open future and swap contracts are valued at "bid" prices for long positions and "ask" prices for short positions at the valuation date.
The differences between the bid/ask prices and the contract prices are recognized in the Statement of Comprehensive Income.
Open option contracts are valued at "bid" prices for long positions and "ask" prices for short positions at the valuation date. The
differences between the bid/ask prices and the premium amounts/contract prices are recognized in the Statement of Comprehensive
Income.
Forward foreign exchange contracts are valued at the forward rates ruling at the valuation date. The differences between the forward
rates and the contract rates are recognized in the Statement of Comprehensive Income.

JPMORGAN CHJPMORGAN CHJPMORGAN CHJPMORGAN CHINA PIONEER AINA PIONEER AINA PIONEER AINA PIONEER A----SHARE FUNDSHARE FUNDSHARE FUNDSHARE FUND (Formerly known as JF China Pioneer A(Formerly known as JF China Pioneer A(Formerly known as JF China Pioneer A(Formerly known as JF China Pioneer A----Share Fund)Share Fund)Share Fund)Share Fund)
SemiSemiSemiSemi----annual report for theannual report for theannual report for theannual report for the
period ended 31 March 2013period ended 31 March 2013period ended 31 March 2013period ended 31 March 2013
- 68 -
(c)(c)(c)(c) Foreign currency translationForeign currency translationForeign currency translationForeign currency translation
Functional and presentation currency
The Fund has adopted United States dollar as its functional and presentation currency.
Transactions and balances
Foreign currency transactions are translated into the functional currency using the exchange rates prevailing at the dates of the
transactions.
Foreign exchange gains and losses resulting from the settlement of such transactions and from the translation of assets and liabilities
denominated in foreign currencies at period/year end exchange rates are recognized in the Statement of Comprehensive Income.
Foreign exchange gains and losses relating to cash and cash equivalents are presented in the Statement of Comprehensive Income
within "Net foreign currency exchange gains/losses". Foreign exchange gains and losses relating to the financial assets and liabilities
carried at fair value through profit or loss are presented in the Statement of Comprehensive Income within "Net gains/losses on
investments and derivatives".
(d)(d)(d)(d) Proceeds and payments on allotment and redemption of unitsProceeds and payments on allotment and redemption of unitsProceeds and payments on allotment and redemption of unitsProceeds and payments on allotment and redemption of units
The net asset value per unit is computed for each dealing day. The price at which units are allotted or redeemed is calculated by
reference to the net asset value per unit as at the close of business on the relevant dealing day in accordance with the provisions of the
Fund's Trust Deed dated 14 June 2006, as amended, which may be different from the accounting policies stated in the financial
statements.
(e)(e)(e)(e) TaxationTaxationTaxationTaxation
Deferred income tax is provided, using the liability method, on temporary differences arising between the tax bases of assets and
liabilities and their carrying amounts in the financial statements. However, the deferred income tax is not accounted for if it arises from
initial recognition of an asset or liability in a transaction that at the time of the transaction affects neither accounting nor taxable profit
or loss. Deferred income tax is determined using tax rates (and laws) that have been enacted or substantially enacted by the statement
of financial position date and are expected to apply when the related deferred income tax asset is realized or the deferred income tax
liability is settled.
Deferred income tax assets are recognized to the extent that it is probable that future taxable profit will be available against which the
temporary differences can be utilized.
3333 Number of units in issueNumber of units in issueNumber of units in issueNumber of units in issue and net assets attributable to holders of redeemable units (per unit)and net assets attributable to holders of redeemable units (per unit)and net assets attributable to holders of redeemable units (per unit)and net assets attributable to holders of redeemable units (per unit)
31.3.2013 30.9.2012
Units Units
Number of units in issue 32,101,162.327 29,495,846.482
US$ US$
Net assets attributable to holders of redeemable units 800,814,439 661,807,687
Net assets attributable to holders of redeemable units (per unit) 24.95 22.44

JPMORGAN CHJPMORGAN CHJPMORGAN CHJPMORGAN CHINA PIONEER AINA PIONEER AINA PIONEER AINA PIONEER A----SHARE FUNDSHARE FUNDSHARE FUNDSHARE FUND (Formerly known as JF China Pioneer A(Formerly known as JF China Pioneer A(Formerly known as JF China Pioneer A(Formerly known as JF China Pioneer A----Share Fund)Share Fund)Share Fund)Share Fund)
SemiSemiSemiSemi----annual report for theannual report for theannual report for theannual report for the
period ended 31 March 2013period ended 31 March 2013period ended 31 March 2013period ended 31 March 2013
- 69 -
4444 Net gains on investments and derivativesNet gains on investments and derivativesNet gains on investments and derivativesNet gains on investments and derivatives
1.10.2012
to
31.3.2013
1.10.2011
to
31.3.2012
US$ US$
Change in unrealized gains/losses in value of investments and derivatives 99,748,561 34,478,217
Realized gains/(losses) on sale of investments and derivatives 5,051,668 (27,063,236)
104,800,229 7,414,981
5555 TaxationTaxationTaxationTaxation
The amount of taxation (charged)/reversed to the Statement of Comprehensive Income represents:
1.10.2012
to
31.3.2013
1.10.2011
to
31.3.2012
US$ US$
Withholding tax
- Dividend and interest income (10,598) (43,100)
Capital gains tax (3,186,420) (1,339,585)
Deferred tax liabilities (5,470,461) 863,433
Taxation (8,667,479) (519,252)
The movement in deferred tax liabilities is as follows:
1.10.2012
to
31.3.2013
1.10.2011
to
30.9.2012
US$ US$
At the beginning of the period/year 2,119,791 1,709,726
Deferred tax liabilities charged to the Statement of Comprehensive Income 5,470,461 410,065
At the end of the period/year 7,590,252 2,119,791
The movement in provision for taxation is as follows:
1.10.2012
to
31.3.2013
1.10.2011
to
30.9.2012
US$ US$
At the beginning of the period/year 54,573,272 52,111,126
Taxation charged to the Statement of Comprehensive Income 3,197,018 3,803,614
Tax paid (9,782) (1,341,468)
At the end of the period/year 57,760,508 54,573,272

JPMORGAN CHJPMORGAN CHJPMORGAN CHJPMORGAN CHINA PIONEER AINA PIONEER AINA PIONEER AINA PIONEER A----SHARE FUNDSHARE FUNDSHARE FUNDSHARE FUND (Formerly known as JF China Pioneer A(Formerly known as JF China Pioneer A(Formerly known as JF China Pioneer A(Formerly known as JF China Pioneer A----Share Fund)Share Fund)Share Fund)Share Fund)
SemiSemiSemiSemi----annual report for theannual report for theannual report for theannual report for the
period ended 31 March 2013period ended 31 March 2013period ended 31 March 2013period ended 31 March 2013
- 70 -
(a)(a)(a)(a) The Fund held A-shares of PRC listed companies through the QFII quota of the Investment Manager and certain investment in other PRC
securities. Tax provisioning of 10% is made for PRC sourced dividends and interest. The PRC taxation of gains on PRC securities is
however presently unclear. Under current PRC tax law, a 10% tax may be payable on gains derived from the sale of PRC securities by
foreign investors. Up to the issuance date of these financial statements, it is uncertain as to whether the State Administration of
Taxation ("SAT") will collect this tax in respect of the gains on PRC securities. However, the Manager is of the view that it is possible that
the SAT may start to collect this tax retrospectively from the launch of the Fund. The Manager has assessed the likelihood of such
exposure and has made a provision of US$65,278,221 as at 31 March 2013 (30 September 2012: US$56,621,340) based on its best
estimate of the potential taxation liability and the probability of such gains crystallizing. The Manager estimates that the potential
taxation liability ranges from nil to US$65,278,221 as at 31 March 2013 (30 September 2012: from nil to US$56,621,340). However the
Manager would like to highlight that there is a possibility that some or all of the tax provided as at 31 March 2013 for gains on PRC
securities in the amount of US$65,278,221 (30 September 2012: US$56,621,340) will not be payable and may be released. The Manager
is regularly monitoring the position.
(b)(b)(b)(b) No provision for Hong Kong profits tax has been made as the Fund was authorized as a collective investment scheme under Section 104
of the Securities and Futures Ordinance and is therefore exempt from profits tax under Section 26A(1A) of the Inland Revenue Ordinance.
Overseas withholding tax was charged on certain dividend and interest income received during the period.
6666 Soft commission arrangementsSoft commission arrangementsSoft commission arrangementsSoft commission arrangements
The Investment Manager has entered into soft commission arrangements with brokers under which certain goods and services used to
support investment decision making are received by the Investment Manager. The Investment Manager does not make direct payment for
these services but transacts an agreed amount of business with the brokers on behalf of the Fund. Commission is paid from the Fund on these
transactions.
The goods and services must be of demonstrable benefit to the Fund and may include research and advisory services; economic and political
analysis; portfolio analysis, including valuation and performance measurement; market analysis, data and quotation services, computer
hardware and software incidental to the above goods and services; clearing and custodian services and investment-related publications.
7777 DistributionDistributionDistributionDistribution
No distribution was made during the period (31 March 2012: nil).

JPMORGAN EASTERN FUNDJPMORGAN EASTERN FUNDJPMORGAN EASTERN FUNDJPMORGAN EASTERN FUND (Formerly known as JF Eastern Fund)(Formerly known as JF Eastern Fund)(Formerly known as JF Eastern Fund)(Formerly known as JF Eastern Fund)
SemiSemiSemiSemi----annual report for theannual report for theannual report for theannual report for the
period ended 31 March 2013period ended 31 March 2013period ended 31 March 2013period ended 31 March 2013
- 71 -
Distributor StatusDistributor StatusDistributor StatusDistributor Status
The Fund has been certified by HMRC in the UK as a
distributing fund in respect of the period from 1 January
1984 to 30 September 2010. The principal effect of this
certification is that for unitholders resident or ordinarily
resident in the UK for taxation purposes any gains accruing
on the sale, redemption or other disposal of units during
the period will be taxed in the UK as a capital gain and not
as income. This treatment will continue under the new UK
reporting fund regime provided the Fund does not invest
more than 5% of its assets in other offshore funds which
are not themselves reporting funds. There will be no need
to formally apply for reporting fund status as the Fund is
transparent for UK tax purposes and therefore considered
out of scope of the requirements of this new regime.
As noted, the Fund is transparent for UK income tax
purposes and UK investors are subject to UK capital gains
tax on disposal of their units. UK investors are subject to tax
on their share of income of the Fund on an arising basis.
Information has been provided to UK investors of the
amount of their share of the underlying income, expenses
and overseas tax suffered.
Investment PortfolioInvestment PortfolioInvestment PortfolioInvestment Portfolio
As at 31 March 2013As at 31 March 2013As at 31 March 2013As at 31 March 2013 (Unaudited)(Unaudited)(Unaudited)(Unaudited)
HoldingHoldingHoldingHolding
FairFairFairFair
valuevaluevaluevalue
US$US$US$US$
% of% of% of% of
netnetnetnet
assetsassetsassetsassets
Listed/Quoted InvestmentsListed/Quoted InvestmentsListed/Quoted InvestmentsListed/Quoted Investments (103.3%)
(I) Equities and Warrants(I) Equities and Warrants(I) Equities and Warrants(I) Equities and Warrants (100.3%)
ChinaChinaChinaChina (28.9%)
Agricultural Bank of China 'H' 15,244,000 7,305,196 2.2
Belle Intl Hldgs 1,772,000 2,940,151 0.9
China Construction Bank 'H' 17,374,270 14,190,111 4.2
China Eastern Airlines 'H' 8,128,000 3,518,139 1.0
China Minsheng Banking 'H' 3,708,000 4,724,175 1.4
China National Bldg Material
'H' 1,734,000 2,180,163 0.6
China Oilfield Services 'H' 1,652,000 3,456,098 1.0
China Petroleum & Chemical
'H' 8,252,000 9,694,916 2.9
China Resources Gas Group 2,010,000 5,541,149 1.6
China Resources Land 1,270,000 3,542,025 1.0
China Shipping Development
'H' 3,510,000 1,695,619 0.5
China Vanke 'B' 3,211,120 6,200,806 1.8
CITIC Securities 'H' 881,500 1,900,937 0.6
CNOOC Ltd 1,514,000 2,906,044 0.9
Geely Automobile Hldgs 4,170,000 2,025,198 0.6
Great Wall Motor 'H' 939,000 3,169,253 0.9
Intime Department Store
(Group) 3,259,000 3,694,512 1.1
New China Life Insurance 'H' 637,000 2,162,271 0.6
Ping An Insurance (Group) 'H' 494,000 3,827,829 1.1
Tencent Hldgs 283,000 8,990,203 2.6
Want Want China Hldgs 3,160,000 4,836,080 1.4
(Continued)
HoldingHoldingHoldingHolding
FairFairFairFair
valuevaluevaluevalue
US$US$US$US$
% of% of% of% of
netnetnetnet
assetsassetsassetsassets
Hong KongHong KongHong KongHong Kong (18.8%)
AAC Technologies Hldgs 1,202,500 5,770,339 1.7
AIA Group 2,967,000 12,957,083 3.8
Cheung Kong (Hldgs) 462,000 6,808,603 2.0
Galaxy Entertainment Group 957,000 3,988,193 1.2
Hutchison Whampoa 282,000 2,938,919 0.8
Jardine Matheson Hldgs 74,800 4,869,480 1.4
Lifestyle Intl Hldgs 1,524,000 3,368,932 1.0
New World Dev 2,357,000 3,989,743 1.2
Orient Overseas (Intl) 508,500 3,406,311 1.0
Prada SpA 502,900 5,066,154 1.5
Sands China 939,600 4,853,750 1.4
Wharf (Hldgs) 687,400 6,118,959 1.8
IndiaIndiaIndiaIndia (4.0%)
IDFC Ltd Wts 15/07/13(UBS) 2,339,716 6,164,624 1.8
ING Vysya Bank Wts 26/11/13
(BNP) 725,000 7,430,750 2.2
IndonesiaIndonesiaIndonesiaIndonesia (4.0%)
Astra Intl 2,708,000 2,187,579 0.6
Bank Central Asia 4,201,500 4,734,389 1.4
Matahari Department Store 1,462,500 1,655,518 0.5
Semen Indonesia Persero 1,696,500 3,090,100 0.9
Telekomunikasi Indonesia 'B' 1,904,500 2,126,455 0.6
KoreaKoreaKoreaKorea (19.5%)
Hyundai Heavy Industries 22,200 4,210,138 1.2
Hyundai Mobis 8,700 2,400,593 0.7
Hyundai Motor 31,000 6,227,305 1.8
KB Financial Group 214,000 7,212,835 2.1
KIA Motors 125,000 6,246,630 1.8
LG Chem 7,000 1,682,995 0.5
POSCO 26,400 7,723,531 2.3
Samsung C&T 26,500 1,631,539 0.5
Samsung Electronics 16,725 22,939,375 6.7
Samsung Engineering 34,800 4,066,151 1.2
Shinhan Financial Group 66,000 2,393,583 0.7
MalaysiaMalaysiaMalaysiaMalaysia (0.9%)
SapuraKencana Petroleum 3,122,700 3,025,384 0.9
SingaporeSingaporeSingaporeSingapore (3.9%)
CapitaMalls Asia 2,262,000 3,737,788 1.1
DBS Group Hldgs 407,000 5,232,670 1.5
Noble Group 1,769,000 1,725,367 0.5
United Overseas Bank 155,000 2,546,268 0.8
TaiwanTaiwanTaiwanTaiwan (13.0%)
Advanced Semiconductor Eng 3,043,436 2,493,577 0.7
Cheng Shin Rubber Industry 523,000 1,537,387 0.5
China Steel Chemical 328,000 1,612,440 0.5
Delta Electronics 598,000 2,549,787 0.7
Innolux Corp 5,285,000 3,252,036 1.0
Lite-On Technology 1,078,000 1,737,634 0.5
MediaTek Inc 400,000 4,568,180 1.3
Novatek Microelectronics 572,000 2,477,184 0.7
Ruentex Development 1,585,000 3,228,041 0.9
Taiwan Semiconductor Mfg 4,147,000 13,937,748 4.1
TPK Hldg Co 185,622 3,687,299 1.1
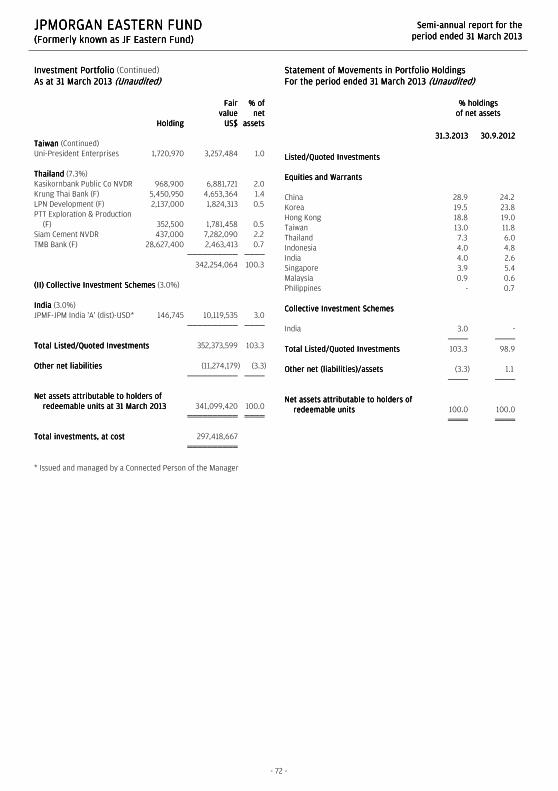
JPMORGAN EASTERN FUNDJPMORGAN EASTERN FUNDJPMORGAN EASTERN FUNDJPMORGAN EASTERN FUND (Formerly known as JF Eastern Fund)(Formerly known as JF Eastern Fund)(Formerly known as JF Eastern Fund)(Formerly known as JF Eastern Fund)
SemiSemiSemiSemi----annual report for theannual report for theannual report for theannual report for the
period ended 31 March 2013period ended 31 March 2013period ended 31 March 2013period ended 31 March 2013
- 72 -
Investment PortfolioInvestment PortfolioInvestment PortfolioInvestment Portfolio (Continued)
As at 31 March 2013As at 31 March 2013As at 31 March 2013As at 31 March 2013 (Unaudited)(Unaudited)(Unaudited)(Unaudited)
HoldingHoldingHoldingHolding
FairFairFairFair
valuevaluevaluevalue
US$US$US$US$
% of% of% of% of
netnetnetnet
assetsassetsassetsassets
TaiwanTaiwanTaiwanTaiwan (Continued)
Uni-President Enterprises 1,720,970 3,257,484 1.0
ThailandThailandThailandThailand (7.3%)
Kasikornbank Public Co NVDR 968,900 6,881,721 2.0
Krung Thai Bank (F) 5,450,950 4,653,364 1.4
LPN Development (F) 2,137,000 1,824,313 0.5
PTT Exploration & Production
(F) 352,500 1,781,458 0.5
Siam Cement NVDR 437,000 7,282,090 2.2
TMB Bank (F) 28,627,400 2,463,413 0.7
342,254,064 100.3
(II) Collective Investment Schemes(II) Collective Investment Schemes(II) Collective Investment Schemes(II) Collective Investment Schemes (3.0%)
IndiaIndiaIndiaIndia (3.0%)
JPMF-JPM India 'A' (dist)-USD* 146,745 10,119,535 3.0
Total Listed/Quoted InvestmentsTotal Listed/Quoted InvestmentsTotal Listed/Quoted InvestmentsTotal Listed/Quoted Investments 352,373,599 103.3
Other net Other net Other net Other net liabilitiesliabilitiesliabilitiesliabilities (11,274,179) (3.3)
Net assets attributable to holders of Net assets attributable to holders of Net assets attributable to holders of Net assets attributable to holders of
redeemable units at 31 March 2013redeemable units at 31 March 2013redeemable units at 31 March 2013redeemable units at 31 March 2013 341,099,420 100.0
Total investments, at costTotal investments, at costTotal investments, at costTotal investments, at cost 297,418,667
* Issued and managed by a Connected Person of the Manager
Statement of Movements in Portfolio HoldingsStatement of Movements in Portfolio HoldingsStatement of Movements in Portfolio HoldingsStatement of Movements in Portfolio Holdings
For the period ended 31 March 2013For the period ended 31 March 2013For the period ended 31 March 2013For the period ended 31 March 2013 (Unaudited)(Unaudited)(Unaudited)(Unaudited)
% holdings% holdings% holdings% holdings
of net assetsof net assetsof net assetsof net assets
31.3.201331.3.201331.3.201331.3.2013 30.9.201230.9.201230.9.201230.9.2012
Listed/Quoted InvestmentsListed/Quoted InvestmentsListed/Quoted InvestmentsListed/Quoted Investments
Equities and WarrantsEquities and WarrantsEquities and WarrantsEquities and Warrants
China 28.9 24.2
Korea 19.5 23.8
Hong Kong 18.8 19.0
Taiwan 13.0 11.8
Thailand 7.3 6.0
Indonesia 4.0 4.8
India 4.0 2.6
Singapore 3.9 5.4
Malaysia 0.9 0.6
Philippines - 0.7
Collective Investment SchemesCollective Investment SchemesCollective Investment SchemesCollective Investment Schemes
India 3.0 -
Total Listed/Quoted Total Listed/Quoted Total Listed/Quoted Total Listed/Quoted InvestmentsInvestmentsInvestmentsInvestments 103.3 98.9
Other net (liabilities)/assetsOther net (liabilities)/assetsOther net (liabilities)/assetsOther net (liabilities)/assets (3.3) 1.1
Net assets attributable to holders of Net assets attributable to holders of Net assets attributable to holders of Net assets attributable to holders of
redeemable unitsredeemable unitsredeemable unitsredeemable units 100.0 100.0
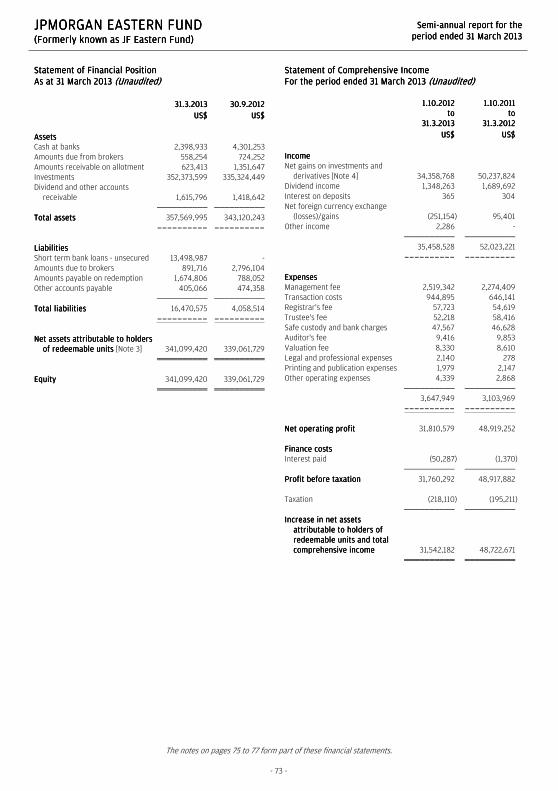
JPMORGAN EASTERN FUNDJPMORGAN EASTERN FUNDJPMORGAN EASTERN FUNDJPMORGAN EASTERN FUND (Formerly known as JF Eastern Fund)(Formerly known as JF Eastern Fund)(Formerly known as JF Eastern Fund)(Formerly known as JF Eastern Fund)
SemiSemiSemiSemi----annual report for theannual report for theannual report for theannual report for the
period ended 31 March 2013period ended 31 March 2013period ended 31 March 2013period ended 31 March 2013
The notes on pages 75 to 77 form part of these financial statements.
- 73 -
Statement of Financial PositionStatement of Financial PositionStatement of Financial PositionStatement of Financial Position
As at 31 March 2013As at 31 March 2013As at 31 March 2013As at 31 March 2013 (Unaudited)(Unaudited)(Unaudited)(Unaudited)
31.3.201331.3.201331.3.201331.3.2013 30.9.201230.9.201230.9.201230.9.2012
US$US$US$US$ US$US$US$US$
AssetsAssetsAssetsAssets
Cash at banks 2,398,933 4,301,253
Amounts due from brokers 558,254 724,252
Amounts receivable on allotment 623,413 1,351,647
Investments 352,373,599 335,324,449
Dividend and other accounts
receivable 1,615,796 1,418,642
Total assetsTotal assetsTotal assetsTotal assets 357,569,995 343,120,243
---------- ----------
LiabilitiesLiabilitiesLiabilitiesLiabilities
Short term bank loans - unsecured 13,498,987 -
Amounts due to brokers 891,716 2,796,104
Amounts payable on redemption 1,674,806 788,052
Other accounts payable 405,066 474,358
Total liabilitiesTotal liabilitiesTotal liabilitiesTotal liabilities 16,470,575 4,058,514
---------- ----------
Net assets attributable to holders Net assets attributable to holders Net assets attributable to holders Net assets attributable to holders
of redeemable units of redeemable units of redeemable units of redeemable units [Note 3] 341,099,420 339,061,729
EquityEquityEquityEquity 341,099,420 339,061,729
Statement of Comprehensive IncomeStatement of Comprehensive IncomeStatement of Comprehensive IncomeStatement of Comprehensive Income
For the period ended 31 March 2013For the period ended 31 March 2013For the period ended 31 March 2013For the period ended 31 March 2013 (Unaudited)(Unaudited)(Unaudited)(Unaudited)
1.10.20121.10.20121.10.20121.10.2012
totototo
31.3.201331.3.201331.3.201331.3.2013
1.10.20111.10.20111.10.20111.10.2011
totototo
31.3.201231.3.201231.3.201231.3.2012
US$US$US$US$ US$US$US$US$
IncomeIncomeIncomeIncome
Net gains on investments and
derivatives [Note 4] 34,358,768 50,237,824
Dividend income 1,348,263 1,689,692
Interest on deposits 365 304
Net foreign currency exchange
(losses)/gains (251,154) 95,401
Other income 2,286 -
35,458,528 52,023,221
---------- ----------
ExpensesExpensesExpensesExpenses
Management fee 2,519,342 2,274,409
Transaction costs 944,895 646,141
Registrar's fee 57,723 54,619
Trustee's fee 52,218 58,416
Safe custody and bank charges 47,567 46,628
Auditor's fee 9,416 9,853
Valuation fee 8,330 8,610
Legal and professional expenses 2,140 278
Printing and publication expenses 1,979 2,147
Other operating expenses 4,339 2,868
3,647,949 3,103,969
---------- ----------
Net operating profitNet operating profitNet operating profitNet operating profit 31,810,579 48,919,252
Finance costsFinance costsFinance costsFinance costs
Interest paid (50,287) (1,370)
Profit before taxationProfit before taxationProfit before taxationProfit before taxation 31,760,292 48,917,882
Taxation (218,110) (195,211)
Increase in net assets Increase in net assets Increase in net assets Increase in net assets
attributable to holders of attributable to holders of attributable to holders of attributable to holders of
redeemable units and total redeemable units and total redeemable units and total redeemable units and total
comprehensive incomecomprehensive incomecomprehensive incomecomprehensive income 31,542,182 48,722,671

JPMORGAN EASTERN FUNDJPMORGAN EASTERN FUNDJPMORGAN EASTERN FUNDJPMORGAN EASTERN FUND (Formerly known as JF Eastern Fund)(Formerly known as JF Eastern Fund)(Formerly known as JF Eastern Fund)(Formerly known as JF Eastern Fund)
SemiSemiSemiSemi----annual report for theannual report for theannual report for theannual report for the
period ended 31 March 2013period ended 31 March 2013period ended 31 March 2013period ended 31 March 2013
The notes on pages 75 to 77 form part of these financial statements.
- 74 -
Statement of Changes in Net Assets Attributable to Holders Statement of Changes in Net Assets Attributable to Holders Statement of Changes in Net Assets Attributable to Holders Statement of Changes in Net Assets Attributable to Holders
of Redeemable Unitsof Redeemable Unitsof Redeemable Unitsof Redeemable Units
For the period ended 31 March 2013For the period ended 31 March 2013For the period ended 31 March 2013For the period ended 31 March 2013 (Unaudited)(Unaudited)(Unaudited)(Unaudited)
1.10.20121.10.20121.10.20121.10.2012
totototo
31.3.201331.3.201331.3.201331.3.2013
1.10.20111.10.20111.10.20111.10.2011
totototo
31.3.201231.3.201231.3.201231.3.2012
US$US$US$US$ US$US$US$US$
Net assets attributable to Net assets attributable to Net assets attributable to Net assets attributable to holders holders holders holders
of redeemable units at the of redeemable units at the of redeemable units at the of redeemable units at the
beginning of the periodbeginning of the periodbeginning of the periodbeginning of the period 339,061,729 297,622,221
---------- ----------
Allotment of redeemable units 20,694,115 23,272,258
Redemption of redeemable units (50,198,606) (30,548,517)
NetNetNetNet redemptionredemptionredemptionredemption (29,504,491) (7,276,259)
---------- ----------
309,557,238 290,345,962
Increase in net assets Increase in net assets Increase in net assets Increase in net assets
attributable to holders of attributable to holders of attributable to holders of attributable to holders of
redeemable units and total redeemable units and total redeemable units and total redeemable units and total
comprehensive incomecomprehensive incomecomprehensive incomecomprehensive income 31,542,182 48,722,671
Net assets Net assets Net assets Net assets attributable to holders attributable to holders attributable to holders attributable to holders
of redeemable units at the end of redeemable units at the end of redeemable units at the end of redeemable units at the end
of the periodof the periodof the periodof the period 341,099,420 339,068,633
Statement of Cash FlowsStatement of Cash FlowsStatement of Cash FlowsStatement of Cash Flows
For the period ended 31 March 2013For the period ended 31 March 2013For the period ended 31 March 2013For the period ended 31 March 2013 (Unaudited)(Unaudited)(Unaudited)(Unaudited)
1.10.20121.10.20121.10.20121.10.2012
totototo
31.3.201331.3.201331.3.201331.3.2013
1.10.20111.10.20111.10.20111.10.2011
totototo
31.3.201231.3.201231.3.201231.3.2012
US$US$US$US$ US$US$US$US$
Operating activitiesOperating activitiesOperating activitiesOperating activities
Purchase of investments and
derivatives (180,384,694) (133,957,236)
Proceeds from disposal of
investments and derivatives 196,150,581 136,237,684
Dividend received 959,698 1,403,671
Interest received 353 304
Trustee's fee paid (51,931) (62,233)
Registrar's fee paid (108,168) (111,439)
Tax paid (218,110) (195,211)
Transaction costs paid (952,247) (663,602)
Management fee paid (2,514,185) (2,263,075)
Others (333,082) (12,476)
Net cash inflow from Net cash inflow from Net cash inflow from Net cash inflow from operating operating operating operating
activitiesactivitiesactivitiesactivities 12,548,215 376,387
---------- ----------
Financing activitiesFinancing activitiesFinancing activitiesFinancing activities
Interest paid (49,087) (1,335)
Receipts on allotment of
redeemable units 21,422,349 23,008,463
Payments on redemption of
redeemable units (49,311,852) (30,647,187)
Net cash outflow from Net cash outflow from Net cash outflow from Net cash outflow from
financing activitiesfinancing activitiesfinancing activitiesfinancing activities (27,938,590) (7,640,059)
---------- ----------
Decrease in cash and cash Decrease in cash and cash Decrease in cash and cash Decrease in cash and cash
equivalentsequivalentsequivalentsequivalents (15,390,375) (7,263,672)
Cash and cash equivalents at the
beginning of the period 4,301,253 7,097,495
Exchange (losses)/gains on cash
and cash equivalents (10,932) 15,355
Cash and cash equivalents at Cash and cash equivalents at Cash and cash equivalents at Cash and cash equivalents at
the end of the periodthe end of the periodthe end of the periodthe end of the period (11,100,054) (150,822)
Analysis of balances of cash and cash Analysis of balances of cash and cash Analysis of balances of cash and cash Analysis of balances of cash and cash equivalents:equivalents:equivalents:equivalents:
Cash at banks 2,398,933 749,242
Short term bank loans -
unsecured (13,498,987) (900,064)
(11,100,054) (150,822)

JPMORGAN EASTERN FUNDJPMORGAN EASTERN FUNDJPMORGAN EASTERN FUNDJPMORGAN EASTERN FUND (Formerly known as JF Eastern Fund)(Formerly known as JF Eastern Fund)(Formerly known as JF Eastern Fund)(Formerly known as JF Eastern Fund)
SemiSemiSemiSemi----annual report for theannual report for theannual report for theannual report for the
period ended 31 March 2013period ended 31 March 2013period ended 31 March 2013period ended 31 March 2013
- 75 -
Notes to the Financial StatementsNotes to the Financial StatementsNotes to the Financial StatementsNotes to the Financial Statements
1111 The FundThe FundThe FundThe Fund
JPMorgan Eastern Fund (the "Fund") was established under a Trust Deed dated 20 January 1971, as amended, and is governed by the laws of
Hong Kong. The Fund is authorized by the Securities and Futures Commission of Hong Kong.
With effect from 4 February 2013, the name of the Fund was changed from JF Eastern Fund to JPMorgan Eastern Fund.
The investment objective of the Fund is to provide investors with long-term capital growth by investing primarily in the securities of
companies in the Asia-Pacific region, excluding Japan and Australia except the Manager may, from time to time, invest in Japan and Australia
when appropriate investment opportunities arise.
Pursuant to the Supplemental Trust Deed dated 4 January 2013, the Manager may decide to issue separate classes (each a "Class") whose
assets will be commonly invested but where a specific fee structure, currency or distribution policy may be applied. Each Class may have a
different charging structure with the result that the net asset value attributable to each Class may differ.
All unitholders' rights with regard to the convening, voting or otherwise acting at any meeting of unitholders are the same.
2222 Summary of principal accounting policiesSummary of principal accounting policiesSummary of principal accounting policiesSummary of principal accounting policies
(a)(a)(a)(a) Accounting policies of interim financial statementsAccounting policies of interim financial statementsAccounting policies of interim financial statementsAccounting policies of interim financial statements
The accounting policies and methods of computation used in the preparation of these unaudited condensed interim financial statements
are consistent with those used in the annual financial statements for the year ended 30 September 2012.
(b)(b)(b)(b) Investments and derivatives Investments and derivatives Investments and derivatives Investments and derivatives
Classification
The Fund classifies its investments and derivatives as financial assets or financial liabilities at fair value through profit or loss. These
financial assets or financial liabilities are held-for-trading as they are acquired or incurred principally for the purpose of selling or
repurchasing in the near term or short-term profit taking.
All derivatives are carried in assets when amounts are receivable by the Fund and in liabilities when amounts are payable by the Fund.
The Fund makes short sales in which a borrowed security is sold in anticipation of a decline in the market value of that security, or it may
use short sales for various arbitrage transactions. Short sales are classified as financial liabilities at fair value through profit or loss.
Recognition, derecognition and measurement
Purchases and sales of investments and derivatives are accounted for on the trade date basis. Investments and derivatives are initially
recognized at fair value and are subsequently re-measured at fair value. Realized and unrealized gains and losses on investments and
derivatives are recognized in the Statement of Comprehensive Income. Investments and derivatives are derecognized when the rights to
receive cash flows from the investments and derivatives have expired or the Fund has transferred substantially all risks and rewards of
ownership.
Fair value estimation
Investments that are listed or traded on an exchange and investments with prices quoted in over-the-counter markets or by market
makers, are fair valued based on quoted "bid" prices on long investments and quoted "ask" prices on investments sold short. When
trading in the securities of an investee company is suspended, the investment is valued at the Manager's estimate of its fair value.
Debt securities are fair valued based on quoted prices inclusive of accrued interest.
Investments in collective investment schemes are stated at fair value based on the net asset value per unit of the respective funds as
determined by the administrators of the relevant funds or stated at "bid" prices if the collective investment schemes are listed or traded
on an exchange.
Open future and swap contracts are valued at "bid" prices for long positions and "ask" prices for short positions at the valuation date.
The differences between the bid/ask prices and the contract prices are recognized in the Statement of Comprehensive Income.
Open option contracts are valued at "bid" prices for long positions and "ask" prices for short positions at the valuation date. The
differences between the bid/ask prices and the premium amounts/contract prices are recognized in the Statement of Comprehensive
Income.

JPMORGAN EASTERN FUNDJPMORGAN EASTERN FUNDJPMORGAN EASTERN FUNDJPMORGAN EASTERN FUND (Formerly known as JF Eastern Fund)(Formerly known as JF Eastern Fund)(Formerly known as JF Eastern Fund)(Formerly known as JF Eastern Fund)
SemiSemiSemiSemi----annual report for theannual report for theannual report for theannual report for the
period ended 31 March 2013period ended 31 March 2013period ended 31 March 2013period ended 31 March 2013
- 76 -
Forward foreign exchange contracts are valued at the forward rates ruling at the valuation date. The differences between the forward
rates and the contract rates are recognized in the Statement of Comprehensive Income.
(c)(c)(c)(c) SeSeSeSecurities borrowingcurities borrowingcurities borrowingcurities borrowing
The Fund may enter into securities borrowing arrangements for short sale purposes. Short positions represent obligations to deliver
securities sold but not yet purchased, and are accounted for as investments and valued at their fair value. Securities borrowed during the
period/year are off-balance sheet transactions and are therefore not included in the investment portfolio of the Fund. Collateral placed
for the purpose of securities borrowed generally consist of cash collateral and are included in the Statement of Financial Position
separately.
(d)(d)(d)(d) Foreign currency translationForeign currency translationForeign currency translationForeign currency translation
Functional and presentation currency
The Fund has adopted United States dollar as its functional and presentation currency.
Transactions and balances
Foreign currency transactions are translated into the functional currency using the exchange rates prevailing at the dates of the
transactions.
Foreign exchange gains and losses resulting from the settlement of such transactions and from the translation of assets and liabilities
denominated in foreign currencies at period/year end exchange rates are recognized in the Statement of Comprehensive Income.
Foreign exchange gains and losses relating to cash and cash equivalents are presented in the Statement of Comprehensive Income
within "Net foreign currency exchange gains/losses". Foreign exchange gains and losses relating to the financial assets and liabilities
carried at fair value through profit or loss are presented in the Statement of Comprehensive Income within "Net gains/losses on
investments and derivatives".
(e)(e)(e)(e) Proceeds and payments on allotment and redemption of unitsProceeds and payments on allotment and redemption of unitsProceeds and payments on allotment and redemption of unitsProceeds and payments on allotment and redemption of units
The net asset value per unit is computed for each dealing day. The price at which units are allotted or redeemed is calculated by
reference to the net asset value per unit as at the close of business on the relevant dealing day in accordance with the provisions of the
Fund's Trust Deed dated 20 January 1971, as amended, which may be different from the accounting policies stated in the financial
statements.
3333 NNNNumber of units in issue and net assets attributable to holders of redeemable units (per unit)umber of units in issue and net assets attributable to holders of redeemable units (per unit)umber of units in issue and net assets attributable to holders of redeemable units (per unit)umber of units in issue and net assets attributable to holders of redeemable units (per unit)
31.3.2013 30.9.2012
Units Units
Number of units in issue 1,247,406.990 1,357,716.580
US$ US$
Net assets attributable to holders of redeemable units 341,099,420 339,061,729
Net assets attributable to holders of redeemable units (per unit) 273.45 249.73
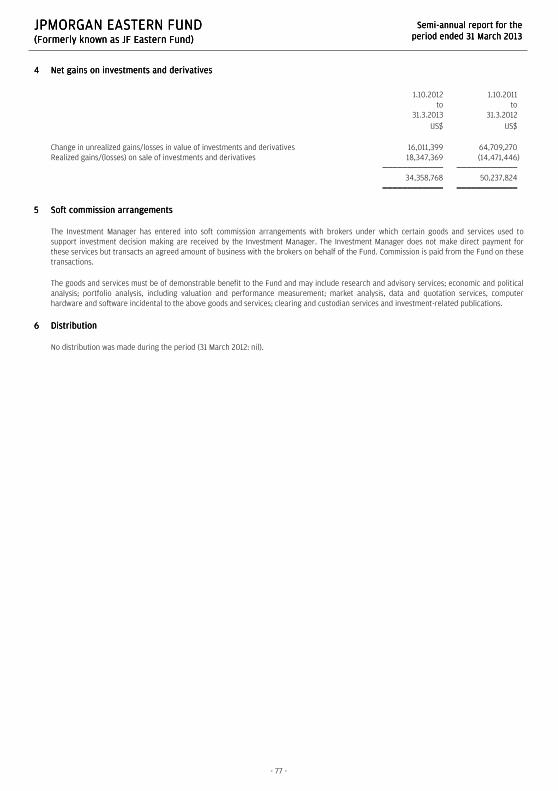
JPMORGAN EASTERN FUNDJPMORGAN EASTERN FUNDJPMORGAN EASTERN FUNDJPMORGAN EASTERN FUND (Formerly known as JF Eastern Fund)(Formerly known as JF Eastern Fund)(Formerly known as JF Eastern Fund)(Formerly known as JF Eastern Fund)
SemiSemiSemiSemi----annual report for theannual report for theannual report for theannual report for the
period ended 31 March 2013period ended 31 March 2013period ended 31 March 2013period ended 31 March 2013
- 77 -
4444 Net gains on investments and derivatives Net gains on investments and derivatives Net gains on investments and derivatives Net gains on investments and derivatives
1.10.2012
to
31.3.2013
1.10.2011
to
31.3.2012
US$ US$
Change in unrealized gains/losses in value of investments and derivatives 16,011,399 64,709,270
Realized gains/(losses) on sale of investments and derivatives 18,347,369 (14,471,446)
34,358,768 50,237,824
5555 Soft commission arrangementsSoft commission arrangementsSoft commission arrangementsSoft commission arrangements
The Investment Manager has entered into soft commission arrangements with brokers under which certain goods and services used to
support investment decision making are received by the Investment Manager. The Investment Manager does not make direct payment for
these services but transacts an agreed amount of business with the brokers on behalf of the Fund. Commission is paid from the Fund on these
transactions.
The goods and services must be of demonstrable benefit to the Fund and may include research and advisory services; economic and political
analysis; portfolio analysis, including valuation and performance measurement; market analysis, data and quotation services, computer
hardware and software incidental to the above goods and services; clearing and custodian services and investment-related publications.
6666 Distribution Distribution Distribution Distribution
No distribution was made during the period (31 March 2012: nil).

JPMORGAN EASTERN SMALLER COMPANIES FUNDJPMORGAN EASTERN SMALLER COMPANIES FUNDJPMORGAN EASTERN SMALLER COMPANIES FUNDJPMORGAN EASTERN SMALLER COMPANIES FUND (Formerly known as JF Eastern Smaller Companies Fund)(Formerly known as JF Eastern Smaller Companies Fund)(Formerly known as JF Eastern Smaller Companies Fund)(Formerly known as JF Eastern Smaller Companies Fund)
SemiSemiSemiSemi----annual report for theannual report for theannual report for theannual report for the
period ended 31 March 2013period ended 31 March 2013period ended 31 March 2013period ended 31 March 2013
- 78 -
Distributor StatusDistributor StatusDistributor StatusDistributor Status
The Fund has been certified by HMRC in the UK as a
distributing fund in respect of the period from 2 December
1991 to 30 September 2010. The principal effect of this
certification is that for unitholders resident or ordinarily
resident in the UK for taxation purposes any gains accruing
on the sale, redemption or other disposal of units during
the period will be taxed in the UK as a capital gain and not
as income. This treatment will continue under the new UK
reporting fund regime provided the Fund does not invest
more than 5% of its assets in other offshore funds which
are not themselves reporting funds. There will be no need
to formally apply for reporting fund status as the Fund is
transparent for UK tax purposes and therefore considered
out of scope of the requirements of this new regime.
As noted, the Fund is transparent for UK income tax
purposes and UK investors are subject to UK capital gains
tax on disposal of their units. UK investors are subject to tax
on their share of income of the Fund on an arising basis.
Information has been provided to UK investors of the
amount of their share of the underlying income, expenses
and overseas tax suffered.
Investment PortfolioInvestment PortfolioInvestment PortfolioInvestment Portfolio
As at 31 March 2013As at 31 March 2013As at 31 March 2013As at 31 March 2013 (Unaudited)(Unaudited)(Unaudited)(Unaudited)
HoldingHoldingHoldingHolding
FairFairFairFair
valuevaluevaluevalue
US$US$US$US$
% of% of% of% of
netnetnetnet
assetsassetsassetsassets
Listed/Quoted InvestmentsListed/Quoted InvestmentsListed/Quoted InvestmentsListed/Quoted Investments (98.6%)
EquitiesEquitiesEquitiesEquities (98.6%)
ChinaChinaChinaChina (17.3%)
Anhui Conch Cement 'H' 658,000 2,182,695 0.8
Anta Sports Products 838,000 715,727 0.3
Central China Real Estate
Hldgs 4,199,000 1,346,900 0.5
China National Bldg Material
'H' 1,646,000 2,069,520 0.8
China Resources Cement Hldgs 1,266,000 714,328 0.3
China Resources Land 530,000 1,478,168 0.5
China Shanshui Cement Group 2,216,000 1,270,339 0.5
China State Construction Intl 3,370,000 4,584,414 1.7
CITIC Telecom Intl 3,540,000 1,317,926 0.5
Geely Automobile Hldgs 5,125,000 2,489,002 0.9
Goodbaby Intl Hldgs 842,000 494,615 0.2
Haitian Intl Hldgs 933,000 1,451,906 0.5
Hengan Intl Group 265,000 2,587,647 1.0
KWG Property Hldg 2,991,500 1,869,049 0.7
Minmetals Land 9,604,000 1,373,299 0.5
Minth Group 3,542,000 5,201,677 2.0
Poly Property Group 3,610,000 2,274,082 0.9
REXLot Hldgs 18,100,000 1,562,224 0.6
Sunny Optical Technology
Group 1,551,000 1,790,234 0.7
Towngas China 8,150,000 7,485,782 2.8
West China Cement 9,042,000 1,479,307 0.6
Hong KongHong KongHong KongHong Kong (13.8%)
Chow Sang Sang Hldgs 298,000 875,268 0.3
(Continued)
HoldingHoldingHoldingHolding
FairFairFairFair
valuevaluevaluevalue
US$US$US$US$
% of% of% of% of
netnetnetnet
assetsassetsassetsassets
Emperor Watch & Jewellery 26,000,000 2,612,510 1.0
Lifestyle Intl Hldgs 542,500 1,199,243 0.5
Luk Fook Hldgs Intl 411,000 1,305,115 0.5
Man Wah Hldgs 4,466,000 4,257,361 1.6
Midland Hldgs 1,778,000 783,336 0.3
Samson Hldg 7,542,000 1,428,216 0.5
Samsonite Intl 766,200 1,912,872 0.7
SCMP Group 6,454,000 1,621,263 0.6
Techtronic Industries 4,640,500 11,298,391 4.3
Trinity Ltd 4,746,000 2,408,873 0.9
Tsui Wah Hldgs 2,618,000 1,315,298 0.5
VTech Hldgs 304,900 3,717,646 1.4
Xinyi Glass Hldgs 2,534,000 1,785,599 0.7
IndiaIndiaIndiaIndia (15.5%)
Bata India 68,911 906,303 0.3
Cummins India 151,089 1,362,164 0.5
Development Credit Bank 1,834,941 1,451,747 0.6
Eicher Motors 85,201 3,989,633 1.5
Exide Industries 1,422,330 3,383,758 1.3
Godrej Industries 596,947 3,197,264 1.2
Gujarat Pipavav Port 2,146,952 1,961,291 0.7
IDFC Ltd 648,479 1,708,596 0.6
IndusInd Bank 760,779 5,643,902 2.1
ING Vysya Bank 403,438 4,134,961 1.6
JK Lakshmi Cement 411,250 733,970 0.3
Mahindra & Mah Fin PN
15/9/16 (JPM)* 143,237 513,914 0.2
Mahindra & Mah Fin PN 2/17
(1)(JPM)* 41,568 149,140 0.1
Mahindra & Mah Fin PN 2/17
(2)(JPM)* 739,220 2,652,215 1.0
PI Industries 75,000 874,678 0.3
Shree Cement 48,704 3,606,874 1.4
Shriram Transport Finance 242,358 3,090,901 1.2
Whirlpool Of India 391,146 1,590,492 0.6
IndonesiaIndonesiaIndonesiaIndonesia (6.6%)
Bank Pembangunan Daerah
Jawa Timur 30,033,000 1,576,211 0.6
Express Transindo Utama 15,235,500 1,520,806 0.6
Hero Supermarket 2,398,500 1,203,261 0.4
Hexindo Adiperkasa 3,344,500 1,927,368 0.7
Holcim Indonesia 1,899,500 698,813 0.3
Indosiar Karya Media 22,716,500 2,968,866 1.1
Matahari Department Store 1,028,500 1,164,240 0.4
Midi Utama Indonesia 10,538,000 791,638 0.3
Modern Intl 16,445,903 1,675,477 0.6
Surya Citra Media 10,060,500 2,795,302 1.1
Total Bangun Persada 11,924,500 1,263,930 0.5
KoreaKoreaKoreaKorea (10.2%)
ABLE C&C 28,030 2,166,619 0.8
CJ Hellovision 55,000 766,223 0.3
Com2us Corp 11,383 526,896 0.2
Dongsuh Co 299,263 6,536,123 2.5
Gamevil Inc 22,685 2,059,307 0.8
Golfzon Co 24,383 1,378,474 0.5
Grand Korea Leisure 46,980 1,363,881 0.5
GS Engineering & Construction 11,040 548,726 0.2

JPMORGAN EASTERN SMALLER COMPANIES FUNDJPMORGAN EASTERN SMALLER COMPANIES FUNDJPMORGAN EASTERN SMALLER COMPANIES FUNDJPMORGAN EASTERN SMALLER COMPANIES FUND (Formerly known as JF Eastern Smaller Companies Fund)(Formerly known as JF Eastern Smaller Companies Fund)(Formerly known as JF Eastern Smaller Companies Fund)(Formerly known as JF Eastern Smaller Companies Fund)
SemiSemiSemiSemi----annual report for theannual report for theannual report for theannual report for the
period ended 31 March 2013period ended 31 March 2013period ended 31 March 2013period ended 31 March 2013
- 79 -
Investment PortfolioInvestment PortfolioInvestment PortfolioInvestment Portfolio (Continued)
As at 31 March 2013As at 31 March 2013As at 31 March 2013As at 31 March 2013 (Unaudited)(Unaudited)(Unaudited)(Unaudited)
HoldingHoldingHoldingHolding
FairFairFairFair
valuevaluevaluevalue
US$US$US$US$
% of% of% of% of
netnetnetnet
assetsassetsassetsassets
KoreaKoreaKoreaKorea (Continued)
Halla Climate Control 110,210 2,753,764 1.0
iMarketKorea Inc 64,170 1,470,731 0.6
Interpark Corp 82,081 593,143 0.2
Osstem Implant Co 94,636 2,840,951 1.1
Seegene Inc 22,626 1,421,497 0.5
Shinsegae Food 31,724 2,631,786 1.0
PhilippinesPhilippinesPhilippinesPhilippines (3.3%)
ABS-CBN Hldgs PDR 1,340,200 1,349,724 0.5
GT Capital Hldgs 31,458 565,026 0.2
Philippine Seven 727,000 1,567,655 0.6
Puregold Price Club 4,142,000 4,059,789 1.5
Universal Robina 420,820 1,165,221 0.5
SingaporeSingaporeSingaporeSingapore (7.3%)
AIMS AMP Capital Ind REIT 1,414,000 1,789,441 0.7
Cache Logistics 1,391,000 1,457,601 0.5
China Minzhong Food 10,441,000 10,099,308 3.8
Frasers Centrepoint 876,000 1,496,953 0.6
Frasers Commercial Trust 1,567,000 1,762,022 0.7
Jardine Cycle & Carriage 68,000 2,801,451 1.0
TaiwanTaiwanTaiwanTaiwan (15.1%)
Basso Industry 1,197,000 794,597 0.3
Chailease Hldg 769,000 2,131,932 0.8
Chailease Hldg GDR-RegS 348,591 4,841,929 1.8
Chicony Electronics 534,000 1,405,428 0.5
China Life Insurance 2,109,000 2,115,877 0.8
China Steel Chemical 294,000 1,445,297 0.6
Chipbond Technology 3,083,000 6,949,059 2.6
GeoVision Inc 671,558 2,908,344 1.1
Globe Union Industrial 2,648,000 1,359,311 0.5
Gourmet Master 390,500 2,193,930 0.8
Himax Technologies ADR 210,991 1,145,681 0.5
Largan Precision 22,000 573,865 0.2
Novatek Microelectronics 348,000 1,507,098 0.6
PCHome Online 294,950 1,272,420 0.5
Prince Housing &
Development 2,890,932 2,054,420 0.8
Rotam Global Agrosciences 428,000 1,047,725 0.4
Ruentex Development 2,084,000 4,244,314 1.6
Shin Zu Shing 638,000 1,933,042 0.7
ThailandThailandThailandThailand (9.5%)
Central Plaza Hotel (F) 682,300 902,821 0.4
Hemaraj Land & Dev (F) 27,773,800 4,021,202 1.5
Land & Houses NVDR 5,423,700 2,370,612 0.9
LPN Development (F) 3,408,300 2,909,595 1.1
Quality Houses (F) 8,947,500 1,356,561 0.5
Robinson Department Store
(F) 399,500 1,029,956 0.4
Sansiri Public Co (F) 13,337,800 2,177,042 0.8
Siam City Cement (F) 276,600 4,571,432 1.7
Sino Thai Eng & Construction
(F)-AC 679,400 666,988 0.3
Thai Tap Water Supply (F) 6,588,100 2,452,118 0.9
Thai Union Frozen Products (F) 610,400 1,328,769 0.5
TPI Polene (F) 2,636,300 1,422,351 0.5
(Continued)
HoldingHoldingHoldingHolding
FairFairFairFair
valuevaluevaluevalue
US$US$US$US$
% of% of% of% of
netnetnetnet
assetsassetsassetsassets
Total Listed/Quoted InvestmentsTotal Listed/Quoted InvestmentsTotal Listed/Quoted InvestmentsTotal Listed/Quoted Investments 261,103,575 98.6
Other net assetsOther net assetsOther net assetsOther net assets 3,729,836 1.4
Net assets attributable Net assets attributable Net assets attributable Net assets attributable to holders of to holders of to holders of to holders of
redeemable units at 31 March 2013redeemable units at 31 March 2013redeemable units at 31 March 2013redeemable units at 31 March 2013 264,833,411 100.0
Total investments, at costTotal investments, at costTotal investments, at costTotal investments, at cost 217,009,398
* Issued by a Connected Person of the Manager

JPMORGAN EASTERN SMALLER COMPANIES FUNDJPMORGAN EASTERN SMALLER COMPANIES FUNDJPMORGAN EASTERN SMALLER COMPANIES FUNDJPMORGAN EASTERN SMALLER COMPANIES FUND (Formerly known as JF Eastern Smaller Companies Fund)(Formerly known as JF Eastern Smaller Companies Fund)(Formerly known as JF Eastern Smaller Companies Fund)(Formerly known as JF Eastern Smaller Companies Fund)
SemiSemiSemiSemi----annual report for theannual report for theannual report for theannual report for the
period ended 31 March 2013period ended 31 March 2013period ended 31 March 2013period ended 31 March 2013
- 80 -
Statement of Movements in Portfolio HoldingsStatement of Movements in Portfolio HoldingsStatement of Movements in Portfolio HoldingsStatement of Movements in Portfolio Holdings
For the period For the period For the period For the period ended 31 March 2013ended 31 March 2013ended 31 March 2013ended 31 March 2013 (Unaudited)(Unaudited)(Unaudited)(Unaudited)
% holdings% holdings% holdings% holdings
of net assetsof net assetsof net assetsof net assets
31.3.201331.3.201331.3.201331.3.2013 30.9.201230.9.201230.9.201230.9.2012
Listed/Quoted InvestmentsListed/Quoted InvestmentsListed/Quoted InvestmentsListed/Quoted Investments
EquitiesEquitiesEquitiesEquities
China 17.3 21.4
India 15.5 12.8
Taiwan 15.1 13.6
Hong Kong 13.8 7.7
Korea 10.2 11.1
Thailand 9.5 13.0
Singapore 7.3 6.3
Indonesia 6.6 9.3
Philippines 3.3 4.4
Australia - 1.9
Malaysia - 0.5
Total Listed/Quoted InvestmentsTotal Listed/Quoted InvestmentsTotal Listed/Quoted InvestmentsTotal Listed/Quoted Investments 98.6 102.0
Other net assets/(liabilities)Other net assets/(liabilities)Other net assets/(liabilities)Other net assets/(liabilities) 1.4 (2.0)
Net assets attributable to holders of Net assets attributable to holders of Net assets attributable to holders of Net assets attributable to holders of
redeemable unitsredeemable unitsredeemable unitsredeemable units 100.0 100.0
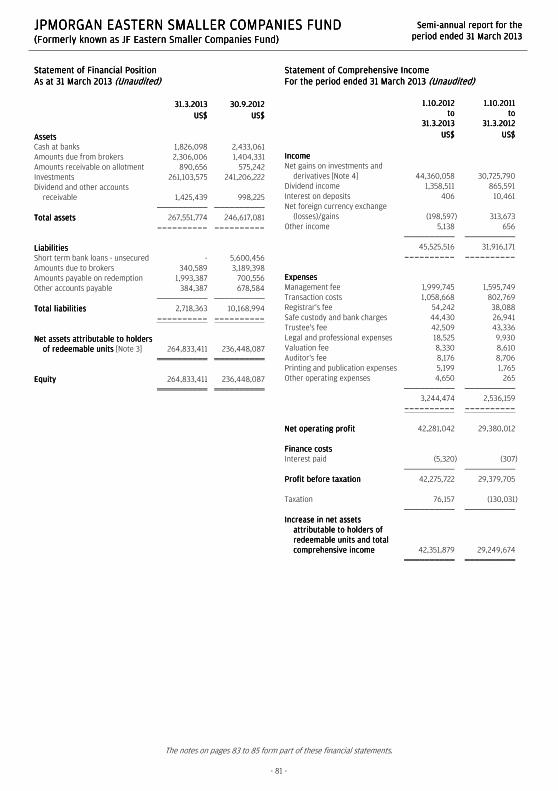
JPMORGAN EASTERN SMALLER COMPANIES FUNDJPMORGAN EASTERN SMALLER COMPANIES FUNDJPMORGAN EASTERN SMALLER COMPANIES FUNDJPMORGAN EASTERN SMALLER COMPANIES FUND (Formerly known as JF Eastern Smaller Companies Fund)(Formerly known as JF Eastern Smaller Companies Fund)(Formerly known as JF Eastern Smaller Companies Fund)(Formerly known as JF Eastern Smaller Companies Fund)
SemiSemiSemiSemi----annual report for theannual report for theannual report for theannual report for the
period ended 31 March 2013period ended 31 March 2013period ended 31 March 2013period ended 31 March 2013
The notes on pages 83 to 85 form part of these financial statements.
- 81 -
Statement of Statement of Statement of Statement of Financial PositionFinancial PositionFinancial PositionFinancial Position
As at 31 March 2013As at 31 March 2013As at 31 March 2013As at 31 March 2013 (Unaudited)(Unaudited)(Unaudited)(Unaudited)
31.3.201331.3.201331.3.201331.3.2013 30.9.201230.9.201230.9.201230.9.2012
US$US$US$US$ US$US$US$US$
AssetsAssetsAssetsAssets
Cash at banks 1,826,098 2,433,061
Amounts due from brokers 2,306,006 1,404,331
Amounts receivable on allotment 890,656 575,242
Investments 261,103,575 241,206,222
Dividend and other accounts
receivable 1,425,439 998,225
Total assetsTotal assetsTotal assetsTotal assets 267,551,774 246,617,081
---------- ----------
LiabilitiesLiabilitiesLiabilitiesLiabilities
Short term bank loans - unsecured - 5,600,456
Amounts due to brokers 340,589 3,189,398
Amounts payable on redemption 1,993,387 700,556
Other accounts payable 384,387 678,584
Total liabilitiesTotal liabilitiesTotal liabilitiesTotal liabilities 2,718,363 10,168,994
---------- ----------
Net assets attributable to holders Net assets attributable to holders Net assets attributable to holders Net assets attributable to holders
of redeemable units of redeemable units of redeemable units of redeemable units [Note 3] 264,833,411 236,448,087
EquityEquityEquityEquity 264,833,411 236,448,087
Statement of Comprehensive IncomeStatement of Comprehensive IncomeStatement of Comprehensive IncomeStatement of Comprehensive Income
For the period ended 31 March 2013For the period ended 31 March 2013For the period ended 31 March 2013For the period ended 31 March 2013 (Unaudited)(Unaudited)(Unaudited)(Unaudited)
1.10.20121.10.20121.10.20121.10.2012
totototo
31.3.201331.3.201331.3.201331.3.2013
1.10.20111.10.20111.10.20111.10.2011
totototo
31.3.201231.3.201231.3.201231.3.2012
US$US$US$US$ US$US$US$US$
IncomeIncomeIncomeIncome
Net gains on investments and
derivatives [Note 4] 44,360,058 30,725,790
Dividend income 1,358,511 865,591
Interest on deposits 406 10,461
Net foreign currency exchange
(losses)/gains (198,597) 313,673
Other income 5,138 656
45,525,516 31,916,171
---------- ----------
ExpensesExpensesExpensesExpenses
Management fee 1,999,745 1,595,749
Transaction costs 1,058,668 802,769
Registrar's fee 54,242 38,088
Safe custody and bank charges 44,430 26,941
Trustee's fee 42,509 43,336
Legal and professional expenses 18,525 9,930
Valuation fee 8,330 8,610
Auditor's fee 8,176 8,706
Printing and publication expenses 5,199 1,765
Other operating expenses 4,650 265
3,244,474 2,536,159
---------- ----------
Net operating profitNet operating profitNet operating profitNet operating profit 42,281,042 29,380,012
Finance costsFinance costsFinance costsFinance costs
Interest paid (5,320) (307)
Profit before taxationProfit before taxationProfit before taxationProfit before taxation 42,275,722 29,379,705
Taxation 76,157 (130,031)
Increase in net assets Increase in net assets Increase in net assets Increase in net assets
attributable to holders of attributable to holders of attributable to holders of attributable to holders of
redeemable units and total redeemable units and total redeemable units and total redeemable units and total
comprehensive incomecomprehensive incomecomprehensive incomecomprehensive income 42,351,879 29,249,674

JPMORGAN EASTERN SMALLER COMPANIES FUNDJPMORGAN EASTERN SMALLER COMPANIES FUNDJPMORGAN EASTERN SMALLER COMPANIES FUNDJPMORGAN EASTERN SMALLER COMPANIES FUND (Formerly known as JF Eastern Smaller Companies Fund)(Formerly known as JF Eastern Smaller Companies Fund)(Formerly known as JF Eastern Smaller Companies Fund)(Formerly known as JF Eastern Smaller Companies Fund)
SemiSemiSemiSemi----annual report for theannual report for theannual report for theannual report for the
period ended 31 March 2013period ended 31 March 2013period ended 31 March 2013period ended 31 March 2013
The notes on pages 83 to 85 form part of these financial statements.
- 82 -
Statement of Changes in Net Assets Attributable to Holders Statement of Changes in Net Assets Attributable to Holders Statement of Changes in Net Assets Attributable to Holders Statement of Changes in Net Assets Attributable to Holders
of Redeemable Unitsof Redeemable Unitsof Redeemable Unitsof Redeemable Units
For For For For the period ended 31 March 2013the period ended 31 March 2013the period ended 31 March 2013the period ended 31 March 2013 (Unaudited)(Unaudited)(Unaudited)(Unaudited)
1.10.20121.10.20121.10.20121.10.2012
totototo
31.3.201331.3.201331.3.201331.3.2013
1.10.20111.10.20111.10.20111.10.2011
totototo
31.3.201231.3.201231.3.201231.3.2012
US$US$US$US$ US$US$US$US$
Net assets attributable to holders Net assets attributable to holders Net assets attributable to holders Net assets attributable to holders
of redeemable units at the of redeemable units at the of redeemable units at the of redeemable units at the
beginning of the periodbeginning of the periodbeginning of the periodbeginning of the period 236,448,087 200,903,474
---------- ----------
Allotment of redeemable units 60,133,776 21,059,913
Redemption of redeemable units (74,100,331) (20,896,569)
Net (redemption)/allotmentNet (redemption)/allotmentNet (redemption)/allotmentNet (redemption)/allotment (13,966,555) 163,344
---------- ----------
222,481,532 201,066,818
IncreaseIncreaseIncreaseIncrease in net assets in net assets in net assets in net assets
attributable to holders of attributable to holders of attributable to holders of attributable to holders of
redeemable units and total redeemable units and total redeemable units and total redeemable units and total
comprehensive incomecomprehensive incomecomprehensive incomecomprehensive income 42,351,879 29,249,674
Net assets attributable to holders Net assets attributable to holders Net assets attributable to holders Net assets attributable to holders
of redeemable units at the end of redeemable units at the end of redeemable units at the end of redeemable units at the end
of the periodof the periodof the periodof the period 264,833,411 230,316,492
Statement of Cash FlowsStatement of Cash FlowsStatement of Cash FlowsStatement of Cash Flows
For the period ended 31 March 2013For the period ended 31 March 2013For the period ended 31 March 2013For the period ended 31 March 2013 (Unaudited)(Unaudited)(Unaudited)(Unaudited)
1.10.20121.10.20121.10.20121.10.2012
totototo
31.3.201331.3.201331.3.201331.3.2013
1.10.20111.10.20111.10.20111.10.2011
totototo
31.3.201231.3.201231.3.201231.3.2012
US$US$US$US$ US$US$US$US$
Operating activitiesOperating activitiesOperating activitiesOperating activities
Purchase of investments and
derivatives (172,201,182) (175,024,293)
Proceeds from disposal of
investments and derivatives 192,664,052 147,881,399
Dividend received 1,185,743 716,347
Tax refund/(paid) 76,157 (140,387)
Interest received 389 10,354
Trustee's fee paid (41,750) (46,922)
Registrar's fee paid (89,552) (76,944)
Transaction costs paid (1,070,177) (802,457)
Management fee paid (1,954,370) (1,585,691)
Others (586,396) 233,059
Net cash inflow/(outflow) from Net cash inflow/(outflow) from Net cash inflow/(outflow) from Net cash inflow/(outflow) from
operating activitiesoperating activitiesoperating activitiesoperating activities 17,982,914 (28,835,535)
---------- ----------
Financing activitiesFinancing activitiesFinancing activitiesFinancing activities
Interest paid (5,693) (307)
Receipts on allotment of
redeemable units 59,818,362 20,663,733
Payments on redemption of
redeemable units (72,807,500) (19,991,697)
Net cash (outflow)/inflow from Net cash (outflow)/inflow from Net cash (outflow)/inflow from Net cash (outflow)/inflow from
financing financing financing financing activitiesactivitiesactivitiesactivities (12,994,831) 671,729
---------- ----------
Increase/(decrease) in cash and Increase/(decrease) in cash and Increase/(decrease) in cash and Increase/(decrease) in cash and
cash equivalentscash equivalentscash equivalentscash equivalents 4,988,083 (28,163,806)
Cash and cash equivalents at the
beginning of the period (3,167,395) 39,013,803
Exchange gains on cash and cash
equivalents 5,410 5,389
Cash and cash equivalents at Cash and cash equivalents at Cash and cash equivalents at Cash and cash equivalents at
the end of the periodthe end of the periodthe end of the periodthe end of the period 1,826,098 10,855,386
Analysis of balances of cash and cash equivalents:Analysis of balances of cash and cash equivalents:Analysis of balances of cash and cash equivalents:Analysis of balances of cash and cash equivalents:
Cash at banks 1,826,098 1,355,386
Short term deposits - 9,500,000
1,826,098 10,855,386

JPMORGAN EASTERN SMALLER COMPANIES FUNDJPMORGAN EASTERN SMALLER COMPANIES FUNDJPMORGAN EASTERN SMALLER COMPANIES FUNDJPMORGAN EASTERN SMALLER COMPANIES FUND (Formerly known as JF Eastern Smaller Companies Fund)(Formerly known as JF Eastern Smaller Companies Fund)(Formerly known as JF Eastern Smaller Companies Fund)(Formerly known as JF Eastern Smaller Companies Fund)
SemiSemiSemiSemi----annual report for theannual report for theannual report for theannual report for the
period ended 31 March 2013period ended 31 March 2013period ended 31 March 2013period ended 31 March 2013
- 83 -
Notes to the Financial StatementsNotes to the Financial StatementsNotes to the Financial StatementsNotes to the Financial Statements
1111 The FundThe FundThe FundThe Fund
JPMorgan Eastern Smaller Companies Fund (the "Fund") was established under a Trust Deed dated 2 December 1991, as amended, and is
governed by the laws of Hong Kong. The Fund is authorized by the Securities and Futures Commission of Hong Kong.
With effect from 4 February 2013, the name of the Fund was changed from JF Eastern Smaller Companies Fund to JPMorgan Eastern Smaller
Companies fund.
The investment objective of the Fund is to provide investors with long-term capital growth by investing primarily in the securities of small to
medium sized companies in the Asia-Pacific region, excluding Japan and Australia except the Manager may, from time to time, invest in Japan
and Australia when appropriate investment opportunities arise.
Pursuant to the Supplemental Trust Deed dated 4 January 2013, the Manager may decide to issue separate classes (each a "Class") whose
assets will be commonly invested but where a specific fee structure, currency or distribution policy may be applied. Each Class may have a
different charging structure with the result that the net asset value attributable to each Class may differ.
On 2 November 2012, JF Pacific Smaller Companies Fund merged into JPMorgan Eastern Smaller Companies Fund (previously JF Eastern
Smaller Companies Fund) as a result of the resolution passed at the General Meeting of Unitholders of JF Pacific Smaller Companies Fund held
on 31 August 2012.
All unitholders' rights with regard to the convening, voting or otherwise acting at any meeting of unitholders are the same.
2222 Summary of principal accounting policiesSummary of principal accounting policiesSummary of principal accounting policiesSummary of principal accounting policies
(a)(a)(a)(a) Accounting policies of interim financial statementsAccounting policies of interim financial statementsAccounting policies of interim financial statementsAccounting policies of interim financial statements
The accounting policies and methods of computation used in the preparation of these unaudited condensed interim financial statements
are consistent with those used in the annual financial statements for the year ended 30 September 2012.
(b)(b)(b)(b) Investments and derivatives Investments and derivatives Investments and derivatives Investments and derivatives
Classification
The Fund classifies its investments and derivatives as financial assets or financial liabilities at fair value through profit or loss. These
financial assets or financial liabilities are held-for-trading as they are acquired or incurred principally for the purpose of selling or
repurchasing in the near term or short-term profit taking.
All derivatives are carried in assets when amounts are receivable by the Fund and in liabilities when amounts are payable by the Fund.
The Fund makes short sales in which a borrowed security is sold in anticipation of a decline in the market value of that security, or it may
use short sales for various arbitrage transactions. Short sales are classified as financial liabilities at fair value through profit or loss.
Recognition, derecognition and measurement
Purchases and sales of investments and derivatives are accounted for on the trade date basis. Investments and derivatives are initially
recognized at fair value and are subsequently re-measured at fair value. Realized and unrealized gains and losses on investments and
derivatives are recognized in the Statement of Comprehensive Income. Investments and derivatives are derecognized when the rights to
receive cash flows from the investments and derivatives have expired or the Fund has transferred substantially all risks and rewards of
ownership.
Fair value estimation
Investments that are listed or traded on an exchange and investments with prices quoted in over-the-counter markets or by market
makers, are fair valued based on quoted "bid" prices on long investments and quoted "ask" prices on investments sold short. When
trading in the securities of an investee company is suspended, the investment is valued at the Manager's estimate of its fair value.
Debt securities are fair valued based on quoted prices inclusive of accrued interest.
Investments in collective investment schemes are stated at fair value based on the net asset value per unit of the respective funds as
determined by the administrators of the relevant funds or stated at "bid" prices if the collective investment schemes are listed or traded
on an exchange.
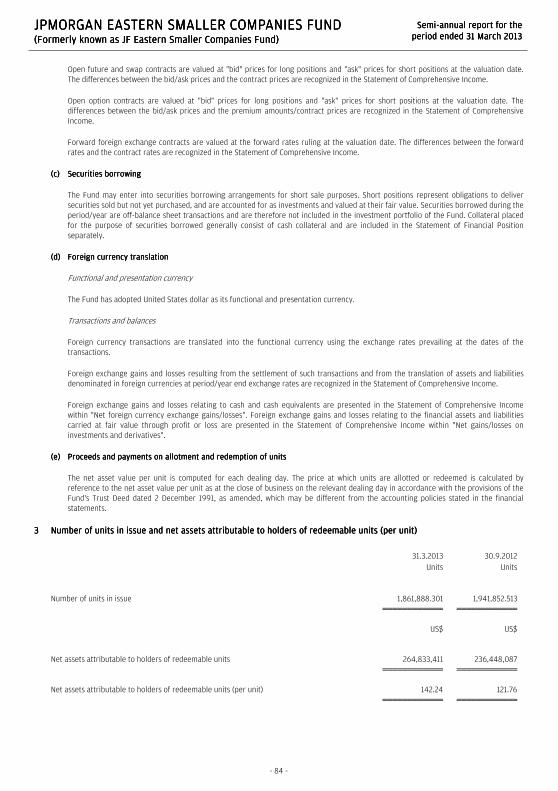
JPMORGAN EASTERN SMALLER COMPANIES FUNDJPMORGAN EASTERN SMALLER COMPANIES FUNDJPMORGAN EASTERN SMALLER COMPANIES FUNDJPMORGAN EASTERN SMALLER COMPANIES FUND (Formerly known as JF Eastern Smaller Companies Fund)(Formerly known as JF Eastern Smaller Companies Fund)(Formerly known as JF Eastern Smaller Companies Fund)(Formerly known as JF Eastern Smaller Companies Fund)
SemiSemiSemiSemi----annual report for theannual report for theannual report for theannual report for the
period ended 31 March 2013period ended 31 March 2013period ended 31 March 2013period ended 31 March 2013
- 84 -
Open future and swap contracts are valued at "bid" prices for long positions and "ask" prices for short positions at the valuation date.
The differences between the bid/ask prices and the contract prices are recognized in the Statement of Comprehensive Income.
Open option contracts are valued at "bid" prices for long positions and "ask" prices for short positions at the valuation date. The
differences between the bid/ask prices and the premium amounts/contract prices are recognized in the Statement of Comprehensive
Income.
Forward foreign exchange contracts are valued at the forward rates ruling at the valuation date. The differences between the forward
rates and the contract rates are recognized in the Statement of Comprehensive Income.
(c)(c)(c)(c) Securities borrowingSecurities borrowingSecurities borrowingSecurities borrowing
The Fund may enter into securities borrowing arrangements for short sale purposes. Short positions represent obligations to deliver
securities sold but not yet purchased, and are accounted for as investments and valued at their fair value. Securities borrowed during the
period/year are off-balance sheet transactions and are therefore not included in the investment portfolio of the Fund. Collateral placed
for the purpose of securities borrowed generally consist of cash collateral and are included in the Statement of Financial Position
separately.
(d)(d)(d)(d) Foreign currency translationForeign currency translationForeign currency translationForeign currency translation
Functional and presentation currency
The Fund has adopted United States dollar as its functional and presentation currency.
Transactions and balances
Foreign currency transactions are translated into the functional currency using the exchange rates prevailing at the dates of the
transactions.
Foreign exchange gains and losses resulting from the settlement of such transactions and from the translation of assets and liabilities
denominated in foreign currencies at period/year end exchange rates are recognized in the Statement of Comprehensive Income.
Foreign exchange gains and losses relating to cash and cash equivalents are presented in the Statement of Comprehensive Income
within "Net foreign currency exchange gains/losses". Foreign exchange gains and losses relating to the financial assets and liabilities
carried at fair value through profit or loss are presented in the Statement of Comprehensive Income within "Net gains/losses on
investments and derivatives".
(e)(e)(e)(e) Proceeds and payments on allotment and redemption of unitsProceeds and payments on allotment and redemption of unitsProceeds and payments on allotment and redemption of unitsProceeds and payments on allotment and redemption of units
The net asset value per unit is computed for each dealing day. The price at which units are allotted or redeemed is calculated by
reference to the net asset value per unit as at the close of business on the relevant dealing day in accordance with the provisions of the
Fund's Trust Deed dated 2 December 1991, as amended, which may be different from the accounting policies stated in the financial
statements.
3333 Number of units in issue and net assets attributable to holders of redeemable units (per unit)Number of units in issue and net assets attributable to holders of redeemable units (per unit)Number of units in issue and net assets attributable to holders of redeemable units (per unit)Number of units in issue and net assets attributable to holders of redeemable units (per unit)
31.3.2013 30.9.2012
Units Units
Number of units in issue 1,861,888.301 1,941,852.513
US$ US$
Net assets attributable to holders of redeemable units 264,833,411 236,448,087
Net assets attributable to holders of redeemable units (per unit) 142.24 121.76

JPMORGAN EASTERN SMALLER COMPANIES FUNDJPMORGAN EASTERN SMALLER COMPANIES FUNDJPMORGAN EASTERN SMALLER COMPANIES FUNDJPMORGAN EASTERN SMALLER COMPANIES FUND (Formerly known as JF Eastern Smaller Companies Fund)(Formerly known as JF Eastern Smaller Companies Fund)(Formerly known as JF Eastern Smaller Companies Fund)(Formerly known as JF Eastern Smaller Companies Fund)
SemiSemiSemiSemi----annual report for theannual report for theannual report for theannual report for the
period ended 31 March 2013period ended 31 March 2013period ended 31 March 2013period ended 31 March 2013
- 85 -
4444 Net gains on investments and derivatives Net gains on investments and derivatives Net gains on investments and derivatives Net gains on investments and derivatives
1.10.2012
to
31.3.2013
1.10.2011
to
31.3.2012
US$ US$
Change in unrealized gains/losses in value of investments and derivatives 14,338,858 42,196,797
Realized gains/(losses) on sale of investments and derivatives 30,021,200 (11,471,007)
44,360,058 30,725,790
5555 Soft commission arrangementsSoft commission arrangementsSoft commission arrangementsSoft commission arrangements
The Investment Manager has entered into soft commission arrangements with brokers under which certain goods and services used to
support investment decision making are received by the Investment Manager. The Investment Manager does not make direct payment for
these services but transacts an agreed amount of business with the brokers on behalf of the Fund. Commission is paid from the Fund on these
transactions.
The goods and services must be of demonstrable benefit to the Fund and may include research and advisory services; economic and political
analysis; portfolio analysis, including valuation and performance measurement; market analysis, data and quotation services, computer
hardware and software incidental to the above goods and services; clearing and custodian services and investment-related publications.
6666 Distribution Distribution Distribution Distribution
No distribution was made during the period (31 March 2012: nil).

JPMORGAN EVERGREEN FUNDJPMORGAN EVERGREEN FUNDJPMORGAN EVERGREEN FUNDJPMORGAN EVERGREEN FUND (Formerly known as JPM Evergreen Fund)(Formerly known as JPM Evergreen Fund)(Formerly known as JPM Evergreen Fund)(Formerly known as JPM Evergreen Fund)
SemiSemiSemiSemi----annual report for theannual report for theannual report for theannual report for the
period ended 31 March 2013period ended 31 March 2013period ended 31 March 2013period ended 31 March 2013
- 86 -
Investment Investment Investment Investment PortfolioPortfolioPortfolioPortfolio
As at 31 March 2013As at 31 March 2013As at 31 March 2013As at 31 March 2013 (Unaudited)(Unaudited)(Unaudited)(Unaudited)
Place ofPlace ofPlace ofPlace of
establishmentestablishmentestablishmentestablishment HoldingHoldingHoldingHolding
FairFairFairFair
valuevaluevaluevalue
US$US$US$US$
% of% of% of% of
netnetnetnet
assetsassetsassetsassets
Listed/Quoted InvestmentsListed/Quoted InvestmentsListed/Quoted InvestmentsListed/Quoted Investments (96.5%)
Collective Investment SchemesCollective Investment SchemesCollective Investment SchemesCollective Investment Schemes (96.5%)
ChinaChinaChinaChina (0.0%)
JPMF-JPM China Fd 'A' (dist)-USD* Luxembourg 105 4,407 0.0
EuropeEuropeEuropeEurope (5.0%)
JPMF-Europe Dynamic 'A' (dist)-EUR* Luxembourg 96,000 1,725,830 5.0
GermanyGermanyGermanyGermany (7.5%)
JPMF-Germany Equity 'A'(acc)-EUR* Luxembourg 114,000 2,593,985 7.5
InternationalInternationalInternationalInternational (31.8%)
JPM Global Prop Income Fd-USD (div)** Hong Kong 281,019 2,531,979 7.3
JPMF-Africa Equity 'A' (acc)-USD*# Luxembourg 90,000 1,028,700 3.0
JPMF-Emer Mk L Ccy Debt'A'(acc)-USD* Luxembourg 94,500 1,851,255 5.3
JPMF-Emer Mkt Small Cap'A'(acc)-USD*# Luxembourg 110,000 1,204,500 3.5
JPMF-Global Corp Bond 'A'(acc)-USD*# Luxembourg 121,500 1,773,900 5.1
JPMIF-Global High Yield'A'(acc)-USD* Luxembourg 18,750 2,622,188 7.6
JapanJapanJapanJapan (14.6%)
JPMF-Japan Strat Value 'A'(acc)-JPY*# Luxembourg 29,200 2,643,901 7.6
JPMIF-Japan 50 Equity 'A' (acc)-JPY* Luxembourg 23,971 2,429,734 7.0
KoreaKoreaKoreaKorea (3.1%)
JPMF-JPM Korea Equity 'A' (acc)-USD* Luxembourg 106,000 1,075,900 3.1
United StatesUnited StatesUnited StatesUnited States (34.5%)
iShares Barclays 7-10Yr Tsy Bond Fd# United States 25,100 2,692,979 7.8
iShares Barclays TIPS Bond Fd# United States 13,400 1,624,616 4.7
JPMF-America Equity 'A' (dist)-USD* Luxembourg 26,500 2,761,565 8.0
JPMF-US Aggregate Bd 'A' (acc)-USD* Luxembourg 100,000 1,538,000 4.4
JPMF-US Select Eq Plus'A'(acc)-USD*# Luxembourg 282,000 3,338,881 9.6
Total Listed/Quoted InvestmentsTotal Listed/Quoted InvestmentsTotal Listed/Quoted InvestmentsTotal Listed/Quoted Investments 33,442,320 96.5
Other net assetsOther net assetsOther net assetsOther net assets 1,224,350 3.5
Net assets attributable to holders of redeemable units at 31 March 2013Net assets attributable to holders of redeemable units at 31 March 2013Net assets attributable to holders of redeemable units at 31 March 2013Net assets attributable to holders of redeemable units at 31 March 2013 34,666,670 100.0
Total investments, at costTotal investments, at costTotal investments, at costTotal investments, at cost 28,778,039
* Issued and managed by a Connected Person of the Manager
** Issued and managed by the Manager
# Not authorized in Hong Kong and not available to Hong Kong Residents

JPMORGAN EVERGREEN FUNDJPMORGAN EVERGREEN FUNDJPMORGAN EVERGREEN FUNDJPMORGAN EVERGREEN FUND (Formerly known as JPM Evergreen Fund)(Formerly known as JPM Evergreen Fund)(Formerly known as JPM Evergreen Fund)(Formerly known as JPM Evergreen Fund)
SemiSemiSemiSemi----annual report for theannual report for theannual report for theannual report for the
period ended 31 March 2013period ended 31 March 2013period ended 31 March 2013period ended 31 March 2013
- 87 -
Statement of Movements in Portfolio HoldingsStatement of Movements in Portfolio HoldingsStatement of Movements in Portfolio HoldingsStatement of Movements in Portfolio Holdings
For the period ended 31 March 2013For the period ended 31 March 2013For the period ended 31 March 2013For the period ended 31 March 2013 (Unaudited)(Unaudited)(Unaudited)(Unaudited)
% holdings% holdings% holdings% holdings
of net assetsof net assetsof net assetsof net assets
31.3.201331.3.201331.3.201331.3.2013 30.9.201230.9.201230.9.201230.9.2012
Listed/Quoted InvestmentsListed/Quoted InvestmentsListed/Quoted InvestmentsListed/Quoted Investments
Collective Investment SchemesCollective Investment SchemesCollective Investment SchemesCollective Investment Schemes
United States 34.5 45.3
International 31.8 28.0
Japan 14.6 12.8
Germany 7.5 7.1
Europe 5.0 -
Korea 3.1 3.2
China 0.0 0.0
Total Listed/Quoted InvestmentsTotal Listed/Quoted InvestmentsTotal Listed/Quoted InvestmentsTotal Listed/Quoted Investments 96.5 96.4
Other net assetsOther net assetsOther net assetsOther net assets 3.5 3.6
Net assets attributable to holders of redeemable unitsNet assets attributable to holders of redeemable unitsNet assets attributable to holders of redeemable unitsNet assets attributable to holders of redeemable units 100.0 100.0

JPMORGAN EVERGREEN FUNDJPMORGAN EVERGREEN FUNDJPMORGAN EVERGREEN FUNDJPMORGAN EVERGREEN FUND (Formerly known as JPM Evergreen Fund)(Formerly known as JPM Evergreen Fund)(Formerly known as JPM Evergreen Fund)(Formerly known as JPM Evergreen Fund)
SemiSemiSemiSemi----annual report for theannual report for theannual report for theannual report for the
period ended 31 March 2013period ended 31 March 2013period ended 31 March 2013period ended 31 March 2013
The notes on pages 90 to 91 form part of these financial statements.
- 88 -
Statement of Financial PositionStatement of Financial PositionStatement of Financial PositionStatement of Financial Position
As at 31 March 2013As at 31 March 2013As at 31 March 2013As at 31 March 2013 (Unaudited)(Unaudited)(Unaudited)(Unaudited)
31.3.201331.3.201331.3.201331.3.2013 30.9.201230.9.201230.9.201230.9.2012
US$US$US$US$ US$US$US$US$
AssetsAssetsAssetsAssets
Cash at banks 1,198,549 360,709
Amounts due from brokers - 1,097,000
Amounts receivable on allotment 67,044 54,556
Investments 33,442,320 32,054,603
Dividend and other accounts
receivable 5,314 38,766
Total assetsTotal assetsTotal assetsTotal assets 34,713,227 33,605,634
---------- ----------
LiabilitiesLiabilitiesLiabilitiesLiabilities
Amounts payable on redemption 25,325 313,855
Other accounts payable 21,232 36,562
Total liabilitiesTotal liabilitiesTotal liabilitiesTotal liabilities 46,557 350,417
---------- ----------
Net assets attributable to holders Net assets attributable to holders Net assets attributable to holders Net assets attributable to holders
of redeemable units of redeemable units of redeemable units of redeemable units [Note 3] 34,666,670 33,255,217
EquityEquityEquityEquity 34,666,670 33,255,217
Statement of Comprehensive IncomeStatement of Comprehensive IncomeStatement of Comprehensive IncomeStatement of Comprehensive Income
For the period ended 31 March 2013For the period ended 31 March 2013For the period ended 31 March 2013For the period ended 31 March 2013 (Unaudited)(Unaudited)(Unaudited)(Unaudited)
1.10.20121.10.20121.10.20121.10.2012
totototo
31.3.201331.3.201331.3.201331.3.2013
1.10.20111.10.20111.10.20111.10.2011
totototo
31.3.201231.3.201231.3.201231.3.2012
US$US$US$US$ US$US$US$US$
IncomeIncomeIncomeIncome
Net gains on investments and
derivatives [Note 4] 2,132,404 3,377,008
Dividend income 43,098 67,201
Net foreign currency exchange
gains 13,862 12,250
Interest on deposits 258 6,356
Other income - 60
2,189,622 3,462,875
---------- ----------
ExpensesExpensesExpensesExpenses
Management fee 83,216 85,849
Registrar's fee 9,498 10,374
Valuation fee 8,050 8,400
Auditor's fee 5,743 6,362
Trustee's fee 4,993 6,831
Safe custody and bank charges 2,026 2,477
Printing and publication expenses 1,519 2,060
Transaction costs 474 -
Legal and professional expenses 2 30
Other operating expenses 1,028 448
116,549 122,831
---------- ----------
Net operating profitNet operating profitNet operating profitNet operating profit 2,073,073 3,340,044
Finance costsFinance costsFinance costsFinance costs
Interest paid (47) -
Profit before taxationProfit before taxationProfit before taxationProfit before taxation 2,073,026 3,340,044
Taxation (9,489) (12,883)
Increase in net assets Increase in net assets Increase in net assets Increase in net assets
attributable to holders of attributable to holders of attributable to holders of attributable to holders of
redeemable units and total redeemable units and total redeemable units and total redeemable units and total
comprehensive incomecomprehensive incomecomprehensive incomecomprehensive income 2,063,537 3,327,161

JPMORGAN EVERGREEN FUNDJPMORGAN EVERGREEN FUNDJPMORGAN EVERGREEN FUNDJPMORGAN EVERGREEN FUND (Formerly known as JPM Evergreen Fund)(Formerly known as JPM Evergreen Fund)(Formerly known as JPM Evergreen Fund)(Formerly known as JPM Evergreen Fund)
SemiSemiSemiSemi----annual report for theannual report for theannual report for theannual report for the
period ended 31 March 2013period ended 31 March 2013period ended 31 March 2013period ended 31 March 2013
The notes on pages 90 to 91 form part of these financial statements.
- 89 -
Statement of Changes in Net Assets Attributable to Holders Statement of Changes in Net Assets Attributable to Holders Statement of Changes in Net Assets Attributable to Holders Statement of Changes in Net Assets Attributable to Holders
of Redeemable Unitsof Redeemable Unitsof Redeemable Unitsof Redeemable Units
For the period ended 31 March 2013For the period ended 31 March 2013For the period ended 31 March 2013For the period ended 31 March 2013 (Unaudited)(Unaudited)(Unaudited)(Unaudited)
1.10.20121.10.20121.10.20121.10.2012
totototo
31.3.201331.3.201331.3.201331.3.2013
1.10.20111.10.20111.10.20111.10.2011
totototo
31.3.201231.3.201231.3.201231.3.2012
US$US$US$US$ US$US$US$US$
Net assets attributable to holders Net assets attributable to holders Net assets attributable to holders Net assets attributable to holders
of redeemable of redeemable of redeemable of redeemable units at the units at the units at the units at the
beginning of the periodbeginning of the periodbeginning of the periodbeginning of the period 33,255,217 32,479,326
---------- ----------
Allotment of redeemable units 4,579,232 2,880,036
Redemption of redeemable units (5,231,316) (2,161,751)
Net (redemption)/allotmentNet (redemption)/allotmentNet (redemption)/allotmentNet (redemption)/allotment (652,084) 718,285
---------- ----------
32,603,133 33,197,611
Increase in net assets Increase in net assets Increase in net assets Increase in net assets
attributable to holders of attributable to holders of attributable to holders of attributable to holders of
redeemable units and total redeemable units and total redeemable units and total redeemable units and total
comprehensive incomecomprehensive incomecomprehensive incomecomprehensive income 2,063,537 3,327,161
Net assets attributable to holdersNet assets attributable to holdersNet assets attributable to holdersNet assets attributable to holders
of redeemable units at the end of redeemable units at the end of redeemable units at the end of redeemable units at the end
of the periodof the periodof the periodof the period 34,666,670 36,524,772
Statement of Cash FlowsStatement of Cash FlowsStatement of Cash FlowsStatement of Cash Flows
For the period ended 31 March 2013For the period ended 31 March 2013For the period ended 31 March 2013For the period ended 31 March 2013 (Unaudited)(Unaudited)(Unaudited)(Unaudited)
1.10.20121.10.20121.10.20121.10.2012
totototo
31.3.201331.3.201331.3.201331.3.2013
1.10.20111.10.20111.10.20111.10.2011
totototo
31.3.201231.3.201231.3.201231.3.2012
US$US$US$US$ US$US$US$US$
Operating activitiesOperating activitiesOperating activitiesOperating activities
Purchase of investments and
derivatives (3,456,739) (4,925,735)
Proceeds from disposal of
investments and derivatives 5,319,675 1,040,250
Dividend received 55,320 70,621
Interest received 239 6,396
Transaction costs paid (474) (60)
Trustee's fee paid (4,974) (7,630)
Tax paid (9,489) (12,883)
Registrar's fee paid (19,176) (21,368)
Management fee paid (82,912) (85,085)
Others (10,480) (13,192)
Net cash inflow/(outflow) from Net cash inflow/(outflow) from Net cash inflow/(outflow) from Net cash inflow/(outflow) from
operating activitiesoperating activitiesoperating activitiesoperating activities 1,790,990 (3,948,686)
---------- ----------
Financing activitiesFinancing activitiesFinancing activitiesFinancing activities
Interest paid (47) -
Receipts on allotment of
redeemable units 4,566,744 2,678,602
Payments on redemption of
redeemable units (5,519,846) (2,149,187)
Net cash (outflow)/inflow Net cash (outflow)/inflow Net cash (outflow)/inflow Net cash (outflow)/inflow from from from from
financing activitiesfinancing activitiesfinancing activitiesfinancing activities (953,149) 529,415
---------- ----------
Increase/(decrease) in cash and Increase/(decrease) in cash and Increase/(decrease) in cash and Increase/(decrease) in cash and
cash equivalentscash equivalentscash equivalentscash equivalents 837,841 (3,419,271)
Cash and cash equivalents at the
beginning of the period 360,709 5,901,662
Exchange (losses)/gains on cash
and cash equivalents (1) 17
Cash and cash equivalents at Cash and cash equivalents at Cash and cash equivalents at Cash and cash equivalents at
the end of the periodthe end of the periodthe end of the periodthe end of the period 1,198,549 2,482,408
Analysis of balances of cash and cash equivalents:Analysis of balances of cash and cash equivalents:Analysis of balances of cash and cash equivalents:Analysis of balances of cash and cash equivalents:
Cash at banks 1,198,549 2,482,408

JPMORGAN EVERGREEN FUNDJPMORGAN EVERGREEN FUNDJPMORGAN EVERGREEN FUNDJPMORGAN EVERGREEN FUND (Formerly known as JPM Evergreen Fund)(Formerly known as JPM Evergreen Fund)(Formerly known as JPM Evergreen Fund)(Formerly known as JPM Evergreen Fund)
SemiSemiSemiSemi----annual report for theannual report for theannual report for theannual report for the
period ended 31 March 2013period ended 31 March 2013period ended 31 March 2013period ended 31 March 2013
- 90 -
Notes to the Financial StatementsNotes to the Financial StatementsNotes to the Financial StatementsNotes to the Financial Statements
1111 The FundThe FundThe FundThe Fund
JPMorgan Evergreen Fund (the "Fund") was established under a Trust Deed dated 19 January 2004, as amended, and is governed by the laws
of Hong Kong. The Fund is authorized by the Securities and Futures Commission of Hong Kong.
With effect from 4 February 2013, the name of the Fund was changed from JPM Evergreen Fund to JPMorgan Evergreen Fund.
The investment policy of the Fund is to seek to produce a competitive total return in different market conditions. The Fund seeks to achieve
this through an actively managed portfolio of collective investment schemes managed by the Manager, its connected parties or external
parties.
All unitholders' rights with regard to the convening, voting or otherwise acting at any meeting of unitholders are the same.
2222 Summary of principal accounting policiesSummary of principal accounting policiesSummary of principal accounting policiesSummary of principal accounting policies
(a)(a)(a)(a) Accounting policies of interim financial statementsAccounting policies of interim financial statementsAccounting policies of interim financial statementsAccounting policies of interim financial statements
The accounting policies and methods of computation used in the preparation of these unaudited condensed interim financial statements
are consistent with those used in the annual financial statements for the year ended 30 September 2012.
(b)(b)(b)(b) Investments and derivativesInvestments and derivativesInvestments and derivativesInvestments and derivatives
Classification
The Fund classifies its investments and derivatives as financial assets or financial liabilities at fair value through profit or loss. These
financial assets or financial liabilities are held-for-trading as they are acquired or incurred principally for the purpose of selling or
repurchasing in the near term or short-term profit taking.
All derivatives are carried in assets when amounts are receivable by the Fund and in liabilities when amounts are payable by the Fund.
Recognition, derecognition and measurement
Purchases and sales of investments and derivatives are accounted for on the trade date basis. Investments and derivatives are initially
recognized at fair value and are subsequently re-measured at fair value. Realized and unrealized gains and losses on investments and
derivatives are recognized in the Statement of Comprehensive Income. Investments and derivatives are derecognized when the rights to
receive cash flows from the investments and derivatives have expired or the Fund has transferred substantially all risks and rewards of
ownership.
Fair value estimation
Investments that are listed or traded on an exchange and investments with prices quoted in over-the-counter markets or by market
makers, are fair valued based on quoted "bid" prices on long investments and quoted "ask" prices on investments sold short. When
trading in the securities of an investee company is suspended, the investment is valued at the Manager's estimate of its fair value.
Investments in collective investment schemes are stated at fair value based on the net asset value per unit of the respective funds as
determined by the administrators of the relevant funds or stated at "bid" prices if the collective investment schemes are listed or traded
on an exchange.
Open future contracts are valued at "bid" prices for long positions and "ask" prices for short positions at the valuation date. The
differences between the bid/ask prices and the contract prices are recognized in the Statement of Comprehensive Income.
(c)(c)(c)(c) Foreign currency translationForeign currency translationForeign currency translationForeign currency translation
Functional and presentation currency
The Fund has adopted United States dollar as its functional and presentation currency.
Transactions and balances
Foreign currency transactions are translated into the functional currency using the exchange rates prevailing at the dates of the
transactions.

JPMORGAN EVERGREEN FUNDJPMORGAN EVERGREEN FUNDJPMORGAN EVERGREEN FUNDJPMORGAN EVERGREEN FUND (Formerly known as JPM Evergreen Fund)(Formerly known as JPM Evergreen Fund)(Formerly known as JPM Evergreen Fund)(Formerly known as JPM Evergreen Fund)
SemiSemiSemiSemi----annual report for theannual report for theannual report for theannual report for the
period ended 31 March 2013period ended 31 March 2013period ended 31 March 2013period ended 31 March 2013
- 91 -
Foreign exchange gains and losses resulting from the settlement of such transactions and from the translation of assets and liabilities
denominated in foreign currencies at period/year end exchange rates are recognized in the Statement of Comprehensive Income.
Foreign exchange gains and losses relating to cash and cash equivalents are presented in the Statement of Comprehensive Income
within "Net foreign currency exchange gains/losses". Foreign exchange gains and losses relating to the financial assets and liabilities
carried at fair value through profit or loss are presented in the Statement of Comprehensive Income within "Net gains/losses on
investments and derivatives".
(d)(d)(d)(d) Proceeds and payments on allotment and redemption of unitsProceeds and payments on allotment and redemption of unitsProceeds and payments on allotment and redemption of unitsProceeds and payments on allotment and redemption of units
The net asset value per unit is computed for each dealing day. The price at which units are allotted or redeemed is calculated by
reference to the net asset value per unit as at the close of business on the relevant dealing day in accordance with the provisions of the
Fund's Trust Deed dated 19 January 2004, as amended, which may be different from the accounting policies stated in the financial
statements.
3333 Number of units in issue and net assets attributable to holders of redeemable units (per unit)Number of units in issue and net assets attributable to holders of redeemable units (per unit)Number of units in issue and net assets attributable to holders of redeemable units (per unit)Number of units in issue and net assets attributable to holders of redeemable units (per unit)
31.3.2013 30.9.2012
Units Units
Number of units in issue 2,006,211.284 2,045,437.720
US$ US$
Net assets attributable to holders of redeemable units 34,666,670 33,255,217
Net assets attributable to holders of redeemable units (per unit) 17.28 16.26
4444 Net gains on investments and derivativesNet gains on investments and derivativesNet gains on investments and derivativesNet gains on investments and derivatives
1.10.2012
to
31.3.2013
1.10.2011
to
31.3.2012
US$ US$
Change in unrealized gains/losses in value of investments and derivatives 1,036,009 3,381,261
Realized gains/(losses) on sale of investments and derivatives 1,096,395 (4,253)
2,132,404 3,377,008
5555 Soft commission arrangementsSoft commission arrangementsSoft commission arrangementsSoft commission arrangements
During the period, the Investment Manager and its associates did not enter into any soft commission arrangements in connection with
directing transactions of the Fund through a broker or dealer (31 March 2012: nil).
6666 DistributionDistributionDistributionDistribution
No distribution was made during the period (31 March 2012: nil).

JPMORGAN GLOBAL BOND AND CURRENCY FUNDJPMORGAN GLOBAL BOND AND CURRENCY FUNDJPMORGAN GLOBAL BOND AND CURRENCY FUNDJPMORGAN GLOBAL BOND AND CURRENCY FUND (Formerly known as JPM Global Bond and Currency Fund)(Formerly known as JPM Global Bond and Currency Fund)(Formerly known as JPM Global Bond and Currency Fund)(Formerly known as JPM Global Bond and Currency Fund)
SemiSemiSemiSemi----annual report for theannual report for theannual report for theannual report for the
period ended 31 March 2013period ended 31 March 2013period ended 31 March 2013period ended 31 March 2013
- 92 -
Investment PortfolioInvestment PortfolioInvestment PortfolioInvestment Portfolio
As at 31 March 2013As at 31 March 2013As at 31 March 2013As at 31 March 2013 (Unaudited)(Unaudited)(Unaudited)(Unaudited)
HoldingHoldingHoldingHolding
FairFairFairFair
valuevaluevaluevalue
US$US$US$US$
% of% of% of% of
netnetnetnet
assetsassetsassetsassets
Listed/Quoted InvestmentsListed/Quoted InvestmentsListed/Quoted InvestmentsListed/Quoted Investments (92.6%)
(I) Debt Securities(I) Debt Securities(I) Debt Securities(I) Debt Securities (80.9%)
BelgiumBelgiumBelgiumBelgium (1.3%)
Belgium Kingdom of
2.25% 22/06/23 EUR170,000 219,787 0.9
Belgium Kingdom of
No64 4.5%28/3/26 EUR75,000 116,830 0.4
CanadaCanadaCanadaCanada (2.4%)
Canada Govt Of 0.75%
01/05/14 CAD90,000 88,605 0.3
Canada Govt Of 1.5%
01/09/17 CAD130,000 129,338 0.5
Canada Govt Of 2.75%
01/06/22 CAD70,000 74,731 0.3
Canada Govt Of 3.5%
01/06/20 CAD18,000 20,248 0.1
Canada Govt Of 4%
01/06/41 CAD50,000 64,740 0.3
Canada Govt Of 4.5%
01/06/15 CAD180,000 193,052 0.8
Canada Govt Of 5.75%
01/06/29 CAD25,000 36,517 0.1
Cayman IslandsCayman IslandsCayman IslandsCayman Islands (1.5%)
Hutchison Wha Int9/16
4.625% 11/09/15-
RegS USD350,000 378,839 1.5
ChinaChinaChinaChina (0.3%)
Export-Imp Bk CN
4.875% 21/07/15-
RegS USD60,000 65,113 0.3
DenmarkDenmarkDenmarkDenmark (0.6%)
Denmark Kingdom Of
3% 15/11/21 DKK700,000 141,177 0.6
FranceFranceFranceFrance (3.8%)
France OAT 2.25%
25/10/22 EUR325,000 429,493 1.7
France OAT 4%
25/04/55 EUR30,000 46,300 0.2
France OAT 4.5%
25/04/41 EUR60,000 99,755 0.4
France OAT 4.75%
25/04/35 EUR137,000 233,919 0.9
France OAT 5.75%
25/10/32 EUR83,000 155,041 0.6
GermanyGermanyGermanyGermany (5.2%)
Bundesrep Deut 1.5%
04/09/22 EUR93,000 123,504 0.5
Bundesrep Deut 2.5%
04/07/44 EUR100,000 139,661 0.6
Bundesrep Deut
4.75% 04/07/28 EUR255,000 464,012 1.9
(Continued)
HoldingHoldingHoldingHolding
FairFairFairFair
valuevaluevaluevalue
US$US$US$US$
% of% of% of% of
netnetnetnet
assetsassetsassetsassets
Bundesrep Deut
4.75% 04/07/34 EUR135,000 257,736 1.0
Bundesrep Deut No08
4.75% 04/07/40 EUR156,000 313,474 1.2
IndonesiaIndonesiaIndonesiaIndonesia (0.3%)
Indonesia Govt
NoFR26 11%
15/10/14 IDR700,000,000 82,860 0.3
IrelandIrelandIrelandIreland (1.1%)
Ireland Treasury 3.9%
20/03/23 EUR155,000 193,978 0.8
Ireland Treasury 5.4%
13/03/25 EUR60,000 83,719 0.3
ItalyItalyItalyItaly (3.8%)
Italy Rep Of (BTP)
3.5% 01/11/17 EUR230,000 299,655 1.2
Italy Rep Of (BTP)
3.7% 14/11/16 JPY15,000,000 166,382 0.6
Italy Rep Of (BTP) 4%
01/02/37 EUR195,000 217,928 0.9
Italy Rep Of (BTP)
5.5% 01/11/22 EUR195,000 271,844 1.1
JapanJapanJapanJapan (21.1%)
JGB No105 (20Yr) 2.1%
20/09/28 JPY22,600,000 276,404 1.1
JGB No20 (30Yr) 2.5%
20/09/35 JPY58,200,000 743,020 2.9
JGB No305 (10Yr) 1.3%
20/12/19 JPY44,400,000 506,918 2.0
JGB No309 (10Yr) 1.1%
20/06/20 JPY84,000,000 947,009 3.8
JGB No318 (10Yr) 1%
20/09/21 JPY64,500,000 718,219 2.9
JGB No325 (10Yr)
0.8% 20/09/22 JPY92,000,000 1,003,529 4.0
JGB No4 (40Yr) 2.2%
20/03/51 JPY7,500,000 92,799 0.4
JGB No73 (20Yr) 2%
20/12/24 JPY29,500,000 360,573 1.4
JGB No78 (20Yr) 1.9%
20/06/25 JPY53,200,000 643,532 2.6
KoreaKoreaKoreaKorea (0.6%)
Korea Treasury
No1409 4.25%
10/9/14 KRW160,000,000 147,503 0.6
MalaysiaMalaysiaMalaysiaMalaysia (2.8%)
Petronas Cap 5.25%
12/08/19-RegS USD600,000 704,215 2.8

JPMORGAN GLOBAL BOND AND CURRENCY FUNDJPMORGAN GLOBAL BOND AND CURRENCY FUNDJPMORGAN GLOBAL BOND AND CURRENCY FUNDJPMORGAN GLOBAL BOND AND CURRENCY FUND (Formerly known as JPM Global Bond and Currency Fund)(Formerly known as JPM Global Bond and Currency Fund)(Formerly known as JPM Global Bond and Currency Fund)(Formerly known as JPM Global Bond and Currency Fund)
SemiSemiSemiSemi----annual report for theannual report for theannual report for theannual report for the
period ended 31 March 2013period ended 31 March 2013period ended 31 March 2013period ended 31 March 2013
- 93 -
Investment PortfolioInvestment PortfolioInvestment PortfolioInvestment Portfolio (Continued)
As at 31 March 2013As at 31 March 2013As at 31 March 2013As at 31 March 2013 (Unaudited)(Unaudited)(Unaudited)(Unaudited)
HoldingHoldingHoldingHolding
FairFairFairFair
valuevaluevaluevalue
US$US$US$US$
% of% of% of% of
netnetnetnet
assetsassetsassetsassets
NetherlandsNetherlandsNetherlandsNetherlands (1.9%)
Majapahit Hldg 7.75%
20/01/20-RegS USD300,000 373,830 1.5
Netherlands Govt
3.75% 15/01/42 EUR65,000 106,562 0.4
New ZealandNew ZealandNew ZealandNew Zealand (0.5%)
New Zealand IL 2%
20/09/25 NZD130,000 116,764 0.5
PhilippinesPhilippinesPhilippinesPhilippines (1.7%)
Dev Bank Of Philip
VRN 8.375% Perp USD400,000 439,342 1.7
RussiaRussiaRussiaRussia (1.1%)
Russia Step-up 7.5%
31/03/30-RegS USD290,000 286,623 1.1
SpainSpainSpainSpain (6.4%)
Spain Kingdom Of
4.2% 31/01/37 EUR55,000 58,280 0.2
Spain Kingdom Of
4.25% 31/10/16 EUR160,000 214,537 0.9
Spain Kingdom Of
4.5% 31/01/18 EUR375,000 499,642 2.0
Spain Kingdom Of
4.65% 30/07/25 EUR175,000 218,698 0.9
Spain Kingdom Of
4.7% 30/07/41 EUR35,000 40,550 0.2
Spain Kingdom Of
5.4% 31/01/23 EUR170,000 226,368 0.9
Spain Kingdom Of
5.85% 31/01/22 EUR245,000 336,947 1.3
United KingdomUnited KingdomUnited KingdomUnited Kingdom (6.5%)
UK Treasury 1%
07/09/17 GBP129,000 199,167 0.8
UK Treasury 2.75%
22/01/15 GBP20,000 31,913 0.1
UK Treasury 3.75%
22/07/52 GBP30,000 50,936 0.2
UK Treasury IL No3MO
0.125% 22/3/29 GBP160,000 284,020 1.1
UK Treasury IL No3MO
1.25% 22/11/27 GBP85,000 218,298 0.9
UK Treasury IL No3MO
1.875% 11/22 GBP345,000 854,655 3.4
United StatesUnited StatesUnited StatesUnited States (17.7%)
US Treasury 0.875%
31/01/18 USD230,000 231,879 0.9
US Treasury 1.5%
31/03/19 USD100,000 103,754 0.4
US Treasury 1.625%
15/08/22 USD1,060,000 1,049,471 4.2
US Treasury 2.125%
15/08/21 USD330,000 345,928 1.4
US Treasury 3.125%
15/05/21 USD690,000 785,542 3.1
US Treasury 4.625%
15/02/40 USD933,000 1,222,419 4.9
(Continued)
HoldingHoldingHoldingHolding
FairFairFairFair
valuevaluevaluevalue
US$US$US$US$
% of% of% of% of
netnetnetnet
assetsassetsassetsassets
US Treasury 5.25%
15/11/28 USD145,000 199,594 0.8
US Treasury IL Nts
1.875% 15/07/19 USD375,000 496,950 2.0
VenezuelaVenezuelaVenezuelaVenezuela (0.3%)
Rep of Venezuela
5.75% 26/2/16-
RegS USD69,000 65,691 0.3
20,310,319 80.9
--------- ----
(II) Collective Investment Schemes(II) Collective Investment Schemes(II) Collective Investment Schemes(II) Collective Investment Schemes (11.7%)
InternationalInternationalInternationalInternational (11.7%)
JPMF-Emerging
Market Local
Currency
Debt'X'(acc)-USD* 30,279 657,357 2.6
JPMIF-Global High
Yield'X'(acc)-USD* 10,470 1,298,280 5.2
JPMIF-Global High
Yield'X'(acc)-EUR
Hedged* 5,380 968,773 3.9
2,924,410 11.7
--------- ----
Total Listed/Quoted InvestmentsTotal Listed/Quoted InvestmentsTotal Listed/Quoted InvestmentsTotal Listed/Quoted Investments 23,234,729 92.6
Other net assetsOther net assetsOther net assetsOther net assets 1,854,017 7.4
Net assets attributable to holders of Net assets attributable to holders of Net assets attributable to holders of Net assets attributable to holders of
redeemable units at 31 March 2013redeemable units at 31 March 2013redeemable units at 31 March 2013redeemable units at 31 March 2013 25,088,746 100.0
Total investments, at costTotal investments, at costTotal investments, at costTotal investments, at cost 22,683,980
* Issued and managed by a Connected Person of the Manager

JPMORGAN GLOBAL BOND AND CURRENCY FUNDJPMORGAN GLOBAL BOND AND CURRENCY FUNDJPMORGAN GLOBAL BOND AND CURRENCY FUNDJPMORGAN GLOBAL BOND AND CURRENCY FUND (Formerly known as JPM Global Bond and Currency Fund)(Formerly known as JPM Global Bond and Currency Fund)(Formerly known as JPM Global Bond and Currency Fund)(Formerly known as JPM Global Bond and Currency Fund)
SemiSemiSemiSemi----annual report for theannual report for theannual report for theannual report for the
period ended 31 March 2013period ended 31 March 2013period ended 31 March 2013period ended 31 March 2013
- 94 -
Statement of Movements in Portfolio HoldingsStatement of Movements in Portfolio HoldingsStatement of Movements in Portfolio HoldingsStatement of Movements in Portfolio Holdings
For the period For the period For the period For the period ended 31 March 2013ended 31 March 2013ended 31 March 2013ended 31 March 2013 (Unaudited)(Unaudited)(Unaudited)(Unaudited)
% holdings% holdings% holdings% holdings
of net assetsof net assetsof net assetsof net assets
31.3.201331.3.201331.3.201331.3.2013 30.9.201230.9.201230.9.201230.9.2012
Listed/Quoted InvestmentsListed/Quoted InvestmentsListed/Quoted InvestmentsListed/Quoted Investments
Debt SecuritiesDebt SecuritiesDebt SecuritiesDebt Securities
Japan 21.1 26.7
United States 17.7 20.4
United Kingdom 6.5 5.8
Spain 6.4 3.4
Germany 5.2 5.0
France 3.8 4.6
Italy 3.8 5.3
Malaysia 2.8 2.3
Canada 2.4 1.5
Netherlands 1.9 2.5
Philippines 1.7 1.4
Cayman Islands 1.5 1.2
Belgium 1.3 1.6
Russia 1.1 1.0
Ireland 1.1 0.4
Korea 0.6 1.8
Denmark 0.6 0.7
New Zealand 0.5 -
Indonesia 0.3 0.3
Venezuela 0.3 0.2
China 0.3 0.2
Australia - 1.1
Mexico - 1.1
Norway - 0.9
Collective Investment SchemesCollective Investment SchemesCollective Investment SchemesCollective Investment Schemes
International 11.7 9.9
Total Listed/Quoted InvestmentsTotal Listed/Quoted InvestmentsTotal Listed/Quoted InvestmentsTotal Listed/Quoted Investments 92.6 99.3
Other net assetsOther net assetsOther net assetsOther net assets 7.4 0.7
Net assets attributable Net assets attributable Net assets attributable Net assets attributable to holders of to holders of to holders of to holders of
redeemable unitsredeemable unitsredeemable unitsredeemable units 100.0 100.0

JPMORGAN GLOBAL BOND AND CURRENCY FUNDJPMORGAN GLOBAL BOND AND CURRENCY FUNDJPMORGAN GLOBAL BOND AND CURRENCY FUNDJPMORGAN GLOBAL BOND AND CURRENCY FUND (Formerly known as JPM Global Bond and Currency Fund)(Formerly known as JPM Global Bond and Currency Fund)(Formerly known as JPM Global Bond and Currency Fund)(Formerly known as JPM Global Bond and Currency Fund)
SemiSemiSemiSemi----annual report for theannual report for theannual report for theannual report for the
period ended 31 March 2013period ended 31 March 2013period ended 31 March 2013period ended 31 March 2013
The notes on pages 97 to 100 form part of these financial statements.
- 95 -
Statement of Financial PositionStatement of Financial PositionStatement of Financial PositionStatement of Financial Position
As at 31 March 2013As at 31 March 2013As at 31 March 2013As at 31 March 2013 (Unaudited)(Unaudited)(Unaudited)(Unaudited)
31.3.201331.3.201331.3.201331.3.2013 30.9.201230.9.201230.9.201230.9.2012
US$US$US$US$ US$US$US$US$
AssetsAssetsAssetsAssets
Cash at banks 1,832,895 774,256
Amounts due from brokers 274,058 328,142
Amounts receivable on allotment 17,153 60,257
Investments [Note 3] 23,234,729 30,359,730
Other accounts receivable 5 44
Total assetsTotal assetsTotal assetsTotal assets 25,358,840 31,522,429
---------- ----------
LiabilitiesLiabilitiesLiabilitiesLiabilities
Amounts due to brokers 31,800 656,719
Amounts payable on redemption 83,054 59,024
Distribution payable [Note 5] 152,833 205,968
Other accounts payable 11,559 52,360
Liabilities (excluding net assets Liabilities (excluding net assets Liabilities (excluding net assets Liabilities (excluding net assets
attributable to holders of attributable to holders of attributable to holders of attributable to holders of
redeemable units)redeemable units)redeemable units)redeemable units) 279,246 974,071
---------- ----------
Net assets attributable to holders Net assets attributable to holders Net assets attributable to holders Net assets attributable to holders
of redeemable units of redeemable units of redeemable units of redeemable units
(before fair value adjustment) (before fair value adjustment) (before fair value adjustment) (before fair value adjustment)
[Note 3] 25,079,594 30,548,358
Fair value adjustment of units of
the Fund [Note 3] 9,152 38,802
Net assets attributable to holders Net assets attributable to holders Net assets attributable to holders Net assets attributable to holders
of redeemable unitsof redeemable unitsof redeemable unitsof redeemable units
(after fair value adjustment) (after fair value adjustment) (after fair value adjustment) (after fair value adjustment)
[Note 3] 25,088,746 30,587,160
Statement of Comprehensive IncomeStatement of Comprehensive IncomeStatement of Comprehensive IncomeStatement of Comprehensive Income
For For For For the period ended 31 March 2013the period ended 31 March 2013the period ended 31 March 2013the period ended 31 March 2013 (Unaudited)(Unaudited)(Unaudited)(Unaudited)
1.10.20121.10.20121.10.20121.10.2012
totototo
31.3.201331.3.201331.3.201331.3.2013
1.10.20111.10.20111.10.20111.10.2011
totototo
31.3.201231.3.201231.3.201231.3.2012
US$US$US$US$ US$US$US$US$
IncomeIncomeIncomeIncome
Net (losses)/gains on investments
and derivatives [Note 4] (1,058,810) 194,307
Interest on deposits 229 297
Net foreign currency exchange
losses (79,048) (48,635)
(1,137,629) 145,969
---------- ----------
ExpensesExpensesExpensesExpenses
Management fee 146,795 171,939
Registrar's fee 18,358 26,348
Auditor's fee 5,746 6,198
Safe custody and bank charges 3,821 4,678
Legal and professional expenses 2,997 32
Trustee's fee 2,643 3,095
Transaction costs 2,429 1,290
Printing and publication expenses 1,080 1,371
Other operating expenses 34 120
183,903 215,071
---------- ----------
Net operating lossNet operating lossNet operating lossNet operating loss (1,321,532) (69,102)
Finance costsFinance costsFinance costsFinance costs
Distribution [Note 5] (152,833) (222,479)
Loss before taxationLoss before taxationLoss before taxationLoss before taxation (1,474,365) (291,581)
Taxation (4,456) (2,855)
(1,478,821) (294,436)
Change in cumulative difference
arising from the fair value
adjustment of units of the
Fund (29,650) 16,648
Decrease in net assets Decrease in net assets Decrease in net assets Decrease in net assets
attributable to holders of attributable to holders of attributable to holders of attributable to holders of
redeemable units and total redeemable units and total redeemable units and total redeemable units and total
comprehensive comprehensive comprehensive comprehensive incomeincomeincomeincome (1,508,471) (277,788)

JPMORGAN GLOBAL BOND AND CURRENCY FUNDJPMORGAN GLOBAL BOND AND CURRENCY FUNDJPMORGAN GLOBAL BOND AND CURRENCY FUNDJPMORGAN GLOBAL BOND AND CURRENCY FUND (Formerly known as JPM Global Bond and Currency Fund)(Formerly known as JPM Global Bond and Currency Fund)(Formerly known as JPM Global Bond and Currency Fund)(Formerly known as JPM Global Bond and Currency Fund)
SemiSemiSemiSemi----annual report for theannual report for theannual report for theannual report for the
period ended 31 March 2013period ended 31 March 2013period ended 31 March 2013period ended 31 March 2013
The notes on pages 97 to 100 form part of these financial statements.
- 96 -
Statement of Changes in Net Assets Attributable to Holders Statement of Changes in Net Assets Attributable to Holders Statement of Changes in Net Assets Attributable to Holders Statement of Changes in Net Assets Attributable to Holders
of Redeemable Unitsof Redeemable Unitsof Redeemable Unitsof Redeemable Units
For the period ended 31 March 2013For the period ended 31 March 2013For the period ended 31 March 2013For the period ended 31 March 2013 (Unaudited)(Unaudited)(Unaudited)(Unaudited)
1.10.20121.10.20121.10.20121.10.2012
totototo
31.3.201331.3.201331.3.201331.3.2013
1.10.20111.10.20111.10.20111.10.2011
totototo
31.3.201231.3.201231.3.201231.3.2012
US$US$US$US$ US$US$US$US$
Net assets Net assets Net assets Net assets attributable to holders attributable to holders attributable to holders attributable to holders
of redeemable units at the of redeemable units at the of redeemable units at the of redeemable units at the
beginning of the periodbeginning of the periodbeginning of the periodbeginning of the period 30,587,160 33,218,773
---------- ----------
Allotment of redeemable units 5,870,537 11,011,085
Redemption of redeemable units (9,860,480) (11,817,537)
Net redemptionNet redemptionNet redemptionNet redemption (3,989,943) (806,452)
---------- ----------
26,597,217 32,412,321
Decrease in net assets Decrease in net assets Decrease in net assets Decrease in net assets
attributable to holders of attributable to holders of attributable to holders of attributable to holders of
redeemable units and total redeemable units and total redeemable units and total redeemable units and total
comprehensive incomecomprehensive incomecomprehensive incomecomprehensive income (1,508,471) (277,788)
Net assets attributable to holders Net assets attributable to holders Net assets attributable to holders Net assets attributable to holders
of redeemable units at the end of redeemable units at the end of redeemable units at the end of redeemable units at the end
of the periodof the periodof the periodof the period 25,088,746 32,134,533
Statement of Cash FlowsStatement of Cash FlowsStatement of Cash FlowsStatement of Cash Flows
For the period ended 31 March 2013For the period ended 31 March 2013For the period ended 31 March 2013For the period ended 31 March 2013 (Unaudited)(Unaudited)(Unaudited)(Unaudited)
1.10.20121.10.20121.10.20121.10.2012
totototo
31.3.201331.3.201331.3.201331.3.2013
1.10.20111.10.20111.10.20111.10.2011
totototo
31.3.201231.3.201231.3.201231.3.2012
US$US$US$US$ US$US$US$US$
Operating activitiesOperating activitiesOperating activitiesOperating activities
Purchase of investments and
derivatives (23,789,117) (15,826,431)
Proceeds from disposal of
investments and derivatives 29,284,473 15,737,575
Interest received 229 297
Tax paid (2,452) (2,632)
Trustee's fee paid (2,735) (3,088)
Transaction costs paid (2,994) (1,970)
Registrar's fee paid (30,764) (45,834)
Management fee paid (172,027) (171,553)
Others 95,949 (65,676)
Net cash inflow/(outflow) from Net cash inflow/(outflow) from Net cash inflow/(outflow) from Net cash inflow/(outflow) from
operating activitiesoperating activitiesoperating activitiesoperating activities 5,380,562 (379,312)
---------- ----------
Financing activitiesFinancing activitiesFinancing activitiesFinancing activities
Receipts on allotment of
redeemable units 5,913,641 11,730,562
Payments on redemption of
redeemable units (9,836,450) (11,747,629)
Distribution paid (205,968) (240,743)
Net Net Net Net cash outflow from cash outflow from cash outflow from cash outflow from
financing activitiesfinancing activitiesfinancing activitiesfinancing activities (4,128,777) (257,810)
---------- ----------
Increase/(decrease) in cash and Increase/(decrease) in cash and Increase/(decrease) in cash and Increase/(decrease) in cash and
cash equivalentscash equivalentscash equivalentscash equivalents 1,251,785 (637,122)
Cash and cash equivalents at the
beginning of the period 774,256 1,861,220
Exchange losses on cash and cash
equivalents (193,146) (16,837)
Cash and cash equivalents at Cash and cash equivalents at Cash and cash equivalents at Cash and cash equivalents at
the end of the periodthe end of the periodthe end of the periodthe end of the period 1,832,895 1,207,261
Analysis of balances of cash and cash equivalents:Analysis of balances of cash and cash equivalents:Analysis of balances of cash and cash equivalents:Analysis of balances of cash and cash equivalents:
Cash at banks 1,832,895 1,207,261
JPMORGAN GLOBAL BOND AND CURRENCY FUNDJPMORGAN GLOBAL BOND AND CURRENCY FUNDJPMORGAN GLOBAL BOND AND CURRENCY FUNDJPMORGAN GLOBAL BOND AND CURRENCY FUND (Formerly known as JPM Global Bond and Currency Fund)(Formerly known as JPM Global Bond and Currency Fund)(Formerly known as JPM Global Bond and Currency Fund)(Formerly known as JPM Global Bond and Currency Fund)
SemiSemiSemiSemi----annual report for theannual report for theannual report for theannual report for the
period ended 31 March 2013period ended 31 March 2013period ended 31 March 2013period ended 31 March 2013
- 97 -
Notes to the Financial StatementsNotes to the Financial StatementsNotes to the Financial StatementsNotes to the Financial Statements
1111 The FundThe FundThe FundThe Fund
JPMorgan Global Bond and Currency Fund (the "Fund") was established under a Trust Deed dated 30 April 1979, as amended, and is governed
by the laws of Hong Kong. The Fund is authorized by the Securities and Futures Commission of Hong Kong.
With effect from 4 February 2013, the name of the Fund was changed from JPM Global Bond and Currency Fund to JPMorgan Global Bond and
Currency Fund.
The investment objective of the Fund is to provide a stable income primarily from a portfolio of international interest bearing securities
together with long-term capital appreciation through diversification of exposure to the major international currencies.
Pursuant to the Supplemental Trust Deed dated 4 January 2013, the Manager may decide to issue separate classes (each a "Class") whose
assets will be commonly invested but where a specific fee structure, currency or distribution policy may be applied. Each Class may have a
different charging structure with the result that the net asset value attributable to each Class may differ.
All unitholders' rights with regard to the convening, voting or otherwise acting at any meeting of unitholders are the same.
2222 Summary of principal accounting policiesSummary of principal accounting policiesSummary of principal accounting policiesSummary of principal accounting policies
(a)(a)(a)(a) Accounting Accounting Accounting Accounting policies of interim financial statementspolicies of interim financial statementspolicies of interim financial statementspolicies of interim financial statements
The accounting policies and methods of computation used in the preparation of these unaudited condensed interim financial statements
are consistent with those used in the annual financial statements for the year ended 30 September 2012.
(b)(b)(b)(b) Investments and derivativesInvestments and derivativesInvestments and derivativesInvestments and derivatives
Classification
The Fund classifies its investments and derivatives as financial assets or financial liabilities at fair value through profit or loss. These
financial assets or financial liabilities are held-for-trading as they are acquired or incurred principally for the purpose of selling or
repurchasing in the near term or short-term profit taking.
All derivatives are carried in assets when amounts are receivable by the Fund and in liabilities when amounts are payable by the Fund.
The Fund makes short sales in which a borrowed security is sold in anticipation of a decline in the market value of that security, or it may
use short sales for various arbitrage transactions. Short sales are classified as financial liabilities at fair value through profit or loss.
Recognition, derecognition and measurement
Purchases and sales of investments and derivatives are accounted for on the trade date basis. Investments and derivatives are initially
recognized at fair value and are subsequently re-measured at fair value. Realized and unrealized gains and losses on investments and
derivatives are recognized in the Statement of Comprehensive Income. Investments and derivatives are derecognized when the rights to
receive cash flows from the investments and derivatives have expired or the Fund has transferred substantially all risks and rewards of
ownership.
Fair value estimation
Investments that are listed or traded on an exchange and investments with prices quoted in over-the-counter markets or by market
makers, are fair valued based on quoted "bid" prices on long investments and quoted "ask" prices on investments sold short. When
trading in the securities of an investee company is suspended, the investment is valued at the Manager's estimate of its fair value.
Debt securities are fair valued based on quoted prices inclusive of accrued interest.
Investments in collective investment schemes are stated at fair value based on the net asset value per unit of the respective funds as
determined by the administrators of the relevant funds or stated at "bid" prices if the collective investment schemes are listed or traded
on an exchange.
Open future and swap contracts are valued at "bid" prices for long positions and "ask" prices for short positions at the valuation date.
The differences between the bid/ask prices and the contract prices are recognized in the Statement of Comprehensive Income.
Open option contracts are valued at "bid" prices for long positions and "ask" prices for short positions at the valuation date. The
differences between the bid/ask prices and the premium amounts/contract prices are recognized in the Statement of Comprehensive
Income.

JPMORGAN GLOBAL BOND AND CURRENCY FUNDJPMORGAN GLOBAL BOND AND CURRENCY FUNDJPMORGAN GLOBAL BOND AND CURRENCY FUNDJPMORGAN GLOBAL BOND AND CURRENCY FUND (Formerly known as JPM Global Bond and Currency Fund)(Formerly known as JPM Global Bond and Currency Fund)(Formerly known as JPM Global Bond and Currency Fund)(Formerly known as JPM Global Bond and Currency Fund)
SemiSemiSemiSemi----annual report for theannual report for theannual report for theannual report for the
period ended 31 March 2013period ended 31 March 2013period ended 31 March 2013period ended 31 March 2013
- 98 -
Forward foreign exchange contracts are valued at the forward rates ruling at the valuation date. The differences between the forward
rates and the contract rates are recognized in the Statement of Comprehensive Income.
(c)(c)(c)(c) Securities borrowing Securities borrowing Securities borrowing Securities borrowing
The Fund may enter into securities borrowing arrangements for short sale purposes. Short positions represent obligations to deliver
securities sold but not yet purchased, and are accounted for as investments and valued at their fair value. Securities borrowed during the
period/year are off-balance sheet transactions and are therefore not included in the investment portfolio of the Fund. Collateral placed
for the purpose of securities borrowed generally consist of cash collateral and are included in the Statement of Financial Position
separately.
(d)(d)(d)(d) Foreign currency translationForeign currency translationForeign currency translationForeign currency translation
Functional and presentation currency
The Fund has adopted United States dollar as its functional and presentation currency.
Transactions and balances
Foreign currency transactions are translated into the functional currency using the exchange rates prevailing at the dates of the
transactions.
Foreign exchange gains and losses resulting from the settlement of such transactions and from the translation of assets and liabilities
denominated in foreign currencies at period/year end exchange rates are recognized in the Statement of Comprehensive Income.
Foreign exchange gains and losses relating to cash and cash equivalents are presented in the Statement of Comprehensive Income
within "Net foreign currency exchange gains/losses". Foreign exchange gains and losses relating to the financial assets and liabilities
carried at fair value through profit or loss are presented in the Statement of Comprehensive Income within "Net gains/losses on
investments and derivatives".
(e)(e)(e)(e) Proceeds and payments on allotment and redemption of unitsProceeds and payments on allotment and redemption of unitsProceeds and payments on allotment and redemption of unitsProceeds and payments on allotment and redemption of units
The net asset value per unit is computed for each dealing day. The price at which units are allotted or redeemed is calculated by
reference to the net asset value per unit as at the close of business on the relevant dealing day in accordance with the provisions of the
Fund's Trust Deed dated 30 April 1979, as amended, which may be different from the accounting policies stated in the financial
statements.
Units of the Fund are redeemable at the option of the holders of redeemable units and are classified as a financial liability in the
Statement of Financial Position which represents the net assets attributable to holders of redeemable units (or "net asset value" or "net
assets" or "NAV") and is carried at the redemption amount that would be payable at the Statement of Financial Position date if the
holders of redeemable units exercised the right to redeem units of the Fund.
3333 Net assets attribuNet assets attribuNet assets attribuNet assets attributable to holders of redeemable units and number of units in issuetable to holders of redeemable units and number of units in issuetable to holders of redeemable units and number of units in issuetable to holders of redeemable units and number of units in issue
Fair value adjustment of units of the Fund
As stated in Note 2(e), units of the Fund are redeemable at the option of the holders of redeemable units and are classified as a financial
liability in the Statement of Financial Position which represents the net assets attributable to the holders of redeemable units and is carried at
the redemption amount that would be payable at the Statement of Financial Position date, if the holders of redeemable units exercised the
right to redeem units of the Fund. The redemption amount is determined based on the net assets attributable to holders of redeemable units
calculated in accordance with the provisions of the Fund's Trust Deed dated 30 April 1979, as amended ("Trust Deed NAV").

JPMORGAN GLOBAL BOND AND CURRENCY FUNDJPMORGAN GLOBAL BOND AND CURRENCY FUNDJPMORGAN GLOBAL BOND AND CURRENCY FUNDJPMORGAN GLOBAL BOND AND CURRENCY FUND (Formerly known as JPM Global Bond and Currency Fund)(Formerly known as JPM Global Bond and Currency Fund)(Formerly known as JPM Global Bond and Currency Fund)(Formerly known as JPM Global Bond and Currency Fund)
SemiSemiSemiSemi----annual report for theannual report for theannual report for theannual report for the
period ended 31 March 2013period ended 31 March 2013period ended 31 March 2013period ended 31 March 2013
- 99 -
31.3.2013 30.9.2012
US$ US$
Net assets attributable to holders of redeemable units (before fair value adjustment) 25,079,594 30,548,358
Fair value adjustment of units of the Fund:
Difference between bid/ask prices and last traded prices basis in valuing investments and
derivatives as at the end of the period [Note 3(a)] 9,152 38,802
Net assets attributable to holders of redeemable units (after fair value adjustment) 25,088,746 30,587,160
Note:
(a) Listed investments, investments and derivatives with prices quoted in over-the-counter markets or by market makers are stated at the
last traded prices for the purpose of the Trust Deed NAV. As stated in Note 2(b), the accounting policy of the Fund for the purpose of
compliance with Hong Kong Accounting Standard 39, "Financial Instruments: Recognition and Measurement" and for reporting purposes
is to value its investments and derivatives at fair value based on the relevant bid/ask market prices on the Statement of Financial
Position date.
31.3.2013 30.9.2012
Units Units
Number of units in issue 1,033,199.837 1,196,933.279
US$ US$
Net assets attributable to holders of redeemable units
(after fair value adjustment) 25,088,746 30,587,160
Net assets attributable to holders of redeemable units (per unit) 24.28 25.55
4444 Net (losses)/gains on investments and derivatives Net (losses)/gains on investments and derivatives Net (losses)/gains on investments and derivatives Net (losses)/gains on investments and derivatives
1.10.2012
to
31.3.2013
1.10.2011
to
31.3.2012
US$ US$
Change in unrealized gains/losses in value of investments and derivatives (1,666,062) (672,055)
Realized gains on sale of investments and derivatives 607,252 866,362
(1,058,810) 194,307

JPMORGAN GLOBAL BOND AND CURRENCY FUNDJPMORGAN GLOBAL BOND AND CURRENCY FUNDJPMORGAN GLOBAL BOND AND CURRENCY FUNDJPMORGAN GLOBAL BOND AND CURRENCY FUND (Formerly known as JPM Global Bond and Currency Fund)(Formerly known as JPM Global Bond and Currency Fund)(Formerly known as JPM Global Bond and Currency Fund)(Formerly known as JPM Global Bond and Currency Fund)
SemiSemiSemiSemi----annual report for theannual report for theannual report for theannual report for the
period ended 31 March 2013period ended 31 March 2013period ended 31 March 2013period ended 31 March 2013
- 100 -
5555 Distribution Distribution Distribution Distribution
In accordance with the Explanatory Memorandum of the Fund, in respect of each accounting period, the Fund will distribute at least 85% of
the net operating profit of the Fund after making certain adjustments to the holders of redeemable units. The distribution is included under
finance costs in the Statement of Comprehensive Income.
1.10.2012
to
31.3.2013
1.10.2011
to
31.3.2012
US$ US$
Net operating loss (1,321,532) (69,102)
Adjustments:
Net losses/(gains) on investments and derivatives 1,058,810 (194,307)
Net foreign currency exchange losses 79,048 48,635
Interest income included in net gains/losses on investments and derivatives (at coupon rate) 367,612 447,519
Transaction costs 2,429 1,290
Taxation (4,456) (2,855)
Amount available for distribution 181,911 231,180
Interim distribution of
US$0.1479 per unit on 1,033,356.592 units ex on 28 March 2013 and pay
on 10 April 2013 (152,833)
(2012: US$0.1695 per unit on 1,312,559.778 units ex on 30 March 2012 and pay
on 12 April 2012)
(222,479)
In the event that the amount available for distribution is insufficient to pay distributions as the Fund declares, the Manager may in its
discretion determine that such distributions be paid from capital.
6666 Soft commission arrangementsSoft commission arrangementsSoft commission arrangementsSoft commission arrangements
The Investment Manager has entered into soft commission arrangements with brokers under which certain goods and services used to
support investment decision making are received by the Investment Manager. The Investment Manager does not make direct payment for
these services but transacts an agreed amount of business with the brokers on behalf of the Fund. Commission is paid from the Fund on these
transactions.
The goods and services must be of demonstrable benefit to the Fund and may include research and advisory services; economic and political
analysis; portfolio analysis, including valuation and performance measurement; market analysis, data and quotation services, computer
hardware and software incidental to the above goods and services; clearing and custodian services and investment-related publications.

JPMORGAN GLOBAL PROPERTY INCOME JPMORGAN GLOBAL PROPERTY INCOME JPMORGAN GLOBAL PROPERTY INCOME JPMORGAN GLOBAL PROPERTY INCOME FUNDFUNDFUNDFUND (Formerly known as JPM Global Property Income Fund)(Formerly known as JPM Global Property Income Fund)(Formerly known as JPM Global Property Income Fund)(Formerly known as JPM Global Property Income Fund)
SemiSemiSemiSemi----annual report for theannual report for theannual report for theannual report for the
period ended 31 March 2013period ended 31 March 2013period ended 31 March 2013period ended 31 March 2013
- 101 -
Investment PortfolioInvestment PortfolioInvestment PortfolioInvestment Portfolio
As at 31 March 2013As at 31 March 2013As at 31 March 2013As at 31 March 2013 (Unaudited)(Unaudited)(Unaudited)(Unaudited)
HoldingHoldingHoldingHolding
FairFairFairFair
valuevaluevaluevalue
US$US$US$US$
% of% of% of% of
netnetnetnet
assetsassetsassetsassets
Listed/Quoted InvestmentsListed/Quoted InvestmentsListed/Quoted InvestmentsListed/Quoted Investments (95.3%)
(I) Equities(I) Equities(I) Equities(I) Equities (94.8%)
AustraliaAustraliaAustraliaAustralia (13.1%)
Commonwealth Property
Office Fd 194,398 223,950 0.8
Dexus Property Group Stapled
Sec 684,118 741,756 2.6
Goodman Group Stapled Sec 125,177 615,975 2.1
Mirvac Group Stapled Sec 315,065 527,196 1.8
Stockland Stapled Sec 88,173 335,525 1.2
Westfield Group Stapled Sec 67,937 761,398 2.6
Westfield Retail Trust Stapled
Sec 188,344 591,038 2.0
AustriaAustriaAustriaAustria (0.8%)
Atrium European Real Estate 39,828 229,888 0.8
BelgiumBelgiumBelgiumBelgium (1.1%)
Warehouses De Pauw 4,847 305,102 1.1
CanadaCanadaCanadaCanada (7.9%)
Allied Properties REIT 8,200 266,513 0.9
Artis Real Estate Inv Trust 18,544 293,324 1.0
Calloway Real Estate Inv Trust 2,400 69,098 0.3
Canadian Apartment
Properties REIT 8,500 210,670 0.7
Canadian Real Estate Inv Trust 2,400 106,045 0.4
Dundee Real Estate
Investment 'A' 7,000 252,247 0.9
First Capital Realty 20,170 376,022 1.3
H&R Real Estate Inv Trust 10,500 241,326 0.8
RioCan Real Estate Inv Trust 17,162 466,235 1.6
FranceFranceFranceFrance (0.4%)
ICADE SA 1,260 109,925 0.4
GermanyGermanyGermanyGermany (1.3%)
Alstria Office REIT 33,514 377,420 1.3
Hong KongHong KongHong KongHong Kong (7.4%)
Cheung Kong (Hldgs) 33,000 486,329 1.7
Link REIT 135,500 734,871 2.5
New World Dev 247,000 418,102 1.4
Wharf (Hldgs) 58,000 516,293 1.8
JapanJapanJapanJapan (19.8%)
Advance Residence
Investment 136 373,053 1.3
Daiwahouse Residential
Investment 72 346,139 1.2
GLP J-REIT 215 224,101 0.8
GLP J-REIT (RegS) 97 101,106 0.3
Japan Logistics Fd 26 303,914 1.0
Japan Real Estate Inv 58 789,620 2.7
Japan Retail Fund Investment 78 191,557 0.7
Kenedix Realty Investment 75 366,943 1.3
Mitsubishi Estate 5,000 138,003 0.5
Mitsui Fudosan 26,000 729,504 2.5
(Continued)
HoldingHoldingHoldingHolding
FairFairFairFair
valuevaluevaluevalue
US$US$US$US$
% of% of% of% of
netnetnetnet
assetsassetsassetsassets
Nippon Prologis REIT 43 452,776 1.6
Nippon Prologis REIT-RegS 36 379,068 1.3
Nomura Real Estate Hldgs 6,800 150,147 0.5
Nomura Real Estate Office Fd 54 402,042 1.4
ORIX JREIT 230 324,133 1.1
United Urban Investment 288 467,441 1.6
NetherlandsNetherlandsNetherlandsNetherlands (4.3%)
Corio NV 2,284 106,581 0.4
Unibail-Rodamco SE-NL List 4,179 974,781 3.3
VastNed Retail 2,717 112,866 0.4
Wereldhave NV 962 66,558 0.2
SingaporeSingaporeSingaporeSingapore (5.4%)
Ascendas Real Estate Inv Trust 77,415 161,619 0.6
Ascott Residence Trust 241,193 265,378 0.9
Cambridge Industrial Trust 220,000 139,207 0.5
CapitaCommercial Trust 203,000 259,354 0.9
CapitaLand Ltd 18,000 51,217 0.2
CapitaMalls Asia 147,000 242,907 0.8
Global Logistics Properties 176,000 371,691 1.3
Keppel Land 22,000 69,869 0.2
United KingdomUnited KingdomUnited KingdomUnited Kingdom (5.7%)
British Land 93,005 766,843 2.7
Hammerson plc 47,650 355,621 1.2
Helical Bar 59,161 210,658 0.7
Land Securities Group 3,749 47,192 0.2
Safestore Hldgs 151,430 268,454 0.9
United StatesUnited StatesUnited StatesUnited States (27.6%)
American Campus
Communities 4,300 194,919 0.7
American Tower 4,876 375,013 1.3
Apartment Inv & Mgmt 'A' 12,355 378,681 1.3
Avalonbay Communities 1,600 202,592 0.7
Biomed Realty Trust 12,200 263,276 0.9
Boston Properties 1,100 111,144 0.4
Camden Property Trust 1,500 103,005 0.4
CBL & Associates Prop Dep
Pref 'D' 15,225 385,497 1.3
CBL & Associates Properties 10,300 243,080 0.8
Corporate Office Properties
Trust 4,200 112,014 0.4
CubeSmart 7,400 116,772 0.4
Digital Realty Trust 4,300 287,670 1.0
Duke Realty 22,900 388,613 1.3
DuPont Fabros Technology 5,162 125,230 0.4
Education Realty Trust 18,100 190,412 0.7
Equity One 10,300 246,891 0.8
First Potomac Realty Trust 7,000 103,740 0.4
HCP Inc 11,000 547,910 1.9
Health Care REIT 3,300 224,004 0.8
Healthcare Realty Trust 8,500 241,230 0.8
Lasalle Hotel Properties 8,100 205,578 0.7
Liberty Property Trust 10,600 421,244 1.4
National Retail Properties 9,800 354,172 1.2
Post Properties 2,300 108,330 0.4
Prologis Inc 7,100 283,716 1.0
Public Storage 2,610 397,216 1.4

JPMORGAN GLOBAL PROPERTY INCOME JPMORGAN GLOBAL PROPERTY INCOME JPMORGAN GLOBAL PROPERTY INCOME JPMORGAN GLOBAL PROPERTY INCOME FUNDFUNDFUNDFUND (Formerly known as JPM Global Property Income Fund)(Formerly known as JPM Global Property Income Fund)(Formerly known as JPM Global Property Income Fund)(Formerly known as JPM Global Property Income Fund)
SemiSemiSemiSemi----annual report for theannual report for theannual report for theannual report for the
period ended 31 March 2013period ended 31 March 2013period ended 31 March 2013period ended 31 March 2013
- 102 -
Investment PortfolioInvestment PortfolioInvestment PortfolioInvestment Portfolio (Continued)
As at 31 March 2013As at 31 March 2013As at 31 March 2013As at 31 March 2013 (Unaudited)(Unaudited)(Unaudited)(Unaudited)
HoldingHoldingHoldingHolding
FairFairFairFair
valuevaluevaluevalue
US$US$US$US$
% of% of% of% of
netnetnetnet
assetsassetsassetsassets
United StatesUnited StatesUnited StatesUnited States (Continued)
Realty Income 7,200 326,088 1.1
Regency Centers 5,000 264,350 0.9
Simon Property Group 3,500 554,960 1.9
Ventas Inc 3,426 250,612 0.9
27,474,550 94.8
(II) Derivatives(II) Derivatives(II) Derivatives(II) Derivatives (0.5%)
Forward foreign exchangeForward foreign exchangeForward foreign exchangeForward foreign exchange
contracts contracts contracts contracts (0.5%) 148,112 0.5
Total Listed/Quoted InvestmentsTotal Listed/Quoted InvestmentsTotal Listed/Quoted InvestmentsTotal Listed/Quoted Investments 27,622,662 95.3
---------- -----
UnlistedUnlistedUnlistedUnlisted/Unquoted Investments /Unquoted Investments /Unquoted Investments /Unquoted Investments (0.0%)
Equities Equities Equities Equities (0.0%)
MaltaMaltaMaltaMalta (0.0%)
BGP Hldgs 193,047 0 0.0
Total Unlisted/Unquoted Total Unlisted/Unquoted Total Unlisted/Unquoted Total Unlisted/Unquoted
InvestmentsInvestmentsInvestmentsInvestments 0 0.0
---------- ----
Total InvestmentsTotal InvestmentsTotal InvestmentsTotal Investments 27,622,662 95.3
Other net assetsOther net assetsOther net assetsOther net assets 1,350,717 4.7
Net assets attributable to holders of Net assets attributable to holders of Net assets attributable to holders of Net assets attributable to holders of
redeemable redeemable redeemable redeemable units at 31 March 2013units at 31 March 2013units at 31 March 2013units at 31 March 2013 28,973,379 100.0
Total investments, at costTotal investments, at costTotal investments, at costTotal investments, at cost 23,933,488
Statement of Movements in Portfolio HoldingsStatement of Movements in Portfolio HoldingsStatement of Movements in Portfolio HoldingsStatement of Movements in Portfolio Holdings
For the period ended 31 March 2013For the period ended 31 March 2013For the period ended 31 March 2013For the period ended 31 March 2013 (Unaudited)(Unaudited)(Unaudited)(Unaudited)
% holdings% holdings% holdings% holdings
of net assetsof net assetsof net assetsof net assets
31.3.201331.3.201331.3.201331.3.2013 30.9.201230.9.201230.9.201230.9.2012
Listed/Quoted InvestmentsListed/Quoted InvestmentsListed/Quoted InvestmentsListed/Quoted Investments
EquitiesEquitiesEquitiesEquities
United States 27.6 33.4
Japan 19.8 16.6
Australia 13.1 18.4
Canada 7.9 7.3
Hong Kong 7.4 0.6
United Kingdom 5.7 4.4
Singapore 5.4 6.8
Netherlands 4.3 1.1
Germany 1.3 0.7
Belgium 1.1 0.2
Austria 0.8 0.9
France 0.4 4.4
DerivativesDerivativesDerivativesDerivatives
Forward foreign exchange contracts 0.5 (0.5)
Total Listed/Quoted InvestmentsTotal Listed/Quoted InvestmentsTotal Listed/Quoted InvestmentsTotal Listed/Quoted Investments 95.3 94.3
---- ----
Unlisted/Unquoted InvestmentsUnlisted/Unquoted InvestmentsUnlisted/Unquoted InvestmentsUnlisted/Unquoted Investments
EquitiesEquitiesEquitiesEquities
Malta 0.0 0.0
Total Unlisted/Unquoted InvestmentsTotal Unlisted/Unquoted InvestmentsTotal Unlisted/Unquoted InvestmentsTotal Unlisted/Unquoted Investments 0.0 0.0
---- ----
Total investmentsTotal investmentsTotal investmentsTotal investments 95.3 94.3
Other net assetsOther net assetsOther net assetsOther net assets 4.7 5.7
Net assets attributable to holders of Net assets attributable to holders of Net assets attributable to holders of Net assets attributable to holders of
redeemable unitsredeemable unitsredeemable unitsredeemable units 100.0 100.0

JPMORGAN GLOBAL PROPERTY INCOME JPMORGAN GLOBAL PROPERTY INCOME JPMORGAN GLOBAL PROPERTY INCOME JPMORGAN GLOBAL PROPERTY INCOME FUNDFUNDFUNDFUND (Formerly known as JPM Global Property Income Fund)(Formerly known as JPM Global Property Income Fund)(Formerly known as JPM Global Property Income Fund)(Formerly known as JPM Global Property Income Fund)
SemiSemiSemiSemi----annual report for theannual report for theannual report for theannual report for the
period ended 31 March 2013period ended 31 March 2013period ended 31 March 2013period ended 31 March 2013
The notes on pages 105 to 108 form part of these financial statements.
- 103 -
Statement of Financial PositionStatement of Financial PositionStatement of Financial PositionStatement of Financial Position
As at 31 March 2013As at 31 March 2013As at 31 March 2013As at 31 March 2013 (Unaudited)(Unaudited)(Unaudited)(Unaudited)
31.3.201331.3.201331.3.201331.3.2013 30.9.201230.9.201230.9.201230.9.2012
US$US$US$US$ US$US$US$US$
AssetsAssetsAssetsAssets
Cash at banks 836,514 787,476
Amounts due from brokers 609,607 805,470
Amounts receivable on allotment 1,123,255 821,091
Derivatives [Note 3] 148,112 -
Investments [Note 3] 27,474,550 19,542,503
Dividend and other accounts
receivable 88,841 79,789
Total assetsTotal assetsTotal assetsTotal assets 30,280,879 22,036,329
---------- ----------
LiabilitiesLiabilitiesLiabilitiesLiabilities
Amounts due to brokers 988,300 1,141,906
Amounts payable on redemption 309,337 9,975
Distribution payable [Note 5] 44,739 153,416
Derivatives [Note 3] - 105,256
Other accounts payable 39,293 48,914
Liabilities (excluding netLiabilities (excluding netLiabilities (excluding netLiabilities (excluding net assets assets assets assets
attributable to holders of attributable to holders of attributable to holders of attributable to holders of
redeemable units)redeemable units)redeemable units)redeemable units) 1,381,669 1,459,467
---------- ----------
Net assets attributable to holders Net assets attributable to holders Net assets attributable to holders Net assets attributable to holders
of redeemable units of redeemable units of redeemable units of redeemable units
(before fair value adjustment) (before fair value adjustment) (before fair value adjustment) (before fair value adjustment)
[Note 3] 28,899,210 20,576,862
Fair value adjustment of units of
the Fund [Note 3] 74,169 31,111
Net assets attributable to holders Net assets attributable to holders Net assets attributable to holders Net assets attributable to holders
of redeemable unitsof redeemable unitsof redeemable unitsof redeemable units
(after fair value adjustment) (after fair value adjustment) (after fair value adjustment) (after fair value adjustment)
[Note 3] 28,973,379 20,607,973
Statement of Comprehensive IncomeStatement of Comprehensive IncomeStatement of Comprehensive IncomeStatement of Comprehensive Income
For the period ended 31 March 2013For the period ended 31 March 2013For the period ended 31 March 2013For the period ended 31 March 2013 (Unaudited)(Unaudited)(Unaudited)(Unaudited)
1.10.20121.10.20121.10.20121.10.2012
totototo
31.3.201331.3.201331.3.201331.3.2013
1.10.20111.10.20111.10.20111.10.2011
totototo
31.3.201231.3.201231.3.201231.3.2012
US$US$US$US$ US$US$US$US$
IncomeIncomeIncomeIncome
Net gains on investments and
derivatives [Note 4] 3,406,029 1,971,638
Dividend income 465,909 563,156
Net foreign currency exchange
losses (2,213) (795)
Other income 15 5,048
3,869,740 2,539,047
---------- ----------
ExpensesExpensesExpensesExpenses
Management fee 172,585 145,230
Transaction costs 42,623 6,352
Registrar's fee 14,095 14,371
Valuation fee 8,400 5,350
Trustee's fee 6,905 5,809
Safe custody and bank charges 5,740 4,611
Auditor's fee 5,051 5,614
Printing and publication expenses 949 2,030
Legal and professional expenses 220 17
Other operating expenses 271 226
256,839 189,610
---------- ----------
Net operating profitNet operating profitNet operating profitNet operating profit 3,612,901 2,349,437
---------- ----------
Finance costsFinance costsFinance costsFinance costs
Distribution [Note 5] (117,839) (241,000)
Interest paid (1) (16)
(117,840) (241,016)
---------- ----------
Profit before taxationProfit before taxationProfit before taxationProfit before taxation 3,495,061 2,108,421
Taxation (100,385) (120,124)
3,394,676 1,988,297
Change in cumulative difference
arising from the fair value
adjustment of units of the
Fund 43,058 (21,123)
Increase in net assets Increase in net assets Increase in net assets Increase in net assets
attributable to holders of attributable to holders of attributable to holders of attributable to holders of
redeemable unitsredeemable unitsredeemable unitsredeemable units and total and total and total and total
comprehensive incomecomprehensive incomecomprehensive incomecomprehensive income 3,437,734 1,967,174

JPMORGAN GLOBAL PROPERTY INCOME JPMORGAN GLOBAL PROPERTY INCOME JPMORGAN GLOBAL PROPERTY INCOME JPMORGAN GLOBAL PROPERTY INCOME FUNDFUNDFUNDFUND (Formerly known as JPM Global Property Income Fund)(Formerly known as JPM Global Property Income Fund)(Formerly known as JPM Global Property Income Fund)(Formerly known as JPM Global Property Income Fund)
SemiSemiSemiSemi----annual report for theannual report for theannual report for theannual report for the
period ended 31 March 2013period ended 31 March 2013period ended 31 March 2013period ended 31 March 2013
The notes on pages 105 to 108 form part of these financial statements.
- 104 -
Statement of Changes in Net Assets Attributable to Holders Statement of Changes in Net Assets Attributable to Holders Statement of Changes in Net Assets Attributable to Holders Statement of Changes in Net Assets Attributable to Holders
of Redeemable Unitsof Redeemable Unitsof Redeemable Unitsof Redeemable Units
For the period ended 31 March 2013For the period ended 31 March 2013For the period ended 31 March 2013For the period ended 31 March 2013 (Unaudited)(Unaudited)(Unaudited)(Unaudited)
1.10.20121.10.20121.10.20121.10.2012
totototo
31.3.201331.3.201331.3.201331.3.2013
1.10.20111.10.20111.10.20111.10.2011
totototo
31.3.201231.3.201231.3.201231.3.2012
US$US$US$US$ US$US$US$US$
Net assets attributable to holders Net assets attributable to holders Net assets attributable to holders Net assets attributable to holders
of redeemable units at the of redeemable units at the of redeemable units at the of redeemable units at the
beginning of the periodbeginning of the periodbeginning of the periodbeginning of the period 20,607,973 18,969,345
---------- ----------
Allotment of redeemable units 11,012,323 1,874,105
Redemption of redeemable units (6,084,651) (2,178,844)
Net allotment/(redemption)Net allotment/(redemption)Net allotment/(redemption)Net allotment/(redemption) 4,927,672 (304,739)
---------- ----------
25,535,645 18,664,606
Increase in net assets Increase in net assets Increase in net assets Increase in net assets
attributable to holders of attributable to holders of attributable to holders of attributable to holders of
redeemable units and total redeemable units and total redeemable units and total redeemable units and total
comprehensive incomecomprehensive incomecomprehensive incomecomprehensive income 3,437,734 1,967,174
Net assets attributable to holders Net assets attributable to holders Net assets attributable to holders Net assets attributable to holders
of redeemable units at the end of redeemable units at the end of redeemable units at the end of redeemable units at the end
of the periodof the periodof the periodof the period 28,973,379 20,631,780
Statement of Cash FlowsStatement of Cash FlowsStatement of Cash FlowsStatement of Cash Flows
For the period ended 31 March 2013For the period ended 31 March 2013For the period ended 31 March 2013For the period ended 31 March 2013 (Unaudited)(Unaudited)(Unaudited)(Unaudited)
1.10.20121.10.20121.10.20121.10.2012
totototo
31.3.201331.3.201331.3.201331.3.2013
1.10.20111.10.20111.10.20111.10.2011
totototo
31.3.201231.3.201231.3.201231.3.2012
US$US$US$US$ US$US$US$US$
Operating activitiesOperating activitiesOperating activitiesOperating activities
Purchase of investments and
derivatives (16,958,037) (2,409,500)
Proceeds from disposal of
investments and derivatives 12,221,087 2,838,520
Dividend received 456,538 549,525
Trustee's fee paid (6,557) (5,785)
Registrar's fee paid (27,279) (29,628)
Transaction costs paid (42,907) (7,340)
Tax paid (100,385) (120,124)
Management fee paid (163,903) (144,621)
Others (27,693) (21,958)
Net cash Net cash Net cash Net cash (outflow)/inflow from (outflow)/inflow from (outflow)/inflow from (outflow)/inflow from
operating activitiesoperating activitiesoperating activitiesoperating activities (4,649,136) 649,089
---------- ----------
Financing activitiesFinancing activitiesFinancing activitiesFinancing activities
Interest paid (1) (16)
Receipts on allotment of
redeemable units 10,710,159 1,871,108
Payments on redemption of
redeemable units (5,785,289) (2,174,876)
Distribution paid (226,516) (290,098)
Net cash inflow/(outflow) from Net cash inflow/(outflow) from Net cash inflow/(outflow) from Net cash inflow/(outflow) from
financing activitiesfinancing activitiesfinancing activitiesfinancing activities 4,698,353 (593,882)
---------- ----------
Increase in cash and cash Increase in cash and cash Increase in cash and cash Increase in cash and cash
equivalentsequivalentsequivalentsequivalents 49,217 55,207
Cash and cash equivalents at the
beginning of the period 787,476 204,208
Exchange (losses)/gains on cash
and cash equivalents (179) 934
Cash and cash equivalents at Cash and cash equivalents at Cash and cash equivalents at Cash and cash equivalents at
the end of the periodthe end of the periodthe end of the periodthe end of the period 836,514 260,349
Analysis of Analysis of Analysis of Analysis of balances of cash and cash equivalents:balances of cash and cash equivalents:balances of cash and cash equivalents:balances of cash and cash equivalents:
Cash at banks 836,514 260,349

JPMORGAN GLOBAL PROPERTY INCOME FUNDJPMORGAN GLOBAL PROPERTY INCOME FUNDJPMORGAN GLOBAL PROPERTY INCOME FUNDJPMORGAN GLOBAL PROPERTY INCOME FUND (Formerly (Formerly (Formerly (Formerly known as JPM GLOBAL PROPERTY INCOME FUND)known as JPM GLOBAL PROPERTY INCOME FUND)known as JPM GLOBAL PROPERTY INCOME FUND)known as JPM GLOBAL PROPERTY INCOME FUND)
SemiSemiSemiSemi----annual report for theannual report for theannual report for theannual report for the
period ended 31 March 2013period ended 31 March 2013period ended 31 March 2013period ended 31 March 2013
- 105 -
Notes to the Financial StatementsNotes to the Financial StatementsNotes to the Financial StatementsNotes to the Financial Statements
1111 The FundThe FundThe FundThe Fund
JPMorgan Global Property Income Fund (the "Fund") was established under a Trust Deed dated 6 July 2005, as amended, and is governed by
the laws of Hong Kong. The Fund is authorized by the Securities and Futures Commission of Hong Kong.
With effect from 4 February 2013, the name of the Fund was changed from JPM Global Property Income Fund to JPMorgan Global Property
Income Fund.
The investment objective of the Fund is to achieve a high level of current income and long-term capital appreciation primarily through
investing in securities that are listed on any stock exchange and are principally engaged in or related to the property industry or which own
significant property assets. The Fund does not invest in real estate directly.
Pursuant to the Supplemental Trust Deed dated 4 January 2013, the Manager may decide to issue separate classes (each a "Class") whose
assets will be commonly invested but where a specific fee structure, currency or distribution policy may be applied. Each Class may have a
different charging structure with the result that the net asset value attributable to each Class may differ.
All unitholders' rights with regard to the convening, voting or otherwise acting at any meeting of unitholders are the same.
2222 Summary of principal accounting policiesSummary of principal accounting policiesSummary of principal accounting policiesSummary of principal accounting policies
(a)(a)(a)(a) Accounting policies of interim financial statementsAccounting policies of interim financial statementsAccounting policies of interim financial statementsAccounting policies of interim financial statements
The accounting policies and methods of computation used in the preparation of these unaudited condensed interim financial statements
are consistent with those used in the annual financial statements for the year ended 30 September 2012.
(b)(b)(b)(b) Investments and derivatives Investments and derivatives Investments and derivatives Investments and derivatives
Classification
The Fund classifies its investments and derivatives as financial assets or financial liabilities at fair value through profit or loss. These
financial assets or financial liabilities are held-for-trading as they are acquired or incurred principally for the purpose of selling or
repurchasing in the near term or short-term profit taking.
All derivatives are carried in assets when amounts are receivable by the Fund and in liabilities when amounts are payable by the Fund.
The Fund makes short sales in which a borrowed security is sold in anticipation of a decline in the market value of that security, or it may
use short sales for various arbitrage transactions. Short sales are classified as financial liabilities at fair value through profit or loss.
Recognition, derecognition and measurement
Purchases and sales of investments and derivatives are accounted for on the trade date basis. Investments and derivatives are initially
recognized at fair value and are subsequently re-measured at fair value. Realized and unrealized gains and losses on investments and
derivatives are recognized in the Statement of Comprehensive Income. Investments and derivatives are derecognized when the rights to
receive cash flows from the investments and derivatives have expired or the Fund has transferred substantially all risks and rewards of
ownership.
Fair value estimation
Investments that are listed or traded on an exchange and investments with prices quoted in over-the-counter markets or by market
makers, are fair valued based on quoted "bid" prices on long investments and quoted "ask" prices on investments sold short. When
trading in the securities of an investee company is suspended, the investment is valued at the Manager's estimate of its fair value.
Debt securities are fair valued based on quoted prices inclusive of accrued interest.
Investments in collective investment schemes are stated at fair value based on the net asset value per unit of the respective funds as
determined by the administrators of the relevant funds or stated at "bid" prices if the collective investment schemes are listed or traded
on an exchange.
Open future and swap contracts are valued at "bid" prices for long positions and "ask" prices for short positions at the valuation date.
The differences between the bid/ask prices and the contract prices are recognized in the Statement of Comprehensive Income.

JPMORGAN GLOBAL PROPERTY INCOME FUNDJPMORGAN GLOBAL PROPERTY INCOME FUNDJPMORGAN GLOBAL PROPERTY INCOME FUNDJPMORGAN GLOBAL PROPERTY INCOME FUND (Formerly (Formerly (Formerly (Formerly known as JPM GLOBAL PROPERTY INCOME FUND)known as JPM GLOBAL PROPERTY INCOME FUND)known as JPM GLOBAL PROPERTY INCOME FUND)known as JPM GLOBAL PROPERTY INCOME FUND)
SemiSemiSemiSemi----annual report for theannual report for theannual report for theannual report for the
period ended 31 March 2013period ended 31 March 2013period ended 31 March 2013period ended 31 March 2013
- 106 -
Open option contracts are valued at "bid" prices for long positions and "ask" prices for short positions at the valuation date. The
differences between the bid/ask prices and the premium amounts/contract prices are recognized in the Statement of Comprehensive
Income.
Forward foreign exchange contracts are valued at the forward rates ruling at the valuation date. The differences between the forward
rates and the contract rates are recognized in the Statement of Comprehensive Income.
(c)(c)(c)(c) Securities borrowingSecurities borrowingSecurities borrowingSecurities borrowing
The Fund may enter into securities borrowing arrangements for short sale purposes. Short positions represent obligations to deliver
securities sold but not yet purchased, and are accounted for as investments and valued at their fair value. Securities borrowed during the
period/year are off-balance sheet transactions and are therefore not included in the investment portfolio of the Fund. Collateral placed
for the purpose of securities borrowed generally consist of cash collateral and are included in the Statement of Financial Position
separately.
(d)(d)(d)(d) Foreign currency translationForeign currency translationForeign currency translationForeign currency translation
Functional and presentation currency
The Fund has adopted United States dollar as its functional and presentation currency.
Transactions and balances
Foreign currency transactions are translated into the functional currency using the exchange rates prevailing at the dates of the
transactions.
Foreign exchange gains and losses resulting from the settlement of such transactions and from the translation of assets and liabilities
denominated in foreign currencies at period/year end exchange rates are recognized in the Statement of Comprehensive Income.
Foreign exchange gains and losses relating to cash and cash equivalents are presented in the Statement of Comprehensive Income
within "Net foreign currency exchange gains/losses". Foreign exchange gains and losses relating to the financial assets and liabilities
carried at fair value through profit or loss are presented in the Statement of Comprehensive Income within "Net gains/losses on
investments and derivatives".
(e)(e)(e)(e) Proceeds and payments on allotment and redemption of unitsProceeds and payments on allotment and redemption of unitsProceeds and payments on allotment and redemption of unitsProceeds and payments on allotment and redemption of units
The net asset value per unit is computed for each dealing day. The price at which units are allotted or redeemed is calculated by
reference to the net asset value per unit as at the close of business on the relevant dealing day in accordance with the provisions of the
Fund's Trust Deed dated 6 July 2005, as amended, which may be different from the accounting policies stated in the financial statements.
Units of the Fund are redeemable at the option of the holders of redeemable units and are classified as a financial liability in the
Statement of Financial Position which represents the net assets attributable to holders of redeemable units (or "net asset value" or "net
assets" or "NAV") and is carried at the redemption amount that would be payable at the Statement of Financial Position date if the
holders of redeemable units exercised the right to redeem units of the Fund.

JPMORGAN GLOBAL PROPERTY INCOME FUNDJPMORGAN GLOBAL PROPERTY INCOME FUNDJPMORGAN GLOBAL PROPERTY INCOME FUNDJPMORGAN GLOBAL PROPERTY INCOME FUND (Formerly (Formerly (Formerly (Formerly known as JPM GLOBAL PROPERTY INCOME FUND)known as JPM GLOBAL PROPERTY INCOME FUND)known as JPM GLOBAL PROPERTY INCOME FUND)known as JPM GLOBAL PROPERTY INCOME FUND)
SemiSemiSemiSemi----annual report for theannual report for theannual report for theannual report for the
period ended 31 March 2013period ended 31 March 2013period ended 31 March 2013period ended 31 March 2013
- 107 -
3333 Net assets attributable to holders of redeemable units and number Net assets attributable to holders of redeemable units and number Net assets attributable to holders of redeemable units and number Net assets attributable to holders of redeemable units and number of units in issueof units in issueof units in issueof units in issue
Fair value adjustment of units of the Fund
As stated in Note 2(e), units of the Fund are redeemable at the option of the holders of redeemable units and are classified as a financial
liability in the Statement of Financial Position which represents the net assets attributable to the holders of redeemable units and is carried at
the redemption amount that would be payable at the Statement of Financial Position date, if the holders of redeemable units exercised the
right to redeem units of the Fund. The redemption amount is determined based on the net assets attributable to holders of redeemable units
calculated in accordance with the provisions of the Fund's Trust Deed dated 6 July 2005, as amended ("Trust Deed NAV").
31.3.2013 30.9.2012
US$ US$
Net assets attributable to holders of redeemable units (before fair value adjustment) 28,899,210 20,576,862
Fair value adjustment of units of the Fund:
Difference between bid/ask prices and last traded prices basis in valuing investments and
derivatives as at the end of the period [Note 3(a)] 74,169 31,111
Net assets attributable to holders of redeemable units (after fair value adjustment) 28,973,379 20,607,973
Note:
(a) Listed investments, investments and derivatives with prices quoted in over-the-counter markets or by market makers are stated at the
last traded prices for the purpose of the Trust Deed NAV. As stated in Note 2(b), the accounting policy of the Fund for the purpose of
compliance with Hong Kong Accounting Standards 39, "Financial Instruments: Recognition and Measurement" and for reporting purposes
is to value its investments and derivatives at fair value based on the relevant bid/ask market prices on the Statement of Financial
Position date.
Number of units in issue
31.3.2013 30.9.2012
Units Units
Number of units in issue 3,220,626.042 2,647,106.221
US$ US$
Net assets attributable to holders of redeemable units
(after fair value adjustment) 28,973,379 20,607,973
Net assets attributable to holders of redeemable units (per unit) 9.00 7.79

JPMORGAN GLOBAL PROPERTY INCOME FUNDJPMORGAN GLOBAL PROPERTY INCOME FUNDJPMORGAN GLOBAL PROPERTY INCOME FUNDJPMORGAN GLOBAL PROPERTY INCOME FUND (Formerly (Formerly (Formerly (Formerly known as JPM GLOBAL PROPERTY INCOME FUND)known as JPM GLOBAL PROPERTY INCOME FUND)known as JPM GLOBAL PROPERTY INCOME FUND)known as JPM GLOBAL PROPERTY INCOME FUND)
SemiSemiSemiSemi----annual report for theannual report for theannual report for theannual report for the
period ended 31 March 2013period ended 31 March 2013period ended 31 March 2013period ended 31 March 2013
- 108 -
4444 Net gains on investments and derivativesNet gains on investments and derivativesNet gains on investments and derivativesNet gains on investments and derivatives
1.10.2012
to
31.3.2013
1.10.2011
to
31.3.2012
US$ US$
Change in unrealized gains/losses in value of investments and derivatives 1,542,197 1,841,266
Realized gains on sale of investments and derivatives 1,863,832 130,372
3,406,029 1,971,638
5555 DistributionDistributionDistributionDistribution
In accordance with the Explanatory Memorandum of the Fund, in respect of each accounting period, the Fund will distribute at least 85% of
the net operating profit of the Fund after making certain adjustments to the holders of redeemable units. The distribution is included under
finance costs in the Statement of Comprehensive Income.
1.10.2012
to
31.3.2013
1.10.2011
to
31.3.2012
US$ US$
Net operating profit 3,612,901 2,349,437
Adjustments:
Net gains on investments and derivatives (3,406,029) (1,971,638)
Net foreign currency exchange losses 2,213 795
Transaction costs 42,623 6,352
Interest paid (1) (16)
Taxation (100,385) (120,124)
Amount available for distribution 151,322 264,806
Distribution of
US$0.0270 per unit on 2,707,390.173 units ex on 31 December 2012
and pay on 9 January 2013 (73,100)
(2012: US$0.0536 per unit on 2,707,831.796 units ex on 30 December 2011
and pay on 10 January 2012)
(145,139)
US$0.0139 per unit on 3,218,644.206 units ex on 28 March 2013
and pay on 10 April 2013 (44,739)
(2012: US$0.0352 per unit on 2,723,310.031 units ex on 30 March 2012
and pay on 12 April 2012)
(95,861)
Total distribution to holders of redeemable units (117,839) (241,000)
In the event that the amount available for distribution is insufficient to pay distributions as the Fund declares, the Manager may in its
discretion determine that such distributions be paid from capital.
6666 Soft commission arrangementsSoft commission arrangementsSoft commission arrangementsSoft commission arrangements
The Investment Manager has entered into soft commission arrangements with brokers under which certain goods and services used to
support investment decision making are received by the Investment Manager. The Investment Manager does not make direct payment for
these services but transacts an agreed amount of business with the brokers on behalf of the Fund. Commission is paid from the Fund on these
transactions.
The goods and services must be of demonstrable benefit to the Fund and may include research and advisory services; economic and political
analysis; portfolio analysis, including valuation and performance measurement; market analysis, data and quotation services, computer
hardware and software incidental to the above goods and services; clearing and custodian services and investment-related publications.

JPMORGAN GREATER CHINA SMALLER COMPANIES FUNDJPMORGAN GREATER CHINA SMALLER COMPANIES FUNDJPMORGAN GREATER CHINA SMALLER COMPANIES FUNDJPMORGAN GREATER CHINA SMALLER COMPANIES FUND (Formerly known as JF Greater (Formerly known as JF Greater (Formerly known as JF Greater (Formerly known as JF Greater China Smaller Companies Fund)China Smaller Companies Fund)China Smaller Companies Fund)China Smaller Companies Fund)
SemiSemiSemiSemi----annual report for theannual report for theannual report for theannual report for the
period ended 31 March 2013period ended 31 March 2013period ended 31 March 2013period ended 31 March 2013
- 109 -
Investment PortfolioInvestment PortfolioInvestment PortfolioInvestment Portfolio
As at 31 March 2013As at 31 March 2013As at 31 March 2013As at 31 March 2013 (Unaudited)(Unaudited)(Unaudited)(Unaudited)
HoldingHoldingHoldingHolding
FairFairFairFair
valuevaluevaluevalue
HK$HK$HK$HK$
% of% of% of% of
netnetnetnet
assetsassetsassetsassets
Listed/Quoted InvestmentsListed/Quoted InvestmentsListed/Quoted InvestmentsListed/Quoted Investments (99.2%)
EquitiesEquitiesEquitiesEquities (99.2%)
ChinaChinaChinaChina (41.4%)
Asia Cement China Hldgs 1,350,000 5,265,000 2.6
Bosideng Intl Hldgs 1,740,000 4,176,000 2.0
China Lilang 518,000 2,491,580 1.2
China Overseas Grand Oceans 184,000 1,880,480 0.9
China Suntien Green Energy
'H' 2,440,000 5,172,800 2.5
Dah Chong Hong Hldgs 637,000 4,675,580 2.3
Greatview Aseptic Packaging 443,000 2,259,300 1.1
Haier Electronics Group 503,000 6,227,140 3.1
Haitian Intl Hldgs 552,000 6,668,160 3.3
Hengdeli Hldgs 412,000 885,800 0.4
Home Inns & Hotels Mgt ADR 10,571 2,443,716 1.2
Hopefluent Group Hldgs 1,446,487 3,399,244 1.7
Huadian Fuxin Energy 'H' 608,000 1,179,520 0.6
Kingboard Chemical Hldgs 188,500 4,156,425 2.0
Kingboard Laminates Hldgs 586,000 1,998,260 1.0
KWG Property Hldg 1,111,500 5,390,775 2.6
Lonking Hldgs 604,000 1,063,040 0.5
Minth Group 610,000 6,954,000 3.4
REXLot Hldgs 4,525,000 3,031,750 1.5
Shanda Games ADR 38,356 884,300 0.4
Shenguan Hldgs (Group) 490,000 1,969,800 1.0
Skyworth Digital Hldgs 907,896 4,721,059 2.3
Towngas China 629,000 4,484,770 2.2
Weiqiao Textile 'H' 309,000 1,322,520 0.7
Yuexiu REIT 407,000 1,790,800 0.9
Hong KongHong KongHong KongHong Kong (34.4%)
Chong Hing Bank 233,000 4,436,320 2.2
Dah Sing Banking Group 354,897 3,769,006 1.9
Dah Sing Financial Hldgs 122,400 4,969,440 2.4
Emperor Watch & Jewellery 3,280,000 2,558,400 1.3
Guotai Junan Intl Hldgs 1,301,000 4,384,370 2.2
I.T Ltd 532,000 1,681,120 0.8
Le Saunda Hldgs 778,000 1,890,540 0.9
Luk Fook Hldgs Intl 83,000 2,045,950 1.0
Man Wah Hldgs 183,600 1,358,640 0.7
Midland Hldgs 1,792,000 6,128,640 3.0
Pacific Textile Hldgs 231,000 1,914,990 0.9
Prosperity REIT 1,756,000 4,706,080 2.3
Sa Sa Intl Hldgs 690,000 5,161,200 2.5
Samson Hldg 789,000 1,159,830 0.6
Shun Tak Hldgs 1,666,750 6,950,348 3.4
Singamas Container Hldgs 2,084,000 4,168,000 2.0
SOCAM Development 226,000 2,149,260 1.1
Techtronic Industries 151,000 2,853,900 1.4
Trinity Ltd 770,000 3,033,800 1.5
Tsui Wah Hldgs 162,000 631,800 0.3
Xinyi Glass Hldgs 520,000 2,844,400 1.4
YGM Trading 56,000 1,220,800 0.6
TaiwanTaiwanTaiwanTaiwan (23.4%)
Casetek Hldgs 30,000 1,113,678 0.5
Chailease Hldg 171,000 3,680,045 1.8
China Steel Chemical 30,000 1,144,830 0.6
(Continued)
HoldingHoldingHoldingHolding
FairFairFairFair
valuevaluevaluevalue
HK$HK$HK$HK$
% of% of% of% of
netnetnetnet
assetsassetsassetsassets
CTCI Corp 149,000 2,258,924 1.1
Epistar Corp 88,000 1,231,329 0.6
Genius Electronic Optical 18,518 910,974 0.5
Giant Manufacturing 122,000 5,273,228 2.6
Gourmet Master 28,700 1,251,681 0.6
Huaku Development 205,227 3,942,473 1.9
Johnson Health Tech 182,875 4,002,068 2.0
Oriental Union Chemical 231,200 1,857,595 0.9
PCHome Online 68,430 2,291,600 1.1
Phison Electronics 22,000 1,310,714 0.6
Poya Co 47,000 1,161,548 0.6
Prince Housing &
Development 960,492 5,298,528 2.6
Radiant Opto-Electronics 39,000 1,189,611 0.6
Rotam Global Agrosciences 49,000 931,129 0.5
Ruentex Development 237,000 3,746,866 1.8
TXC Corp 169,000 1,967,667 1.0
WPG Hldgs 349,480 3,111,852 1.5
Total Listed/Quoted InvestmentsTotal Listed/Quoted InvestmentsTotal Listed/Quoted InvestmentsTotal Listed/Quoted Investments 202,184,993 99.2
Other net assetsOther net assetsOther net assetsOther net assets 1,707,871 0.8
Net assets attributable to holders of Net assets attributable to holders of Net assets attributable to holders of Net assets attributable to holders of
redeemable units at 31 March 2013redeemable units at 31 March 2013redeemable units at 31 March 2013redeemable units at 31 March 2013 203,892,864 100.0
Total investments, at costTotal investments, at costTotal investments, at costTotal investments, at cost 191,573,891

JPMORGAN GREATER CHINA SMALLER COMPANIES FUNDJPMORGAN GREATER CHINA SMALLER COMPANIES FUNDJPMORGAN GREATER CHINA SMALLER COMPANIES FUNDJPMORGAN GREATER CHINA SMALLER COMPANIES FUND (Formerly known as JF Greater (Formerly known as JF Greater (Formerly known as JF Greater (Formerly known as JF Greater China Smaller Companies Fund)China Smaller Companies Fund)China Smaller Companies Fund)China Smaller Companies Fund)
SemiSemiSemiSemi----annual report for theannual report for theannual report for theannual report for the
period ended 31 March 2013period ended 31 March 2013period ended 31 March 2013period ended 31 March 2013
- 110 -
Statement of Movements in Portfolio HoldingsStatement of Movements in Portfolio HoldingsStatement of Movements in Portfolio HoldingsStatement of Movements in Portfolio Holdings
For the period ended 31 March 2013For the period ended 31 March 2013For the period ended 31 March 2013For the period ended 31 March 2013 (Unaudited)(Unaudited)(Unaudited)(Unaudited)
% holdings% holdings% holdings% holdings
of net assetsof net assetsof net assetsof net assets
31.3.201331.3.201331.3.201331.3.2013 30.9.201230.9.201230.9.201230.9.2012
Listed/Quoted InvestmentsListed/Quoted InvestmentsListed/Quoted InvestmentsListed/Quoted Investments
EquitiesEquitiesEquitiesEquities
China 41.4 37.3
Hong Kong 34.4 37.5
Taiwan 23.4 23.8
Total Listed/Quoted InvestmentsTotal Listed/Quoted InvestmentsTotal Listed/Quoted InvestmentsTotal Listed/Quoted Investments 99.2 98.6
Other net assetsOther net assetsOther net assetsOther net assets 0.8 1.4
Net assets attributable to holders of Net assets attributable to holders of Net assets attributable to holders of Net assets attributable to holders of
redeemable unitsredeemable unitsredeemable unitsredeemable units 100.0 100.0

JPMORGAN GREATER CHINA SMALLER COMPANIES FUNDJPMORGAN GREATER CHINA SMALLER COMPANIES FUNDJPMORGAN GREATER CHINA SMALLER COMPANIES FUNDJPMORGAN GREATER CHINA SMALLER COMPANIES FUND (Formerly known as JF Greater (Formerly known as JF Greater (Formerly known as JF Greater (Formerly known as JF Greater China Smaller Companies Fund)China Smaller Companies Fund)China Smaller Companies Fund)China Smaller Companies Fund)
SemiSemiSemiSemi----annual report for theannual report for theannual report for theannual report for the
period ended 31 March 2013period ended 31 March 2013period ended 31 March 2013period ended 31 March 2013
The notes on pages 113 to 115 form part of these financial statements.
- 111 -
Statement of Financial PositionStatement of Financial PositionStatement of Financial PositionStatement of Financial Position
As at 31 March 2013As at 31 March 2013As at 31 March 2013As at 31 March 2013 (Unaudited)(Unaudited)(Unaudited)(Unaudited)
31.3.201331.3.201331.3.201331.3.2013 30.9.201230.9.201230.9.201230.9.2012
HK$HK$HK$HK$ HK$HK$HK$HK$
AssetsAssetsAssetsAssets
Cash at banks 1,680,089 4,507,909
Amounts due from brokers - 2,855,183
Amounts receivable on allotment 256,457 33,514
Investments 202,184,993 184,234,282
Dividend and other accounts
receivable 642,262 1,083,293
Total assetsTotal assetsTotal assetsTotal assets 204,763,801 192,714,181
---------- ----------
LiabilitiesLiabilitiesLiabilitiesLiabilities
Amounts due to brokers 240,951 4,537,715
Amounts payable on redemption 259,355 737,204
Other accounts payable 370,631 504,326
Total liabilitiesTotal liabilitiesTotal liabilitiesTotal liabilities 870,937 5,779,245
---------- ----------
Net assets attributable to holders Net assets attributable to holders Net assets attributable to holders Net assets attributable to holders
of redeemable units of redeemable units of redeemable units of redeemable units [Note 3] 203,892,864 186,934,936
EquityEquityEquityEquity 203,892,864 186,934,936
Statement of Comprehensive IncomeStatement of Comprehensive IncomeStatement of Comprehensive IncomeStatement of Comprehensive Income
For the period ended 31 March 2013For the period ended 31 March 2013For the period ended 31 March 2013For the period ended 31 March 2013 (Unaudited)(Unaudited)(Unaudited)(Unaudited)
1.10.20121.10.20121.10.20121.10.2012
totototo
31.3.201331.3.201331.3.201331.3.2013
1.10.20111.10.20111.10.20111.10.2011
totototo
31.3.201231.3.201231.3.201231.3.2012
HK$HK$HK$HK$ HK$HK$HK$HK$
IncomeIncomeIncomeIncome
Net gains on investments and
derivatives [Note 4] 32,749,449 44,805,936
Dividend income 628,564 722,154
Net foreign currency exchange
gains 16,402 185,652
Interest on deposits - 18
Other income - 5,832
33,394,415 45,719,592
---------- ----------
ExpensesExpensesExpensesExpenses
Management fee 1,709,436 1,929,788
Transaction costs 487,472 777,407
Auditor's fee 75,788 77,181
Registrar's fee 73,559 92,483
Valuation fee 65,133 66,847
Trustee's fee 58,621 84,845
Safe custody and bank charges 32,417 65,798
Legal and professional expenses 14,759 182
Printing and publication expenses 11,593 18,111
Other operating expenses 2,250 828
2,531,028 3,113,470
---------- ----------
Net operating profitNet operating profitNet operating profitNet operating profit 30,863,387 42,606,122
Finance costsFinance costsFinance costsFinance costs
Interest paid (270) -
Profit before taxationProfit before taxationProfit before taxationProfit before taxation 30,863,117 42,606,122
Taxation (49,570) (41,719)
Increase in net assets Increase in net assets Increase in net assets Increase in net assets
attributable to holders of attributable to holders of attributable to holders of attributable to holders of
redeemable units and total redeemable units and total redeemable units and total redeemable units and total
comprehensive incomecomprehensive incomecomprehensive incomecomprehensive income 30,813,547 42,564,403

JPMORGAN GREATER CHINA SMALLER COMPANIES FUNDJPMORGAN GREATER CHINA SMALLER COMPANIES FUNDJPMORGAN GREATER CHINA SMALLER COMPANIES FUNDJPMORGAN GREATER CHINA SMALLER COMPANIES FUND (Formerly known as JF Greater (Formerly known as JF Greater (Formerly known as JF Greater (Formerly known as JF Greater China Smaller Companies Fund)China Smaller Companies Fund)China Smaller Companies Fund)China Smaller Companies Fund)
SemiSemiSemiSemi----annual report for theannual report for theannual report for theannual report for the
period ended 31 March 2013period ended 31 March 2013period ended 31 March 2013period ended 31 March 2013
The notes on pages 113 to 115 form part of these financial statements.
- 112 -
Statement of Changes in Net Assets Attributable to Holders Statement of Changes in Net Assets Attributable to Holders Statement of Changes in Net Assets Attributable to Holders Statement of Changes in Net Assets Attributable to Holders
of Redeemable Unitsof Redeemable Unitsof Redeemable Unitsof Redeemable Units
For the period ended 31 March 2013For the period ended 31 March 2013For the period ended 31 March 2013For the period ended 31 March 2013 (Unaudited)(Unaudited)(Unaudited)(Unaudited)
1.10.20121.10.20121.10.20121.10.2012
totototo
31.3.201331.3.201331.3.201331.3.2013
1.10.20111.10.20111.10.20111.10.2011
totototo
31.3.201231.3.201231.3.201231.3.2012
HK$HK$HK$HK$ HK$HK$HK$HK$
Net assets attributable to holders Net assets attributable to holders Net assets attributable to holders Net assets attributable to holders
of of of of redeemable units at the redeemable units at the redeemable units at the redeemable units at the
beginning of the periodbeginning of the periodbeginning of the periodbeginning of the period 186,934,936 218,590,106
---------- ----------
Allotment of redeemable units 21,606,248 16,771,602
Redemption of redeemable units (35,461,867) (56,004,856)
Net redemptionNet redemptionNet redemptionNet redemption (13,855,619) (39,233,254)
---------- ----------
173,079,317 179,356,852
Increase in net assets Increase in net assets Increase in net assets Increase in net assets
attributable to holders of attributable to holders of attributable to holders of attributable to holders of
redeemable units and total redeemable units and total redeemable units and total redeemable units and total
comprehensive incomecomprehensive incomecomprehensive incomecomprehensive income 30,813,547 42,564,403
Net assets Net assets Net assets Net assets attributable to holders attributable to holders attributable to holders attributable to holders
of redeemable units at the end of redeemable units at the end of redeemable units at the end of redeemable units at the end
of the periodof the periodof the periodof the period 203,892,864 221,921,255
Statement of Cash FlowsStatement of Cash FlowsStatement of Cash FlowsStatement of Cash Flows
For the period ended 31 March 2013For the period ended 31 March 2013For the period ended 31 March 2013For the period ended 31 March 2013 (Unaudited)(Unaudited)(Unaudited)(Unaudited)
1.10.20121.10.20121.10.20121.10.2012
totototo
31.3.201331.3.201331.3.201331.3.2013
1.10.20111.10.20111.10.20111.10.2011
totototo
31.3.201231.3.201231.3.201231.3.2012
HK$HK$HK$HK$ HK$HK$HK$HK$
Operating activitiesOperating activitiesOperating activitiesOperating activities
Purchase of investments and
derivatives (67,445,680) (116,675,073)
Proceeds from disposal of
investments and derivatives 80,944,913 145,986,796
Dividend received 949,163 1,577,245
Interest received - 18
Tax paid (49,570) (59,638)
Trustee's fee paid (57,791) (96,455)
Registrar's fee paid (145,284) (196,845)
Transaction costs paid (514,621) (802,527)
Management fee paid (1,685,404) (1,964,829)
Others (259,711) (122,117)
Net cash inflow from Net cash inflow from Net cash inflow from Net cash inflow from operating operating operating operating
activitiesactivitiesactivitiesactivities 11,736,015 27,646,575
---------- ----------
Financing activitiesFinancing activitiesFinancing activitiesFinancing activities
Interest paid (270) -
Receipts on allotment of
redeemable units 21,383,305 16,799,761
Payments on redemption of
redeemable units (35,939,716) (57,459,996)
Net cash outflow from Net cash outflow from Net cash outflow from Net cash outflow from
financing activitiesfinancing activitiesfinancing activitiesfinancing activities (14,556,681) (40,660,235)
---------- ----------
Decrease in cash and cash Decrease in cash and cash Decrease in cash and cash Decrease in cash and cash
equivalentsequivalentsequivalentsequivalents (2,820,666) (13,013,660)
Cash and cash equivalents at the
beginning of the period 4,507,909 18,068,809
Exchange losses on cash and cash
equivalents (7,154) (2,498)
Cash and cash equivalents at Cash and cash equivalents at Cash and cash equivalents at Cash and cash equivalents at
the end of the periodthe end of the periodthe end of the periodthe end of the period 1,680,089 5,052,651
Analysis of balances of cash and cash equivalents:Analysis of balances of cash and cash equivalents:Analysis of balances of cash and cash equivalents:Analysis of balances of cash and cash equivalents:
Cash at banks 1,680,089 5,052,651

JPMORGAN GREATER CHINA SMALLER COMPANIES FUNDJPMORGAN GREATER CHINA SMALLER COMPANIES FUNDJPMORGAN GREATER CHINA SMALLER COMPANIES FUNDJPMORGAN GREATER CHINA SMALLER COMPANIES FUND (Formerly known as JF Greater China Smaller Companies Fund)(Formerly known as JF Greater China Smaller Companies Fund)(Formerly known as JF Greater China Smaller Companies Fund)(Formerly known as JF Greater China Smaller Companies Fund)
SemiSemiSemiSemi----annual report for theannual report for theannual report for theannual report for the
period ended 31 March 2period ended 31 March 2period ended 31 March 2period ended 31 March 2013013013013
- 113 -
Notes to the Financial StatementsNotes to the Financial StatementsNotes to the Financial StatementsNotes to the Financial Statements
1111 The FundThe FundThe FundThe Fund
JPMorgan Greater China Smaller Companies Fund (the "Fund") was established under a Trust Deed dated 26 August 2009, as amended, and is
governed by the laws of Hong Kong. The Fund is authorized by the Securities and Futures Commission of Hong Kong.
With effect from 4 February 2013, the name of the Fund was changed from JF Greater China Smaller Companies Fund to JPMorgan Greater
China Smaller Companies Fund.
The investment objective of the Fund is to provide investors with long-term capital growth by investing primarily in the securities of small to
medium-sized companies in the People's Republic of China, Hong Kong and Taiwan ("Greater China").
Pursuant to the Supplemental Trust Deed dated 4 January 2013, the Manager may decide to issue separate classes (each a "Class") whose
assets will be commonly invested but where a specific fee structure, currency or distribution policy may be applied. Each Class may have a
different charging structure with the result that the net asset value attributable to each Class may differ.
All unitholders' rights with regard to the convening, voting or otherwise acting at any meeting of unitholders are the same.
2222 Summary of principal accounting policiesSummary of principal accounting policiesSummary of principal accounting policiesSummary of principal accounting policies
(a)(a)(a)(a) Accounting policies of interim financial statementsAccounting policies of interim financial statementsAccounting policies of interim financial statementsAccounting policies of interim financial statements
The accounting policies and methods of computation used in the preparation of these unaudited condensed interim financial statements
are consistent with those used in the annual financial statements for the year ended 30 September 2012.
(b)(b)(b)(b) Investments and derivatives Investments and derivatives Investments and derivatives Investments and derivatives
Classification
The Fund classifies its investments and derivatives as financial assets or financial liabilities at fair value through profit or loss. These
financial assets or financial liabilities are held-for-trading as they are acquired or incurred principally for the purpose of selling or
repurchasing in the near term or short-term profit taking.
All derivatives are carried in assets when amounts are receivable by the Fund and in liabilities when amounts are payable by the Fund.
The Fund makes short sales in which a borrowed security is sold in anticipation of a decline in the market value of that security, or it may
use short sales for various arbitrage transactions. Short sales are classified as financial liabilities at fair value through profit or loss.
Recognition, derecognition and measurement
Purchases and sales of investments and derivatives are accounted for on the trade date basis. Investments and derivatives are initially
recognized at fair value and are subsequently re-measured at fair value. Realized and unrealized gains and losses on investments and
derivatives are recognized in the Statement of Comprehensive Income. Investments and derivatives are derecognized when the rights to
receive cash flows from the investments and derivatives have expired or the Fund has transferred substantially all risks and rewards of
ownership.
Fair value estimation
Investments that are listed or traded on an exchange and investments with prices quoted in over-the-counter markets or by market
makers, are fair valued based on quoted "bid" prices on long investments and quoted "ask" prices on investments sold short. When
trading in the securities of an investee company is suspended, the investment is valued at the Manager's estimate of its fair value.
Debt securities are fair valued based on quoted prices inclusive of accrued interest.
Investments in collective investment schemes are stated at fair value based on the net asset value per unit of the respective funds as
determined by the administrators of the relevant funds or stated at "bid" prices if the collective investment schemes are listed or traded
on an exchange.
Open future and swap contracts are valued at "bid" prices for long positions and "ask" prices for short positions at the valuation date.
The differences between the bid/ask prices and the contract prices are recognized in the Statement of Comprehensive Income.
Open option contracts are valued at "bid" prices for long positions and "ask" prices for short positions at the valuation date. The
differences between the bid/ask prices and the premium amounts/contract prices are recognized in the Statement of Comprehensive
Income.

JPMORGAN GREATER CHINA SMALLER COMPANIES FUNDJPMORGAN GREATER CHINA SMALLER COMPANIES FUNDJPMORGAN GREATER CHINA SMALLER COMPANIES FUNDJPMORGAN GREATER CHINA SMALLER COMPANIES FUND (Formerly known as JF Greater China Smaller Companies Fund)(Formerly known as JF Greater China Smaller Companies Fund)(Formerly known as JF Greater China Smaller Companies Fund)(Formerly known as JF Greater China Smaller Companies Fund)
SemiSemiSemiSemi----annual report for theannual report for theannual report for theannual report for the
period ended 31 March 2period ended 31 March 2period ended 31 March 2period ended 31 March 2013013013013
- 114 -
Forward foreign exchange contracts are valued at the forward rates ruling at the valuation date. The differences between the forward
rates and the contract rates are recognized in the Statement of Comprehensive Income.
(c)(c)(c)(c) SecSecSecSecurities borrowingurities borrowingurities borrowingurities borrowing
The Fund may enter into securities borrowing arrangements for short sale purposes. Short positions represent obligations to deliver
securities sold but not yet purchased, and are accounted for as investments and valued at their fair value. Securities borrowed during the
period/year are off-balance sheet transactions and are therefore not included in the investment portfolio of the Fund. Collateral placed
for the purpose of securities borrowed generally consist of cash collateral and are included in the Statement of Financial Position
separately.
(d)(d)(d)(d) Foreign currency translationForeign currency translationForeign currency translationForeign currency translation
Functional and presentation currency
The Fund has adopted Hong Kong dollar as its functional and presentation currency.
Transactions and balances
Foreign currency transactions are translated into the functional currency using the exchange rates prevailing at the dates of the
transactions.
Foreign exchange gains and losses resulting from the settlement of such transactions and from the translation of assets and liabilities
denominated in foreign currencies at period/year end exchange rates are recognized in the Statement of Comprehensive Income.
Foreign exchange gains and losses relating to cash and cash equivalents are presented in the Statement of Comprehensive Income
within "Net foreign currency exchange gains/losses". Foreign exchange gains and losses relating to the financial assets and liabilities
carried at fair value through profit or loss are presented in the Statement of Comprehensive Income within "Net gains/losses on
investments and derivatives".
(e)(e)(e)(e) Formation expenses Formation expenses Formation expenses Formation expenses
Formation expenses are recognized as an expense in the period in which they are incurred.
(f)(f)(f)(f) Proceeds and payments on allotment and redemption of unitsProceeds and payments on allotment and redemption of unitsProceeds and payments on allotment and redemption of unitsProceeds and payments on allotment and redemption of units
The net asset value per unit is computed for each dealing day. The price at which units are allotted or redeemed is calculated by
reference to the net asset value per unit as at the close of business on the relevant dealing day in accordance with the provisions of the
Fund's Trust Deed dated 26 August 2009, as amended, which may be different from the accounting policies stated in the financial
statements.
3333 Number of units in issue and net assets attributable to holders of redeemable units (per unit)Number of units in issue and net assets attributable to holders of redeemable units (per unit)Number of units in issue and net assets attributable to holders of redeemable units (per unit)Number of units in issue and net assets attributable to holders of redeemable units (per unit)
31.3.2013 30.9.2012
Units Units
Number of units in issue 23,384,020.650 25,132,944.710
HK$ HK$
Net assets attributable to holders of redeemable units 203,892,864 186,934,936
Net assets attributable to holders of redeemable units (per unit) 8.72 7.44

JPMORGAN GREATER CHINA SMALLER COMPANIES FUNDJPMORGAN GREATER CHINA SMALLER COMPANIES FUNDJPMORGAN GREATER CHINA SMALLER COMPANIES FUNDJPMORGAN GREATER CHINA SMALLER COMPANIES FUND (Formerly known as JF Greater China Smaller Companies Fund)(Formerly known as JF Greater China Smaller Companies Fund)(Formerly known as JF Greater China Smaller Companies Fund)(Formerly known as JF Greater China Smaller Companies Fund)
SemiSemiSemiSemi----annual report for theannual report for theannual report for theannual report for the
period ended 31 March 2period ended 31 March 2period ended 31 March 2period ended 31 March 2013013013013
- 115 -
4444 Net gains on investments and derivatives Net gains on investments and derivatives Net gains on investments and derivatives Net gains on investments and derivatives
1.10.2012
to
31.3.2013
1.10.2011
to
31.3.2012
HK$ HK$
Change in unrealized gains/losses in value of investments and derivatives 25,374,830 86,391,368
Realized gains/(losses) on sale of investments and derivatives 7,374,619 (41,585,432)
32,749,449 44,805,936
5555 Soft commission arrangementsSoft commission arrangementsSoft commission arrangementsSoft commission arrangements
The Investment Manager has entered into soft commission arrangements with brokers under which certain goods and services used to
support investment decision making are received by the Investment Manager. The Investment Manager does not make direct payment for
these services but transacts an agreed amount of business with the brokers on behalf of the Fund. Commission is paid from the Fund on these
transactions.
The goods and services must be of demonstrable benefit to the Fund and may include research and advisory services; economic and political
analysis; portfolio analysis, including valuation and performance measurement; market analysis, data and quotation services, computer
hardware and software incidental to the above goods and services; clearing and custodian services and investment-related publications.
6666 DistributionDistributionDistributionDistribution
No distribution was made during the period (31 March 2012: nil).

JPMORGAN INDIA FUNDJPMORGAN INDIA FUNDJPMORGAN INDIA FUNDJPMORGAN INDIA FUND (Formerly known as JF India Fund)(Formerly known as JF India Fund)(Formerly known as JF India Fund)(Formerly known as JF India Fund)
SemiSemiSemiSemi----annual report for theannual report for theannual report for theannual report for the
period ended 31 March 2013period ended 31 March 2013period ended 31 March 2013period ended 31 March 2013
- 116 -
Distributor StatusDistributor StatusDistributor StatusDistributor Status
The Fund has been certified by HMRC in the UK as a
distributing fund in respect of the period from 23 November
1989 to 30 September 2010. The principal effect of this
certification is that for unitholders resident or ordinarily
resident in the UK for taxation purposes any gains accruing
on the sale, redemption or other disposal of units during
the period will be taxed in the UK as a capital gain and not
as income. This treatment will continue under the new UK
reporting fund regime provided the Fund does not invest
more than 5% of its assets in other offshore funds which
are not themselves reporting funds. There will be no need
to formally apply for reporting fund status as the Fund is
transparent for UK tax purposes and therefore considered
out of scope of the requirements of this new regime.
As noted, the Fund is transparent for UK income tax
purposes and UK investors are subject to UK capital gains
tax on disposal of their units. UK investors are subject to tax
on their share of income of the Fund on an arising basis.
Information has been provided to UK investors of the
amount of their share of the underlying income, expenses
and overseas tax suffered.
Investment PortfolioInvestment PortfolioInvestment PortfolioInvestment Portfolio
As at 31 March 2013As at 31 March 2013As at 31 March 2013As at 31 March 2013 (Unaudited)(Unaudited)(Unaudited)(Unaudited)
HoldingHoldingHoldingHolding
FairFairFairFair
valuevaluevaluevalue
US$US$US$US$
% of% of% of% of
netnetnetnet
assetsassetsassetsassets
Listed/Quoted InvestmentsListed/Quoted InvestmentsListed/Quoted InvestmentsListed/Quoted Investments (99.4%)
EquitiesEquitiesEquitiesEquities (99.4%)
IndiaIndiaIndiaIndia (99.4%)
Auto ComponentsAuto ComponentsAuto ComponentsAuto Components (0.6%)
Exide Industries 3,500,000 8,326,587 0.6
AutomobilesAutomobilesAutomobilesAutomobiles (9.7%)
Bajaj Auto 310,473 10,152,496 0.7
Mahindra & Mahindra 3,356,000 53,183,492 3.7
Maruti Suzuki India 695,040 16,314,769 1.1
Tata Motors 10,311,459 51,064,015 3.6
Tata Motors 'A' 2,963,000 8,305,668 0.6
BiotechnologyBiotechnologyBiotechnologyBiotechnology (0.3%)
Biocon Ltd 862,606 4,324,933 0.3
ChemicalsChemicalsChemicalsChemicals (2.6%)
Godrej Industries 3,360,556 17,999,225 1.2
Grasim Industries 362,400 19,602,141 1.4
Commercial BanksCommercial BanksCommercial BanksCommercial Banks (14.7%)
HDFC Bank 11,982,570 137,871,208 9.6
ICICI Bank 486,000 9,346,223 0.7
ICICI Bank ADR 240,000 10,296,000 0.7
IndusInd Bank 3,994,368 29,632,552 2.1
ING Vysya Bank 2,286,661 23,436,698 1.6
Construction & EngineeringConstruction & EngineeringConstruction & EngineeringConstruction & Engineering (1.8%)
Larsen & Toubro 1,016,626 25,555,004 1.8
HoldingHoldingHoldingHolding
FairFairFairFair
valuevaluevaluevalue
US$US$US$US$
% of% of% of% of
netnetnetnet
assetsassetsassetsassets
Construction MaterialsConstruction MaterialsConstruction MaterialsConstruction Materials (6.0%)
ACC Ltd 1,925,852 41,032,872 2.9
Ambuja Cements 13,199,708 42,209,922 2.9
Ultratech Cement 95,000 3,266,794 0.2
Consumer FinanceConsumer FinanceConsumer FinanceConsumer Finance (2.2%)
Mahindra & Mahindra Fin
Services 5,807,045 20,834,844 1.5
Shriram Transport Finance 775,254 9,887,163 0.7
Diversified Financial ServicesDiversified Financial ServicesDiversified Financial ServicesDiversified Financial Services (7.4%)
IDFC Ltd 26,240,000 69,136,486 4.9
Kotak Mahindra Bank 2,995,054 35,984,733 2.5
Electrical EquipmentElectrical EquipmentElectrical EquipmentElectrical Equipment (1.2%)
Bharat Heavy Electricals 5,189,526 16,900,572 1.2
Independent Power Producers & Energy TradersIndependent Power Producers & Energy TradersIndependent Power Producers & Energy TradersIndependent Power Producers & Energy Traders (1.5%)
NTPC Ltd 8,226,734 21,448,541 1.5
IT ServicesIT ServicesIT ServicesIT Services (14.3%)
Infosys Ltd 2,623,330 139,203,012 9.7
Tata Consultancy Services 1,715,000 49,556,716 3.5
Wipro Ltd 2,018,000 16,231,255 1.1
Life Sciences Tools & ServicesLife Sciences Tools & ServicesLife Sciences Tools & ServicesLife Sciences Tools & Services (0.9%)
Divi's Laboratories 730,000 13,263,569 0.9
MachineryMachineryMachineryMachinery (0.5%)
Cummins India 830,000 7,482,981 0.5
Metals & MiningMetals & MiningMetals & MiningMetals & Mining (1.2%)
Hindalco Industries 4,375,277 7,365,922 0.5
Jindal Steel & Power 1,575,206 10,078,710 0.7
Oil & Gas & Consumable FuelsOil & Gas & Consumable FuelsOil & Gas & Consumable FuelsOil & Gas & Consumable Fuels (8.2%)
Bharat Petroleum 1,067,792 7,387,117 0.5
Hindustan Petroleum 791,013 4,131,169 0.3
Reliance Industries 7,451,099 105,960,523 7.4
PharmaceuticalsPharmaceuticalsPharmaceuticalsPharmaceuticals (5.3%)
Cadila Healthcare 550,000 7,516,329 0.6
DR Reddy's Laboratories 757,000 24,582,652 1.7
Sun Pharma Advanced
Research 2,859,122 5,978,642 0.4
Sun Pharma Advanced
Research-AC 408,446 854,092 0.1
Sun Pharmaceutical Industries 2,397,571 36,126,785 2.5
Real Estate Management & DevelopmentReal Estate Management & DevelopmentReal Estate Management & DevelopmentReal Estate Management & Development (1.2%)
Godrej Properties 981,929 9,531,125 0.7
Oberoi Realty 1,696,127 8,040,609 0.5
Thrifts & Mortgage Thrifts & Mortgage Thrifts & Mortgage Thrifts & Mortgage FinanceFinanceFinanceFinance (9.8%)
Housing Development Finance 9,225,000 139,597,078 9.8
TobaccoTobaccoTobaccoTobacco (7.3%)
ITC Ltd 18,386,123 104,684,191 7.3

JPMORGAN INDIA FUNDJPMORGAN INDIA FUNDJPMORGAN INDIA FUNDJPMORGAN INDIA FUND (Formerly known as JF India Fund)(Formerly known as JF India Fund)(Formerly known as JF India Fund)(Formerly known as JF India Fund)
SemiSemiSemiSemi----annual report for theannual report for theannual report for theannual report for the
period ended 31 March 2013period ended 31 March 2013period ended 31 March 2013period ended 31 March 2013
- 117 -
Investment PortfolioInvestment PortfolioInvestment PortfolioInvestment Portfolio (Continued)
As at 31 March 2013As at 31 March 2013As at 31 March 2013As at 31 March 2013 (Unaudited)(Unaudited)(Unaudited)(Unaudited)
HoldingHoldingHoldingHolding
FairFairFairFair
valuevaluevaluevalue
US$US$US$US$
% of% of% of% of
netnetnetnet
assetsassetsassetsassets
Wireless Wireless Wireless Wireless Telecommunication ServicesTelecommunication ServicesTelecommunication ServicesTelecommunication Services (2.7%)
Bharti Airtel 7,209,466 38,700,307 2.7
Total Listed/Quoted InvestmentsTotal Listed/Quoted InvestmentsTotal Listed/Quoted InvestmentsTotal Listed/Quoted Investments 1,422,385,722 99.4
Other net assetsOther net assetsOther net assetsOther net assets 9,220,221 0.6
Net assets attributable to holders of Net assets attributable to holders of Net assets attributable to holders of Net assets attributable to holders of
redeemable units at 31 March 2013redeemable units at 31 March 2013redeemable units at 31 March 2013redeemable units at 31 March 2013 1,431,605,943 100.0
Total investments, at costTotal investments, at costTotal investments, at costTotal investments, at cost 1,185,521,475
Statement of Movements in Portfolio HoldingsStatement of Movements in Portfolio HoldingsStatement of Movements in Portfolio HoldingsStatement of Movements in Portfolio Holdings
For the period ended 31 March 2013For the period ended 31 March 2013For the period ended 31 March 2013For the period ended 31 March 2013 (Unaudited)(Unaudited)(Unaudited)(Unaudited)
% holdings% holdings% holdings% holdings
of net of net of net of net assetsassetsassetsassets
31.3.201331.3.201331.3.201331.3.2013 30.9.201230.9.201230.9.201230.9.2012
Listed/Quoted InvestmentsListed/Quoted InvestmentsListed/Quoted InvestmentsListed/Quoted Investments
EquitiesEquitiesEquitiesEquities
IndiaIndiaIndiaIndia
Commercial Banks 14.7 13.5
IT Services 14.3 14.3
Thrifts & Mortgage Finance 9.8 9.5
Automobiles 9.7 9.1
Oil & Gas & Consumable Fuels 8.2 9.1
Diversified Financial Services 7.4 6.5
Tobacco 7.3 7.5
Construction Materials 6.0 7.1
Pharmaceuticals 5.3 4.2
Wireless Telecommunication Services 2.7 2.2
Chemicals 2.6 2.4
Consumer Finance 2.2 1.3
Construction & Engineering 1.8 0.9
Independent Power Producers & Energy
Traders 1.5 1.6
Real Estate Management & Development 1.2 1.2
Metals & Mining 1.2 1.8
Electrical Equipment 1.2 1.5
Life Sciences Tools & Services 0.9 0.9
Auto Components 0.6 0.6
Machinery 0.5 0.5
Biotechnology 0.3 0.3
Total Total Total Total Listed/Quoted InvestmentsListed/Quoted InvestmentsListed/Quoted InvestmentsListed/Quoted Investments 99.4 96.0
Other net assetsOther net assetsOther net assetsOther net assets 0.6 4.0
Net assets attributable to holders of Net assets attributable to holders of Net assets attributable to holders of Net assets attributable to holders of
redeemable unitsredeemable unitsredeemable unitsredeemable units 100.0 100.0
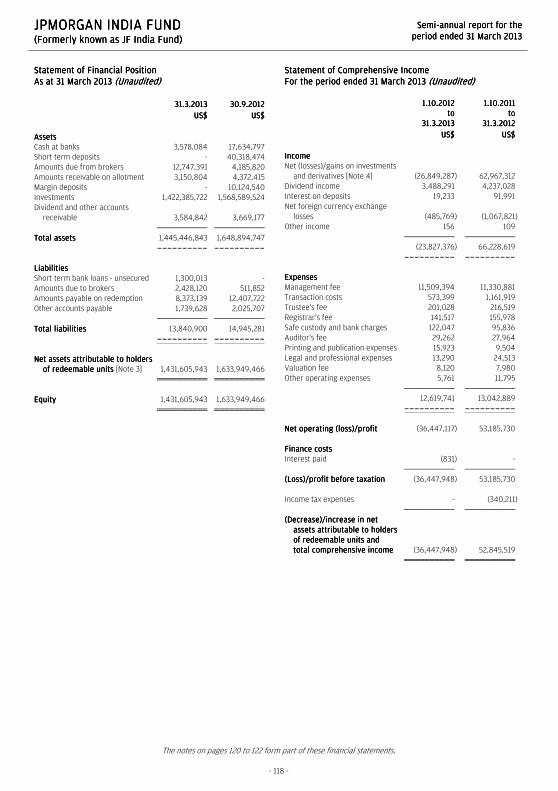
JPMORGAN INDIA FUNDJPMORGAN INDIA FUNDJPMORGAN INDIA FUNDJPMORGAN INDIA FUND (Formerly known as JF India Fund)(Formerly known as JF India Fund)(Formerly known as JF India Fund)(Formerly known as JF India Fund)
SemiSemiSemiSemi----annual report for theannual report for theannual report for theannual report for the
period ended 31 March 2013period ended 31 March 2013period ended 31 March 2013period ended 31 March 2013
The notes on pages 120 to 122 form part of these financial statements.
- 118 -
Statement of Financial PositionStatement of Financial PositionStatement of Financial PositionStatement of Financial Position
As at 31 March 2013As at 31 March 2013As at 31 March 2013As at 31 March 2013 (Unaudited)(Unaudited)(Unaudited)(Unaudited)
31.3.201331.3.201331.3.201331.3.2013 30.9.201230.9.201230.9.201230.9.2012
US$US$US$US$ US$US$US$US$
AssetsAssetsAssetsAssets
Cash at banks 3,578,084 17,634,797
Short term deposits - 40,318,474
Amounts due from brokers 12,747,391 4,185,820
Amounts receivable on allotment 3,150,804 4,372,415
Margin deposits - 10,124,540
Investments 1,422,385,722 1,568,589,524
Dividend and other accounts
receivable 3,584,842 3,669,177
Total assetsTotal assetsTotal assetsTotal assets 1,445,446,843 1,648,894,747
---------- ----------
LiabilitiesLiabilitiesLiabilitiesLiabilities
Short term bank loans - unsecured 1,300,013 -
Amounts due to brokers 2,428,120 511,852
Amounts payable on redemption 8,373,139 12,407,722
Other accounts payable 1,739,628 2,025,707
Total liabilitiesTotal liabilitiesTotal liabilitiesTotal liabilities 13,840,900 14,945,281
---------- ----------
Net assets attributable to holders Net assets attributable to holders Net assets attributable to holders Net assets attributable to holders
of redeemable units of redeemable units of redeemable units of redeemable units [Note 3] 1,431,605,943 1,633,949,466
EquityEquityEquityEquity 1,431,605,943 1,633,949,466
Statement of Comprehensive IncomeStatement of Comprehensive IncomeStatement of Comprehensive IncomeStatement of Comprehensive Income
For the period ended 31 March 2013For the period ended 31 March 2013For the period ended 31 March 2013For the period ended 31 March 2013 (Unaudited)(Unaudited)(Unaudited)(Unaudited)
1.10.20121.10.20121.10.20121.10.2012
totototo
31.3.201331.3.201331.3.201331.3.2013
1.10.20111.10.20111.10.20111.10.2011
totototo
31.3.201231.3.201231.3.201231.3.2012
US$US$US$US$ US$US$US$US$
IncomeIncomeIncomeIncome
Net (losses)/gains on investments
and derivatives [Note 4] (26,849,287) 62,967,312
Dividend income 3,488,291 4,237,028
Interest on deposits 19,233 91,991
Net foreign currency exchange
losses (485,769) (1,067,821)
Other income 156 109
(23,827,376) 66,228,619
---------- ----------
ExpensesExpensesExpensesExpenses
Management fee 11,509,394 11,330,881
Transaction costs 573,399 1,161,919
Trustee's fee 201,028 216,519
Registrar's fee 141,517 155,978
Safe custody and bank charges 122,047 95,836
Auditor's fee 29,262 27,964
Printing and publication expenses 15,923 9,504
Legal and professional expenses 13,290 24,513
Valuation fee 8,120 7,980
Other operating expenses 5,761 11,795
12,619,741 13,042,889
---------- ----------
Net operating (loss)/profitNet operating (loss)/profitNet operating (loss)/profitNet operating (loss)/profit (36,447,117) 53,185,730
Finance costsFinance costsFinance costsFinance costs
Interest paid (831) -
(Loss)/profit before taxation(Loss)/profit before taxation(Loss)/profit before taxation(Loss)/profit before taxation (36,447,948) 53,185,730
Income tax expenses - (340,211)
(Decrease)/increase in net (Decrease)/increase in net (Decrease)/increase in net (Decrease)/increase in net
assets attributable to holdersassets attributable to holders assets attributable to holdersassets attributable to holders
of redeemable units and of redeemable units and of redeemable units and of redeemable units and
total comprehensive incometotal comprehensive incometotal comprehensive incometotal comprehensive income (36,447,948) 52,845,519

JPMORGAN INDIA FUNDJPMORGAN INDIA FUNDJPMORGAN INDIA FUNDJPMORGAN INDIA FUND (Formerly known as JF India Fund)(Formerly known as JF India Fund)(Formerly known as JF India Fund)(Formerly known as JF India Fund)
SemiSemiSemiSemi----annual report for theannual report for theannual report for theannual report for the
period ended 31 March 2013period ended 31 March 2013period ended 31 March 2013period ended 31 March 2013
The notes on pages 120 to 122 form part of these financial statements.
- 119 -
Statement of Changes in Net Assets Attributable to Holders Statement of Changes in Net Assets Attributable to Holders Statement of Changes in Net Assets Attributable to Holders Statement of Changes in Net Assets Attributable to Holders
ofofofof Redeemable UnitsRedeemable UnitsRedeemable UnitsRedeemable Units
For the period ended 31 March 2013For the period ended 31 March 2013For the period ended 31 March 2013For the period ended 31 March 2013 (Unaudited)(Unaudited)(Unaudited)(Unaudited)
1.10.20121.10.20121.10.20121.10.2012
totototo
31.3.201331.3.201331.3.201331.3.2013
1.10.20111.10.20111.10.20111.10.2011
totototo
31.3.201231.3.201231.3.201231.3.2012
US$US$US$US$ US$US$US$US$
Net assets attributable to holders Net assets attributable to holders Net assets attributable to holders Net assets attributable to holders
of redeemable units at the of redeemable units at the of redeemable units at the of redeemable units at the
beginning of the periodbeginning of the periodbeginning of the periodbeginning of the period 1,633,949,466 1,518,488,443
---------- ----------
Allotment of redeemable units 121,853,041 229,907,434
Redemption of redeemable units (287,748,616) (218,354,193)
Net (redemption)/allotmentNet (redemption)/allotmentNet (redemption)/allotmentNet (redemption)/allotment (165,895,575) 11,553,241
---------- ----------
1,468,053,891 1,530,041,684
(Decrease)/increase in net assets (Decrease)/increase in net assets (Decrease)/increase in net assets (Decrease)/increase in net assets
attributable to holders of attributable to holders of attributable to holders of attributable to holders of
redeemable units and total redeemable units and total redeemable units and total redeemable units and total
comprehensive incomecomprehensive incomecomprehensive incomecomprehensive income (36,447,948) 52,845,519
Net assets attributable to holders Net assets attributable to holders Net assets attributable to holders Net assets attributable to holders
of redeemable units at the end of redeemable units at the end of redeemable units at the end of redeemable units at the end
of the of the of the of the periodperiodperiodperiod 1,431,605,943 1,582,887,203
Statement of Cash FlowsStatement of Cash FlowsStatement of Cash FlowsStatement of Cash Flows
For the period ended 31 March 2013For the period ended 31 March 2013For the period ended 31 March 2013For the period ended 31 March 2013 (Unaudited)(Unaudited)(Unaudited)(Unaudited)
1.10.20121.10.20121.10.20121.10.2012
totototo
31.3.201331.3.201331.3.201331.3.2013
1.10.20111.10.20111.10.20111.10.2011
totototo
31.3.201231.3.201231.3.201231.3.2012
US$US$US$US$ US$US$US$US$
Operating activitiesOperating activitiesOperating activitiesOperating activities
Purchase of investments and
derivatives (46,650,834) (182,981,700)
Proceeds from disposal of
investments and derivatives 160,329,756 234,287,698
Decrease in margin deposits 10,124,540 421,645
Dividend received 2,573,981 4,068,279
Interest received 19,824 91,649
Tax paid - (340,211)
Trustee's fee paid (202,526) (227,398)
Registrar's fee paid (275,145) (314,057)
Transaction costs paid (545,846) (1,159,859)
Management fee paid (11,600,170) (11,401,189)
Others (707,235) (1,198,476)
Net cash inflow Net cash inflow Net cash inflow Net cash inflow from operating from operating from operating from operating
activitiesactivitiesactivitiesactivities 113,066,345 41,246,381
---------- ----------
Financing activitiesFinancing activitiesFinancing activitiesFinancing activities
Interest paid (715) -
Receipts on allotment of
redeemable units 123,074,652 231,049,444
Payments on redemption of
redeemable units (291,783,199) (229,474,036)
Net cash (outflow)/inflow from Net cash (outflow)/inflow from Net cash (outflow)/inflow from Net cash (outflow)/inflow from
financing activitiesfinancing activitiesfinancing activitiesfinancing activities (168,709,262) 1,575,408
---------- ----------
(Decrease)/increase in cash (Decrease)/increase in cash (Decrease)/increase in cash (Decrease)/increase in cash
and cash equivalentsand cash equivalentsand cash equivalentsand cash equivalents (55,642,917) 42,821,789
Cash and cash equivalents at the
beginning of the period 57,953,271 54,608,347
Exchange losses on cash and cash
equivalents (32,283) (85,468)
Cash and cash equivalents at Cash and cash equivalents at Cash and cash equivalents at Cash and cash equivalents at
the end of the periodthe end of the periodthe end of the periodthe end of the period 2,278,071 97,344,668
Analysis of balancesAnalysis of balancesAnalysis of balancesAnalysis of balances of cash and cash equivalents:of cash and cash equivalents:of cash and cash equivalents:of cash and cash equivalents:
Cash at banks 3,578,084 10,023,019
Short term deposits - 87,321,649
Short term bank loans -
unsecured (1,300,013) -
2,278,071 97,344,668

JPMORGAN INDIA FUNDJPMORGAN INDIA FUNDJPMORGAN INDIA FUNDJPMORGAN INDIA FUND (Formerly known as JF India Fund)(Formerly known as JF India Fund)(Formerly known as JF India Fund)(Formerly known as JF India Fund)
SemiSemiSemiSemi----annual report for theannual report for theannual report for theannual report for the
period ended 31 March 2013period ended 31 March 2013period ended 31 March 2013period ended 31 March 2013
- 120 -
Notes to the Financial StatementsNotes to the Financial StatementsNotes to the Financial StatementsNotes to the Financial Statements
1111 The FundThe FundThe FundThe Fund
JPMorgan India Fund (the "Fund") was established under a Trust Deed dated 23 November 1989, as amended, and is governed by the laws of
the Republic of Mauritius. The Fund is authorized by the Securities and Futures Commission of Hong Kong.
With effect from 4 February 2013, the name of the Fund was changed from JF India Fund to JPMorgan India Fund.
The investment objective of the Fund is to provide long-term capital growth through a portfolio consisting primarily of securities linked to the
Indian economy. These include, but are not restricted to, securities traded on the stock exchanges of India and the rest of the Indian sub-
continent including Pakistan, Bangladesh and Sri Lanka.
Pursuant to the Supplemental Trust Deed dated 7 January 2013, the Manager may decide to issue separate classes (each a "Class") whose
assets will be commonly invested but where a specific fee structure, currency or distribution policy may be applied. Each Class may have a
different charging structure with the result that the net asset value attributable to each Class may differ.
All unitholders' rights with regard to the convening, voting or otherwise acting at any meeting of unitholders are the same.
2222 Summary of principal accounting policiesSummary of principal accounting policiesSummary of principal accounting policiesSummary of principal accounting policies
(a)(a)(a)(a) Accounting policies of interim financial statementsAccounting policies of interim financial statementsAccounting policies of interim financial statementsAccounting policies of interim financial statements
The accounting policies and methods of computation used in the preparation of these unaudited condensed interim financial statements
are consistent with those used in the annual financial statements for the year ended 30 September 2012.
(b)(b)(b)(b) Investments and derivatives Investments and derivatives Investments and derivatives Investments and derivatives
Classification
The Fund classifies its investments and derivatives as financial assets or financial liabilities at fair value through profit or loss. These
financial assets or financial liabilities are held-for-trading as they are acquired or incurred principally for the purpose of selling or
repurchasing in the near term or short-term profit taking.
All derivatives are carried in assets when amounts are receivable by the Fund and in liabilities when amounts are payable by the Fund.
The Fund makes short sales in which a borrowed security is sold in anticipation of a decline in the market value of that security, or it may
use short sales for various arbitrage transactions. Short sales are classified as financial liabilities at fair value through profit or loss.
Recognition, derecognition and measurement
Purchases and sales of investments and derivatives are accounted for on the trade date basis. Investments and derivatives are initially
recognized at fair value and are subsequently re-measured at fair value. Realized and unrealized gains and losses on investments and
derivatives are recognized in the Statement of Comprehensive Income. Investments and derivatives are derecognized when the rights to
receive cash flows from the investments and derivatives have expired or the Fund has transferred substantially all risks and rewards of
ownership.
Fair value estimation
Investments that are listed or traded on an exchange and investments with prices quoted in over-the-counter markets or by market
makers, are fair valued based on quoted "bid" prices on long investments and quoted "ask" prices on investments sold short. When
trading in the securities of an investee company is suspended, the investment is valued at the Manager's estimate of its fair value.
Debt securities are fair valued based on quoted prices inclusive of accrued interest.
Investments in collective investment schemes are stated at fair value based on the net asset value per unit of the respective funds as
determined by the administrators of the relevant funds or stated at "bid" prices if the collective investment schemes are listed or traded
on an exchange.
Open future and swap contracts are valued at "bid" prices for long positions and "ask" prices for short positions at the valuation date.
The differences between the bid/ask prices and the contract prices are recognized in the Statement of Comprehensive Income.
Open option contracts are valued at "bid" prices for long positions and "ask" prices for short positions at the valuation date. The
differences between the bid/ask prices and the premium amounts/contract prices are recognized in the Statement of Comprehensive
Income.
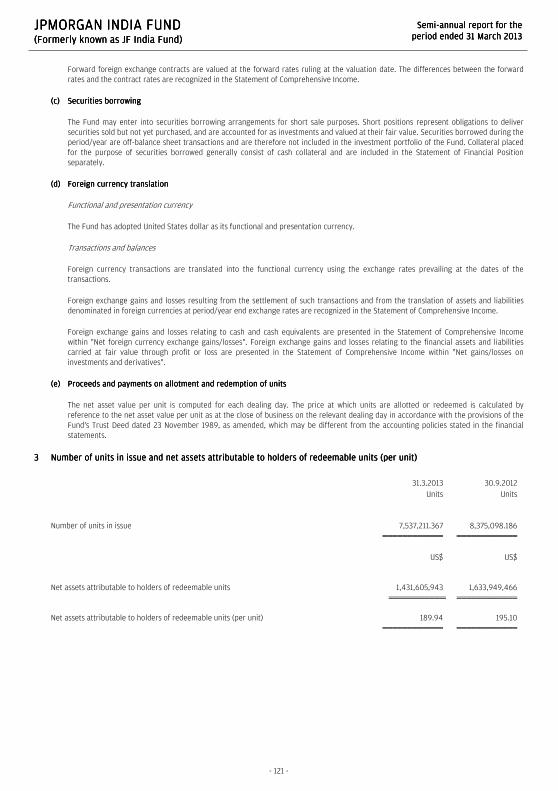
JPMORGAN INDIA FUNDJPMORGAN INDIA FUNDJPMORGAN INDIA FUNDJPMORGAN INDIA FUND (Formerly known as JF India Fund)(Formerly known as JF India Fund)(Formerly known as JF India Fund)(Formerly known as JF India Fund)
SemiSemiSemiSemi----annual report for theannual report for theannual report for theannual report for the
period ended 31 March 2013period ended 31 March 2013period ended 31 March 2013period ended 31 March 2013
- 121 -
Forward foreign exchange contracts are valued at the forward rates ruling at the valuation date. The differences between the forward
rates and the contract rates are recognized in the Statement of Comprehensive Income.
(c)(c)(c)(c) Securities borrowing Securities borrowing Securities borrowing Securities borrowing
The Fund may enter into securities borrowing arrangements for short sale purposes. Short positions represent obligations to deliver
securities sold but not yet purchased, and are accounted for as investments and valued at their fair value. Securities borrowed during the
period/year are off-balance sheet transactions and are therefore not included in the investment portfolio of the Fund. Collateral placed
for the purpose of securities borrowed generally consist of cash collateral and are included in the Statement of Financial Position
separately.
(d)(d)(d)(d) Foreign currency translationForeign currency translationForeign currency translationForeign currency translation
Functional and presentation currency
The Fund has adopted United States dollar as its functional and presentation currency.
Transactions and balances
Foreign currency transactions are translated into the functional currency using the exchange rates prevailing at the dates of the
transactions.
Foreign exchange gains and losses resulting from the settlement of such transactions and from the translation of assets and liabilities
denominated in foreign currencies at period/year end exchange rates are recognized in the Statement of Comprehensive Income.
Foreign exchange gains and losses relating to cash and cash equivalents are presented in the Statement of Comprehensive Income
within "Net foreign currency exchange gains/losses". Foreign exchange gains and losses relating to the financial assets and liabilities
carried at fair value through profit or loss are presented in the Statement of Comprehensive Income within "Net gains/losses on
investments and derivatives".
(e)(e)(e)(e) Proceeds and payments on allotment and redemption of unitsProceeds and payments on allotment and redemption of unitsProceeds and payments on allotment and redemption of unitsProceeds and payments on allotment and redemption of units
The net asset value per unit is computed for each dealing day. The price at which units are allotted or redeemed is calculated by
reference to the net asset value per unit as at the close of business on the relevant dealing day in accordance with the provisions of the
Fund's Trust Deed dated 23 November 1989, as amended, which may be different from the accounting policies stated in the financial
statements.
3333 Number of units in issue and net asseNumber of units in issue and net asseNumber of units in issue and net asseNumber of units in issue and net assets attributable to holders of redeemable units (per unit)ts attributable to holders of redeemable units (per unit)ts attributable to holders of redeemable units (per unit)ts attributable to holders of redeemable units (per unit)
31.3.2013 30.9.2012
Units Units
Number of units in issue 7,537,211.367 8,375,098.186
US$ US$
Net assets attributable to holders of redeemable units 1,431,605,943 1,633,949,466
Net assets attributable to holders of redeemable units (per unit) 189.94 195.10

JPMORGAN INDIA FUNDJPMORGAN INDIA FUNDJPMORGAN INDIA FUNDJPMORGAN INDIA FUND (Formerly known as JF India Fund)(Formerly known as JF India Fund)(Formerly known as JF India Fund)(Formerly known as JF India Fund)
SemiSemiSemiSemi----annual report for theannual report for theannual report for theannual report for the
period ended 31 March 2013period ended 31 March 2013period ended 31 March 2013period ended 31 March 2013
- 122 -
4444 Net (losses)/ gains on investments and derivatives Net (losses)/ gains on investments and derivatives Net (losses)/ gains on investments and derivatives Net (losses)/ gains on investments and derivatives
1.10.2012
to
31.3.2013
1.10.2011
to
31.3.2012
US$ US$
Change in unrealized gains/losses in value of investments and derivatives (53,224,074) 91,294,515
Realized gains/(losses) on sale of investments and derivatives 26,374,787 (28,327,203)
(26,849,287) 62,967,312
5555 Soft commission arrangementsSoft commission arrangementsSoft commission arrangementsSoft commission arrangements
The Investment Manager has entered into soft commission arrangements with brokers under which certain goods and services used to
support investment decision making are received by the Investment Manager. The Investment Manager does not make direct payment for
these services but transacts an agreed amount of business with the brokers on behalf of the Fund. Commission is paid from the Fund on these
transactions.
The goods and services must be of demonstrable benefit to the Fund and may include research and advisory services; economic and political
analysis; portfolio analysis, including valuation and performance measurement; market analysis, data and quotation services, computer
hardware and software incidental to the above goods and services; clearing and custodian services and investment-related publications.
6666 DistributionDistributionDistributionDistribution
No distribution was made during the period (31 March 2012: nil).
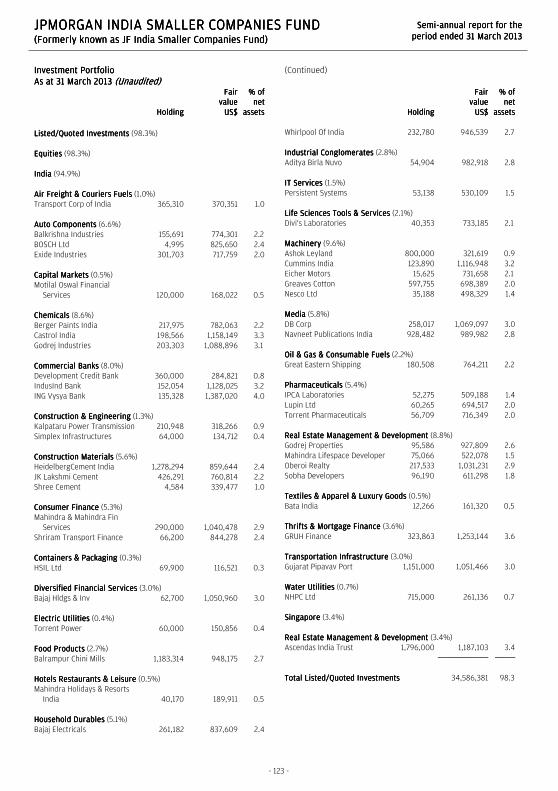
JPMORGAN INDIA SMALLER COMPANIES FUNDJPMORGAN INDIA SMALLER COMPANIES FUNDJPMORGAN INDIA SMALLER COMPANIES FUNDJPMORGAN INDIA SMALLER COMPANIES FUND (Formerly known as JF India Smaller Companies Fund(Formerly known as JF India Smaller Companies Fund(Formerly known as JF India Smaller Companies Fund(Formerly known as JF India Smaller Companies Fund))))
SemiSemiSemiSemi----annual annual annual annual report for thereport for thereport for thereport for the
period ended 31 March 2013period ended 31 March 2013period ended 31 March 2013period ended 31 March 2013
- 123 -
Investment PortfolioInvestment PortfolioInvestment PortfolioInvestment Portfolio
As at 31 March 2013As at 31 March 2013As at 31 March 2013As at 31 March 2013 (Unaudited)(Unaudited)(Unaudited)(Unaudited)
HoldingHoldingHoldingHolding
FairFairFairFair
valuevaluevaluevalue
US$US$US$US$
% of% of% of% of
netnetnetnet
assetsassetsassetsassets
Listed/Quoted InvestmentsListed/Quoted InvestmentsListed/Quoted InvestmentsListed/Quoted Investments (98.3%)
EquitiesEquitiesEquitiesEquities (98.3%)
IndiaIndiaIndiaIndia (94.9%)
Air Freight & Couriers FuelsAir Freight & Couriers FuelsAir Freight & Couriers FuelsAir Freight & Couriers Fuels (1.0%)
Transport Corp of India 365,310 370,351 1.0
Auto ComponentsAuto ComponentsAuto ComponentsAuto Components (6.6%)
Balkrishna Industries 155,691 774,301 2.2
BOSCH Ltd 4,995 825,650 2.4
Exide Industries 301,703 717,759 2.0
Capital MarketsCapital MarketsCapital MarketsCapital Markets (0.5%)
Motilal Oswal Financial
Services 120,000 168,022 0.5
ChemicalsChemicalsChemicalsChemicals (8.6%)
Berger Paints India 217,975 782,063 2.2
Castrol India 198,566 1,158,149 3.3
Godrej Industries 203,303 1,088,896 3.1
Commercial BanksCommercial BanksCommercial BanksCommercial Banks (8.0%)
Development Credit Bank 360,000 284,821 0.8
IndusInd Bank 152,054 1,128,025 3.2
ING Vysya Bank 135,328 1,387,020 4.0
Construction & EngineeringConstruction & EngineeringConstruction & EngineeringConstruction & Engineering (1.3%)
Kalpataru Power Transmission 210,948 318,266 0.9
Simplex Infrastructures 64,000 134,712 0.4
Construction MaterialsConstruction MaterialsConstruction MaterialsConstruction Materials (5.6%)
HeidelbergCement India 1,278,294 859,644 2.4
JK Lakshmi Cement 426,291 760,814 2.2
Shree Cement 4,584 339,477 1.0
Consumer FinanceConsumer FinanceConsumer FinanceConsumer Finance (5.3%)
Mahindra & Mahindra Fin
Services 290,000 1,040,478 2.9
Shriram Transport Finance 66,200 844,278 2.4
Containers & PackagingContainers & PackagingContainers & PackagingContainers & Packaging (0.3%)
HSIL Ltd 69,900 116,521 0.3
Diversified Financial ServicesDiversified Financial ServicesDiversified Financial ServicesDiversified Financial Services (3.0%)
Bajaj Hldgs & Inv 62,700 1,050,960 3.0
Electric UtilitiesElectric UtilitiesElectric UtilitiesElectric Utilities (0.4%)
Torrent Power 60,000 150,856 0.4
Food ProductsFood ProductsFood ProductsFood Products (2.7%)
Balrampur Chini Mills 1,183,314 948,175 2.7
Hotels Restaurants & LeisureHotels Restaurants & LeisureHotels Restaurants & LeisureHotels Restaurants & Leisure (0.5%)
Mahindra Holidays & Resorts
India 40,170 189,911 0.5
Household Household Household Household DurablesDurablesDurablesDurables (5.1%)
Bajaj Electricals 261,182 837,609 2.4
(Continued)
HoldingHoldingHoldingHolding
FairFairFairFair
valuevaluevaluevalue
US$US$US$US$
% of% of% of% of
netnetnetnet
assetsassetsassetsassets
Whirlpool Of India 232,780 946,539 2.7
Industrial ConglomeratesIndustrial ConglomeratesIndustrial ConglomeratesIndustrial Conglomerates (2.8%)
Aditya Birla Nuvo 54,904 982,918 2.8
IT ServicesIT ServicesIT ServicesIT Services (1.5%)
Persistent Systems 53,138 530,109 1.5
Life Sciences Tools & ServicesLife Sciences Tools & ServicesLife Sciences Tools & ServicesLife Sciences Tools & Services (2.1%)
Divi's Laboratories 40,353 733,185 2.1
MachineryMachineryMachineryMachinery (9.6%)
Ashok Leyland 800,000 321,619 0.9
Cummins India 123,890 1,116,948 3.2
Eicher Motors 15,625 731,658 2.1
Greaves Cotton 597,755 698,389 2.0
Nesco Ltd 35,188 498,329 1.4
MediaMediaMediaMedia (5.8%)
DB Corp 258,017 1,069,097 3.0
Navneet Publications India 928,482 989,982 2.8
Oil & Gas & Consumable FuelsOil & Gas & Consumable FuelsOil & Gas & Consumable FuelsOil & Gas & Consumable Fuels (2.2%)
Great Eastern Shipping 180,508 764,211 2.2
PharmaceuticalsPharmaceuticalsPharmaceuticalsPharmaceuticals (5.4%)
IPCA Laboratories 52,275 509,188 1.4
Lupin Ltd 60,265 694,517 2.0
Torrent Pharmaceuticals 56,709 716,349 2.0
Real Estate Management & DevelopmentReal Estate Management & DevelopmentReal Estate Management & DevelopmentReal Estate Management & Development (8.8%)
Godrej Properties 95,586 927,809 2.6
Mahindra Lifespace Developer 75,066 522,078 1.5
Oberoi Realty 217,533 1,031,231 2.9
Sobha Developers 96,190 611,298 1.8
Textiles & Apparel & Luxury GoodsTextiles & Apparel & Luxury GoodsTextiles & Apparel & Luxury GoodsTextiles & Apparel & Luxury Goods (0.5%)
Bata India 12,266 161,320 0.5
Thrifts & Mortgage FinanceThrifts & Mortgage FinanceThrifts & Mortgage FinanceThrifts & Mortgage Finance (3.6%)
GRUH Finance 323,863 1,253,144 3.6
Transportation InfrastructureTransportation InfrastructureTransportation InfrastructureTransportation Infrastructure (3.0%)
Gujarat Pipavav Port 1,151,000 1,051,466 3.0
Water UtilitiesWater UtilitiesWater UtilitiesWater Utilities (0.7%)
NHPC Ltd 715,000 261,136 0.7
SingaporeSingaporeSingaporeSingapore (3.4%)
Real Estate Management & DevelopmentReal Estate Management & DevelopmentReal Estate Management & DevelopmentReal Estate Management & Development (3.4%)
Ascendas India Trust 1,796,000 1,187,103 3.4
Total Listed/Quoted InvestmentsTotal Listed/Quoted InvestmentsTotal Listed/Quoted InvestmentsTotal Listed/Quoted Investments 34,586,381 98.3

JPMORGAN INDIA SMALLER COMPANIES FUNDJPMORGAN INDIA SMALLER COMPANIES FUNDJPMORGAN INDIA SMALLER COMPANIES FUNDJPMORGAN INDIA SMALLER COMPANIES FUND (Formerly known as JF India Smaller Companies Fund(Formerly known as JF India Smaller Companies Fund(Formerly known as JF India Smaller Companies Fund(Formerly known as JF India Smaller Companies Fund))))
SemiSemiSemiSemi----annual annual annual annual report for thereport for thereport for thereport for the
period ended 31 March 2013period ended 31 March 2013period ended 31 March 2013period ended 31 March 2013
- 124 -
Investment PortfolioInvestment PortfolioInvestment PortfolioInvestment Portfolio (Continued)
As at 31 March 2013As at 31 March 2013As at 31 March 2013As at 31 March 2013 (Unaudited)(Unaudited)(Unaudited)(Unaudited)
FairFairFairFair
valuevaluevaluevalue
US$US$US$US$
% of% of% of% of
netnetnetnet
assetsassetsassetsassets
Other net assetsOther net assetsOther net assetsOther net assets 593,807 1.7
Net assets attributable to holders of Net assets attributable to holders of Net assets attributable to holders of Net assets attributable to holders of
redeemable units at 31 March 2013redeemable units at 31 March 2013redeemable units at 31 March 2013redeemable units at 31 March 2013 35,180,188 100.0
Total investments, at costTotal investments, at costTotal investments, at costTotal investments, at cost 32,679,779
Statement of Movements in Portfolio HoldingsStatement of Movements in Portfolio HoldingsStatement of Movements in Portfolio HoldingsStatement of Movements in Portfolio Holdings
For the period ended 31 March For the period ended 31 March For the period ended 31 March For the period ended 31 March 2013201320132013 (Unaudited)(Unaudited)(Unaudited)(Unaudited)
% holdings% holdings% holdings% holdings
of net assetsof net assetsof net assetsof net assets
31.3.201331.3.201331.3.201331.3.2013 30.9.201230.9.201230.9.201230.9.2012
Listed/Quoted InvestmentsListed/Quoted InvestmentsListed/Quoted InvestmentsListed/Quoted Investments
EquitiesEquitiesEquitiesEquities
IndiaIndiaIndiaIndia
Machinery 9.6 6.3
Real Estate Management & Development 8.8 10.3
Chemicals 8.6 7.5
Commercial Banks 8.0 5.2
Auto Components 6.6 7.3
Media 5.8 5.8
Construction Materials 5.6 6.6
Pharmaceuticals 5.4 4.9
Consumer Finance 5.3 4.6
Household Durables 5.1 2.3
Thrifts & Mortgage Finance 3.6 2.1
Transportation Infrastructure 3.0 3.0
Diversified Financial Services 3.0 2.4
Industrial Conglomerates 2.8 2.6
Food Products 2.7 5.4
Oil & Gas & Consumable Fuels 2.2 2.1
Life Sciences Tools & Services 2.1 1.9
IT Services 1.5 1.1
Construction & Engineering 1.3 1.1
Air Freight & Couriers Fuels 1.0 1.0
Water Utilities 0.7 -
Hotels Restaurants & Leisure 0.5 -
Capital Markets 0.5 -
Textiles & Apparel & Luxury Goods 0.5 0.9
Electric Utilities 0.4 -
Containers & Packaging 0.3 2.2
SingaporeSingaporeSingaporeSingapore
Real Estate Management & Development 3.4 3.2
Total Listed/QuotedTotal Listed/QuotedTotal Listed/QuotedTotal Listed/Quoted InvestmentsInvestmentsInvestmentsInvestments 98.3 89.8
Other net assetsOther net assetsOther net assetsOther net assets 1.7 10.2
Net assets attributable to holders of Net assets attributable to holders of Net assets attributable to holders of Net assets attributable to holders of
redeemable unitsredeemable unitsredeemable unitsredeemable units 100.0 100.0

JPMORGAN INDIA SMALLER COMPANIES FUNDJPMORGAN INDIA SMALLER COMPANIES FUNDJPMORGAN INDIA SMALLER COMPANIES FUNDJPMORGAN INDIA SMALLER COMPANIES FUND (Formerly known as JF India Smaller Companies Fund(Formerly known as JF India Smaller Companies Fund(Formerly known as JF India Smaller Companies Fund(Formerly known as JF India Smaller Companies Fund))))
SemiSemiSemiSemi----annual annual annual annual report for thereport for thereport for thereport for the
period ended 31 March 2013period ended 31 March 2013period ended 31 March 2013period ended 31 March 2013
The notes on pages 127 to 129 form part of these financial statements.
- 125 -
Statement of Financial PositionStatement of Financial PositionStatement of Financial PositionStatement of Financial Position
As at 31 March 2013As at 31 March 2013As at 31 March 2013As at 31 March 2013 (Unaudited)(Unaudited)(Unaudited)(Unaudited)
31.3.201331.3.201331.3.201331.3.2013 30.9.201230.9.201230.9.201230.9.2012
US$US$US$US$ US$US$US$US$
AssetsAssetsAssetsAssets
Cash at banks 403,628 5,192,360
Amounts due from brokers 431,502 -
Amounts receivable on allotment 249 704,144
Margin deposits - 31,076
Investments 34,586,381 33,552,440
Dividend and other accounts
receivable 104,009 124,138
Total assetsTotal assetsTotal assetsTotal assets 35,525,769 39,604,158
---------- ----------
LiabilitiesLiabilitiesLiabilitiesLiabilities
Short term bank loans - unsecured 200,009 -
Amounts due to brokers 83,439 2,139,671
Amounts payable on redemption 9,970 30,913
Other accounts payable 52,163 60,232
Total Total Total Total liabilitiesliabilitiesliabilitiesliabilities 345,581 2,230,816
---------- ----------
Net assets attributable to holders Net assets attributable to holders Net assets attributable to holders Net assets attributable to holders
of redeemable units of redeemable units of redeemable units of redeemable units [Note 3] 35,180,188 37,373,342
EquityEquityEquityEquity 35,180,188 37,373,342
Statement of Comprehensive IncomeStatement of Comprehensive IncomeStatement of Comprehensive IncomeStatement of Comprehensive Income
For the period ended 31 March 2013For the period ended 31 March 2013For the period ended 31 March 2013For the period ended 31 March 2013 (Unaudited)(Unaudited)(Unaudited)(Unaudited)
1.10.20121.10.20121.10.20121.10.2012
totototo
31.3.201331.3.201331.3.201331.3.2013
1.10.20111.10.20111.10.20111.10.2011
totototo
31.3.201231.3.201231.3.201231.3.2012
US$US$US$US$ US$US$US$US$
IncomeIncomeIncomeIncome
Net (losses)/gains on investments
and derivatives [Note 4] (1,971,113) 1,236,485
Dividend income 112,730 133,246
Interest on deposits 179 21
Net foreign currency exchange
losses (17,947) (9,336)
(1,876,151) 1,360,416
---------- ----------
ExpensesExpensesExpensesExpenses
Management fee 278,840 178,164
Transaction costs 44,473 48,009
Safe custody and bank charges 11,264 6,740
Trustee's fee 11,160 9,755
Auditor's fee 9,577 9,606
Valuation fee 8,120 7,860
Legal and professional expenses 5,493 43,618
Registrar's fee 5,253 5,696
Printing and publication expenses 505 1,246
Other operating expenses 1,892 530
376,577 311,224
---------- ----------
Net operating (loss)/profitNet operating (loss)/profitNet operating (loss)/profitNet operating (loss)/profit (2,252,728) 1,049,192
Finance costsFinance costsFinance costsFinance costs
Interest paid (925) -
(Decrease)/increase in net (Decrease)/increase in net (Decrease)/increase in net (Decrease)/increase in net
assets attributable to holdersassets attributable to holders assets attributable to holdersassets attributable to holders
of redeemable units and of redeemable units and of redeemable units and of redeemable units and
total comprehensive incometotal comprehensive incometotal comprehensive incometotal comprehensive income (2,253,653) 1,049,192

JPMORGAN INDIA SMALLER COMPANIES FUNDJPMORGAN INDIA SMALLER COMPANIES FUNDJPMORGAN INDIA SMALLER COMPANIES FUNDJPMORGAN INDIA SMALLER COMPANIES FUND (Formerly known as JF India Smaller Companies Fund(Formerly known as JF India Smaller Companies Fund(Formerly known as JF India Smaller Companies Fund(Formerly known as JF India Smaller Companies Fund))))
SemiSemiSemiSemi----annual annual annual annual report for thereport for thereport for thereport for the
period ended 31 March 2013period ended 31 March 2013period ended 31 March 2013period ended 31 March 2013
The notes on pages 127 to 129 form part of these financial statements.
- 126 -
Statement of Changes in Net Assets Attributable to Holders Statement of Changes in Net Assets Attributable to Holders Statement of Changes in Net Assets Attributable to Holders Statement of Changes in Net Assets Attributable to Holders
of Redeemable Unitsof Redeemable Unitsof Redeemable Unitsof Redeemable Units
For the period For the period For the period For the period ended 31 March 2013ended 31 March 2013ended 31 March 2013ended 31 March 2013 (Unaudited)(Unaudited)(Unaudited)(Unaudited)
1.10.20121.10.20121.10.20121.10.2012
totototo
31.3.201331.3.201331.3.201331.3.2013
1.10.20111.10.20111.10.20111.10.2011
totototo
31.3.201231.3.201231.3.201231.3.2012
US$US$US$US$ US$US$US$US$
Net assets attributable to holders Net assets attributable to holders Net assets attributable to holders Net assets attributable to holders
of redeemable units at the of redeemable units at the of redeemable units at the of redeemable units at the
beginning of the periodbeginning of the periodbeginning of the periodbeginning of the period 37,373,342 25,167,917
---------- ----------
Allotment of redeemable units 1,182,110 668,223
Redemption of redeemable units (1,121,611) (746,163)
Net allotment/(redemption)Net allotment/(redemption)Net allotment/(redemption)Net allotment/(redemption) 60,499 (77,940)
---------- ----------
37,433,841 25,089,977
(Decrease)/increase in (Decrease)/increase in (Decrease)/increase in (Decrease)/increase in net assets net assets net assets net assets
attributable to holders of attributable to holders of attributable to holders of attributable to holders of
redeemable units and total redeemable units and total redeemable units and total redeemable units and total
comprehensive incomecomprehensive incomecomprehensive incomecomprehensive income (2,253,653) 1,049,192
Net assets attributable to holders Net assets attributable to holders Net assets attributable to holders Net assets attributable to holders
of redeemable units at the end of redeemable units at the end of redeemable units at the end of redeemable units at the end
of the periodof the periodof the periodof the period 35,180,188 26,139,169
Statement of Cash FlowsStatement of Cash FlowsStatement of Cash FlowsStatement of Cash Flows
For the period ended 31 March 2013For the period ended 31 March 2013For the period ended 31 March 2013For the period ended 31 March 2013 (Unaudited)(Unaudited)(Unaudited)(Unaudited)
1.10.20121.10.20121.10.20121.10.2012
totototo
31.3.201331.3.201331.3.201331.3.2013
1.10.20111.10.20111.10.20111.10.2011
totototo
31.3.201231.3.201231.3.201231.3.2012
US$US$US$US$ US$US$US$US$
Operating activitiesOperating activitiesOperating activitiesOperating activities
Purchase of investments and
derivatives (10,550,885) (5,649,276)
Proceeds from disposal of
investments and derivatives 5,071,174 7,570,764
Dividend received 121,869 114,880
Decrease in margin deposits 31,076 1,294
Interest received 176 21
Performance fee paid - (4,276)
Registrar's fee paid (10,558) (11,985)
Trustee's fee paid (10,794) (11,313)
Transaction costs paid (49,587) (50,917)
Management fee paid (269,720) (180,449)
Others (55,255) (87,785)
Net cash (outflow)/inflow from Net cash (outflow)/inflow from Net cash (outflow)/inflow from Net cash (outflow)/inflow from
operating activitiesoperating activitiesoperating activitiesoperating activities (5,722,504) 1,690,958
---------- ----------
Financing activitiesFinancing activitiesFinancing activitiesFinancing activities
Interest paid (907) -
Receipts on allotment of
redeemable units 1,886,005 543,565
Payments on redemption of
redeemable units (1,142,554) (757,470)
Net cash inflow/(outflow) from Net cash inflow/(outflow) from Net cash inflow/(outflow) from Net cash inflow/(outflow) from
financing activitiesfinancing activitiesfinancing activitiesfinancing activities 742,544 (213,905)
---------- ----------
(Decrease)/increase in cash (Decrease)/increase in cash (Decrease)/increase in cash (Decrease)/increase in cash
and cash equivalentsand cash equivalentsand cash equivalentsand cash equivalents (4,979,960) 1,477,053
Cash and cash equivalents at the
beginning of the period 5,192,360 1,497,589
Exchange losses on cash and cash
equivalents (8,781) (671)
Cash and cash equivalents at Cash and cash equivalents at Cash and cash equivalents at Cash and cash equivalents at
the end of the periodthe end of the periodthe end of the periodthe end of the period 203,619 2,973,971
Analysis of balances of cash and cash equivalents:Analysis of balances of cash and cash equivalents:Analysis of balances of cash and cash equivalents:Analysis of balances of cash and cash equivalents:
Cash at banks 403,628 2,973,971
Short term bank loans -
unsecured (200,009) -
203,619 2,973,971

JPMORGAN INDIA SMALLERJPMORGAN INDIA SMALLERJPMORGAN INDIA SMALLERJPMORGAN INDIA SMALLER COMPANIES FUNDCOMPANIES FUNDCOMPANIES FUNDCOMPANIES FUND (Formerly known as JF India Smaller Companies Fund(Formerly known as JF India Smaller Companies Fund(Formerly known as JF India Smaller Companies Fund(Formerly known as JF India Smaller Companies Fund))))
SemiSemiSemiSemi----annual report for theannual report for theannual report for theannual report for the
period ended 31 March 2013period ended 31 March 2013period ended 31 March 2013period ended 31 March 2013
- 127 -
Notes to the Financial StatementsNotes to the Financial StatementsNotes to the Financial StatementsNotes to the Financial Statements
1111 The FundThe FundThe FundThe Fund
JPMorgan India Smaller Companies Fund (the "Fund") was established under a Trust Deed dated 13 April 2006, as amended, and is governed
by the laws of the Republic of Mauritius. The Fund is authorized by the Securities and Futures Commission of Hong Kong.
With effect from and including 1 October 2012, the performance fee currently received by the Manager in respect of the Fund was removed.
Any cumulative performance fee accrued on each dealing day up to 28 September 2012 was crystallised on 28 September 2012 and became
payable to the Manager (if any). On 28 September 2012, no performance fee was crystallised in relation to the Fund.
With effect from 4 February 2013, the name of the Fund was changed from JF India Smaller Companies Fund to JPMorgan India Smaller
Companies Fund.
The investment objective of the Fund is to provide investors with long-term capital growth by investing primarily in securities of small to
medium-sized companies in India.
Pursuant to the Supplemental Trust Deed dated 31 August 2012, the Manager may decide to issue separate classes (each a "Class") whose
assets will be commonly invested but where a specific fee structure, currency or distribution policy may be applied. Each Class may have a
different charging structure with the result that the net asset value attributable to each Class may differ.
All unitholders' rights with regard to the convening, voting or otherwise acting at any meeting of unitholders are the same.
2222 Summary of principal accounting policiesSummary of principal accounting policiesSummary of principal accounting policiesSummary of principal accounting policies
(a)(a)(a)(a) Accounting policies of interim financial statementsAccounting policies of interim financial statementsAccounting policies of interim financial statementsAccounting policies of interim financial statements
The accounting policies and methods of computation used in the preparation of these unaudited condensed interim financial statements
are consistent with those used in the annual financial statements for the year ended 30 September 2012.
(b)(b)(b)(b) Investments and derivatives Investments and derivatives Investments and derivatives Investments and derivatives
Classification
The Fund classifies its investments and derivatives as financial assets or financial liabilities at fair value through profit or loss. These
financial assets or financial liabilities are held-for-trading as they are acquired or incurred principally for the purpose of selling or
repurchasing in the near term or short-term profit taking.
All derivatives are carried in assets when amounts are receivable by the Fund and in liabilities when amounts are payable by the Fund.
The Fund makes short sales in which a borrowed security is sold in anticipation of a decline in the market value of that security, or it may
use short sales for various arbitrage transactions. Short sales are classified as financial liabilities at fair value through profit or loss.
Recognition, derecognition and measurement
Purchases and sales of investments and derivatives are accounted for on the trade date basis. Investments and derivatives are initially
recognized at fair value and are subsequently re-measured at fair value. Realized and unrealized gains and losses on investments and
derivatives are recognized in the Statement of Comprehensive Income. Investments and derivatives are derecognized when the rights to
receive cash flows from the investments and derivatives have expired or the Fund has transferred substantially all risks and rewards of
ownership.
Fair value estimation
Investments that are listed or traded on an exchange and investments with prices quoted in over-the-counter markets or by market
makers, are fair valued based on quoted "bid" prices on long investments and quoted "ask" prices on investments sold short. When
trading in the securities of an investee company is suspended, the investment is valued at the Manager's estimate of its fair value.
Debt securities are fair valued based on quoted prices inclusive of accrued interest.
Investments in collective investment schemes are stated at fair value based on the net asset value per unit of the respective funds as
determined by the administrators of the relevant funds or stated at "bid" prices if the collective investment schemes are listed or traded
on an exchange.
Open future and swap contracts are valued at "bid" prices for long positions and "ask" prices for short positions at the valuation date.
The differences between the bid/ask prices and the contract prices are recognized in the Statement of Comprehensive Income.
JPMORGAN INDIA SMALLERJPMORGAN INDIA SMALLERJPMORGAN INDIA SMALLERJPMORGAN INDIA SMALLER COMPANIES FUNDCOMPANIES FUNDCOMPANIES FUNDCOMPANIES FUND (Formerly known as JF India Smaller Companies Fund(Formerly known as JF India Smaller Companies Fund(Formerly known as JF India Smaller Companies Fund(Formerly known as JF India Smaller Companies Fund))))
SemiSemiSemiSemi----annual report for theannual report for theannual report for theannual report for the
period ended 31 March 2013period ended 31 March 2013period ended 31 March 2013period ended 31 March 2013
- 128 -
Open option contracts are valued at "bid" prices for long positions and "ask" prices for short positions at the valuation date. The
differences between the bid/ask prices and the premium amounts/contract prices are recognized in the Statement of Comprehensive
Income.
Forward foreign exchange contracts are valued at the forward rates ruling at the valuation date. The differences between the forward
rates and the contract rates are recognized in the Statement of Comprehensive Income.
(c)(c)(c)(c) Securities borrowSecurities borrowSecurities borrowSecurities borrowing ing ing ing
The Fund may enter into securities borrowing arrangements for short sale purposes. Short positions represent obligations to deliver
securities sold but not yet purchased, and are accounted for as investments and valued at their fair value. Securities borrowed during the
period/year are off-balance sheet transactions and are therefore not included in the investment portfolio of the Fund. Collateral placed
for the purpose of securities borrowed generally consist of cash collateral and are included in the Statement of Financial Position
separately.
(d)(d)(d)(d) Foreign currency translationForeign currency translationForeign currency translationForeign currency translation
Functional and presentation currency
The Fund has adopted United States dollar as its functional and presentation currency.
Transactions and balances
Foreign currency transactions are translated into the functional currency using the exchange rates prevailing at the dates of the
transactions.
Foreign exchange gains and losses resulting from the settlement of such transactions and from the translation of assets and liabilities
denominated in foreign currencies at period/year end exchange rates are recognized in the Statement of Comprehensive Income.
Foreign exchange gains and losses relating to cash and cash equivalents are presented in the Statement of Comprehensive Income
within "Net foreign currency exchange gains/losses". Foreign exchange gains and losses relating to the financial assets and liabilities
carried at fair value through profit or loss are presented in the Statement of Comprehensive Income within "Net gains/losses on
investments and derivatives".
(e)(e)(e)(e) Proceeds and payments on allotment and redemption of unitsProceeds and payments on allotment and redemption of unitsProceeds and payments on allotment and redemption of unitsProceeds and payments on allotment and redemption of units
The net asset value per unit is computed for each dealing day. The price at which units are allotted or redeemed is calculated by
reference to the net asset value per unit as at the close of business on the relevant dealing day in accordance with the provisions of the
Fund's Trust Deed dated 13 April 2006, as amended, which may be different from the accounting policies stated in the financial
statements.

JPMORGAN INDIA SMALLERJPMORGAN INDIA SMALLERJPMORGAN INDIA SMALLERJPMORGAN INDIA SMALLER COMPANIES FUNDCOMPANIES FUNDCOMPANIES FUNDCOMPANIES FUND (Formerly known as JF India Smaller Companies Fund(Formerly known as JF India Smaller Companies Fund(Formerly known as JF India Smaller Companies Fund(Formerly known as JF India Smaller Companies Fund))))
SemiSemiSemiSemi----annual report for theannual report for theannual report for theannual report for the
period ended 31 March 2013period ended 31 March 2013period ended 31 March 2013period ended 31 March 2013
- 129 -
3333 NumbeNumbeNumbeNumber of units in issue and net assets attributable to holders of redeemable units (per unit)r of units in issue and net assets attributable to holders of redeemable units (per unit)r of units in issue and net assets attributable to holders of redeemable units (per unit)r of units in issue and net assets attributable to holders of redeemable units (per unit)
31.3.2013 30.9.2012
Units Units
Number of units in issue 4,133,393.955 4,128,333.255
US$ US$
Net assets attributable to holders of redeemable units 35,180,188 37,373,342
Net assets attributable to holders of redeemable units (per unit) 8.51 9.05
4444 Net (losses)/gains on investments and derivatives Net (losses)/gains on investments and derivatives Net (losses)/gains on investments and derivatives Net (losses)/gains on investments and derivatives
1.10.2012
to
31.3.2013
1.10.2011
to
31.3.2012
US$ US$
Change in unrealized gains/losses in value of investments and derivatives (1,781,797) 4,506,952
Realized losses on sale of investments and derivatives (189,316) (3,270,467)
(1,971,113) 1,236,485
5555 Soft commission arrangementsSoft commission arrangementsSoft commission arrangementsSoft commission arrangements
The Investment Manager has entered into soft commission arrangements with brokers under which certain goods and services used to
support investment decision making are received by the Investment Manager. The Investment Manager does not make direct payment for
these services but transacts an agreed amount of business with the brokers on behalf of the Fund. Commission is paid from the Fund on these
transactions.
The goods and services must be of demonstrable benefit to the Fund and may include research and advisory services; economic and political
analysis; portfolio analysis, including valuation and performance measurement; market analysis, data and quotation services, computer
hardware and software incidental to the above goods and services; clearing and custodian services and investment-related publications.
6666 Distribution Distribution Distribution Distribution
No distribution was made during the period (31 March 2012: nil).
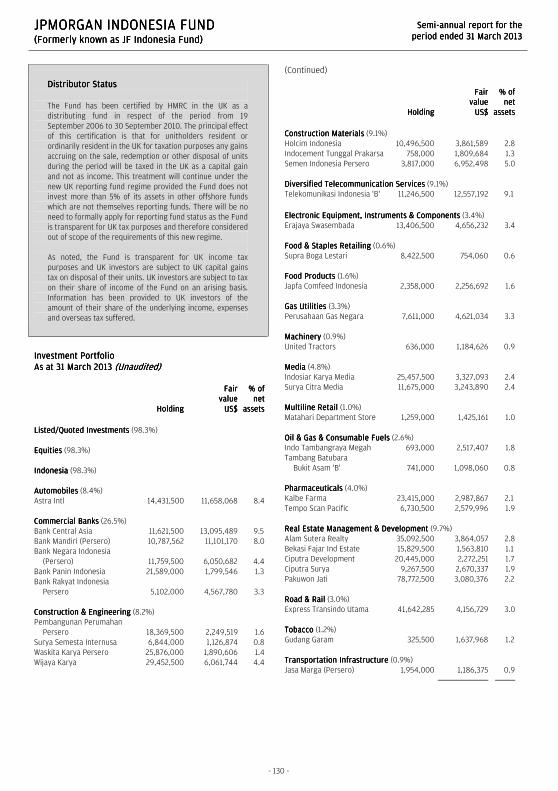
JPMORGAN INDONESIA FUNDJPMORGAN INDONESIA FUNDJPMORGAN INDONESIA FUNDJPMORGAN INDONESIA FUND (Formerly known as JF Indonesia Fund)(Formerly known as JF Indonesia Fund)(Formerly known as JF Indonesia Fund)(Formerly known as JF Indonesia Fund)
SemiSemiSemiSemi----annual report for theannual report for theannual report for theannual report for the
period ended 31 March 2013period ended 31 March 2013period ended 31 March 2013period ended 31 March 2013
- 130 -
Distributor StatusDistributor StatusDistributor StatusDistributor Status
The Fund has been certified by HMRC in the UK as a
distributing fund in respect of the period from 19
September 2006 to 30 September 2010. The principal effect
of this certification is that for unitholders resident or
ordinarily resident in the UK for taxation purposes any gains
accruing on the sale, redemption or other disposal of units
during the period will be taxed in the UK as a capital gain
and not as income. This treatment will continue under the
new UK reporting fund regime provided the Fund does not
invest more than 5% of its assets in other offshore funds
which are not themselves reporting funds. There will be no
need to formally apply for reporting fund status as the Fund
is transparent for UK tax purposes and therefore considered
out of scope of the requirements of this new regime.
As noted, the Fund is transparent for UK income tax
purposes and UK investors are subject to UK capital gains
tax on disposal of their units. UK investors are subject to tax
on their share of income of the Fund on an arising basis.
Information has been provided to UK investors of the
amount of their share of the underlying income, expenses
and overseas tax suffered.
Investment PortfolioInvestment PortfolioInvestment PortfolioInvestment Portfolio
As at 31 March 2013As at 31 March 2013As at 31 March 2013As at 31 March 2013 (Unaudited)(Unaudited)(Unaudited)(Unaudited)
HoldingHoldingHoldingHolding
FairFairFairFair
valuevaluevaluevalue
US$US$US$US$
% of% of% of% of
netnetnetnet
assetsassetsassetsassets
Listed/Quoted InvestmentsListed/Quoted InvestmentsListed/Quoted InvestmentsListed/Quoted Investments (98.3%)
EquitiesEquitiesEquitiesEquities (98.3%)
IndonesiaIndonesiaIndonesiaIndonesia (98.3%)
AutomobilesAutomobilesAutomobilesAutomobiles (8.4%)
Astra Intl 14,431,500 11,658,068 8.4
Commercial BanksCommercial BanksCommercial BanksCommercial Banks (26.5%)
Bank Central Asia 11,621,500 13,095,489 9.5
Bank Mandiri (Persero) 10,787,562 11,101,170 8.0
Bank Negara Indonesia
(Persero) 11,759,500 6,050,682 4.4
Bank Panin Indonesia 21,589,000 1,799,546 1.3
Bank Rakyat Indonesia
Persero 5,102,000 4,567,780 3.3
Construction & EngineeringConstruction & EngineeringConstruction & EngineeringConstruction & Engineering (8.2%)
Pembangunan Perumahan
Persero 18,369,500 2,249,519 1.6
Surya Semesta Internusa 6,844,000 1,126,874 0.8
Waskita Karya Persero 25,876,000 1,890,606 1.4
Wijaya Karya 29,452,500 6,061,744 4.4
(Continued)
HoldingHoldingHoldingHolding
FairFairFairFair
valuevaluevaluevalue
US$US$US$US$
% of% of% of% of
netnetnetnet
assetsassetsassetsassets
Construction MaterialsConstruction MaterialsConstruction MaterialsConstruction Materials (9.1%)
Holcim Indonesia 10,496,500 3,861,589 2.8
Indocement Tunggal Prakarsa 758,000 1,809,684 1.3
Semen Indonesia Persero 3,817,000 6,952,498 5.0
Diversified Telecommunication ServicesDiversified Telecommunication ServicesDiversified Telecommunication ServicesDiversified Telecommunication Services (9.1%)
Telekomunikasi Indonesia 'B' 11,246,500 12,557,192 9.1
Electronic Equipment, Instruments & ComponentsElectronic Equipment, Instruments & ComponentsElectronic Equipment, Instruments & ComponentsElectronic Equipment, Instruments & Components (3.4%)
Erajaya Swasembada 13,406,500 4,656,232 3.4
Food & Staples RetailingFood & Staples RetailingFood & Staples RetailingFood & Staples Retailing (0.6%)
Supra Boga Lestari 8,422,500 754,060 0.6
Food ProductsFood ProductsFood ProductsFood Products (1.6%)
Japfa Comfeed Indonesia 2,358,000 2,256,692 1.6
Gas UtilitiesGas UtilitiesGas UtilitiesGas Utilities (3.3%)
Perusahaan Gas Negara 7,611,000 4,621,034 3.3
MachineryMachineryMachineryMachinery (0.9%)
United Tractors 636,000 1,184,626 0.9
MediaMediaMediaMedia (4.8%)
Indosiar Karya Media 25,457,500 3,327,093 2.4
Surya Citra Media 11,675,000 3,243,890 2.4
Multiline RetailMultiline RetailMultiline RetailMultiline Retail (1.0%)
Matahari Department Store 1,259,000 1,425,161 1.0
Oil & Gas & Consumable FuelsOil & Gas & Consumable FuelsOil & Gas & Consumable FuelsOil & Gas & Consumable Fuels (2.6%)
Indo Tambangraya Megah 693,000 2,517,407 1.8
Tambang Batubara
Bukit Asam 'B' 741,000 1,098,060 0.8
PharmaceuticalsPharmaceuticalsPharmaceuticalsPharmaceuticals (4.0%)
Kalbe Farma 23,415,000 2,987,867 2.1
Tempo Scan Pacific 6,730,500 2,579,996 1.9
Real Estate Management & DevelopmentReal Estate Management & DevelopmentReal Estate Management & DevelopmentReal Estate Management & Development (9.7%)
Alam Sutera Realty 35,092,500 3,864,057 2.8
Bekasi Fajar Ind Estate 15,829,500 1,563,810 1.1
Ciputra Development 20,445,000 2,272,251 1.7
Ciputra Surya 9,267,500 2,670,337 1.9
Pakuwon Jati 78,772,500 3,080,376 2.2
Road & RailRoad & RailRoad & RailRoad & Rail (3.0%)
Express Transindo Utama 41,642,285 4,156,729 3.0
TobaccoTobaccoTobaccoTobacco (1.2%)
Gudang Garam 325,500 1,637,968 1.2
Transportation InfrastructureTransportation InfrastructureTransportation InfrastructureTransportation Infrastructure (0.9%)
Jasa Marga (Persero) 1,954,000 1,186,375 0.9

JPMORGAN INDONESIA FUNDJPMORGAN INDONESIA FUNDJPMORGAN INDONESIA FUNDJPMORGAN INDONESIA FUND (Formerly known as JF Indonesia Fund)(Formerly known as JF Indonesia Fund)(Formerly known as JF Indonesia Fund)(Formerly known as JF Indonesia Fund)
SemiSemiSemiSemi----annual report for theannual report for theannual report for theannual report for the
period ended 31 March 2013period ended 31 March 2013period ended 31 March 2013period ended 31 March 2013
- 131 -
Total Listed/Quoted InvestmentsTotal Listed/Quoted InvestmentsTotal Listed/Quoted InvestmentsTotal Listed/Quoted Investments 135,866,462 98.3
Other net assetsOther net assetsOther net assetsOther net assets 2,387,452 1.7
Net assets attributable to holders of Net assets attributable to holders of Net assets attributable to holders of Net assets attributable to holders of
redeemable units at 31 March 2013redeemable units at 31 March 2013redeemable units at 31 March 2013redeemable units at 31 March 2013 138,253,914 100.0
Total investments, at costTotal investments, at costTotal investments, at costTotal investments, at cost 100,629,184
Statement of Movements in Portfolio HoldingsStatement of Movements in Portfolio HoldingsStatement of Movements in Portfolio HoldingsStatement of Movements in Portfolio Holdings
For the period For the period For the period For the period ended 31 March 2013ended 31 March 2013ended 31 March 2013ended 31 March 2013 (Unaudited)(Unaudited)(Unaudited)(Unaudited)
% holdings% holdings% holdings% holdings
of net assetsof net assetsof net assetsof net assets
31.3.201331.3.201331.3.201331.3.2013 30.9.201230.9.201230.9.201230.9.2012
Listed/Quoted InvestmentsListed/Quoted InvestmentsListed/Quoted InvestmentsListed/Quoted Investments
EquitiesEquitiesEquitiesEquities
IndonesiaIndonesiaIndonesiaIndonesia
Commercial Banks 26.5 21.8
Real Estate Management & Development 9.7 8.1
Construction Materials 9.1 10.7
Diversified Telecommunication Services 9.1 13.5
Automobiles 8.4 9.2
Construction & Engineering 8.2 7.5
Media 4.8 4.5
Pharmaceuticals 4.0 5.3
Electronic Equipment, Instruments &
Components 3.4 2.5
Gas Utilities 3.3 -
Road & Rail 3.0 -
Oil & Gas & Consumable Fuels 2.6 3.8
Food Products 1.6 -
Tobacco 1.2 -
Multiline Retail 1.0 -
Transportation Infrastructure 0.9 4.2
Machinery 0.9 -
Food & Staples Retailing 0.6 -
SingaporeSingaporeSingaporeSingapore
Distributors - 3.7
Food Products - 0.8
Multiline Retail - 0.4
Total Listed/Quoted InvestmentsTotal Listed/Quoted InvestmentsTotal Listed/Quoted InvestmentsTotal Listed/Quoted Investments 98.3 96.0
Other net assetsOther net assetsOther net assetsOther net assets 1.7 4.0
Net assets attributable to holders of Net assets attributable to holders of Net assets attributable to holders of Net assets attributable to holders of
redeemable unitsredeemable unitsredeemable unitsredeemable units 100.0 100.0

JPMORGAN INDONESIA FUNDJPMORGAN INDONESIA FUNDJPMORGAN INDONESIA FUNDJPMORGAN INDONESIA FUND (Formerly known as JF Indonesia Fund)(Formerly known as JF Indonesia Fund)(Formerly known as JF Indonesia Fund)(Formerly known as JF Indonesia Fund)
SemiSemiSemiSemi----annual report for theannual report for theannual report for theannual report for the
period ended 31 March 2013period ended 31 March 2013period ended 31 March 2013period ended 31 March 2013
The notes on pages 134 to 136 form part of these financial statements.
- 132 -
Statement of Financial PositionStatement of Financial PositionStatement of Financial PositionStatement of Financial Position
As at 31 March 2013As at 31 March 2013As at 31 March 2013As at 31 March 2013 (Unaudited)(Unaudited)(Unaudited)(Unaudited)
31.3.201331.3.201331.3.201331.3.2013 30.9.201230.9.201230.9.201230.9.2012
US$US$US$US$ US$US$US$US$
AssetsAssetsAssetsAssets
Cash at banks 892,831 29,516
Amounts due from brokers - 4,428,434
Amounts receivable on allotment 1,622,268 3,946,587
Investments 135,866,462 122,059,129
Dividend and other accounts
receivable 1,720,906 1,124,200
Total assetsTotal assetsTotal assetsTotal assets 140,102,467 131,587,866
---------- ----------
LiabilitiesLiabilitiesLiabilitiesLiabilities
Short term bank loans - unsecured - 1,150,000
Amounts due to brokers - 2,039,477
Amounts payable on redemption 1,684,312 1,025,976
Other accounts payable 164,241 190,630
Total liabilitiesTotal liabilitiesTotal liabilitiesTotal liabilities 1,848,553 4,406,083
---------- ----------
Net assets attributable to holders Net assets attributable to holders Net assets attributable to holders Net assets attributable to holders
of redeemable units of redeemable units of redeemable units of redeemable units [Note 3] 138,253,914 127,181,783
EquityEquityEquityEquity 138,253,914 127,181,783
Statement of Comprehensive IncomeStatement of Comprehensive IncomeStatement of Comprehensive IncomeStatement of Comprehensive Income
For the period ended 31 March 2013For the period ended 31 March 2013For the period ended 31 March 2013For the period ended 31 March 2013 (Unaudited)(Unaudited)(Unaudited)(Unaudited)
1.10.20121.10.20121.10.20121.10.2012
totototo
31.3.201331.3.201331.3.201331.3.2013
1.10.20111.10.20111.10.20111.10.2011
totototo
31.3.201231.3.201231.3.201231.3.2012
US$US$US$US$ US$US$US$US$
IncomeIncomeIncomeIncome
Net gains on investments and
derivatives [Note 4] 29,158,226 13,763,489
Dividend income 424,678 242,550
Interest on deposits 1,029 2,510
Net foreign currency exchange
losses (142,639) (158,494)
29,441,294 13,850,055
---------- ----------
ExpensesExpensesExpensesExpenses
Management fee 920,782 807,556
Transaction costs 272,190 396,463
Registrar's fee 25,694 24,650
Trustee's fee 24,523 29,331
Safe custody and bank charges 21,492 26,764
Valuation fee 7,910 8,540
Auditor's fee 5,796 7,363
Printing and publication expenses 1,334 1,325
Legal and professional expenses 227 90
Other operating expenses 1,245 503
1,281,193 1,302,585
---------- ----------
Net operating profitNet operating profitNet operating profitNet operating profit 28,160,101 12,547,470
Finance costsFinance costsFinance costsFinance costs
Interest paid (870) (2,933)
Profit before taxationProfit before taxationProfit before taxationProfit before taxation 28,159,231 12,544,537
Taxation (82,943) (47,811)
Increase in net assets Increase in net assets Increase in net assets Increase in net assets
attributable to holders of attributable to holders of attributable to holders of attributable to holders of
redeemable units and total redeemable units and total redeemable units and total redeemable units and total
comprehensive incomecomprehensive incomecomprehensive incomecomprehensive income 28,076,288 12,496,726
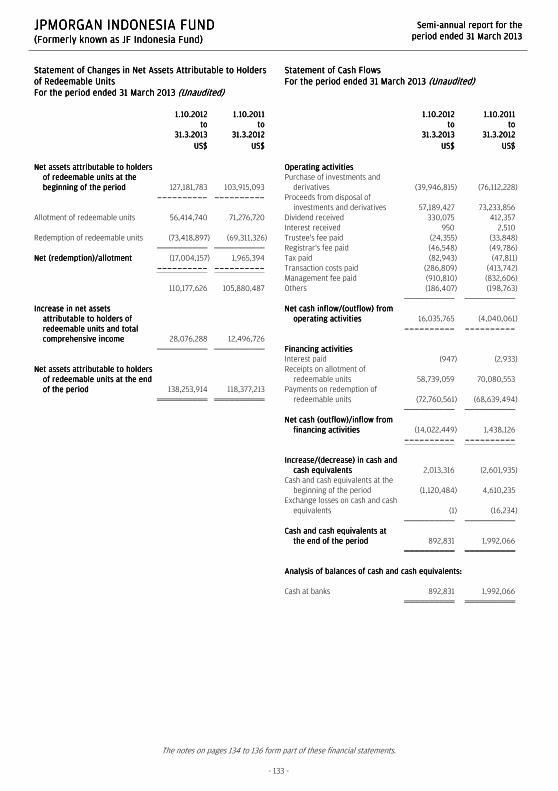
JPMORGAN INDONESIA FUNDJPMORGAN INDONESIA FUNDJPMORGAN INDONESIA FUNDJPMORGAN INDONESIA FUND (Formerly known as JF Indonesia Fund)(Formerly known as JF Indonesia Fund)(Formerly known as JF Indonesia Fund)(Formerly known as JF Indonesia Fund)
SemiSemiSemiSemi----annual report for theannual report for theannual report for theannual report for the
period ended 31 March 2013period ended 31 March 2013period ended 31 March 2013period ended 31 March 2013
The notes on pages 134 to 136 form part of these financial statements.
- 133 -
Statement of Changes in Net Assets Attributable to Holders Statement of Changes in Net Assets Attributable to Holders Statement of Changes in Net Assets Attributable to Holders Statement of Changes in Net Assets Attributable to Holders
of Redeemable Unitsof Redeemable Unitsof Redeemable Unitsof Redeemable Units
For the period ended 31 March 2013For the period ended 31 March 2013For the period ended 31 March 2013For the period ended 31 March 2013 (Unaudited)(Unaudited)(Unaudited)(Unaudited)
1.10.20121.10.20121.10.20121.10.2012
totototo
31.3.201331.3.201331.3.201331.3.2013
1.10.20111.10.20111.10.20111.10.2011
totototo
31.3.201231.3.201231.3.201231.3.2012
US$US$US$US$ US$US$US$US$
Net assets attributable to holders Net assets attributable to holders Net assets attributable to holders Net assets attributable to holders
of redeemable units at the of redeemable units at the of redeemable units at the of redeemable units at the
beginning of the periodbeginning of the periodbeginning of the periodbeginning of the period 127,181,783 103,915,093
---------- ----------
Allotment of redeemable units 56,414,740 71,276,720
Redemption of redeemable units (73,418,897) (69,311,326)
Net (redemption)/allotmentNet (redemption)/allotmentNet (redemption)/allotmentNet (redemption)/allotment (17,004,157) 1,965,394
---------- ----------
110,177,626 105,880,487
Increase in net assets Increase in net assets Increase in net assets Increase in net assets
attributable to holders of attributable to holders of attributable to holders of attributable to holders of
redeemable units and total redeemable units and total redeemable units and total redeemable units and total
comprehensive incomecomprehensive incomecomprehensive incomecomprehensive income 28,076,288 12,496,726
Net assets attributable Net assets attributable Net assets attributable Net assets attributable to holders to holders to holders to holders
of redeemable units at the end of redeemable units at the end of redeemable units at the end of redeemable units at the end
of the periodof the periodof the periodof the period 138,253,914 118,377,213
Statement of Cash FlowsStatement of Cash FlowsStatement of Cash FlowsStatement of Cash Flows
For the period ended 31 March 2013For the period ended 31 March 2013For the period ended 31 March 2013For the period ended 31 March 2013 (Unaudited)(Unaudited)(Unaudited)(Unaudited)
1.10.20121.10.20121.10.20121.10.2012
totototo
31.3.201331.3.201331.3.201331.3.2013
1.10.20111.10.20111.10.20111.10.2011
totototo
31.3.201231.3.201231.3.201231.3.2012
US$US$US$US$ US$US$US$US$
Operating Operating Operating Operating activitiesactivitiesactivitiesactivities
Purchase of investments and
derivatives (39,946,815) (76,112,228)
Proceeds from disposal of
investments and derivatives 57,189,427 73,233,856
Dividend received 330,075 412,357
Interest received 950 2,510
Trustee's fee paid (24,355) (33,848)
Registrar's fee paid (46,548) (49,786)
Tax paid (82,943) (47,811)
Transaction costs paid (286,809) (413,742)
Management fee paid (910,810) (832,606)
Others (186,407) (198,763)
Net cash inflow/(outflow) from Net cash inflow/(outflow) from Net cash inflow/(outflow) from Net cash inflow/(outflow) from
operating operating operating operating activitiesactivitiesactivitiesactivities 16,035,765 (4,040,061)
---------- ----------
Financing activitiesFinancing activitiesFinancing activitiesFinancing activities
Interest paid (947) (2,933)
Receipts on allotment of
redeemable units 58,739,059 70,080,553
Payments on redemption of
redeemable units (72,760,561) (68,639,494)
Net cash (outflow)/inflow from Net cash (outflow)/inflow from Net cash (outflow)/inflow from Net cash (outflow)/inflow from
financing activitiesfinancing activitiesfinancing activitiesfinancing activities (14,022,449) 1,438,126
---------- ----------
Increase/(decrease) in cash and Increase/(decrease) in cash and Increase/(decrease) in cash and Increase/(decrease) in cash and
cash equivalentscash equivalentscash equivalentscash equivalents 2,013,316 (2,601,935)
Cash and cash equivalents at the
beginning of the period (1,120,484) 4,610,235
Exchange losses on cash and cash
equivalents (1) (16,234)
Cash and cash equivalents at Cash and cash equivalents at Cash and cash equivalents at Cash and cash equivalents at
the end of the periodthe end of the periodthe end of the periodthe end of the period 892,831 1,992,066
Analysis of balances of cash and cash equivalents:Analysis of balances of cash and cash equivalents:Analysis of balances of cash and cash equivalents:Analysis of balances of cash and cash equivalents:
Cash at banks 892,831 1,992,066

JPMORGAN INDONESIA FUNDJPMORGAN INDONESIA FUNDJPMORGAN INDONESIA FUNDJPMORGAN INDONESIA FUND (Formerly known as JF Indonesia Fund)(Formerly known as JF Indonesia Fund)(Formerly known as JF Indonesia Fund)(Formerly known as JF Indonesia Fund)
SemiSemiSemiSemi----annual report for theannual report for theannual report for theannual report for the
period ended 31 March 2013period ended 31 March 2013period ended 31 March 2013period ended 31 March 2013
- 134 -
Notes to the Financial StatementsNotes to the Financial StatementsNotes to the Financial StatementsNotes to the Financial Statements
1111 The FundThe FundThe FundThe Fund
JPMorgan Indonesia Fund (the "Fund") was established under a Trust Deed dated 19 September 2006, as amended, and is governed by the
laws of Hong Kong. The Fund is authorized by the Securities and Futures Commission of Hong Kong.
With effect from 4 February 2013, the name of the Fund was changed from JF Indonesia Fund to JPMorgan Indonesia Fund.
The investment objective of the Fund is to provide investors with long-term capital appreciation through a portfolio consisting primarily of
securities linked to the Indonesian economy. These include, but are not restricted to, securities traded on the stock exchanges of Indonesia.
Pursuant to the Supplemental Trust Deed dated 4 January 2013, the Manager may decide to issue separate classes (each a “Class”) whose
assets will be commonly invested but where a specific fee structure, currency or distribution policy may be applied. Each Class may have a
different charging structure with the result that the net asset value attributable to each Class may differ.
All unitholders' rights with regard to the convening, voting or otherwise acting at any meeting of unitholders are the same.
2222 Summary of principal accounting policiesSummary of principal accounting policiesSummary of principal accounting policiesSummary of principal accounting policies
(a)(a)(a)(a) Accounting policies of interiAccounting policies of interiAccounting policies of interiAccounting policies of interim financial statementsm financial statementsm financial statementsm financial statements
The accounting policies and methods of computation used in the preparation of these unaudited condensed interim financial statements
are consistent with those used in the annual financial statements for the year ended 30 September 2012.
(b)(b)(b)(b) Investments and derivatives Investments and derivatives Investments and derivatives Investments and derivatives
Classification
The Fund classifies its investments and derivatives as financial assets or financial liabilities at fair value through profit or loss. These
financial assets or financial liabilities are held-for-trading as they are acquired or incurred principally for the purpose of selling or
repurchasing in the near term or short-term profit taking.
All derivatives are carried in assets when amounts are receivable by the Fund and in liabilities when amounts are payable by the Fund.
The Fund makes short sales in which a borrowed security is sold in anticipation of a decline in the market value of that security, or it may
use short sales for various arbitrage transactions. Short sales are classified as financial liabilities at fair value through profit or loss.
Recognition, derecognition and measurement
Purchases and sales of investments and derivatives are accounted for on the trade date basis. Investments and derivatives are initially
recognized at fair value and are subsequently re-measured at fair value. Realized and unrealized gains and losses on investments and
derivatives are recognized in the Statement of Comprehensive Income. Investments and derivatives are derecognized when the rights to
receive cash flows from the investments and derivatives have expired or the Fund has transferred substantially all risks and rewards of
ownership.
Fair value estimation
Investments that are listed or traded on an exchange and investments with prices quoted in over-the-counter markets or by market
makers, are fair valued based on quoted "bid" prices on long investments and quoted "ask" prices on investments sold short. When
trading in the securities of an investee company is suspended, the investment is valued at the Manager's estimate of its fair value.
Debt securities are fair valued based on quoted prices inclusive of accrued interest.
Investments in collective investment schemes are stated at fair value based on the net asset value per unit of the respective funds as
determined by the administrators of the relevant funds or stated at "bid" prices if the collective investment schemes are listed or traded
on an exchange.

JPMORGAN INDONESIA FUNDJPMORGAN INDONESIA FUNDJPMORGAN INDONESIA FUNDJPMORGAN INDONESIA FUND (Formerly known as JF Indonesia Fund)(Formerly known as JF Indonesia Fund)(Formerly known as JF Indonesia Fund)(Formerly known as JF Indonesia Fund)
SemiSemiSemiSemi----annual report for theannual report for theannual report for theannual report for the
period ended 31 March 2013period ended 31 March 2013period ended 31 March 2013period ended 31 March 2013
- 135 -
Open future and swap contracts are valued at "bid" prices for long positions and "ask" prices for short positions at the valuation date.
The differences between the bid/ask prices and the contract prices are recognized in the Statement of Comprehensive Income.
Open option contracts are valued at "bid" prices for long positions and "ask" prices for short positions at the valuation date. The
differences between the bid/ask prices and the premium amounts/contract prices are recognized in the Statement of Comprehensive
Income.
Forward foreign exchange contracts are valued at the forward rates ruling at the valuation date. The differences between the forward
rates and the contract rates are recognized in the Statement of Comprehensive Income.
(c)(c)(c)(c) Securities borrowing Securities borrowing Securities borrowing Securities borrowing
The Fund may enter into securities borrowing arrangements for short sale purposes. Short positions represent obligations to deliver
securities sold but not yet purchased, and are accounted for as investments and valued at their fair value. Securities borrowed during the
period/year are off-balance sheet transactions and are therefore not included in the investment portfolio of the Fund. Collateral placed
for the purpose of securities borrowed generally consist of cash collateral and are included in the Statement of Financial Position
separately.
(d)(d)(d)(d) Foreign currency translationForeign currency translationForeign currency translationForeign currency translation
Functional and presentation currency
The Fund has adopted United States dollar as its functional and presentation currency.
Transactions and balances
Foreign currency transactions are translated into the functional currency using the exchange rates prevailing at the dates of the
transactions.
Foreign exchange gains and losses resulting from the settlement of such transactions and from the translation of assets and liabilities
denominated in foreign currencies at period/year end exchange rates are recognized in the Statement of Comprehensive Income.
Foreign exchange gains and losses relating to cash and cash equivalents are presented in the Statement of Comprehensive Income
within "Net foreign currency exchange gains/losses". Foreign exchange gains and losses relating to the financial assets and liabilities
carried at fair value through profit or loss are presented in the Statement of Comprehensive Income within "Net gains/losses on
investments and derivatives".
(e)(e)(e)(e) Proceeds and payments on allotment and redemption of unitsProceeds and payments on allotment and redemption of unitsProceeds and payments on allotment and redemption of unitsProceeds and payments on allotment and redemption of units
The net asset value per unit is computed for each dealing day. The price at which units are allotted or redeemed is calculated by
reference to the net asset value per unit as at the close of business on the relevant dealing day in accordance with the provisions of the
Fund's Trust Deed dated 19 September 2006, as amended, which may be different from the accounting policies stated in the financial
statements.
3333 Number of units in issue and net assets attributable to holders of redeemable units (per unit)Number of units in issue and net assets attributable to holders of redeemable units (per unit)Number of units in issue and net assets attributable to holders of redeemable units (per unit)Number of units in issue and net assets attributable to holders of redeemable units (per unit)
31.3.2013 30.9.2012
Units Units
Number of units in issue 3,816,439.024 4,398,927.140
US$ US$
Net assets attributable to holders of redeemable units 138,253,914 127,181,783
Net assets attributable to holders of redeemable units (per unit) 36.23 28.91

JPMORGAN INDONESIA FUNDJPMORGAN INDONESIA FUNDJPMORGAN INDONESIA FUNDJPMORGAN INDONESIA FUND (Formerly known as JF Indonesia Fund)(Formerly known as JF Indonesia Fund)(Formerly known as JF Indonesia Fund)(Formerly known as JF Indonesia Fund)
SemiSemiSemiSemi----annual report for theannual report for theannual report for theannual report for the
period ended 31 March 2013period ended 31 March 2013period ended 31 March 2013period ended 31 March 2013
- 136 -
4444 Net gains on investments and derivatives Net gains on investments and derivatives Net gains on investments and derivatives Net gains on investments and derivatives
1.10.2012
to
31.3.2013
1.10.2011
to
31.3.2012
US$ US$
Change in unrealized gains/losses in value of investments and derivatives 21,343,200 11,158,002
Realized gains on sale of investments and derivatives 7,815,026 2,605,487
29,158,226 13,763,489
5555 Soft commission arrangementsSoft commission arrangementsSoft commission arrangementsSoft commission arrangements
The Investment Manager has entered into soft commission arrangements with brokers under which certain goods and services used to
support investment decision making are received by the Investment Manager. The Investment Manager does not make direct payment for
these services but transacts an agreed amount of business with the brokers on behalf of the Fund. Commission is paid from the Fund on these
transactions.
The goods and services must be of demonstrable benefit to the Fund and may include research and advisory services; economic and political
analysis; portfolio analysis, including valuation and performance measurement; market analysis, data and quotation services, computer
hardware and software incidental to the above goods and services; clearing and custodian services and investment-related publications.
6666 Distribution Distribution Distribution Distribution
No distribution was made during the period (31 March 2012: nil).

JPMORGAN JAPAN (YEN) FUNDJPMORGAN JAPAN (YEN) FUNDJPMORGAN JAPAN (YEN) FUNDJPMORGAN JAPAN (YEN) FUND (Formerly known as JF Japan (Yen) Fund)(Formerly known as JF Japan (Yen) Fund)(Formerly known as JF Japan (Yen) Fund)(Formerly known as JF Japan (Yen) Fund)
SemiSemiSemiSemi----annual report for theannual report for theannual report for theannual report for the
period ended 31 March 2013period ended 31 March 2013period ended 31 March 2013period ended 31 March 2013
- 137 -
Distributor StatusDistributor StatusDistributor StatusDistributor Status
The Fund has been certified by HMRC in the UK as a
distributing fund in respect of the period from 1 January
1984 to 30 September 2010. The principal effect of this
certification is that for unitholders resident or ordinarily
resident in the UK for taxation purposes any gains accruing
on the sale, redemption or other disposal of units during
the period will be taxed in the UK as a capital gain and not
as income. This treatment will continue under the new UK
reporting fund regime provided the Fund does not invest
more than 5% of its assets in other offshore funds which
are not themselves reporting funds. There will be no need
to formally apply for reporting fund status as the Fund is
transparent for UK tax purposes and therefore considered
out of scope of the requirements of this new regime.
As noted, the Fund is transparent for UK income tax
purposes and UK investors are subject to UK capital gains
tax on disposal of their units. UK investors are subject to tax
on their share of income of the Fund on an arising basis.
Information has been provided to UK investors of the
amount of their share of the underlying income, expenses
and overseas tax suffered.
Investment PortfolioInvestment PortfolioInvestment PortfolioInvestment Portfolio
As at 31 March 2013As at 31 March 2013As at 31 March 2013As at 31 March 2013 (Unaudited)(Unaudited)(Unaudited)(Unaudited)
HoldingHoldingHoldingHolding
FairFairFairFair
valuevaluevaluevalue
JPY'000JPY'000JPY'000JPY'000
% of% of% of% of
netnetnetnet
assetsassetsassetsassets
Listed/Quoted InvestmentsListed/Quoted InvestmentsListed/Quoted InvestmentsListed/Quoted Investments (116.6%)
EquitiesEquitiesEquitiesEquities (116.6%)
JapanJapanJapanJapan (116.6%)
BanksBanksBanksBanks (16.1%)
Mitsubishi UFJ Financial Group 1,081,000 602,118 4.7
Mizuho Financial Group 1,471,100 292,749 2.3
Seven Bank 404,800 122,654 1.0
Shinsei Bank 1,423,000 300,253 2.3
Sumitomo Mitsui Financial Grp 198,000 747,451 5.8
ChemicalsChemicalsChemicalsChemicals (2.8%)
Kansai Paint Co 117,000 122,148 0.9
Nifco Inc 26,300 58,570 0.5
Unicharm Corp 33,200 184,260 1.4
ConstructionConstructionConstructionConstruction (1.9%)
Obayashi Corp 256,000 114,688 0.9
SHO-BOND Hldgs 39,000 132,990 1.0
Electric AppliancesElectric AppliancesElectric AppliancesElectric Appliances (11.6%)
Anritsu Corp 44,000 63,844 0.5
Enplas Corp 55,100 248,226 1.9
Fanuc Corp 17,100 247,437 1.9
Hitachi Ltd 671,000 364,353 2.8
Keyence Corp 4,370 125,113 1.0
Mitsubishi Electric 337,000 255,109 2.0
Sysmex Corp 33,200 191,564 1.5
(Continued)
HoldingHoldingHoldingHolding
FairFairFairFair
valuevaluevaluevalue
JPY'000JPY'000JPY'000JPY'000
% of% of% of% of
netnetnetnet
assetsassetsassetsassets
FoodsFoodsFoodsFoods (3.5%)
Japan Tobacco 112,700 337,987 2.7
Toyo Suisan Kaisha 37,000 106,227 0.8
Glass & Ceramics ProductsGlass & Ceramics ProductsGlass & Ceramics ProductsGlass & Ceramics Products (2.3%)
Taiheiyo Cement 1,350,000 297,000 2.3
Information & CommunicationInformation & CommunicationInformation & CommunicationInformation & Communication (7.6%)
Avex Group Hldgs 55,700 144,987 1.1
Digital Garage 665 202,492 1.6
Fuji Media Hldgs 802 130,806 1.0
Itochu Techno-Solutions 24,900 117,279 0.9
Konami Corp 56,700 107,106 0.8
Softbank Corp 64,000 277,440 2.2
InsuranceInsuranceInsuranceInsurance (1.8%)
Anicom Hldgs 23,700 24,648 0.2
Lifenet Insurance 40,100 33,082 0.2
Tokio Marine Hldgs 66,500 175,892 1.4
MachineryMachineryMachineryMachinery (6.2%)
Daikin Industries 47,700 175,298 1.4
Glory Ltd 25,100 56,575 0.4
Kubota Corp 198,000 264,726 2.1
Makita Corp 68,700 293,692 2.3
Metal ProductsMetal ProductsMetal ProductsMetal Products (1.7%)
LIXIL Group 81,700 151,717 1.2
Sumco Corp 55,100 60,004 0.5
Non Ferrous MetalsNon Ferrous MetalsNon Ferrous MetalsNon Ferrous Metals (1.7%)
Sumitomo Electric Industries 191,900 222,604 1.7
Other Other Other Other Financing BusinessFinancing BusinessFinancing BusinessFinancing Business (5.3%)
Aeon Credit Service 48,000 127,872 1.0
Orix Corp 467,800 556,682 4.3
PharmaceuticalsPharmaceuticalsPharmaceuticalsPharmaceuticals (3.5%)
3-D Matrix 27,700 201,656 1.6
Nippon Shinyaku 110,000 146,960 1.1
Sosei Group 31,600 103,174 0.8
Precision InstrumentsPrecision InstrumentsPrecision InstrumentsPrecision Instruments (1.3%)
Asahi Intecc 32,800 169,576 1.3
Real EstateReal EstateReal EstateReal Estate (9.6%)
Hulic Co 340,200 262,294 2.0
Industrial & Infrastructure
Fund 194 201,954 1.6
Leopalace21 Corp 607,700 241,257 1.9
Sumitomo Realty &
Development 94,000 337,930 2.6
Tokyo Tatemono 293,000 192,794 1.5
Retail TradeRetail TradeRetail TradeRetail Trade (9.5%)
Cosmos Pharmaceutical 10,500 128,520 1.0
Don Quijote 42,400 176,384 1.4
FamilyMart Co 29,100 126,294 1.0
Jin Co 54,000 275,400 2.1
Kusuri No Aoki 20,700 151,524 1.2

JPMORGAN JAPAN (YEN) FUNDJPMORGAN JAPAN (YEN) FUNDJPMORGAN JAPAN (YEN) FUNDJPMORGAN JAPAN (YEN) FUND (Formerly known as JF Japan (Yen) Fund)(Formerly known as JF Japan (Yen) Fund)(Formerly known as JF Japan (Yen) Fund)(Formerly known as JF Japan (Yen) Fund)
SemiSemiSemiSemi----annual report for theannual report for theannual report for theannual report for the
period ended 31 March 2013period ended 31 March 2013period ended 31 March 2013period ended 31 March 2013
- 138 -
Investment PortfolioInvestment PortfolioInvestment PortfolioInvestment Portfolio (Continued)
As As As As at 31 March 2013at 31 March 2013at 31 March 2013at 31 March 2013 (Unaudited)(Unaudited)(Unaudited)(Unaudited)
HoldingHoldingHoldingHolding
FairFairFairFair
valuevaluevaluevalue
JPY'000JPY'000JPY'000JPY'000
% of% of% of% of
netnetnetnet
assetsassetsassetsassets
Retail TradeRetail TradeRetail TradeRetail Trade (Continued)
MonotaRO Co 50,300 227,859 1.8
Seria Co 57,100 133,728 1.0
SecuritiesSecuritiesSecuritiesSecurities (1.5%)
Tokai Tokyo Financial Hldgs 278,000 189,596 1.5
ServicesServicesServicesServices (9.6%)
Cookpad Inc 39,500 185,058 1.5
H I S Co 31,900 136,372 1.1
Kakaku.com Inc 89,400 206,961 1.6
M3 Inc 1,285 232,585 1.8
Nihon M&A Center 37,800 156,681 1.2
Rakuten Inc 188,100 180,012 1.4
Sohgo Security Services 96,800 132,810 1.0
Transportation EquipmentTransportation EquipmentTransportation EquipmentTransportation Equipment (12.0%)
Daido Metal Co 69,000 52,302 0.4
Daihatsu Motor 131,000 255,057 2.0
Honda Motor 40,700 144,688 1.1
Isuzu Motors 590,000 327,450 2.5
Musashi Seimitsu Industry 56,500 118,368 0.9
Nissan Motor 216,900 196,078 1.5
Nissin Kogyo 80,900 125,395 1.0
Shimano Inc 25,300 201,135 1.6
Suzuki Motor 58,100 122,591 1.0
Wholesale TradeWholesale TradeWholesale TradeWholesale Trade (7.1%)
Daiichikosho Co 49,600 125,141 1.0
Itochu Corp 242,600 274,138 2.1
Marubeni Corp 347,000 243,941 1.9
Misumi Group 56,700 147,023 1.1
Sanrio Co 30,600 128,061 1.0
Total Listed/Quoted InvestmentsTotal Listed/Quoted InvestmentsTotal Listed/Quoted InvestmentsTotal Listed/Quoted Investments 14,996,390 116.6
Other net liabilitiesOther net liabilitiesOther net liabilitiesOther net liabilities (2,136,140) (16.6)
Net assets attributable to holders of Net assets attributable to holders of Net assets attributable to holders of Net assets attributable to holders of
redeemable units at 31 March redeemable units at 31 March redeemable units at 31 March redeemable units at 31 March 2013201320132013 12,860,250 100.0
Total investments, at costTotal investments, at costTotal investments, at costTotal investments, at cost 11,030,058
Statement of Movements in Portfolio HoldingsStatement of Movements in Portfolio HoldingsStatement of Movements in Portfolio HoldingsStatement of Movements in Portfolio Holdings
For the period ended 31 March 2013For the period ended 31 March 2013For the period ended 31 March 2013For the period ended 31 March 2013 (Unaudited)(Unaudited)(Unaudited)(Unaudited)
% holdings% holdings% holdings% holdings
of net assetsof net assetsof net assetsof net assets
31.3.201331.3.201331.3.201331.3.2013 30.9.201230.9.201230.9.201230.9.2012
Listed/Quoted InvestmentsListed/Quoted InvestmentsListed/Quoted InvestmentsListed/Quoted Investments
EquitiesEquitiesEquitiesEquities
JapanJapanJapanJapan
Banks 16.1 4.7
Transportation Equipment 12.0 11.0
Electric Appliances 11.6 8.4
Real Estate 9.6 3.6
Services 9.6 15.6
Retail Trade 9.5 12.2
Information & Communication 7.6 12.0
Wholesale Trade 7.1 10.5
Machinery 6.2 3.9
Other Financing Business 5.3 4.4
Pharmaceuticals 3.5 1.7
Foods 3.5 5.7
Chemicals 2.8 4.0
Glass & Ceramics Products 2.3 -
Construction 1.9 1.6
Insurance 1.8 2.5
Non Ferrous Metals 1.7 1.9
Metal Products 1.7 2.2
Securities 1.5 -
Precision Instruments 1.3 -
Other Products - 2.5
Total Listed/Quoted InvestmentsTotal Listed/Quoted InvestmentsTotal Listed/Quoted InvestmentsTotal Listed/Quoted Investments 116.6 108.4
Other net liabilitiesOther net liabilitiesOther net liabilitiesOther net liabilities (16.6) (8.4)
Net assets attributable to holders of Net assets attributable to holders of Net assets attributable to holders of Net assets attributable to holders of
redeemable unitsredeemable unitsredeemable unitsredeemable units 100.0 100.0

JPMORGAN JAPAN (YEN) FUNDJPMORGAN JAPAN (YEN) FUNDJPMORGAN JAPAN (YEN) FUNDJPMORGAN JAPAN (YEN) FUND (Formerly known as JF Japan (Yen) Fund)(Formerly known as JF Japan (Yen) Fund)(Formerly known as JF Japan (Yen) Fund)(Formerly known as JF Japan (Yen) Fund)
SemiSemiSemiSemi----annual report for theannual report for theannual report for theannual report for the
period ended 31 March 2013period ended 31 March 2013period ended 31 March 2013period ended 31 March 2013
The notes on pages 141 to 143 form part of these financial statements.
- 139 -
Statement of Financial PositionStatement of Financial PositionStatement of Financial PositionStatement of Financial Position
As at 31 March 2013As at 31 March 2013As at 31 March 2013As at 31 March 2013 (Unaudited)(Unaudited)(Unaudited)(Unaudited)
31.3.201331.3.201331.3.201331.3.2013 30.9.201230.9.201230.9.201230.9.2012
JPY'000JPY'000JPY'000JPY'000 JPY'000JPY'000JPY'000JPY'000
AssetsAssetsAssetsAssets
Cash at banks 5,436 10,416
Amounts due from brokers 157,778 454,356
Amounts receivable on allotment 497,988 7,487
Investments 14,996,390 8,978,268
Dividend and other accounts
receivable 120,129 101,893
Total assetsTotal assetsTotal assetsTotal assets 15,777,721 9,552,420
---------- ----------
LiabilitiesLiabilitiesLiabilitiesLiabilities
Short term bank loans - unsecured 2,584,838 1,120,154
Amounts due to brokers 162,875 115,802
Amounts payable on redemption 154,835 17,355
Other accounts payable 14,923 12,835
Total liabilitiesTotal liabilitiesTotal liabilitiesTotal liabilities 2,917,471 1,266,146
---------- ----------
Net assets attributable to holders Net assets attributable to holders Net assets attributable to holders Net assets attributable to holders
of redeemable units of redeemable units of redeemable units of redeemable units [Note 3] 12,860,250 8,286,274
EquityEquityEquityEquity 12,860,250 8,286,274
Statement of Comprehensive IncomeStatement of Comprehensive IncomeStatement of Comprehensive IncomeStatement of Comprehensive Income
For the period ended 31 March 2013For the period ended 31 March 2013For the period ended 31 March 2013For the period ended 31 March 2013 (Unaudited)(Unaudited)(Unaudited)(Unaudited)
1.10.20121.10.20121.10.20121.10.2012
totototo
31.3.201331.3.201331.3.201331.3.2013
1.10.20111.10.20111.10.20111.10.2011
totototo
31.3.201231.3.201231.3.201231.3.2012
JPY'000JPY'000JPY'000JPY'000 JPY'000JPY'000JPY'000JPY'000
IncomeIncomeIncomeIncome
Net gains on investments and
derivatives [Note 4] 3,765,273 782,363
Dividend income 117,654 116,768
Net foreign currency exchange
(losses)/gains (111) 167
3,882,816 899,298
---------- ----------
ExpensesExpensesExpensesExpenses
Management fee 70,844 68,232
Transaction costs 6,173 3,478
Registrar's fee 2,073 1,773
Trustee's fee 1,873 2,363
Safe custody and bank charges 899 823
Valuation fee 686 640
Auditor's fee 556 594
Printing and publication expenses 176 65
Legal and professional expenses - 8
Other operating expenses 53 156
83,333 78,132
---------- ----------
Net operating profitNet operating profitNet operating profitNet operating profit 3,799,483 821,166
Finance costsFinance costsFinance costsFinance costs
Interest paid (5,769) (852)
Profit before taxationProfit before taxationProfit before taxationProfit before taxation 3,793,714 820,314
Taxation (8,407) (8,174)
Increase in net assets Increase in net assets Increase in net assets Increase in net assets
attributable to holders of attributable to holders of attributable to holders of attributable to holders of
redeemable units and total redeemable units and total redeemable units and total redeemable units and total
comprehensive incomecomprehensive incomecomprehensive incomecomprehensive income 3,785,307 812,140

JPMORGAN JAPAN (YEN) FUNDJPMORGAN JAPAN (YEN) FUNDJPMORGAN JAPAN (YEN) FUNDJPMORGAN JAPAN (YEN) FUND (Formerly known as JF Japan (Yen) Fund)(Formerly known as JF Japan (Yen) Fund)(Formerly known as JF Japan (Yen) Fund)(Formerly known as JF Japan (Yen) Fund)
SemiSemiSemiSemi----annual report for theannual report for theannual report for theannual report for the
period ended 31 March 2013period ended 31 March 2013period ended 31 March 2013period ended 31 March 2013
The notes on pages 141 to 143 form part of these financial statements.
- 140 -
Statement of Statement of Statement of Statement of Changes in Net Assets Attributable to Holders Changes in Net Assets Attributable to Holders Changes in Net Assets Attributable to Holders Changes in Net Assets Attributable to Holders
of Redeemable Unitsof Redeemable Unitsof Redeemable Unitsof Redeemable Units
For the period ended 31 March 2013For the period ended 31 March 2013For the period ended 31 March 2013For the period ended 31 March 2013 (Unaudited)(Unaudited)(Unaudited)(Unaudited)
1.10.20121.10.20121.10.20121.10.2012
totototo
31.3.201331.3.201331.3.201331.3.2013
1.10.20111.10.20111.10.20111.10.2011
totototo
31.3.201231.3.201231.3.201231.3.2012
JPY'000JPY'000JPY'000JPY'000 JPY'000JPY'000JPY'000JPY'000
Net assets attributable to holders Net assets attributable to holders Net assets attributable to holders Net assets attributable to holders
of redeemable units at the of redeemable units at the of redeemable units at the of redeemable units at the
beginning beginning beginning beginning of the periodof the periodof the periodof the period 8,286,274 9,471,028
---------- ----------
Allotment of redeemable units 3,646,681 370,724
Redemption of redeemable units (2,858,012) (862,039)
Net allotment/(redemption)Net allotment/(redemption)Net allotment/(redemption)Net allotment/(redemption) 788,669 (491,315)
---------- ----------
9,074,943 8,979,713
Increase in net assets Increase in net assets Increase in net assets Increase in net assets
attributable to holders of attributable to holders of attributable to holders of attributable to holders of
redeemable units and total redeemable units and total redeemable units and total redeemable units and total
comprehensive incomecomprehensive incomecomprehensive incomecomprehensive income 3,785,307 812,140
Net assets attributable to holders Net assets attributable to holders Net assets attributable to holders Net assets attributable to holders
of redeemable units at the end of redeemable units at the end of redeemable units at the end of redeemable units at the end
of of of of the periodthe periodthe periodthe period 12,860,250 9,791,853
Statement of Cash FlowsStatement of Cash FlowsStatement of Cash FlowsStatement of Cash Flows
For the period ended 31 March 2013For the period ended 31 March 2013For the period ended 31 March 2013For the period ended 31 March 2013 (Unaudited)(Unaudited)(Unaudited)(Unaudited)
1.10.20121.10.20121.10.20121.10.2012
totototo
31.3.201331.3.201331.3.201331.3.2013
1.10.20111.10.20111.10.20111.10.2011
totototo
31.3.201231.3.201231.3.201231.3.2012
JPY'000JPY'000JPY'000JPY'000 JPY'000JPY'000JPY'000JPY'000
Operating activitiesOperating activitiesOperating activitiesOperating activities
Purchase of investments and
derivatives (5,700,773) (2,768,627)
Proceeds from disposal of
investments and derivatives 3,791,727 2,126,350
Dividend received 99,378 97,771
Trustee's fee paid (1,803) (2,616)
Registrar's fee paid (3,565) (3,545)
Transaction costs paid (6,319) (3,306)
Tax paid (8,407) (8,174)
Management fee paid (66,636) (68,010)
Others (3,525) (3,096)
Net cash outflow from Net cash outflow from Net cash outflow from Net cash outflow from
operating activitiesoperating activitiesoperating activitiesoperating activities (1,899,923) (633,253)
---------- ----------
Financing activitiesFinancing activitiesFinancing activitiesFinancing activities
Interest paid (5,684) (810)
Receipts on allotment of
redeemable units 3,156,180 390,280
Payments on redemption of
redeemable units (2,720,532) (865,109)
Net cash inflow/(outflow) from Net cash inflow/(outflow) from Net cash inflow/(outflow) from Net cash inflow/(outflow) from
financing activitiesfinancing activitiesfinancing activitiesfinancing activities 429,964 (475,639)
---------- ----------
Decrease in cash and cash Decrease in cash and cash Decrease in cash and cash Decrease in cash and cash
equivalentsequivalentsequivalentsequivalents (1,469,959) (1,108,892)
Cash and cash equivalents at the
beginning of the period (1,109,738) 138,440
Exchange gains on cash and cash
equivalents 295 62
Cash and cash Cash and cash Cash and cash Cash and cash equivalents at equivalents at equivalents at equivalents at
the end of the periodthe end of the periodthe end of the periodthe end of the period (2,579,402) (970,390)
Analysis of balances of cash and cash equivalents:Analysis of balances of cash and cash equivalents:Analysis of balances of cash and cash equivalents:Analysis of balances of cash and cash equivalents:
Cash at banks 5,436 37,418
Short term bank loans -
unsecured (2,584,838) (1,007,808)
(2,579,402) (970,390)

JPMORGAN JAPAN (YEN) FUNDJPMORGAN JAPAN (YEN) FUNDJPMORGAN JAPAN (YEN) FUNDJPMORGAN JAPAN (YEN) FUND (Formerly known as JF Japan (Yen) Fund)(Formerly known as JF Japan (Yen) Fund)(Formerly known as JF Japan (Yen) Fund)(Formerly known as JF Japan (Yen) Fund)
SemiSemiSemiSemi----annual report for theannual report for theannual report for theannual report for the
period ended 31 March 2013period ended 31 March 2013period ended 31 March 2013period ended 31 March 2013
- 141 -
Notes to the Financial StatementsNotes to the Financial StatementsNotes to the Financial StatementsNotes to the Financial Statements
1111 The FundThe FundThe FundThe Fund
JPMorgan Japan (Yen) Fund (the "Fund") was established under a Trust Deed dated 1 August 1969, as amended, and is governed by the laws of
Hong Kong. The Fund is authorized by the Securities and Futures Commission of Hong Kong.
With effect from 4 February 2013, the name of the Fund was changed from JF Japan (Yen) Fund to JPMorgan Japan (Yen) Fund.
The investment objective of the Fund is to provide investors with long-term capital growth through investment primarily in Japanese
securities and other securities whose performance is linked to the Japanese economy.
All unitholders' rights with regard to the convening, voting or otherwise acting at any meeting of unitholders are the same.
2222 Summary of principal accounting policiesSummary of principal accounting policiesSummary of principal accounting policiesSummary of principal accounting policies
(a)(a)(a)(a) Accounting policies of interim financial statementsAccounting policies of interim financial statementsAccounting policies of interim financial statementsAccounting policies of interim financial statements
The accounting policies and methods of computation used in the preparation of these unaudited condensed interim financial statements
are consistent with those used in the annual financial statements for the year ended 30 September 2012.
(b)(b)(b)(b) Investments and derivativesInvestments and derivativesInvestments and derivativesInvestments and derivatives
Classification
The Fund classifies its investments and derivatives as financial assets or financial liabilities at fair value through profit or loss. These
financial assets or financial liabilities are held-for-trading as they are acquired or incurred principally for the purpose of selling or
repurchasing in the near term or short-term profit taking.
All derivatives are carried in assets when amounts are receivable by the Fund and in liabilities when amounts are payable by the Fund.
The Fund makes short sales in which a borrowed security is sold in anticipation of a decline in the market value of that security, or it may
use short sales for various arbitrage transactions. Short sales are classified as financial liabilities at fair value through profit or loss.
Recognition, derecognition and measurement
Purchases and sales of investments and derivatives are accounted for on the trade date basis. Investments and derivatives are initially
recognized at fair value and are subsequently re-measured at fair value. Realized and unrealized gains and losses on investments and
derivatives are recognized in the Statement of Comprehensive Income. Investments and derivatives are derecognized when the rights to
receive cash flows from the investments and derivatives have expired or the Fund has transferred substantially all risks and rewards of
ownership.
Fair value estimation
Investments that are listed or traded on an exchange and investments with prices quoted in over-the-counter markets or by market
makers, are fair valued based on quoted "bid" prices on long investments and quoted "ask" prices on investments sold short. When
trading in the securities of an investee company is suspended, the investment is valued at the Manager's estimate of its fair value.
Debt securities are fair valued based on quoted prices inclusive of accrued interest.
Investments in collective investment schemes are stated at fair value based on the net asset value per unit of the respective funds as
determined by the administrators of the relevant funds or stated at "bid" prices if the collective investment schemes are listed or traded
on an exchange.
Open future and swap contracts are valued at "bid" prices for long positions and "ask" prices for short positions at the valuation date.
The differences between the bid/ask prices and the contract prices are recognized in the Statement of Comprehensive Income.
Open option contracts are valued at "bid" prices for long positions and "ask" prices for short positions at the valuation date. The
differences between the bid/ask prices and the premium amounts/contract prices are recognized in the Statement of Comprehensive
Income.
Forward foreign exchange contracts are valued at the forward rates ruling at the valuation date. The differences between the forward
rates and the contract rates are recognized in the Statement of Comprehensive Income.

JPMORGAN JAPAN (YEN) FUNDJPMORGAN JAPAN (YEN) FUNDJPMORGAN JAPAN (YEN) FUNDJPMORGAN JAPAN (YEN) FUND (Formerly known as JF Japan (Yen) Fund)(Formerly known as JF Japan (Yen) Fund)(Formerly known as JF Japan (Yen) Fund)(Formerly known as JF Japan (Yen) Fund)
SemiSemiSemiSemi----annual report for theannual report for theannual report for theannual report for the
period ended 31 March 2013period ended 31 March 2013period ended 31 March 2013period ended 31 March 2013
- 142 -
(c)(c)(c)(c) Securities lending and borrowingSecurities lending and borrowingSecurities lending and borrowingSecurities lending and borrowing
Securities lenders' agreements are entered into with institutions of appropriate financial standing who engage in such arrangements
acceptable to the Trustee and on arm's length commercial terms. Securities lent are included in the investment portfolio of the Fund.
Relevant securities lending income entitled by the Fund is accounted for in the Statement of Comprehensive Income. Collateral received
for the purpose of securities lent generally consist of non-cash collateral which are off-balance sheet transactions and are therefore not
included in the financial statements.
The Fund may enter into securities borrowing arrangements for short sale purposes. Short positions represent obligations to deliver
securities sold but not yet purchased, and are accounted for as investments and valued at their fair value. Securities borrowed during the
period/year are off-balance sheet transactions and are therefore not included in the investment portfolio of the Fund. Collateral placed
for the purpose of securities borrowed generally consist of cash collateral and are included in the Statement of Financial Position
separately.
(d)(d)(d)(d) Foreign currency translationForeign currency translationForeign currency translationForeign currency translation
Functional and presentation currency
The Fund has adopted Japanese Yen as its functional and presentation currency.
Transactions and balances
Foreign currency transactions are translated into the functional currency using the exchange rates prevailing at the dates of the
transactions.
Foreign exchange gains and losses resulting from the settlement of such transactions and from the translation of assets and liabilities
denominated in foreign currencies at period/year end exchange rates are recognized in the Statement of Comprehensive Income.
Foreign exchange gains and losses relating to cash and cash equivalents are presented in the Statement of Comprehensive Income
within "Net foreign currency exchange gains/losses". Foreign exchange gains and losses relating to the financial assets and liabilities
carried at fair value through profit or loss are presented in the Statement of Comprehensive Income within "Net gains/losses on
investments and derivatives".
(e)(e)(e)(e) Proceeds and payments on allotment and redemption of unitsProceeds and payments on allotment and redemption of unitsProceeds and payments on allotment and redemption of unitsProceeds and payments on allotment and redemption of units
The net asset value per unit is computed for each dealing day. The price at which units are allotted or redeemed is calculated by
reference to the net asset value per unit as at the close of business on the relevant dealing day in accordance with the provisions of the
Fund's Trust Deed dated 1 August 1969, as amended, which may be different from the accounting policies stated in the financial
statements.
3333 Number of units in issue and net assets attributable to holders of redeemable units (per unit)Number of units in issue and net assets attributable to holders of redeemable units (per unit)Number of units in issue and net assets attributable to holders of redeemable units (per unit)Number of units in issue and net assets attributable to holders of redeemable units (per unit)
31.3.2013 30.9.2012
Units Units
Number of units in issue 884,767.821 834,638.398
JPY'000 JPY'000
Net assets attributable to holders of redeemable units 12,860,250 8,286,274
Net assets attributable to holders of redeemable units (per unit) 14.535 9.928

JPMORGAN JAPAN (YEN) FUNDJPMORGAN JAPAN (YEN) FUNDJPMORGAN JAPAN (YEN) FUNDJPMORGAN JAPAN (YEN) FUND (Formerly known as JF Japan (Yen) Fund)(Formerly known as JF Japan (Yen) Fund)(Formerly known as JF Japan (Yen) Fund)(Formerly known as JF Japan (Yen) Fund)
SemiSemiSemiSemi----annual report for theannual report for theannual report for theannual report for the
period ended 31 March 2013period ended 31 March 2013period ended 31 March 2013period ended 31 March 2013
- 143 -
4444 Net gains on investments and derivativesNet gains on investments and derivativesNet gains on investments and derivativesNet gains on investments and derivatives
1.10.2012
to
31.3.2013
1.10.2011
to
31.3.2012
JPY'000 JPY'000
Change in unrealized gains/losses in value of investments and derivatives 3,877,595 1,018,385
Realized losses on sale of investments and derivatives (112,322) (236,022)
3,765,273 782,363
5555 Soft commission arrangementsSoft commission arrangementsSoft commission arrangementsSoft commission arrangements
The Investment Manager has entered into soft commission arrangements with brokers under which certain goods and services used to
support investment decision making are received by the Investment Manager. The Investment Manager does not make direct payment for
these services but transacts an agreed amount of business with the brokers on behalf of the Fund. Commission is paid from the Fund on these
transactions.
The goods and services must be of demonstrable benefit to the Fund and may include research and advisory services; economic and political
analysis; portfolio analysis, including valuation and performance measurement; market analysis, data and quotation services, computer
hardware and software incidental to the above goods and services; clearing and custodian services and investment-related publications.
6666 DistributionDistributionDistributionDistribution
No distribution was made during the period (31 March 2012: nil).

JPMORGAN JAPAN OTC FUNDJPMORGAN JAPAN OTC FUNDJPMORGAN JAPAN OTC FUNDJPMORGAN JAPAN OTC FUND (Formerly known as JF (Formerly known as JF (Formerly known as JF (Formerly known as JF Japan OTCJapan OTCJapan OTCJapan OTC Fund)Fund)Fund)Fund)
SemiSemiSemiSemi----annual report for theannual report for theannual report for theannual report for the
period ended 31 March 2013period ended 31 March 2013period ended 31 March 2013period ended 31 March 2013
- 144 -
Distributor StatusDistributor StatusDistributor StatusDistributor Status
The Fund has been certified by HMRC in the UK as a
distributing fund in respect of the period from 10 June 1991
to 30 September 2010. The principal effect of this
certification is that for unitholders resident or ordinarily
resident in the UK for taxation purposes any gains accruing
on the sale, redemption or other disposal of units during
the period will be taxed in the UK as a capital gain and not
as income. This treatment will continue under the new UK
reporting fund regime provided the Fund does not invest
more than 5% of its assets in other offshore funds which
are not themselves reporting funds. There will be no need
to formally apply for reporting fund status as the Fund is
transparent for UK tax purposes and therefore considered
out of scope of the requirements of this new regime.
As noted, the Fund is transparent for UK income tax
purposes and UK investors are subject to UK capital gains
tax on disposal of their units. UK investors are subject to tax
on their share of income of the Fund on an arising basis.
Information has been provided to UK investors of the
amount of their share of the underlying income, expenses
and overseas tax suffered.
Investment PortfolioInvestment PortfolioInvestment PortfolioInvestment Portfolio
As at 31 March 2013As at 31 March 2013As at 31 March 2013As at 31 March 2013 (Unaudited)(Unaudited)(Unaudited)(Unaudited)
HoldingHoldingHoldingHolding
FairFairFairFair
valuevaluevaluevalue
JPY'000JPY'000JPY'000JPY'000
% of% of% of% of
netnetnetnet
assetsassetsassetsassets
Listed/Quoted InvestmentsListed/Quoted InvestmentsListed/Quoted InvestmentsListed/Quoted Investments (95.9%)
EquitiesEquitiesEquitiesEquities (95.9%)
JapanJapanJapanJapan (95.9%)
BanksBanksBanksBanks (1.1%)
Seven Bank 40,000 12,120 0.2
Shinsei Bank 85,000 17,935 0.4
Suruga Bank 15,000 22,770 0.5
ChemicalsChemicalsChemicalsChemicals (3.2%)
Daicel Corp 15,000 11,190 0.2
FP Corp 2,000 12,260 0.3
Fuso Chemical 7,500 17,700 0.4
Mec Co 35,000 17,990 0.4
Takara Bio 30,000 43,260 0.9
Toyo Gosei 68,200 34,782 0.7
Unicharm Corp 2,500 13,875 0.3
ConstructionConstructionConstructionConstruction (2.5%)
Hajime Construction 15,000 80,700 1.7
Nippo Corp 7,000 7,994 0.2
Obayashi Corp 20,000 8,960 0.2
SHO-BOND Hldgs 4,500 15,345 0.3
Tama Home 1,000 1,537 0.1
Electric AppliancesElectric AppliancesElectric AppliancesElectric Appliances (14.1%)
Aichi Electric 65,000 19,370 0.4
Anritsu Corp 10,000 14,510 0.3
Endo Lighting 6,500 19,662 0.4
Nippon Ceramic 25,000 41,250 0.9
(Continued)
HoldingHoldingHoldingHolding
FairFairFairFair
valuevaluevaluevalue
JPY'000JPY'000JPY'000JPY'000
% of% of% of% of
netnetnetnet
assetsassetsassetsassets
Odelic Co 101,700 358,493 7.7
Onkyo Corp 425,600 51,498 1.1
Optoelectronics Co 50,000 34,400 0.7
Sanyo Denki Co 45,000 30,645 0.7
Sysmex Corp 4,500 25,965 0.6
Tabuchi Electric Co 195,000 37,635 0.8
Yokogawa Electric 25,000 23,575 0.5
FoodsFoodsFoodsFoods (0.3%)
Toyo Suisan Kaisha 5,000 14,355 0.3
Glass & Ceramics ProductsGlass & Ceramics ProductsGlass & Ceramics ProductsGlass & Ceramics Products (7.0%)
Kuramoto Co 750,000 150,000 3.2
Maruwa Co (5344) 12,500 33,012 0.7
Nihon Micro Coating 492,600 126,106 2.7
Taiheiyo Cement 75,000 16,500 0.4
Information & CommunicationInformation & CommunicationInformation & CommunicationInformation & Communication (14.0%)
Avex Group Hldgs 2,500 6,508 0.1
Bit-isle Inc 20,000 26,060 0.6
Colopl Inc 7,500 44,850 1.0
Cross Marketing 30,000 33,450 0.7
Digital Garage 225 68,512 1.5
Fujitsu Broad Solution &
Consulting 20,000 15,060 0.3
Nippon Ichi Software 50,000 33,350 0.7
Okinawa Cellular Telephone 15,000 35,025 0.8
Yahoo Japan 9,000 388,801 8.3
InsuranceInsuranceInsuranceInsurance (1.0%)
Anicom Hldgs 30,000 31,200 0.7
Lifenet Insurance 20,000 16,500 0.3
MachineryMachineryMachineryMachinery (7.9%)
Daikin Industries 3,000 11,025 0.2
Disco Corp 3,000 15,900 0.3
Freund Corp 30,000 51,510 1.1
Harmonic Drive Systems 15,000 24,375 0.5
Hoden Seimitsu Kako
Kenkyusho 25,000 18,925 0.4
Hosokawa Micron 50,000 40,150 0.9
Kubota Corp 10,000 13,370 0.3
Makita Corp 4,500 19,238 0.4
Nittoku Engineering 25,000 24,300 0.5
NuFlare Technology 85 49,385 1.1
Samco Inc 13,400 10,331 0.2
Sasakura Engineering 75,000 42,600 0.9
Takeuchi MFG 22,500 37,778 0.8
THK Co 6,500 11,804 0.3
Metal ProductsMetal ProductsMetal ProductsMetal Products (2.3%)
G-Tekt Corp 10,000 25,200 0.5
LIXIL Group 5,000 9,285 0.2
Rinnai Corp 2,000 13,500 0.3
Sanno Co 115,000 41,975 0.9
Sumco Corp 15,000 16,335 0.4
Non Ferrous MetalsNon Ferrous MetalsNon Ferrous MetalsNon Ferrous Metals (0.2%)
Sumitomo Electric Industries 10,000 11,600 0.2

JPMORGAN JAPAN OTC FUNDJPMORGAN JAPAN OTC FUNDJPMORGAN JAPAN OTC FUNDJPMORGAN JAPAN OTC FUND (Formerly known as JF (Formerly known as JF (Formerly known as JF (Formerly known as JF Japan OTCJapan OTCJapan OTCJapan OTC Fund)Fund)Fund)Fund)
SemiSemiSemiSemi----annual report for theannual report for theannual report for theannual report for the
period ended 31 March 2013period ended 31 March 2013period ended 31 March 2013period ended 31 March 2013
- 145 -
Investment PortfolioInvestment PortfolioInvestment PortfolioInvestment Portfolio (Continued)
As at 31 March 2013As at 31 March 2013As at 31 March 2013As at 31 March 2013 (Unaudited)(Unaudited)(Unaudited)(Unaudited)
HoldingHoldingHoldingHolding
FairFairFairFair
valuevaluevaluevalue
JPY'000JPY'000JPY'000JPY'000
% of% of% of% of
netnetnetnet
assetsassetsassetsassets
Other Financing BusinessOther Financing BusinessOther Financing BusinessOther Financing Business (1.2%)
Mitsubishi UFJ Lease &
Finance Co 50,000 24,800 0.5
Orix Corp 25,000 29,750 0.7
Other ProductsOther ProductsOther ProductsOther Products (1.4%)
Fuji Seal Intl 6,500 15,216 0.3
Hagihara Industries 27,500 49,170 1.1
PharmaceuticalsPharmaceuticalsPharmaceuticalsPharmaceuticals (2.7%)
Medrx Co 20,000 70,300 1.5
Nippon Shinyaku 10,000 13,360 0.3
R-Tech Ueno 150 40,965 0.9
Precision Precision Precision Precision InstrumentsInstrumentsInstrumentsInstruments (1.9%)
IMV Corp 235,000 66,740 1.4
Kokusai Co 35,000 23,100 0.5
Pulp & PaperPulp & PaperPulp & PaperPulp & Paper (0.2%)
Tokushu Tokai Paper Co 50,000 10,650 0.2
Real EstateReal EstateReal EstateReal Estate (1.9%)
Hulic Co 20,000 15,420 0.3
Leopalace21 Corp 20,000 7,940 0.2
Sumitomo Realty &
Development 15,000 53,925 1.1
Tokyo Tatemono 20,000 13,160 0.3
Retail TradeRetail TradeRetail TradeRetail Trade (14.5%)
Asahi Co 5,500 7,122 0.1
BROCCOLI Co 750,000 287,250 6.2
Cosmos Pharmaceutical 1,500 18,360 0.4
Don Quijote 5,500 22,880 0.5
McDonald's Hldgs Co (Japan) 37,500 95,962 2.1
Otsuka Kagu 50,000 46,700 1.0
Seria Co 40,000 93,680 2.0
Starbucks Coffee Japan 600 47,520 1.0
WATTS Co 65,000 54,535 1.2
SecuritiesSecuritiesSecuritiesSecurities (0.6%)
Kyokuto Securities 8,500 13,005 0.3
Marusan Securities 20,000 13,980 0.3
ServicesServicesServicesServices (12.7%)
EPCO Co 15,000 18,300 0.4
GNI Group 95,000 38,475 0.8
H I S Co 3,500 14,962 0.3
Infomart Corp 30,000 76,500 1.6
M3 Inc 90 16,290 0.4
Mixi Inc 15,000 24,435 0.5
OPT Inc 50,000 44,950 1.0
Rakuten Inc 365,000 349,306 7.5
Sohgo Security Services 8,000 10,976 0.2
Transportation EquipmentTransportation EquipmentTransportation EquipmentTransportation Equipment (2.0%)
Daido Metal Co 10,000 7,580 0.2
Daihatsu Motor 9,000 17,523 0.4
Isuzu Motors 25,000 13,875 0.3
Musashi Seimitsu Industry 5,000 10,475 0.2
Shimano Inc 2,000 15,900 0.3
(Continued)
HoldingHoldingHoldingHolding
FairFairFairFair
valuevaluevaluevalue
JPY'000JPY'000JPY'000JPY'000
% of% of% of% of
netnetnetnet
assetsassetsassetsassets
ShinMaywa Industries 20,000 14,760 0.3
Suzuki Motor 5,500 11,605 0.3
Wholesale TradeWholesale TradeWholesale TradeWholesale Trade (3.2%)
Daiichikosho Co 20,000 50,460 1.1
Misumi Group 4,500 11,668 0.3
Sanrio Co 3,000 12,555 0.3
Startia Inc 11,500 15,985 0.3
Takasho Co 45,000 20,610 0.4
Yonkyu Co 37,500 37,050 0.8
Total Listed/Quoted InvestmentsTotal Listed/Quoted InvestmentsTotal Listed/Quoted InvestmentsTotal Listed/Quoted Investments 4,473,026 95.9
Other net assetsOther net assetsOther net assetsOther net assets 191,562 4.1
Net assets attributable to holders of Net assets attributable to holders of Net assets attributable to holders of Net assets attributable to holders of
redeemable units at 31 March 2013redeemable units at 31 March 2013redeemable units at 31 March 2013redeemable units at 31 March 2013 4,664,588 100.0
Total investments, at costTotal investments, at costTotal investments, at costTotal investments, at cost 3,317,674

JPMORGAN JAPAN OTC FUNDJPMORGAN JAPAN OTC FUNDJPMORGAN JAPAN OTC FUNDJPMORGAN JAPAN OTC FUND (Formerly known as JF (Formerly known as JF (Formerly known as JF (Formerly known as JF Japan OTCJapan OTCJapan OTCJapan OTC Fund)Fund)Fund)Fund)
SemiSemiSemiSemi----annual report for theannual report for theannual report for theannual report for the
period ended 31 March 2013period ended 31 March 2013period ended 31 March 2013period ended 31 March 2013
- 146 -
Statement of Movements in Portfolio HoldingsStatement of Movements in Portfolio HoldingsStatement of Movements in Portfolio HoldingsStatement of Movements in Portfolio Holdings
For the period ended 31 March 2013For the period ended 31 March 2013For the period ended 31 March 2013For the period ended 31 March 2013 (Unaudited)(Unaudited)(Unaudited)(Unaudited)
% holdings% holdings% holdings% holdings
of net assetsof net assetsof net assetsof net assets
31.3.201331.3.201331.3.201331.3.2013 30.9.201230.9.201230.9.201230.9.2012
Listed/Quoted InvestmentsListed/Quoted InvestmentsListed/Quoted InvestmentsListed/Quoted Investments
EquitiesEquitiesEquitiesEquities
JapanJapanJapanJapan
Retail Trade 14.5 19.7
Electric Appliances 14.1 12.9
Information & Communication 14.0 16.9
Services 12.7 11.8
Machinery 7.9 6.4
Glass & Ceramics Products 7.0 3.7
Chemicals 3.2 3.0
Wholesale Trade 3.2 4.5
Pharmaceuticals 2.7 -
Construction 2.5 1.8
Metal Products 2.3 2.2
Transportation Equipment 2.0 1.6
Real Estate 1.9 1.2
Precision Instruments 1.9 2.8
Other Products 1.4 2.2
Other Financing Business 1.2 1.6
Banks 1.1 0.6
Insurance 1.0 1.0
Securities 0.6 -
Foods 0.3 1.6
Non Ferrous Metals 0.2 0.3
Pulp & Paper 0.2 0.6
Land Transportation - 0.6
Total Listed/Quoted InvestmentsTotal Listed/Quoted InvestmentsTotal Listed/Quoted InvestmentsTotal Listed/Quoted Investments 95.9 97.0
Other net assetsOther net assetsOther net assetsOther net assets 4.1 3.0
Net assetsNet assetsNet assetsNet assets attributable to holders of attributable to holders of attributable to holders of attributable to holders of
redeemable unitsredeemable unitsredeemable unitsredeemable units 100.0 100.0

JPMORGAN JAPAN OTC FUNDJPMORGAN JAPAN OTC FUNDJPMORGAN JAPAN OTC FUNDJPMORGAN JAPAN OTC FUND (Formerly known as JF (Formerly known as JF (Formerly known as JF (Formerly known as JF Japan OTCJapan OTCJapan OTCJapan OTC Fund)Fund)Fund)Fund)
SemiSemiSemiSemi----annual report for theannual report for theannual report for theannual report for the
period ended 31 March 2013period ended 31 March 2013period ended 31 March 2013period ended 31 March 2013
The notes on pages 149 to 151 form part of these financial statements.
- 147 -
Statement of Financial PositionStatement of Financial PositionStatement of Financial PositionStatement of Financial Position
As at 31 March 2013As at 31 March 2013As at 31 March 2013As at 31 March 2013 (Unaudited)(Unaudited)(Unaudited)(Unaudited)
31.3.201331.3.201331.3.201331.3.2013 30.9.201230.9.201230.9.201230.9.2012
JPY'000JPY'000JPY'000JPY'000 JPY'000JPY'000JPY'000JPY'000
AssetsAssetsAssetsAssets
Cash at banks 51,972 52,673
Amounts due from brokers 136,696 37,658
Amounts receivable on allotment 81,275 2,338
Investments 4,473,026 2,830,209
Dividend and other accounts
receivable 44,643 27,956
Total assetsTotal assetsTotal assetsTotal assets 4,787,612 2,950,834
---------- ----------
LiabilitiesLiabilitiesLiabilitiesLiabilities
Amounts due to brokers 99,558 22,375
Amounts payable on redemption 16,694 5,398
Other accounts payable 6,772 5,991
Total liabilitiesTotal liabilitiesTotal liabilitiesTotal liabilities 123,024 33,764
---------- ----------
Net assets attributable to holders Net assets attributable to holders Net assets attributable to holders Net assets attributable to holders
of redeemable units of redeemable units of redeemable units of redeemable units [Note 3] 4,664,588 2,917,070
EquityEquityEquityEquity 4,664,588 2,917,070
Statement of Comprehensive IncomeStatement of Comprehensive IncomeStatement of Comprehensive IncomeStatement of Comprehensive Income
For the period ended 31 March 2013For the period ended 31 March 2013For the period ended 31 March 2013For the period ended 31 March 2013 (Unaudited)(Unaudited)(Unaudited)(Unaudited)
1.10.20121.10.20121.10.20121.10.2012
totototo
31.3.201331.3.201331.3.201331.3.2013
1.10.20111.10.20111.10.20111.10.2011
totototo
31.3.201231.3.201231.3.201231.3.2012
JPY'000JPY'000JPY'000JPY'000 JPY'000JPY'000JPY'000JPY'000
IncomeIncomeIncomeIncome
Net gains on investments and
derivatives [Note 4] 1,488,155 124,655
Dividend income 41,478 35,379
Net foreign currency exchange
(losses)/gains (91) 143
1,529,542 160,177
---------- ----------
ExpensesExpensesExpensesExpenses
Management fee 28,951 29,281
Transaction costs 3,079 2,477
Registrar's fee 1,079 877
Trustee's fee 955 1,329
Valuation fee 686 640
Auditor's fee 437 475
Safe custody and bank charges 303 367
Printing and publication expenses 101 44
Legal and professional expenses - 3
Other operating expenses 42 52
35,633 35,545
---------- ----------
Net operating profitNet operating profitNet operating profitNet operating profit 1,493,909 124,632
Finance costsFinance costsFinance costsFinance costs
Interest paid (10) (1)
Profit Profit Profit Profit before taxationbefore taxationbefore taxationbefore taxation 1,493,899 124,631
Taxation (2,964) (2,477)
Increase in net assets Increase in net assets Increase in net assets Increase in net assets
attributable to holders of attributable to holders of attributable to holders of attributable to holders of
redeemable units and total redeemable units and total redeemable units and total redeemable units and total
comprehensive incomecomprehensive incomecomprehensive incomecomprehensive income 1,490,935 122,154
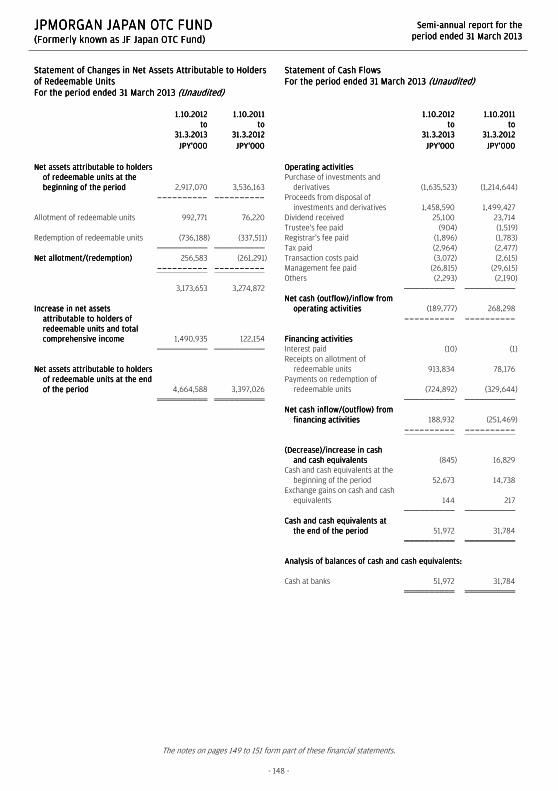
JPMORGAN JAPAN OTC FUNDJPMORGAN JAPAN OTC FUNDJPMORGAN JAPAN OTC FUNDJPMORGAN JAPAN OTC FUND (Formerly known as JF (Formerly known as JF (Formerly known as JF (Formerly known as JF Japan OTCJapan OTCJapan OTCJapan OTC Fund)Fund)Fund)Fund)
SemiSemiSemiSemi----annual report for theannual report for theannual report for theannual report for the
period ended 31 March 2013period ended 31 March 2013period ended 31 March 2013period ended 31 March 2013
The notes on pages 149 to 151 form part of these financial statements.
- 148 -
Statement of Changes inStatement of Changes inStatement of Changes inStatement of Changes in Net Assets Attributable to Holders Net Assets Attributable to Holders Net Assets Attributable to Holders Net Assets Attributable to Holders
of Redeemable Unitsof Redeemable Unitsof Redeemable Unitsof Redeemable Units
For the period ended 31 March 2013For the period ended 31 March 2013For the period ended 31 March 2013For the period ended 31 March 2013 (Unaudited)(Unaudited)(Unaudited)(Unaudited)
1.10.20121.10.20121.10.20121.10.2012
totototo
31.3.201331.3.201331.3.201331.3.2013
1.10.20111.10.20111.10.20111.10.2011
totototo
31.3.201231.3.201231.3.201231.3.2012
JPY'000JPY'000JPY'000JPY'000 JPY'000JPY'000JPY'000JPY'000
Net assets attributable to holders Net assets attributable to holders Net assets attributable to holders Net assets attributable to holders
of redeemable units at the of redeemable units at the of redeemable units at the of redeemable units at the
beginning of the beginning of the beginning of the beginning of the periodperiodperiodperiod 2,917,070 3,536,163
---------- ----------
Allotment of redeemable units 992,771 76,220
Redemption of redeemable units (736,188) (337,511)
Net allotment/(redemption)Net allotment/(redemption)Net allotment/(redemption)Net allotment/(redemption) 256,583 (261,291)
---------- ----------
3,173,653 3,274,872
Increase in net assets Increase in net assets Increase in net assets Increase in net assets
attributable to holders of attributable to holders of attributable to holders of attributable to holders of
redeemable units and total redeemable units and total redeemable units and total redeemable units and total
comprehensive incomecomprehensive incomecomprehensive incomecomprehensive income 1,490,935 122,154
Net assets attributable to holders Net assets attributable to holders Net assets attributable to holders Net assets attributable to holders
of redeemable units at the end of redeemable units at the end of redeemable units at the end of redeemable units at the end
of the periodof the periodof the periodof the period 4,664,588 3,397,026
Statement of Cash FlowsStatement of Cash FlowsStatement of Cash FlowsStatement of Cash Flows
For the period ended 31 March 2013For the period ended 31 March 2013For the period ended 31 March 2013For the period ended 31 March 2013 (Unaudited)(Unaudited)(Unaudited)(Unaudited)
1.10.20121.10.20121.10.20121.10.2012
totototo
31.3.201331.3.201331.3.201331.3.2013
1.10.20111.10.20111.10.20111.10.2011
totototo
31.3.201231.3.201231.3.201231.3.2012
JPY'000JPY'000JPY'000JPY'000 JPY'000JPY'000JPY'000JPY'000
Operating activitiesOperating activitiesOperating activitiesOperating activities
Purchase of investments and
derivatives (1,635,523) (1,214,644)
Proceeds from disposal of
investments and derivatives 1,458,590 1,499,427
Dividend received 25,100 23,714
Trustee's fee paid (904) (1,519)
Registrar's fee paid (1,896) (1,783)
Tax paid (2,964) (2,477)
Transaction costs paid (3,072) (2,615)
Management fee paid (26,815) (29,615)
Others (2,293) (2,190)
Net cash (outflow)/inflow from Net cash (outflow)/inflow from Net cash (outflow)/inflow from Net cash (outflow)/inflow from
operating activitiesoperating activitiesoperating activitiesoperating activities (189,777) 268,298
---------- ----------
Financing activitiesFinancing activitiesFinancing activitiesFinancing activities
Interest paid (10) (1)
Receipts on allotment of
redeemable units 913,834 78,176
Payments on redemption of
redeemable units (724,892) (329,644)
Net cash inflow/(outflow) from Net cash inflow/(outflow) from Net cash inflow/(outflow) from Net cash inflow/(outflow) from
financing activitiesfinancing activitiesfinancing activitiesfinancing activities 188,932 (251,469)
---------- ----------
(Decrease)/increase in cash (Decrease)/increase in cash (Decrease)/increase in cash (Decrease)/increase in cash
and cash equivalentsand cash equivalentsand cash equivalentsand cash equivalents (845) 16,829
Cash and cash equivalents at the
beginning of the period 52,673 14,738
Exchange gains on cash and cash
equivalents 144 217
Cash and cash equivalents at Cash and cash equivalents at Cash and cash equivalents at Cash and cash equivalents at
the end of the the end of the the end of the the end of the periodperiodperiodperiod 51,972 31,784
Analysis of balances of cash and cash equivalents:Analysis of balances of cash and cash equivalents:Analysis of balances of cash and cash equivalents:Analysis of balances of cash and cash equivalents:
Cash at banks 51,972 31,784
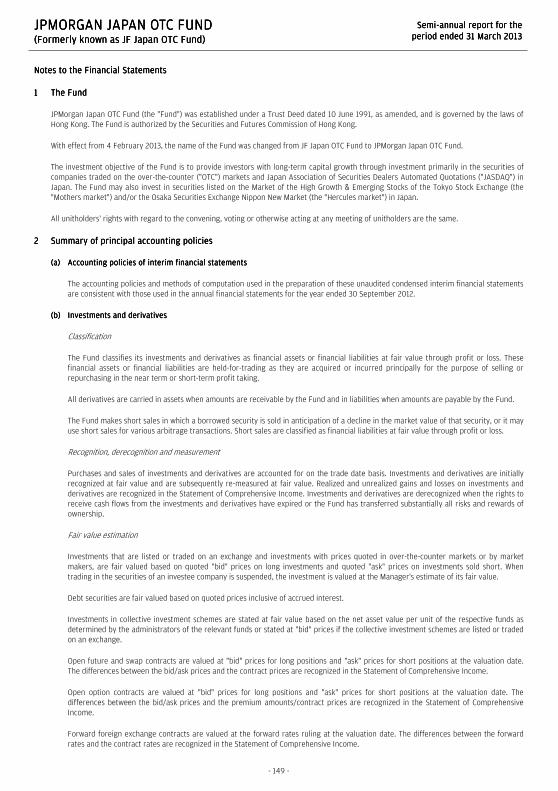
JPMORGAN JAPAN OTC FUNDJPMORGAN JAPAN OTC FUNDJPMORGAN JAPAN OTC FUNDJPMORGAN JAPAN OTC FUND (Formerly known as JF (Formerly known as JF (Formerly known as JF (Formerly known as JF Japan OTCJapan OTCJapan OTCJapan OTC Fund)Fund)Fund)Fund)
SemiSemiSemiSemi----annual report for theannual report for theannual report for theannual report for the
period ended 31 March 2013period ended 31 March 2013period ended 31 March 2013period ended 31 March 2013
- 149 -
Notes to the Financial StatementsNotes to the Financial StatementsNotes to the Financial StatementsNotes to the Financial Statements
1111 The FundThe FundThe FundThe Fund
JPMorgan Japan OTC Fund (the "Fund") was established under a Trust Deed dated 10 June 1991, as amended, and is governed by the laws of
Hong Kong. The Fund is authorized by the Securities and Futures Commission of Hong Kong.
With effect from 4 February 2013, the name of the Fund was changed from JF Japan OTC Fund to JPMorgan Japan OTC Fund.
The investment objective of the Fund is to provide investors with long-term capital growth through investment primarily in the securities of
companies traded on the over-the-counter ("OTC") markets and Japan Association of Securities Dealers Automated Quotations ("JASDAQ") in
Japan. The Fund may also invest in securities listed on the Market of the High Growth & Emerging Stocks of the Tokyo Stock Exchange (the
"Mothers market") and/or the Osaka Securities Exchange Nippon New Market (the "Hercules market") in Japan.
All unitholders' rights with regard to the convening, voting or otherwise acting at any meeting of unitholders are the same.
2222 Summary of principal accounting policiesSummary of principal accounting policiesSummary of principal accounting policiesSummary of principal accounting policies
(a)(a)(a)(a) Accounting policies of interim financAccounting policies of interim financAccounting policies of interim financAccounting policies of interim financial statementsial statementsial statementsial statements
The accounting policies and methods of computation used in the preparation of these unaudited condensed interim financial statements
are consistent with those used in the annual financial statements for the year ended 30 September 2012.
(b)(b)(b)(b) InveInveInveInvestments and derivatives stments and derivatives stments and derivatives stments and derivatives
Classification
The Fund classifies its investments and derivatives as financial assets or financial liabilities at fair value through profit or loss. These
financial assets or financial liabilities are held-for-trading as they are acquired or incurred principally for the purpose of selling or
repurchasing in the near term or short-term profit taking.
All derivatives are carried in assets when amounts are receivable by the Fund and in liabilities when amounts are payable by the Fund.
The Fund makes short sales in which a borrowed security is sold in anticipation of a decline in the market value of that security, or it may
use short sales for various arbitrage transactions. Short sales are classified as financial liabilities at fair value through profit or loss.
Recognition, derecognition and measurement
Purchases and sales of investments and derivatives are accounted for on the trade date basis. Investments and derivatives are initially
recognized at fair value and are subsequently re-measured at fair value. Realized and unrealized gains and losses on investments and
derivatives are recognized in the Statement of Comprehensive Income. Investments and derivatives are derecognized when the rights to
receive cash flows from the investments and derivatives have expired or the Fund has transferred substantially all risks and rewards of
ownership.
Fair value estimation
Investments that are listed or traded on an exchange and investments with prices quoted in over-the-counter markets or by market
makers, are fair valued based on quoted "bid" prices on long investments and quoted "ask" prices on investments sold short. When
trading in the securities of an investee company is suspended, the investment is valued at the Manager's estimate of its fair value.
Debt securities are fair valued based on quoted prices inclusive of accrued interest.
Investments in collective investment schemes are stated at fair value based on the net asset value per unit of the respective funds as
determined by the administrators of the relevant funds or stated at "bid" prices if the collective investment schemes are listed or traded
on an exchange.
Open future and swap contracts are valued at "bid" prices for long positions and "ask" prices for short positions at the valuation date.
The differences between the bid/ask prices and the contract prices are recognized in the Statement of Comprehensive Income.
Open option contracts are valued at "bid" prices for long positions and "ask" prices for short positions at the valuation date. The
differences between the bid/ask prices and the premium amounts/contract prices are recognized in the Statement of Comprehensive
Income.
Forward foreign exchange contracts are valued at the forward rates ruling at the valuation date. The differences between the forward
rates and the contract rates are recognized in the Statement of Comprehensive Income.

JPMORGAN JAPAN OTC FUNDJPMORGAN JAPAN OTC FUNDJPMORGAN JAPAN OTC FUNDJPMORGAN JAPAN OTC FUND (Formerly known as JF (Formerly known as JF (Formerly known as JF (Formerly known as JF Japan OTCJapan OTCJapan OTCJapan OTC Fund)Fund)Fund)Fund)
SemiSemiSemiSemi----annual report for theannual report for theannual report for theannual report for the
period ended 31 March 2013period ended 31 March 2013period ended 31 March 2013period ended 31 March 2013
- 150 -
(c)(c)(c)(c) Securities borrowing Securities borrowing Securities borrowing Securities borrowing
The Fund may enter into securities borrowing arrangements for short sale purposes. Short positions represent obligations to deliver
securities sold but not yet purchased, and are accounted for as investments and valued at their fair value. Securities borrowed during the
period/year are off-balance sheet transactions and are therefore not included in the investment portfolio of the Fund. Collateral placed
for the purpose of securities borrowed generally consist of cash collateral and are included in the Statement of Financial Position
separately.
(d)(d)(d)(d) Foreign currency translationForeign currency translationForeign currency translationForeign currency translation
Functional and presentation currency
The Fund has adopted Japanese Yen as its functional and presentation currency.
Transactions and balances
Foreign currency transactions are translated into the functional currency using the exchange rates prevailing at the dates of the
transactions.
Foreign exchange gains and losses resulting from the settlement of such transactions and from the translation of assets and liabilities
denominated in foreign currencies at period/year end exchange rates are recognized in the Statement of Comprehensive Income.
Foreign exchange gains and losses relating to cash and cash equivalents are presented in the Statement of Comprehensive Income
within "Net foreign currency exchange gains/losses". Foreign exchange gains and losses relating to the financial assets and liabilities
carried at fair value through profit or loss are presented in the Statement of Comprehensive Income within "Net gains/losses on
investments and derivatives".
(e)(e)(e)(e) Proceeds and payments on allotment and redemption of unitsProceeds and payments on allotment and redemption of unitsProceeds and payments on allotment and redemption of unitsProceeds and payments on allotment and redemption of units
The net asset value per unit is computed for each dealing day. The price at which units are allotted or redeemed is calculated by
reference to the net asset value per unit as at the close of business on the relevant dealing day in accordance with the provisions of the
Fund's Trust Deed dated 10 June 1991, as amended, which may be different from the accounting policies stated in the financial
statements.
3333 Number of units in issue and net assets attributable to holders of redeemable units (per unit)Number of units in issue and net assets attributable to holders of redeemable units (per unit)Number of units in issue and net assets attributable to holders of redeemable units (per unit)Number of units in issue and net assets attributable to holders of redeemable units (per unit)
31.3.2013 30.9.2012
Units Units
Number of units in issue 4,738,019.985 4,510,092.336
JPY'000 JPY'000
Net assets attributable to holders of redeemable units 4,664,588 2,917,070
Net assets attributable to holders of redeemable units (per unit) 0.985 0.647

JPMORGAN JAPAN OTC FUNDJPMORGAN JAPAN OTC FUNDJPMORGAN JAPAN OTC FUNDJPMORGAN JAPAN OTC FUND (Formerly known as JF (Formerly known as JF (Formerly known as JF (Formerly known as JF Japan OTCJapan OTCJapan OTCJapan OTC Fund)Fund)Fund)Fund)
SemiSemiSemiSemi----annual report for theannual report for theannual report for theannual report for the
period ended 31 March 2013period ended 31 March 2013period ended 31 March 2013period ended 31 March 2013
- 151 -
4444 Net gains on investments and derivatives Net gains on investments and derivatives Net gains on investments and derivatives Net gains on investments and derivatives
1.10.2012
to
31.3.2013
1.10.2011
to
31.3.2012
JPY'000 JPY'000
Change in unrealized gains/losses in value of investments and derivatives 1,051,050 419,608
Realized gains/(losses) on sale of investments and derivatives 437,105 (294,953)
1,488,155 124,655
5555 Soft commission arrangementsSoft commission arrangementsSoft commission arrangementsSoft commission arrangements
The Investment Manager has entered into soft commission arrangements with brokers under which certain goods and services used to
support investment decision making are received by the Investment Manager. The Investment Manager does not make direct payment for
these services but transacts an agreed amount of business with the brokers on behalf of the Fund. Commission is paid from the Fund on these
transactions.
The goods and services must be of demonstrable benefit to the Fund and may include research and advisory services; economic and political
analysis; portfolio analysis, including valuation and performance measurement; market analysis, data and quotation services, computer
hardware and software incidental to the above goods and services; clearing and custodian services and investment-related publications.
6666 Distribution Distribution Distribution Distribution
No distribution was made during the period (31 March 2012: nil).

JPMORGAN JAPAN SMALLER COMPANY (YEN) FUNDJPMORGAN JAPAN SMALLER COMPANY (YEN) FUNDJPMORGAN JAPAN SMALLER COMPANY (YEN) FUNDJPMORGAN JAPAN SMALLER COMPANY (YEN) FUND (Formerly known as JF Japan Smaller Company (Yen) (Formerly known as JF Japan Smaller Company (Yen) (Formerly known as JF Japan Smaller Company (Yen) (Formerly known as JF Japan Smaller Company (Yen) Fund)Fund)Fund)Fund)
SemiSemiSemiSemi----annual report for theannual report for theannual report for theannual report for the
period ended 31 March 2013period ended 31 March 2013period ended 31 March 2013period ended 31 March 2013
- 152 -
Distributor StatusDistributor StatusDistributor StatusDistributor Status
The Fund has been certified by HMRC in the UK as a
distributing fund in respect of the period from 1 January
1984 to 30 September 2010. The principal effect of this
certification is that for unitholders resident or ordinarily
resident in the UK for taxation purposes any gains accruing
on the sale, redemption or other disposal of units during
the period will be taxed in the UK as a capital gain and not
as income. This treatment will continue under the new UK
reporting fund regime provided the Fund does not invest
more than 5% of its assets in other offshore funds which
are not themselves reporting funds. There will be no need
to formally apply for reporting fund status as the Fund is
transparent for UK tax purposes and therefore considered
out of scope of the requirements of this new regime.
As noted, the Fund is transparent for UK income tax
purposes and UK investors are subject to UK capital gains
tax on disposal of their units. UK investors are subject to tax
on their share of income of the Fund on an arising basis.
Information has been provided to UK investors of the
amount of their share of the underlying income, expenses
and overseas tax suffered.
Investment PortfolioInvestment PortfolioInvestment PortfolioInvestment Portfolio
As at 31 March 2013As at 31 March 2013As at 31 March 2013As at 31 March 2013 (Unaudited)(Unaudited)(Unaudited)(Unaudited)
HoldingHoldingHoldingHolding
FairFairFairFair
valuevaluevaluevalue
JPY'000JPY'000JPY'000JPY'000
% of% of% of% of
netnetnetnet
assetsassetsassetsassets
Listed/Quoted InvestmentsListed/Quoted InvestmentsListed/Quoted InvestmentsListed/Quoted Investments (109.8%)
EquitiesEquitiesEquitiesEquities (109.8%)
JapanJapanJapanJapan (109.8%)
BanksBanksBanksBanks (5.7%)
Seven Bank 293,300 88,870 1.1
Shinsei Bank 655,000 138,205 1.8
Suruga Bank 148,000 224,664 2.8
ChemicalsChemicalsChemicalsChemicals (4.6%)
Daicel Corp 106,000 79,076 1.0
FP Corp 13,800 84,594 1.1
Kansai Paint Co 100,000 104,400 1.3
Unicharm Corp 16,500 91,575 1.2
ConstructionConstructionConstructionConstruction (3.0%)
Nippo Corp 55,000 62,810 0.8
Obayashi Corp 149,000 66,752 0.9
SHO-BOND Hldgs 28,700 97,867 1.2
Tama Home 6,100 9,376 0.1
Electric AppliancesElectric AppliancesElectric AppliancesElectric Appliances (6.9%)
Anritsu Corp 93,000 134,943 1.7
Enplas Corp 15,800 71,179 0.9
Sysmex Corp 33,000 190,410 2.4
Toshiba Tec 138,000 76,590 1.0
Yokogawa Electric 79,500 74,968 0.9
FoodsFoodsFoodsFoods (1.0%)
Toyo Suisan Kaisha 28,000 80,388 1.0
(Continued)
HoldingHoldingHoldingHolding
FairFairFairFair
valuevaluevaluevalue
JPY'000JPY'000JPY'000JPY'000
% of% of% of% of
netnetnetnet
assetsassetsassetsassets
Glass & Ceramics ProductsGlass & Ceramics ProductsGlass & Ceramics ProductsGlass & Ceramics Products (1.0%)
Taiheiyo Cement 352,000 77,440 1.0
Information & CommunicationInformation & CommunicationInformation & CommunicationInformation & Communication (8.0%)
Avex Group Hldgs 18,100 47,114 0.6
Broadleaf Co 13,900 20,600 0.3
Digital Garage 235 71,558 0.9
GMO Payment Gateway 40,000 87,800 1.1
Gree Inc 35,500 41,180 0.5
Itochu Techno-Solutions 35,200 165,792 2.1
Konami Corp 46,800 88,405 1.1
Net One Systems 76,400 62,724 0.8
Poletowin Pitcrew Hldgs 25,800 44,299 0.6
InsuranceInsuranceInsuranceInsurance (1.5%)
Anicom Hldgs 87,100 90,584 1.1
Lifenet Insurance 38,100 31,432 0.4
Iron & SteelIron & SteelIron & SteelIron & Steel (1.1%)
Yamato Kogyo 32,700 90,154 1.1
MachineryMachineryMachineryMachinery (9.6%)
Daikin Industries 21,400 78,645 1.0
Disco Corp 28,500 151,050 1.9
Glory Ltd 35,800 80,693 1.0
Kubota Corp 80,000 106,960 1.4
Makita Corp 39,000 166,725 2.1
Nabtesco Corp 48,000 92,688 1.2
THK Co 43,500 78,996 1.0
Metal ProductsMetal ProductsMetal ProductsMetal Products (3.0%)
LIXIL Group 34,900 64,809 0.8
Rinnai Corp 14,000 94,500 1.2
Sumco Corp 69,600 75,794 1.0
Non Ferrous MetalsNon Ferrous MetalsNon Ferrous MetalsNon Ferrous Metals (0.9%)
Sumitomo Electric Industries 60,300 69,948 0.9
Other Financing BusinessOther Financing BusinessOther Financing BusinessOther Financing Business (6.4%)
Mitsubishi UFJ Lease &
Finance Co 448,100 222,258 2.8
Orix Corp 237,000 282,031 3.6
Other ProductsOther ProductsOther ProductsOther Products (1.3%)
Fuji Seal Intl 42,400 99,258 1.3
PharmaceuticalsPharmaceuticalsPharmaceuticalsPharmaceuticals (2.8%)
3-D Matrix 11,100 80,808 1.0
Medrx Co 8,200 28,823 0.4
Nippon Shinyaku 57,000 76,152 1.0
Sosei Group 11,000 35,915 0.4
Precision InstrumentsPrecision InstrumentsPrecision InstrumentsPrecision Instruments (2.8%)
Asahi Intecc 28,700 148,379 1.9
Nikkiso Co 60,000 68,820 0.9
Real EstateReal EstateReal EstateReal Estate (12.4%)
Arealink Co 4,646 53,661 0.7
GLP J-REIT 937 91,826 1.2

JPMORGAN JAPAN SMALLER COMPANY (YEN) FUNDJPMORGAN JAPAN SMALLER COMPANY (YEN) FUNDJPMORGAN JAPAN SMALLER COMPANY (YEN) FUNDJPMORGAN JAPAN SMALLER COMPANY (YEN) FUND (Formerly known as JF Japan Smaller Company (Yen) (Formerly known as JF Japan Smaller Company (Yen) (Formerly known as JF Japan Smaller Company (Yen) (Formerly known as JF Japan Smaller Company (Yen) Fund)Fund)Fund)Fund)
SemiSemiSemiSemi----annual report for theannual report for theannual report for theannual report for the
period ended 31 March 2013period ended 31 March 2013period ended 31 March 2013period ended 31 March 2013
- 153 -
Investment PortfolioInvestment PortfolioInvestment PortfolioInvestment Portfolio (Continued)
As at 31 March 2013As at 31 March 2013As at 31 March 2013As at 31 March 2013 (Unaudited)(Unaudited)(Unaudited)(Unaudited)
HoldingHoldingHoldingHolding
FairFairFairFair
valuevaluevaluevalue
JPY'000JPY'000JPY'000JPY'000
% of% of% of% of
netnetnetnet
assetsassetsassetsassets
Real EstateReal EstateReal EstateReal Estate (Continued)
Hulic Co 146,200 112,720 1.4
Industrial & Infrastructure
Fund 135 140,535 1.8
Leopalace21 Corp 295,000 117,115 1.5
Nippon Prologis REIT 72 71,280 0.9
Sumitomo Realty &
Development 82,000 294,791 3.7
Tokyo Tatemono 142,000 93,436 1.2
Retail TradeRetail TradeRetail TradeRetail Trade (9.8%)
Asahi Co 42,500 55,038 0.7
Cosmos Pharmaceutical 8,000 97,920 1.2
Don Quijote 43,100 179,296 2.3
Jin Co 34,000 173,400 2.2
Medical System Network 86,600 40,789 0.5
MonotaRO Co 31,600 143,148 1.8
Seria Co 35,300 82,673 1.1
SecuritiesSecuritiesSecuritiesSecurities (1.9%)
Kyokuto Securities 45,500 69,615 0.9
Marusan Securities 119,400 83,461 1.0
ServicesServicesServicesServices (12.3%)
Cookpad Inc 24,300 113,846 1.4
DeNA Co 30,000 76,110 1.0
H I S Co 21,500 91,912 1.2
JP-Holdings Inc 47,400 100,393 1.3
Kakaku.com Inc 44,800 103,712 1.3
M3 Inc 1,050 190,050 2.4
Nihon M&A Center 25,600 106,112 1.3
Rakuten Inc 114,500 109,576 1.4
Sohgo Security Services 57,700 79,164 1.0
Transportation EquipmentTransportation EquipmentTransportation EquipmentTransportation Equipment (9.2%)
Daido Metal Co 60,000 45,480 0.6
Daihatsu Motor 72,000 140,184 1.8
Isuzu Motors 141,000 78,255 1.0
Musashi Seimitsu Industry 61,100 128,004 1.6
Nissin Kogyo 50,000 77,500 1.0
Shimano Inc 10,000 79,500 1.0
ShinMaywa Industries 125,000 92,250 1.2
Suzuki Motor 39,000 82,290 1.0
Wholesale TradeWholesale TradeWholesale TradeWholesale Trade (4.6%)
Daiichikosho Co 39,400 99,406 1.3
Misumi Group 44,700 115,907 1.5
Sanrio Co 34,900 146,056 1.8
Total Listed/Quoted InvestmentsTotal Listed/Quoted InvestmentsTotal Listed/Quoted InvestmentsTotal Listed/Quoted Investments 8,655,412 109.8
Other net liabilitiesOther net liabilitiesOther net liabilitiesOther net liabilities (773,416) (9.8)
Net assets attributable to holders of Net assets attributable to holders of Net assets attributable to holders of Net assets attributable to holders of
redeemable units at 31 March 2013redeemable units at 31 March 2013redeemable units at 31 March 2013redeemable units at 31 March 2013 7,881,996 100.0
Total investments, at costTotal investments, at costTotal investments, at costTotal investments, at cost 6,010,225
Statement of Movements in Portfolio HoldingsStatement of Movements in Portfolio HoldingsStatement of Movements in Portfolio HoldingsStatement of Movements in Portfolio Holdings
For the period ended 31 March For the period ended 31 March For the period ended 31 March For the period ended 31 March 2013201320132013 (Unaudited)(Unaudited)(Unaudited)(Unaudited)
% holdings% holdings% holdings% holdings
of net assetsof net assetsof net assetsof net assets
31.3.201331.3.201331.3.201331.3.2013 30.9.201230.9.201230.9.201230.9.2012
Listed/Quoted InvestmentsListed/Quoted InvestmentsListed/Quoted InvestmentsListed/Quoted Investments
EquitiesEquitiesEquitiesEquities
JapanJapanJapanJapan
Real Estate 12.4 5.2
Services 12.3 18.1
Retail Trade 9.8 10.9
Machinery 9.6 7.5
Transportation Equipment 9.2 7.6
Information & Communication 8.0 8.2
Electric Appliances 6.9 6.3
Other Financing Business 6.4 7.2
Banks 5.7 3.5
Wholesale Trade 4.6 7.1
Chemicals 4.6 6.4
Construction 3.0 3.9
Metal Products 3.0 2.5
Pharmaceuticals 2.8 1.0
Precision Instruments 2.8 2.2
Securities 1.9 -
Insurance 1.5 0.7
Other Products 1.3 2.8
Iron & Steel 1.1 1.3
Foods 1.0 1.8
Glass & Ceramics Products 1.0 -
Non Ferrous Metals 0.9 0.9
Land Transportation - 1.8
Air Transportation - 0.3
Total Listed/Quoted Total Listed/Quoted Total Listed/Quoted Total Listed/Quoted InvestmentsInvestmentsInvestmentsInvestments 109.8 107.2
Other net liabilitiesOther net liabilitiesOther net liabilitiesOther net liabilities (9.8) (7.2)
Net assets attributable to holders of Net assets attributable to holders of Net assets attributable to holders of Net assets attributable to holders of
redeemable unitsredeemable unitsredeemable unitsredeemable units 100.0 100.0

JPMORGAN JAPAN SMALLER COMPANY (YEN) FUNDJPMORGAN JAPAN SMALLER COMPANY (YEN) FUNDJPMORGAN JAPAN SMALLER COMPANY (YEN) FUNDJPMORGAN JAPAN SMALLER COMPANY (YEN) FUND (Formerly known as JF Japan Smaller Company (Yen) (Formerly known as JF Japan Smaller Company (Yen) (Formerly known as JF Japan Smaller Company (Yen) (Formerly known as JF Japan Smaller Company (Yen) Fund)Fund)Fund)Fund)
SemiSemiSemiSemi----annual report for theannual report for theannual report for theannual report for the
period ended 31 March 2013period ended 31 March 2013period ended 31 March 2013period ended 31 March 2013
The notes on pages 156 to 158 form part of these financial statements.
- 154 -
Statement of Financial PositionStatement of Financial PositionStatement of Financial PositionStatement of Financial Position
As at 31 March 2013As at 31 March 2013As at 31 March 2013As at 31 March 2013 (Unaudited)(Unaudited)(Unaudited)(Unaudited)
31.3.201331.3.201331.3.201331.3.2013 30.9.201230.9.201230.9.201230.9.2012
JPY'000JPY'000JPY'000JPY'000 JPY'000JPY'000JPY'000JPY'000
AssetsAssetsAssetsAssets
Cash at banks 43,792 21,284
Amounts due from brokers - 3,771
Amounts receivable on allotment 32,732 3,910
Investments 8,655,412 6,161,060
Dividend and other accounts
receivable 62,750 57,013
Total assetsTotal assetsTotal assetsTotal assets 8,794,686 6,247,038
---------- ----------
LiabilitiesLiabilitiesLiabilitiesLiabilities
Short term bank loans - unsecured 836,605 480,344
Amounts due to brokers 40,521 -
Amounts payable on redemption 26,208 10,501
Other accounts payable 9,356 9,084
Total liabilitiesTotal liabilitiesTotal liabilitiesTotal liabilities 912,690 499,929
---------- ----------
Net assets attributable to holders Net assets attributable to holders Net assets attributable to holders Net assets attributable to holders
of redeemable units of redeemable units of redeemable units of redeemable units [Note 3] 7,881,996 5,747,109
EquityEquityEquityEquity 7,881,996 5,747,109
Statement of Statement of Statement of Statement of Comprehensive IncomeComprehensive IncomeComprehensive IncomeComprehensive Income
For the period ended 31 March 2013For the period ended 31 March 2013For the period ended 31 March 2013For the period ended 31 March 2013 (Unaudited)(Unaudited)(Unaudited)(Unaudited)
1.10.20121.10.20121.10.20121.10.2012
totototo
31.3.201331.3.201331.3.201331.3.2013
1.10.20111.10.20111.10.20111.10.2011
totototo
31.3.201231.3.201231.3.201231.3.2012
JPY'000JPY'000JPY'000JPY'000 JPY'000JPY'000JPY'000JPY'000
IncomeIncomeIncomeIncome
Net gains/(losses) on investments
and derivatives [Note 4] 2,470,001 (54,325)
Dividend income 56,028 70,376
Net foreign currency exchange
gains 85 30
2,526,114 16,081
---------- ----------
ExpensesExpensesExpensesExpenses
Management fee 46,651 49,906
Transaction costs 3,086 4,322
Registrar's fee 1,441 1,249
Trustee's fee 560 599
Auditor's fee 509 548
Safe custody and bank charges 460 523
Printing and publication expenses 180 143
Legal and professional expenses - 6
Other operating expenses 20 22
52,907 57,318
---------- ----------
Net operating profit/(loss)Net operating profit/(loss)Net operating profit/(loss)Net operating profit/(loss) 2,473,207 (41,237)
Finance costsFinance costsFinance costsFinance costs
Interest paid (2,281) (923)
Profit/(loss) before taxationProfit/(loss) before taxationProfit/(loss) before taxationProfit/(loss) before taxation 2,470,926 (42,160)
Taxation (3,998) (4,926)
Increase/(decrease) in net Increase/(decrease) in net Increase/(decrease) in net Increase/(decrease) in net
assets attributable to holdersassets attributable to holders assets attributable to holdersassets attributable to holders
of redeemable units and of redeemable units and of redeemable units and of redeemable units and
total comprehensive incometotal comprehensive incometotal comprehensive incometotal comprehensive income 2,466,928 (47,086)
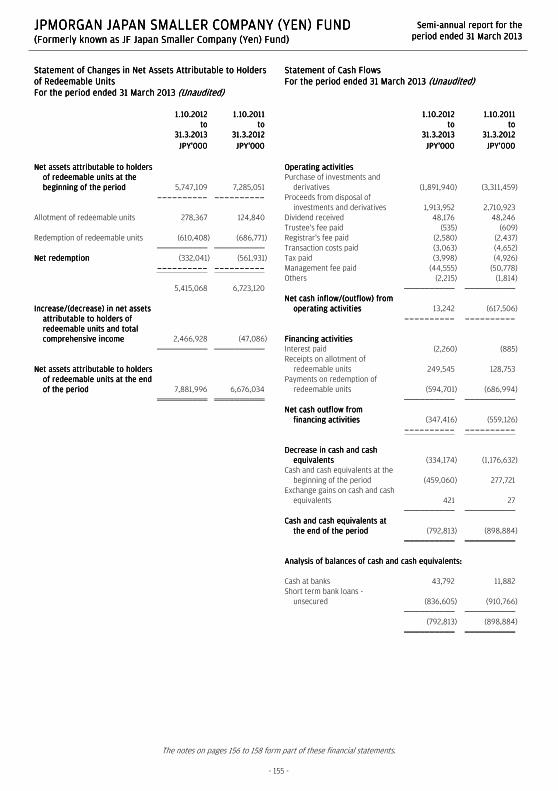
JPMORGAN JAPAN SMALLER COMPANY (YEN) FUNDJPMORGAN JAPAN SMALLER COMPANY (YEN) FUNDJPMORGAN JAPAN SMALLER COMPANY (YEN) FUNDJPMORGAN JAPAN SMALLER COMPANY (YEN) FUND (Formerly known as JF Japan Smaller Company (Yen) (Formerly known as JF Japan Smaller Company (Yen) (Formerly known as JF Japan Smaller Company (Yen) (Formerly known as JF Japan Smaller Company (Yen) Fund)Fund)Fund)Fund)
SemiSemiSemiSemi----annual report for theannual report for theannual report for theannual report for the
period ended 31 March 2013period ended 31 March 2013period ended 31 March 2013period ended 31 March 2013
The notes on pages 156 to 158 form part of these financial statements.
- 155 -
Statement of Changes in Net Assets Attributable to Holders Statement of Changes in Net Assets Attributable to Holders Statement of Changes in Net Assets Attributable to Holders Statement of Changes in Net Assets Attributable to Holders
of Redeemable Unitsof Redeemable Unitsof Redeemable Unitsof Redeemable Units
For the period ended For the period ended For the period ended For the period ended 31 March 201331 March 201331 March 201331 March 2013 (Unaudited)(Unaudited)(Unaudited)(Unaudited)
1.10.20121.10.20121.10.20121.10.2012
totototo
31.3.201331.3.201331.3.201331.3.2013
1.10.20111.10.20111.10.20111.10.2011
totototo
31.3.201231.3.201231.3.201231.3.2012
JPY'000JPY'000JPY'000JPY'000 JPY'000JPY'000JPY'000JPY'000
Net assets attributable to holders Net assets attributable to holders Net assets attributable to holders Net assets attributable to holders
of redeemable units at the of redeemable units at the of redeemable units at the of redeemable units at the
beginning of the periodbeginning of the periodbeginning of the periodbeginning of the period 5,747,109 7,285,051
---------- ----------
Allotment of redeemable units 278,367 124,840
Redemption of redeemable units (610,408) (686,771)
Net redemptionNet redemptionNet redemptionNet redemption (332,041) (561,931)
---------- ----------
5,415,068 6,723,120
Increase/(decrease) in net assets Increase/(decrease) in net assets Increase/(decrease) in net assets Increase/(decrease) in net assets
attributable to holders of attributable to holders of attributable to holders of attributable to holders of
redeemable units and total redeemable units and total redeemable units and total redeemable units and total
comprehensive incomecomprehensive incomecomprehensive incomecomprehensive income 2,466,928 (47,086)
Net assets attributable to holders Net assets attributable to holders Net assets attributable to holders Net assets attributable to holders
of redeemable units at the end of redeemable units at the end of redeemable units at the end of redeemable units at the end
of the periodof the periodof the periodof the period 7,881,996 6,676,034
Statement of Cash FlowsStatement of Cash FlowsStatement of Cash FlowsStatement of Cash Flows
For the period ended 31 March 2013For the period ended 31 March 2013For the period ended 31 March 2013For the period ended 31 March 2013 (Unaudited)(Unaudited)(Unaudited)(Unaudited)
1.10.20121.10.20121.10.20121.10.2012
totototo
31.3.201331.3.201331.3.201331.3.2013
1.10.20111.10.20111.10.20111.10.2011
totototo
31.3.201231.3.201231.3.201231.3.2012
JPY'000JPY'000JPY'000JPY'000 JPY'000JPY'000JPY'000JPY'000
Operating activitiesOperating activitiesOperating activitiesOperating activities
Purchase of investments and
derivatives (1,891,940) (3,311,459)
Proceeds from disposal of
investments and derivatives 1,913,952 2,710,923
Dividend received 48,176 48,246
Trustee's fee paid (535) (609)
Registrar's fee paid (2,580) (2,437)
Transaction costs paid (3,063) (4,652)
Tax paid (3,998) (4,926)
Management fee paid (44,555) (50,778)
Others (2,215) (1,814)
Net cash inflow/(outflow) from Net cash inflow/(outflow) from Net cash inflow/(outflow) from Net cash inflow/(outflow) from
operating activitiesoperating activitiesoperating activitiesoperating activities 13,242 (617,506)
---------- ----------
Financing activitiesFinancing activitiesFinancing activitiesFinancing activities
Interest paid (2,260) (885)
Receipts on allotment of
redeemable units 249,545 128,753
Payments on redemption of
redeemable units (594,701) (686,994)
Net cash outflow from Net cash outflow from Net cash outflow from Net cash outflow from
financing activitiesfinancing activitiesfinancing activitiesfinancing activities (347,416) (559,126)
---------- ----------
Decrease in cash and cash Decrease in cash and cash Decrease in cash and cash Decrease in cash and cash
equivalentsequivalentsequivalentsequivalents (334,174) (1,176,632)
Cash and cash equivalents at the
beginning of the period (459,060) 277,721
Exchange gains on cash and cash
equivalents 421 27
Cash and cash equivalents at Cash and cash equivalents at Cash and cash equivalents at Cash and cash equivalents at
the end of the periodthe end of the periodthe end of the periodthe end of the period (792,813) (898,884)
Analysis of balances of cash and cash equivalents:Analysis of balances of cash and cash equivalents:Analysis of balances of cash and cash equivalents:Analysis of balances of cash and cash equivalents:
Cash at banks 43,792 11,882
Short term bank loans -
unsecured (836,605) (910,766)
(792,813) (898,884)

JPMORGAN JAPAN SMALLER COMPANY (YEN) FUNDJPMORGAN JAPAN SMALLER COMPANY (YEN) FUNDJPMORGAN JAPAN SMALLER COMPANY (YEN) FUNDJPMORGAN JAPAN SMALLER COMPANY (YEN) FUND (Formerly known as JF Japan Smaller Company (Yen) Fund)(Formerly known as JF Japan Smaller Company (Yen) Fund)(Formerly known as JF Japan Smaller Company (Yen) Fund)(Formerly known as JF Japan Smaller Company (Yen) Fund)
SemiSemiSemiSemi----annual report for theannual report for theannual report for theannual report for the
period ended 31 March 2013period ended 31 March 2013period ended 31 March 2013period ended 31 March 2013
- 156 -
Notes to the Financial StatementsNotes to the Financial StatementsNotes to the Financial StatementsNotes to the Financial Statements
1111 The FundThe FundThe FundThe Fund
JPMorgan Japan Smaller Company (Yen) Fund (the "Fund") was established under a Trust Deed dated 5 June 1980, as amended, and is
governed by the laws of Hong Kong. The Fund is authorized by the Securities and Futures Commission of Hong Kong.
With effect from 4 February 2013, the name of the Fund was changed from JF Japan Smaller Company (Yen) Fund to JPMorgan Japan Smaller
Company (Yen) Fund.
The investment objective of the Fund is to provide investors with long-term capital growth through investment primarily in the shares of small
to medium sized Japanese companies.
All unitholders' rights with regard to the convening, voting or otherwise acting at any meeting of unitholders are the same.
2222 Summary of principal accounting policiesSummary of principal accounting policiesSummary of principal accounting policiesSummary of principal accounting policies
(a)(a)(a)(a) Accounting policies of interim financial statementsAccounting policies of interim financial statementsAccounting policies of interim financial statementsAccounting policies of interim financial statements
The accounting policies and methods of computation used in the preparation of these unaudited condensed interim financial statements
are consistent with those used in the annual financial statements for the year ended 30 September 2012.
(b)(b)(b)(b) Investments and derivatives Investments and derivatives Investments and derivatives Investments and derivatives
Classification
The Fund classifies its investments and derivatives as financial assets or financial liabilities at fair value through profit or loss. These
financial assets or financial liabilities are held-for-trading as they are acquired or incurred principally for the purpose of selling or
repurchasing in the near term or short-term profit taking.
All derivatives are carried in assets when amounts are receivable by the Fund and in liabilities when amounts are payable by the Fund.
The Fund makes short sales in which a borrowed security is sold in anticipation of a decline in the market value of that security, or it may
use short sales for various arbitrage transactions. Short sales are classified as financial liabilities at fair value through profit or loss.
Recognition, derecognition and measurement
Purchases and sales of investments and derivatives are accounted for on the trade date basis. Investments and derivatives are initially
recognized at fair value and are subsequently re-measured at fair value. Realized and unrealized gains and losses on investments and
derivatives are recognized in the Statement of Comprehensive Income. Investments and derivatives are derecognized when the rights to
receive cash flows from the investments and derivatives have expired or the Fund has transferred substantially all risks and rewards of
ownership.
Fair value estimation
Investments that are listed or traded on an exchange and investments with prices quoted in over-the-counter markets or by market
makers, are fair valued based on quoted "bid" prices on long investments and quoted "ask" prices on investments sold short. When
trading in the securities of an investee company is suspended, the investment is valued at the Manager's estimate of its fair value.
Debt securities are fair valued based on quoted prices inclusive of accrued interest.
Investments in collective investment schemes are stated at fair value based on the net asset value per unit of the respective funds as
determined by the administrators of the relevant funds or stated at "bid" prices if the collective investment schemes are listed or traded
on an exchange.
Open future and swap contracts are valued at "bid" prices for long positions and "ask" prices for short positions at the valuation date.
The differences between the bid/ask prices and the contract prices are recognized in the Statement of Comprehensive Income.
Open option contracts are valued at "bid" prices for long positions and "ask" prices for short positions at the valuation date. The
differences between the bid/ask prices and the premium amounts/contract prices are recognized in the Statement of Comprehensive
Income.
Forward foreign exchange contracts are valued at the forward rates ruling at the valuation date. The differences between the forward
rates and the contract rates are recognized in the Statement of Comprehensive Income.

JPMORGAN JAPAN SMALLER COMPANY (YEN) FUNDJPMORGAN JAPAN SMALLER COMPANY (YEN) FUNDJPMORGAN JAPAN SMALLER COMPANY (YEN) FUNDJPMORGAN JAPAN SMALLER COMPANY (YEN) FUND (Formerly known as JF Japan Smaller Company (Yen) Fund)(Formerly known as JF Japan Smaller Company (Yen) Fund)(Formerly known as JF Japan Smaller Company (Yen) Fund)(Formerly known as JF Japan Smaller Company (Yen) Fund)
SemiSemiSemiSemi----annual report for theannual report for theannual report for theannual report for the
period ended 31 March 2013period ended 31 March 2013period ended 31 March 2013period ended 31 March 2013
- 157 -
(c)(c)(c)(c) Securities borrowing Securities borrowing Securities borrowing Securities borrowing
The Fund may enter into securities borrowing arrangements for short sale purposes. Short positions represent obligations to deliver
securities sold but not yet purchased, and are accounted for as investments and valued at their fair value. Securities borrowed during the
period/year are off-balance sheet transactions and are therefore not included in the investment portfolio of the Fund. Collateral placed
for the purpose of securities borrowed generally consist of cash collateral and are included in the Statement of Financial Position
separately.
(d)(d)(d)(d) Foreign currency translationForeign currency translationForeign currency translationForeign currency translation
Functional and presentation currency
The Fund has adopted Japanese Yen as its functional and presentation currency.
Transactions and balances
Foreign currency transactions are translated into the functional currency using the exchange rates prevailing at the dates of the
transactions.
Foreign exchange gains and losses resulting from the settlement of such transactions and from the translation of assets and liabilities
denominated in foreign currencies at period/year end exchange rates are recognized in the Statement of Comprehensive Income.
Foreign exchange gains and losses relating to cash and cash equivalents are presented in the Statement of Comprehensive Income
within "Net foreign currency exchange gains/losses". Foreign exchange gains and losses relating to the financial assets and liabilities
carried at fair value through profit or loss are presented in the Statement of Comprehensive Income within "Net gains/losses on
investments and derivatives".
(e)(e)(e)(e) Proceeds and payments on allotment and redemption of unitsProceeds and payments on allotment and redemption of unitsProceeds and payments on allotment and redemption of unitsProceeds and payments on allotment and redemption of units
The net asset value per unit is computed for each dealing day. The price at which units are allotted or redeemed is calculated by
reference to the net asset value per unit as at the close of business on the relevant dealing day in accordance with the provisions of the
Fund's Trust Deed dated 5 June 1980, as amended, which may be different from the accounting policies stated in the financial statements.
3333 Number of units in issue and net assets attributable to holders of redeemable units (per unit)Number of units in issue and net assets attributable to holders of redeemable units (per unit)Number of units in issue and net assets attributable to holders of redeemable units (per unit)Number of units in issue and net assets attributable to holders of redeemable units (per unit)
31.3.2013 30.9.2012
Units Units
Number of units in issue 252,688.162 267,379.093
JPY'000 JPY'000
Net assets attributable to holders of redeemable units 7,881,996 5,747,109
Net assets attributable to holders of redeemable units (per unit) 31.193 21.494
4444 Net gains/(losses) on investments and derivatives Net gains/(losses) on investments and derivatives Net gains/(losses) on investments and derivatives Net gains/(losses) on investments and derivatives
1.10.2012
to
31.3.2013
1.10.2011
to
31.3.2012
JPY'000 JPY'000
Change in unrealized gains/losses in value of investments and derivatives 2,398,153 5,602
Realized gains/(losses) on sale of investments and derivatives 71,848 (59,927)
2,470,001 (54,325)

JPMORGAN JAPAN SMALLER COMPANY (YEN) FUNDJPMORGAN JAPAN SMALLER COMPANY (YEN) FUNDJPMORGAN JAPAN SMALLER COMPANY (YEN) FUNDJPMORGAN JAPAN SMALLER COMPANY (YEN) FUND (Formerly known as JF Japan Smaller Company (Yen) Fund)(Formerly known as JF Japan Smaller Company (Yen) Fund)(Formerly known as JF Japan Smaller Company (Yen) Fund)(Formerly known as JF Japan Smaller Company (Yen) Fund)
SemiSemiSemiSemi----annual report for theannual report for theannual report for theannual report for the
period ended 31 March 2013period ended 31 March 2013period ended 31 March 2013period ended 31 March 2013
- 158 -
5555 Soft commission arrangementsSoft commission arrangementsSoft commission arrangementsSoft commission arrangements
The Investment Manager has entered into soft commission arrangements with brokers under which certain goods and services used to
support investment decision making are received by the Investment Manager. The Investment Manager does not make direct payment for
these services but transacts an agreed amount of business with the brokers on behalf of the Fund. Commission is paid from the Fund on these
transactions.
The goods and services must be of demonstrable benefit to the Fund and may include research and advisory services; economic and political
analysis; portfolio analysis, including valuation and performance measurement; market analysis, data and quotation services, computer
hardware and software incidental to the above goods and services; clearing and custodian services and investment-related publications.
6666 Distribution Distribution Distribution Distribution
No distribution was made during the period (31 March 2012: nil).

JPMORGAN JAPAN TECHNOLOGY FUNDJPMORGAN JAPAN TECHNOLOGY FUNDJPMORGAN JAPAN TECHNOLOGY FUNDJPMORGAN JAPAN TECHNOLOGY FUND (Formerly known as JF Japan Technology Fund)(Formerly known as JF Japan Technology Fund)(Formerly known as JF Japan Technology Fund)(Formerly known as JF Japan Technology Fund)
SemiSemiSemiSemi----annual report for theannual report for theannual report for theannual report for the
period ended 31 March 2013period ended 31 March 2013period ended 31 March 2013period ended 31 March 2013
- 159 -
Distributor StatusDistributor StatusDistributor StatusDistributor Status
The Fund has been certified by HMRC in the UK as a
distributing fund in respect of the period from 1 January
1984 to 30 September 2010. The principal effect of this
certification is that for unitholders resident or ordinarily
resident in the UK for taxation purposes any gains accruing
on the sale, redemption or other disposal of units during
the period will be taxed in the UK as a capital gain and not
as income. This treatment will continue under the new UK
reporting fund regime provided the Fund does not invest
more than 5% of its assets in other offshore funds which
are not themselves reporting funds. There will be no need
to formally apply for reporting fund status as the Fund is
transparent for UK tax purposes and therefore considered
out of scope of the requirements of this new regime.
As noted, the Fund is transparent for UK income tax
purposes and UK investors are subject to UK capital gains
tax on disposal of their units. UK investors are subject to tax
on their share of income of the Fund on an arising basis.
Information has been provided to UK investors of the
amount of their share of the underlying income, expenses
and overseas tax suffered.
Investment PortfolioInvestment PortfolioInvestment PortfolioInvestment Portfolio
As at 31 March 2013As at 31 March 2013As at 31 March 2013As at 31 March 2013 (Unaudited)(Unaudited)(Unaudited)(Unaudited)
HoldingHoldingHoldingHolding
FairFairFairFair
valuevaluevaluevalue
JPY'000JPY'000JPY'000JPY'000
% % % % ofofofof
netnetnetnet
assetsassetsassetsassets
Listed/Quoted InvestmentsListed/Quoted InvestmentsListed/Quoted InvestmentsListed/Quoted Investments (97.7%)
EquitiesEquitiesEquitiesEquities (97.7%)
JapanJapanJapanJapan (97.7%)
Auto ComponentsAuto ComponentsAuto ComponentsAuto Components (2.0%)
Toyoda Gosei 43,000 93,697 2.0
BiotechnologyBiotechnologyBiotechnologyBiotechnology (1.9%)
3-D Matrix 12,300 89,544 1.9
ChemicalsChemicalsChemicalsChemicals (2.0%)
Nitto Denko 17,500 97,125 2.0
Computers & PeripheralsComputers & PeripheralsComputers & PeripheralsComputers & Peripherals (8.9%)
NEC Corp 193,000 47,092 1.0
Seiko Epson 91,200 83,266 1.8
Toshiba Corp 617,000 291,224 6.1
Electrical EquipmentElectrical EquipmentElectrical EquipmentElectrical Equipment (1.4%)
Endo Lighting 22,100 66,852 1.4
Electronic Equipment, Electronic Equipment, Electronic Equipment, Electronic Equipment, Instruments & ComponentsInstruments & ComponentsInstruments & ComponentsInstruments & Components (31.4%)
Anritsu Corp 98,000 142,198 3.0
Enplas Corp 17,100 77,036 1.6
FUJIFILM Hldgs 159,300 292,316 6.2
Hamamatsu Photonics 22,500 85,050 1.8
Hitachi High-Technologies 10,500 20,727 0.4
Hitachi Ltd 721,000 391,502 8.2
Ibiden Co 33,000 48,246 1.0
Keyence Corp 6,920 198,120 4.2
(Continued)
HoldingHoldingHoldingHolding
FairFairFairFair
valuevaluevaluevalue
JPY'000JPY'000JPY'000JPY'000
% of% of% of% of
netnetnetnet
assetsassetsassetsassets
Maruwa Co (5344) 6,700 17,695 0.4
Murata Mfg 27,700 193,900 4.1
Nippon Electric Glass 50,000 23,800 0.5
Health Care Health Care Health Care Health Care Equipment & SuppliesEquipment & SuppliesEquipment & SuppliesEquipment & Supplies (2.0%)
Olympus Corp 43,600 96,356 2.0
Household DurablesHousehold DurablesHousehold DurablesHousehold Durables (2.5%)
Sony Corp 72,800 119,246 2.5
Internet & Catalog RetailInternet & Catalog RetailInternet & Catalog RetailInternet & Catalog Retail (1.0%)
Rakuten Inc 50,600 48,424 1.0
Internet Software & ServicesInternet Software & ServicesInternet Software & ServicesInternet Software & Services (6.3%)
CROOZ Inc 360 57,780 1.2
DeNA Co 7,900 20,042 0.4
Gree Inc 28,000 32,480 0.7
Kakaku.com Inc 41,000 94,915 2.0
Yahoo Japan 2,126 91,843 2.0
IT ServicesIT ServicesIT ServicesIT Services (1.7%)
Itochu Techno-Solutions 16,700 78,657 1.7
Leisure Equipment & ProductsLeisure Equipment & ProductsLeisure Equipment & ProductsLeisure Equipment & Products (2.6%)
Namco Bandai Hldgs 40,900 67,894 1.4
Nikon Corp 24,500 54,635 1.2
MachineryMachineryMachineryMachinery (4.8%)
Fanuc Corp 3,900 56,433 1.2
Hitachi Zosen 557,000 85,778 1.8
SMC Corp 4,600 83,490 1.8
MediaMediaMediaMedia (1.4%)
Avex Group Hldgs 26,200 68,199 1.4
Office ElectronicsOffice ElectronicsOffice ElectronicsOffice Electronics (12.8%)
Canon Inc 103,400 351,559 7.4
Ricoh Co 197,000 197,197 4.2
Toshiba Tec 104,000 57,720 1.2
Semiconductors & Semiconductor EquipmentSemiconductors & Semiconductor EquipmentSemiconductors & Semiconductor EquipmentSemiconductors & Semiconductor Equipment (7.2%)
Disco Corp 9,300 49,290 1.0
NuFlare Technology 37 21,497 0.4
Rohm Co 35,500 121,942 2.6
Sumco Corp 116,600 126,977 2.7
Tokyo Electron 5,500 22,908 0.5
SoftwareSoftwareSoftwareSoftware (4.2%)
Gungho Online Entertainment 271 107,452 2.2
Nintendo Co 9,300 93,279 2.0
Wireless Telecommunication ServicesWireless Telecommunication ServicesWireless Telecommunication ServicesWireless Telecommunication Services (3.6%)
Softbank Corp 39,700 172,100 3.6
Total Listed/Quoted InvestmentsTotal Listed/Quoted InvestmentsTotal Listed/Quoted InvestmentsTotal Listed/Quoted Investments 4,637,483 97.7

JPMORGAN JAPAN TECHNOLOGY FUNDJPMORGAN JAPAN TECHNOLOGY FUNDJPMORGAN JAPAN TECHNOLOGY FUNDJPMORGAN JAPAN TECHNOLOGY FUND (Formerly known as JF Japan Technology Fund)(Formerly known as JF Japan Technology Fund)(Formerly known as JF Japan Technology Fund)(Formerly known as JF Japan Technology Fund)
SemiSemiSemiSemi----annual report for theannual report for theannual report for theannual report for the
period ended 31 March 2013period ended 31 March 2013period ended 31 March 2013period ended 31 March 2013
- 160 -
Investment PortfolioInvestment PortfolioInvestment PortfolioInvestment Portfolio (Continued)
As at 31 March 2013As at 31 March 2013As at 31 March 2013As at 31 March 2013 (Unaudited)(Unaudited)(Unaudited)(Unaudited)
FairFairFairFair
valuevaluevaluevalue
JPY'000JPY'000JPY'000JPY'000
% of% of% of% of
netnetnetnet
assetsassetsassetsassets
Other net assetsOther net assetsOther net assetsOther net assets 107,753 2.3
Net assets attributableNet assets attributableNet assets attributableNet assets attributable to holders of to holders of to holders of to holders of
redeemable units at 31 March 2013redeemable units at 31 March 2013redeemable units at 31 March 2013redeemable units at 31 March 2013 4,745,236 100.0
Total investments, at costTotal investments, at costTotal investments, at costTotal investments, at cost 3,568,274
Statement of Movements in Portfolio HoldingsStatement of Movements in Portfolio HoldingsStatement of Movements in Portfolio HoldingsStatement of Movements in Portfolio Holdings
For the period ended 31 March 2013For the period ended 31 March 2013For the period ended 31 March 2013For the period ended 31 March 2013 (Unaudited)(Unaudited)(Unaudited)(Unaudited)
% holdings% holdings% holdings% holdings
of of of of net assetsnet assetsnet assetsnet assets
31.3.201331.3.201331.3.201331.3.2013 30.9.201230.9.201230.9.201230.9.2012
Listed/Quoted InvestmentsListed/Quoted InvestmentsListed/Quoted InvestmentsListed/Quoted Investments
EquitiesEquitiesEquitiesEquities
JapanJapanJapanJapan
Electronic Equipment, Instruments &
Components 31.4 33.4
Office Electronics 12.8 8.3
Computers & Peripherals 8.9 -
Semiconductors & Semiconductor
Equipment 7.2 2.0
Internet Software & Services 6.3 11.5
Machinery 4.8 4.5
Software 4.2 8.3
Wireless Telecommunication Services 3.6 2.6
Leisure Equipment & Products 2.6 8.9
Household Durables 2.5 -
Chemicals 2.0 -
Health Care Equipment & Supplies 2.0 -
Auto Components 2.0 -
Biotechnology 1.9 -
IT Services 1.7 6.6
Media 1.4 2.2
Electrical Equipment 1.4 1.6
Internet & Catalog Retail 1.0 4.3
Total Listed/Quoted InvestmentsTotal Listed/Quoted InvestmentsTotal Listed/Quoted InvestmentsTotal Listed/Quoted Investments 97.7 94.2
Other net assetsOther net assetsOther net assetsOther net assets 2.3 5.8
NetNetNetNet assets attributable to holders of assets attributable to holders of assets attributable to holders of assets attributable to holders of
redeemable unitsredeemable unitsredeemable unitsredeemable units 100.0 100.0

JPMORGAN JAPAN TECHNOLOGY FUNDJPMORGAN JAPAN TECHNOLOGY FUNDJPMORGAN JAPAN TECHNOLOGY FUNDJPMORGAN JAPAN TECHNOLOGY FUND (Formerly known as JF Japan Technology Fund)(Formerly known as JF Japan Technology Fund)(Formerly known as JF Japan Technology Fund)(Formerly known as JF Japan Technology Fund)
SemiSemiSemiSemi----annual report for theannual report for theannual report for theannual report for the
period ended 31 March 2013period ended 31 March 2013period ended 31 March 2013period ended 31 March 2013
The notes on pages 163 to 165 form part of these financial statements.
- 161 -
Statement of Financial PositionStatement of Financial PositionStatement of Financial PositionStatement of Financial Position
As at 31 March 2013As at 31 March 2013As at 31 March 2013As at 31 March 2013 (Unaudited)(Unaudited)(Unaudited)(Unaudited)
31.3.201331.3.201331.3.201331.3.2013 30.9.201230.9.201230.9.201230.9.2012
JPY'000JPY'000JPY'000JPY'000 JPY'000JPY'000JPY'000JPY'000
AssetsAssetsAssetsAssets
Cash at banks 49,668 137,627
Amounts due from brokers 36,893 93,078
Amounts receivable on allotment 2,663 2,574
Investments 4,637,483 3,615,624
Dividend and other accounts
receivable 38,175 34,011
Total assetsTotal assetsTotal assetsTotal assets 4,764,882 3,882,914
---------- ----------
LiabilitiesLiabilitiesLiabilitiesLiabilities
Amounts due to brokers 6,545 28,715
Amounts payable on redemption 6,979 8,089
Other accounts payable 6,122 6,613
Total liabilitiesTotal liabilitiesTotal liabilitiesTotal liabilities 19,646 43,417
---------- ----------
Net assets attributable to holders Net assets attributable to holders Net assets attributable to holders Net assets attributable to holders
of redeemable units of redeemable units of redeemable units of redeemable units [Note 3] 4,745,236 3,839,497
EquityEquityEquityEquity 4,745,236 3,839,497
Statement of Comprehensive IncomeStatement of Comprehensive IncomeStatement of Comprehensive IncomeStatement of Comprehensive Income
For the period ended 31 March 2013For the period ended 31 March 2013For the period ended 31 March 2013For the period ended 31 March 2013 (Unaudited)(Unaudited)(Unaudited)(Unaudited)
1.10.20121.10.20121.10.20121.10.2012
totototo
31.3.201331.3.201331.3.201331.3.2013
1.10.20111.10.20111.10.20111.10.2011
totototo
31.3.201231.3.201231.3.201231.3.2012
JPY'000JPY'000JPY'000JPY'000 JPY'000JPY'000JPY'000JPY'000
IncomeIncomeIncomeIncome
Net gains on investments and
derivatives [Note 4] 1,127,126 448,651
Dividend income 36,321 36,854
Net foreign currency exchange
gains 301 265
Other income - 39
1,163,748 485,809
---------- ----------
ExpensesExpensesExpensesExpenses
Management fee 30,312 34,546
Transaction costs 3,930 5,547
Trustee's fee 1,106 1,669
Registrar's fee 1,036 872
Valuation fee 686 640
Auditor's fee 489 525
Safe custody and bank charges 349 419
Printing and publication expenses 42 108
Legal and professional expenses - 4
Other operating expenses 70 11
38,020 44,341
---------- ----------
Net operating profitNet operating profitNet operating profitNet operating profit 1,125,728 441,468
Finance costsFinance costsFinance costsFinance costs
Interest paid (1) (1)
Profit before taxationProfit before taxationProfit before taxationProfit before taxation 1,125,727 441,467
Taxation (2,596) (2,580)
Increase in net assets Increase in net assets Increase in net assets Increase in net assets
attributable to holders of attributable to holders of attributable to holders of attributable to holders of
redeemable units and total redeemable units and total redeemable units and total redeemable units and total
comprehensive incomecomprehensive incomecomprehensive incomecomprehensive income 1,123,131 438,887

JPMORGAN JAPAN TECHNOLOGY FUNDJPMORGAN JAPAN TECHNOLOGY FUNDJPMORGAN JAPAN TECHNOLOGY FUNDJPMORGAN JAPAN TECHNOLOGY FUND (Formerly known as JF Japan Technology Fund)(Formerly known as JF Japan Technology Fund)(Formerly known as JF Japan Technology Fund)(Formerly known as JF Japan Technology Fund)
SemiSemiSemiSemi----annual report for theannual report for theannual report for theannual report for the
period ended 31 March 2013period ended 31 March 2013period ended 31 March 2013period ended 31 March 2013
The notes on pages 163 to 165 form part of these financial statements.
- 162 -
Statement of Statement of Statement of Statement of Changes in Net Assets Attributable to Holders Changes in Net Assets Attributable to Holders Changes in Net Assets Attributable to Holders Changes in Net Assets Attributable to Holders
of Redeemable Unitsof Redeemable Unitsof Redeemable Unitsof Redeemable Units
For the period ended 31 March 2013For the period ended 31 March 2013For the period ended 31 March 2013For the period ended 31 March 2013 (Unaudited)(Unaudited)(Unaudited)(Unaudited)
1.10.20121.10.20121.10.20121.10.2012
totototo
31.3.201331.3.201331.3.201331.3.2013
1.10.20111.10.20111.10.20111.10.2011
totototo
31.3.201231.3.201231.3.201231.3.2012
JPY'000JPY'000JPY'000JPY'000 JPY'000JPY'000JPY'000JPY'000
Net assets attributable to holders Net assets attributable to holders Net assets attributable to holders Net assets attributable to holders
of redeemable units at the of redeemable units at the of redeemable units at the of redeemable units at the
beginning beginning beginning beginning of the periodof the periodof the periodof the period 3,839,497 4,706,648
---------- ----------
Allotment of redeemable units 67,150 63,190
Redemption of redeemable units (284,542) (320,307)
Net redemptionNet redemptionNet redemptionNet redemption (217,392) (257,117)
---------- ----------
3,622,105 4,449,531
Increase in net assets Increase in net assets Increase in net assets Increase in net assets
attributable to holders of attributable to holders of attributable to holders of attributable to holders of
redeemable units and total redeemable units and total redeemable units and total redeemable units and total
comprehensive incomecomprehensive incomecomprehensive incomecomprehensive income 1,123,131 438,887
Net assets attributable to holders Net assets attributable to holders Net assets attributable to holders Net assets attributable to holders
of redeemable units at the end of redeemable units at the end of redeemable units at the end of redeemable units at the end
of the periodof the periodof the periodof the period 4,745,236 4,888,418
Statement of Cash FlowsStatement of Cash FlowsStatement of Cash FlowsStatement of Cash Flows
For the period ended 31 March 2013For the period ended 31 March 2013For the period ended 31 March 2013For the period ended 31 March 2013 (Unaudited)(Unaudited)(Unaudited)(Unaudited)
1.10.20121.10.20121.10.20121.10.2012
totototo
31.3.201331.3.201331.3.201331.3.2013
1.10.20111.10.20111.10.20111.10.2011
totototo
31.3.201231.3.201231.3.201231.3.2012
JPY'000JPY'000JPY'000JPY'000 JPY'000JPY'000JPY'000JPY'000
Operating activitiesOperating activitiesOperating activitiesOperating activities
Purchase of investments and
derivatives (3,243,813) (4,880,002)
Proceeds from disposal of
investments and derivatives 3,384,969 4,540,237
Dividend received 30,323 26,712
Trustee's fee paid (1,084) (1,886)
Registrar's fee paid (1,796) (1,663)
Tax paid (2,596) (2,580)
Transaction costs paid (3,984) (5,570)
Management fee paid (29,483) (34,464)
Others (2,322) (2,162)
Net cash inflow/(outflow) from Net cash inflow/(outflow) from Net cash inflow/(outflow) from Net cash inflow/(outflow) from
operating activitiesoperating activitiesoperating activitiesoperating activities 130,214 (361,378)
---------- ----------
Financing activitiesFinancing activitiesFinancing activitiesFinancing activities
Interest paid (1) (1)
Receipts on allotment of
redeemable units 67,061 65,340
Payments on redemption of
redeemable units (285,652) (316,024)
Net cash outflow from Net cash outflow from Net cash outflow from Net cash outflow from
financing activitiesfinancing activitiesfinancing activitiesfinancing activities (218,592) (250,685)
---------- ----------
Decrease in cash Decrease in cash Decrease in cash Decrease in cash and cash and cash and cash and cash
equivalentsequivalentsequivalentsequivalents (88,378) (612,063)
Cash and cash equivalents at the
beginning of the period 137,627 684,491
Exchange gains on cash and cash
equivalents 419 179
Cash and cash equivalents at Cash and cash equivalents at Cash and cash equivalents at Cash and cash equivalents at
the end of the periodthe end of the periodthe end of the periodthe end of the period 49,668 72,607
Analysis of balances of cash and cash equivalents:Analysis of balances of cash and cash equivalents:Analysis of balances of cash and cash equivalents:Analysis of balances of cash and cash equivalents:
Cash at banks 49,668 72,607

JPMORGAN JAPAN TECHNOLOGY FUNDJPMORGAN JAPAN TECHNOLOGY FUNDJPMORGAN JAPAN TECHNOLOGY FUNDJPMORGAN JAPAN TECHNOLOGY FUND (Formerly known as JF Japan Technology Fund)(Formerly known as JF Japan Technology Fund)(Formerly known as JF Japan Technology Fund)(Formerly known as JF Japan Technology Fund)
SemiSemiSemiSemi----annual report for theannual report for theannual report for theannual report for the
period ended 31 March 2013period ended 31 March 2013period ended 31 March 2013period ended 31 March 2013
- 163 -
Notes to the Financial StatementsNotes to the Financial StatementsNotes to the Financial StatementsNotes to the Financial Statements
1111 The FundThe FundThe FundThe Fund
JPMorgan Japan Technology Fund (the "Fund") was established under a Trust Deed dated 5 March 1981, as amended, and is governed by the
laws of Hong Kong. The Fund is authorized by the Securities and Futures Commission of Hong Kong.
With effect from 4 February 2013, the name of the Fund was changed from JF Japan Technology Fund to JPMorgan Japan Technology Fund.
The investment objective of the Fund is to provide investors with long-term capital growth through a portfolio primarily of shares in Japanese
companies involved in technology industries.
All unitholders' rights with regard to the convening, voting or otherwise acting at any meeting of unitholders are the same.
2222 Summary of principaSummary of principaSummary of principaSummary of principal accounting policiesl accounting policiesl accounting policiesl accounting policies
(a)(a)(a)(a) Accounting policies of interim financial statementsAccounting policies of interim financial statementsAccounting policies of interim financial statementsAccounting policies of interim financial statements
The accounting policies and methods of computation used in the preparation of these unaudited condensed interim financial statements
are consistent with those used in the annual financial statements for the year ended 30 September 2012.
(b)(b)(b)(b) Investments and derivativesInvestments and derivativesInvestments and derivativesInvestments and derivatives
Classification
The Fund classifies its investments and derivatives as financial assets or financial liabilities at fair value through profit or loss. These
financial assets or financial liabilities are held-for-trading as they are acquired or incurred principally for the purpose of selling or
repurchasing in the near term or short-term profit taking.
All derivatives are carried in assets when amounts are receivable by the Fund and in liabilities when amounts are payable by the Fund.
The Fund makes short sales in which a borrowed security is sold in anticipation of a decline in the market value of that security, or it may
use short sales for various arbitrage transactions. Short sales are classified as financial liabilities at fair value through profit or loss.
Recognition, derecognition and measurement
Purchases and sales of investments and derivatives are accounted for on the trade date basis. Investments and derivatives are initially
recognized at fair value and are subsequently re-measured at fair value. Realized and unrealized gains and losses on investments and
derivatives are recognized in the Statement of Comprehensive Income. Investments and derivatives are derecognized when the rights to
receive cash flows from the investments and derivatives have expired or the Fund has transferred substantially all risks and rewards of
ownership.
Fair value estimation
Investments that are listed or traded on an exchange and investments with prices quoted in over-the-counter markets or by market
makers, are fair valued based on quoted "bid" prices on long investments and quoted "ask" prices on investments sold short. When
trading in the securities of an investee company is suspended, the investment is valued at the Manager's estimate of its fair value.
Debt securities are fair valued based on quoted prices inclusive of accrued interest.
Investments in collective investment schemes are stated at fair value based on the net asset value per unit of the respective funds as
determined by the administrators of the relevant funds or stated at "bid" prices if the collective investment schemes are listed or traded
on an exchange.
Open future and swap contracts are valued at "bid" prices for long positions and "ask" prices for short positions at the valuation date.
The differences between the bid/ask prices and the contract prices are recognized in the Statement of Comprehensive Income.
Open option contracts are valued at "bid" prices for long positions and "ask" prices for short positions at the valuation date. The
differences between the bid/ask prices and the premium amounts/contract prices are recognized in the Statement of Comprehensive
Income.

JPMORGAN JAPAN TECHNOLOGY FUNDJPMORGAN JAPAN TECHNOLOGY FUNDJPMORGAN JAPAN TECHNOLOGY FUNDJPMORGAN JAPAN TECHNOLOGY FUND (Formerly known as JF Japan Technology Fund)(Formerly known as JF Japan Technology Fund)(Formerly known as JF Japan Technology Fund)(Formerly known as JF Japan Technology Fund)
SemiSemiSemiSemi----annual report for theannual report for theannual report for theannual report for the
period ended 31 March 2013period ended 31 March 2013period ended 31 March 2013period ended 31 March 2013
- 164 -
Forward foreign exchange contracts are valued at the forward rates ruling at the valuation date. The differences between the forward
rates and the contract rates are recognized in the Statement of Comprehensive Income.
(c)(c)(c)(c) Securities borrowingSecurities borrowingSecurities borrowingSecurities borrowing
The Fund may enter into securities borrowing arrangements for short sale purposes. Short positions represent obligations to deliver
securities sold but not yet purchased, and are accounted for as investments and valued at their fair value. Securities borrowed during the
period/year are off-balance sheet transactions and are therefore not included in the investment portfolio of the Fund. Collateral placed
for the purpose of securities borrowed generally consist of cash collateral and are included in the Statement of Financial Position
separately.
(d)(d)(d)(d) Foreign currency translForeign currency translForeign currency translForeign currency translationationationation
Functional and presentation currency
The Fund has adopted Japanese Yen as its functional and presentation currency.
Transactions and balances
Foreign currency transactions are translated into the functional currency using the exchange rates prevailing at the dates of the
transactions.
Foreign exchange gains and losses resulting from the settlement of such transactions and from the translation of assets and liabilities
denominated in foreign currencies at period/year end exchange rates are recognized in the Statement of Comprehensive Income.
Foreign exchange gains and losses relating to cash and cash equivalents are presented in the Statement of Comprehensive Income
within "Net foreign currency exchange gains/losses". Foreign exchange gains and losses relating to the financial assets and liabilities
carried at fair value through profit or loss are presented in the Statement of Comprehensive Income within "Net gains/losses on
investments and derivatives".
(e)(e)(e)(e) Proceeds and payments on allotment and redemptionProceeds and payments on allotment and redemptionProceeds and payments on allotment and redemptionProceeds and payments on allotment and redemption of unitsof unitsof unitsof units
The net asset value per unit is computed for each dealing day. The price at which units are allotted or redeemed is calculated by
reference to the net asset value per unit as at the close of business on the relevant dealing day in accordance with the provisions of the
Fund's Trust Deed dated 5 March 1981, as amended, which may be different from the accounting policies stated in the financial
statements.
3333 Number of units in issue and net assets attributable to holders of redeemable units (per unit)Number of units in issue and net assets attributable to holders of redeemable units (per unit)Number of units in issue and net assets attributable to holders of redeemable units (per unit)Number of units in issue and net assets attributable to holders of redeemable units (per unit)
31.3.2013 30.9.2012
Units Units
Number of units in issue 135,999.041 143,642.008
JPY'000 JPY'000
Net assets attributable to holders of redeemable units 4,745,236 3,839,497
Net assets attributable to holders of redeemable units (per unit) 34.892 26.730

JPMORGAN JAPAN TECHNOLOGY FUNDJPMORGAN JAPAN TECHNOLOGY FUNDJPMORGAN JAPAN TECHNOLOGY FUNDJPMORGAN JAPAN TECHNOLOGY FUND (Formerly known as JF Japan Technology Fund)(Formerly known as JF Japan Technology Fund)(Formerly known as JF Japan Technology Fund)(Formerly known as JF Japan Technology Fund)
SemiSemiSemiSemi----annual report for theannual report for theannual report for theannual report for the
period ended 31 March 2013period ended 31 March 2013period ended 31 March 2013period ended 31 March 2013
- 165 -
4444 Net gains on investments and derivatives Net gains on investments and derivatives Net gains on investments and derivatives Net gains on investments and derivatives
1.10.2012
to
31.3.2013
1.10.2011
to
31.3.2012
JPY'000 JPY'000
Change in unrealized gains/losses in value of investments and derivatives 1,037,103 623,678
Realized gains/(losses) on sale of investments and derivatives 90,023 (175,027)
1,127,126 448,651
5555 Soft commission Soft commission Soft commission Soft commission arrangementsarrangementsarrangementsarrangements
The Investment Manager has entered into soft commission arrangements with brokers under which certain goods and services used to
support investment decision making are received by the Investment Manager. The Investment Manager does not make direct payment for
these services but transacts an agreed amount of business with the brokers on behalf of the Fund. Commission is paid from the Fund on these
transactions.
The goods and services must be of demonstrable benefit to the Fund and may include research and advisory services; economic and political
analysis; portfolio analysis, including valuation and performance measurement; market analysis, data and quotation services, computer
hardware and software incidental to the above goods and services; clearing and custodian services and investment-related publications.
6666 Distribution Distribution Distribution Distribution
No distribution was made during the period (31 March 2012: nil).
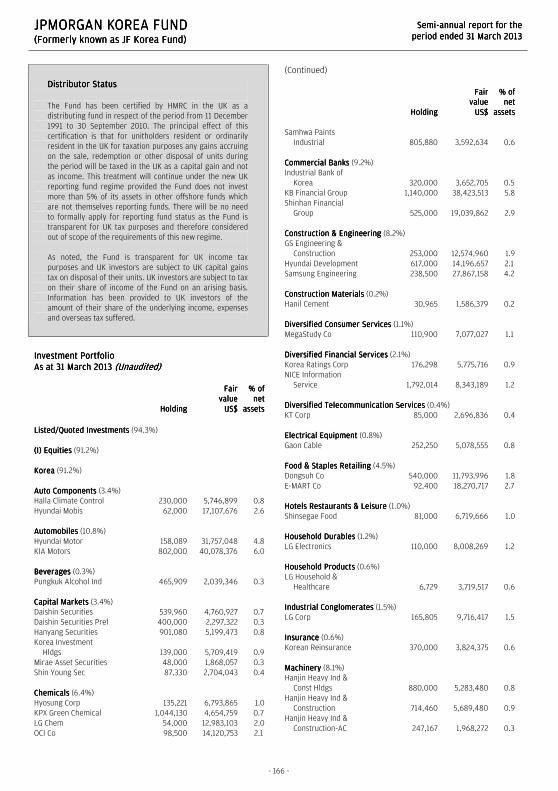
JPMORGAN KOREA FUNDJPMORGAN KOREA FUNDJPMORGAN KOREA FUNDJPMORGAN KOREA FUND (Formerly known as JF Korea Fund)(Formerly known as JF Korea Fund)(Formerly known as JF Korea Fund)(Formerly known as JF Korea Fund)
SemiSemiSemiSemi----annual report for theannual report for theannual report for theannual report for the
period ended 31 March 2013period ended 31 March 2013period ended 31 March 2013period ended 31 March 2013
- 166 -
Distributor StatusDistributor StatusDistributor StatusDistributor Status
The Fund has been certified by HMRC in the UK as a
distributing fund in respect of the period from 11 December
1991 to 30 September 2010. The principal effect of this
certification is that for unitholders resident or ordinarily
resident in the UK for taxation purposes any gains accruing
on the sale, redemption or other disposal of units during
the period will be taxed in the UK as a capital gain and not
as income. This treatment will continue under the new UK
reporting fund regime provided the Fund does not invest
more than 5% of its assets in other offshore funds which
are not themselves reporting funds. There will be no need
to formally apply for reporting fund status as the Fund is
transparent for UK tax purposes and therefore considered
out of scope of the requirements of this new regime.
As noted, the Fund is transparent for UK income tax
purposes and UK investors are subject to UK capital gains
tax on disposal of their units. UK investors are subject to tax
on their share of income of the Fund on an arising basis.
Information has been provided to UK investors of the
amount of their share of the underlying income, expenses
and overseas tax suffered.
Investment PortfolioInvestment PortfolioInvestment PortfolioInvestment Portfolio
As at 31 March 2013As at 31 March 2013As at 31 March 2013As at 31 March 2013 (Unaudited)(Unaudited)(Unaudited)(Unaudited)
HoldingHoldingHoldingHolding
FairFairFairFair
valuevaluevaluevalue
US$US$US$US$
% of% of% of% of
netnetnetnet
assetsassetsassetsassets
Listed/Quoted InvestmentsListed/Quoted InvestmentsListed/Quoted InvestmentsListed/Quoted Investments (94.3%)
(I) Equities(I) Equities(I) Equities(I) Equities (91.2%)
KoreaKoreaKoreaKorea (91.2%)
Auto ComponentsAuto ComponentsAuto ComponentsAuto Components (3.4%)
Halla Climate Control 230,000 5,746,899 0.8
Hyundai Mobis 62,000 17,107,676 2.6
AutomobilesAutomobilesAutomobilesAutomobiles (10.8%)
Hyundai Motor 158,089 31,757,048 4.8
KIA Motors 802,000 40,078,376 6.0
BeveragesBeveragesBeveragesBeverages (0.3%)
Pungkuk Alcohol Ind 465,909 2,039,346 0.3
Capital MarketsCapital MarketsCapital MarketsCapital Markets (3.4%)
Daishin Securities 539,960 4,760,927 0.7
Daishin Securities Pref 400,000 2,297,322 0.3
Hanyang Securities 901,080 5,199,473 0.8
Korea Investment
Hldgs 139,000 5,709,419 0.9
Mirae Asset Securities 48,000 1,868,057 0.3
Shin Young Sec 87,330 2,704,043 0.4
ChemicalsChemicalsChemicalsChemicals (6.4%)
Hyosung Corp 135,221 6,793,865 1.0
KPX Green Chemical 1,044,130 4,654,759 0.7
LG Chem 54,000 12,983,103 2.0
OCI Co 98,500 14,120,753 2.1
(Continued)
HoldingHoldingHoldingHolding
FairFairFairFair
valuevaluevaluevalue
US$US$US$US$
% of% of% of% of
netnetnetnet
assetsassetsassetsassets
Samhwa Paints
Industrial 805,880 3,592,634 0.6
Commercial BanksCommercial BanksCommercial BanksCommercial Banks (9.2%)
Industrial Bank of
Korea 320,000 3,652,705 0.5
KB Financial Group 1,140,000 38,423,513 5.8
Shinhan Financial
Group 525,000 19,039,862 2.9
Construction & EngineeringConstruction & EngineeringConstruction & EngineeringConstruction & Engineering (8.2%)
GS Engineering &
Construction 253,000 12,574,960 1.9
Hyundai Development 617,000 14,196,657 2.1
Samsung Engineering 238,500 27,867,158 4.2
Construction MaterialsConstruction MaterialsConstruction MaterialsConstruction Materials (0.2%)
Hanil Cement 30,965 1,586,379 0.2
Diversified Consumer ServicesDiversified Consumer ServicesDiversified Consumer ServicesDiversified Consumer Services (1.1%)
MegaStudy Co 110,900 7,077,027 1.1
Diversified Financial ServicesDiversified Financial ServicesDiversified Financial ServicesDiversified Financial Services (2.1%)
Korea Ratings Corp 176,298 5,775,716 0.9
NICE Information
Service 1,792,014 8,343,189 1.2
Diversified Telecommunication ServicesDiversified Telecommunication ServicesDiversified Telecommunication ServicesDiversified Telecommunication Services (0.4%)
KT Corp 85,000 2,696,836 0.4
Electrical EquipmentElectrical EquipmentElectrical EquipmentElectrical Equipment (0.8%)
Gaon Cable 252,250 5,078,555 0.8
Food & Staples RetailingFood & Staples RetailingFood & Staples RetailingFood & Staples Retailing (4.5%)
Dongsuh Co 540,000 11,793,996 1.8
E-MART Co 92,400 18,270,717 2.7
Hotels Restaurants & LeisureHotels Restaurants & LeisureHotels Restaurants & LeisureHotels Restaurants & Leisure (1.0%)
Shinsegae Food 81,000 6,719,666 1.0
Household DurablesHousehold DurablesHousehold DurablesHousehold Durables (1.2%)
LG Electronics 110,000 8,008,269 1.2
Household ProductsHousehold ProductsHousehold ProductsHousehold Products (0.6%)
LG Household &
Healthcare 6,729 3,719,517 0.6
Industrial ConglomeratesIndustrial ConglomeratesIndustrial ConglomeratesIndustrial Conglomerates (1.5%)
LG Corp 165,805 9,716,417 1.5
InsuranceInsuranceInsuranceInsurance (0.6%)
Korean Reinsurance 370,000 3,824,375 0.6
MachineryMachineryMachineryMachinery (8.1%)
Hanjin Heavy Ind &
Const Hldgs 880,000 5,283,480 0.8
Hanjin Heavy Ind &
Construction 714,460 5,689,480 0.9
Hanjin Heavy Ind &
Construction-AC 247,167 1,968,272 0.3
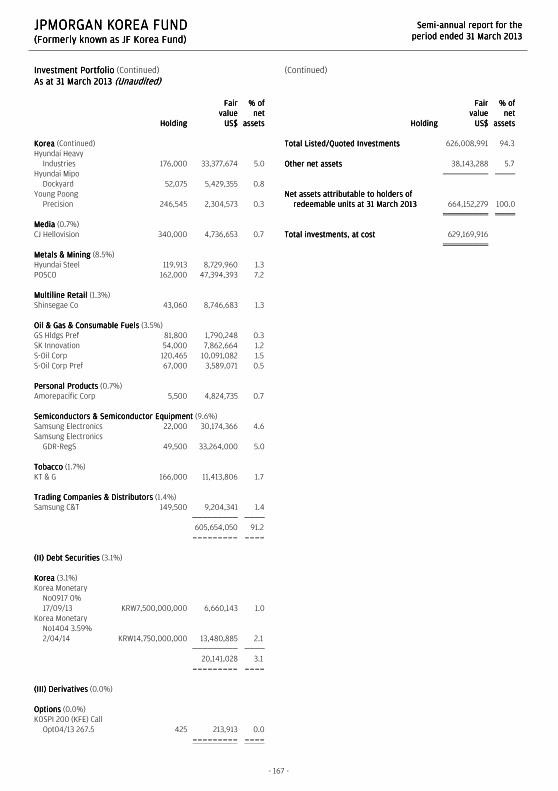
JPMORGAN KOREA FUNDJPMORGAN KOREA FUNDJPMORGAN KOREA FUNDJPMORGAN KOREA FUND (Formerly known as JF Korea Fund)(Formerly known as JF Korea Fund)(Formerly known as JF Korea Fund)(Formerly known as JF Korea Fund)
SemiSemiSemiSemi----annual report for theannual report for theannual report for theannual report for the
period ended 31 March 2013period ended 31 March 2013period ended 31 March 2013period ended 31 March 2013
- 167 -
Investment PortfolioInvestment PortfolioInvestment PortfolioInvestment Portfolio (Continued)
As at 31 March 2013As at 31 March 2013As at 31 March 2013As at 31 March 2013 (Unaudited)(Unaudited)(Unaudited)(Unaudited)
HoldingHoldingHoldingHolding
FairFairFairFair
valuevaluevaluevalue
US$US$US$US$
% of% of% of% of
netnetnetnet
assetsassetsassetsassets
KoreaKoreaKoreaKorea (Continued)
Hyundai Heavy
Industries 176,000 33,377,674 5.0
Hyundai Mipo
Dockyard 52,075 5,429,355 0.8
Young Poong
Precision 246,545 2,304,573 0.3
MediaMediaMediaMedia (0.7%)
CJ Hellovision 340,000 4,736,653 0.7
Metals & MiningMetals & MiningMetals & MiningMetals & Mining (8.5%)
Hyundai Steel 119,913 8,729,960 1.3
POSCO 162,000 47,394,393 7.2
Multiline RetailMultiline RetailMultiline RetailMultiline Retail (1.3%)
Shinsegae Co 43,060 8,746,683 1.3
Oil & Gas & Consumable FuelsOil & Gas & Consumable FuelsOil & Gas & Consumable FuelsOil & Gas & Consumable Fuels (3.5%)
GS Hldgs Pref 81,800 1,790,248 0.3
SK Innovation 54,000 7,862,664 1.2
S-Oil Corp 120,465 10,091,082 1.5
S-Oil Corp Pref 67,000 3,589,071 0.5
Personal ProductsPersonal ProductsPersonal ProductsPersonal Products (0.7%)
Amorepacific Corp 5,500 4,824,735 0.7
Semiconductors & Semiconductor EquipmentSemiconductors & Semiconductor EquipmentSemiconductors & Semiconductor EquipmentSemiconductors & Semiconductor Equipment (9.6%)
Samsung Electronics 22,000 30,174,366 4.6
Samsung Electronics
GDR-RegS 49,500 33,264,000 5.0
TobaccoTobaccoTobaccoTobacco (1.7%)
KT & G 166,000 11,413,806 1.7
Trading Companies & DistributorsTrading Companies & DistributorsTrading Companies & DistributorsTrading Companies & Distributors (1.4%)
Samsung C&T 149,500 9,204,341 1.4
605,654,050 91.2
--------- ----
(II) Debt Securities(II) Debt Securities(II) Debt Securities(II) Debt Securities (3.1%)
KoreaKoreaKoreaKorea (3.1%)
Korea Monetary
No0917 0%
17/09/13 KRW7,500,000,000 6,660,143 1.0
Korea Monetary
No1404 3.59%
2/04/14 KRW14,750,000,000 13,480,885 2.1
20,141,028 3.1
--------- ----
(III) Derivatives(III) Derivatives(III) Derivatives(III) Derivatives (0.0%)
OptionsOptionsOptionsOptions (0.0%)
KOSPI 200 (KFE) Call
Opt04/13 267.5 425 213,913 0.0
--------- ----
(Continued)
HoldingHoldingHoldingHolding
FairFairFairFair
valuevaluevaluevalue
US$US$US$US$
% of% of% of% of
netnetnetnet
assetsassetsassetsassets
Total Listed/Quoted InvestmentsTotal Listed/Quoted InvestmentsTotal Listed/Quoted InvestmentsTotal Listed/Quoted Investments 626,008,991 94.3
Other net assetsOther net assetsOther net assetsOther net assets 38,143,288 5.7
Net assets attributable to holders of Net assets attributable to holders of Net assets attributable to holders of Net assets attributable to holders of
redeemable units at 31 March 2013redeemable units at 31 March 2013redeemable units at 31 March 2013redeemable units at 31 March 2013 664,152,279 100.0
Total investments, at costTotal investments, at costTotal investments, at costTotal investments, at cost 629,169,916

JPMORGAN KOREA FUNDJPMORGAN KOREA FUNDJPMORGAN KOREA FUNDJPMORGAN KOREA FUND (Formerly known as JF Korea Fund)(Formerly known as JF Korea Fund)(Formerly known as JF Korea Fund)(Formerly known as JF Korea Fund)
SemiSemiSemiSemi----annual report for theannual report for theannual report for theannual report for the
period ended 31 March 2013period ended 31 March 2013period ended 31 March 2013period ended 31 March 2013
- 168 -
Statement of Movements in Portfolio HoldingsStatement of Movements in Portfolio HoldingsStatement of Movements in Portfolio HoldingsStatement of Movements in Portfolio Holdings
For the period ended 31 March 2013For the period ended 31 March 2013For the period ended 31 March 2013For the period ended 31 March 2013 (Unaudited)(Unaudited)(Unaudited)(Unaudited)
% holdings% holdings% holdings% holdings
of net assetsof net assetsof net assetsof net assets
31.3.201331.3.201331.3.201331.3.2013 30.9.201230.9.201230.9.201230.9.2012
Listed/Quoted InvestmentsListed/Quoted InvestmentsListed/Quoted InvestmentsListed/Quoted Investments
EquitiesEquitiesEquitiesEquities
KoreaKoreaKoreaKorea
Automobiles 10.8 5.6
Semiconductors & Semiconductor
Equipment 9.6 9.5
Commercial Banks 9.2 12.3
Metals & Mining 8.5 8.5
Construction & Engineering 8.2 6.1
Machinery 8.1 9.9
Chemicals 6.4 5.5
Food & Staples Retailing 4.5 4.4
Oil & Gas & Consumable Fuels 3.5 2.0
Auto Components 3.4 5.1
Capital Markets 3.4 4.9
Diversified Financial Services 2.1 2.4
Tobacco 1.7 -
Industrial Conglomerates 1.5 2.0
Trading Companies & Distributors 1.4 2.4
Multiline Retail 1.3 0.3
Household Durables 1.2 1.4
Diversified Consumer Services 1.1 0.9
Hotels Restaurants & Leisure 1.0 1.0
Electrical Equipment 0.8 0.7
Personal Products 0.7 0.3
Media 0.7 -
Insurance 0.6 0.7
Household Products 0.6 -
Diversified Telecommunication Services 0.4 -
Beverages 0.3 1.3
Construction Materials 0.2 0.6
Marine - 1.3
Food Products - 0.5
Electronic Equipment, Instruments &
Components - 0.4
SingaporeSingaporeSingaporeSingapore
Capital Markets - 0.7
Debt Debt Debt Debt SecuritiesSecuritiesSecuritiesSecurities 3.1 -
DerivativesDerivativesDerivativesDerivatives
Options 0.0 -
Total Listed/Quoted InvestmentsTotal Listed/Quoted InvestmentsTotal Listed/Quoted InvestmentsTotal Listed/Quoted Investments 94.3 90.7
Other net assetsOther net assetsOther net assetsOther net assets 5.7 9.3
Net assets attributable to holders of Net assets attributable to holders of Net assets attributable to holders of Net assets attributable to holders of
redeemable unitsredeemable unitsredeemable unitsredeemable units 100.0 100.0

JPMORGAN KOREA FUNDJPMORGAN KOREA FUNDJPMORGAN KOREA FUNDJPMORGAN KOREA FUND (Formerly known as JF Korea Fund)(Formerly known as JF Korea Fund)(Formerly known as JF Korea Fund)(Formerly known as JF Korea Fund)
SemiSemiSemiSemi----annual report for theannual report for theannual report for theannual report for the
period ended 31 March 2013period ended 31 March 2013period ended 31 March 2013period ended 31 March 2013
The notes on pages 171 to 173 form part of these financial statements.
- 169 -
Statement of Financial PositionStatement of Financial PositionStatement of Financial PositionStatement of Financial Position
As at 31 March 2013As at 31 March 2013As at 31 March 2013As at 31 March 2013 (Unaudited)(Unaudited)(Unaudited)(Unaudited)
31.3.201331.3.201331.3.201331.3.2013 30.9.201230.9.201230.9.201230.9.2012
US$US$US$US$ US$US$US$US$
AssetsAssetsAssetsAssets
Cash at banks 16,063,263 3,861,980
Short term deposits 6,029,497 66,415,683
Amounts due from brokers 10,217,546 7,416,587
Amounts receivable on allotment 3,694,748 4,887,458
Margin deposits 3,125,556 1,577,868
Derivatives 213,913 -
Investments 625,795,078 666,004,801
Dividend and other accounts
receivable 6,651,417 1,244,608
Total assetsTotal assetsTotal assetsTotal assets 671,791,018 751,408,985
---------- ----------
LiabilitiesLiabilitiesLiabilitiesLiabilities
Amounts due to brokers 4,139,316 11,147,911
Amounts payable on redemption 2,692,136 4,620,079
Other accounts payable 807,287 974,033
Total liabilitiesTotal liabilitiesTotal liabilitiesTotal liabilities 7,638,739 16,742,023
---------- ----------
Net assets attributable to holders Net assets attributable to holders Net assets attributable to holders Net assets attributable to holders
of redeemable units of redeemable units of redeemable units of redeemable units [Note 3] 664,152,279 734,666,962
EquityEquityEquityEquity 664,152,279 734,666,962
Statement of Comprehensive IncomeStatement of Comprehensive IncomeStatement of Comprehensive IncomeStatement of Comprehensive Income
For the period ended 31 March 2013For the period ended 31 March 2013For the period ended 31 March 2013For the period ended 31 March 2013 (Unaudited)(Unaudited)(Unaudited)(Unaudited)
1.10.20121.10.20121.10.20121.10.2012
totototo
31.3.201331.3.201331.3.201331.3.2013
1.10.20111.10.20111.10.20111.10.2011
totototo
31.3.201231.3.201231.3.201231.3.2012
US$US$US$US$ US$US$US$US$
IncomeIncomeIncomeIncome
Net gains on investments and
derivatives [Note 4] 4,350,336 161,064,041
Dividend income 8,940,621 9,908,569
Interest on deposits 42,916 45,552
Net foreign currency exchange
losses (945,102) (267,606)
Other income 767 2,406
12,389,538 170,752,962
---------- ----------
ExpensesExpensesExpensesExpenses
Management fee 5,279,277 5,199,554
Transaction costs 3,049,308 3,058,276
Trustee's fee 97,176 107,296
Safe custody and bank charges 89,326 104,415
Registrar's fee 88,915 90,651
Auditor's fee 11,449 11,997
Printing and publication expenses 8,123 11,196
Valuation fee 8,120 8,400
Legal and professional expenses 219 -
Other operating expenses 3,626 902
8,635,539 8,592,687
---------- ----------
Net operating profitNet operating profitNet operating profitNet operating profit 3,753,999 162,160,275
Finance costsFinance costsFinance costsFinance costs
Interest paid - (109)
Profit before taxationProfit before taxationProfit before taxationProfit before taxation 3,753,999 162,160,166
Taxation (1,954,986) (2,179,726)
Increase in net assets Increase in net assets Increase in net assets Increase in net assets
attributable to holders of attributable to holders of attributable to holders of attributable to holders of
redeemable units and total redeemable units and total redeemable units and total redeemable units and total
comprehensive incomecomprehensive incomecomprehensive incomecomprehensive income 1,799,013 159,980,440
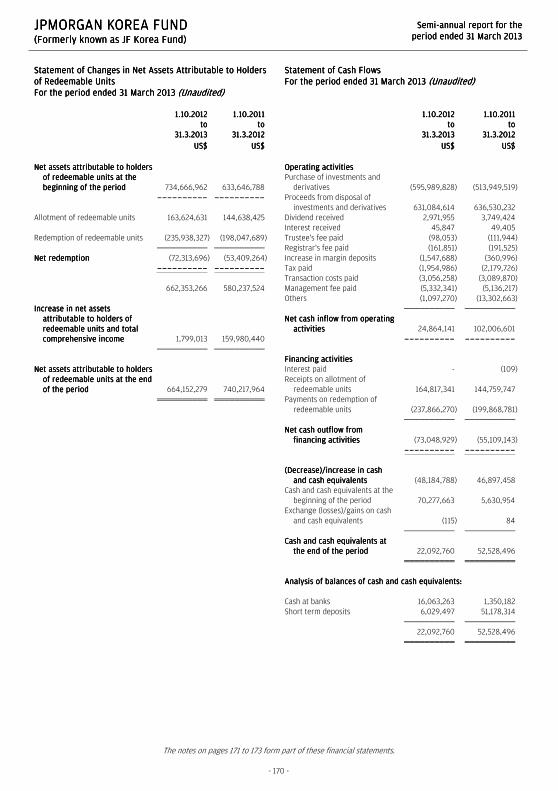
JPMORGAN KOREA FUNDJPMORGAN KOREA FUNDJPMORGAN KOREA FUNDJPMORGAN KOREA FUND (Formerly known as JF Korea Fund)(Formerly known as JF Korea Fund)(Formerly known as JF Korea Fund)(Formerly known as JF Korea Fund)
SemiSemiSemiSemi----annual report for theannual report for theannual report for theannual report for the
period ended 31 March 2013period ended 31 March 2013period ended 31 March 2013period ended 31 March 2013
The notes on pages 171 to 173 form part of these financial statements.
- 170 -
Statement of Changes in Net Assets Attributable to Holders Statement of Changes in Net Assets Attributable to Holders Statement of Changes in Net Assets Attributable to Holders Statement of Changes in Net Assets Attributable to Holders
of Redeemableof Redeemableof Redeemableof Redeemable UnitsUnitsUnitsUnits
For the period ended 31 March 2013For the period ended 31 March 2013For the period ended 31 March 2013For the period ended 31 March 2013 (Unaudited)(Unaudited)(Unaudited)(Unaudited)
1.10.20121.10.20121.10.20121.10.2012
totototo
31.3.201331.3.201331.3.201331.3.2013
1.10.20111.10.20111.10.20111.10.2011
totototo
31.3.201231.3.201231.3.201231.3.2012
US$US$US$US$ US$US$US$US$
Net assets attributable to holders Net assets attributable to holders Net assets attributable to holders Net assets attributable to holders
of redeemable units at the of redeemable units at the of redeemable units at the of redeemable units at the
beginning of the periodbeginning of the periodbeginning of the periodbeginning of the period 734,666,962 633,646,788
---------- ----------
Allotment of redeemable units 163,624,631 144,638,425
Redemption of redeemable units (235,938,327) (198,047,689)
Net redemptionNet redemptionNet redemptionNet redemption (72,313,696) (53,409,264)
---------- ----------
662,353,266 580,237,524
Increase inIncrease inIncrease inIncrease in net assets net assets net assets net assets
attributable to holders of attributable to holders of attributable to holders of attributable to holders of
redeemable units and total redeemable units and total redeemable units and total redeemable units and total
comprehensive incomecomprehensive incomecomprehensive incomecomprehensive income 1,799,013 159,980,440
Net assets attributable to holders Net assets attributable to holders Net assets attributable to holders Net assets attributable to holders
of redeemable units at the end of redeemable units at the end of redeemable units at the end of redeemable units at the end
of the periodof the periodof the periodof the period 664,152,279 740,217,964
Statement of Cash FlowsStatement of Cash FlowsStatement of Cash FlowsStatement of Cash Flows
For the period ended 31 March 2013For the period ended 31 March 2013For the period ended 31 March 2013For the period ended 31 March 2013 (Unaudited)(Unaudited)(Unaudited)(Unaudited)
1.10.20121.10.20121.10.20121.10.2012
totototo
31.3.201331.3.201331.3.201331.3.2013
1.10.20111.10.20111.10.20111.10.2011
totototo
31.3.201231.3.201231.3.201231.3.2012
US$US$US$US$ US$US$US$US$
Operating activitiesOperating activitiesOperating activitiesOperating activities
Purchase of investments and
derivatives (595,989,828) (513,949,519)
Proceeds from disposal of
investments and derivatives 631,084,614 636,530,232
Dividend received 2,971,955 3,749,424
Interest received 45,847 49,405
Trustee's fee paid (98,053) (111,944)
Registrar's fee paid (161,851) (191,525)
Increase in margin deposits (1,547,688) (360,996)
Tax paid (1,954,986) (2,179,726)
Transaction costs paid (3,056,258) (3,089,870)
Management fee paid (5,332,341) (5,136,217)
Others (1,097,270) (13,302,663)
Net cash inflow from operating Net cash inflow from operating Net cash inflow from operating Net cash inflow from operating
activitiesactivitiesactivitiesactivities 24,864,141 102,006,601
---------- ----------
Financing activitiesFinancing activitiesFinancing activitiesFinancing activities
Interest paid - (109)
Receipts on allotment of
redeemable units 164,817,341 144,759,747
Payments on redemption of
redeemable units (237,866,270) (199,868,781)
Net cash outflow from Net cash outflow from Net cash outflow from Net cash outflow from
financing activitiesfinancing activitiesfinancing activitiesfinancing activities (73,048,929) (55,109,143)
---------- ----------
(Decrease)/increase in cash (Decrease)/increase in cash (Decrease)/increase in cash (Decrease)/increase in cash
and cash equivalentsand cash equivalentsand cash equivalentsand cash equivalents (48,184,788) 46,897,458
Cash and cash equivalents at the
beginning of the period 70,277,663 5,630,954
Exchange (losses)/gains on cash
and cash equivalents (115) 84
Cash and cash equivalents at Cash and cash equivalents at Cash and cash equivalents at Cash and cash equivalents at
the end of the periodthe end of the periodthe end of the periodthe end of the period 22,092,760 52,528,496
Analysis of balances of cash and cash equivalents:Analysis of balances of cash and cash equivalents:Analysis of balances of cash and cash equivalents:Analysis of balances of cash and cash equivalents:
Cash at banks 16,063,263 1,350,182
Short term deposits 6,029,497 51,178,314
22,092,760 52,528,496

JPMORGAN KOREA FUNDJPMORGAN KOREA FUNDJPMORGAN KOREA FUNDJPMORGAN KOREA FUND (Formerly known as JF Korea Fund)(Formerly known as JF Korea Fund)(Formerly known as JF Korea Fund)(Formerly known as JF Korea Fund)
SemiSemiSemiSemi----annual report for theannual report for theannual report for theannual report for the
period ended 31 March 2013period ended 31 March 2013period ended 31 March 2013period ended 31 March 2013
- 171 -
Notes to the Financial StatementsNotes to the Financial StatementsNotes to the Financial StatementsNotes to the Financial Statements
1111 The FundThe FundThe FundThe Fund
JPMorgan Korea Fund (the "Fund") was established under a Trust Deed dated 11 December 1991, as amended, and is governed by the laws of
Hong Kong. The Fund is authorized by the Securities and Futures Commission of Hong Kong.
With effect from 4 February 2013, the name of the Fund was changed from JF Korea Fund to JPMorgan Korea Fund.
The investment objective of the Fund is to provide investors with long-term capital appreciation through investment primarily in companies
whose shares are listed on the Korea Stock Exchange or traded on the Korean over-the-counter market.
Pursuant to the Supplemental Trust Deed dated 4 January 2013, the Manager may decide to issue separate classes (each a "Class") whose
assets will be commonly invested but where a specific fee structure, currency or distribution policy may be applied. Each Class may have a
different charging structure with the result that the net asset value attributable to each Class may differ.
All unitholders' rights with regard to the convening, voting or otherwise acting at any meeting of unitholders are the same.
2222 Summary of principal accounting policiesSummary of principal accounting policiesSummary of principal accounting policiesSummary of principal accounting policies
(a)(a)(a)(a) Accounting policies of interim financial statementsAccounting policies of interim financial statementsAccounting policies of interim financial statementsAccounting policies of interim financial statements
The accounting policies and methods of computation used in the preparation of these unaudited condensed interim financial statements
are consistent with those used in the annual financial statements for the year ended 30 September 2012.
(b)(b)(b)(b) Investments and derivativesInvestments and derivativesInvestments and derivativesInvestments and derivatives
Classification
The Fund classifies its investments and derivatives as financial assets or financial liabilities at fair value through profit or loss. These
financial assets or financial liabilities are held-for-trading as they are acquired or incurred principally for the purpose of selling or
repurchasing in the near term or short-term profit taking.
All derivatives are carried in assets when amounts are receivable by the Fund and in liabilities when amounts are payable by the Fund.
The Fund makes short sales in which a borrowed security is sold in anticipation of a decline in the market value of that security, or it may
use short sales for various arbitrage transactions. Short sales are classified as financial liabilities at fair value through profit or loss.
Recognition, derecognition and measurement
Purchases and sales of investments and derivatives are accounted for on the trade date basis. Investments and derivatives are initially
recognized at fair value and are subsequently re-measured at fair value. Realized and unrealized gains and losses on investments and
derivatives are recognized in the Statement of Comprehensive Income. Investments and derivatives are derecognized when the rights to
receive cash flows from the investments and derivatives have expired or the Fund has transferred substantially all risks and rewards of
ownership.
Fair value estimation
Investments that are listed or traded on an exchange and investments with prices quoted in over-the-counter markets or by market
makers, are fair valued based on quoted "bid" prices on long investments and quoted "ask" prices on investments sold short. When
trading in the securities of an investee company is suspended, the investment is valued at the Manager's estimate of its fair value.
Debt securities are fair valued based on quoted prices inclusive of accrued interest.
Investments in collective investment schemes are stated at fair value based on the net asset value per unit of the respective funds as
determined by the administrators of the relevant funds or stated at "bid" prices if the collective investment schemes are listed or traded
on an exchange.
Open future and swap contracts are valued at "bid" prices for long positions and "ask" prices for short positions at the valuation date.
The differences between the bid/ask prices and the contract prices are recognized in the Statement of Comprehensive Income.
Open option contracts are valued at "bid" prices for long positions and "ask" prices for short positions at the valuation date. The
differences between the bid/ask prices and the premium amounts/contract prices are recognized in the Statement of Comprehensive
Income.

JPMORGAN KOREA FUNDJPMORGAN KOREA FUNDJPMORGAN KOREA FUNDJPMORGAN KOREA FUND (Formerly known as JF Korea Fund)(Formerly known as JF Korea Fund)(Formerly known as JF Korea Fund)(Formerly known as JF Korea Fund)
SemiSemiSemiSemi----annual report for theannual report for theannual report for theannual report for the
period ended 31 March 2013period ended 31 March 2013period ended 31 March 2013period ended 31 March 2013
- 172 -
Forward foreign exchange contracts are valued at the forward rates ruling at the valuation date. The differences between the forward
rates and the contract rates are recognized in the Statement of Comprehensive Income.
(c)(c)(c)(c) Securities lending and borrowingSecurities lending and borrowingSecurities lending and borrowingSecurities lending and borrowing
Securities lenders' agreements are entered into with institutions of appropriate financial standing who engage in such arrangements
acceptable to the Trustee and on arm's length commercial terms. Securities lent are included in the investment portfolio of the Fund.
Relevant securities lending income entitled by the Fund is accounted for in the Statement of Comprehensive Income. Collateral received
for the purpose of securities lent generally consist of non-cash collateral which are off-balance sheet transactions and are therefore not
included in the financial statements.
The Fund may enter into securities borrowing arrangements for short sale purposes. Short positions represent obligations to deliver
securities sold but not yet purchased, and are accounted for as investments and valued at their fair value. Securities borrowed during the
period/year are off-balance sheet transactions and are therefore not included in the investment portfolio of the Fund. Collateral placed
for the purpose of securities borrowed generally consist of cash collateral and are included in the Statement of Financial Position
separately.
(d)(d)(d)(d) Foreign currency translationForeign currency translationForeign currency translationForeign currency translation
Functional and presentation currency
The Fund has adopted United States dollar as its functional and presentation currency.
Transactions and balances
Foreign currency transactions are translated into the functional currency using the exchange rates prevailing at the dates of the
transactions.
Foreign exchange gains and losses resulting from the settlement of such transactions and from the translation of assets and liabilities
denominated in foreign currencies at period/year end exchange rates are recognized in the Statement of Comprehensive Income.
Foreign exchange gains and losses relating to cash and cash equivalents are presented in the Statement of Comprehensive Income
within "Net foreign currency exchange gains/losses". Foreign exchange gains and losses relating to the financial assets and liabilities
carried at fair value through profit or loss are presented in the Statement of Comprehensive Income within "Net gains/losses on
investments and derivatives".
(e)(e)(e)(e) Proceeds and payments on allotment and redemption of unitsProceeds and payments on allotment and redemption of unitsProceeds and payments on allotment and redemption of unitsProceeds and payments on allotment and redemption of units
The net asset value per unit is computed for each dealing day. The price at which units are allotted or redeemed is calculated by
reference to the net asset value per unit as at the close of business on the relevant dealing day in accordance with the provisions of the
Fund's Trust Deed dated 11 December 1991, as amended, which may be different from the accounting policies stated in the financial
statements.
3333 Number of units in issue and net assets attributable to holders of redeemable units (per unit)Number of units in issue and net assets attributable to holders of redeemable units (per unit)Number of units in issue and net assets attributable to holders of redeemable units (per unit)Number of units in issue and net assets attributable to holders of redeemable units (per unit)
31.3.2013 30.9.2012
Units Units
Number of units in issue 13,878,050.851 15,380,226.337
US$ US$
Net assets attributable to holders of redeemable units 664,152,279 734,666,962
Net assets attributable to holders of redeemable units (per unit) 47.86 47.77

JPMORGAN KOREA FUNDJPMORGAN KOREA FUNDJPMORGAN KOREA FUNDJPMORGAN KOREA FUND (Formerly known as JF Korea Fund)(Formerly known as JF Korea Fund)(Formerly known as JF Korea Fund)(Formerly known as JF Korea Fund)
SemiSemiSemiSemi----annual report for theannual report for theannual report for theannual report for the
period ended 31 March 2013period ended 31 March 2013period ended 31 March 2013period ended 31 March 2013
- 173 -
4444 Net gains on investments and derivativesNet gains on investments and derivativesNet gains on investments and derivativesNet gains on investments and derivatives
1.10.2012
to
31.3.2013
1.10.2011
to
31.3.2012
US$ US$
Change in unrealized gains/losses in value of investments and derivatives (10,339,665) 181,633,067
Realized gains/(losses) on sale of investments and derivatives 14,690,001 (20,569,026)
4,350,336 161,064,041
5555 Soft commission arrangementsSoft commission arrangementsSoft commission arrangementsSoft commission arrangements
The Investment Manager has entered into soft commission arrangements with brokers under which certain goods and services used to
support investment decision making are received by the Investment Manager. The Investment Manager does not make direct payment for
these services but transacts an agreed amount of business with the brokers on behalf of the Fund. Commission is paid from the Fund on these
transactions.
The goods and services must be of demonstrable benefit to the Fund and may include research and advisory services; economic and political
analysis; portfolio analysis, including valuation and performance measurement; market analysis, data and quotation services, computer
hardware and software incidental to the above goods and services; clearing and custodian services and investment-related publications.
6666 DistributionDistributionDistributionDistribution
No distribution was made during the period (31 March 2012: nil).

JPMORGAN MALAYSIA FUNDJPMORGAN MALAYSIA FUNDJPMORGAN MALAYSIA FUNDJPMORGAN MALAYSIA FUND (Forme(Forme(Forme(Formerrrrly known as JF Malaysia Fund)ly known as JF Malaysia Fund)ly known as JF Malaysia Fund)ly known as JF Malaysia Fund)
SemiSemiSemiSemi----annual report for theannual report for theannual report for theannual report for the
period ended 31 March 2013period ended 31 March 2013period ended 31 March 2013period ended 31 March 2013
- 174 -
Distributor StatusDistributor StatusDistributor StatusDistributor Status
The Fund has been certified by HMRC in the UK as a
distributing fund in respect of the period from 12 December
1989 to 30 September 2010. The principal effect of this
certification is that for unitholders resident or ordinarily
resident in the UK for taxation purposes any gains accruing
on the sale, redemption or other disposal of units during
the period will be taxed in the UK as a capital gain and not
as income. This treatment will continue under the new UK
reporting fund regime provided the Fund does not invest
more than 5% of its assets in other offshore funds which
are not themselves reporting funds. There will be no need
to formally apply for reporting fund status as the Fund is
transparent for UK tax purposes and therefore considered
out of scope of the requirements of this new regime.
As noted, the Fund is transparent for UK income tax
purposes and UK investors are subject to UK capital gains
tax on disposal of their units. UK investors are subject to tax
on their share of income of the Fund on an arising basis.
Information has been provided to UK investors of the
amount of their share of the underlying income, expenses
and overseas tax suffered.
Investment PortfolioInvestment PortfolioInvestment PortfolioInvestment Portfolio
As As As As at 31 March 2013at 31 March 2013at 31 March 2013at 31 March 2013 (Unaudited)(Unaudited)(Unaudited)(Unaudited)
HoldingHoldingHoldingHolding
FairFairFairFair
valuevaluevaluevalue
US$US$US$US$
% of% of% of% of
netnetnetnet
assetsassetsassetsassets
Listed/Quoted InvestmentsListed/Quoted InvestmentsListed/Quoted InvestmentsListed/Quoted Investments (93.9%)
Equities and WarrantsEquities and WarrantsEquities and WarrantsEquities and Warrants (93.9%)
MalaysiaMalaysiaMalaysiaMalaysia (87.4%)
ChemicalsChemicalsChemicalsChemicals (3.7%)
Petronas Chemicals 3,167,400 6,526,082 3.7
ConstructionConstructionConstructionConstruction (9.7%)
Benalec Hldgs 2,141,000 815,882 0.4
Gamuda Bhd 3,796,300 4,940,768 2.8
SapuraKencana Petroleum 6,722,163 6,512,672 3.7
SP Setia 1,010,700 1,073,859 0.6
WCT Bhd 3,866,930 2,972,160 1.7
WCT Bhd Wts 11/12/17 472,040 56,404 0.0
YTL Corp 1,640,000 863,297 0.5
Consumer ProductsConsumer ProductsConsumer ProductsConsumer Products (9.6%)
Axiata Group 3,656,600 7,793,819 4.4
IHH Healthcare-MY List 1,783,000 2,147,777 1.2
Padini Hldgs 2,663,700 1,643,038 1.0
PPB Group 270,000 1,098,660 0.6
QL Resources 1,489,200 1,442,790 0.8
UMW Hldgs 650,000 2,800,258 1.6
FinanceFinanceFinanceFinance (25.0%)
Alliance Financial Group 1,798,000 2,554,885 1.4
AMMB Hldgs 950,000 2,006,459 1.1
(Continued)
HoldingHoldingHoldingHolding
FairFairFairFair
valuevaluevaluevalue
US$US$US$US$
% of% of% of% of
netnetnetnet
assetsassetsassetsassets
CIMB Group Hldgs 5,238,500 12,874,208 7.3
Malayan Banking 5,652,514 17,049,727 9.6
Public Bank (L) 1,706,773 8,951,395 5.1
RHB Capital 330,000 899,467 0.5
Industrial ProductsIndustrial ProductsIndustrial ProductsIndustrial Products (6.0%)
Maxis Bhd 1,745,800 3,681,600 2.1
Petronas Gas 1,130,600 6,922,711 3.9
PlantationsPlantationsPlantationsPlantations (1.9%)
Kuala Lumpur Kepong 503,000 3,388,529 1.9
PropertyPropertyPropertyProperty (7.3%)
CapitaMalls Malaysia Trust 6,435,400 3,824,039 2.2
IGB Real Estate
Investment Trust 4,403,900 1,991,106 1.1
IJM Land 2,518,700 2,114,846 1.2
UEM Land Hldgs 4,291,000 3,741,547 2.1
UOA Development 1,839,600 1,211,944 0.7
Real EstateReal EstateReal EstateReal Estate (1.1%)
Pavilion REIT 3,868,500 1,986,409 1.1
Trading ServicesTrading ServicesTrading ServicesTrading Services (23.1%)
Dialog Group 6,839,160 5,212,471 2.9
Dialog Group Wts 12/02/17 569,930 82,825 0.0
Digi.com Bhd 5,002,900 7,480,519 4.2
Genting Bhd 2,002,800 6,461,480 3.6
Genting Malaysia 3,063,000 3,561,053 2.0
KPJ Healthcare 1,192,000 2,286,607 1.3
MBM Resources 759,800 836,725 0.5
Power Root 1,701,500 829,732 0.5
Sime Darby 3,645,790 10,890,863 6.1
Star Publications 800,000 656,225 0.4
Telekom Malaysia 871,900 1,514,879 0.9
Tenaga Nasional 500,000 1,159,373 0.7
SingaporeSingaporeSingaporeSingapore (6.5%)
ElectronicsElectronicsElectronicsElectronics (1.2%)
Courts Asia 2,622,000 2,092,359 1.2
Food & BeveragesFood & BeveragesFood & BeveragesFood & Beverages (3.2%)
Thai Beverage 11,538,000 5,673,207 3.2
Real EstateReal EstateReal EstateReal Estate (1.1%)
CapitaLand Ltd 463,000 1,317,419 0.8
CapitaMalls Asia 327,000 540,343 0.3
ShippingShippingShippingShipping (0.4%)
STX OSV Hldgs 798,000 784,749 0.4
Wholesale TradeWholesale TradeWholesale TradeWholesale Trade (0.6%)
Tat Hong Hldgs 871,000 1,070,671 0.6
Total Total Total Total Listed/Quoted InvestmentsListed/Quoted InvestmentsListed/Quoted InvestmentsListed/Quoted Investments 166,337,838 93.9

JPMORGAN MALAYSIA FUNDJPMORGAN MALAYSIA FUNDJPMORGAN MALAYSIA FUNDJPMORGAN MALAYSIA FUND (Forme(Forme(Forme(Formerrrrly known as JF Malaysia Fund)ly known as JF Malaysia Fund)ly known as JF Malaysia Fund)ly known as JF Malaysia Fund)
SemiSemiSemiSemi----annual report for theannual report for theannual report for theannual report for the
period ended 31 March 2013period ended 31 March 2013period ended 31 March 2013period ended 31 March 2013
- 175 -
Investment PortfolioInvestment PortfolioInvestment PortfolioInvestment Portfolio (Continued)
As at 31 March 2013As at 31 March 2013As at 31 March 2013As at 31 March 2013 (Unaudited)(Unaudited)(Unaudited)(Unaudited)
HoldingHoldingHoldingHolding
FairFairFairFair
valuevaluevaluevalue
US$US$US$US$
% of% of% of% of
netnetnetnet
assetsassetsassetsassets
Other net assetsOther net assetsOther net assetsOther net assets 10,788,108 6.1
Net assets Net assets Net assets Net assets attributable to holders of attributable to holders of attributable to holders of attributable to holders of
redeemable units at 31 March 2013redeemable units at 31 March 2013redeemable units at 31 March 2013redeemable units at 31 March 2013 177,125,946 100.0
Total investments, at costTotal investments, at costTotal investments, at costTotal investments, at cost 127,856,481
Statement of Movements in Portfolio HoldingsStatement of Movements in Portfolio HoldingsStatement of Movements in Portfolio HoldingsStatement of Movements in Portfolio Holdings
For the period ended 31 March 2013For the period ended 31 March 2013For the period ended 31 March 2013For the period ended 31 March 2013 (Unaudited)(Unaudited)(Unaudited)(Unaudited)
% holdings% holdings% holdings% holdings
of net assetsof net assetsof net assetsof net assets
31.3.201331.3.201331.3.201331.3.2013 30.9.201230.9.201230.9.201230.9.2012
Listed/Quoted InvestmentsListed/Quoted InvestmentsListed/Quoted InvestmentsListed/Quoted Investments
Equities and WarrantsEquities and WarrantsEquities and WarrantsEquities and Warrants
MalaysiaMalaysiaMalaysiaMalaysia
Finance 25.0 30.2
Trading Services 23.1 26.9
Construction 9.7 6.6
Consumer Products 9.6 14.2
Property 7.3 6.8
Industrial Products 6.0 2.8
Chemicals 3.7 3.4
Plantations 1.9 4.2
Real Estate 1.1 1.2
SingaporeSingaporeSingaporeSingapore
Food & Beverages 3.2 -
Electronics 1.2 -
Real Estate 1.1 -
Wholesale Trade 0.6 0.5
Shipping 0.4 -
Retailing - 0.4
Total Listed/Quoted Total Listed/Quoted Total Listed/Quoted Total Listed/Quoted InvestmentsInvestmentsInvestmentsInvestments 93.9 97.2
Other net assetsOther net assetsOther net assetsOther net assets 6.1 2.8
Net assets attributable to holders of Net assets attributable to holders of Net assets attributable to holders of Net assets attributable to holders of
redeemable unitsredeemable unitsredeemable unitsredeemable units 100.0 100.0

JPMORGAN MALAYSIA FUNDJPMORGAN MALAYSIA FUNDJPMORGAN MALAYSIA FUNDJPMORGAN MALAYSIA FUND (Forme(Forme(Forme(Formerrrrly known as JF Malaysia Fund)ly known as JF Malaysia Fund)ly known as JF Malaysia Fund)ly known as JF Malaysia Fund)
SemiSemiSemiSemi----annual report for theannual report for theannual report for theannual report for the
period ended 31 March 2013period ended 31 March 2013period ended 31 March 2013period ended 31 March 2013
The notes on pages 178 to 180 form part of these financial statements.
- 176 -
Statement of Financial PositionStatement of Financial PositionStatement of Financial PositionStatement of Financial Position
As at 31 March 2013As at 31 March 2013As at 31 March 2013As at 31 March 2013 (Unaudited)(Unaudited)(Unaudited)(Unaudited)
31.3.201331.3.201331.3.201331.3.2013 30.9.201230.9.201230.9.201230.9.2012
US$US$US$US$ US$US$US$US$
AssetsAssetsAssetsAssets
Cash at banks 969,985 2,516,583
Short term deposits 10,001,000 -
Amounts due from brokers - 1,353,993
Amounts receivable on allotment 2,521,865 1,759,266
Investments 166,337,838 170,441,325
Dividend and other accounts
receivable 455,257 1,111,706
Total Total Total Total assetsassetsassetsassets 180,285,945 177,182,873
---------- ----------
LiabilitiesLiabilitiesLiabilitiesLiabilities
Amounts due to brokers 114,470 -
Amounts payable on redemption 2,830,949 1,513,802
Other accounts payable 214,580 276,002
Total liabilitiesTotal liabilitiesTotal liabilitiesTotal liabilities 3,159,999 1,789,804
---------- ----------
Net assets attributable to holders Net assets attributable to holders Net assets attributable to holders Net assets attributable to holders
of redeemable units of redeemable units of redeemable units of redeemable units [Note 3] 177,125,946 175,393,069
EquityEquityEquityEquity 177,125,946 175,393,069
Statement of Statement of Statement of Statement of Comprehensive IncomeComprehensive IncomeComprehensive IncomeComprehensive Income
For the period ended 31 March 2013For the period ended 31 March 2013For the period ended 31 March 2013For the period ended 31 March 2013 (Unaudited)(Unaudited)(Unaudited)(Unaudited)
1.10.20121.10.20121.10.20121.10.2012
totototo
31.3.201331.3.201331.3.201331.3.2013
1.10.20111.10.20111.10.20111.10.2011
totototo
31.3.201231.3.201231.3.201231.3.2012
US$US$US$US$ US$US$US$US$
IncomeIncomeIncomeIncome
Net gains on investments and
derivatives [Note 4] 8,246,599 33,651,943
Dividend income 1,639,541 2,833,929
Interest on deposits 1,794 12,277
Net foreign currency exchange
(losses)/gains (152,679) 33,142
Other income 74 188
9,735,329 36,531,479
---------- ----------
ExpensesExpensesExpensesExpenses
Management fee 1,232,824 1,510,933
Transaction costs 274,165 293,172
Registrar's fee 43,282 36,007
Trustee's fee 29,724 41,800
Safe custody and bank charges 26,314 41,444
Valuation fee 7,980 8,190
Auditor's fee 6,639 7,210
Printing and publication expenses 1,281 1,549
Legal and professional expenses 230 179
Other operating expenses 2,769 1,602
1,625,208 1,942,086
---------- ----------
Net operating profitNet operating profitNet operating profitNet operating profit 8,110,121 34,589,393
Finance costsFinance costsFinance costsFinance costs
Interest paid (644) (896)
Profit before taxationProfit before taxationProfit before taxationProfit before taxation 8,109,477 34,588,497
Taxation (16,203) (157,413)
Increase in net assets Increase in net assets Increase in net assets Increase in net assets
attributable to holders of attributable to holders of attributable to holders of attributable to holders of
redeemable units and total redeemable units and total redeemable units and total redeemable units and total
comprehensive incomecomprehensive incomecomprehensive incomecomprehensive income 8,093,274 34,431,084

JPMORGAN MALAYSIA FUNDJPMORGAN MALAYSIA FUNDJPMORGAN MALAYSIA FUNDJPMORGAN MALAYSIA FUND (Forme(Forme(Forme(Formerrrrly known as JF Malaysia Fund)ly known as JF Malaysia Fund)ly known as JF Malaysia Fund)ly known as JF Malaysia Fund)
SemiSemiSemiSemi----annual report for theannual report for theannual report for theannual report for the
period ended 31 March 2013period ended 31 March 2013period ended 31 March 2013period ended 31 March 2013
The notes on pages 178 to 180 form part of these financial statements.
- 177 -
Statement of Changes in Net Assets Attributable to Holders Statement of Changes in Net Assets Attributable to Holders Statement of Changes in Net Assets Attributable to Holders Statement of Changes in Net Assets Attributable to Holders
of Redeemable Unitsof Redeemable Unitsof Redeemable Unitsof Redeemable Units
For the period ended 31 March 2013For the period ended 31 March 2013For the period ended 31 March 2013For the period ended 31 March 2013 (Unaudited)(Unaudited)(Unaudited)(Unaudited)
1.10.20121.10.20121.10.20121.10.2012
totototo
31.3.201331.3.201331.3.201331.3.2013
1.10.20111.10.20111.10.20111.10.2011
totototo
31.3.201231.3.201231.3.201231.3.2012
US$US$US$US$ US$US$US$US$
Net assets attributable to holders Net assets attributable to holders Net assets attributable to holders Net assets attributable to holders
of redeemable of redeemable of redeemable of redeemable units at the units at the units at the units at the
beginning of the periodbeginning of the periodbeginning of the periodbeginning of the period 175,393,069 181,671,476
---------- ----------
Allotment of redeemable units 50,461,915 42,505,946
Redemption of redeemable units (56,822,312) (52,076,146)
Net redemptionNet redemptionNet redemptionNet redemption (6,360,397) (9,570,200)
---------- ----------
169,032,672 172,101,276
Increase in net assets Increase in net assets Increase in net assets Increase in net assets
attributable to holders of attributable to holders of attributable to holders of attributable to holders of
redeemable units and total redeemable units and total redeemable units and total redeemable units and total
comprehensive incomecomprehensive incomecomprehensive incomecomprehensive income 8,093,274 34,431,084
Net assets attributable Net assets attributable Net assets attributable Net assets attributable to holders to holders to holders to holders
of redeemable units at the end of redeemable units at the end of redeemable units at the end of redeemable units at the end
of the periodof the periodof the periodof the period 177,125,946 206,532,360
Statement of Cash FlowsStatement of Cash FlowsStatement of Cash FlowsStatement of Cash Flows
For the period ended 31 March 2013For the period ended 31 March 2013For the period ended 31 March 2013For the period ended 31 March 2013 (Unaudited)(Unaudited)(Unaudited)(Unaudited)
1.10.20121.10.20121.10.20121.10.2012
totototo
31.3.201331.3.201331.3.201331.3.2013
1.10.20111.10.20111.10.20111.10.2011
totototo
31.3.201231.3.201231.3.201231.3.2012
US$US$US$US$ US$US$US$US$
Operating Operating Operating Operating activitiesactivitiesactivitiesactivities
Purchase of investments and
derivatives (46,188,926) (62,836,694)
Proceeds from disposal of
investments and derivatives 60,085,734 68,547,791
Dividend received 2,220,598 2,990,782
Interest received 1,492 12,338
Tax paid (16,203) (157,413)
Trustee's fee paid (29,950) (45,909)
Registrar's fee paid (78,665) (74,769)
Transaction costs paid (277,905) (308,700)
Management fee paid (1,243,451) (1,517,307)
Others (199,371) (87,429)
Net cash inflow from operating Net cash inflow from operating Net cash inflow from operating Net cash inflow from operating
activitiesactivitiesactivitiesactivities 14,273,353 6,522,690
---------- ----------
Financing activitiesFinancing activitiesFinancing activitiesFinancing activities
Interest paid (644) (896)
Receipts on allotment of
redeemable units 49,699,316 41,989,126
Payments on redemption of
redeemable units (55,505,165) (52,249,042)
Net cash outflow from Net cash outflow from Net cash outflow from Net cash outflow from
financing activitiesfinancing activitiesfinancing activitiesfinancing activities (5,806,493) (10,260,812)
---------- ----------
Increase/(decrease) in cash and Increase/(decrease) in cash and Increase/(decrease) in cash and Increase/(decrease) in cash and
cash equivalentscash equivalentscash equivalentscash equivalents 8,466,860 (3,738,122)
Cash and cash equivalents at the
beginning of the period 2,516,583 9,820,271
Exchange (losses)/gains on cash
and cash equivalents (12,458) 43,929
Cash and cash equivalents at Cash and cash equivalents at Cash and cash equivalents at Cash and cash equivalents at
the end of the periodthe end of the periodthe end of the periodthe end of the period 10,970,985 6,126,078
Analysis of balances of cash and cash Analysis of balances of cash and cash Analysis of balances of cash and cash Analysis of balances of cash and cash equivalents:equivalents:equivalents:equivalents:
Cash at banks 969,985 2,125,843
Short term deposits 10,001,000 4,000,235
10,970,985 6,126,078
JPMORGAN MALAYSIA FUNDJPMORGAN MALAYSIA FUNDJPMORGAN MALAYSIA FUNDJPMORGAN MALAYSIA FUND (Forme(Forme(Forme(Formerrrrly known as JF Malaysia Fund)ly known as JF Malaysia Fund)ly known as JF Malaysia Fund)ly known as JF Malaysia Fund)
SemiSemiSemiSemi----annual report for theannual report for theannual report for theannual report for the
period ended 31 March 2013period ended 31 March 2013period ended 31 March 2013period ended 31 March 2013
- 178 -
Notes to the Financial StatementsNotes to the Financial StatementsNotes to the Financial StatementsNotes to the Financial Statements
1111 The FundThe FundThe FundThe Fund
JPMorgan Malaysia Fund (the "Fund") was established under a Trust Deed dated 12 December 1989, as amended, and is governed by the laws
of Hong Kong. The Fund is authorized by the Securities and Futures Commission of Hong Kong.
With effect from 4 February 2013, the name of the Fund was changed from JF Malaysia Fund to JPMorgan Malaysia Fund.
The investment objective of the Fund is to provide investors with long-term capital growth by investing primarily in securities linked to the
Malaysian economy. These include, but are not restricted to, securities listed on the Kuala Lumpur Stock Exchange.
Pursuant to the Supplemental Trust Deed dated 4 January 2013, the Manager may decide to issue separate classes (each a “Class”) whose
assets will be commonly invested but where a specific fee structure, currency or distribution policy may be applied. Each Class may have a
different charging structure with the result that the net asset value attributable to each Class may differ.
All unitholders' rights with regard to the convening, voting or otherwise acting at any meeting of unitholders are the same.
2222 Summary of principal accounting policiesSummary of principal accounting policiesSummary of principal accounting policiesSummary of principal accounting policies
(a)(a)(a)(a) Accounting policies of interim financial statements Accounting policies of interim financial statements Accounting policies of interim financial statements Accounting policies of interim financial statements
The accounting policies and methods of computation used in the preparation of these unaudited condensed interim financial statements
are consistent with those used in the annual financial statements for the year ended 30 September 2012.
(b)(b)(b)(b) Investments and derivatiInvestments and derivatiInvestments and derivatiInvestments and derivatives ves ves ves
Classification
The Fund classifies its investments and derivatives as financial assets or financial liabilities at fair value through profit or loss. These
financial assets or financial liabilities are held-for-trading as they are acquired or incurred principally for the purpose of selling or
repurchasing in the near term or short-term profit taking.
All derivatives are carried in assets when amounts are receivable by the Fund and in liabilities when amounts are payable by the Fund.
The Fund makes short sales in which a borrowed security is sold in anticipation of a decline in the market value of that security, or it may
use short sales for various arbitrage transactions. Short sales are classified as financial liabilities at fair value through profit or loss.
Recognition, derecognition and measurement
Purchases and sales of investments and derivatives are accounted for on the trade date basis. Investments and derivatives are initially
recognized at fair value and are subsequently re-measured at fair value. Realized and unrealized gains and losses on investments and
derivatives are recognized in the Statement of Comprehensive Income. Investments and derivatives are derecognized when the rights to
receive cash flows from the investments and derivatives have expired or the Fund has transferred substantially all risks and rewards of
ownership.
Fair value estimation
Investments that are listed or traded on an exchange and investments with prices quoted in over-the-counter markets or by market
makers, are fair valued based on quoted "bid" prices on long investments and quoted "ask" prices on investments sold short. When
trading in the securities of an investee company is suspended, the investment is valued at the Manager's estimate of its fair value.
Debt securities are fair valued based on quoted prices inclusive of accrued interest.
Investments in collective investment schemes are stated at fair value based on the net asset value per unit of the respective funds as
determined by the administrators of the relevant funds or stated at "bid" prices if the collective investment schemes are listed or traded
on an exchange.
Open future and swap contracts are valued at "bid" prices for long positions and "ask" prices for short positions at the valuation date.
The differences between the bid/ask prices and the contract prices are recognized in the Statement of Comprehensive Income.
Open option contracts are valued at "bid" prices for long positions and "ask" prices for short positions at the valuation date. The
differences between the bid/ask prices and the premium amounts/contract prices are recognized in the Statement of Comprehensive
Income.

JPMORGAN MALAYSIA FUNDJPMORGAN MALAYSIA FUNDJPMORGAN MALAYSIA FUNDJPMORGAN MALAYSIA FUND (Forme(Forme(Forme(Formerrrrly known as JF Malaysia Fund)ly known as JF Malaysia Fund)ly known as JF Malaysia Fund)ly known as JF Malaysia Fund)
SemiSemiSemiSemi----annual report for theannual report for theannual report for theannual report for the
period ended 31 March 2013period ended 31 March 2013period ended 31 March 2013period ended 31 March 2013
- 179 -
Forward foreign exchange contracts are valued at the forward rates ruling at the valuation date. The differences between the forward
rates and the contract rates are recognized in the Statement of Comprehensive Income.
(c)(c)(c)(c) Securities borrowing Securities borrowing Securities borrowing Securities borrowing
The Fund may enter into securities borrowing arrangements for short sale purposes. Short positions represent obligations to deliver
securities sold but not yet purchased, and are accounted for as investments and valued at their fair value. Securities borrowed during the
period/year are off-balance sheet transactions and are therefore not included in the investment portfolio of the Fund. Collateral placed
for the purpose of securities borrowed generally consist of cash collateral and are included in the Statement of Financial Position
separately.
(d)(d)(d)(d) Foreign currency translationForeign currency translationForeign currency translationForeign currency translation
Functional and presentation currency
The Fund has adopted United States dollar as its functional and presentation currency.
Transactions and balances
Foreign currency transactions are translated into the functional currency using the exchange rates prevailing at the dates of the
transactions.
Foreign exchange gains and losses resulting from the settlement of such transactions and from the translation of assets and liabilities
denominated in foreign currencies at period/year end exchange rates are recognized in the Statement of Comprehensive Income.
Foreign exchange gains and losses relating to cash and cash equivalents are presented in the Statement of Comprehensive Income
within "Net foreign currency exchange gains/losses". Foreign exchange gains and losses relating to the financial assets and liabilities
carried at fair value through profit or loss are presented in the Statement of Comprehensive Income within "Net gains/losses on
investments and derivatives".
(e)(e)(e)(e) Proceeds and payments on allotment and redemption of unitsProceeds and payments on allotment and redemption of unitsProceeds and payments on allotment and redemption of unitsProceeds and payments on allotment and redemption of units
The net asset value per unit is computed for each dealing day. The price at which units are allotted or redeemed is calculated by
reference to the net asset value per unit as at the close of business on the relevant dealing day in accordance with the provisions of the
Fund's Trust Deed dated 12 December 1989, as amended, which may be different from the accounting policies stated in the financial
statements.
3333 Number of units in issue and net assets attributable to holders of redeemable units (per unit)Number of units in issue and net assets attributable to holders of redeemable units (per unit)Number of units in issue and net assets attributable to holders of redeemable units (per unit)Number of units in issue and net assets attributable to holders of redeemable units (per unit)
31.3.2013 30.9.2012
Units Units
Number of units in issue 2,942,653.292 3,050,804.913
US$ US$
Net assets attributable to holders of redeemable units 177,125,946 175,393,069
Net assets attributable to holders of redeemable units (per unit) 60.19 57.49
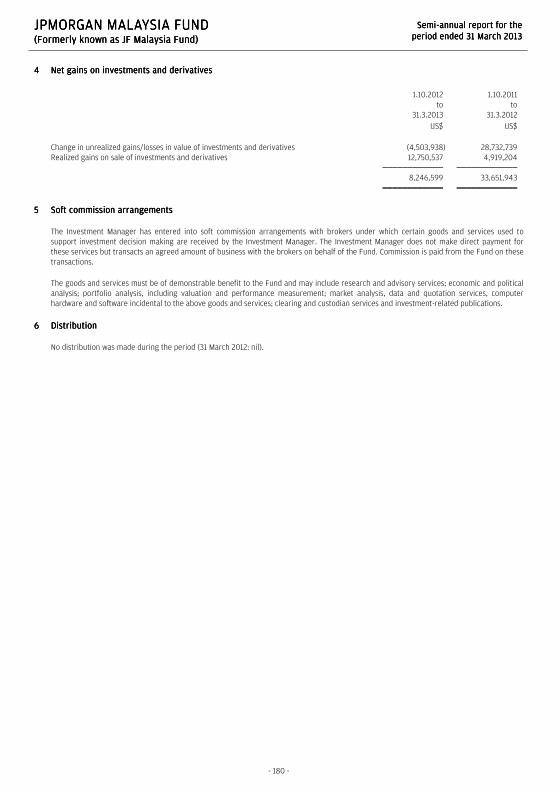
JPMORGAN MALAYSIA FUNDJPMORGAN MALAYSIA FUNDJPMORGAN MALAYSIA FUNDJPMORGAN MALAYSIA FUND (Forme(Forme(Forme(Formerrrrly known as JF Malaysia Fund)ly known as JF Malaysia Fund)ly known as JF Malaysia Fund)ly known as JF Malaysia Fund)
SemiSemiSemiSemi----annual report for theannual report for theannual report for theannual report for the
period ended 31 March 2013period ended 31 March 2013period ended 31 March 2013period ended 31 March 2013
- 180 -
4444 Net gains on investments and derivatives Net gains on investments and derivatives Net gains on investments and derivatives Net gains on investments and derivatives
1.10.2012
to
31.3.2013
1.10.2011
to
31.3.2012
US$ US$
Change in unrealized gains/losses in value of investments and derivatives (4,503,938) 28,732,739
Realized gains on sale of investments and derivatives 12,750,537 4,919,204
8,246,599 33,651,943
5555 Soft commission arrangementsSoft commission arrangementsSoft commission arrangementsSoft commission arrangements
The Investment Manager has entered into soft commission arrangements with brokers under which certain goods and services used to
support investment decision making are received by the Investment Manager. The Investment Manager does not make direct payment for
these services but transacts an agreed amount of business with the brokers on behalf of the Fund. Commission is paid from the Fund on these
transactions.
The goods and services must be of demonstrable benefit to the Fund and may include research and advisory services; economic and political
analysis; portfolio analysis, including valuation and performance measurement; market analysis, data and quotation services, computer
hardware and software incidental to the above goods and services; clearing and custodian services and investment-related publications.
6666 Distribution Distribution Distribution Distribution
No distribution was made during the period (31 March 2012: nil).

JPMORGAN MONEY FUND JPMORGAN MONEY FUND JPMORGAN MONEY FUND JPMORGAN MONEY FUND (Formerly known as JF Money(Formerly known as JF Money(Formerly known as JF Money(Formerly known as JF Money Fund)Fund)Fund)Fund)
SemiSemiSemiSemi----annual report for theannual report for theannual report for theannual report for the
period ended 31 March 2013period ended 31 March 2013period ended 31 March 2013period ended 31 March 2013
- 181 -
Investment PortfolioInvestment PortfolioInvestment PortfolioInvestment Portfolio
As at 31 March 2013As at 31 March 2013As at 31 March 2013As at 31 March 2013 (Unaudited)(Unaudited)(Unaudited)(Unaudited)
HoldingHoldingHoldingHolding
HK$HK$HK$HK$ portfolioportfolioportfolioportfolio
fairfairfairfair valuevaluevaluevalue
HK$HK$HK$HK$
% of% of% of% of
netnetnetnet
assetsassetsassetsassets
Listed/Quoted InvestmentsListed/Quoted InvestmentsListed/Quoted InvestmentsListed/Quoted Investments (72.1%)
(I) Debt Securities(I) Debt Securities(I) Debt Securities(I) Debt Securities (27.8%)
Cayman IslandsCayman IslandsCayman IslandsCayman Islands (10.5%) Cheung Kong Bond
Fin 3.48%
22/04/13 HKD30,000,000 30,187,459 3.0
Cheung Kong Bond
Fin 3.9% 27/05/13 HKD5,000,000 5,030,664 0.5
MTR Corp 4.6%
03/06/13 HKD4,000,000 4,171,729 0.4
MTR Corp 5%
26/08/13 HKD4,000,000 4,081,738 0.4
MTR Corp 5.25%
21/05/13 HKD31,500,000 33,076,519 3.2
Swire Pacific MTN
FRN 10/06/13 HKD30,000,000 30,050,790 3.0
ChinaChinaChinaChina (3.9%)
ICBC HK FRN
08/04/13 HKD40,000,000 40,067,737 3.9
Hong KongHong KongHong KongHong Kong (3.9%)
HK Mortgage FRN
16/08/13 HKD10,000,000 10,014,458 1.0
Kowloon-Canton Rail
4.65% 10/06/13 HKD28,500,000 29,732,477 2.9
KoreaKoreaKoreaKorea (0.5%)
Korea Dev Bank
2.15% 06/08/13 HKD5,000,000 5,085,696 0.5
NetherlandsNetherlandsNetherlandsNetherlands (0.6%)
Rabobank Nederland
(HK) 4.18% 07/13 HKD6,000,000 6,220,095 0.6
SupranationalSupranationalSupranationalSupranational (3.8%)
Eurofima 1.65%
22/04/13 HKD39,000,000 39,091,819 3.8
United KingdomUnited KingdomUnited KingdomUnited Kingdom (1.0%)
Barclays Bank FRN
27/08/13 HKD10,000,000 10,011,051 1.0
United StatesUnited StatesUnited StatesUnited States (3.1%)
General Elec Cap
3.8525% 06/05/13 HKD30,000,000 31,072,225 3.1
Virgin IslandsVirgin IslandsVirgin IslandsVirgin Islands (0.5%)
CLP Power HK Fin 5%
30/09/13 HKD5,000,000 5,096,240 0.5
��������� ����
282,990,697 27.8
--------- ----
HoldingHoldingHoldingHolding
HK$HK$HK$HK$ portfolioportfolioportfolioportfolio
fairfairfairfair valuevaluevaluevalue
HK$HK$HK$HK$
% of% of% of% of netnetnetnet
assetsassetsassetsassets
(II) Money Market (II) Money Market (II) Money Market (II) Money Market (44.3%)
AustraliaAustraliaAustraliaAustralia (11.8%)
Bk Tky-Mit UFJ ECD 0%
08/04/13-HKD HKD40,000,000 39,996,000 4.0
Credit Suisse ECP 0%
08/05/13-HKD HKD40,000,000 39,984,000 3.9
Deutsche Bk Sydney ECP
0% 05/13-HKD HKD40,000,000 39,984,000 3.9
ChinaChinaChinaChina (10.4%)
Agricultural Bk China HK
CD0.8%3/14 HKD10,000,000 9,971,911 1.0
Agricultural Bk China HK
CD0.8%4/14 HKD15,000,000 14,973,000 1.5
Bank of China HK CD 1.3%
18/07/13 HKD30,000,000 30,268,003 3.0
Bank of China HK CD FRN
21/08/13 HKD10,000,000 10,026,112 1.0
China Dev Bank HK CD FRN
29/11/13 HKD40,000,000 40,060,714 3.9
Hong KongHong KongHong KongHong Kong (15.7%)
Bank of East Asia CD 1.42%
21/05/13 HKD30,000,000 30,047,918 2.9
Banque Natl Paris HK
ECD0%05/13-HKD HKD35,000,000 34,986,000 3.4
China Const Bk Asia CD
0.6% 6/12/13 HKD20,000,000 19,961,948 2.0
Dah Sing Bank CD 0.88%
09/01/14 HKD15,000,000 14,993,655 1.5
HK Exchange Fd Bill
08/05/13-Q1306 HKD40,000,000 39,998,800 3.9
Standard Chart Bk HK CD
0.7% 01/14 HKD20,000,000 19,917,151 2.0
MalaysiaMalaysiaMalaysiaMalaysia (3.0%)
Malayan Banking HK FRN
CD 12/04/13 HKD30,000,000 30,089,569 3.0
NetherlandsNetherlandsNetherlandsNetherlands (3.4%)
ING Bank ECP 0%
09/04/13-HKD HKD35,000,000 34,993,000 3.4 ��������� ����
450,251,781 44.3 --------- ----
Total Listed/Quoted InvestmentsTotal Listed/Quoted InvestmentsTotal Listed/Quoted InvestmentsTotal Listed/Quoted Investments 733,242,478 72.1
Other net assetsOther net assetsOther net assetsOther net assets 284,053,596 27.9
��������� ����
Net assets attributable to holders of Net assets attributable to holders of Net assets attributable to holders of Net assets attributable to holders of
redeemable units at 31 March 2013redeemable units at 31 March 2013redeemable units at 31 March 2013redeemable units at 31 March 2013 1,017,296,074 100.0
��������� ����
Total investments, at costTotal investments, at costTotal investments, at costTotal investments, at cost 733,897,911
���������
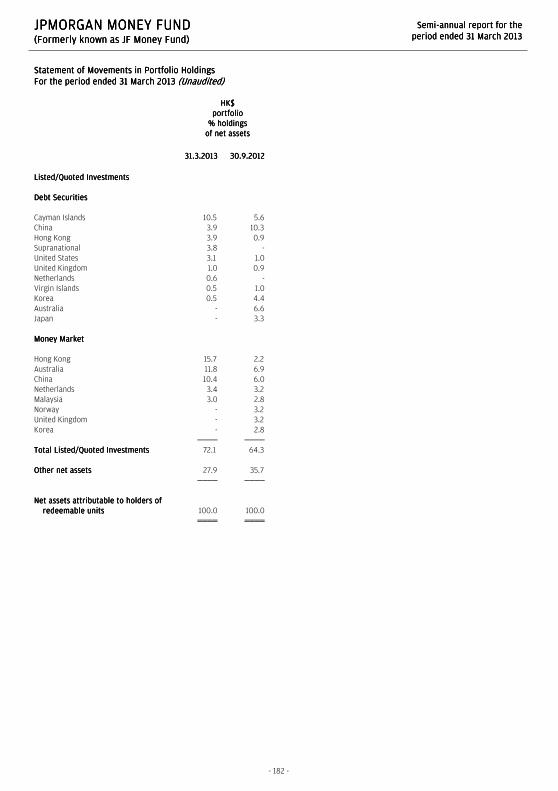
JPMORGAN MONEY FUND JPMORGAN MONEY FUND JPMORGAN MONEY FUND JPMORGAN MONEY FUND (Formerly known as JF Money(Formerly known as JF Money(Formerly known as JF Money(Formerly known as JF Money Fund)Fund)Fund)Fund)
SemiSemiSemiSemi----annual report for theannual report for theannual report for theannual report for the
period ended 31 March 2013period ended 31 March 2013period ended 31 March 2013period ended 31 March 2013
- 182 -
Statement of Movements in Portfolio HoldingsStatement of Movements in Portfolio HoldingsStatement of Movements in Portfolio HoldingsStatement of Movements in Portfolio Holdings
For the period ended 31 March 2013For the period ended 31 March 2013For the period ended 31 March 2013For the period ended 31 March 2013 (Unaudited)(Unaudited)(Unaudited)(Unaudited)
HK$HK$HK$HK$
portfolioportfolioportfolioportfolio
% holdings% holdings% holdings% holdings
of net assetsof net assetsof net assetsof net assets
31.3.201331.3.201331.3.201331.3.2013 30.9.201230.9.201230.9.201230.9.2012
Listed/Quoted InvestmentsListed/Quoted InvestmentsListed/Quoted InvestmentsListed/Quoted Investments
Debt SecuritiesDebt SecuritiesDebt SecuritiesDebt Securities
Cayman Islands 10.5 5.6
China 3.9 10.3
Hong Kong 3.9 0.9
Supranational 3.8 -
United States 3.1 1.0
United Kingdom 1.0 0.9
Netherlands 0.6 -
Virgin Islands 0.5 1.0
Korea 0.5 4.4
Australia - 6.6
Japan - 3.3
Money MarketMoney MarketMoney MarketMoney Market
Hong Kong 15.7 2.2
Australia 11.8 6.9
China 10.4 6.0
Netherlands 3.4 3.2
Malaysia 3.0 2.8
Norway - 3.2
United Kingdom - 3.2
Korea - 2.8
Total Listed/Quoted InvestmentsTotal Listed/Quoted InvestmentsTotal Listed/Quoted InvestmentsTotal Listed/Quoted Investments 72.1 64.3
Other net assetsOther net assetsOther net assetsOther net assets 27.9 35.7
Net assets attributable to holders of Net assets attributable to holders of Net assets attributable to holders of Net assets attributable to holders of
redeemable unitsredeemable unitsredeemable unitsredeemable units 100.0 100.0
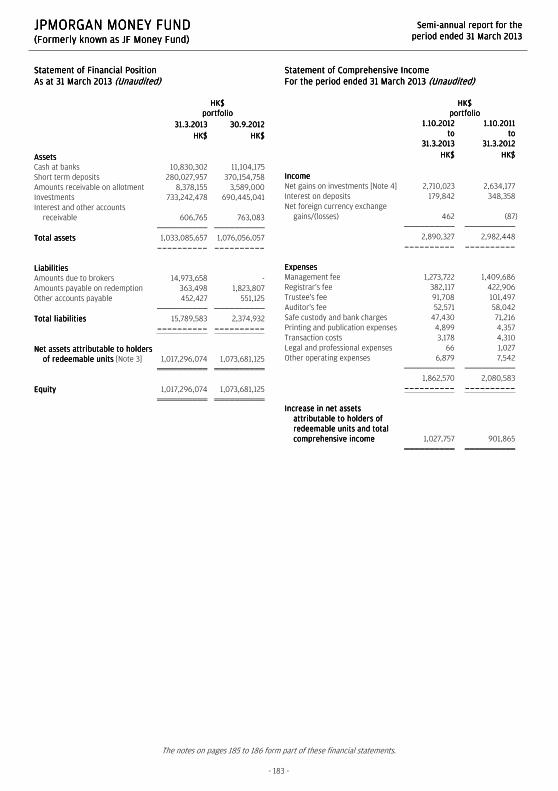
JPMORGAN MONEY FUND JPMORGAN MONEY FUND JPMORGAN MONEY FUND JPMORGAN MONEY FUND (Formerly known as JF Money(Formerly known as JF Money(Formerly known as JF Money(Formerly known as JF Money Fund)Fund)Fund)Fund)
SemiSemiSemiSemi----annual report for theannual report for theannual report for theannual report for the
period ended 31 March 2013period ended 31 March 2013period ended 31 March 2013period ended 31 March 2013
The notes on pages 185 to 186 form part of these financial statements.
- 183 -
Statement of Financial PositionStatement of Financial PositionStatement of Financial PositionStatement of Financial Position
As at 31 March 2013As at 31 March 2013As at 31 March 2013As at 31 March 2013 (Unaudited)(Unaudited)(Unaudited)(Unaudited)
HK$HK$HK$HK$
portfolioportfolioportfolioportfolio
31.3.201331.3.201331.3.201331.3.2013 30.9.201230.9.201230.9.201230.9.2012
HK$HK$HK$HK$ HK$HK$HK$HK$
AssetsAssetsAssetsAssets
Cash at banks 10,830,302 11,104,175
Short term deposits 280,027,957 370,154,758
Amounts receivable on allotment 8,378,155 3,589,000
Investments 733,242,478 690,445,041
Interest and other accounts
receivable 606,765 763,083
Total Total Total Total assetsassetsassetsassets 1,033,085,657 1,076,056,057
---------- ----------
LiabilitiesLiabilitiesLiabilitiesLiabilities
Amounts due to brokers 14,973,658 -
Amounts payable on redemption 363,498 1,823,807
Other accounts payable 452,427 551,125
Total liabilitiesTotal liabilitiesTotal liabilitiesTotal liabilities 15,789,583 2,374,932
---------- ----------
Net assets attributable to holders Net assets attributable to holders Net assets attributable to holders Net assets attributable to holders
of redeemable units of redeemable units of redeemable units of redeemable units [Note 3] 1,017,296,074 1,073,681,125
EquityEquityEquityEquity 1,017,296,074 1,073,681,125
Statement of Comprehensive IncomeStatement of Comprehensive IncomeStatement of Comprehensive IncomeStatement of Comprehensive Income
For the period ended 31 March 2013For the period ended 31 March 2013For the period ended 31 March 2013For the period ended 31 March 2013 (Unaudited)(Unaudited)(Unaudited)(Unaudited)
HK$HK$HK$HK$
portfolioportfolioportfolioportfolio
1.10.20121.10.20121.10.20121.10.2012
totototo
31.3.201331.3.201331.3.201331.3.2013
1.10.20111.10.20111.10.20111.10.2011
totototo
31.3.201231.3.201231.3.201231.3.2012
HK$HK$HK$HK$ HK$HK$HK$HK$
IncomeIncomeIncomeIncome
Net gains on investments [Note 4] 2,710,023 2,634,177
Interest on deposits 179,842 348,358
Net foreign currency exchange
gains/(losses) 462 (87)
2,890,327 2,982,448
---------- ----------
ExpensesExpensesExpensesExpenses
Management fee 1,273,722 1,409,686
Registrar's fee 382,117 422,906
Trustee's fee 91,708 101,497
Auditor's fee 52,571 58,042
Safe custody and bank charges 47,430 71,216
Printing and publication expenses 4,899 4,357
Transaction costs 3,178 4,310
Legal and professional expenses 66 1,027
Other operating expenses 6,879 7,542
1,862,570 2,080,583
---------- ----------
Increase in net assets Increase in net assets Increase in net assets Increase in net assets
attributable to holders of attributable to holders of attributable to holders of attributable to holders of
redeemable units and total redeemable units and total redeemable units and total redeemable units and total
comprehensive incomecomprehensive incomecomprehensive incomecomprehensive income 1,027,757 901,865
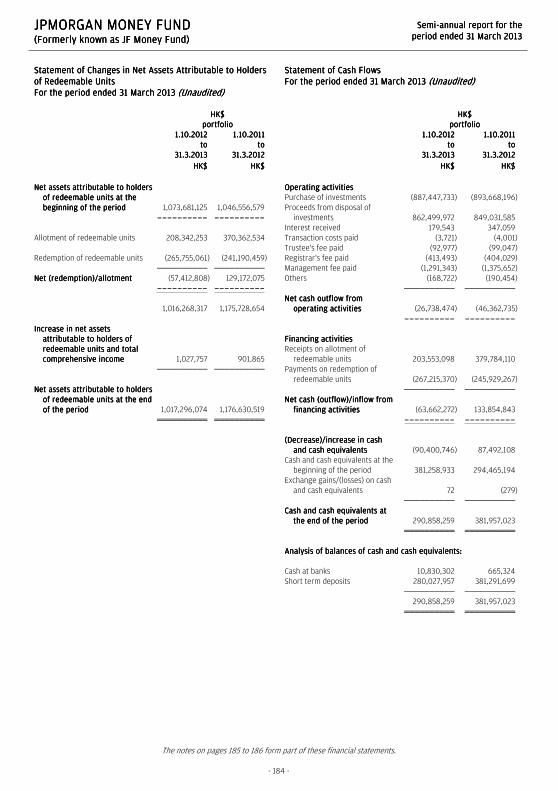
JPMORGAN MONEY FUND JPMORGAN MONEY FUND JPMORGAN MONEY FUND JPMORGAN MONEY FUND (Formerly known as JF Money(Formerly known as JF Money(Formerly known as JF Money(Formerly known as JF Money Fund)Fund)Fund)Fund)
SemiSemiSemiSemi----annual report for theannual report for theannual report for theannual report for the
period ended 31 March 2013period ended 31 March 2013period ended 31 March 2013period ended 31 March 2013
The notes on pages 185 to 186 form part of these financial statements.
- 184 -
Statement of Changes in Net Statement of Changes in Net Statement of Changes in Net Statement of Changes in Net Assets Attributable to Holders Assets Attributable to Holders Assets Attributable to Holders Assets Attributable to Holders
of Redeemable Unitsof Redeemable Unitsof Redeemable Unitsof Redeemable Units
For the period ended 31 March 2013For the period ended 31 March 2013For the period ended 31 March 2013For the period ended 31 March 2013 (Unaudited)(Unaudited)(Unaudited)(Unaudited)
HK$HK$HK$HK$
portfolioportfolioportfolioportfolio
1.10.20121.10.20121.10.20121.10.2012
totototo
31.3.201331.3.201331.3.201331.3.2013
1.10.20111.10.20111.10.20111.10.2011
totototo
31.3.201231.3.201231.3.201231.3.2012
HK$HK$HK$HK$ HK$HK$HK$HK$
Net assets attributable to holders Net assets attributable to holders Net assets attributable to holders Net assets attributable to holders
of redeemable units at the of redeemable units at the of redeemable units at the of redeemable units at the
beginning of the beginning of the beginning of the beginning of the periodperiodperiodperiod 1,073,681,125 1,046,556,579
---------- ----------
Allotment of redeemable units 208,342,253 370,362,534
Redemption of redeemable units (265,755,061) (241,190,459)
Net (redemption)/allotmentNet (redemption)/allotmentNet (redemption)/allotmentNet (redemption)/allotment (57,412,808) 129,172,075
---------- ----------
1,016,268,317 1,175,728,654
Increase in net assets Increase in net assets Increase in net assets Increase in net assets
attributable to holders of attributable to holders of attributable to holders of attributable to holders of
redeemable units and total redeemable units and total redeemable units and total redeemable units and total
comprehensive incomecomprehensive incomecomprehensive incomecomprehensive income 1,027,757 901,865
Net assets attributable to holders Net assets attributable to holders Net assets attributable to holders Net assets attributable to holders
of redeemable units at the end of redeemable units at the end of redeemable units at the end of redeemable units at the end
of the periodof the periodof the periodof the period 1,017,296,074 1,176,630,519
Statement of Cash FlowsStatement of Cash FlowsStatement of Cash FlowsStatement of Cash Flows
For the period ended 31 March 2013For the period ended 31 March 2013For the period ended 31 March 2013For the period ended 31 March 2013 (Unaudited)(Unaudited)(Unaudited)(Unaudited)
HK$HK$HK$HK$
portfolioportfolioportfolioportfolio
1.10.20121.10.20121.10.20121.10.2012
totototo
31.3.201331.3.201331.3.201331.3.2013
1.10.20111.10.20111.10.20111.10.2011
totototo
31.3.201231.3.201231.3.201231.3.2012
HK$HK$HK$HK$ HK$HK$HK$HK$
Operating activitiesOperating activitiesOperating activitiesOperating activities
Purchase of investments (887,447,733) (893,668,196)
Proceeds from disposal of
investments 862,499,972 849,031,585
Interest received 179,543 347,059
Transaction costs paid (3,721) (4,001)
Trustee's fee paid (92,977) (99,047)
Registrar's fee paid (413,493) (404,029)
Management fee paid (1,291,343) (1,375,652)
Others (168,722) (190,454)
Net cash outflow from Net cash outflow from Net cash outflow from Net cash outflow from
operating activitiesoperating activitiesoperating activitiesoperating activities (26,738,474) (46,362,735)
---------- ----------
Financing Financing Financing Financing activitiesactivitiesactivitiesactivities
Receipts on allotment of
redeemable units 203,553,098 379,784,110
Payments on redemption of
redeemable units (267,215,370) (245,929,267)
Net cash (outflow)/inflow from Net cash (outflow)/inflow from Net cash (outflow)/inflow from Net cash (outflow)/inflow from
financing activitiesfinancing activitiesfinancing activitiesfinancing activities (63,662,272) 133,854,843
---------- ----------
(Decrease)/increase in cash (Decrease)/increase in cash (Decrease)/increase in cash (Decrease)/increase in cash
and cash equivalentsand cash equivalentsand cash equivalentsand cash equivalents (90,400,746) 87,492,108
Cash and cash equivalents at the
beginning of the period 381,258,933 294,465,194
Exchange gains/(losses) on cash
and cash equivalents 72 (279)
Cash and cash equivalents at Cash and cash equivalents at Cash and cash equivalents at Cash and cash equivalents at
the end of the periodthe end of the periodthe end of the periodthe end of the period 290,858,259 381,957,023
Analysis of balances of cash and cash equivalents:Analysis of balances of cash and cash equivalents:Analysis of balances of cash and cash equivalents:Analysis of balances of cash and cash equivalents:
Cash at banks 10,830,302 665,324
Short term deposits 280,027,957 381,291,699
290,858,259 381,957,023

JPMORGAN MONEY FUND JPMORGAN MONEY FUND JPMORGAN MONEY FUND JPMORGAN MONEY FUND (Formerly known as JF (Formerly known as JF (Formerly known as JF (Formerly known as JF MoneyMoneyMoneyMoney Fund)Fund)Fund)Fund)
SemiSemiSemiSemi----annual report for theannual report for theannual report for theannual report for the
period ended 31 March 2013period ended 31 March 2013period ended 31 March 2013period ended 31 March 2013
- 185 -
Notes to the Financial StatementsNotes to the Financial StatementsNotes to the Financial StatementsNotes to the Financial Statements
1111 The FundThe FundThe FundThe Fund
JPMorgan Money Fund (the "Fund") was established under a Trust Deed dated 13 June 1983, as amended, and is governed by the laws of Hong
Kong. The Fund is authorized by the Securities and Futures Commission of Hong Kong.
With effect from 4 February 2013, the name of the Fund was changed from JF Money Fund to JPMorgan Money Fund.
The Fund currently comprising the HK$ portfolio ("Portfolio").
The investment objective of the Portfolio is to provide an efficient vehicle for holding liquid assets currently denominated in the currency of
Hong Kong.
All unitholders' rights with regard to the convening, voting or otherwise acting at any meeting of unitholders are the same.
2222 Summary of principal accounting policiesSummary of principal accounting policiesSummary of principal accounting policiesSummary of principal accounting policies
(a)(a)(a)(a) Accounting policies of interim financial statementsAccounting policies of interim financial statementsAccounting policies of interim financial statementsAccounting policies of interim financial statements
The accounting policies and methods of computation used in the preparation of these unaudited condensed interim financial statements
are consistent with those used in the annual financial statements for the year ended 30 September 2012.
(b)(b)(b)(b) InvestmentsInvestmentsInvestmentsInvestments
Classification
The Fund classifies its investments as financial assets or financial liabilities at fair value through profit or loss. These financial assets or
financial liabilities are held-for-trading as they are acquired or incurred principally for the purpose of selling or repurchasing in the near
term or short-term profit taking.
Recognition, derecognition and measurement
Purchases and sales of investments are accounted for on the trade date basis. Investments are initially recognized at fair value and are
subsequently re-measured at fair value. Realized and unrealized gains and losses on investments are recognized in the Statement of
Comprehensive Income. Investments are derecognized when the rights to receive cash flows from the investments have expired or the
Fund has transferred substantially all risks and rewards of ownership.
Fair value estimation
Investments that are listed or traded on an exchange and investments with prices quoted in over-the-counter markets or by market
makers, are fair valued based on quoted "bid" prices on long investments and quoted "ask" prices on investments sold short. When
trading in the securities of an investee company is suspended, the investment is valued at the Manager's estimate of its fair value.
Debt securities are fair valued based on quoted prices inclusive of accrued interest.
(c)(c)(c)(c) Foreign currency translationForeign currency translationForeign currency translationForeign currency translation
Functional and presentation currency
The Fund has adopted Hong Kong dollar as its functional and presentation currency.
Transactions and balances
Foreign currency transactions are translated into the functional currency using the exchange rates prevailing at the dates of the
transactions.
Foreign exchange gains and losses resulting from the settlement of such transactions and from the translation of assets and liabilities
denominated in foreign currencies at period/year end exchange rates are recognized in the Statement of Comprehensive Income.
Foreign exchange gains and losses relating to cash and cash equivalents are presented in the Statement of Comprehensive Income
within "Net foreign currency exchange gains/losses". Foreign exchange gains and losses relating to the financial assets and liabilities
carried at fair value through profit or loss are presented in the Statement of Comprehensive Income within "Net gains/losses on
investments".

JPMORGAN MONEY FUND JPMORGAN MONEY FUND JPMORGAN MONEY FUND JPMORGAN MONEY FUND (Formerly known as JF (Formerly known as JF (Formerly known as JF (Formerly known as JF MoneyMoneyMoneyMoney Fund)Fund)Fund)Fund)
SemiSemiSemiSemi----annual report for theannual report for theannual report for theannual report for the
period ended 31 Maperiod ended 31 Maperiod ended 31 Maperiod ended 31 March 2013rch 2013rch 2013rch 2013
- 186 -
(d)(d)(d)(d) Proceeds and payments on allotment and redemption of unitsProceeds and payments on allotment and redemption of unitsProceeds and payments on allotment and redemption of unitsProceeds and payments on allotment and redemption of units
The net asset value per unit is computed for each dealing day. The price at which units are allotted or redeemed is calculated by
reference to the net asset value per unit as at the close of business on the relevant dealing day in accordance with the provisions of the
Fund's Trust Deed dated 13 June 1983, as amended, which may be different from the accounting policies stated in the financial
statements.
3333 Number of units in issue and net assets attributable to holders of redeemable units (per unit)Number of units in issue and net assets attributable to holders of redeemable units (per unit)Number of units in issue and net assets attributable to holders of redeemable units (per unit)Number of units in issue and net assets attributable to holders of redeemable units (per unit)
31.3.2013 30.9.2012
Units Units
Number of units in issue 6,353,592.675 6,712,456.907
HK$ HK$
Net assets attributable to holders of redeemable units 1,017,296,074 1,073,681,125
Net assets attributable to holders of redeemable units (per unit) 160.11 159.95
4444 Net gains on investments Net gains on investments Net gains on investments Net gains on investments
1.10.2012
to
31.3.2013
1.10.2011
to
31.3.2012
HK$ HK$
Change in unrealized gains/losses in value of investments (778,673) (434,641)
Realized gains on sale of investments 3,488,696 3,068,818
2,710,023 2,634,177
5555 Soft commission arrangementsSoft commission arrangementsSoft commission arrangementsSoft commission arrangements
During the period, the Investment Manager and its associates did not enter into any soft commission arrangements in connection with
directing transactions of the Fund through a broker or dealer (31 March 2012: nil).
6666 Distribution Distribution Distribution Distribution
No distribution was made during the period (31 March 2012: nil).

JPMORGAN MULTI INCOME FUNDJPMORGAN MULTI INCOME FUNDJPMORGAN MULTI INCOME FUNDJPMORGAN MULTI INCOME FUND (Formerly known as JPM Multi Income Fund)(Formerly known as JPM Multi Income Fund)(Formerly known as JPM Multi Income Fund)(Formerly known as JPM Multi Income Fund)
SemiSemiSemiSemi----annual report for theannual report for theannual report for theannual report for the
period ended 31 March 2013period ended 31 March 2013period ended 31 March 2013period ended 31 March 2013
- 187 -
Investment PortfolioInvestment PortfolioInvestment PortfolioInvestment Portfolio
As at 31 March 2013As at 31 March 2013As at 31 March 2013As at 31 March 2013 (Unaudited)(Unaudited)(Unaudited)(Unaudited)
HoldingHoldingHoldingHolding
FairFairFairFair
valuevaluevaluevalue
US$US$US$US$
% of% of% of% of
netnetnetnet
assetsassetsassetsassets
Listed/Quoted InvestmentsListed/Quoted InvestmentsListed/Quoted InvestmentsListed/Quoted Investments (94.4%)
(I) Equities and Convertibles(I) Equities and Convertibles(I) Equities and Convertibles(I) Equities and Convertibles (49.3%)
AustraliaAustraliaAustraliaAustralia (2.0%)
Amcor Ltd 389,065 3,723,589 0.2
Australia & NZ Bkg Group-
AU List 148,989 4,428,415 0.2
Commonwealth Prop CB
5.25% 12/16 AUD100,000 118,610 0.0
Commonwealth Property
Office Fd 809,113 932,113 0.1
Dexus Property Group
Stapled Sec 3,186,032 3,454,462 0.2
Goodman Group Stapled
Sec 1,286,329 6,329,814 0.3
Mirvac Group Stapled Sec 950,972 1,591,255 0.1
Paladin Energy CB 3.625%
04/11/15 USD1,800,000 1,586,705 0.1
Paladin Energy CB 6%
30/04/17 USD600,000 561,350 0.0
Stockland Stapled Sec 1,434,107 5,457,218 0.3
Transurban Group Stapled
Sec 713,021 4,720,336 0.2
Westfield Group Stapled
Sec 306,239 3,432,147 0.2
Westfield Retail Trust
Stapled Sec 758,547 2,380,378 0.1
AustriaAustriaAustriaAustria (0.1%)
Atrium European Real
Estate 133,618 771,247 0.1
Immofinanz AG CB 4.25%
8/3/18 (Uts) EUR66,619 367,845 0.0
BelgiumBelgiumBelgiumBelgium (0.2%)
Solvay SA 28,831 3,909,511 0.2
Warehouses De Pauw 13,346 840,085 0.0
BrazilBrazilBrazilBrazil (2.9%)
AES Tiete 208,080 1,803,873 0.1
Banco do Brasil 775,780 10,549,699 0.5
CCR SA 346,950 3,532,563 0.2
CIA de Bebidas das Amer
Pref ADR 144,400 6,111,008 0.3
Cielo SA 369,260 10,861,611 0.6
EDP - Energias do Brasil 995,660 6,231,671 0.3
Embraer SA ADR 172,330 6,147,011 0.3
Souza Cruz 430,970 6,313,811 0.3
Tractebel Energia 343,670 5,900,690 0.3
CanadaCanadaCanadaCanada (0.8%)
Allied Properties REIT 50,700 1,647,831 0.1
Artis Real Estate Inv Trust 78,909 1,248,159 0.1
Bank Of Montreal 61,681 3,878,930 0.2
Calloway Real Estate Inv
Trust 24,800 714,012 0.0
Canadian Apartment
Properties REIT 28,000 693,971 0.0
(Continued)
HoldingHoldingHoldingHolding
FairFairFairFair
valuevaluevaluevalue
US$US$US$US$
% of% of% of% of
netnetnetnet
assetsassetsassetsassets
Canadian Real Estate Inv
Trust 16,100 711,382 0.0
Detour Gold CB 5.5%
30/11/17 USD963,000 998,813 0.0
Dundee Real Estate
Investment 'A' 43,100 1,553,119 0.1
First Capital Realty 50,431 940,167 0.0
H&R Real Estate Inv Trust 59,100 1,358,320 0.1
Petrominerales Ltd CB
2.625%25/8/16 USD1,100,000 1,069,771 0.1
RioCan Real Estate Inv
Trust 60,352 1,639,564 0.1
ChinaChinaChinaChina (2.6%)
Agile Property CB 4%
28/04/16 USD1,100,000 1,131,197 0.1
Bank of China 'H' 15,631,000 7,249,018 0.4
China Construction Bank
'H' 15,150,000 12,373,480 0.6
China Hongqiao CB 6.5%
10/04/17 USD800,000 832,444 0.0
China Mobile 637,000 6,737,093 0.3
Dah Chong Hong Hldgs 4,247,000 4,015,765 0.2
Ind & Comm Bank of China
'H' 10,083,000 7,053,092 0.4
Jiangsu Expressway 'H' 1,830,000 1,827,018 0.1
PetroChina Co 'H' 5,058,000 6,620,069 0.3
Shui On Land CB 4.5%
29/09/15 CNY9,200,000 1,519,319 0.1
Zhejiang Expressway 'H' 2,298,000 1,805,801 0.1
DenmarkDenmarkDenmarkDenmark (0.2%)
TDC A/S 457,626 3,519,594 0.2
FinlandFinlandFinlandFinland (0.2%)
Technopolis Oyj 149,404 717,518 0.0
UPM-Kymmene Oyj 350,523 3,915,927 0.2
FranceFranceFranceFrance (1.5%)
Air France-KLM CB 4.97%
1/4/15(Uts) EUR55,302 905,420 0.1
Alcatel-Lucent CB 5%
01/01/15 (Uts) EUR600,050 2,488,793 0.1
Cie de Saint-Gobain 94,095 3,491,912 0.2
Electricite de France (EDF) 200,498 3,849,019 0.2
ICADE SA 3,757 327,767 0.0
Peugeot SA CB 4.45%
01/01/16 (Uts) EUR87,810 2,756,904 0.2
Sanofi 65,845 6,700,710 0.3
Schneider Electric 58,680 4,292,746 0.2
Silicon On CB 6.25%
09/09/14 (Uts) EUR39,700 398,654 0.0
Total SA 80,703 3,870,607 0.2
GermanyGermanyGermanyGermany (1.0%)
Aabar Inv EB (DAI) 4%
27/5/16-RegS EUR500,000 678,533 0.0
Allianz SE-Regd 48,550 6,595,895 0.3
Alstria Office REIT 118,070 1,329,652 0.1
BASF SE 66,671 5,842,179 0.3
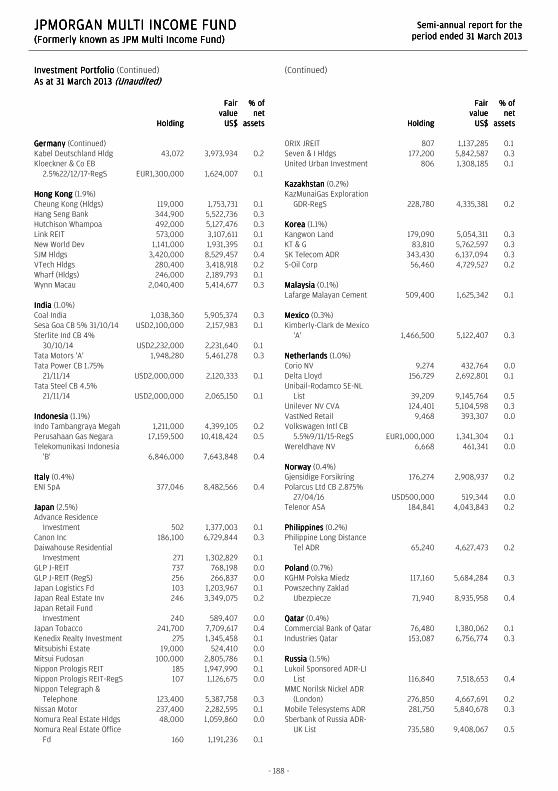
JPMORGAN MULTI INCOME FUNDJPMORGAN MULTI INCOME FUNDJPMORGAN MULTI INCOME FUNDJPMORGAN MULTI INCOME FUND (Formerly known as JPM Multi Income Fund)(Formerly known as JPM Multi Income Fund)(Formerly known as JPM Multi Income Fund)(Formerly known as JPM Multi Income Fund)
SemiSemiSemiSemi----annual report for theannual report for theannual report for theannual report for the
period ended 31 March 2013period ended 31 March 2013period ended 31 March 2013period ended 31 March 2013
- 188 -
Investment PortfolioInvestment PortfolioInvestment PortfolioInvestment Portfolio (Continued)
As at 31 March 2013As at 31 March 2013As at 31 March 2013As at 31 March 2013 (Unaudited)(Unaudited)(Unaudited)(Unaudited)
HoldingHoldingHoldingHolding
FairFairFairFair
valuevaluevaluevalue
US$US$US$US$
% of% of% of% of
netnetnetnet
assetsassetsassetsassets
GermanyGermanyGermanyGermany (Continued)
Kabel Deutschland Hldg 43,072 3,973,934 0.2
Kloeckner & Co EB
2.5%22/12/17-RegS EUR1,300,000 1,624,007 0.1
Hong KongHong KongHong KongHong Kong (1.9%)
Cheung Kong (Hldgs) 119,000 1,753,731 0.1
Hang Seng Bank 344,900 5,522,736 0.3
Hutchison Whampoa 492,000 5,127,476 0.3
Link REIT 573,000 3,107,611 0.1
New World Dev 1,141,000 1,931,395 0.1
SJM Hldgs 3,420,000 8,529,457 0.4
VTech Hldgs 280,400 3,418,918 0.2
Wharf (Hldgs) 246,000 2,189,793 0.1
Wynn Macau 2,040,400 5,414,677 0.3
IndiaIndiaIndiaIndia (1.0%)
Coal India 1,038,360 5,905,374 0.3
Sesa Goa CB 5% 31/10/14 USD2,100,000 2,157,983 0.1
Sterlite Ind CB 4%
30/10/14 USD2,232,000 2,231,640 0.1
Tata Motors 'A' 1,948,280 5,461,278 0.3
Tata Power CB 1.75%
21/11/14 USD2,000,000 2,120,333 0.1
Tata Steel CB 4.5%
21/11/14 USD2,000,000 2,065,150 0.1
IndonesiaIndonesiaIndonesiaIndonesia (1.1%)
Indo Tambangraya Megah 1,211,000 4,399,105 0.2
Perusahaan Gas Negara 17,159,500 10,418,424 0.5
Telekomunikasi Indonesia
'B' 6,846,000 7,643,848 0.4
ItalyItalyItalyItaly (0.4%)
ENI SpA 377,046 8,482,566 0.4
JapanJapanJapanJapan (2.5%)
Advance Residence
Investment 502 1,377,003 0.1
Canon Inc 186,100 6,729,844 0.3
Daiwahouse Residential
Investment 271 1,302,829 0.1
GLP J-REIT 737 768,198 0.0
GLP J-REIT (RegS) 256 266,837 0.0
Japan Logistics Fd 103 1,203,967 0.1
Japan Real Estate Inv 246 3,349,075 0.2
Japan Retail Fund
Investment 240 589,407 0.0
Japan Tobacco 241,700 7,709,617 0.4
Kenedix Realty Investment 275 1,345,458 0.1
Mitsubishi Estate 19,000 524,410 0.0
Mitsui Fudosan 100,000 2,805,786 0.1
Nippon Prologis REIT 185 1,947,990 0.1
Nippon Prologis REIT-RegS 107 1,126,675 0.0
Nippon Telegraph &
Telephone 123,400 5,387,758 0.3
Nissan Motor 237,400 2,282,595 0.1
Nomura Real Estate Hldgs 48,000 1,059,860 0.0
Nomura Real Estate Office
Fd 160 1,191,236 0.1
(Continued)
HoldingHoldingHoldingHolding
FairFairFairFair
valuevaluevaluevalue
US$US$US$US$
% of% of% of% of
netnetnetnet
assetsassetsassetsassets
ORIX JREIT 807 1,137,285 0.1
Seven & I Hldgs 177,200 5,842,587 0.3
United Urban Investment 806 1,308,185 0.1
KazakhstanKazakhstanKazakhstanKazakhstan (0.2%)
KazMunaiGas Exploration
GDR-RegS 228,780 4,335,381 0.2
KoreaKoreaKoreaKorea (1.1%)
Kangwon Land 179,090 5,054,311 0.3
KT & G 83,810 5,762,597 0.3
SK Telecom ADR 343,430 6,137,094 0.3
S-Oil Corp 56,460 4,729,527 0.2
MalaysiaMalaysiaMalaysiaMalaysia (0.1%)
Lafarge Malayan Cement 509,400 1,625,342 0.1
MexicoMexicoMexicoMexico (0.3%)
Kimberly-Clark de Mexico
'A' 1,466,500 5,122,407 0.3
NetherlandsNetherlandsNetherlandsNetherlands (1.0%)
Corio NV 9,274 432,764 0.0
Delta Lloyd 156,729 2,692,801 0.1
Unibail-Rodamco SE-NL
List 39,209 9,145,764 0.5
Unilever NV CVA 124,401 5,104,598 0.3
VastNed Retail 9,468 393,307 0.0
Volkswagen Intl CB
5.5%9/11/15-RegS EUR1,000,000 1,341,304 0.1
Wereldhave NV 6,668 461,341 0.0
NorwayNorwayNorwayNorway (0.4%)
Gjensidige Forsikring 176,274 2,908,937 0.2
Polarcus Ltd CB 2.875%
27/04/16 USD500,000 519,344 0.0
Telenor ASA 184,841 4,043,843 0.2
PhilippinesPhilippinesPhilippinesPhilippines (0.2%)
Philippine Long Distance
Tel ADR 65,240 4,627,473 0.2
PolandPolandPolandPoland (0.7%)
KGHM Polska Miedz 117,160 5,684,284 0.3
Powszechny Zaklad
Ubezpiecze 71,940 8,935,958 0.4
QatarQatarQatarQatar (0.4%)
Commercial Bank of Qatar 76,480 1,380,062 0.1
Industries Qatar 153,087 6,756,774 0.3
RussiaRussiaRussiaRussia (1.5%)
Lukoil Sponsored ADR-LI
List 116,840 7,518,653 0.4
MMC Norilsk Nickel ADR
(London) 276,850 4,667,691 0.2
Mobile Telesystems ADR 281,750 5,840,678 0.3
Sberbank of Russia ADR-
UK List 735,580 9,408,067 0.5

JPMORGAN MULTI INCOME FUNDJPMORGAN MULTI INCOME FUNDJPMORGAN MULTI INCOME FUNDJPMORGAN MULTI INCOME FUND (Formerly known as JPM Multi Income Fund)(Formerly known as JPM Multi Income Fund)(Formerly known as JPM Multi Income Fund)(Formerly known as JPM Multi Income Fund)
SemiSemiSemiSemi----annual report for theannual report for theannual report for theannual report for the
period ended 31 March 2013period ended 31 March 2013period ended 31 March 2013period ended 31 March 2013
- 189 -
Investment PortfolioInvestment PortfolioInvestment PortfolioInvestment Portfolio (Continued)
As at 31 March 2013As at 31 March 2013As at 31 March 2013As at 31 March 2013 (Unaudited)(Unaudited)(Unaudited)(Unaudited)
HoldingHoldingHoldingHolding
FairFairFairFair
valuevaluevaluevalue
US$US$US$US$
% of% of% of% of
netnetnetnet
assetsassetsassetsassets
RussiaRussiaRussiaRussia (Continued)
TMK Bonds CB 5.25%
11/02/15 USD2,500,000 2,498,507 0.1
SingaporeSingaporeSingaporeSingapore (1.2%)
Ascendas India Trust 3,142,000 2,076,769 0.1
Ascendas Real Estate Inv
Trust 338,000 705,642 0.0
Cambridge Industrial Trust 1,567,000 991,532 0.1
CapitaCommercial Trust 345,000 440,775 0.0
CapitaLand Ltd 215,000 611,760 0.0
CapitaMalls Asia 523,000 864,219 0.0
Global Logistics Properties 592,000 1,250,234 0.1
Hutchison Port Hldgs
Trust-USD 7,396,000 6,286,600 0.3
Keppel Corp 319,000 2,879,897 0.2
Keppel Land 61,000 193,729 0.0
Singapore Telecom 2,417,000 6,994,220 0.4
South AfricaSouth AfricaSouth AfricaSouth Africa (2.9%)
African Bank Investments 691,827 2,272,043 0.1
Anglogold Ash Conv Pref
6% 15/09/13 20,150 573,872 0.0
Bidvest Group 240,509 6,353,488 0.3
Exxaro Resources 180,230 3,207,992 0.2
Foschini Group 550,690 6,770,741 0.3
Growthpoint Properties
(Units) 1,239,610 3,617,041 0.2
Impala Platinum CB 1%
21/02/18 USD400,000 377,656 0.0
Impala Platinum CB 5%
21/02/18(Uts) ZAR200 216,370 0.0
Imperial Hldgs 438,928 10,007,679 0.5
Kumba Iron Ore 92,030 4,935,010 0.3
MTN Group 344,490 6,056,253 0.3
Sasol Ltd 137,930 6,118,897 0.3
Steinhoff Fin CB (SHF)
4.5% 31/3/18 EUR1,500,000 2,008,396 0.1
Tiger Brands 180,830 5,794,397 0.3
SpainSpainSpainSpain (0.2%)
Melia Hotels CB 4.5%
04/04/18 EUR900,000 1,132,576 0.1
Melia Hotels CB 5%
18/12/14 EUR600,000 794,410 0.0
OHL Investment CB 4%
25/04/18-RegS EUR900,000 1,155,690 0.1
SwedenSwedenSwedenSweden (0.6%)
Ericsson (LM) Tel 'B' 375,524 4,686,831 0.3
Swedbank AB 'A' 272,891 6,220,001 0.3
SwitzerlandSwitzerlandSwitzerlandSwitzerland (1.3%)
Nestle SA-Regd 54,267 3,934,135 0.2
Novartis AG-Regd 65,848 4,686,789 0.2
Roche Hldg (Genusschein) 40,259 9,395,679 0.5
Swiss Re 100,094 8,160,152 0.4
TaiwanTaiwanTaiwanTaiwan (2.2%)
Delta Electronics 1,726,000 7,359,417 0.4
(Continued)
HoldingHoldingHoldingHolding
FairFairFairFair
valuevaluevaluevalue
US$US$US$US$
% of% of% of% of
netnetnetnet
assetsassetsassetsassets
Far EasTone Telecom 1,300,000 2,986,707 0.1
Novatek Microelectronics 1,709,000 7,401,236 0.4
President Chain Store 927,000 5,130,625 0.2
Quanta Computer 3,182,000 7,065,789 0.3
Taiwan Mobile 1,554,300 5,275,862 0.3
Taiwan Semiconductor
Mfg ADR 345,170 5,933,472 0.3
Tripod Technology 1,472,000 3,239,114 0.2
ThailandThailandThailandThailand (0.6%)
Advanced Information (F) 850,600 6,970,940 0.4
Siam Cement NVDR 234,300 3,904,333 0.2
TurkeyTurkeyTurkeyTurkey (0.7%)
Arcelik AS 363,040 2,598,159 0.1
Ford Otomotiv Sanayi 164,340 2,388,584 0.1
Tupras-Turkiye Petrol
Rafinerileri 321,180 9,717,935 0.5
United KingdomUnited KingdomUnited KingdomUnited Kingdom (3.3%)
British Land 248,446 2,048,483 0.1
Centrica plc 954,218 5,327,724 0.3
Diageo plc 119,442 3,758,825 0.2
GlaxoSmithKline plc 251,001 5,863,723 0.3
Hammerson plc 211,239 1,576,515 0.1
Helical Bar 186,480 664,012 0.0
HSBC Hldgs-UK List 549,425 5,860,778 0.3
Land Securities Group 13,162 165,683 0.0
Old Mutual-SA List 1,755,824 5,408,454 0.3
Pearson plc 239,006 4,293,328 0.2
Rio Tinto-UK List 98,767 4,626,659 0.2
Royal Dutch Shell 'A'-UK
List 321,034 10,375,885 0.5
SABMiller plc 59,251 3,116,550 0.2
Safestore Hldgs 632,763 1,121,756 0.0
Segro plc 160,250 618,792 0.0
TUI Travel CB 4.9%
27/04/17 GBP700,000 1,210,599 0.1
TUI Travel CB 6%
05/10/14 GBP700,000 1,201,934 0.1
Vedanta Resources CB
5.5% 13/07/16 USD2,400,000 2,472,167 0.1
Vodafone Group-UK List 1,923,262 5,449,424 0.3
United StatesUnited StatesUnited StatesUnited States (12.0%)
Advanced Micro Devices
CB 6% 1/5/15 USD715,000 723,966 0.0
American Campus
Communities 18,500 838,605 0.0
American Tower 18,412 1,416,067 0.1
Annaly Capital Mgt CB 5%
15/05/15 USD1,605,000 1,694,758 0.1
Apartment Inv & Mgmt 'A' 52,300 1,602,995 0.1
Apple Inc 5,980 2,645,731 0.1
ArcelorMittal NV CB 6%
15/1/16(Uts) USD102,723 2,152,047 0.1
Ares Capital CB 4.75%
15/01/18-144A USD1,225,000 1,298,493 0.1
Ares Capital CB 4.875%
15/03/17 USD1,000,000 1,079,347 0.1

JPMORGAN MULTI INCOME FUNDJPMORGAN MULTI INCOME FUNDJPMORGAN MULTI INCOME FUNDJPMORGAN MULTI INCOME FUND (Formerly known as JPM Multi Income Fund)(Formerly known as JPM Multi Income Fund)(Formerly known as JPM Multi Income Fund)(Formerly known as JPM Multi Income Fund)
SemiSemiSemiSemi----annual report for theannual report for theannual report for theannual report for the
period ended 31 March 2013period ended 31 March 2013period ended 31 March 2013period ended 31 March 2013
- 190 -
Investment PortfolioInvestment PortfolioInvestment PortfolioInvestment Portfolio (Continued)
As at 31 March 2013As at 31 March 2013As at 31 March 2013As at 31 March 2013 (Unaudited)(Unaudited)(Unaudited)(Unaudited)
HoldingHoldingHoldingHolding
FairFairFairFair
valuevaluevaluevalue
US$US$US$US$
% of% of% of% of
netnetnetnet
assetsassetsassetsassets
United StatesUnited StatesUnited StatesUnited States (Continued)
Ares Capital CB 5.125%
01/06/16 USD436,000 472,333 0.0
Avalonbay Communities 4,100 519,142 0.0
Bank Of America Conv
Pref 7.25%Perp 2,438 2,969,484 0.2
Bank of New York Mellon
Pref 'C' 212,200 5,366,538 0.3
BB&T Corp Deposit Pref 'F' 128,400 3,224,124 0.2
BB&T Corp Pref 'E' 37,200 950,088 0.1
Biomed Realty Trust 50,300 1,085,474 0.1
Boston Properties 6,364 643,019 0.0
Boston Properties Pref 39,000 973,050 0.1
Bristol Myers Squibb 113,638 4,678,476 0.2
Bunge Ltd Conv Pref
4.875% Perp 8,000 846,280 0.0
Camden Property Trust 8,400 576,828 0.0
CBL & Associates
Properties 42,400 1,000,640 0.1
Chesapeake Energy CB
2.25% 15/12/38 USD1,947,000 1,735,037 0.1
Chevron Corp 41,770 4,961,023 0.3
Cisco Systems 222,475 4,647,503 0.2
Cliffs Natural Res Dep Cnv
Pref 'A' 87,585 1,625,578 0.1
CME Group 'A' 106,992 6,566,099 0.3
ConocoPhillips 134,312 8,068,121 0.4
Corporate Office
Properties Trust 16,300 434,721 0.0
CubeSmart 27,200 429,216 0.0
Dendreon Corp CB 2.875%
15/01/16 USD150,000 118,672 0.0
Digital Realty Trust 14,000 936,600 0.0
Discover Fin Serv Dep Pref
'B' 175,200 4,523,664 0.2
Dow Chemical 145,820 4,641,451 0.2
DryShips Inc CB 5%
01/12/14 USD1,065,000 946,963 0.1
Duke Energy Pref 115,200 2,924,928 0.1
Duke Realty 125,700 2,133,129 0.1
DuPont Fabros Technology 15,600 378,456 0.0
Education Realty Trust 34,600 363,992 0.0
Emerson Electric 118,588 6,621,954 0.3
Equity One 67,500 1,617,975 0.1
First Potomac Realty Trust 27,000 400,140 0.0
General Motors Pref 'B' 5,550 238,317 0.0
Goldman Sachs Group Dep
Pref 'I' 240,000 6,069,600 0.3
Goodyear Tire Conv Pref
5.875% 4/14 37,250 1,620,748 0.1
HCP Inc 57,753 2,876,677 0.1
Health Care REIT 11,600 787,408 0.0
Health Care REIT Conv Prf
6.5% Perp 30,100 1,869,511 0.1
Healthcare Realty Trust 33,500 950,730 0.1
Hologic Inc CB Step 2%
15/12/43 USD683,000 719,737 0.0
Intel Corp CB 2.95%
15/12/35 USD2,896,000 3,095,152 0.2
Johnson & Johnson 95,036 7,742,582 0.4
(Continued)
HoldingHoldingHoldingHolding
FairFairFairFair
valuevaluevaluevalue
US$US$US$US$
% of% of% of% of
netnetnetnet
assetsassetsassetsassets
Kinder Morgan 110,711 4,281,194 0.2
Lasalle Hotel Properties 25,300 642,114 0.0
Liberty Property Trust 29,100 1,156,434 0.1
Masco Corp 226,056 4,575,373 0.2
Mattel Inc 62,359 2,729,453 0.1
McDonald's Corp 46,857 4,670,706 0.2
Merck & Co 131,353 5,805,803 0.3
Micron Technology CB
1.875% 1/06/27 USD900,000 949,500 0.1
Microsoft Corp 245,020 7,007,571 0.4
National Retail Properties 50,100 1,810,614 0.1
NextEra Energy Con Prf
5.889% 09/15 65,002 3,545,859 0.2
Nuvasive Inc CB 2.75%
01/07/17 USD1,734,000 1,693,901 0.1
Peabody Energy CB 4.75%
15/12/41 USD1,955,000 1,622,103 0.1
Pfizer Inc 94,387 2,722,121 0.1
Philip Morris Intl 62,964 5,837,392 0.3
Post Properties 12,500 588,750 0.0
PPL Corp Conv Pref 8.75%
01/05/14 52,700 2,938,025 0.2
Prologis Inc 9,600 383,616 0.0
Prospect Cap CB
5.375%15/10/17-144A USD390,000 416,046 0.0
Prospect Cap CB 5.5%
15/08/16 USD800,000 869,344 0.0
Prospect Cap CB 5.75%
15/03/18-144A USD607,000 632,746 0.0
Public Storage 9,700 1,476,243 0.1
RadioShack Corp CB 2.5%
1/8/13-144A USD779,000 764,095 0.0
Realty Income 39,900 1,807,071 0.1
Redwood Trust CB 4.625%
15/04/18 USD1,687,000 1,866,990 0.1
Regency Centers 17,500 925,225 0.0
SCE Trust II Preferred Secs 80,800 2,019,192 0.1
Sempra Energy 53,393 4,267,702 0.2
Ship Finance Intl CB 3.25%
1/2/18 USD561,000 577,183 0.0
Simon Property Group 13,457 2,133,742 0.1
Starwood Prop CB 4.55%
01/03/18 USD1,527,000 1,685,717 0.1
State Street Pref 'C' 209,200 5,294,852 0.3
Sunpower Corp CB 4.5%
15/03/15 USD970,000 967,211 0.1
Sunpower Corp CB 4.75%
15/04/14 USD1,241,000 1,269,834 0.1
Take-Two Int CB 1.75%
01/12/16 USD660,000 759,779 0.0
Time Warner 204,580 11,787,899 0.6
United Tech Conv Pref
7.5% 01/08/15 19,640 1,175,454 0.1
United Technologies 41,699 3,895,521 0.2
Ventas Inc 30,288 2,215,567 0.1
Verizon Communications 134,145 6,583,837 0.3
WellPoint Inc CB
2.75%15/10/42-144A USD2,801,000 3,098,257 0.2
Wells Fargo & Co 167,087 6,175,536 0.3

JPMORGAN MULTI INCOME FUNDJPMORGAN MULTI INCOME FUNDJPMORGAN MULTI INCOME FUNDJPMORGAN MULTI INCOME FUND (Formerly known as JPM Multi Income Fund)(Formerly known as JPM Multi Income Fund)(Formerly known as JPM Multi Income Fund)(Formerly known as JPM Multi Income Fund)
SemiSemiSemiSemi----annual report for theannual report for theannual report for theannual report for the
period ended 31 March 2013period ended 31 March 2013period ended 31 March 2013period ended 31 March 2013
- 191 -
Investment PortfolioInvestment PortfolioInvestment PortfolioInvestment Portfolio (Continued)
As at 31 March 2013As at 31 March 2013As at 31 March 2013As at 31 March 2013 (Unaudited)(Unaudited)(Unaudited)(Unaudited)
HoldingHoldingHoldingHolding
FairFairFairFair
valuevaluevaluevalue
US$US$US$US$
% of% of% of% of
netnetnetnet
assetsassetsassetsassets
United StatesUnited StatesUnited StatesUnited States (Continued)
Wells Fargo Conv Pref
7.5% Perp-L 2,371 3,055,626 0.2
Williams Co 83,521 3,127,026 0.2
976,738,361 49.3
--------- ----
(II) Debt Securities(II) Debt Securities(II) Debt Securities(II) Debt Securities (44.4%)
ArgentinaArgentinaArgentinaArgentina (0.2%)
Prov Buenos Aires
10.875% 1/21-RegS USD4,832,000 3,430,418 0.2
Rep of Argentina 8.28%
31/12/33 USD1,536,092 1,156,254 0.0
ArubaArubaArubaAruba (0.3%)
Aruba Govt Of 4.625%
14/09/23-RegS USD5,270,000 5,466,547 0.3
AustraliaAustraliaAustraliaAustralia (0.2%)
Ausdrill Fin 6.875%
01/11/19-144A USD325,000 340,045 0.0
Ausdrill Fin 6.875%
01/11/19-RegS USD200,000 209,265 0.0
FMG Res (Aug2006) 6%
01/04/17-144A USD200,000 212,000 0.0
FMG Res (Aug2006) 6%
01/04/17-RegS USD16,000 16,946 0.0
FMG Res (Aug2006)
6.875% 04/22-144A USD700,000 762,563 0.0
FMG Res (Aug2006)
6.875%1/2/18-RegS USD775,000 828,443 0.1
FMG Res (Aug2006) 7%
01/11/15-RegS USD145,000 155,580 0.0
FMG Res (Aug2006)
8.25%1/11/19-144A USD950,000 1,073,149 0.1
Nufarm Aust 6.375%
15/10/19-RegS USD79,000 86,019 0.0
AustriaAustriaAustriaAustria (0.0%)
ESAL GMBH 6.25%
05/02/23-144A USD200,000 201,958 0.0
AzerbaijanAzerbaijanAzerbaijanAzerbaijan (0.1%)
State Oil of Azerb 4.75%
13/03/23 USD1,870,000 1,841,963 0.1
BahamasBahamasBahamasBahamas (0.0%)
Ultrapetrol Bahamas 9%
24/11/14 USD202,000 208,844 0.0
BermudaBermudaBermudaBermuda (0.1%)
Aircastle Ltd 6.25%
01/12/19 USD320,000 356,378 0.0
Aircastle Ltd 7.625%
15/04/20 USD575,000 685,901 0.1
Aircastle Ltd 9.75%
01/08/18 USD325,000 375,781 0.0
(Continued)
HoldingHoldingHoldingHolding
FairFairFairFair
valuevaluevaluevalue
US$US$US$US$
% of% of% of% of
netnetnetnet
assetsassetsassetsassets
Seadrill Ltd 5.625%
15/09/17-RegS USD200,000 202,531 0.0
BrazilBrazilBrazilBrazil (0.7%)
Fed Rep of Brazil 11%
17/08/40 USD11,185,000 13,885,618 0.7
CanadaCanadaCanadaCanada (0.6%)
Ainsworth Lumber 7.5%
15/12/17-144A USD85,000 94,872 0.0
Bombardier Inc 6.125%
15/01/23-144A USD1,023,000 1,072,381 0.1
Bombardier Inc 7.75%
15/03/20-144A USD650,000 749,879 0.0
Brookfield Resident 6.5%
12/20-144A USD372,000 407,080 0.0
Cascades Inc 7.75%
15/12/17 USD200,000 217,607 0.0
Garda World Sec 9.75%
15/03/17-144A USD710,000 761,939 0.1
Garda World Sec 9.75%
15/03/17-RegS USD100,000 105,480 0.0
Hub Intl 8.125% 15/10/18-
RegS USD120,000 130,354 0.0
Inmet Mining 7.5%
01/06/21-144A USD155,000 171,533 0.0
Inmet Mining 8.75%
01/06/20-144A USD490,000 554,517 0.0
Kodiak Oil 5.5% 15/01/21-
144A USD180,000 188,868 0.0
Kodiak Oil 8.125%
01/12/19 USD500,000 580,732 0.0
Masonite Intl 8.25%
15/04/21-144A USD285,000 327,257 0.0
Masonite Intl 8.25%
15/04/21-RegS USD150,000 172,241 0.0
Mattamy Group 6.5%
15/11/20-144A USD278,000 283,487 0.0
MEG Energy 6.375%
30/01/23-144A USD865,000 909,097 0.1
MEG Energy 6.375%
30/01/23-RegS USD99,000 104,047 0.0
MEG Energy 6.5%
15/03/21-144A USD400,000 427,228 0.0
Mood Media 9.25%
15/10/20-144A USD130,000 145,845 0.0
New Gold 6.25% 15/11/22-
144A USD100,000 107,436 0.0
New Gold 7% 15/04/20-
RegS USD24,000 26,649 0.0
Novelis Inc 8.75%
15/12/20 USD750,000 866,068 0.1
Precision Drilling 6.5%
15/12/21 USD700,000 760,774 0.0
Precision Drilling 6.625%
15/11/20 USD250,000 274,428 0.0
Quebecor Media 5.75%
15/01/23-144A USD1,347,000 1,400,328 0.1
Taseko Mines 7.75%
15/04/19 USD275,000 287,122 0.0

JPMORGAN MULTI INCOME FUNDJPMORGAN MULTI INCOME FUNDJPMORGAN MULTI INCOME FUNDJPMORGAN MULTI INCOME FUND (Formerly known as JPM Multi Income Fund)(Formerly known as JPM Multi Income Fund)(Formerly known as JPM Multi Income Fund)(Formerly known as JPM Multi Income Fund)
SemiSemiSemiSemi----annual report for theannual report for theannual report for theannual report for the
period ended 31 March 2013period ended 31 March 2013period ended 31 March 2013period ended 31 March 2013
- 192 -
Investment PortfolioInvestment PortfolioInvestment PortfolioInvestment Portfolio (Continued)
As at 31 March 2013As at 31 March 2013As at 31 March 2013As at 31 March 2013 (Unaudited)(Unaudited)(Unaudited)(Unaudited)
HoldingHoldingHoldingHolding
FairFairFairFair
valuevaluevaluevalue
US$US$US$US$
% of% of% of% of
netnetnetnet
assetsassetsassetsassets
CanadaCanadaCanadaCanada (Continued)
Telesat Canada/LLC 6%
15/05/17-RegS USD156,000 166,777 0.0
Trinidad Drill 7.875%
15/01/19-144A USD825,000 902,386 0.1
Trinidad Drill 7.875%
15/01/19-RegS USD425,000 464,866 0.0
Cayman IslandsCayman IslandsCayman IslandsCayman Islands (0.2%)
Seagate HDD Cayman
6.875% 01/05/20 USD620,000 688,600 0.0
Shelf Drilling 8.625%
01/11/18-144A USD150,000 163,553 0.0
Studio City Fin 8.5%
01/12/20-144A USD700,000 788,025 0.0
UPCB Finance III 6.625%
1/7/20-144A USD750,000 819,566 0.1
UPCB Finance V 7.25%
15/11/21-144A USD950,000 1,075,961 0.1
UPCB Finance VI 6.875%
01/22-144A USD550,000 605,234 0.0
Costa RicaCosta RicaCosta RicaCosta Rica (0.6%)
Banco Costa Rica 9.995%
1/8/20-RegS USD7,915,000 10,975,401 0.6
Dominican RepublicDominican RepublicDominican RepublicDominican Republic (0.9%)
Banco Resv Rep Domin 7%
1/2/23-RegS USD2,730,000 2,789,150 0.2
Dominican Republic
9.04% 01/18-RegS USD11,758,333 14,504,643 0.7
El SalvadorEl SalvadorEl SalvadorEl Salvador (0.2%)
Rep of El Salvador 7.75%
01/23-RegS USD2,950,000 3,605,310 0.2
FinlandFinlandFinlandFinland (0.0%)
Nokia Corp 5.375%
15/05/19 USD281,000 273,462 0.0
Nokia Corp 6.625%
15/05/39 USD143,000 135,094 0.0
FranceFranceFranceFrance (0.2%)
Electric France VRN 5.25%
Perp-144A USD2,940,000 2,919,677 0.2
Lafarge SA 7.125%
15/07/36 USD110,000 119,585 0.0
Rexel SA 5.25% 15/06/20-
144A USD357,000 359,249 0.0
Rexel SA 6.125% 15/12/19-
RegS USD200,000 215,141 0.0
GeorgiaGeorgiaGeorgiaGeorgia (0.4%)
Georgian Railway 7.75%
11/7/22-RegS USD6,470,000 7,488,621 0.4
GermanyGermanyGermanyGermany (0.0%)
Unitymedia Hes/NRW
5.5% 01/23-144A USD615,000 637,448 0.0
(Continued)
HoldingHoldingHoldingHolding
FairFairFairFair
valuevaluevaluevalue
US$US$US$US$
% of% of% of% of
netnetnetnet
assetsassetsassetsassets
GhanaGhanaGhanaGhana (0.6%)
Citigroup Inc CLN 23%
23/08/17 USD1,500,000 1,415,850 0.1
Rep of Ghana 8.5%
04/10/17-RegS USD7,330,000 8,700,914 0.4
Standard Bank CLN 21%
28/10/15 USD1,360,000 1,496,680 0.1
HondurasHondurasHondurasHonduras (0.0%)
Honduras Govt 7.5%
15/03/24-RegS USD820,000 845,225 0.0
HungaryHungaryHungaryHungary (0.7%)
Rep of Hungary 7.625%
29/03/41 USD12,850,000 13,623,839 0.7
IndonesiaIndonesiaIndonesiaIndonesia (1.1%)
Rep of Indonesia 11.625%
03/19-RegS USD14,683,000 21,571,407 1.1
IraqIraqIraqIraq (0.6%)
Rep of Iraq 5.8%
15/01/28-RegS USD12,630,000 11,714,395 0.6
IrelandIrelandIrelandIreland (0.3%)
Ardagh Pack Fin/MP
4.875%11/22-144A USD350,000 347,973 0.0
Ardagh Pack Fin/MP 7%
15/11/20-144A USD200,000 207,644 0.0
Ardagh Pack Fin/MP
9.125%10/20-144A USD350,000 396,315 0.0
Ardagh Pack Fin/MP
9.125%10/20-RegS USD200,000 227,466 0.0
Ardagh Packaging 7.375%
10/17-144A USD600,000 677,308 0.0
Ardagh Packaging 7.375%
10/17-RegS USD600,000 677,547 0.1
Ardagh Packaging 9.125%
10/20-144A USD2,200,000 2,491,126 0.1
Ardagh Packaging 9.125%
10/20-RegS USD225,000 257,587 0.0
Elan Finance 6.25%
15/10/19-144A USD665,000 798,831 0.1
VIP Fin Ireland 7.748%
2/2/21-144A USD400,000 455,005 0.0
JapanJapanJapanJapan (0.0%)
eAccess Ltd 8.25%
01/04/18-144A USD450,000 518,063 0.0
KazakhstanKazakhstanKazakhstanKazakhstan (0.7%)
KazMunaiGaz Fin 11.75%
01/15-RegS USD11,650,000 13,747,243 0.7
LuxembourgLuxembourgLuxembourgLuxembourg (1.8%)
Altice Financing 7.875%
12/19-144A USD200,000 222,433 0.0
Aperam SA 7.375%
01/04/16-144A USD300,000 312,188 0.0

JPMORGAN MULTI INCOME FUNDJPMORGAN MULTI INCOME FUNDJPMORGAN MULTI INCOME FUNDJPMORGAN MULTI INCOME FUND (Formerly known as JPM Multi Income Fund)(Formerly known as JPM Multi Income Fund)(Formerly known as JPM Multi Income Fund)(Formerly known as JPM Multi Income Fund)
SemiSemiSemiSemi----annual report for theannual report for theannual report for theannual report for the
period ended 31 March 2013period ended 31 March 2013period ended 31 March 2013period ended 31 March 2013
- 193 -
Investment PortfolioInvestment PortfolioInvestment PortfolioInvestment Portfolio (Continued)
As at 31 March 2013As at 31 March 2013As at 31 March 2013As at 31 March 2013 (Unaudited)(Unaudited)(Unaudited)(Unaudited)
HoldingHoldingHoldingHolding
FairFairFairFair
valuevaluevaluevalue
US$US$US$US$
% of% of% of% of
netnetnetnet
assetsassetsassetsassets
LuxembourgLuxembourgLuxembourgLuxembourg (Continued)
Aperam SA 7.75%
01/04/18-144A USD300,000 308,625 0.0
Arcelormittal 7.5%
15/10/39 USD1,000,000 1,079,792 0.1
ArcelorMittal Stp Cpn
10.35% 1/6/19 USD1,000,000 1,288,200 0.1
ArcelorMittal Stp Cpn 5%
25/2/17 USD1,200,000 1,264,679 0.1
ArcelorMittal Stp Cpn
6.75% 25/2/22 USD2,160,000 2,385,585 0.1
ArcelorMittal Stp Cpn
7.25% 1/3/41 USD1,000,000 1,003,546 0.1
Intelsat Jackson 6.625%
12/22-144A USD2,230,000 2,440,046 0.1
Intelsat Jackson 7.25%
15/10/20 USD1,680,000 1,904,502 0.1
Intelsat Jackson 7.5%
01/04/21 USD2,200,000 2,541,000 0.1
Intelsat Jackson 8.5%
01/11/19 USD70,000 81,142 0.0
Intelsat Lux 11.25%
04/02/17 USD771,000 833,403 0.0
Intelsat Lux 11.25%
04/02/17-PO3/13 USD284,000 306,986 0.0
Intelsat Lux 11.5%
04/02/17 USD1,623,197 1,749,017 0.1
Intelsat Lux 11.5%
04/02/17-PO03/13 USD791,803 853,179 0.1
Intelsat Lux 6.75%
01/06/18-144A USD180,000 185,634 0.0
Intelsat Lux 7.75%
01/06/21-144A USD1,026,000 1,041,390 0.1
Intelsat Lux 8.125%
01/06/23-144A USD587,000 595,805 0.0
NII Intl Telecom 11.375%
08/19-144A USD518,000 550,938 0.0
RSHB Capital 9%
11/06/14-RegS USD10,305,000 11,399,906 0.6
Trinseo Materials 8.75%
1/2/19-144A USD679,000 695,581 0.0
Wind Acquisition
11.75%15/7/17-144A USD800,000 864,106 0.1
Wind Acquisition
12.25%15/7/17-144A USD300,000 320,790 0.0
Wind Acquisition 7.25%
15/2/18-144A USD625,000 666,494 0.0
Wind Acquisition 7.25%
15/2/18-RegS USD200,000 212,838 0.0
Wind Acquisition 7.25%
15/2/18-RegS USD400,000 425,036 0.0
Marshall Marshall Marshall Marshall IslandIslandIslandIsland (0.0%)
Navigator Hldgs 9%
18/12/17-RegS USD200,000 207,082 0.0
Navios S A Log/Fin 9.25%
04/19-144A USD218,000 242,614 0.0
Navios S A Log/Fin 9.25%
15/04/19 USD393,000 436,391 0.0
(Continued)
HoldingHoldingHoldingHolding
FairFairFairFair
valuevaluevaluevalue
US$US$US$US$
% of% of% of% of
netnetnetnet
assetsassetsassetsassets
MexicoMexicoMexicoMexico (0.1%)
Cemex SAB 5.875%
25/03/19-144A USD350,000 354,110 0.0
Cemex SAB 9% 11/01/18-
RegS USD800,000 902,280 0.1
Grupo Cementos 8.125%
08/02/20-144A USD300,000 327,300 0.0
Kansas City Southern
6.125% 15/6/21 USD50,000 57,384 0.0
Kansas City Southern
6.625%15/12/20 USD150,000 172,525 0.0
NetherlandsNetherlandsNetherlandsNetherlands (0.4%)
Bluewater Hldgs FRN
17/07/14-144A USD1,000,000 961,725 0.1
Koninklijke KPN VRN 7%
28/3/73-144A USD2,110,000 2,079,991 0.1
Lyondellbasell Ind 5%
15/04/19 USD900,000 1,039,000 0.1
Lyondellbasell Ind 5.75%
15/04/24 USD200,000 240,335 0.0
Lyondellbasell Ind 6%
15/11/21 USD400,000 484,633 0.0
Montell Fin 8.1%
15/03/27-144A USD355,000 473,087 0.0
NXP BV/NXP Fdg 5.75%
15/02/21-144A USD700,000 728,117 0.1
NXP BV/NXP Fdg 5.75%
15/03/23-144A USD200,000 204,639 0.0
NXP BV/NXP Fdg 9.75%
01/08/18-144A USD142,000 164,188 0.0
OSX 3 Leasing 9.25%
20/03/15 USD125,000 123,798 0.0
Royal Bk Scotland NV FRN
09/03/15 USD10,000 9,514 0.0
Sensata Tech 6.5%
15/05/19-144A USD310,000 342,468 0.0
VimpelCom Hldgs 5.2%
13/02/19-144A USD295,000 298,740 0.0
VimpelCom Hldgs 5.95%
13/02/23-144A USD200,000 200,620 0.0
NigeriaNigeriaNigeriaNigeria (0.1%)
Citigroup Inc CLN 16.39%
01/22-RegS USD1,500,000 1,619,985 0.1
SEA Trucks 9% 26/03/18-
144A/RegS USD300,000 301,944 0.0
NorwayNorwayNorwayNorway (0.0%)
Petroleum Geo-Ser
7.375% 12/18-144A USD201,000 226,511 0.0
PhilippinesPhilippinesPhilippinesPhilippines (0.6%)
Philippines Rep of
10.625% 16/03/25 USD7,590,000 12,759,718 0.6
RomaniaRomaniaRomaniaRomania (0.9%)
Romania 6.75% 07/02/22-
RegS USD15,060,000 17,650,508 0.9

JPMORGAN MULTI INCOME FUNDJPMORGAN MULTI INCOME FUNDJPMORGAN MULTI INCOME FUNDJPMORGAN MULTI INCOME FUND (Formerly known as JPM Multi Income Fund)(Formerly known as JPM Multi Income Fund)(Formerly known as JPM Multi Income Fund)(Formerly known as JPM Multi Income Fund)
SemiSemiSemiSemi----annual report for theannual report for theannual report for theannual report for the
period ended 31 March 2013period ended 31 March 2013period ended 31 March 2013period ended 31 March 2013
- 194 -
Investment PortfolioInvestment PortfolioInvestment PortfolioInvestment Portfolio (Continued)
As at 31 March 2013As at 31 March 2013As at 31 March 2013As at 31 March 2013 (Unaudited)(Unaudited)(Unaudited)(Unaudited)
HoldingHoldingHoldingHolding
FairFairFairFair
valuevaluevaluevalue
US$US$US$US$
% of% of% of% of
netnetnetnet
assetsassetsassetsassets
RussiaRussiaRussiaRussia (1.0%)
Russia 12.75% 24/06/28-
RegS USD10,045,000 19,567,744 1.0
SerbiaSerbiaSerbiaSerbia (0.8%)
Rep of Serbia 7.25%
28/09/21-RegS USD14,740,000 16,371,080 0.8
SpainSpainSpainSpain (0.0%)
Cemex Espana 9.25%
12/05/20-144A USD200,000 228,240 0.0
Cemex Espana 9.25%
12/05/20-RegS USD125,000 142,909 0.0
Cemex Espana 9.875%
30/04/19-144A USD400,000 477,458 0.0
SupranationalSupranationalSupranationalSupranational (0.3%)
Eurasian Dev Bk 7.375%
29/9/14-RegS USD5,550,000 6,188,192 0.3
SwedenSwedenSwedenSweden (0.0%)
Skandinaviska VRN
5.471% Perp-144A USD230,000 233,190 0.0
UkraineUkraineUkraineUkraine (0.5%)
Ukraine Govt 9.25%
24/07/17-RegS USD8,120,000 8,903,354 0.5
United KingdomUnited KingdomUnited KingdomUnited Kingdom (0.4%)
Barclays Bank 10.179%
12/06/21-144A USD95,000 130,682 0.0
Barclays Bank 6.05%
04/12/17-144A USD380,000 431,637 0.0
Barclays Bank 7.625%
21/11/22 USD500,000 506,223 0.0
CEVA Group 8.375%
01/12/17-144A USD250,000 262,544 0.0
Hanson Ltd 6.125%
15/08/16 USD200,000 222,492 0.0
INEOS Finance 8.375%
15/02/19-144A USD1,700,000 1,892,498 0.1
Inmarsat Fin 7.375%
01/12/17-RegS USD200,000 218,417 0.0
Jaguar Land 5.625%
01/02/23-144A USD150,000 157,970 0.0
Royal Bk Scotland Grp
5.05% 8/1/15 USD30,000 31,438 0.0
Royal Bk Scotland Grp
6.125% 12/22 USD1,148,000 1,212,904 0.1
Royal Bk Scotland VRN
7.648% Perp USD630,000 659,408 0.1
Royal Bk Scotland VRN
9.5% 16/03/22 USD483,000 558,697 0.0
Standard Chart PLC VRN
Perp-144A USD1,500,000 1,617,720 0.1
Virgin Media Fin 8.375%
15/10/19 USD134,000 155,492 0.0
(Continued)
HoldingHoldingHoldingHolding
FairFairFairFair
valuevaluevaluevalue
US$US$US$US$
% of% of% of% of
netnetnetnet
assetsassetsassetsassets
United StatesUnited StatesUnited StatesUnited States (27.3%)
99 Cents Only Stores 11%
15/12/19 USD165,000 194,732 0.0
Acadia Healthcare 6.125%
03/21-144A USD216,000 223,215 0.0
Accellent Inc 8.375%
01/02/17 USD500,000 538,229 0.0
Access Midstream 4.875%
15/05/23 USD554,000 554,913 0.0
Access Midstream 6.125%
15/07/22 USD1,028,000 1,117,930 0.1
ACE Cash Express 11%
01/02/19-144A USD765,000 775,200 0.1
ACE Cash Express 11%
01/02/19-RegS USD200,000 202,667 0.0
ACL I 10.625% 15/02/16 USD713,053 762,162 0.1
Actuant Corp 5.625%
15/06/22 USD110,000 115,689 0.0
Advanced Micro Devices
7.75% 1/8/20 USD215,000 200,577 0.0
Advanced Micro Devices
8.125% 12/17 USD10,000 10,329 0.0
AES Corp 7.375% 01/07/21 USD100,000 117,844 0.0
AES Corp 8% 01/06/20 USD200,000 243,333 0.0
AES Corp 8% 15/10/17 USD450,000 543,034 0.0
Affinia Group 9% 30/11/14 USD500,000 516,500 0.0
AK Steel 7.625% 15/05/20 USD135,000 121,479 0.0
AK Steel 8.75% 01/12/18-
144A USD595,000 672,102 0.0
Alcatel-Lucent USA 6.45%
15/03/29 USD925,000 724,317 0.1
Allbritton Commun 8%
15/05/18 USD100,000 111,544 0.0
Alliance One Intl 10%
15/07/16 USD115,000 124,446 0.0
Alliant Techsystems
6.875% 15/9/20 USD100,000 108,700 0.0
Allison Trans 7.125%
15/05/19-144A USD750,000 826,586 0.1
Ally Financial 4.625%
26/06/15 USD1,000 1,066 0.0
Ally Financial 5.5%
15/02/17 USD1,828,000 1,999,979 0.1
Ally Financial 6.25%
01/12/17 USD1,745,000 1,995,117 0.1
Ally Financial 7.5%
15/09/20 USD1,290,000 1,581,594 0.1
Ally Financial 8% 01/11/31 USD2,255,000 2,923,412 0.2
Ally Financial 8%
15/03/20 USD894,000 1,114,172 0.1
Alpha Natural Res 6%
01/06/19 USD114,000 108,102 0.0
Alpha Natural Res 6.25%
01/06/21 USD338,000 312,932 0.0
Alpha Natural Res 9.75%
15/04/18 USD250,000 280,953 0.0
Alphabet Hldgs 7.75%
01/11/17-144A USD65,000 70,071 0.0
Alta Mesa Hldgs/Fin
9.625% 15/10/18 USD337,000 373,109 0.0
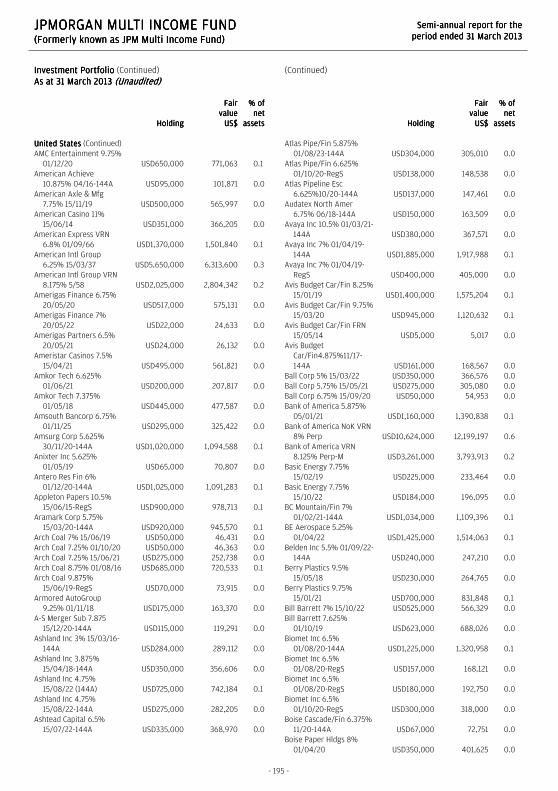
JPMORGAN MULTI INCOME FUNDJPMORGAN MULTI INCOME FUNDJPMORGAN MULTI INCOME FUNDJPMORGAN MULTI INCOME FUND (Formerly known as JPM Multi Income Fund)(Formerly known as JPM Multi Income Fund)(Formerly known as JPM Multi Income Fund)(Formerly known as JPM Multi Income Fund)
SemiSemiSemiSemi----annual report for theannual report for theannual report for theannual report for the
period ended 31 March 2013period ended 31 March 2013period ended 31 March 2013period ended 31 March 2013
- 195 -
Investment PortfolioInvestment PortfolioInvestment PortfolioInvestment Portfolio (Continued)
As at 31 March 2013As at 31 March 2013As at 31 March 2013As at 31 March 2013 (Unaudited)(Unaudited)(Unaudited)(Unaudited)
HoldingHoldingHoldingHolding
FairFairFairFair
valuevaluevaluevalue
US$US$US$US$
% of% of% of% of
netnetnetnet
assetsassetsassetsassets
United StatesUnited StatesUnited StatesUnited States (Continued)
AMC Entertainment 9.75%
01/12/20 USD650,000 771,063 0.1
American Achieve
10.875% 04/16-144A USD95,000 101,871 0.0
American Axle & Mfg
7.75% 15/11/19 USD500,000 565,997 0.0
American Casino 11%
15/06/14 USD351,000 366,205 0.0
American Express VRN
6.8% 01/09/66 USD1,370,000 1,501,840 0.1
American Intl Group
6.25% 15/03/37 USD5,650,000 6,313,600 0.3
American Intl Group VRN
8.175% 5/58 USD2,025,000 2,804,342 0.2
Amerigas Finance 6.75%
20/05/20 USD517,000 575,131 0.0
Amerigas Finance 7%
20/05/22 USD22,000 24,633 0.0
Amerigas Partners 6.5%
20/05/21 USD24,000 26,132 0.0
Ameristar Casinos 7.5%
15/04/21 USD495,000 561,821 0.0
Amkor Tech 6.625%
01/06/21 USD200,000 207,817 0.0
Amkor Tech 7.375%
01/05/18 USD445,000 477,587 0.0
Amsouth Bancorp 6.75%
01/11/25 USD295,000 325,422 0.0
Amsurg Corp 5.625%
30/11/20-144A USD1,020,000 1,094,588 0.1
Anixter Inc 5.625%
01/05/19 USD65,000 70,807 0.0
Antero Res Fin 6%
01/12/20-144A USD1,025,000 1,091,283 0.1
Appleton Papers 10.5%
15/06/15-RegS USD900,000 978,713 0.1
Aramark Corp 5.75%
15/03/20-144A USD920,000 945,570 0.1
Arch Coal 7% 15/06/19 USD50,000 46,431 0.0
Arch Coal 7.25% 01/10/20 USD50,000 46,363 0.0
Arch Coal 7.25% 15/06/21 USD275,000 252,738 0.0
Arch Coal 8.75% 01/08/16 USD685,000 720,533 0.1
Arch Coal 9.875%
15/06/19-RegS USD70,000 73,915 0.0
Armored AutoGroup
9.25% 01/11/18 USD175,000 163,370 0.0
A-S Merger Sub 7.875
15/12/20-144A USD115,000 119,291 0.0
Ashland Inc 3% 15/03/16-
144A USD284,000 289,112 0.0
Ashland Inc 3.875%
15/04/18-144A USD350,000 356,606 0.0
Ashland Inc 4.75%
15/08/22 (144A) USD725,000 742,184 0.1
Ashland Inc 4.75%
15/08/22-144A USD275,000 282,205 0.0
Ashtead Capital 6.5%
15/07/22-144A USD335,000 368,970 0.0
(Continued)
HoldingHoldingHoldingHolding
FairFairFairFair
valuevaluevaluevalue
US$US$US$US$
% of% of% of% of
netnetnetnet
assetsassetsassetsassets
Atlas Pipe/Fin 5.875%
01/08/23-144A USD304,000 305,010 0.0
Atlas Pipe/Fin 6.625%
01/10/20-RegS USD138,000 148,538 0.0
Atlas Pipeline Esc
6.625%10/20-144A USD137,000 147,461 0.0
Audatex North Amer
6.75% 06/18-144A USD150,000 163,509 0.0
Avaya Inc 10.5% 01/03/21-
144A USD380,000 367,571 0.0
Avaya Inc 7% 01/04/19-
144A USD1,885,000 1,917,988 0.1
Avaya Inc 7% 01/04/19-
RegS USD400,000 405,000 0.0
Avis Budget Car/Fin 8.25%
15/01/19 USD1,400,000 1,575,204 0.1
Avis Budget Car/Fin 9.75%
15/03/20 USD945,000 1,120,632 0.1
Avis Budget Car/Fin FRN
15/05/14 USD5,000 5,017 0.0
Avis Budget
Car/Fin4.875%11/17-
144A USD161,000 168,567 0.0
Ball Corp 5% 15/03/22 USD350,000 366,576 0.0
Ball Corp 5.75% 15/05/21 USD275,000 305,080 0.0
Ball Corp 6.75% 15/09/20 USD50,000 54,953 0.0
Bank of America 5.875%
05/01/21 USD1,160,000 1,390,838 0.1
Bank of America NoK VRN
8% Perp USD10,624,000 12,199,197 0.6
Bank of America VRN
8.125% Perp-M USD3,261,000 3,793,913 0.2
Basic Energy 7.75%
15/02/19 USD225,000 233,464 0.0
Basic Energy 7.75%
15/10/22 USD184,000 196,095 0.0
BC Mountain/Fin 7%
01/02/21-144A USD1,034,000 1,109,396 0.1
BE Aerospace 5.25%
01/04/22 USD1,425,000 1,514,063 0.1
Belden Inc 5.5% 01/09/22-
144A USD240,000 247,210 0.0
Berry Plastics 9.5%
15/05/18 USD230,000 264,765 0.0
Berry Plastics 9.75%
15/01/21 USD700,000 831,848 0.1
Bill Barrett 7% 15/10/22 USD525,000 566,329 0.0
Bill Barrett 7.625%
01/10/19 USD623,000 688,026 0.0
Biomet Inc 6.5%
01/08/20-144A USD1,225,000 1,320,958 0.1
Biomet Inc 6.5%
01/08/20-RegS USD157,000 168,121 0.0
Biomet Inc 6.5%
01/08/20-RegS USD180,000 192,750 0.0
Biomet Inc 6.5%
01/10/20-RegS USD300,000 318,000 0.0
Boise Cascade/Fin 6.375%
11/20-144A USD67,000 72,751 0.0
Boise Paper Hldgs 8%
01/04/20 USD350,000 401,625 0.0

JPMORGAN MULTI INCOME FUNDJPMORGAN MULTI INCOME FUNDJPMORGAN MULTI INCOME FUNDJPMORGAN MULTI INCOME FUND (Formerly known as JPM Multi Income Fund)(Formerly known as JPM Multi Income Fund)(Formerly known as JPM Multi Income Fund)(Formerly known as JPM Multi Income Fund)
SemiSemiSemiSemi----annual report for theannual report for theannual report for theannual report for the
period ended 31 March 2013period ended 31 March 2013period ended 31 March 2013period ended 31 March 2013
- 196 -
Investment PortfolioInvestment PortfolioInvestment PortfolioInvestment Portfolio (Continued)
As at 31 March 2013As at 31 March 2013As at 31 March 2013As at 31 March 2013 (Unaudited)(Unaudited)(Unaudited)(Unaudited)
HoldingHoldingHoldingHolding
FairFairFairFair
valuevaluevaluevalue
US$US$US$US$
% of% of% of% of
netnetnetnet
assetsassetsassetsassets
United StatesUnited StatesUnited StatesUnited States (Continued)
BreitBurn Ener/Fin
7.875% 15/04/22 USD250,000 276,633 0.0
BreitBurn Ener/Fin
8.625% 15/10/20 USD250,000 286,253 0.0
Brightstar Corp 9.5%
01/12/16-RegS USD395,000 435,158 0.0
Building Materials 6.75%
05/21-144A USD606,000 678,341 0.0
Building Materials 6.75%
05/21-RegS USD375,000 419,766 0.0
Bumble Bee Acq 9%
15/12/17-144A USD657,000 738,632 0.1
Burger King 9.875%
15/10/18 USD575,000 686,900 0.0
Burlington Hldgs/Fin
9%15/2/18-144A USD171,000 173,651 0.0
Cablevision Systems
5.875% 15/09/22 USD613,000 609,711 0.0
Cablevision Systems
7.75% 15/04/18 USD80,000 92,676 0.0
Cablevision Systems 8%
15/04/20 USD755,000 878,443 0.1
Caesars Entertain 11.25%
01/06/17 USD1,180,000 1,295,050 0.1
Caesars Entertain 8.5%
15/02/20 USD3,535,000 3,542,520 0.2
Caesars Oper/Escrow 9%
15/2/20-144A USD900,000 919,575 0.1
Caesars Oper/Escrow 9%
15/2/20-144a USD550,000 559,213 0.0
Calpine Corp 7.5%
15/02/21-144A USD500,000 553,046 0.0
Calpine Corp 7.5%
15/02/21-RegS USD553,000 612,332 0.0
Calpine Corp 7.875%
15/01/23-144A USD2,175,000 2,453,604 0.1
Calpine Corp 7.875%
31/07/20-144A USD765,000 851,066 0.1
Calpine Corp 7.875%
31/07/20-RegS USD408,000 457,215 0.0
Calumet Specialty 9.375%
01/05/19 USD100,000 115,906 0.0
Calumet Specialty 9.625%
08/20-144A USD175,000 201,432 0.0
Calumet Specialty 9.625%
08/20-RegS USD75,000 86,328 0.0
Cantor Comm Real 7.75%
02/18-144A USD220,000 223,468 0.0
Capella Healthcare 9.25%
01/07/17 USD51,000 56,514 0.0
Case New Holland 7.875%
01/12/17 USD725,000 873,081 0.1
Casella Waste 7.75%
15/02/19 USD150,000 145,143 0.0
Catalent Pharma
7.875%15/10/18-144A USD205,000 215,237 0.0
Catalent Pharma
7.875%15/10/18-RegS USD95,000 99,744 0.0
CB Richard Ellis 6.625%
15/10/20 USD195,000 217,568 0.0
(Continued)
HoldingHoldingHoldingHolding
FairFairFairFair
valuevaluevaluevalue
US$US$US$US$
% of% of% of% of
netnetnetnet
assetsassetsassetsassets
CBRE Services 5%
15/03/23 USD875,000 887,031 0.1
CCM Merger 9.125%
01/05/19-144A USD280,000 296,946 0.0
CCO Hldgs LLC/Cap 5.125%
15/02/23 USD228,000 222,971 0.0
CCO Hldgs LLC/Cap 5.25%
30/09/22 USD265,000 270,190 0.0
CCO Hldgs LLC/Cap
5.25%15/3/21-144A USD470,000 471,234 0.0
CCO Hldgs LLC/Cap 6.5%
30/04/21 USD1,366,000 1,480,327 0.1
CCO Hldgs LLC/Cap 7%
15/01/19 USD50,000 54,634 0.0
CCO Hldgs LLC/Cap
7.375% 01/06/20 USD1,480,000 1,679,775 0.1
CCO Hldgs LLC/Cap
8.125% 30/04/20 USD275,000 316,747 0.0
CDW LLC/CDW Fin 8.5%
01/04/19 USD1,772,000 2,057,735 0.1
Cedar Fair/Canada 9.125%
01/08/18 USD30,000 34,056 0.0
Cedar Fair/Maguum 5.25%
03/21-144A USD210,000 210,009 0.0
Celanese US Hldgs 4.625%
15/11/22 USD290,000 291,735 0.0
Celanese US Hldgs 6.625%
15/10/18 USD225,000 250,196 0.0
Cemex Finance 9.375%
12/10/22-144A USD1,595,000 1,924,002 0.1
Cemex Finance 9.5%
14/12/16-RegS USD300,000 334,800 0.0
Central Garden 8.25%
01/03/18 USD1,295,000 1,343,643 0.1
Centurylink Inc 5.8%
15/03/22 USD1,300,000 1,316,691 0.1
Cenveo Corp 8.875%
01/02/18 USD1,000,000 1,015,422 0.1
Cequel Commun/Cap
8.625% 11/17-144A USD842,000 926,472 0.1
Cequel Commun/Cap
8.625% 11/17-RegS USD200,000 220,065 0.0
Ceridian Corp 11%
15/03/21-144A USD341,000 366,869 0.0
Ceridian Corp 8.875%
15/07/19-144A USD430,000 509,113 0.0
Ceridian Corp 8.875%
15/07/19-RegS USD60,000 71,039 0.0
Chemtura Corp 7.875%
01/09/18 USD610,000 662,441 0.0
Chesapeake Energy 3.25%
15/03/16 USD119,000 120,339 0.0
Chesapeake Energy
5.375% 15/06/21 USD300,000 301,317 0.0
Chesapeake Energy 5.75%
15/03/23 USD300,000 305,124 0.0
Chesapeake Energy
6.125% 15/02/21 USD700,000 750,559 0.1
Chesapeake Energy
6.625% 15/08/20 USD915,000 1,009,418 0.1
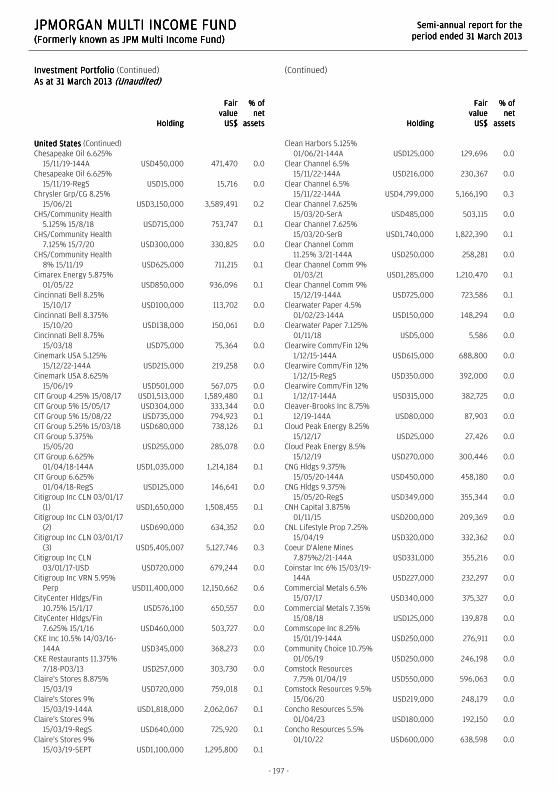
JPMORGAN MULTI INCOME FUNDJPMORGAN MULTI INCOME FUNDJPMORGAN MULTI INCOME FUNDJPMORGAN MULTI INCOME FUND (Formerly known as JPM Multi Income Fund)(Formerly known as JPM Multi Income Fund)(Formerly known as JPM Multi Income Fund)(Formerly known as JPM Multi Income Fund)
SemiSemiSemiSemi----annual report for theannual report for theannual report for theannual report for the
period ended 31 March 2013period ended 31 March 2013period ended 31 March 2013period ended 31 March 2013
- 197 -
Investment PortfolioInvestment PortfolioInvestment PortfolioInvestment Portfolio (Continued)
As at 31 March 2013As at 31 March 2013As at 31 March 2013As at 31 March 2013 (Unaudited)(Unaudited)(Unaudited)(Unaudited)
HoldingHoldingHoldingHolding
FairFairFairFair
valuevaluevaluevalue
US$US$US$US$
% of% of% of% of
netnetnetnet
assetsassetsassetsassets
United StatesUnited StatesUnited StatesUnited States (Continued)
Chesapeake Oil 6.625%
15/11/19-144A USD450,000 471,470 0.0
Chesapeake Oil 6.625%
15/11/19-RegS USD15,000 15,716 0.0
Chrysler Grp/CG 8.25%
15/06/21 USD3,150,000 3,589,491 0.2
CHS/Community Health
5.125% 15/8/18 USD715,000 753,747 0.1
CHS/Community Health
7.125% 15/7/20 USD300,000 330,825 0.0
CHS/Community Health
8% 15/11/19 USD625,000 711,215 0.1
Cimarex Energy 5.875%
01/05/22 USD850,000 936,096 0.1
Cincinnati Bell 8.25%
15/10/17 USD100,000 113,702 0.0
Cincinnati Bell 8.375%
15/10/20 USD138,000 150,061 0.0
Cincinnati Bell 8.75%
15/03/18 USD75,000 75,364 0.0
Cinemark USA 5.125%
15/12/22-144A USD215,000 219,258 0.0
Cinemark USA 8.625%
15/06/19 USD501,000 567,075 0.0
CIT Group 4.25% 15/08/17 USD1,513,000 1,589,480 0.1
CIT Group 5% 15/05/17 USD304,000 333,344 0.0
CIT Group 5% 15/08/22 USD735,000 794,923 0.1
CIT Group 5.25% 15/03/18 USD680,000 738,126 0.1
CIT Group 5.375%
15/05/20 USD255,000 285,078 0.0
CIT Group 6.625%
01/04/18-144A USD1,035,000 1,214,184 0.1
CIT Group 6.625%
01/04/18-RegS USD125,000 146,641 0.0
Citigroup Inc CLN 03/01/17
(1) USD1,650,000 1,508,455 0.1
Citigroup Inc CLN 03/01/17
(2) USD690,000 634,352 0.0
Citigroup Inc CLN 03/01/17
(3) USD5,405,007 5,127,746 0.3
Citigroup Inc CLN
03/01/17-USD USD720,000 679,244 0.0
Citigroup Inc VRN 5.95%
Perp USD11,400,000 12,150,662 0.6
CityCenter Hldgs/Fin
10.75% 15/1/17 USD576,100 650,557 0.0
CityCenter Hldgs/Fin
7.625% 15/1/16 USD460,000 503,727 0.0
CKE Inc 10.5% 14/03/16-
144A USD345,000 368,273 0.0
CKE Restaurants 11.375%
7/18-PO3/13 USD257,000 303,730 0.0
Claire's Stores 8.875%
15/03/19 USD720,000 759,018 0.1
Claire's Stores 9%
15/03/19-144A USD1,818,000 2,062,067 0.1
Claire's Stores 9%
15/03/19-RegS USD640,000 725,920 0.1
Claire's Stores 9%
15/03/19-SEPT USD1,100,000 1,295,800 0.1
(Continued)
HoldingHoldingHoldingHolding
FairFairFairFair
valuevaluevaluevalue
US$US$US$US$
% of% of% of% of
netnetnetnet
assetsassetsassetsassets
Clean Harbors 5.125%
01/06/21-144A USD125,000 129,696 0.0
Clear Channel 6.5%
15/11/22-144A USD216,000 230,367 0.0
Clear Channel 6.5%
15/11/22-144A USD4,799,000 5,166,190 0.3
Clear Channel 7.625%
15/03/20-SerA USD485,000 503,115 0.0
Clear Channel 7.625%
15/03/20-SerB USD1,740,000 1,822,390 0.1
Clear Channel Comm
11.25% 3/21-144A USD250,000 258,281 0.0
Clear Channel Comm 9%
01/03/21 USD1,285,000 1,210,470 0.1
Clear Channel Comm 9%
15/12/19-144A USD725,000 723,586 0.1
Clearwater Paper 4.5%
01/02/23-144A USD150,000 148,294 0.0
Clearwater Paper 7.125%
01/11/18 USD5,000 5,586 0.0
Clearwire Comm/Fin 12%
1/12/15-144A USD615,000 688,800 0.0
Clearwire Comm/Fin 12%
1/12/15-RegS USD350,000 392,000 0.0
Clearwire Comm/Fin 12%
1/12/17-144A USD315,000 382,725 0.0
Cleaver-Brooks Inc 8.75%
12/19-144A USD80,000 87,903 0.0
Cloud Peak Energy 8.25%
15/12/17 USD25,000 27,426 0.0
Cloud Peak Energy 8.5%
15/12/19 USD270,000 300,446 0.0
CNG Hldgs 9.375%
15/05/20-144A USD450,000 458,180 0.0
CNG Hldgs 9.375%
15/05/20-RegS USD349,000 355,344 0.0
CNH Capital 3.875%
01/11/15 USD200,000 209,369 0.0
CNL Lifestyle Prop 7.25%
15/04/19 USD320,000 332,362 0.0
Coeur D'Alene Mines
7.875%2/21-144A USD331,000 355,216 0.0
Coinstar Inc 6% 15/03/19-
144A USD227,000 232,297 0.0
Commercial Metals 6.5%
15/07/17 USD340,000 375,327 0.0
Commercial Metals 7.35%
15/08/18 USD125,000 139,878 0.0
Commscope Inc 8.25%
15/01/19-144A USD250,000 276,911 0.0
Community Choice 10.75%
01/05/19 USD250,000 246,198 0.0
Comstock Resources
7.75% 01/04/19 USD550,000 596,063 0.0
Comstock Resources 9.5%
15/06/20 USD219,000 248,179 0.0
Concho Resources 5.5%
01/04/23 USD180,000 192,150 0.0
Concho Resources 5.5%
01/10/22 USD600,000 638,598 0.0

JPMORGAN MULTI INCOME FUNDJPMORGAN MULTI INCOME FUNDJPMORGAN MULTI INCOME FUNDJPMORGAN MULTI INCOME FUND (Formerly known as JPM Multi Income Fund)(Formerly known as JPM Multi Income Fund)(Formerly known as JPM Multi Income Fund)(Formerly known as JPM Multi Income Fund)
SemiSemiSemiSemi----annual report for theannual report for theannual report for theannual report for the
period ended 31 March 2013period ended 31 March 2013period ended 31 March 2013period ended 31 March 2013
- 198 -
Investment PortfolioInvestment PortfolioInvestment PortfolioInvestment Portfolio (Continued)
As at 31 March 2013As at 31 March 2013As at 31 March 2013As at 31 March 2013 (Unaudited)(Unaudited)(Unaudited)(Unaudited)
HoldingHoldingHoldingHolding
FairFairFairFair
valuevaluevaluevalue
US$US$US$US$
% of% of% of% of
netnetnetnet
assetsassetsassetsassets
United StatesUnited StatesUnited StatesUnited States (Continued)
Concho Resources 6.5%
15/01/22 USD875,000 965,915 0.1
Concho Resources 7%
15/01/21 USD50,000 56,124 0.0
Consol Energy 6.375%
01/03/21 USD100,000 104,397 0.0
Consol Energy 8.25%
01/04/20 USD775,000 892,219 0.1
Constellation Brands 6%
01/05/22 USD325,000 365,570 0.0
Constellation Brands
7.25% 15/05/17 USD100,000 119,009 0.0
Continental Air 5.5%
29/10/20 USD300,000 321,704 0.0
Continental Air 7.875%
02/07/18 USD1,400,000 702,472 0.0
Continental Air 9.798%
01/04/21 USD1,700,000 1,293,492 0.1
Continental Air NoB 6.25%
11/04/20 USD100,000 108,219 0.0
Continental Res 5%
15/09/22 USD482,000 514,034 0.0
Continental Res 7.125%
01/04/21 USD275,000 321,234 0.0
Corrections Corp 4.125%
04/20-144A USD120,000 122,250 0.0
Corrections Corp 4.625%
05/23-144A USD123,000 125,460 0.0
Countrywide Cap 8.05%
06/27-Ser B USD100,000 130,018 0.0
Covanta Hldg 6.375%
01/10/22 USD347,000 388,423 0.0
Crestwood Midstream
7.75% 4/19-144A USD333,000 360,889 0.0
Cricket Commun 7.75%
15/10/20 USD1,386,000 1,428,899 0.1
Crosstex Energy/Fin
7.125%6/22-RegS USD214,000 230,853 0.0
Crosstex Energy/Fin
8.875% 15/02/18 USD650,000 713,594 0.1
Crown Amer LLC/Cap
4.5% 01/23-144A USD273,000 269,690 0.0
Crown Castle Intl 5.25%
15/01/23 USD531,000 553,888 0.0
CSC Hldgs 6.75% 15/11/21 USD210,000 240,857 0.0
CSC Hldgs 8.625%
15/02/19 USD600,000 726,756 0.1
CVR Ref/Coff Fin 6.5%
01/11/22-144A USD521,000 547,680 0.0
CyrusOne LP/Fin
6.375%15/11/22-144A USD249,000 267,270 0.0
Dana Hldg 6.5% 15/02/19 USD300,000 324,296 0.0
Dana Hldg 6.75% 15/02/21 USD100,000 110,381 0.0
DaVita HealthCare Part
6.375% 11/18 USD200,000 218,413 0.0
DaVita HealthCare Part
6.625% 11/20 USD1,050,000 1,169,316 0.1
Dean Foods 7% 01/06/16 USD54,000 61,033 0.0
(Continued)
HoldingHoldingHoldingHolding
FairFairFairFair
valuevaluevaluevalue
US$US$US$US$
% of% of% of% of
netnetnetnet
assetsassetsassetsassets
Dean Foods 9.75%
15/12/18 USD40,000 47,358 0.0
Del Monte 7.625%
15/02/19 USD1,025,000 1,081,841 0.1
Delta Air Lines 4.75%
07/05/20 USD80,000 88,331 0.0
Delta Air Lines 6.875%
7/05/19-144A USD94,000 101,890 0.0
Deluxe Corp 7% 15/03/19 USD760,000 827,112 0.1
Denbury Resources 8.25%
15/02/20 USD500,000 568,605 0.0
DigitalGlobe Inc 5.25%
1/2/21-144A USD318,000 318,398 0.0
DineEquity Inc 9.5%
30/10/18 USD310,000 366,030 0.0
Dish DBS 5% 15/03/23-
144A USD780,000 779,567 0.1
Dish DBS 5.875% 15/07/22 USD250,000 266,141 0.0
Dish DBS 6.75% 01/06/21 USD3,715,000 4,221,169 0.2
Dish DBS 7.875%
01/09/19 USD530,000 632,538 0.0
DJO Fin 7.75% 15/04/18 USD100,000 106,095 0.0
DJO Fin 8.75% 15/03/18 USD600,000 671,479 0.0
DR Horton 4.375%
15/09/22 USD165,000 163,691 0.0
DR Horton 5.625%
15/01/16 USD100,000 109,203 0.0
Dupont Fabros Tech 8.5%
15/12/17 USD300,000 330,829 0.0
Dycom Invest 7.125%
15/01/21 USD25,000 27,068 0.0
Dycom Invest 7.125%
15/01/21-144A USD180,000 194,893 0.0
E*Trade Financial 6%
15/11/17 USD80,000 86,005 0.0
E*Trade Financial 6.375%
15/11/19 USD195,000 211,122 0.0
El Paso 7.25% 01/06/18 USD400,000 469,167 0.0
Embarq Corp 7.995%
01/06/36 USD650,000 708,760 0.1
Emergency Medical
8.125% 01/06/19 USD425,000 476,885 0.0
Endo Health Solutions 7%
15/07/19 USD150,000 162,183 0.0
Endo Health Solutions 7%
15/12/20 USD325,000 353,293 0.0
Endo Health Solutions
7.25% 15/1/22 USD150,000 161,889 0.0
Energy Future/EFIH 10%
01/12/20 USD3,000,000 3,515,170 0.2
Energy Future/EFIH
11.75% 3/22-144A USD145,000 168,312 0.0
Energy Future/EFIH
11.75% 3/22-RegS USD122,000 141,614 0.0
Energy Future/EFIH
6.875% 8/17-144A USD400,000 425,590 0.0
Energy Future/EFIH
6.875% 8/17-RegS USD36,000 38,303 0.0
Energy XXI Gulf Coast
7.75% 15/6/19 USD60,000 66,032 0.0

JPMORGAN MULTI INCOME FUNDJPMORGAN MULTI INCOME FUNDJPMORGAN MULTI INCOME FUNDJPMORGAN MULTI INCOME FUND (Formerly known as JPM Multi Income Fund)(Formerly known as JPM Multi Income Fund)(Formerly known as JPM Multi Income Fund)(Formerly known as JPM Multi Income Fund)
SemiSemiSemiSemi----annual report for theannual report for theannual report for theannual report for the
period ended 31 March 2013period ended 31 March 2013period ended 31 March 2013period ended 31 March 2013
- 199 -
Investment PortfolioInvestment PortfolioInvestment PortfolioInvestment Portfolio (Continued)
As at 31 March 2013As at 31 March 2013As at 31 March 2013As at 31 March 2013 (Unaudited)(Unaudited)(Unaudited)(Unaudited)
HoldingHoldingHoldingHolding
FairFairFairFair
valuevaluevaluevalue
US$US$US$US$
% of% of% of% of
netnetnetnet
assetsassetsassetsassets
United StatesUnited StatesUnited StatesUnited States (Continued)
Energy XXI Gulf Coast
9.25%15/12/17 USD150,000 173,624 0.0
Enterprise Products NoB
VRN 15/1/68 USD1,345,000 1,565,950 0.1
EP Energy/EP Fin 6.875%
01/05/19 USD218,000 245,500 0.0
EP Energy/EP Fin 9.375%
01/05/20 USD1,334,000 1,587,877 0.1
EP Energy/Everest 7.75%
01/09/22 USD1,485,000 1,649,618 0.1
EPE Hldgs/EP Ene 8.125%
12/17-144A USD173,000 183,864 0.0
Epicor Software 8.625%
01/05/19 USD275,000 308,258 0.0
Equinix Inc 4.875%
01/04/20 USD370,000 377,365 0.0
Equinix Inc 8.125%
01/03/18 USD265,000 295,130 0.0
Esterline Technologies 7%
01/08/20 USD150,000 167,125 0.0
EV Energy Partners 8%
15/04/19 USD1,100,000 1,202,697 0.1
Exterran Part/Expl 6%
01/04/21-144A USD160,000 159,333 0.0
Felcor Lodging 6.75%
01/06/19 USD275,000 305,250 0.0
Ferrellgas LP/Fin 6.5%
01/05/21 USD600,000 634,250 0.0
Ferrellgas LP/Fin 9.125%
01/10/17 USD125,000 139,297 0.0
Fidelity & Guaranty
6.375%4/21-144A USD254,000 252,955 0.0
Fidelity Natl Info 5%
15/03/22 USD51,000 54,435 0.0
First Data 10.625%
15/06/21-144A USD285,000 288,563 0.0
First Data 11.25%
15/01/21-144A USD212,000 223,726 0.0
First Data 12.625%
15/01/21 USD728,000 810,580 0.1
First Data 6.75% 01/11/20-
144A USD3,475,000 3,778,628 0.2
First Data 6.75% 01/11/20-
RegS USD380,000 411,303 0.0
First Data 7.375%
15/06/19-RegS USD21,000 22,825 0.0
First Data 8.25% 15/01/21-
144A USD1,134,000 1,199,370 0.1
First Data 8.25% 15/01/21-
RegS USD243,000 257,008 0.0
First Data 8.75% 15/01/22-
144A USD2,150,000 2,308,488 0.1
First Data 8.75% 15/01/22-
RegS USD235,000 253,498 0.0
First Data 8.875%
15/08/20-144A USD500,000 563,293 0.0
First Data 8.875%
15/08/20-RegS USD100,000 112,659 0.0
(Continued)
HoldingHoldingHoldingHolding
FairFairFairFair
valuevaluevaluevalue
US$US$US$US$
% of% of% of% of
netnetnetnet
assetsassetsassetsassets
First Data 9.875%
24/09/15 USD200,000 215,125 0.0
Forest Oil 7.25% 15/06/19 USD870,000 891,766 0.1
Freescale Semicon
10.125% 3/18-144A USD250,000 278,070 0.0
Freescale Semicon
10.125% 3/18-RegS USD100,000 111,228 0.0
Freescale Semicon 8.05%
01/02/20 USD193,000 207,652 0.0
Freescale Semicon 9.25%
04/18-144A USD250,000 284,477 0.0
Freescale Semicon 9.25%
04/18-RegS USD210,000 238,961 0.0
Fresenius Medi 5.625%
31/07/19-144A USD625,000 694,922 0.0
Fresenius Medi 5.625%
31/07/19-RegS USD140,000 155,138 0.0
Fresenius Medi 5.75%
15/02/21-RegS USD290,000 323,352 0.0
Fresenius Medi 5.875%
31/01/22-144A USD920,000 1,035,958 0.1
Fresenius Medi 5.875%
31/01/22-RegS USD12,000 13,513 0.0
Frontier Commun 7.125%
15/01/23 USD446,000 463,942 0.0
Frontier Commun 7.625%
15/04/24 USD21,000 21,630 0.0
Frontier Commun 8.5%
15/04/20 USD425,000 494,607 0.0
Frontier Commun 8.75%
15/04/22 USD400,000 466,512 0.0
Frontier Commun 9.25%
01/07/21 USD175,000 204,859 0.0
FTI Consulting 6.75%
01/10/20 USD100,000 111,625 0.0
GCI Inc 8.625% 15/11/19 USD450,000 489,520 0.0
Gencorp Inc 7.125%
15/03/21-144A USD131,000 138,318 0.0
General Cable 5.75%
01/10/22-144A USD200,000 209,974 0.0
General Cable 5.75%
01/10/22-RegS USD68,000 71,391 0.0
General Elec Cap NoB VRN
6.25% Perp USD9,500,000 10,673,976 0.6
Genesis Energy/Fin 5.75%
02/21-144A USD325,000 335,928 0.0
Genesis Energy/Fin
7.875% 15/12/18 USD280,000 314,554 0.0
GenOn Energy 9.5%
15/10/18 USD125,000 153,165 0.0
GenOn Energy 9.875%
15/10/20 USD790,000 940,739 0.1
GEO Group 6.625%
15/02/21 USD600,000 665,568 0.0
Glatfelter 5.375%
15/10/20 USD220,000 236,330 0.0
Goldman Sachs Cap II FRN
01/06/43 USD1,790,000 1,519,038 0.1
Goodman Net Stp
Cpn13.125%7/18-RegS USD100,000 114,281 0.0

JPMORGAN MULTI INCOME FUNDJPMORGAN MULTI INCOME FUNDJPMORGAN MULTI INCOME FUNDJPMORGAN MULTI INCOME FUND (Formerly known as JPM Multi Income Fund)(Formerly known as JPM Multi Income Fund)(Formerly known as JPM Multi Income Fund)(Formerly known as JPM Multi Income Fund)
SemiSemiSemiSemi----annual report for theannual report for theannual report for theannual report for the
period ended 31 March 2013period ended 31 March 2013period ended 31 March 2013period ended 31 March 2013
- 200 -
Investment PortfolioInvestment PortfolioInvestment PortfolioInvestment Portfolio (Continued)
As at 31 March 2013As at 31 March 2013As at 31 March 2013As at 31 March 2013 (Unaudited)(Unaudited)(Unaudited)(Unaudited)
HoldingHoldingHoldingHolding
FairFairFairFair
valuevaluevaluevalue
US$US$US$US$
% of% of% of% of
netnetnetnet
assetsassetsassetsassets
United StatesUnited StatesUnited StatesUnited States (Continued)
Goodman Networks
13.125% 07/18-144A USD290,000 331,416 0.0
Goodyear Tire 7%
15/05/22 USD2,144,000 2,322,700 0.1
Goodyear Tire 8.75%
15/08/20 USD1,100,000 1,274,816 0.1
Graphic Packaging 4.75%
15/04/21 USD571,000 580,993 0.0
Graton Economic 9.625%
1/9/19-144A USD475,000 536,191 0.0
Graton Economic 9.625%
1/9/19-RegS USD88,000 99,556 0.0
Gray Television 7.5%
01/10/20 USD915,000 1,005,166 0.1
Great Lakes Dredge
7.375% 01/02/19 USD500,000 533,646 0.0
Griffon Corp 7.125%
01/04/18 USD100,000 111,563 0.0
Gymboree Corp 9.125%
01/12/18 USD265,000 258,056 0.0
H&E Equipment Serv 7%
01/09/22-144A USD890,000 983,598 0.1
H&E Equipment Serv 7%
01/09/22-RegS USD94,000 103,768 0.0
Hanesbrands Inc 6.375%
15/12/20 USD500,000 553,874 0.0
Harland Clarke 9.75%
01/08/18-144A USD975,000 1,051,781 0.1
Harland Clarke FRN
15/05/15 USD865,000 837,176 0.1
Harron Comm 9.125%
01/04/20-144A USD295,000 340,909 0.0
Hartford Fin VRN 8.125%
15/06/38 USD150,000 180,484 0.0
Hawk Acquisition
4.25%15/10/20-144A USD2,060,000 2,063,502 0.1
HCA Hldgs 6.25% 15/02/21 USD455,000 494,307 0.0
HCA Hldgs 7.75% 15/05/21 USD1,150,000 1,319,042 0.1
HCA Inc 4.75% 01/05/23 USD320,000 326,681 0.0
HCA Inc 5.875% 15/03/22 USD1,940,000 2,091,697 0.1
HCA Inc 6.5% 15/02/20 USD2,150,000 2,447,745 0.1
HCA Inc 7.25% 15/09/20 USD225,000 249,817 0.0
HCA Inc 7.5% 15/02/22 USD4,332,000 5,062,989 0.3
HCA Inc 7.875% 15/02/20 USD130,000 150,105 0.0
HCA Inc No1 5.875%
01/05/23 USD595,000 637,214 0.0
HD Supply 10.5% 15/01/21 USD274,000 291,034 0.0
HD Supply 7.5% 15/07/20-
144A USD690,000 740,025 0.1
HD Supply 8.125%
15/04/19 USD1,784,000 2,083,161 0.1
HDTFS Inc 6.25% 15/10/22 USD889,000 990,185 0.1
Health Management
6.125% 15/04/16 USD200,000 225,043 0.0
Health Management
7.375% 15/01/20 USD1,090,000 1,213,153 0.1
Healthsouth Corp 7.75%
15/09/22 USD203,000 221,505 0.0
(Continued)
HoldingHoldingHoldingHolding
FairFairFairFair
valuevaluevaluevalue
US$US$US$US$
% of% of% of% of
netnetnetnet
assetsassetsassetsassets
Hertz Corp 4.25%
01/04/18-144A USD67,000 68,204 0.0
Hertz Corp 5.875%
15/10/20 USD1,355,000 1,469,620 0.1
Hertz Corp 6.75%
15/04/19 USD100,000 112,381 0.0
Hertz Corp 7.375%
15/01/21 USD225,000 254,422 0.0
Hertz Corp 7.5% 15/10/18 USD50,000 57,146 0.0
Hexion US Fin 6.625%
15/04/20 USD300,000 310,345 0.0
Hexion US/Nova Scot
6.625%4/20-144A USD750,000 774,924 0.1
Hexion US/Nova Scot
8.875% 01/02/18 USD200,000 210,458 0.0
Hiland Part/Fin 7.25%
01/10/20-144A USD400,000 452,628 0.0
Hiland Part/Fin 7.25%
01/10/20-RegS USD66,000 74,684 0.0
Hilcorp Energy/Fin 7.625%
4/21-144A USD600,000 682,723 0.0
Hilcorp Energy/Fin 7.625%
4/21-RegS USD425,000 483,595 0.0
Hilcorp Energy/Fin 8%
15/02/20-144A USD175,000 193,890 0.0
Holly Energy 6.5%
01/03/20-RegS USD105,000 112,451 0.0
Holly Energy 8.25%
15/3/18 USD500,000 543,198 0.0
Hologic Inc 6.25% 8/20-
144A-PO03/13 USD200,000 214,833 0.0
Hologic Inc 6.25% 8/20-
RegS-PO03/13 USD110,000 118,158 0.0
Hub Intl 8.125% 15/10/18-
144A USD475,000 518,360 0.0
Hughes Satellite 6.5%
15/06/19 USD100,000 111,682 0.0
Huntsman Intl 4.875%
15/11/20 USD200,000 207,102 0.0
Huntsman Intl 8.625%
15/03/21 USD600,000 675,944 0.0
Iasis Healthcare/Cap
8.375% 15/5/19 USD194,000 210,407 0.0
IGate Corp 9% 01/05/16 USD385,000 435,820 0.0
Igloo Hldgs 8.25%
15/12/17-144A USD358,000 379,957 0.0
ILFC E-Capital FRN
21/12/65-144A USD910,000 808,926 0.1
ILFC E-Capital FRN
21/12/65-RegS USD1,185,000 1,053,382 0.1
IMS Health 6% 01/11/20-
144A USD525,000 561,794 0.0
Inergy Midstream/NRGM
6% 12/20-144A USD95,000 100,740 0.0
Infor US 9.375% 01/04/19 USD988,000 1,165,223 0.1
Ingles Markets 8.875%
15/05/17 USD250,000 270,319 0.0
Interactive Data 10.25%
01/08/18 USD200,000 230,917 0.0
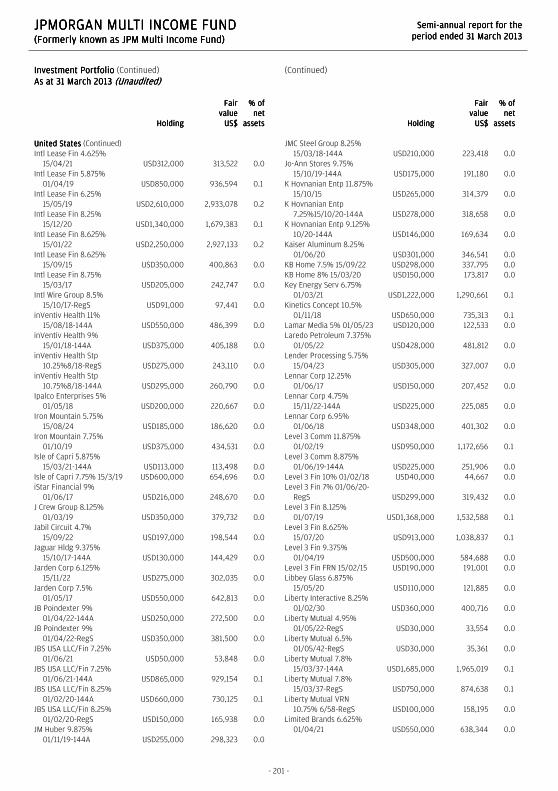
JPMORGAN MULTI INCOME FUNDJPMORGAN MULTI INCOME FUNDJPMORGAN MULTI INCOME FUNDJPMORGAN MULTI INCOME FUND (Formerly known as JPM Multi Income Fund)(Formerly known as JPM Multi Income Fund)(Formerly known as JPM Multi Income Fund)(Formerly known as JPM Multi Income Fund)
SemiSemiSemiSemi----annual report for theannual report for theannual report for theannual report for the
period ended 31 March 2013period ended 31 March 2013period ended 31 March 2013period ended 31 March 2013
- 201 -
Investment PortfolioInvestment PortfolioInvestment PortfolioInvestment Portfolio (Continued)
As at 31 March 2013As at 31 March 2013As at 31 March 2013As at 31 March 2013 (Unaudited)(Unaudited)(Unaudited)(Unaudited)
HoldingHoldingHoldingHolding
FairFairFairFair
valuevaluevaluevalue
US$US$US$US$
%%%% ofofofof
netnetnetnet
assetsassetsassetsassets
United StatesUnited StatesUnited StatesUnited States (Continued)
Intl Lease Fin 4.625%
15/04/21 USD312,000 313,522 0.0
Intl Lease Fin 5.875%
01/04/19 USD850,000 936,594 0.1
Intl Lease Fin 6.25%
15/05/19 USD2,610,000 2,933,078 0.2
Intl Lease Fin 8.25%
15/12/20 USD1,340,000 1,679,383 0.1
Intl Lease Fin 8.625%
15/01/22 USD2,250,000 2,927,133 0.2
Intl Lease Fin 8.625%
15/09/15 USD350,000 400,863 0.0
Intl Lease Fin 8.75%
15/03/17 USD205,000 242,747 0.0
Intl Wire Group 8.5%
15/10/17-RegS USD91,000 97,441 0.0
inVentiv Health 11%
15/08/18-144A USD550,000 486,399 0.0
inVentiv Health 9%
15/01/18-144A USD375,000 405,188 0.0
inVentiv Health Stp
10.25%8/18-RegS USD275,000 243,110 0.0
inVentiv Health Stp
10.75%8/18-144A USD295,000 260,790 0.0
Ipalco Enterprises 5%
01/05/18 USD200,000 220,667 0.0
Iron Mountain 5.75%
15/08/24 USD185,000 186,620 0.0
Iron Mountain 7.75%
01/10/19 USD375,000 434,531 0.0
Isle of Capri 5.875%
15/03/21-144A USD113,000 113,498 0.0
Isle of Capri 7.75% 15/3/19 USD600,000 654,696 0.0
iStar Financial 9%
01/06/17 USD216,000 248,670 0.0
J Crew Group 8.125%
01/03/19 USD350,000 379,732 0.0
Jabil Circuit 4.7%
15/09/22 USD197,000 198,544 0.0
Jaguar Hldg 9.375%
15/10/17-144A USD130,000 144,429 0.0
Jarden Corp 6.125%
15/11/22 USD275,000 302,035 0.0
Jarden Corp 7.5%
01/05/17 USD550,000 642,813 0.0
JB Poindexter 9%
01/04/22-144A USD250,000 272,500 0.0
JB Poindexter 9%
01/04/22-RegS USD350,000 381,500 0.0
JBS USA LLC/Fin 7.25%
01/06/21 USD50,000 53,848 0.0
JBS USA LLC/Fin 7.25%
01/06/21-144A USD865,000 929,154 0.1
JBS USA LLC/Fin 8.25%
01/02/20-144A USD660,000 730,125 0.1
JBS USA LLC/Fin 8.25%
01/02/20-RegS USD150,000 165,938 0.0
JM Huber 9.875%
01/11/19-144A USD255,000 298,323 0.0
(Continued)
HoldingHoldingHoldingHolding
FairFairFairFair
valuevaluevaluevalue
US$US$US$US$
% of% of% of% of
netnetnetnet
assetsassetsassetsassets
JMC Steel Group 8.25%
15/03/18-144A USD210,000 223,418 0.0
Jo-Ann Stores 9.75%
15/10/19-144A USD175,000 191,180 0.0
K Hovnanian Entp 11.875%
15/10/15 USD265,000 314,379 0.0
K Hovnanian Entp
7.25%15/10/20-144A USD278,000 318,658 0.0
K Hovnanian Entp 9.125%
10/20-144A USD146,000 169,634 0.0
Kaiser Aluminum 8.25%
01/06/20 USD301,000 346,541 0.0
KB Home 7.5% 15/09/22 USD298,000 337,795 0.0
KB Home 8% 15/03/20 USD150,000 173,817 0.0
Key Energy Serv 6.75%
01/03/21 USD1,222,000 1,290,661 0.1
Kinetics Concept 10.5%
01/11/18 USD650,000 735,313 0.1
Lamar Media 5% 01/05/23 USD120,000 122,533 0.0
Laredo Petroleum 7.375%
01/05/22 USD428,000 481,812 0.0
Lender Processing 5.75%
15/04/23 USD305,000 327,007 0.0
Lennar Corp 12.25%
01/06/17 USD150,000 207,452 0.0
Lennar Corp 4.75%
15/11/22-144A USD225,000 225,085 0.0
Lennar Corp 6.95%
01/06/18 USD348,000 401,302 0.0
Level 3 Comm 11.875%
01/02/19 USD950,000 1,172,656 0.1
Level 3 Comm 8.875%
01/06/19-144A USD225,000 251,906 0.0
Level 3 Fin 10% 01/02/18 USD40,000 44,667 0.0
Level 3 Fin 7% 01/06/20-
RegS USD299,000 319,432 0.0
Level 3 Fin 8.125%
01/07/19 USD1,368,000 1,532,588 0.1
Level 3 Fin 8.625%
15/07/20 USD913,000 1,038,837 0.1
Level 3 Fin 9.375%
01/04/19 USD500,000 584,688 0.0
Level 3 Fin FRN 15/02/15 USD190,000 191,001 0.0
Libbey Glass 6.875%
15/05/20 USD110,000 121,885 0.0
Liberty Interactive 8.25%
01/02/30 USD360,000 400,716 0.0
Liberty Mutual 4.95%
01/05/22-RegS USD30,000 33,554 0.0
Liberty Mutual 6.5%
01/05/42-RegS USD30,000 35,361 0.0
Liberty Mutual 7.8%
15/03/37-144A USD1,685,000 1,965,019 0.1
Liberty Mutual 7.8%
15/03/37-RegS USD750,000 874,638 0.1
Liberty Mutual VRN
10.75% 6/58-RegS USD100,000 158,195 0.0
Limited Brands 6.625%
01/04/21 USD550,000 638,344 0.0

JPMORGAN MULTI INCOME FUNDJPMORGAN MULTI INCOME FUNDJPMORGAN MULTI INCOME FUNDJPMORGAN MULTI INCOME FUND (Formerly known as JPM Multi Income Fund)(Formerly known as JPM Multi Income Fund)(Formerly known as JPM Multi Income Fund)(Formerly known as JPM Multi Income Fund)
SemiSemiSemiSemi----annual report for theannual report for theannual report for theannual report for the
period ended 31 March 2013period ended 31 March 2013period ended 31 March 2013period ended 31 March 2013
- 202 -
Investment Investment Investment Investment PortfolioPortfolioPortfolioPortfolio (Continued)
As at 31 March 2013As at 31 March 2013As at 31 March 2013As at 31 March 2013 (Unaudited)(Unaudited)(Unaudited)(Unaudited)
HoldingHoldingHoldingHolding
FairFairFairFair
valuevaluevaluevalue
US$US$US$US$
% of% of% of% of
netnetnetnet
assetsassetsassetsassets
United StatesUnited StatesUnited StatesUnited States (Continued)
Linn Energy 6.25%
01/11/19-144A USD950,000 1,000,865 0.1
Linn Energy 7.75%
01/02/21 USD525,000 570,234 0.0
Louisiana Pacific 7.5%
01/06/20 USD67,000 77,888 0.0
Lynx I 5.375% 15/04/21-
144A USD1,399,000 1,449,325 0.1
Lynx II 6.375% 15/04/23-
144A USD200,000 210,917 0.0
M/I Homes 8.625%
15/11/18 USD640,000 730,607 0.1
Manitowoc Co 8.5%
01/11/20 USD600,000 701,500 0.0
Marina District Fin 9.875%
15/08/18 USD550,000 586,274 0.0
Markwest Energy 4.5%
15/07/23 USD220,000 218,372 0.0
Markwest Energy 5.5%
15/02/23 USD1,250,000 1,319,138 0.1
Markwest Energy 6.25%
15/06/22 USD9,000 9,904 0.0
Markwest Energy 6.75%
01/11/20 USD75,000 84,047 0.0
Martin Midstream 7.25%
15/2/21-144A USD244,000 246,506 0.0
Masco Corp 5.95%
15/03/22 USD75,000 84,873 0.0
Masco Corp 7.125%
15/03/20 USD10,000 11,709 0.0
Mastec Inc 4.875%
15/03/23 USD170,000 168,835 0.0
McGraw-Hill Global 9.75%
4/21-144A USD401,000 400,081 0.0
MDC Hldgs 6% 15/01/43 USD97,000 96,386 0.0
Media General 11.75%
15/02/17 USD250,000 287,585 0.0
Mediacom Broadband
6.375 04/23-RegS USD125,000 134,581 0.0
Mediacom LLC/Cap 7.25%
15/02/22 USD150,000 166,795 0.0
Mediacom LLC/Cap
9.125% 15/08/19 USD310,000 350,118 0.0
Meritage Homes 7%
01/04/22 USD161,000 185,150 0.0
Meritage Homes 7.15%
15/04/20 USD114,000 131,176 0.0
Metlife Inc 6.4% 15/12/36 USD6,945,000 7,750,774 0.4
MetroPCS Wireless 6.25%
1/4/21-144A USD1,284,000 1,312,578 0.1
MetroPCS Wireless 6.625%
15/11/20 USD851,000 904,189 0.1
MetroPCS Wireless 7.875%
01/09/18 USD50,000 55,361 0.0
MGM Resorts Int1 6.75%
1/10/20-144A USD750,000 823,116 0.1
MGM Resorts Intl 10%
01/11/16 USD200,000 247,583 0.0
(Continued)
HoldingHoldingHoldingHolding
FairFairFairFair
valuevaluevaluevalue
US$US$US$US$
% of% of% of% of
netnetnetnet
assetsassetsassetsassets
MGM Resorts Intl 11.375%
01/03/18 USD1,060,000 1,355,907 0.1
MGM Resorts Intl 6.75%
1/10/20-RegS USD200,000 218,738 0.0
MGM Resorts Intl 7.625%
15/01/17 USD470,000 530,489 0.0
MGM Resorts Intl 7.75%
15/03/22 USD914,000 1,017,885 0.1
MGM Resorts Intl 8.625%
1/2/19-144A USD2,340,000 2,768,513 0.2
Michael Foods Group
9.75% 15/07/18 USD500,000 566,677 0.0
Michaels Stores 7.75%
01/11/18 USD700,000 790,154 0.1
Midstates Petro 10.75%
1/10/20-RegS USD101,000 117,286 0.0
Milacron/Mcron Fin 7.75%
02/21-144A USD364,000 375,233 0.0
MPT Operating Part
6.375% 15/02/22 USD40,000 43,233 0.0
Multiplan Inc 9.875%
01/09/18-144A USD1,315,000 1,471,553 0.1
Multiplan Inc 9.875%
01/09/18-RegS USD200,000 223,810 0.0
Mylan Inc 7.875%
15/07/20-144A USD550,000 651,389 0.0
National Mentor 12.5%
15/02/18-144A USD75,000 81,849 0.0
National Mentor 12.5%
15/02/18-RegS USD424,000 462,719 0.0
Nationstar Mort 7.875%
1/10/20-144A USD250,000 284,031 0.0
Nationstar Mort 7.875%
10/20-SEP USD90,000 102,251 0.0
Nationstar Mort 9.625%
1/5/19-144A USD110,000 130,086 0.0
Nationstar Mort 9.625%
1/5/19-RegS USD40,000 47,304 0.0
NCR Corp 5% 15/07/22-
RegS USD44,000 44,691 0.0
Neovia Logistics 10%
15/02/18-144A USD90,000 91,275 0.0
Netflix Inc 5.375%
01/02/21-144A USD257,000 258,339 0.0
Neuberger Berman
5.625%15/3/20-144A USD110,000 114,692 0.0
New Albertsons 7.45%
01/08/29 USD510,000 415,608 0.0
New Albertsons 8%
01/05/31 USD369,000 306,024 0.0
New Albertsons 8.7%
01/05/30 USD15,000 12,857 0.0
New Enterprise Stone 13%
03/18-RegS USD27,300 29,686 0.0
Newfield Exploration
5.625% 1/07/24 USD225,000 235,195 0.0
Newfield Exploration
5.75% 30/01/22 USD350,000 379,716 0.0
Newfield Exploration
6.875% 1/2/20 USD100,000 108,387 0.0
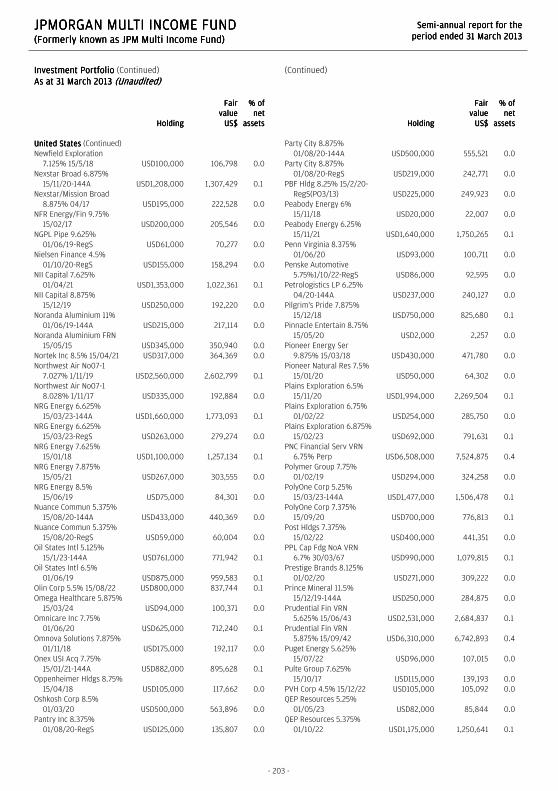
JPMORGAN MULTI INCOME FUNDJPMORGAN MULTI INCOME FUNDJPMORGAN MULTI INCOME FUNDJPMORGAN MULTI INCOME FUND (Formerly known as JPM Multi Income Fund)(Formerly known as JPM Multi Income Fund)(Formerly known as JPM Multi Income Fund)(Formerly known as JPM Multi Income Fund)
SemiSemiSemiSemi----annual report for theannual report for theannual report for theannual report for the
period ended 31 March 2013period ended 31 March 2013period ended 31 March 2013period ended 31 March 2013
- 203 -
Investment PortfolioInvestment PortfolioInvestment PortfolioInvestment Portfolio (Continued)
As at 31 March 2013As at 31 March 2013As at 31 March 2013As at 31 March 2013 (Unaudited)(Unaudited)(Unaudited)(Unaudited)
HoldingHoldingHoldingHolding
FairFairFairFair
valuevaluevaluevalue
US$US$US$US$
% of% of% of% of
netnetnetnet
assetsassetsassetsassets
United StatesUnited StatesUnited StatesUnited States (Continued)
Newfield Exploration
7.125% 15/5/18 USD100,000 106,798 0.0
Nexstar Broad 6.875%
15/11/20-144A USD1,208,000 1,307,429 0.1
Nexstar/Mission Broad
8.875% 04/17 USD195,000 222,528 0.0
NFR Energy/Fin 9.75%
15/02/17 USD200,000 205,546 0.0
NGPL Pipe 9.625%
01/06/19-RegS USD61,000 70,277 0.0
Nielsen Finance 4.5%
01/10/20-RegS USD155,000 158,294 0.0
NII Capital 7.625%
01/04/21 USD1,353,000 1,022,361 0.1
NII Capital 8.875%
15/12/19 USD250,000 192,220 0.0
Noranda Aluminium 11%
01/06/19-144A USD215,000 217,114 0.0
Noranda Aluminium FRN
15/05/15 USD345,000 350,940 0.0
Nortek Inc 8.5% 15/04/21 USD317,000 364,369 0.0
Northwest Air No07-1
7.027% 1/11/19 USD2,560,000 2,602,799 0.1
Northwest Air No07-1
8.028% 1/11/17 USD335,000 192,884 0.0
NRG Energy 6.625%
15/03/23-144A USD1,660,000 1,773,093 0.1
NRG Energy 6.625%
15/03/23-RegS USD263,000 279,274 0.0
NRG Energy 7.625%
15/01/18 USD1,100,000 1,257,134 0.1
NRG Energy 7.875%
15/05/21 USD267,000 303,555 0.0
NRG Energy 8.5%
15/06/19 USD75,000 84,301 0.0
Nuance Commun 5.375%
15/08/20-144A USD433,000 440,369 0.0
Nuance Commun 5.375%
15/08/20-RegS USD59,000 60,004 0.0
Oil States Intl 5.125%
15/1/23-144A USD761,000 771,942 0.1
Oil States Intl 6.5%
01/06/19 USD875,000 959,583 0.1
Olin Corp 5.5% 15/08/22 USD800,000 837,744 0.1
Omega Healthcare 5.875%
15/03/24 USD94,000 100,371 0.0
Omnicare Inc 7.75%
01/06/20 USD625,000 712,240 0.1
Omnova Solutions 7.875%
01/11/18 USD175,000 192,117 0.0
Onex USI Acq 7.75%
15/01/21-144A USD882,000 895,628 0.1
Oppenheimer Hldgs 8.75%
15/04/18 USD105,000 117,662 0.0
Oshkosh Corp 8.5%
01/03/20 USD500,000 563,896 0.0
Pantry Inc 8.375%
01/08/20-RegS USD125,000 135,807 0.0
(Continued)
HoldingHoldingHoldingHolding
FairFairFairFair
valuevaluevaluevalue
US$US$US$US$
% of% of% of% of
netnetnetnet
assetsassetsassetsassets
Party City 8.875%
01/08/20-144A USD500,000 555,521 0.0
Party City 8.875%
01/08/20-RegS USD219,000 242,771 0.0
PBF Hldg 8.25% 15/2/20-
RegS(PO3/13) USD225,000 249,923 0.0
Peabody Energy 6%
15/11/18 USD20,000 22,007 0.0
Peabody Energy 6.25%
15/11/21 USD1,640,000 1,750,265 0.1
Penn Virginia 8.375%
01/06/20 USD93,000 100,711 0.0
Penske Automotive
5.75%1/10/22-RegS USD86,000 92,595 0.0
Petrologistics LP 6.25%
04/20-144A USD237,000 240,127 0.0
Pilgrim's Pride 7.875%
15/12/18 USD750,000 825,680 0.1
Pinnacle Entertain 8.75%
15/05/20 USD2,000 2,257 0.0
Pioneer Energy Ser
9.875% 15/03/18 USD430,000 471,780 0.0
Pioneer Natural Res 7.5%
15/01/20 USD50,000 64,302 0.0
Plains Exploration 6.5%
15/11/20 USD1,994,000 2,269,504 0.1
Plains Exploration 6.75%
01/02/22 USD254,000 285,750 0.0
Plains Exploration 6.875%
15/02/23 USD692,000 791,631 0.1
PNC Financial Serv VRN
6.75% Perp USD6,508,000 7,524,875 0.4
Polymer Group 7.75%
01/02/19 USD294,000 324,258 0.0
PolyOne Corp 5.25%
15/03/23-144A USD1,477,000 1,506,478 0.1
PolyOne Corp 7.375%
15/09/20 USD700,000 776,813 0.1
Post Hldgs 7.375%
15/02/22 USD400,000 441,351 0.0
PPL Cap Fdg NoA VRN
6.7% 30/03/67 USD990,000 1,079,815 0.1
Prestige Brands 8.125%
01/02/20 USD271,000 309,222 0.0
Prince Mineral 11.5%
15/12/19-144A USD250,000 284,875 0.0
Prudential Fin VRN
5.625% 15/06/43 USD2,531,000 2,684,837 0.1
Prudential Fin VRN
5.875% 15/09/42 USD6,310,000 6,742,893 0.4
Puget Energy 5.625%
15/07/22 USD96,000 107,015 0.0
Pulte Group 7.625%
15/10/17 USD115,000 139,193 0.0
PVH Corp 4.5% 15/12/22 USD105,000 105,092 0.0
QEP Resources 5.25%
01/05/23 USD82,000 85,844 0.0
QEP Resources 5.375%
01/10/22 USD1,175,000 1,250,641 0.1

JPMORGAN MULTI INCOME FUNDJPMORGAN MULTI INCOME FUNDJPMORGAN MULTI INCOME FUNDJPMORGAN MULTI INCOME FUND (Formerly known as JPM Multi Income Fund)(Formerly known as JPM Multi Income Fund)(Formerly known as JPM Multi Income Fund)(Formerly known as JPM Multi Income Fund)
SemiSemiSemiSemi----annual report for theannual report for theannual report for theannual report for the
period ended 31 March 2013period ended 31 March 2013period ended 31 March 2013period ended 31 March 2013
- 204 -
Investment PortfolioInvestment PortfolioInvestment PortfolioInvestment Portfolio (Continued)
As at 31 March 2013As at 31 March 2013As at 31 March 2013As at 31 March 2013 (Unaudited)(Unaudited)(Unaudited)(Unaudited)
HoldingHoldingHoldingHolding
FairFairFairFair
valuevaluevaluevalue
US$US$US$US$
% of% of% of% of
netnetnetnet
assetsassetsassetsassets
United StatesUnited StatesUnited StatesUnited States (Continued)
QEP Resources 6.875%
01/03/21 USD500,000 574,401 0.0
Quapaw Downstream
10.5% 1/7/19-144A USD300,000 339,375 0.0
Quapaw Downstream
10.5% 1/7/19-RegS USD175,000 197,969 0.0
Quiksilver Inc 6.875%
15/04/15 USD850,000 877,109 0.1
QVC Inc 7.375% 15/10/20-
RegS USD300,000 342,889 0.0
Qwest Capital Fdg 7.75%
15/02/31 USD450,000 462,991 0.0
Qwest Comm Intl 7.125%
01/04/18 USD71,000 76,458 0.0
Radiation Therapy 8.875%
15/01/17 USD150,000 152,816 0.0
Radio Systems 8.375%
01/11/19-144A USD820,000 901,581 0.1
Rain CII Carbon 8%
01/12/18-144A USD650,000 709,583 0.1
Rain CII Carbon 8.25%
15/01/21-144A USD200,000 220,125 0.0
Range Resources 5%
15/03/23-144A USD277,000 282,552 0.0
RBS Global & Rexnord
8.5% 01/05/18 USD500,000 565,208 0.0
Realogy Corp 7.625%
15/01/20-144A USD550,000 629,782 0.0
Regal Cinemas 8.625%
15/07/19 USD235,000 265,333 0.0
Regal Entertainment
5.75% 01/02/25 USD467,000 465,122 0.0
Regal Entertainment
9.125% 15/08/18 USD250,000 283,603 0.0
Regency Energy/Fin 5.5%
15/04/23 USD490,000 539,309 0.0
Regency Energy/Fin 6.5%
15/07/21 USD370,000 412,144 0.0
Regions Bank 7.5%
15/05/18 USD250,000 314,690 0.0
Resolute Forest 10.25%
15/10/18 USD1,168,000 1,404,577 0.1
Revlon Consumer 5.75%
15/02/21-144A USD338,000 341,760 0.0
Reynolds Grp 5.75%
15/10/20 USD2,721,000 2,862,190 0.2
Reynolds Grp 6.875%
15/02/21 USD500,000 536,988 0.0
Reynolds Grp 7.875%
15/08/19 USD950,000 1,058,330 0.1
Reynolds Grp 9%
15/04/19 USD1,825,000 2,008,504 0.1
Reynolds Grp 9.875%
15/08/19 USD2,310,000 2,562,119 0.1
RHP Hotel Prop/Fin 5%
15/04/21-144A USD379,000 379,000 0.0
Rite Aid 10.25% 15/10/19 USD190,000 228,484 0.0
Rite Aid 7.5% 01/03/17 USD2,225,000 2,312,609 0.1
Rite Aid 9.25% 15/03/20 USD200,000 227,374 0.0
(Continued)
HoldingHoldingHoldingHolding
FairFairFairFair
valuevaluevaluevalue
US$US$US$US$
% of% of% of% of
netnetnetnet
assetsassetsassetsassets
Rite Aid 9.5% 15/06/17 USD2,000,000 2,158,972 0.1
Rivers Pittsburgh 9.5%
15/6/19-144A USD165,000 184,509 0.0
Rivers Pittsburgh 9.5%
15/6/19-RegS USD95,000 106,232 0.0
ROC Finance 12.125%
01/09/18-144A USD200,000 234,223 0.0
ROC Finance 12.125%
01/09/18-RegS USD225,000 263,501 0.0
Rockies Express 6%
15/01/19-144A USD200,000 198,000 0.0
Rock-Tenn Co 4.9%
01/03/22 USD30,000 32,769 0.0
Roofing Supply/Fin 10%
1/6/20-144A USD170,000 197,554 0.0
Roofing Supply/Fin 10%
1/6/20-RegS USD190,000 220,796 0.0
RR Donnelley 7.25%
15/05/18 USD250,000 270,768 0.0
RR Donnelley 7.625%
15/06/20 USD55,000 58,699 0.0
RR Donnelley 7.875%
15/03/21 USD85,000 90,009 0.0
RSI Home Prod 6.875%
01/03/18-144A USD241,000 247,661 0.0
Ryerson Inc/Joseph 9%
15/10/17-RegS USD140,000 159,670 0.0
Sabine Pass 5.625%
01/02/21-144A USD388,000 406,188 0.0
Sabre Inc 8.5% 15/05/19-
144A USD1,050,000 1,173,215 0.1
Sabre Inc 8.5% 15/05/19-
RegS USD100,000 111,735 0.0
Sabre Inc 8.5% 15/05/19-
RegS USD25,000 28,059 0.0
Sally Hldgs/Cap 5.75%
01/06/22 USD42,000 44,839 0.0
Samson Inv 9.75%
15/02/20-144A USD1,125,000 1,209,633 0.1
Samson Inv 9.75%
15/02/20-RegS USD400,000 430,092 0.0
Sandridge Energy 7.5%
15/03/21 USD625,000 656,164 0.0
SBA Telecom 5.75%
15/07/20-RegS USD16,000 16,837 0.0
Scotts Miracle-Gro 6.625%
15/12/20 USD550,000 613,245 0.0
Sealed Air 5.25%
01/04/23-144A USD167,000 168,312 0.0
Sealed Air 6.5% 01/12/20-
144A USD185,000 206,023 0.0
Sealed Air 8.125%
15/09/19-144A USD400,000 454,535 0.0
Sealed Air 8.375%
15/09/21-144A USD825,000 946,857 0.1
Sealed Air 8.375%
15/09/21-RegS USD375,000 430,389 0.0
Seneca Gaming 8.25%
01/12/18-144A USD515,000 562,638 0.0
Seneca Gaming 8.25%
01/12/18-RegS USD275,000 300,438 0.0
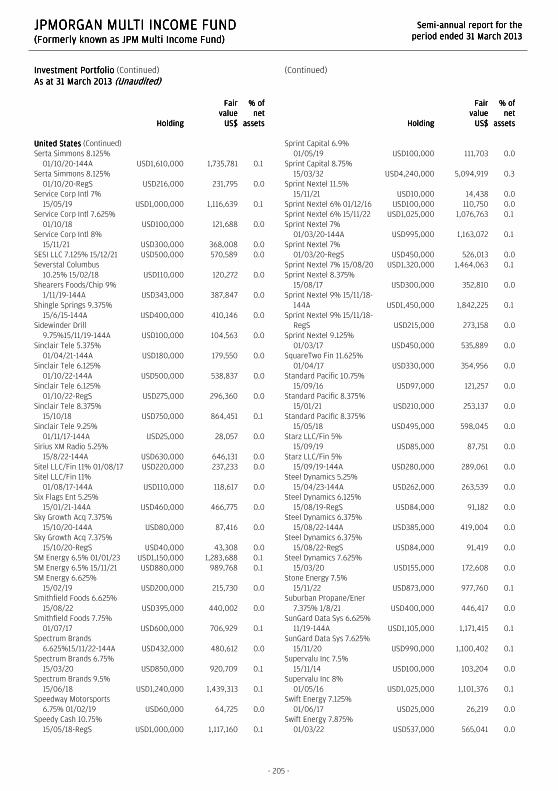
JPMORGAN MULTI INCOME FUNDJPMORGAN MULTI INCOME FUNDJPMORGAN MULTI INCOME FUNDJPMORGAN MULTI INCOME FUND (Formerly known as JPM Multi Income Fund)(Formerly known as JPM Multi Income Fund)(Formerly known as JPM Multi Income Fund)(Formerly known as JPM Multi Income Fund)
SemiSemiSemiSemi----annual report for theannual report for theannual report for theannual report for the
period ended 31 March 2013period ended 31 March 2013period ended 31 March 2013period ended 31 March 2013
- 205 -
Investment PortfolioInvestment PortfolioInvestment PortfolioInvestment Portfolio (Continued)
As at 31 March 2013As at 31 March 2013As at 31 March 2013As at 31 March 2013 (Unaudited)(Unaudited)(Unaudited)(Unaudited)
HoldingHoldingHoldingHolding
FairFairFairFair
valuevaluevaluevalue
US$US$US$US$
% of% of% of% of
netnetnetnet
assetsassetsassetsassets
United StatesUnited StatesUnited StatesUnited States (Continued)
Serta Simmons 8.125%
01/10/20-144A USD1,610,000 1,735,781 0.1
Serta Simmons 8.125%
01/10/20-RegS USD216,000 231,795 0.0
Service Corp Intl 7%
15/05/19 USD1,000,000 1,116,639 0.1
Service Corp Intl 7.625%
01/10/18 USD100,000 121,688 0.0
Service Corp Intl 8%
15/11/21 USD300,000 368,008 0.0
SESI LLC 7.125% 15/12/21 USD500,000 570,589 0.0
Severstal Columbus
10.25% 15/02/18 USD110,000 120,272 0.0
Shearers Foods/Chip 9%
1/11/19-144A USD343,000 387,847 0.0
Shingle Springs 9.375%
15/6/15-144A USD400,000 410,146 0.0
Sidewinder Drill
9.75%15/11/19-144A USD100,000 104,563 0.0
Sinclair Tele 5.375%
01/04/21-144A USD180,000 179,550 0.0
Sinclair Tele 6.125%
01/10/22-144A USD500,000 538,837 0.0
Sinclair Tele 6.125%
01/10/22-RegS USD275,000 296,360 0.0
Sinclair Tele 8.375%
15/10/18 USD750,000 864,451 0.1
Sinclair Tele 9.25%
01/11/17-144A USD25,000 28,057 0.0
Sirius XM Radio 5.25%
15/8/22-144A USD630,000 646,131 0.0
Sitel LLC/Fin 11% 01/08/17 USD220,000 237,233 0.0
Sitel LLC/Fin 11%
01/08/17-144A USD110,000 118,617 0.0
Six Flags Ent 5.25%
15/01/21-144A USD460,000 466,775 0.0
Sky Growth Acq 7.375%
15/10/20-144A USD80,000 87,416 0.0
Sky Growth Acq 7.375%
15/10/20-RegS USD40,000 43,308 0.0
SM Energy 6.5% 01/01/23 USD1,150,000 1,283,688 0.1
SM Energy 6.5% 15/11/21 USD880,000 989,768 0.1
SM Energy 6.625%
15/02/19 USD200,000 215,730 0.0
Smithfield Foods 6.625%
15/08/22 USD395,000 440,002 0.0
Smithfield Foods 7.75%
01/07/17 USD600,000 706,929 0.1
Spectrum Brands
6.625%15/11/22-144A USD432,000 480,612 0.0
Spectrum Brands 6.75%
15/03/20 USD850,000 920,709 0.1
Spectrum Brands 9.5%
15/06/18 USD1,240,000 1,439,313 0.1
Speedway Motorsports
6.75% 01/02/19 USD60,000 64,725 0.0
Speedy Cash 10.75%
15/05/18-RegS USD1,000,000 1,117,160 0.1
(Continued)
HoldingHoldingHoldingHolding
FairFairFairFair
valuevaluevaluevalue
US$US$US$US$
% of% of% of% of
netnetnetnet
assetsassetsassetsassets
Sprint Capital 6.9%
01/05/19 USD100,000 111,703 0.0
Sprint Capital 8.75%
15/03/32 USD4,240,000 5,094,919 0.3
Sprint Nextel 11.5%
15/11/21 USD10,000 14,438 0.0
Sprint Nextel 6% 01/12/16 USD100,000 110,750 0.0
Sprint Nextel 6% 15/11/22 USD1,025,000 1,076,763 0.1
Sprint Nextel 7%
01/03/20-144A USD995,000 1,163,072 0.1
Sprint Nextel 7%
01/03/20-RegS USD450,000 526,013 0.0
Sprint Nextel 7% 15/08/20 USD1,320,000 1,464,063 0.1
Sprint Nextel 8.375%
15/08/17 USD300,000 352,810 0.0
Sprint Nextel 9% 15/11/18-
144A USD1,450,000 1,842,225 0.1
Sprint Nextel 9% 15/11/18-
RegS USD215,000 273,158 0.0
Sprint Nextel 9.125%
01/03/17 USD450,000 535,889 0.0
SquareTwo Fin 11.625%
01/04/17 USD330,000 354,956 0.0
Standard Pacific 10.75%
15/09/16 USD97,000 121,257 0.0
Standard Pacific 8.375%
15/01/21 USD210,000 253,137 0.0
Standard Pacific 8.375%
15/05/18 USD495,000 598,045 0.0
Starz LLC/Fin 5%
15/09/19 USD85,000 87,751 0.0
Starz LLC/Fin 5%
15/09/19-144A USD280,000 289,061 0.0
Steel Dynamics 5.25%
15/04/23-144A USD262,000 263,539 0.0
Steel Dynamics 6.125%
15/08/19-RegS USD84,000 91,182 0.0
Steel Dynamics 6.375%
15/08/22-144A USD385,000 419,004 0.0
Steel Dynamics 6.375%
15/08/22-RegS USD84,000 91,419 0.0
Steel Dynamics 7.625%
15/03/20 USD155,000 172,608 0.0
Stone Energy 7.5%
15/11/22 USD873,000 977,760 0.1
Suburban Propane/Ener
7.375% 1/8/21 USD400,000 446,417 0.0
SunGard Data Sys 6.625%
11/19-144A USD1,105,000 1,171,415 0.1
SunGard Data Sys 7.625%
15/11/20 USD990,000 1,100,402 0.1
Supervalu Inc 7.5%
15/11/14 USD100,000 103,204 0.0
Supervalu Inc 8%
01/05/16 USD1,025,000 1,101,376 0.1
Swift Energy 7.125%
01/06/17 USD25,000 26,219 0.0
Swift Energy 7.875%
01/03/22 USD537,000 565,041 0.0
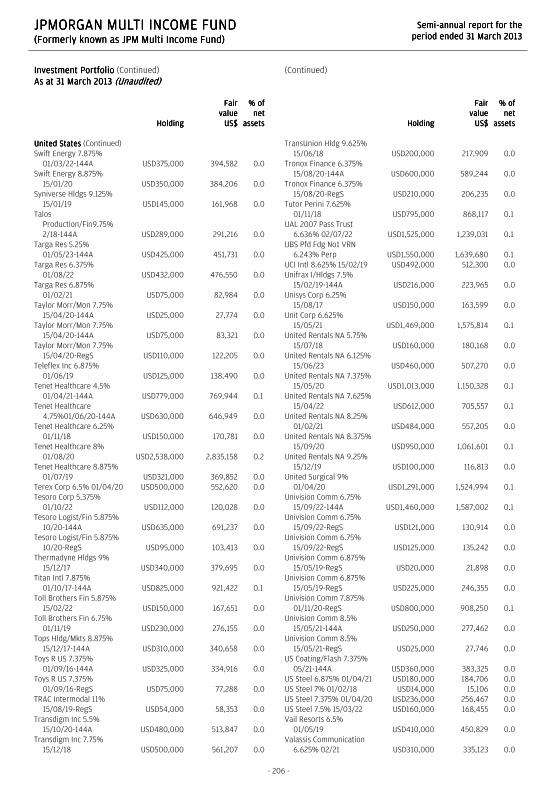
JPMORGAN MULTI INCOME FUNDJPMORGAN MULTI INCOME FUNDJPMORGAN MULTI INCOME FUNDJPMORGAN MULTI INCOME FUND (Formerly known as JPM Multi Income Fund)(Formerly known as JPM Multi Income Fund)(Formerly known as JPM Multi Income Fund)(Formerly known as JPM Multi Income Fund)
SemiSemiSemiSemi----annual report for theannual report for theannual report for theannual report for the
period ended 31 March 2013period ended 31 March 2013period ended 31 March 2013period ended 31 March 2013
- 206 -
Investment PortfolioInvestment PortfolioInvestment PortfolioInvestment Portfolio (Continued)
As at 31 March 2013As at 31 March 2013As at 31 March 2013As at 31 March 2013 (Unaudited)(Unaudited)(Unaudited)(Unaudited)
HoldingHoldingHoldingHolding
FairFairFairFair
valuevaluevaluevalue
US$US$US$US$
% of% of% of% of
netnetnetnet
assetsassetsassetsassets
United StatesUnited StatesUnited StatesUnited States (Continued)
Swift Energy 7.875%
01/03/22-144A USD375,000 394,582 0.0
Swift Energy 8.875%
15/01/20 USD350,000 384,206 0.0
Syniverse Hldgs 9.125%
15/01/19 USD145,000 161,968 0.0
Talos
Production/Fin9.75%
2/18-144A USD289,000 291,216 0.0
Targa Res 5.25%
01/05/23-144A USD425,000 451,731 0.0
Targa Res 6.375%
01/08/22 USD432,000 476,550 0.0
Targa Res 6.875%
01/02/21 USD75,000 82,984 0.0
Taylor Morr/Mon 7.75%
15/04/20-144A USD25,000 27,774 0.0
Taylor Morr/Mon 7.75%
15/04/20-144A USD75,000 83,321 0.0
Taylor Morr/Mon 7.75%
15/04/20-RegS USD110,000 122,205 0.0
Teleflex Inc 6.875%
01/06/19 USD125,000 138,490 0.0
Tenet Healthcare 4.5%
01/04/21-144A USD779,000 769,944 0.1
Tenet Healthcare
4.75%01/06/20-144A USD630,000 646,949 0.0
Tenet Healthcare 6.25%
01/11/18 USD150,000 170,781 0.0
Tenet Healthcare 8%
01/08/20 USD2,538,000 2,835,158 0.2
Tenet Healthcare 8.875%
01/07/19 USD321,000 369,852 0.0
Terex Corp 6.5% 01/04/20 USD500,000 552,620 0.0
Tesoro Corp 5.375%
01/10/22 USD112,000 120,028 0.0
Tesoro Logist/Fin 5.875%
10/20-144A USD635,000 691,237 0.0
Tesoro Logist/Fin 5.875%
10/20-RegS USD95,000 103,413 0.0
Thermadyne Hldgs 9%
15/12/17 USD340,000 379,695 0.0
Titan Intl 7.875%
01/10/17-144A USD825,000 921,422 0.1
Toll Brothers Fin 5.875%
15/02/22 USD150,000 167,651 0.0
Toll Brothers Fin 6.75%
01/11/19 USD230,000 276,155 0.0
Tops Hldg/Mkts 8.875%
15/12/17-144A USD310,000 340,658 0.0
Toys R US 7.375%
01/09/16-144A USD325,000 334,916 0.0
Toys R US 7.375%
01/09/16-RegS USD75,000 77,288 0.0
TRAC Intermodal 11%
15/08/19-RegS USD54,000 58,353 0.0
Transdigm Inc 5.5%
15/10/20-144A USD480,000 513,847 0.0
Transdigm Inc 7.75%
15/12/18 USD500,000 561,207 0.0
(Continued)
HoldingHoldingHoldingHolding
FairFairFairFair
valuevaluevaluevalue
US$US$US$US$
% of% of% of% of
netnetnetnet
assetsassetsassetsassets
TransUnion Hldg 9.625%
15/06/18 USD200,000 217,909 0.0
Tronox Finance 6.375%
15/08/20-144A USD600,000 589,244 0.0
Tronox Finance 6.375%
15/08/20-RegS USD210,000 206,235 0.0
Tutor Perini 7.625%
01/11/18 USD795,000 868,117 0.1
UAL 2007 Pass Trust
6.636% 02/07/22 USD1,525,000 1,239,031 0.1
UBS Pfd Fdg No1 VRN
6.243% Perp USD1,550,000 1,639,680 0.1
UCI Intl 8.625% 15/02/19 USD492,000 512,300 0.0
Unifrax I/Hldgs 7.5%
15/02/19-144A USD216,000 223,965 0.0
Unisys Corp 6.25%
15/08/17 USD150,000 163,599 0.0
Unit Corp 6.625%
15/05/21 USD1,469,000 1,575,814 0.1
United Rentals NA 5.75%
15/07/18 USD160,000 180,168 0.0
United Rentals NA 6.125%
15/06/23 USD460,000 507,270 0.0
United Rentals NA 7.375%
15/05/20 USD1,013,000 1,150,328 0.1
United Rentals NA 7.625%
15/04/22 USD612,000 705,557 0.1
United Rentals NA 8.25%
01/02/21 USD484,000 557,205 0.0
United Rentals NA 8.375%
15/09/20 USD950,000 1,061,601 0.1
United Rentals NA 9.25%
15/12/19 USD100,000 116,813 0.0
United Surgical 9%
01/04/20 USD1,291,000 1,524,994 0.1
Univision Comm 6.75%
15/09/22-144A USD1,460,000 1,587,002 0.1
Univision Comm 6.75%
15/09/22-RegS USD121,000 130,914 0.0
Univision Comm 6.75%
15/09/22-RegS USD125,000 135,242 0.0
Univision Comm 6.875%
15/05/19-RegS USD20,000 21,898 0.0
Univision Comm 6.875%
15/05/19-RegS USD225,000 246,355 0.0
Univision Comm 7.875%
01/11/20-RegS USD800,000 908,250 0.1
Univision Comm 8.5%
15/05/21-144A USD250,000 277,462 0.0
Univision Comm 8.5%
15/05/21-RegS USD25,000 27,746 0.0
US Coating/Flash 7.375%
05/21-144A USD360,000 383,325 0.0
US Steel 6.875% 01/04/21 USD180,000 184,706 0.0
US Steel 7% 01/02/18 USD14,000 15,106 0.0
US Steel 7.375% 01/04/20 USD236,000 256,467 0.0
US Steel 7.5% 15/03/22 USD160,000 168,455 0.0
Vail Resorts 6.5%
01/05/19 USD410,000 450,829 0.0
Valassis Communication
6.625% 02/21 USD310,000 335,123 0.0

JPMORGAN MULTI INCOME FUNDJPMORGAN MULTI INCOME FUNDJPMORGAN MULTI INCOME FUNDJPMORGAN MULTI INCOME FUND (Formerly known as JPM Multi Income Fund)(Formerly known as JPM Multi Income Fund)(Formerly known as JPM Multi Income Fund)(Formerly known as JPM Multi Income Fund)
SemiSemiSemiSemi----annual report for theannual report for theannual report for theannual report for the
period ended 31 March 2013period ended 31 March 2013period ended 31 March 2013period ended 31 March 2013
- 207 -
Investment PortfolioInvestment PortfolioInvestment PortfolioInvestment Portfolio (Continued)
As at 31 March 2013As at 31 March 2013As at 31 March 2013As at 31 March 2013 (Unaudited)(Unaudited)(Unaudited)(Unaudited)
HoldingHoldingHoldingHolding
FairFairFairFair
valuevaluevaluevalue
US$US$US$US$
% of% of% of% of
netnetnetnet
assetsassetsassetsassets
United StatesUnited StatesUnited StatesUnited States (Continued)
Valeant Pharm 6.375%
15/10/20-RegS USD13,000 14,109 0.0
Valeant Pharm 6.75%
15/08/21-144A USD1,360,000 1,458,685 0.1
Valeant Pharm 7%
01/10/20-144A USD250,000 277,500 0.0
Valeant Pharm 7%
01/10/20-RegS USD800,000 888,000 0.1
Valeant Pharm 7.25%
15/07/22-144A USD550,000 606,654 0.0
Vanguard Health 7.75%
01/02/19 USD831,000 902,505 0.1
Vanguard Health 8%
01/02/18 USD1,052,000 1,134,407 0.1
Vanguard Natl/VNR Fin
7.875% 1/4/20 USD205,000 227,934 0.0
Viasystems Inc 7.875%
01/05/19-144A USD130,000 140,116 0.0
Viasystems Inc 7.875%
01/05/19-RegS USD69,000 74,369 0.0
Viking Cruises 8.5%
15/10/22-144A USD291,000 332,027 0.0
Visant Corp 10% 01/10/17 USD100,000 96,500 0.0
Visteon Corp 6.75%
15/04/19 USD225,000 247,795 0.0
VPI Escrow 6.375%
15/10/20-144A USD1,445,000 1,575,514 0.1
VPI Escrow 6.375%
15/10/20-RegS USD25,000 27,163 0.0
Vulcan Materials 7%
15/06/18 USD130,000 149,152 0.0
Vulcan Materials 7.5%
15/06/21 USD1,404,000 1,667,842 0.1
VWR Funding 7.25%
15/09/17-144A USD445,000 469,886 0.0
VWR Funding 7.25%
15/09/17-RegS USD162,000 171,667 0.0
W&T Offshore 8.5%
15/06/19 USD1,190,000 1,324,189 0.1
Wachovia Cap Trust FRN
Perp USD1,575,000 1,563,393 0.1
Walter Energy 8.5%
15/04/21-144A USD266,000 272,632 0.0
Watco Cos/Fin 6.375%
01/04/23-144A USD706,000 726,665 0.1
Wells Enterprises 6.75%
02/20-144A USD820,000 880,578 0.1
Wells Fargo VRN 7.98%
Perp-Ser K USD9,575,000 11,047,332 0.6
Western Refining 6.25%
1/4/21-144A USD150,000 152,807 0.0
WEX Inc 4.75% 01/02/23-
144A USD197,000 191,717 0.0
Weyerhaeuser Co 7.375%
15/03/32 USD296,000 374,627 0.0
Weyerhaeuser Co 8.5%
15/01/25 USD338,000 455,583 0.0
Windstream Corp 6.375%
1/08/23-144A USD96,000 96,578 0.0
(Continued)
HoldingHoldingHoldingHolding
FairFairFairFair
valuevaluevaluevalue
US$US$US$US$
% of% of% of% of
netnetnetnet
assetsassetsassetsassets
Windstream Corp 7%
15/03/19 USD50,000 50,978 0.0
Windstream Corp 7.75%
01/10/21 USD2,775,000 3,139,219 0.2
WMG Acquisition 6%
15/01/21-144A USD1,070,000 1,148,966 0.1
WOK Acquisition 10.25%
30/6/20-144A USD325,000 356,078 0.0
WPX Energy 5.25%
15/01/17 USD240,000 252,295 0.0
WPX Energy 6% 15/01/22 USD2,615,000 2,779,309 0.2
Wynn Las Vegas 5.375%
15/03/22 USD630,000 664,472 0.0
Wynn Las Vegas 7.75%
15/08/20 USD210,000 238,217 0.0
Zayo Group/Cap 10.125%
01/07/20 USD250,000 300,703 0.0
Zayo Group/Cap 8.125%
01/01/20 USD494,000 565,784 0.0
UruguayUruguayUruguayUruguay (0.2%)
Rep of Uruguay 8%
18/11/22 USD1,200,000 1,702,413 0.1
Rep Orient Uruguay
7.625% 21/03/36 USD980,000 1,411,523 0.1
VenezuelaVenezuelaVenezuelaVenezuela (1.3%)
Petroleos de Venez
8.5%2/11/17-RegS USD4,705,000 4,750,246 0.2
Rep of Venezuela 11.95%
08/31-RegS USD4,822,000 5,499,109 0.3
Rep of Venezuela 12.75%
08/22-RegS USD11,010,000 12,960,009 0.7
Rep of Venezuela 9%
07/05/23-RegS USD2,015,000 1,998,734 0.1
879,800,041 44.4
--------- ----
(III) Derivatives(III) Derivatives(III) Derivatives(III) Derivatives (0.7%)
Forward foreign exchangeForward foreign exchangeForward foreign exchangeForward foreign exchange
contracts contracts contracts contracts (0.7%) 14,677,906 0.7
FuturesFuturesFuturesFutures (0.0%)
Euro Stoxx 50 (EUX) Fut
06/13 29 1,117 0.0
FTSE 100 Idx (LIF) Fut
06/13 12 2,004 0.0
S&P 500 E-Mini (CME) Fut
06/13 43 18,025 0.0
TOPIX (TSE) Fut 06/13 5 (5,052) (0.0)
14,694,000 0.7
--------- ----
Total Listed/Quoted InvestmentsTotal Listed/Quoted InvestmentsTotal Listed/Quoted InvestmentsTotal Listed/Quoted Investments 1,871,232,402 94.4
Other net assetsOther net assetsOther net assetsOther net assets 110,410,051 5.6

JPMORGAN MULTI INCOME FUNDJPMORGAN MULTI INCOME FUNDJPMORGAN MULTI INCOME FUNDJPMORGAN MULTI INCOME FUND (Formerly known as JPM Multi Income Fund)(Formerly known as JPM Multi Income Fund)(Formerly known as JPM Multi Income Fund)(Formerly known as JPM Multi Income Fund)
SemiSemiSemiSemi----annual report for theannual report for theannual report for theannual report for the
period ended 31 March 2013period ended 31 March 2013period ended 31 March 2013period ended 31 March 2013
- 208 -
Investment PortfolioInvestment PortfolioInvestment PortfolioInvestment Portfolio (Continued)
As at 31 March 2013As at 31 March 2013As at 31 March 2013As at 31 March 2013 (Unaudited)(Unaudited)(Unaudited)(Unaudited)
HoldingHoldingHoldingHolding
FairFairFairFair
valuevaluevaluevalue
US$US$US$US$
% of% of% of% of
netnetnetnet
assetsassetsassetsassets
Net Net Net Net assets attributable to holders of assets attributable to holders of assets attributable to holders of assets attributable to holders of
redeemable units at 31 March 2013redeemable units at 31 March 2013redeemable units at 31 March 2013redeemable units at 31 March 2013 1,981,642,453 100.0
Total investments, at costTotal investments, at costTotal investments, at costTotal investments, at cost 1,794,514,141
Statement of Movements in Portfolio HoldingsStatement of Movements in Portfolio HoldingsStatement of Movements in Portfolio HoldingsStatement of Movements in Portfolio Holdings
For the period ended 31 March 2013For the period ended 31 March 2013For the period ended 31 March 2013For the period ended 31 March 2013 (Unaudited)(Unaudited)(Unaudited)(Unaudited)
% holdings% holdings% holdings% holdings
of net assetsof net assetsof net assetsof net assets
31.3.201331.3.201331.3.201331.3.2013 30.9.201230.9.201230.9.201230.9.2012
Listed/Quoted InvestmentsListed/Quoted InvestmentsListed/Quoted InvestmentsListed/Quoted Investments
Equities and ConvertiblesEquities and ConvertiblesEquities and ConvertiblesEquities and Convertibles
United States 12.0 8.7
United Kingdom 3.3 3.2
South Africa 2.9 1.6
Brazil 2.9 1.7
China 2.6 2.8
Japan 2.5 2.0
Taiwan 2.2 2.2
Australia 2.0 2.1
Hong Kong 1.9 1.3
Russia 1.5 0.9
France 1.5 1.8
Switzerland 1.3 0.7
Singapore 1.2 1.3
Indonesia 1.1 0.9
Korea 1.1 1.1
Germany 1.0 1.2
India 1.0 0.8
Netherlands 1.0 0.4
Canada 0.8 0.8
Turkey 0.7 0.9
Poland 0.7 0.7
Sweden 0.6 0.3
Thailand 0.6 1.0
Italy 0.4 0.3
Qatar 0.4 0.5
Norway 0.4 0.1
Mexico 0.3 0.6
Belgium 0.2 0.0
Finland 0.2 0.2
Philippines 0.2 0.4
Kazakhstan 0.2 0.4
Denmark 0.2 -
Spain 0.2 0.0
Malaysia 0.1 0.5
Austria 0.1 0.2
New Zealand - 0.3
Debt SecuritiesDebt SecuritiesDebt SecuritiesDebt Securities
United States 27.3 29.7
Luxembourg 1.8 1.7
Venezuela 1.3 1.4
Indonesia 1.1 0.9
Russia 1.0 1.0
Romania 0.9 1.1
Dominican Republic 0.9 0.4
Serbia 0.8 1.2
Brazil 0.7 1.0
Kazakhstan 0.7 0.9
Hungary 0.7 1.0
Philippines 0.6 0.9
Canada 0.6 0.5
Iraq 0.6 1.2
Ghana 0.6 0.8
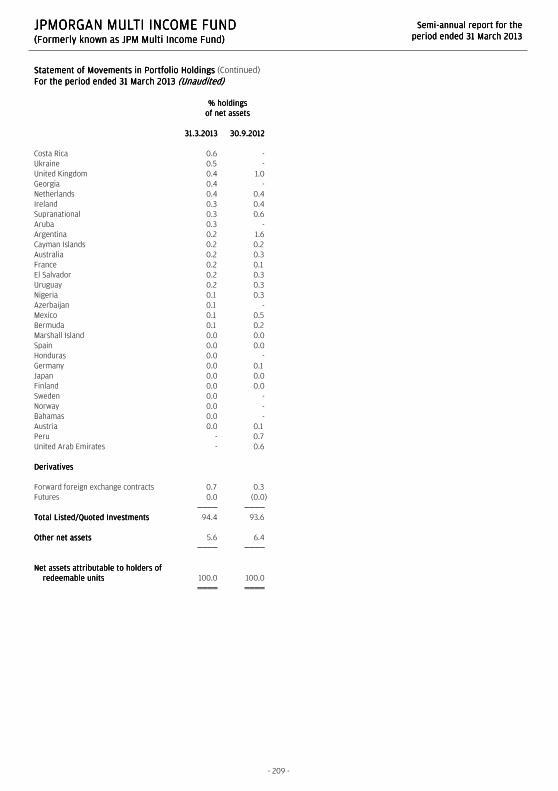
JPMORGAN MULTI INCOME FUNDJPMORGAN MULTI INCOME FUNDJPMORGAN MULTI INCOME FUNDJPMORGAN MULTI INCOME FUND (Formerly known as JPM Multi Income Fund)(Formerly known as JPM Multi Income Fund)(Formerly known as JPM Multi Income Fund)(Formerly known as JPM Multi Income Fund)
SemiSemiSemiSemi----annual report for theannual report for theannual report for theannual report for the
period ended 31 March 2013period ended 31 March 2013period ended 31 March 2013period ended 31 March 2013
- 209 -
Statement of Movements in Portfolio HoldingsStatement of Movements in Portfolio HoldingsStatement of Movements in Portfolio HoldingsStatement of Movements in Portfolio Holdings (Continued)
For the period ended 31 March 2013For the period ended 31 March 2013For the period ended 31 March 2013For the period ended 31 March 2013 (Unaudited)(Unaudited)(Unaudited)(Unaudited)
% holdings% holdings% holdings% holdings
of net assetsof net assetsof net assetsof net assets
31.3.201331.3.201331.3.201331.3.2013 30.9.201230.9.201230.9.201230.9.2012
Costa Rica 0.6 -
Ukraine 0.5 -
United Kingdom 0.4 1.0
Georgia 0.4 -
Netherlands 0.4 0.4
Ireland 0.3 0.4
Supranational 0.3 0.6
Aruba 0.3 -
Argentina 0.2 1.6
Cayman Islands 0.2 0.2
Australia 0.2 0.3
France 0.2 0.1
El Salvador 0.2 0.3
Uruguay 0.2 0.3
Nigeria 0.1 0.3
Azerbaijan 0.1 -
Mexico 0.1 0.5
Bermuda 0.1 0.2
Marshall Island 0.0 0.0
Spain 0.0 0.0
Honduras 0.0 -
Germany 0.0 0.1
Japan 0.0 0.0
Finland 0.0 0.0
Sweden 0.0 -
Norway 0.0 -
Bahamas 0.0 -
Austria 0.0 0.1
Peru - 0.7
United Arab Emirates - 0.6
DerivativesDerivativesDerivativesDerivatives
Forward foreign exchange contracts 0.7 0.3
Futures 0.0 (0.0)
Total Listed/Quoted InvestmentsTotal Listed/Quoted InvestmentsTotal Listed/Quoted InvestmentsTotal Listed/Quoted Investments 94.4 93.6
Other net assetsOther net assetsOther net assetsOther net assets 5.6 6.4
Net assets attributable to holders of Net assets attributable to holders of Net assets attributable to holders of Net assets attributable to holders of
redeemable unitsredeemable unitsredeemable unitsredeemable units 100.0 100.0
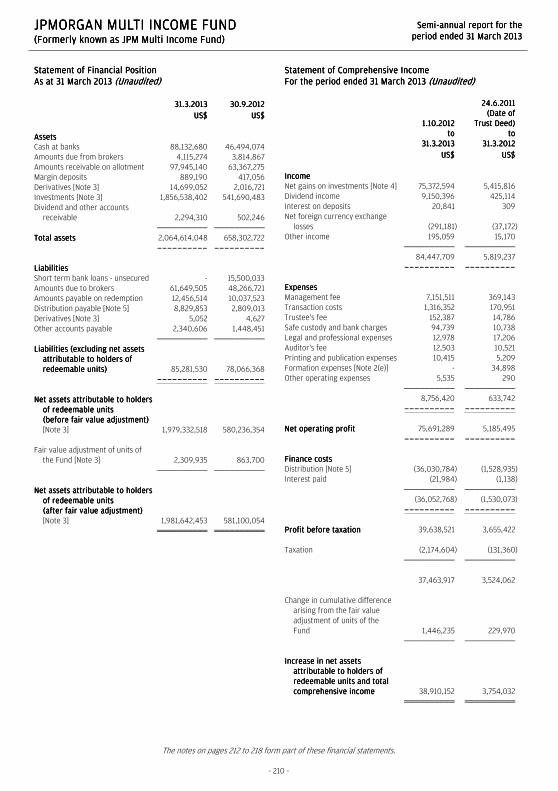
JPMORGAN MULTI INCOME FUNDJPMORGAN MULTI INCOME FUNDJPMORGAN MULTI INCOME FUNDJPMORGAN MULTI INCOME FUND (Formerly known as JPM Multi Income Fund)(Formerly known as JPM Multi Income Fund)(Formerly known as JPM Multi Income Fund)(Formerly known as JPM Multi Income Fund)
SemiSemiSemiSemi----annual report for theannual report for theannual report for theannual report for the
period ended 31 March 2013period ended 31 March 2013period ended 31 March 2013period ended 31 March 2013
The notes on pages 212 to 218 form part of these financial statements.
- 210 -
Statement of Financial PositionStatement of Financial PositionStatement of Financial PositionStatement of Financial Position
As at 31 March 2013As at 31 March 2013As at 31 March 2013As at 31 March 2013 (Unaudited)(Unaudited)(Unaudited)(Unaudited)
31.3.201331.3.201331.3.201331.3.2013 30.9.201230.9.201230.9.201230.9.2012
US$US$US$US$ US$US$US$US$
AssetsAssetsAssetsAssets
Cash at banks 88,132,680 46,494,074
Amounts due from brokers 4,115,274 3,814,867
Amounts receivable on allotment 97,945,140 63,367,275
Margin deposits 889,190 417,056
Derivatives [Note 3] 14,699,052 2,016,721
Investments [Note 3] 1,856,538,402 541,690,483
Dividend and other accounts
receivable 2,294,310 502,246
Total assetsTotal assetsTotal assetsTotal assets 2,064,614,048 658,302,722
---------- ----------
LiabilitiesLiabilitiesLiabilitiesLiabilities
Short term bank loans - unsecured - 15,500,033
Amounts due to brokers 61,649,505 48,266,721
Amounts payable on redemption 12,456,514 10,037,523
Distribution payable [Note 5] 8,829,853 2,809,013
Derivatives [Note 3] 5,052 4,627
Other accounts payable 2,340,606 1,448,451
Liabilities (excluding net assets Liabilities (excluding net assets Liabilities (excluding net assets Liabilities (excluding net assets
attributable to holders of attributable to holders of attributable to holders of attributable to holders of
redeemable units)redeemable units)redeemable units)redeemable units) 85,281,530 78,066,368
---------- ----------
Net assets attributable to holders Net assets attributable to holders Net assets attributable to holders Net assets attributable to holders
of redeemable units of redeemable units of redeemable units of redeemable units
(before fair value adjustment) (before fair value adjustment) (before fair value adjustment) (before fair value adjustment)
[Note 3] 1,979,332,518 580,236,354
Fair value adjustment of units of
the Fund [Note 3] 2,309,935 863,700
Net assets attributable to holders Net assets attributable to holders Net assets attributable to holders Net assets attributable to holders
of redeemable unitsof redeemable unitsof redeemable unitsof redeemable units
(after fair value adjustment) (after fair value adjustment) (after fair value adjustment) (after fair value adjustment)
[Note 3] 1,981,642,453 581,100,054
Statement of Comprehensive IncomeStatement of Comprehensive IncomeStatement of Comprehensive IncomeStatement of Comprehensive Income
For the period For the period For the period For the period ended 31 March 2013ended 31 March 2013ended 31 March 2013ended 31 March 2013 (Unaudited)(Unaudited)(Unaudited)(Unaudited)
1.10.20121.10.20121.10.20121.10.2012
totototo
31.3.201331.3.201331.3.201331.3.2013
24.6.201124.6.201124.6.201124.6.2011
(Date of(Date of(Date of(Date of
Trust Deed)Trust Deed)Trust Deed)Trust Deed)
totototo
31.3.201231.3.201231.3.201231.3.2012
US$US$US$US$ US$US$US$US$
IncomeIncomeIncomeIncome
Net gains on investments [Note 4] 75,372,594 5,415,816
Dividend income 9,150,396 425,114
Interest on deposits 20,841 309
Net foreign currency exchange
losses (291,181) (37,172)
Other income 195,059 15,170
84,447,709 5,819,237
---------- ----------
ExpensesExpensesExpensesExpenses
Management fee 7,151,511 369,143
Transaction costs 1,316,352 170,951
Trustee's fee 152,387 14,786
Safe custody and bank charges 94,739 10,738
Legal and professional expenses 12,978 17,206
Auditor's fee 12,503 10,521
Printing and publication expenses 10,415 5,209
Formation expenses [Note 2(e)] - 34,898
Other operating expenses 5,535 290
8,756,420 633,742
---------- ----------
Net operating profitNet operating profitNet operating profitNet operating profit 75,691,289 5,185,495
---------- ----------
Finance costsFinance costsFinance costsFinance costs
Distribution [Note 5] (36,030,784) (1,528,935)
Interest paid (21,984) (1,138)
(36,052,768) (1,530,073)
---------- ----------
Profit before taxationProfit before taxationProfit before taxationProfit before taxation 39,638,521 3,655,422
Taxation (2,174,604) (131,360)
37,463,917 3,524,062
Change in cumulative difference
arising from the fair value
adjustment of units of the
Fund 1,446,235 229,970
Increase in net assets Increase in net assets Increase in net assets Increase in net assets
attributable to holders of attributable to holders of attributable to holders of attributable to holders of
redeemable redeemable redeemable redeemable units and total units and total units and total units and total
comprehensive incomecomprehensive incomecomprehensive incomecomprehensive income 38,910,152 3,754,032
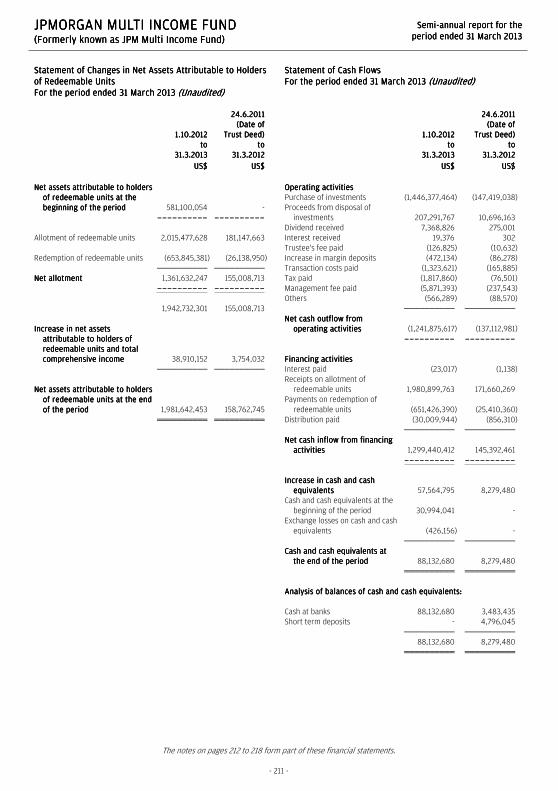
JPMORGAN MULTI INCOME FUNDJPMORGAN MULTI INCOME FUNDJPMORGAN MULTI INCOME FUNDJPMORGAN MULTI INCOME FUND (Formerly known as JPM Multi Income Fund)(Formerly known as JPM Multi Income Fund)(Formerly known as JPM Multi Income Fund)(Formerly known as JPM Multi Income Fund)
SemiSemiSemiSemi----annual report for theannual report for theannual report for theannual report for the
period ended 31 March 2013period ended 31 March 2013period ended 31 March 2013period ended 31 March 2013
The notes on pages 212 to 218 form part of these financial statements.
- 211 -
Statement of Changes in Net Assets Attributable to Holders Statement of Changes in Net Assets Attributable to Holders Statement of Changes in Net Assets Attributable to Holders Statement of Changes in Net Assets Attributable to Holders
of Redeemable Unitsof Redeemable Unitsof Redeemable Unitsof Redeemable Units
For the period ended 31 March 2013For the period ended 31 March 2013For the period ended 31 March 2013For the period ended 31 March 2013 (Unaudited)(Unaudited)(Unaudited)(Unaudited)
1.10.20121.10.20121.10.20121.10.2012
totototo
31.3.201331.3.201331.3.201331.3.2013
24.6.201124.6.201124.6.201124.6.2011
(Date of(Date of(Date of(Date of
Trust Deed)Trust Deed)Trust Deed)Trust Deed)
totototo
31.3.201231.3.201231.3.201231.3.2012
US$US$US$US$ US$US$US$US$
Net assets attributable to holders Net assets attributable to holders Net assets attributable to holders Net assets attributable to holders
of redeemable units at the of redeemable units at the of redeemable units at the of redeemable units at the
beginning of the periodbeginning of the periodbeginning of the periodbeginning of the period 581,100,054 -
---------- ----------
Allotment of redeemable units 2,015,477,628 181,147,663
Redemption of redeemable units (653,845,381) (26,138,950)
Net allotmentNet allotmentNet allotmentNet allotment 1,361,632,247 155,008,713
---------- ----------
1,942,732,301 155,008,713
Increase in net assets Increase in net assets Increase in net assets Increase in net assets
attributable to holders of attributable to holders of attributable to holders of attributable to holders of
redeemable units and redeemable units and redeemable units and redeemable units and total total total total
comprehensive incomecomprehensive incomecomprehensive incomecomprehensive income 38,910,152 3,754,032
Net assets attributable to holders Net assets attributable to holders Net assets attributable to holders Net assets attributable to holders
of redeemable units at the end of redeemable units at the end of redeemable units at the end of redeemable units at the end
of the periodof the periodof the periodof the period 1,981,642,453 158,762,745
Statement of Cash FlowsStatement of Cash FlowsStatement of Cash FlowsStatement of Cash Flows
For the period ended For the period ended For the period ended For the period ended 31 March 201331 March 201331 March 201331 March 2013 (Unaudited)(Unaudited)(Unaudited)(Unaudited)
1.10.20121.10.20121.10.20121.10.2012
totototo
31.3.201331.3.201331.3.201331.3.2013
24.6.201124.6.201124.6.201124.6.2011
(Date of(Date of(Date of(Date of
Trust Deed)Trust Deed)Trust Deed)Trust Deed)
totototo
31.3.201231.3.201231.3.201231.3.2012
US$US$US$US$ US$US$US$US$
Operating activitiesOperating activitiesOperating activitiesOperating activities
Purchase of investments (1,446,377,464) (147,419,038)
Proceeds from disposal of
investments 207,291,767 10,696,163
Dividend received 7,368,826 275,001
Interest received 19,376 302
Trustee's fee paid (126,825) (10,632)
Increase in margin deposits (472,134) (86,278)
Transaction costs paid (1,323,621) (165,885)
Tax paid (1,817,860) (76,501)
Management fee paid (5,871,393) (237,543)
Others (566,289) (88,570)
Net cash outflow from Net cash outflow from Net cash outflow from Net cash outflow from
operating activitiesoperating activitiesoperating activitiesoperating activities (1,241,875,617) (137,112,981)
---------- ----------
Financing activitiesFinancing activitiesFinancing activitiesFinancing activities
Interest paid (23,017) (1,138)
Receipts on allotment of
redeemable units 1,980,899,763 171,660,269
Payments on redemption of
redeemable units (651,426,390) (25,410,360)
Distribution paid (30,009,944) (856,310)
Net cash inflow from financing Net cash inflow from financing Net cash inflow from financing Net cash inflow from financing
activitiesactivitiesactivitiesactivities 1,299,440,412 145,392,461
---------- ----------
Increase in cash and cash Increase in cash and cash Increase in cash and cash Increase in cash and cash
equivalentsequivalentsequivalentsequivalents 57,564,795 8,279,480
Cash and cash equivalents at the
beginning of the period 30,994,041 -
Exchange losses on cash and cash
equivalents (426,156) -
Cash and cash equivalents at Cash and cash equivalents at Cash and cash equivalents at Cash and cash equivalents at
the end of the periodthe end of the periodthe end of the periodthe end of the period 88,132,680 8,279,480
Analysis of balances of cash and cash equivalents:Analysis of balances of cash and cash equivalents:Analysis of balances of cash and cash equivalents:Analysis of balances of cash and cash equivalents:
Cash at banks 88,132,680 3,483,435
Short term deposits - 4,796,045
88,132,680 8,279,480

JPMORGAN MULTI INCOME FUNDJPMORGAN MULTI INCOME FUNDJPMORGAN MULTI INCOME FUNDJPMORGAN MULTI INCOME FUND (Formerly known as JPM Multi Income Fund)(Formerly known as JPM Multi Income Fund)(Formerly known as JPM Multi Income Fund)(Formerly known as JPM Multi Income Fund)
SemiSemiSemiSemi----annual report for theannual report for theannual report for theannual report for the
period ended 31 March 2013period ended 31 March 2013period ended 31 March 2013period ended 31 March 2013
- 212 -
Notes to the Financial StatementsNotes to the Financial StatementsNotes to the Financial StatementsNotes to the Financial Statements
1111 The FundThe FundThe FundThe Fund
JPMorgan Multi Income Fund (the "Fund") was established under a Trust Deed dated 24 June 2011, as amended, and is governed by the laws of
Hong Kong. The Fund is authorized by the Securities and Futures Commission of Hong Kong.
With effect from 4 February 2013, the name of the Fund was changed from JPM Multi Income Fund to JPMorgan Multi Income Fund.
The investment objective of the Fund is to maximize the income return primarily through investing in a diversified portfolio of income
producing equities, bonds and other securities. In addition, the Fund aims to provide medium to long term moderate capital growth.
Pursuant to the Trust Deed, the Manager may decide to issue separate classes (each a "Class") whose assets will be commonly invested but
where a specific fee structure, currency or distribution policy may be applied. Each Class may have a different charging structure with the
result that the net asset value attributable to each Class may differ.
All unitholders' rights with regard to the convening, voting or otherwise acting at any meeting of unitholders are the same.
2222 Summary of principal accounting policiesSummary of principal accounting policiesSummary of principal accounting policiesSummary of principal accounting policies
(a)(a)(a)(a) Accounting policies of interim financial statementsAccounting policies of interim financial statementsAccounting policies of interim financial statementsAccounting policies of interim financial statements
The accounting policies and methods of computation used in the preparation of these unaudited condensed interim financial statements
are consistent with those used in the annual financial statements for the period ended 30 September 2012.
(b)(b)(b)(b) Investments and derivatives Investments and derivatives Investments and derivatives Investments and derivatives
Classification
The Fund classifies its investments and derivatives as financial assets or financial liabilities at fair value through profit or loss. These
financial assets or financial liabilities are held-for-trading as they are acquired or incurred principally for the purpose of selling or
repurchasing in the near term or short-term profit taking.
All derivatives are carried in assets when amounts are receivable by the Fund and in liabilities when amounts are payable by the Fund.
The Fund makes short sales in which a borrowed security is sold in anticipation of a decline in the market value of that security, or it may
use short sales for various arbitrage transactions. Short sales are classified as financial liabilities at fair value through profit or loss.
Recognition, derecognition and measurement
Purchases and sales of investments and derivatives are accounted for on the trade date basis. Investments and derivatives are initially
recognized at fair value and are subsequently re-measured at fair value. Realized and unrealized gains and losses on investments and
derivatives are recognized in the Statement of Comprehensive Income. Investments and derivatives are derecognized when the rights to
receive cash flows from the investments and derivatives have expired or the Fund has transferred substantially all risks and rewards of
ownership.
Fair value estimation
Investments that are listed or traded on an exchange and investments with prices quoted in over-the-counter markets or by market
makers, are fair valued based on quoted "bid" prices on long investments and quoted "ask" prices on investments sold short. When
trading in the securities of an investee company is suspended, the investment is valued at the Manager's estimate of its fair value.
Debt securities are fair valued based on quoted prices inclusive of accrued interest.
Investments in collective investment schemes are stated at fair value based on the net asset value per unit of the respective funds as
determined by the administrators of the relevant funds or stated at "bid" prices if the collective investment schemes are listed or traded
on an exchange.
Open future and swap contracts are valued at "bid" prices for long positions and "ask" prices for short positions at the valuation date.
The differences between the bid/ask prices and the contract prices are recognized in the Statement of Comprehensive Income.
Open option contracts are valued at "bid" prices for long positions and "ask" prices for short positions at the valuation date. The
differences between the bid/ask prices and the premium amounts/contract prices are recognized in the Statement of Comprehensive
Income.

JPMORGAN MULTI INCOME FUNDJPMORGAN MULTI INCOME FUNDJPMORGAN MULTI INCOME FUNDJPMORGAN MULTI INCOME FUND (Formerly known as JPM Multi Income Fund)(Formerly known as JPM Multi Income Fund)(Formerly known as JPM Multi Income Fund)(Formerly known as JPM Multi Income Fund)
SemiSemiSemiSemi----annual report for theannual report for theannual report for theannual report for the
period ended 31 March 2013period ended 31 March 2013period ended 31 March 2013period ended 31 March 2013
- 213 -
Forward foreign exchange contracts are valued at the forward rates ruling at the valuation date. The differences between the forward
rates and the contract rates are recognized in the Statement of Comprehensive Income.
(c)(c)(c)(c) Securities borrowingSecurities borrowingSecurities borrowingSecurities borrowing
The Fund may enter into securities borrowing arrangements for short sale purposes. Short positions represent obligations to deliver
securities sold but not yet purchased, and are accounted for as investments and valued at their fair value. Securities borrowed during the
period/year are off-balance sheet transactions and are therefore not included in the investment portfolio of the Fund. Collateral placed
for the purpose of securities borrowed generally consist of cash collateral and are included in the Statement of Financial Position
separately.
(d)(d)(d)(d) Foreign currency translationForeign currency translationForeign currency translationForeign currency translation
Functional and presentation currency
The Fund has adopted United States dollar as its functional and presentation currency.
Transactions and balances
Foreign currency transactions are translated into the functional currency using the exchange rates prevailing at the dates of the
transactions.
Foreign exchange gains and losses resulting from the settlement of such transactions and from the translation of assets and liabilities
denominated in foreign currencies at period/year end exchange rates are recognized in the Statement of Comprehensive Income.
Foreign exchange gains and losses relating to cash and cash equivalents are presented in the Statement of Comprehensive Income
within "Net foreign currency exchange gains/losses". Foreign exchange gains and losses relating to the financial assets and liabilities
carried at fair value through profit or loss are presented in the Statement of Comprehensive Income within "Net gains/losses on
investments and derivatives".
(e)(e)(e)(e) Formation expenses Formation expenses Formation expenses Formation expenses
Formation expenses are recognized as an expense in the period in which they are incurred.
(f)(f)(f)(f) Proceeds and payments on allotment and redemption of unitsProceeds and payments on allotment and redemption of unitsProceeds and payments on allotment and redemption of unitsProceeds and payments on allotment and redemption of units
The net asset value per unit is computed for each dealing day. The price at which units are allotted or redeemed is calculated by
reference to the net asset value per unit as at the close of business on the relevant dealing day in accordance with the provisions of the
Fund's Trust Deed dated 24 June 2011, as amended, which may be different from the accounting policies stated in the financial
statements.
Units of the Fund are redeemable at the option of the holders of redeemable units and are classified as a financial liability in the
Statement of Financial Position which represents the net assets attributable to holders of redeemable units (or "net asset value" or "net
assets" or "NAV") and is carried at the redemption amount that would be payable at the Statement of Financial Position date if the
holders of redeemable units exercised the right to redeem units of the Fund.

JPMORGAN MULTI INCOME FUNDJPMORGAN MULTI INCOME FUNDJPMORGAN MULTI INCOME FUNDJPMORGAN MULTI INCOME FUND (Formerly known as JPM Multi Income Fund)(Formerly known as JPM Multi Income Fund)(Formerly known as JPM Multi Income Fund)(Formerly known as JPM Multi Income Fund)
SemiSemiSemiSemi----annual report for theannual report for theannual report for theannual report for the
period ended 31 March 2013period ended 31 March 2013period ended 31 March 2013period ended 31 March 2013
- 214 -
3333 Net assets attributable to holders of redeemable units and number of units in issueNet assets attributable to holders of redeemable units and number of units in issueNet assets attributable to holders of redeemable units and number of units in issueNet assets attributable to holders of redeemable units and number of units in issue
Fair value adjustment of units of the Fund
As stated in Note 2(f), units of the Fund are redeemable at the option of the holders of redeemable units and are classified as a financial
liability in the Statement of Financial Position which represents the net assets attributable to the holders of redeemable units and is carried at
the redemption amount that would be payable at the Statement of Financial Position date, if the holders of redeemable units exercised the
right to redeem units of the Fund. The redemption amount is determined based on the net assets attributable to holders of redeemable units
calculated in accordance with the provisions of the Fund's Trust Deed dated 24 June 2011, as amended ("Trust Deed NAV").
31.3.2013 30.9.2012
US$ US$
Net assets attributable to holders of redeemable units (before fair value adjustment) 1,979,332,518 580,236,354
------------ ------------
Fair value adjustment of units of the Fund:
Difference between bid/ask prices and last traded prices basis in valuing investments and
derivatives as at the end of the period [Note 3(a)] 2,293,053 840,994
Unamortized formation expenses as at the end of the period [Note 3(b)] 16,882 22,706
2,309,935 863,700
------------ ------------
Net assets attributable to holders of redeemable units (after fair value adjustment) 1,981,642,453 581,100,054
Note:
(a) Listed investments, investments and derivatives with prices quoted in over-the-counter markets or by market makers are stated at the
last traded prices for the purpose of the Trust Deed NAV. As stated in Note 2(b), the accounting policy of the Fund for the purpose of
compliance with Hong Kong Accounting Standards ("HKAS") 39, "Financial Instruments: Recognition and Measurement" and for reporting
purposes is to value its investments and derivatives at fair value based on the relevant bid/ask market prices on the Statement of
Financial Position date.
(b) In accordance with the provisions of the Fund's Trust Deed, the formation expenses (including legal, accounting, and other professional
fees and expenses) or costs incidental to the establishment of the Fund will be paid out of the assets of the Fund and amortized over the
first three financial years. However, as stated in Note 2(e), the accounting policy of the Fund for the purpose of compliance with HKAS 38
"Intangible Assets" and for reporting purposes is to expense the expenditure incurred in the formation of the Fund in the period in which
they arose.
Number of units in issue
31.3.2013
AUD Hedged Class CAD Hedged Class EUR Hedged Class GBP Hedged Class HKD Class
Units Units Units Units Units
Number of units in issue: 44,549,129.479 17,791,157.343 3,268,913.368 6,953,072.298 272,232,353.768
A$ C$ EUR GBP HK$
Net assets attributable to
holders of redeemable
units (after fair value
adjustment) 481,480,859 192,579,890 33,942,904 72,528,079 3,091,455,397
Net assets attributable to
holders of redeemable
units (per unit) 10.81 10.82 10.38 10.43 11.36

JPMORGAN MULTI INCOME FUNDJPMORGAN MULTI INCOME FUNDJPMORGAN MULTI INCOME FUNDJPMORGAN MULTI INCOME FUND (Formerly known as JPM Multi Income Fund)(Formerly known as JPM Multi Income Fund)(Formerly known as JPM Multi Income Fund)(Formerly known as JPM Multi Income Fund)
SemiSemiSemiSemi----annual report for theannual report for theannual report for theannual report for the
period ended 31 March 2013period ended 31 March 2013period ended 31 March 2013period ended 31 March 2013
- 215 -
NZD Hedged Class SGD Hedged Class USD Class USD Class (acc)
Units Units Units Units
Number of units in issue: 5,153,730.341 1,750,243.180 58,434,344.612 923,940.847
NZ$ S$ US$ US$
Net assets attributable to
holders of redeemable
units (after fair value
adjustment) 55,690,468 18,259,675 666,238,943 10,528,370
Net assets attributable to
holders of redeemable
units (per unit) 10.81 10.43 11.40 11.40
30.9.2012
AUD Hedged Class CAD Hedged Class EUR Hedged Class GBP Hedged Class HKD Class
Units Units Units Units Units
Number of units in issue: 8,971,681.150 1,545,128.771 18,558.869 12,487.426 116,478,704.286
A$ C$ EUR GBP HK$
Net assets attributable to
holders of redeemable
units (after fair value
adjustment) 93,379,069 16,103,605 186,083 125,395 1,271,524,293
Net assets attributable to
holders of redeemable
units (per unit) 10.41 10.42 10.03 10.04 10.92
NZD Hedged Class SGD Hedged Class USD Class USD Class (acc)
Units Units Units Units
Number of units in issue: 3,014,155.571 24,640.884 25,235,996.952 200.000
NZ$ S$ US$ US$
Net assets attributable to
holders of redeemable
units (after fair value
adjustment) 31,405,670 247,429 276,895,583 2,141
Net assets attributable to
holders of redeemable
units (per unit) 10.42 10.04 10.97 10.71
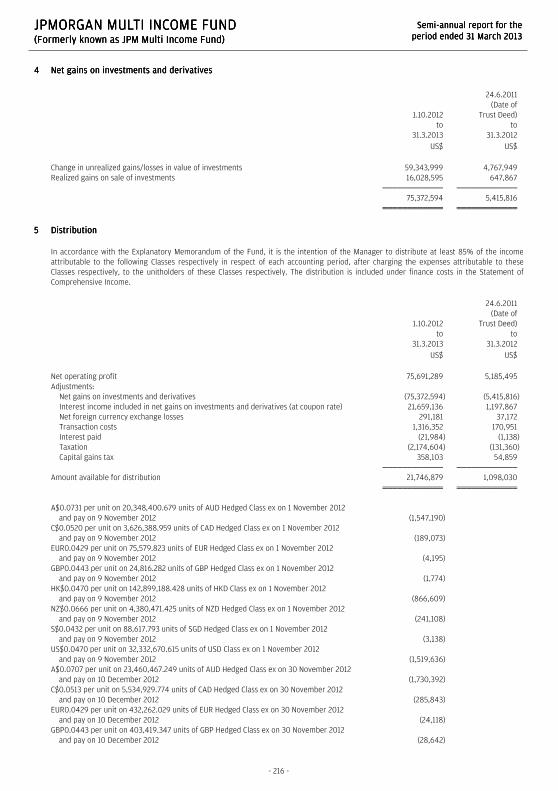
JPMORGAN MULTI INCOME FUNDJPMORGAN MULTI INCOME FUNDJPMORGAN MULTI INCOME FUNDJPMORGAN MULTI INCOME FUND (Formerly known as JPM Multi Income Fund)(Formerly known as JPM Multi Income Fund)(Formerly known as JPM Multi Income Fund)(Formerly known as JPM Multi Income Fund)
SemiSemiSemiSemi----annual report for theannual report for theannual report for theannual report for the
period ended 31 March 2013period ended 31 March 2013period ended 31 March 2013period ended 31 March 2013
- 216 -
4444 Net gains on investments and derivatives Net gains on investments and derivatives Net gains on investments and derivatives Net gains on investments and derivatives
1.10.2012
to
31.3.2013
24.6.2011
(Date of
Trust Deed)
to
31.3.2012
US$ US$
Change in unrealized gains/losses in value of investments 59,343,999 4,767,949
Realized gains on sale of investments 16,028,595 647,867
75,372,594 5,415,816
5555 Distribution Distribution Distribution Distribution
In accordance with the Explanatory Memorandum of the Fund, it is the intention of the Manager to distribute at least 85% of the income
attributable to the following Classes respectively in respect of each accounting period, after charging the expenses attributable to these
Classes respectively, to the unitholders of these Classes respectively. The distribution is included under finance costs in the Statement of
Comprehensive Income.
1.10.2012
to
31.3.2013
24.6.2011
(Date of
Trust Deed)
to
31.3.2012
US$ US$
Net operating profit 75,691,289 5,185,495
Adjustments:
Net gains on investments and derivatives (75,372,594) (5,415,816)
Interest income included in net gains on investments and derivatives (at coupon rate) 21,659,136 1,197,867
Net foreign currency exchange losses 291,181 37,172
Transaction costs 1,316,352 170,951
Interest paid (21,984) (1,138)
Taxation (2,174,604) (131,360)
Capital gains tax 358,103 54,859
Amount available for distribution 21,746,879 1,098,030
A$0.0731 per unit on 20,348,400.679 units of AUD Hedged Class ex on 1 November 2012
and pay on 9 November 2012 (1,547,190)
C$0.0520 per unit on 3,626,388.959 units of CAD Hedged Class ex on 1 November 2012
and pay on 9 November 2012 (189,073)
EUR0.0429 per unit on 75,579.823 units of EUR Hedged Class ex on 1 November 2012
and pay on 9 November 2012 (4,195)
GBP0.0443 per unit on 24,816.282 units of GBP Hedged Class ex on 1 November 2012
and pay on 9 November 2012 (1,774)
HK$0.0470 per unit on 142,899,188.428 units of HKD Class ex on 1 November 2012
and pay on 9 November 2012 (866,609)
NZ$0.0666 per unit on 4,380,471.425 units of NZD Hedged Class ex on 1 November 2012
and pay on 9 November 2012 (241,108)
S$0.0432 per unit on 88,617.793 units of SGD Hedged Class ex on 1 November 2012
and pay on 9 November 2012 (3,138)
US$0.0470 per unit on 32,332,670.615 units of USD Class ex on 1 November 2012
and pay on 9 November 2012 (1,519,636)
A$0.0707 per unit on 23,460,467.249 units of AUD Hedged Class ex on 30 November 2012
and pay on 10 December 2012 (1,730,392)
C$0.0513 per unit on 5,534,929.774 units of CAD Hedged Class ex on 30 November 2012
and pay on 10 December 2012 (285,843)
EUR0.0429 per unit on 432,262.029 units of EUR Hedged Class ex on 30 November 2012
and pay on 10 December 2012 (24,118)
GBP0.0443 per unit on 403,419.347 units of GBP Hedged Class ex on 30 November 2012
and pay on 10 December 2012 (28,642)

JPMORGAN MULTI INCOME FUNDJPMORGAN MULTI INCOME FUNDJPMORGAN MULTI INCOME FUNDJPMORGAN MULTI INCOME FUND (Formerly known as JPM Multi Income Fund)(Formerly known as JPM Multi Income Fund)(Formerly known as JPM Multi Income Fund)(Formerly known as JPM Multi Income Fund)
SemiSemiSemiSemi----annual report for theannual report for theannual report for theannual report for the
period ended 31 March 2013period ended 31 March 2013period ended 31 March 2013period ended 31 March 2013
- 217 -
1.10.2012
to
31.3.2013
24.6.2011
(Date of
Trust Deed)
to
31.3.2012
US$ US$
HK$0.0470 per unit on 163,864,228.554 units of HKD Class ex on 30 November 2012
and pay on 10 December 2012 (993,751)
NZ$0.0657 per unit on 4,798,397.234 units of NZD Hedged Class ex on 30 November 2012
and pay on 10 December 2012 (258,714)
S$0.0433 per unit on 203,691.600 units of SGD Hedged Class ex on 30 November 2012
and pay on 10 December 2012 (7,227)
US$0.0470 per unit on 36,494,189.624 units of USD Class ex on 30 November 2012
and pay on 10 December 2012 (1,715,227)
A$0.0708 per unit on 22,388,123.906 units of AUD Hedged Class ex on 31 December 2012
and pay on 9 January 2013 (1,645,629)
C$0.0516 per unit on 6,048,898.970 units of CAD Hedged Class ex on 31 December 2012
and pay on 9 January 2013 (313,471)
EUR0.0429 per unit on 481,125.373 units of EUR Hedged Class ex on 31 December 2012
and pay on 9 January 2013 (27,212)
GBP0.0435 per unit on 528,591.267 units of GBP Hedged Class ex on 31 December 2012
and pay on 9 January 2013 (37,376)
HK$0.0470 per unit on 173,569,223.398 units of HKD Class ex on 31 December 2012
and pay on 9 January 2013 (1,052,498)
NZ$0.0668 per unit on 4,152,620.546 units of NZD Hedged Class ex on 31 December 2012
and pay on 9 January 2013 (228,851)
S$0.0432 per unit on 190,135.091 units of SGD Hedged Class ex on 31 December 2012
and pay on 9 January 2013 (6,724)
US$0.0470 per unit on 37,491,464.877 units of USD Class ex on 31 December 2012
and pay on 9 January 2013 (1,762,099)
(2012: HK$0.0470 per unit on 10,290,497.587 units of HKD Class ex on 30 December 2011
and pay on 10 January 2012)
(62,274)
(2012: US$0.0470 per unit on 2,397,917.035 units of USD Class ex on 30 December 2011
and pay on 10 January 2012)
(112,702)
A$0.0669 per unit on 23,953,208.781 units of AUD Hedged Class ex on 31 January 2013
and pay on 8 February 2013 (1,671,456)
C$0.0480 per unit on 10,047,112.070 units of CAD Hedged Class ex on 31 January 2013
and pay on 8 February 2013 (482,817)
HK$0.0430 per unit on 202,502,944.377 units of HKD Class ex on 31 January 2013
and pay on 8 February 2013 (1,122,768)
EUR0.0391 per unit on 1,169,107.731 units of EUR Hedged Class ex on 31 January 2013
and pay on 8 February 2013 (62,050)
GBP0.0407 per unit on 1,755,685.850 units of GBP Hedged Class ex on 31 January 2013
and pay on 8 February 2013 (113,291)
NZ$0.0634 per unit on 4,051,142.841 units of NZD Hedged Class ex on 31 January 2013
and pay on 8 February 2013 (215,838)
S$0.0400 per unit on 716,806.678 units of SGD Hedged Class ex on 31 January 2013
and pay on 8 February 2013 (23,164)
US$0.0430 per unit on 46,065,445.631 units of USD Class ex on 31 January 2013
and pay on 8 February 2013 (1,980,814)
(2012: HK$0.0470 per unit on 14,301,938.785 units of HKD Class ex on 31 January 2012
and pay on 8 February 2012)
(86,684)
(2012: US$0.0470 per unit on 3,450,179.255 units of USD Class ex on 31 January 2012
and pay on 8 February 2012)
(162,158)
A$0.0641 per unit on 35,131,315.299 units of AUD Hedged Class ex on 28 February 2013
and pay on 8 March 2013 (2,305,399)
C$0.0473 per unit on 13,147,612.421 units of CAD Hedged Class ex on 28 February 2013
and pay on 8 March 2013 (604,914)
EUR0.0391 per unit on 1,892,743.491 units of EUR Hedged Class ex on 28 February 2013
and pay on 8 March 2013 (96,752)
GBP0.0412 per unit on 3,546,525.161 units of GBP Hedged Class ex on 28 February 2013
and pay on 8 March 2013 (221,798)
HK$0.0430 per unit on 234,058,349.344 units of HKD Class ex on 28 February 2013
and pay on 8 March 2013 (1,297,834)
NZ$0.0611 per unit on 4,272,774.616 units of NZD Hedged Class ex on 28 February 2013
and pay on 8 March 2013 (216,450)

JPMORGAN MULTI INCOME FUNDJPMORGAN MULTI INCOME FUNDJPMORGAN MULTI INCOME FUNDJPMORGAN MULTI INCOME FUND (Formerly known as JPM Multi Income Fund)(Formerly known as JPM Multi Income Fund)(Formerly known as JPM Multi Income Fund)(Formerly known as JPM Multi Income Fund)
SemiSemiSemiSemi----annual report for theannual report for theannual report for theannual report for the
period ended 31 March 2013period ended 31 March 2013period ended 31 March 2013period ended 31 March 2013
- 218 -
1.10.2012
to
31.3.2013
24.6.2011
(Date of
Trust Deed)
to
31.3.2012
US$ US$
S$0.0394 per unit on 1,318,767.773 units of SGD Hedged Class ex on 28 February 2013
and pay on 8 March 2013 (41,979)
US$0.0430 per unit on 52,397,909.481 units of USD Class ex on 28 February 2013
and pay on 8 March 2013 (2,253,110)
(2012: HK$0.0470 per unit on 25,633,166.224 units of HKD Class ex on 29 February 2012
and pay on 8 March 2012)
(155,339)
(2012: US$0.0470 per unit on 5,896,881.350 units of USD Class ex on 29 February 2012
and pay on 8 March 2012)
(277,153)
A$0.0664 per unit on 44,440,020.444 units of AUD Hedged Class ex on 28 March 2013
and pay on 10 April 2013 (3,076,376)
C$0.0482 per unit on 17,686,146.899 units of CAD Hedged Class ex on 28 March 2013
and pay on 10 April 2013 (839,089)
EUR0.0391 per unit on 3,225,750.579 units of EUR Hedged Class ex on 28 March 2013
and pay on 10 April 2013 (161,959)
GBP0.0413 per unit on 6,798,724.005 units of GBP Hedged Class ex on 28 March 2013
and pay on 10 April 2013 (426,361)
HK$0.0430 per unit on 270,583,135.101 units of HKD Class ex on 28 March 2013
and pay on 10 April 2013 (1,498,853)
NZ$0.0633 per unit on 5,147,897.351 units of NZD Hedged Class ex on 28 March 2013
and pay on 10 April 2013 (273,072)
S$0.0393 per unit on 1,727,703.239 units of SGD Hedged Class ex on 28 March 2013
and pay on 10 April 2013 (54,731)
US$0.0430 per unit on 58,125,865.992 units of USD Class ex on 28 March 2013
and pay on 10 April 2013 (2,499,412)
(2012: HK$0.0470 per unit on 43,335,808.91 units of HKD Class ex on 30 March 2012
and pay on 12 April 2012)
(262,336)
(2012: US$0.0470 per unit on 8,729,542.674 units of USD Class ex on 30 March 2012
and pay on 12 April 2012)
(410,289)
Total distribution to holders of redeemable units (36,030,784) (1,528,935)
In the event that the amount available for distribution is insufficient to pay distributions as the Fund declares, the Manager may in its
discretion determine that such distributions be paid from capital.
6666 Soft commission arrangementsSoft commission arrangementsSoft commission arrangementsSoft commission arrangements
The Investment Manager has entered into soft commission arrangements with brokers under which certain goods and services used to
support investment decision making are received by the Investment Manager. The Investment Manager does not make direct payment for
these services but transacts an agreed amount of business with the brokers on behalf of the Fund. Commission is paid from the Fund on these
transactions.
The goods and services must be of demonstrable benefit to the Fund and may include research and advisory services; economic and political
analysis; portfolio analysis, including valuation and performance measurement; market analysis, data and quotation services, computer
hardware and software incidental to the above goods and services; clearing and custodian services and investment-related publications.

JPMORGAN PACIFIC SECURITIES FUND JPMORGAN PACIFIC SECURITIES FUND JPMORGAN PACIFIC SECURITIES FUND JPMORGAN PACIFIC SECURITIES FUND (Formerly known as JF Pacific Securities Fund)(Formerly known as JF Pacific Securities Fund)(Formerly known as JF Pacific Securities Fund)(Formerly known as JF Pacific Securities Fund)
SemiSemiSemiSemi----annual report for theannual report for theannual report for theannual report for the
period ended 31 March 2013period ended 31 March 2013period ended 31 March 2013period ended 31 March 2013
- 219 -
Distributor StatusDistributor StatusDistributor StatusDistributor Status
The Fund has been certified by HMRC in the UK as a
distributing fund in respect of the period from 1 January
1984 to 30 September 2010. The principal effect of this
certification is that for unitholders resident or ordinarily
resident in the UK for taxation purposes any gains accruing
on the sale, redemption or other disposal of units during
the period will be taxed in the UK as a capital gain and not
as income. This treatment will continue under the new UK
reporting fund regime provided the Fund does not invest
more than 5% of its assets in other offshore funds which
are not themselves reporting funds. There will be no need
to formally apply for reporting fund status as the Fund is
transparent for UK tax purposes and therefore considered
out of scope of the requirements of this new regime.
As noted, the Fund is transparent for UK income tax
purposes and UK investors are subject to UK capital gains
tax on disposal of their units. UK investors are subject to tax
on their share of income of the Fund on an arising basis.
Information has been provided to UK investors of the
amount of their share of the underlying income, expenses
and overseas tax suffered.
Investment PortfolioInvestment PortfolioInvestment PortfolioInvestment Portfolio
As at 31 March 2013As at 31 March 2013As at 31 March 2013As at 31 March 2013 (Unaudited)(Unaudited)(Unaudited)(Unaudited)
HoldingHoldingHoldingHolding
FairFairFairFair
valuevaluevaluevalue
US$US$US$US$
% of% of% of% of
netnetnetnet
assetsassetsassetsassets
Listed/Quoted InvestmentsListed/Quoted InvestmentsListed/Quoted InvestmentsListed/Quoted Investments (105.9%)
(I) Equities(I) Equities(I) Equities(I) Equities (102.2%)
AustraliaAustraliaAustraliaAustralia (14.1%)
Aurizon Holdings 500,000 2,100,738 0.5
Australia & NZ Bkg Group-
AU List 300,000 8,916,930 2.2
BHP Billiton 300,000 10,243,055 2.6
Commonwealth Bank of
Australia 70,000 4,962,538 1.2
Computershare Ltd 250,000 2,608,981 0.7
CSL Ltd 60,000 3,703,138 0.9
Insurance Australia Group 400,000 2,377,014 0.6
Macquarie Group 60,000 2,311,333 0.6
Oil Search 250,000 1,926,111 0.5
Rio Tinto-AU List 40,000 2,385,354 0.6
Telstra Corp 1,500,000 7,052,851 1.8
Westpac Banking 230,000 7,349,456 1.9
ChinaChinaChinaChina (17.3%)
Agricultural Bank of China
'H' 7,000,000 3,354,525 0.8
Anhui Conch Cement 'H' 600,000 1,990,300 0.5
Bank of China 'H' 5,000,000 2,318,796 0.6
China Construction Bank
'H' 8,000,588 6,534,331 1.6
China Mobile 400,000 4,230,514 1.1
China Overseas Land &
Investment 2,300,000 6,340,618 1.6
China Pacific Insurance
(Group) 'H' 900,000 2,962,262 0.7
(Continued)
HoldingHoldingHoldingHolding
FairFairFairFair
valuevaluevaluevalue
US$US$US$US$
% of% of% of% of
netnetnetnet
assetsassetsassetsassets
China Petroleum &
Chemical 'H' 3,600,000 4,229,483 1.1
China Resources Land 1,000,000 2,788,996 0.7
China Shenhua Energy 'H' 600,000 2,179,668 0.6
China State Construction
Intl 2,800,000 3,809,009 1.0
CNOOC Ltd 3,200,000 6,142,232 1.5
Geely Automobile Hldgs 6,000,000 2,913,953 0.7
Haier Electronics Group 1,200,000 1,913,779 0.5
Ind & Comm Bank of China
'H' 8,000,000 5,596,027 1.4
Ping An Insurance (Group)
'H' 700,000 5,424,050 1.4
Tencent Hldgs 190,000 6,035,825 1.5
Hong KongHong KongHong KongHong Kong (7.6%)
AIA Group 1,500,000 6,550,598 1.6
BOC Hong Kong (Hldgs) 800,000 2,664,039 0.7
Cheung Kong (Hldgs) 370,000 5,452,777 1.4
Galaxy Entertainment
Group 800,000 3,333,913 0.8
HSBC Hldgs-HK List 400,000 4,222,785 1.1
Jardine Matheson Hldgs 37,184 2,420,678 0.6
Jardine Strategic Hldgs
(CDP) 60,474 2,393,561 0.6
Sands China 600,000 3,099,457 0.8
IndiaIndiaIndiaIndia (2.4%)
HDFC Bank ADR 70,000 2,618,700 0.7
Larsen & Toubro GDR-
RegS 100,000 2,510,000 0.6
Mahindra & Mahindra
GDR-RegS 150,000 2,380,500 0.6
Tata Motors ADR 80,000 1,952,000 0.5
IndonesiaIndonesiaIndonesiaIndonesia (1.7%)
Bank Mandiri (Persero) 3,000,000 3,087,214 0.8
Indocement Tunggal
Prakarsa 1,100,000 2,626,190 0.7
Matahari Department
Store 823,000 931,618 0.2
JapanJapanJapanJapan (35.8%)
Aeon Co 250,000 3,230,696 0.8
Canon Inc 250,000 9,040,630 2.3
Daito Trust Construction 55,000 4,691,555 1.2
DeNA Co 8,900 240,154 0.1
Fanuc Corp 40,000 6,156,137 1.5
Hino Motors 700,000 7,497,341 1.9
Hitachi Ltd 1,000,000 5,775,367 1.4
Honda Motor 120,000 4,537,332 1.1
Isuzu Motors 1,600,000 9,444,799 2.4
Komatsu Ltd 100,000 2,392,044 0.6
Makita Corp 60,000 2,728,143 0.7
Marubeni Corp 400,000 2,990,853 0.7
Mitsubishi UFJ Financial
Group 1,700,000 10,071,262 2.5
MS&AD Insurance Group
Hldgs 150,000 3,296,107 0.8
Nikon Corp 300,000 7,115,507 1.8
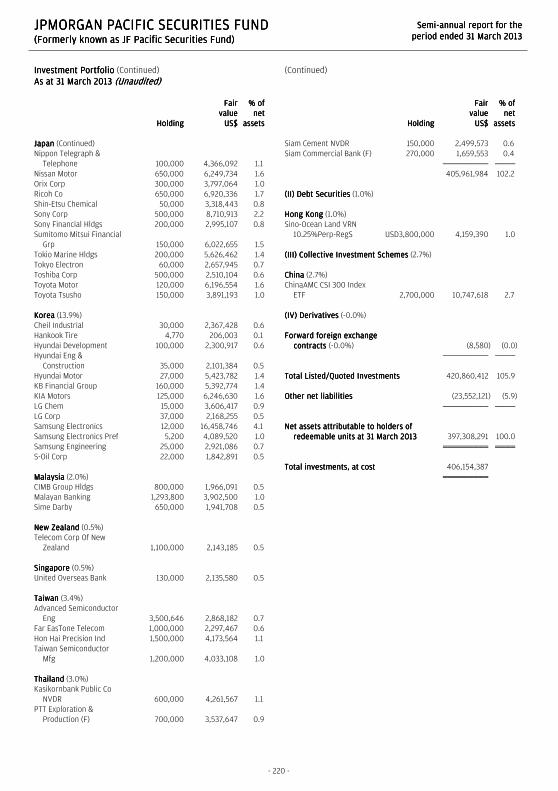
JPMORGAN PACIFIC SECURITIES FUND JPMORGAN PACIFIC SECURITIES FUND JPMORGAN PACIFIC SECURITIES FUND JPMORGAN PACIFIC SECURITIES FUND (Formerly known as JF Pacific Securities Fund)(Formerly known as JF Pacific Securities Fund)(Formerly known as JF Pacific Securities Fund)(Formerly known as JF Pacific Securities Fund)
SemiSemiSemiSemi----annual report for theannual report for theannual report for theannual report for the
period ended 31 March 2013period ended 31 March 2013period ended 31 March 2013period ended 31 March 2013
- 220 -
Investment PortfolioInvestment PortfolioInvestment PortfolioInvestment Portfolio (Continued)
As at 31 March 2013As at 31 March 2013As at 31 March 2013As at 31 March 2013 (Unaudited)(Unaudited)(Unaudited)(Unaudited)
HoldingHoldingHoldingHolding
FairFairFairFair
valuevaluevaluevalue
US$US$US$US$
% of% of% of% of
netnetnetnet
assetsassetsassetsassets
JapanJapanJapanJapan (Continued)
Nippon Telegraph &
Telephone 100,000 4,366,092 1.1
Nissan Motor 650,000 6,249,734 1.6
Orix Corp 300,000 3,797,064 1.0
Ricoh Co 650,000 6,920,336 1.7
Shin-Etsu Chemical 50,000 3,318,443 0.8
Sony Corp 500,000 8,710,913 2.2
Sony Financial Hldgs 200,000 2,995,107 0.8
Sumitomo Mitsui Financial
Grp 150,000 6,022,655 1.5
Tokio Marine Hldgs 200,000 5,626,462 1.4
Tokyo Electron 60,000 2,657,945 0.7
Toshiba Corp 500,000 2,510,104 0.6
Toyota Motor 120,000 6,196,554 1.6
Toyota Tsusho 150,000 3,891,193 1.0
KoreaKoreaKoreaKorea (13.9%)
Cheil Industrial 30,000 2,367,428 0.6
Hankook Tire 4,770 206,003 0.1
Hyundai Development 100,000 2,300,917 0.6
Hyundai Eng &
Construction 35,000 2,101,384 0.5
Hyundai Motor 27,000 5,423,782 1.4
KB Financial Group 160,000 5,392,774 1.4
KIA Motors 125,000 6,246,630 1.6
LG Chem 15,000 3,606,417 0.9
LG Corp 37,000 2,168,255 0.5
Samsung Electronics 12,000 16,458,746 4.1
Samsung Electronics Pref 5,200 4,089,520 1.0
Samsung Engineering 25,000 2,921,086 0.7
S-Oil Corp 22,000 1,842,891 0.5
MalaysiaMalaysiaMalaysiaMalaysia (2.0%)
CIMB Group Hldgs 800,000 1,966,091 0.5
Malayan Banking 1,293,800 3,902,500 1.0
Sime Darby 650,000 1,941,708 0.5
New ZealandNew ZealandNew ZealandNew Zealand (0.5%)
Telecom Corp Of New
Zealand 1,100,000 2,143,185 0.5
SingaporeSingaporeSingaporeSingapore (0.5%)
United Overseas Bank 130,000 2,135,580 0.5
TaiwanTaiwanTaiwanTaiwan (3.4%)
Advanced Semiconductor
Eng 3,500,646 2,868,182 0.7
Far EasTone Telecom 1,000,000 2,297,467 0.6
Hon Hai Precision Ind 1,500,000 4,173,564 1.1
Taiwan Semiconductor
Mfg 1,200,000 4,033,108 1.0
ThailandThailandThailandThailand (3.0%)
Kasikornbank Public Co
NVDR 600,000 4,261,567 1.1
PTT Exploration &
Production (F) 700,000 3,537,647 0.9
(Continued)
HoldingHoldingHoldingHolding
FairFairFairFair
valuevaluevaluevalue
US$US$US$US$
% of% of% of% of
netnetnetnet
assetsassetsassetsassets
Siam Cement NVDR 150,000 2,499,573 0.6
Siam Commercial Bank (F) 270,000 1,659,553 0.4
405,961,984 102.2
(II) Debt Securities(II) Debt Securities(II) Debt Securities(II) Debt Securities (1.0%)
Hong KongHong KongHong KongHong Kong (1.0%)
Sino-Ocean Land VRN
10.25%Perp-RegS USD3,800,000 4,159,390 1.0
(III) Collective Investment Schemes(III) Collective Investment Schemes(III) Collective Investment Schemes(III) Collective Investment Schemes (2.7%)
ChinaChinaChinaChina (2.7%)
ChinaAMC CSI 300 Index
ETF 2,700,000 10,747,618 2.7
(IV) Derivatives(IV) Derivatives(IV) Derivatives(IV) Derivatives (-0.0%)
Forward foreign exchangeForward foreign exchangeForward foreign exchangeForward foreign exchange
contracts contracts contracts contracts (-0.0%) (8,580) (0.0)
Total Listed/Quoted InvestmentsTotal Listed/Quoted InvestmentsTotal Listed/Quoted InvestmentsTotal Listed/Quoted Investments 420,860,412 105.9
Other net liabilitiesOther net liabilitiesOther net liabilitiesOther net liabilities (23,552,121) (5.9)
Net assets Net assets Net assets Net assets attributable to holders of attributable to holders of attributable to holders of attributable to holders of
redeemable units at 31 March 2013redeemable units at 31 March 2013redeemable units at 31 March 2013redeemable units at 31 March 2013 397,308,291 100.0
Total investments, at costTotal investments, at costTotal investments, at costTotal investments, at cost 406,154,387

JPMORGAN PACIFIC SECURITIES FUND JPMORGAN PACIFIC SECURITIES FUND JPMORGAN PACIFIC SECURITIES FUND JPMORGAN PACIFIC SECURITIES FUND (Formerly known as JF Pacific Securities Fund)(Formerly known as JF Pacific Securities Fund)(Formerly known as JF Pacific Securities Fund)(Formerly known as JF Pacific Securities Fund)
SemiSemiSemiSemi----annual report for theannual report for theannual report for theannual report for the
period ended 31 March 2013period ended 31 March 2013period ended 31 March 2013period ended 31 March 2013
- 221 -
Statement of Movements in Portfolio HoldingsStatement of Movements in Portfolio HoldingsStatement of Movements in Portfolio HoldingsStatement of Movements in Portfolio Holdings
For the period ended 31 March 2013For the period ended 31 March 2013For the period ended 31 March 2013For the period ended 31 March 2013 (Unaudited)(Unaudited)(Unaudited)(Unaudited)
% % % % holdingsholdingsholdingsholdings
of net assetsof net assetsof net assetsof net assets
31.3.201331.3.201331.3.201331.3.2013 30.9.201230.9.201230.9.201230.9.2012
Listed/Quoted InvestmentsListed/Quoted InvestmentsListed/Quoted InvestmentsListed/Quoted Investments
EquitiesEquitiesEquitiesEquities
Japan 35.8 27.7
China 17.3 17.4
Australia 14.1 7.6
Korea 13.9 13.6
Hong Kong 7.6 10.5
Taiwan 3.4 4.5
Thailand 3.0 4.6
India 2.4 -
Malaysia 2.0 2.7
Indonesia 1.7 3.5
New Zealand 0.5 -
Singapore 0.5 4.5
United Kingdom - 2.5
Philippines - 0.9
Debt SecuritiesDebt SecuritiesDebt SecuritiesDebt Securities
Hong Kong 1.0 -
Collective Investment SchemesCollective Investment SchemesCollective Investment SchemesCollective Investment Schemes
China 2.7 -
DerivativesDerivativesDerivativesDerivatives
Forward foreign exchange contracts (0.0) 0.0
Total Listed/Quoted InvestmentsTotal Listed/Quoted InvestmentsTotal Listed/Quoted InvestmentsTotal Listed/Quoted Investments 105.9 100.0
Other net (liabilities)/assetsOther net (liabilities)/assetsOther net (liabilities)/assetsOther net (liabilities)/assets (5.9) 0.0
Net assets attributable to holders of Net assets attributable to holders of Net assets attributable to holders of Net assets attributable to holders of
redeemable unitsredeemable unitsredeemable unitsredeemable units 100.0 100.0

JPMORGAN PACIFIC SECURITIES FUND JPMORGAN PACIFIC SECURITIES FUND JPMORGAN PACIFIC SECURITIES FUND JPMORGAN PACIFIC SECURITIES FUND (Formerly known as JF Pacific Securities Fund)(Formerly known as JF Pacific Securities Fund)(Formerly known as JF Pacific Securities Fund)(Formerly known as JF Pacific Securities Fund)
SemiSemiSemiSemi----annual report for theannual report for theannual report for theannual report for the
period ended 31 March 2013period ended 31 March 2013period ended 31 March 2013period ended 31 March 2013
The notes on pages 224 to 226 form part of these financial statements.
- 222 -
Statement of Financial PositionStatement of Financial PositionStatement of Financial PositionStatement of Financial Position
As at 31 March 2013As at 31 March 2013As at 31 March 2013As at 31 March 2013 (Unaudited)(Unaudited)(Unaudited)(Unaudited)
31.3.201331.3.201331.3.201331.3.2013 30.9.201230.9.201230.9.201230.9.2012
US$US$US$US$ US$US$US$US$
AssetsAssetsAssetsAssets
Cash at banks 726,783 2,178,054
Amounts due from brokers - 16,492,404
Amounts receivable on allotment 2,030,962 595,851
Margin deposits 47 47
Derivatives - 77,542
Investments 420,868,992 375,532,374
Dividend and other accounts
receivable 2,963,131 2,244,724
Total assetsTotal assetsTotal assetsTotal assets 426,589,915 397,120,996
---------- ----------
LiabilitiesLiabilitiesLiabilitiesLiabilities
Short term bank loans - unsecured 27,149,742 1,842,129
Amounts due to brokers - 18,199,642
Amounts payable on redemption 1,642,567 792,827
Derivatives 8,580 -
Other accounts payable 480,735 502,768
Total liabilitiesTotal liabilitiesTotal liabilitiesTotal liabilities 29,281,624 21,337,366
---------- ----------
Net assets attributable to holders Net assets attributable to holders Net assets attributable to holders Net assets attributable to holders
of redeemable units of redeemable units of redeemable units of redeemable units [Note 3] 397,308,291 375,783,630
EquityEquityEquityEquity 397,308,291 375,783,630
Statement of Comprehensive IncomeStatement of Comprehensive IncomeStatement of Comprehensive IncomeStatement of Comprehensive Income
For the period ended 31 March 2013For the period ended 31 March 2013For the period ended 31 March 2013For the period ended 31 March 2013 (Unaudited)(Unaudited)(Unaudited)(Unaudited)
1.10.20121.10.20121.10.20121.10.2012
totototo
31.3.201331.3.201331.3.201331.3.2013
1.10.20111.10.20111.10.20111.10.2011
totototo
31.3.201231.3.201231.3.201231.3.2012
US$US$US$US$ US$US$US$US$
IncomeIncomeIncomeIncome
Net gains on investments and
derivatives [Note 4] 44,666,717 56,047,883
Dividend income 3,722,538 3,448,259
Net foreign currency exchange
gains/(losses) 166,283 (667,063)
Interest on deposits 613 742
Other income - 20,566
48,556,151 58,850,387
---------- ----------
ExpensesExpensesExpensesExpenses
Management fee 2,873,392 2,715,416
Transaction costs 1,578,374 1,101,106
Trustee's fee 57,072 63,174
Registrar's fee 42,838 41,877
Safe custody and bank charges 38,442 35,428
Auditor's fee 9,564 10,152
Valuation fee 8,330 8,610
Legal and professional expenses 2,619 310
Printing and publication expenses 2,088 2,221
Other operating expenses 4,454 2,129
4,617,173 3,980,423
---------- ----------
Net operating profitNet operating profitNet operating profitNet operating profit 43,938,978 54,869,964
Finance costsFinance costsFinance costsFinance costs
Interest paid (78,367) (2,589)
Profit before taxationProfit before taxationProfit before taxationProfit before taxation 43,860,611 54,867,375
Taxation (332,288) (235,226)
Increase in net assets Increase in net assets Increase in net assets Increase in net assets
attributable to holders of attributable to holders of attributable to holders of attributable to holders of
redeemable units and total redeemable units and total redeemable units and total redeemable units and total
comprehensive incomecomprehensive incomecomprehensive incomecomprehensive income 43,528,323 54,632,149
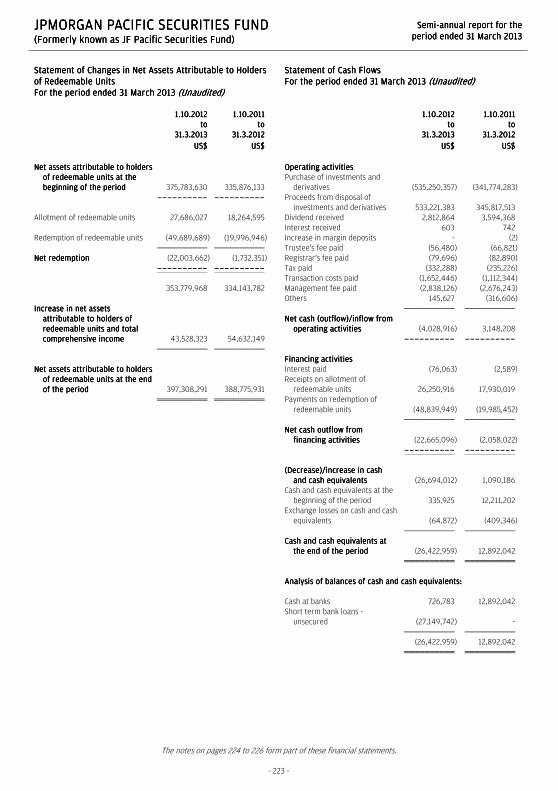
JPMORGAN PACIFIC SECURITIES FUND JPMORGAN PACIFIC SECURITIES FUND JPMORGAN PACIFIC SECURITIES FUND JPMORGAN PACIFIC SECURITIES FUND (Formerly known as JF Pacific Securities Fund)(Formerly known as JF Pacific Securities Fund)(Formerly known as JF Pacific Securities Fund)(Formerly known as JF Pacific Securities Fund)
SemiSemiSemiSemi----annual report for theannual report for theannual report for theannual report for the
period ended 31 March 2013period ended 31 March 2013period ended 31 March 2013period ended 31 March 2013
The notes on pages 224 to 226 form part of these financial statements.
- 223 -
Statement of Changes in Net Assets Attributable to Holders Statement of Changes in Net Assets Attributable to Holders Statement of Changes in Net Assets Attributable to Holders Statement of Changes in Net Assets Attributable to Holders
of Redeemable of Redeemable of Redeemable of Redeemable UnitsUnitsUnitsUnits
For the period ended 31 March 2013For the period ended 31 March 2013For the period ended 31 March 2013For the period ended 31 March 2013 (Unaudited)(Unaudited)(Unaudited)(Unaudited)
1.10.20121.10.20121.10.20121.10.2012
totototo
31.3.201331.3.201331.3.201331.3.2013
1.10.20111.10.20111.10.20111.10.2011
totototo
31.3.201231.3.201231.3.201231.3.2012
US$US$US$US$ US$US$US$US$
Net assets attributable to holders Net assets attributable to holders Net assets attributable to holders Net assets attributable to holders
of redeemable units at the of redeemable units at the of redeemable units at the of redeemable units at the
beginning of the periodbeginning of the periodbeginning of the periodbeginning of the period 375,783,630 335,876,133
---------- ----------
Allotment of redeemable units 27,686,027 18,264,595
Redemption of redeemable units (49,689,689) (19,996,946)
Net redemptionNet redemptionNet redemptionNet redemption (22,003,662) (1,732,351)
---------- ----------
353,779,968 334,143,782
Increase in net Increase in net Increase in net Increase in net assets assets assets assets
attributable to holders of attributable to holders of attributable to holders of attributable to holders of
redeemable units and total redeemable units and total redeemable units and total redeemable units and total
comprehensive incomecomprehensive incomecomprehensive incomecomprehensive income 43,528,323 54,632,149
Net assets attributable to holders Net assets attributable to holders Net assets attributable to holders Net assets attributable to holders
of redeemable units at the end of redeemable units at the end of redeemable units at the end of redeemable units at the end
of the periodof the periodof the periodof the period 397,308,291 388,775,931
Statement of Cash FlowsStatement of Cash FlowsStatement of Cash FlowsStatement of Cash Flows
For the period ended 31 March 2013For the period ended 31 March 2013For the period ended 31 March 2013For the period ended 31 March 2013 (Unaudited)(Unaudited)(Unaudited)(Unaudited)
1.10.20121.10.20121.10.20121.10.2012
totototo
31.3.201331.3.201331.3.201331.3.2013
1.10.20111.10.20111.10.20111.10.2011
totototo
31.3.201231.3.201231.3.201231.3.2012
US$US$US$US$ US$US$US$US$
Operating activitiesOperating activitiesOperating activitiesOperating activities
Purchase of investments and
derivatives (535,250,357) (341,774,283)
Proceeds from disposal of
investments and derivatives 533,221,383 345,817,513
Dividend received 2,812,864 3,594,368
Interest received 603 742
Increase in margin deposits - (2)
Trustee's fee paid (56,480) (66,821)
Registrar's fee paid (79,696) (82,890)
Tax paid (332,288) (235,226)
Transaction costs paid (1,652,446) (1,112,344)
Management fee paid (2,838,126) (2,676,243)
Others 145,627 (316,606)
Net cash (outflow)/inflow from Net cash (outflow)/inflow from Net cash (outflow)/inflow from Net cash (outflow)/inflow from
operating activitiesoperating activitiesoperating activitiesoperating activities (4,028,916) 3,148,208
---------- ----------
Financing activitiesFinancing activitiesFinancing activitiesFinancing activities
Interest paid (76,063) (2,589)
Receipts on allotment of
redeemable units 26,250,916 17,930,019
Payments on redemption of
redeemable units (48,839,949) (19,985,452)
Net cash outflow from Net cash outflow from Net cash outflow from Net cash outflow from
financing activitiesfinancing activitiesfinancing activitiesfinancing activities (22,665,096) (2,058,022)
---------- ----------
(Decrease)/increase in cash (Decrease)/increase in cash (Decrease)/increase in cash (Decrease)/increase in cash
and cash equivalentsand cash equivalentsand cash equivalentsand cash equivalents (26,694,012) 1,090,186
Cash and cash equivalents at the
beginning of the period 335,925 12,211,202
Exchange losses on cash and cash
equivalents (64,872) (409,346)
Cash and cash equivalents at Cash and cash equivalents at Cash and cash equivalents at Cash and cash equivalents at
the end of the periodthe end of the periodthe end of the periodthe end of the period (26,422,959) 12,892,042
Analysis of balances of cash and cash equivalents:Analysis of balances of cash and cash equivalents:Analysis of balances of cash and cash equivalents:Analysis of balances of cash and cash equivalents:
Cash at banks 726,783 12,892,042
Short term bank loans -
unsecured (27,149,742) -
(26,422,959) 12,892,042

JPMORGAN PACIFIC SECURITIES FUNDJPMORGAN PACIFIC SECURITIES FUNDJPMORGAN PACIFIC SECURITIES FUNDJPMORGAN PACIFIC SECURITIES FUND (Formerly known as JF Pacific Securities Fund)(Formerly known as JF Pacific Securities Fund)(Formerly known as JF Pacific Securities Fund)(Formerly known as JF Pacific Securities Fund)
SemiSemiSemiSemi----annual report for theannual report for theannual report for theannual report for the
period ended period ended period ended period ended 31 March 201331 March 201331 March 201331 March 2013
- 224 -
Notes to the Financial StatementsNotes to the Financial StatementsNotes to the Financial StatementsNotes to the Financial Statements
1111 The FundThe FundThe FundThe Fund
JPMorgan Pacific Securities Fund (the "Fund") was established under a Trust Deed dated 7 April 1978, as amended, and is governed by the
laws of Hong Kong. The Fund is authorized by the Securities and Futures Commission of Hong Kong.
With effect from 4 February 2013, the name of the Fund was changed from JF Pacific Securities Fund to JPMorgan Pacific Securities Fund.
The investment objective of the Fund is to provide investors with long-term capital growth by investing primarily in the securities of
companies in the Asia-Pacific region, including Japan, Australia and New Zealand.
Pursuant to the Supplemental Trust Deed dated 4 January 2013, the Manager may decide to issue separate classes (each a "Class") whose
assets will be commonly invested but where a specific fee structure, currency or distribution policy may be applied. Each Class may have a
different charging structure with the result that the net asset value attributable to each Class may differ.
All unitholders' rights with regard to the convening, voting or otherwise acting at any meeting of unitholders are the same.
2222 Summary of principal accounting policiesSummary of principal accounting policiesSummary of principal accounting policiesSummary of principal accounting policies
(a)(a)(a)(a) Accounting policies of interim financial statementsAccounting policies of interim financial statementsAccounting policies of interim financial statementsAccounting policies of interim financial statements
The accounting policies and methods of computation used in the preparation of these unaudited condensed interim financial statements
are consistent with those used in the annual financial statements for the year ended 30 September 2012.
(b)(b)(b)(b) Investments and derivatives Investments and derivatives Investments and derivatives Investments and derivatives
Classification
The Fund classifies its investments and derivatives as financial assets or financial liabilities at fair value through profit or loss. These
financial assets or financial liabilities are held-for-trading as they are acquired or incurred principally for the purpose of selling or
repurchasing in the near term or short-term profit taking.
All derivatives are carried in assets when amounts are receivable by the Fund and in liabilities when amounts are payable by the Fund.
The Fund makes short sales in which a borrowed security is sold in anticipation of a decline in the market value of that security, or it may
use short sales for various arbitrage transactions. Short sales are classified as financial liabilities at fair value through profit or loss.
Recognition, derecognition and measurement
Purchases and sales of investments and derivatives are accounted for on the trade date basis. Investments and derivatives are initially
recognized at fair value and are subsequently re-measured at fair value. Realized and unrealized gains and losses on investments and
derivatives are recognized in the Statement of Comprehensive Income. Investments and derivatives are derecognized when the rights to
receive cash flows from the investments and derivatives have expired or the Fund has transferred substantially all risks and rewards of
ownership.
Fair value estimation
Investments that are listed or traded on an exchange and investments with prices quoted in over-the-counter markets or by market
makers, are fair valued based on quoted "bid" prices on long investments and quoted "ask" prices on investments sold short. When
trading in the securities of an investee company is suspended, the investment is valued at the Manager's estimate of its fair value.
Debt securities are fair valued based on quoted prices inclusive of accrued interest.
Investments in collective investment schemes are stated at fair value based on the net asset value per unit of the respective funds as
determined by the administrators of the relevant funds or stated at "bid" prices if the collective investment schemes are listed or traded
on an exchange.
Open future and swap contracts are valued at "bid" prices for long positions and "ask" prices for short positions at the valuation date.
The differences between the bid/ask prices and the contract prices are recognized in the Statement of Comprehensive Income.
Open option contracts are valued at "bid" prices for long positions and "ask" prices for short positions at the valuation date. The
differences between the bid/ask prices and the premium amounts/contract prices are recognized in the Statement of Comprehensive
Income.

JPMORGAN PACIFIC SECURITIES FUNDJPMORGAN PACIFIC SECURITIES FUNDJPMORGAN PACIFIC SECURITIES FUNDJPMORGAN PACIFIC SECURITIES FUND (Formerly known as JF Pacific Securities Fund)(Formerly known as JF Pacific Securities Fund)(Formerly known as JF Pacific Securities Fund)(Formerly known as JF Pacific Securities Fund)
SemiSemiSemiSemi----annual report for theannual report for theannual report for theannual report for the
period ended period ended period ended period ended 31 March 201331 March 201331 March 201331 March 2013
- 225 -
Forward foreign exchange contracts are valued at the forward rates ruling at the valuation date. The differences between the forward
rates and the contract rates are recognized in the Statement of Comprehensive Income.
(c)(c)(c)(c) Securities lending and borrowing Securities lending and borrowing Securities lending and borrowing Securities lending and borrowing
Securities lenders' agreements are entered into with institutions of appropriate financial standing who engage in such arrangements
acceptable to the Trustee and on arm's length commercial terms. Securities lent are included in the investment portfolio of the Fund.
Relevant securities lending income entitled by the Fund is accounted for in the Statement of Comprehensive Income. Collateral received
for the purpose of securities lent generally consist of non-cash collateral which are off-balance sheet transactions and are therefore not
included in the financial statements.
The Fund may enter into securities borrowing arrangements for short sale purposes. Short positions represent obligations to deliver
securities sold but not yet purchased, and are accounted for as investments and valued at their fair value. Securities borrowed during the
period/year are off-balance sheet transactions and are therefore not included in the investment portfolio of the Fund. Collateral placed
for the purpose of securities borrowed generally consist of cash collateral and are included in the Statement of Financial Position
separately.
(d)(d)(d)(d) Foreign currency translationForeign currency translationForeign currency translationForeign currency translation
Functional and presentation currency
The Fund has adopted United States dollar as its functional and presentation currency.
Transactions and balances
Foreign currency transactions are translated into the functional currency using the exchange rates prevailing at the dates of the
transactions.
Foreign exchange gains and losses resulting from the settlement of such transactions and from the translation of assets and liabilities
denominated in foreign currencies at period/year end exchange rates are recognized in the Statement of Comprehensive Income.
Foreign exchange gains and losses relating to cash and cash equivalents are presented in the Statement of Comprehensive Income
within "Net foreign currency exchange gains/losses". Foreign exchange gains and losses relating to the financial assets and liabilities
carried at fair value through profit or loss are presented in the Statement of Comprehensive Income within "Net gains/losses on
investments and derivatives".
(e)(e)(e)(e) Proceeds and payments on allotment and redemption of unitsProceeds and payments on allotment and redemption of unitsProceeds and payments on allotment and redemption of unitsProceeds and payments on allotment and redemption of units
The net asset value per unit is computed for each dealing day. The price at which units are allotted or redeemed is calculated by
reference to the net asset value per unit as at the close of business on the relevant dealing day in accordance with the provisions of the
Fund's Trust Deed dated 7 April 1978, as amended, which may be different from the accounting policies stated in the financial statements.
3333 Number of units in issue and net assets attributable to holders of redeemable units (per unit)Number of units in issue and net assets attributable to holders of redeemable units (per unit)Number of units in issue and net assets attributable to holders of redeemable units (per unit)Number of units in issue and net assets attributable to holders of redeemable units (per unit)
31.3.2013 30.9.2012
Units Units
Number of units in issue 1,654,452.745 1,752,988.978
US$ US$
Net assets attributable to holders of redeemable units 397,308,291 375,783,630
Net assets attributable to holders of redeemable units (per unit) 240.14 214.37

JPMORGAN PACIFIC SECURITIES FUNDJPMORGAN PACIFIC SECURITIES FUNDJPMORGAN PACIFIC SECURITIES FUNDJPMORGAN PACIFIC SECURITIES FUND (Formerly known as JF Pacific Securities Fund)(Formerly known as JF Pacific Securities Fund)(Formerly known as JF Pacific Securities Fund)(Formerly known as JF Pacific Securities Fund)
SemiSemiSemiSemi----annual report for theannual report for theannual report for theannual report for the
period ended period ended period ended period ended 31 March 201331 March 201331 March 201331 March 2013
- 226 -
4444 Net gainsNet gainsNet gainsNet gains on investments and derivatives on investments and derivatives on investments and derivatives on investments and derivatives
1.10.2012
to
31.3.2013
1.10.2011
to
31.3.2012
US$ US$
Change in unrealized gains/losses in value of investments and derivatives 4,726,824 72,676,276
Realized gains/(losses) on sale of investments and derivatives 39,939,893 (16,628,393)
44,666,717 56,047,883
5555 Soft commission arrangementsSoft commission arrangementsSoft commission arrangementsSoft commission arrangements
The Investment Manager has entered into soft commission arrangements with brokers under which certain goods and services used to
support investment decision making are received by the Investment Manager. The Investment Manager does not make direct payment for
these services but transacts an agreed amount of business with the brokers on behalf of the Fund. Commission is paid from the Fund on these
transactions.
The goods and services must be of demonstrable benefit to the Fund and may include research and advisory services; economic and political
analysis; portfolio analysis, including valuation and performance measurement; market analysis, data and quotation services, computer
hardware and software incidental to the above goods and services; clearing and custodian services and investment-related publications.
6666 Distribution Distribution Distribution Distribution
No distribution was made during the period (31 March 2012: nil).
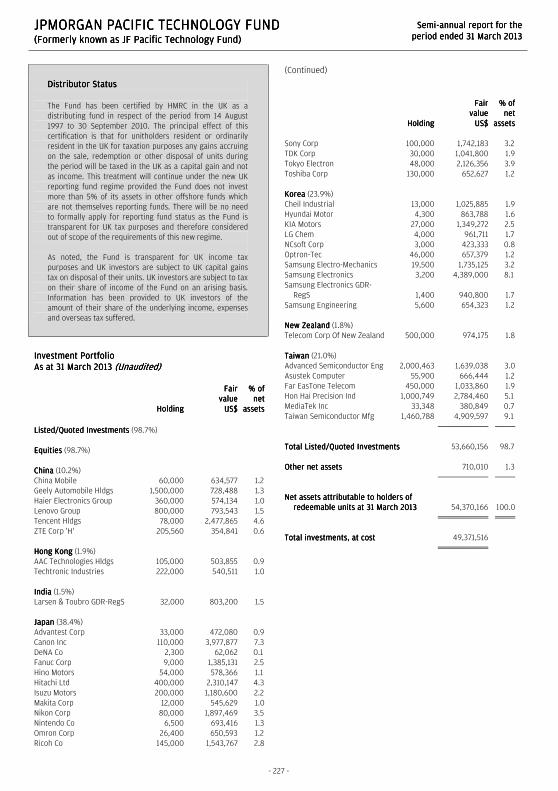
JPMORGAN PACIFIC TECHNOLOGY FUNDJPMORGAN PACIFIC TECHNOLOGY FUNDJPMORGAN PACIFIC TECHNOLOGY FUNDJPMORGAN PACIFIC TECHNOLOGY FUND (Formerly known as JF Pacific Technology Fund)(Formerly known as JF Pacific Technology Fund)(Formerly known as JF Pacific Technology Fund)(Formerly known as JF Pacific Technology Fund)
SemiSemiSemiSemi----annual report for theannual report for theannual report for theannual report for the
period ended 31 March 2013period ended 31 March 2013period ended 31 March 2013period ended 31 March 2013
- 227 -
Distributor StatusDistributor StatusDistributor StatusDistributor Status
The Fund has been certified by HMRC in the UK as a
distributing fund in respect of the period from 14 August
1997 to 30 September 2010. The principal effect of this
certification is that for unitholders resident or ordinarily
resident in the UK for taxation purposes any gains accruing
on the sale, redemption or other disposal of units during
the period will be taxed in the UK as a capital gain and not
as income. This treatment will continue under the new UK
reporting fund regime provided the Fund does not invest
more than 5% of its assets in other offshore funds which
are not themselves reporting funds. There will be no need
to formally apply for reporting fund status as the Fund is
transparent for UK tax purposes and therefore considered
out of scope of the requirements of this new regime.
As noted, the Fund is transparent for UK income tax
purposes and UK investors are subject to UK capital gains
tax on disposal of their units. UK investors are subject to tax
on their share of income of the Fund on an arising basis.
Information has been provided to UK investors of the
amount of their share of the underlying income, expenses
and overseas tax suffered.
Investment PortfolioInvestment PortfolioInvestment PortfolioInvestment Portfolio
As at 31 March 2013As at 31 March 2013As at 31 March 2013As at 31 March 2013 (Unaudited)(Unaudited)(Unaudited)(Unaudited)
HoldingHoldingHoldingHolding
FairFairFairFair
valuevaluevaluevalue
US$US$US$US$
% of% of% of% of
netnetnetnet
assetsassetsassetsassets
Listed/Quoted InvestmentsListed/Quoted InvestmentsListed/Quoted InvestmentsListed/Quoted Investments (98.7%)
EquitiesEquitiesEquitiesEquities (98.7%)
ChinaChinaChinaChina (10.2%)
China Mobile 60,000 634,577 1.2
Geely Automobile Hldgs 1,500,000 728,488 1.3
Haier Electronics Group 360,000 574,134 1.0
Lenovo Group 800,000 793,543 1.5
Tencent Hldgs 78,000 2,477,865 4.6
ZTE Corp 'H' 205,560 354,841 0.6
Hong KongHong KongHong KongHong Kong (1.9%)
AAC Technologies Hldgs 105,000 503,855 0.9
Techtronic Industries 222,000 540,511 1.0
IndiaIndiaIndiaIndia (1.5%)
Larsen & Toubro GDR-RegS 32,000 803,200 1.5
JapanJapanJapanJapan (38.4%)
Advantest Corp 33,000 472,080 0.9
Canon Inc 110,000 3,977,877 7.3
DeNA Co 2,300 62,062 0.1
Fanuc Corp 9,000 1,385,131 2.5
Hino Motors 54,000 578,366 1.1
Hitachi Ltd 400,000 2,310,147 4.3
Isuzu Motors 200,000 1,180,600 2.2
Makita Corp 12,000 545,629 1.0
Nikon Corp 80,000 1,897,469 3.5
Nintendo Co 6,500 693,416 1.3
Omron Corp 26,400 650,593 1.2
Ricoh Co 145,000 1,543,767 2.8
(Continued)
HoldingHoldingHoldingHolding
FairFairFairFair
valuevaluevaluevalue
US$US$US$US$
% of% of% of% of
netnetnetnet
assetsassetsassetsassets
Sony Corp 100,000 1,742,183 3.2
TDK Corp 30,000 1,041,800 1.9
Tokyo Electron 48,000 2,126,356 3.9
Toshiba Corp 130,000 652,627 1.2
KoreaKoreaKoreaKorea (23.9%)
Cheil Industrial 13,000 1,025,885 1.9
Hyundai Motor 4,300 863,788 1.6
KIA Motors 27,000 1,349,272 2.5
LG Chem 4,000 961,711 1.7
NCsoft Corp 3,000 423,333 0.8
Optron-Tec 46,000 657,379 1.2
Samsung Electro-Mechanics 19,500 1,735,125 3.2
Samsung Electronics 3,200 4,389,000 8.1
Samsung Electronics GDR-
RegS 1,400 940,800 1.7
Samsung Engineering 5,600 654,323 1.2
New ZealandNew ZealandNew ZealandNew Zealand (1.8%)
Telecom Corp Of New Zealand 500,000 974,175 1.8
TaiwanTaiwanTaiwanTaiwan (21.0%)
Advanced Semiconductor Eng 2,000,463 1,639,038 3.0
Asustek Computer 55,900 666,444 1.2
Far EasTone Telecom 450,000 1,033,860 1.9
Hon Hai Precision Ind 1,000,749 2,784,460 5.1
MediaTek Inc 33,348 380,849 0.7
Taiwan Semiconductor Mfg 1,460,788 4,909,597 9.1
Total Listed/Quoted InvestmentsTotal Listed/Quoted InvestmentsTotal Listed/Quoted InvestmentsTotal Listed/Quoted Investments 53,660,156 98.7
Other net assetsOther net assetsOther net assetsOther net assets 710,010 1.3
Net assets attributable to holders of Net assets attributable to holders of Net assets attributable to holders of Net assets attributable to holders of
redeemable units at 31redeemable units at 31redeemable units at 31redeemable units at 31 March 2013March 2013March 2013March 2013 54,370,166 100.0
Total investments, at costTotal investments, at costTotal investments, at costTotal investments, at cost 49,371,516

JPMORGAN PACIFIC TECHNOLOGY FUNDJPMORGAN PACIFIC TECHNOLOGY FUNDJPMORGAN PACIFIC TECHNOLOGY FUNDJPMORGAN PACIFIC TECHNOLOGY FUND (Formerly known as JF Pacific Technology Fund)(Formerly known as JF Pacific Technology Fund)(Formerly known as JF Pacific Technology Fund)(Formerly known as JF Pacific Technology Fund)
SemiSemiSemiSemi----annual report for theannual report for theannual report for theannual report for the
period ended 31 March 2013period ended 31 March 2013period ended 31 March 2013period ended 31 March 2013
- 228 -
Statement of Movements in Portfolio HoldingsStatement of Movements in Portfolio HoldingsStatement of Movements in Portfolio HoldingsStatement of Movements in Portfolio Holdings
For the period ended 31 March 2013For the period ended 31 March 2013For the period ended 31 March 2013For the period ended 31 March 2013 (Unaudited)(Unaudited)(Unaudited)(Unaudited)
% holdings% holdings% holdings% holdings
of net assetsof net assetsof net assetsof net assets
31.3.201331.3.201331.3.201331.3.2013 30.9.201230.9.201230.9.201230.9.2012
Listed/Quoted InvestmentsListed/Quoted InvestmentsListed/Quoted InvestmentsListed/Quoted Investments
EquitiesEquitiesEquitiesEquities
Japan 38.4 22.3
Korea 23.9 26.9
Taiwan 21.0 32.1
China 10.2 8.6
Hong Kong 1.9 4.6
New Zealand 1.8 -
India 1.5 -
Australia - 2.0
Total Listed/Quoted InvestmentsTotal Listed/Quoted InvestmentsTotal Listed/Quoted InvestmentsTotal Listed/Quoted Investments 98.7 96.5
Other Other Other Other net assetsnet assetsnet assetsnet assets 1.3 3.5
Net assets attributable to holders of Net assets attributable to holders of Net assets attributable to holders of Net assets attributable to holders of
redeemable unitsredeemable unitsredeemable unitsredeemable units 100.0 100.0

JPMORGAN PACIFIC TECHNOLOGY FUNDJPMORGAN PACIFIC TECHNOLOGY FUNDJPMORGAN PACIFIC TECHNOLOGY FUNDJPMORGAN PACIFIC TECHNOLOGY FUND (Formerly known as JF Pacific Technology Fund)(Formerly known as JF Pacific Technology Fund)(Formerly known as JF Pacific Technology Fund)(Formerly known as JF Pacific Technology Fund)
SemiSemiSemiSemi----annual report for theannual report for theannual report for theannual report for the
period ended 31 March 2013period ended 31 March 2013period ended 31 March 2013period ended 31 March 2013
The notes on pages 231 to 233 form part of these financial statements.
- 229 -
Statement of Financial PositionStatement of Financial PositionStatement of Financial PositionStatement of Financial Position
As at 31 March 2013As at 31 March 2013As at 31 March 2013As at 31 March 2013 (Unaudited)(Unaudited)(Unaudited)(Unaudited)
31.3.201331.3.201331.3.201331.3.2013 30.9.201230.9.201230.9.201230.9.2012
US$US$US$US$ US$US$US$US$
AssetsAssetsAssetsAssets
Cash at banks 516,585 304,254
Amounts due from brokers 60,481 2,244,548
Amounts receivable on allotment 50,128 311,608
Investments 53,660,156 56,534,362
Dividend and other accounts
receivable 300,453 195,415
Total assetsTotal assetsTotal assetsTotal assets 54,587,803 59,590,187
---------- ----------
LiabilitiesLiabilitiesLiabilitiesLiabilities
Amounts due to brokers - 737,129
Amounts payable on redemption 145,052 143,151
Other accounts payable 72,585 102,640
Total liabilitiesTotal liabilitiesTotal liabilitiesTotal liabilities 217,637 982,920
---------- ----------
Net assets attributable to holders Net assets attributable to holders Net assets attributable to holders Net assets attributable to holders
of redeemable units of redeemable units of redeemable units of redeemable units [Note 3] 54,370,166 58,607,267
EquityEquityEquityEquity 54,370,166 58,607,267
Statement of Comprehensive IncomeStatement of Comprehensive IncomeStatement of Comprehensive IncomeStatement of Comprehensive Income
For the period ended 31 March 2013For the period ended 31 March 2013For the period ended 31 March 2013For the period ended 31 March 2013 (Unaudited)(Unaudited)(Unaudited)(Unaudited)
1.10.20121.10.20121.10.20121.10.2012
totototo
31.3.201331.3.201331.3.201331.3.2013
1.10.20111.10.20111.10.20111.10.2011
totototo
31.3.201231.3.201231.3.201231.3.2012
US$US$US$US$ US$US$US$US$
IncomeIncomeIncomeIncome
Net gains on investments and
derivatives [Note 4] 3,296,173 9,426,559
Dividend income 385,018 322,946
Interest on deposits 49 11
Net foreign currency exchange
(losses)/gains (85,609) 60,408
3,595,631 9,809,924
---------- ----------
ExpensesExpensesExpensesExpenses
Management fee 423,471 437,743
Transaction costs 162,422 61,936
Registrar's fee 19,089 18,371
Trustee's fee 15,261 21,201
Safe custody and bank charges 9,955 12,076
Valuation fee 8,330 8,540
Auditor's fee 5,795 6,412
Legal and professional expenses 2,600 51
Printing and publication expenses 1,940 927
Other operating expenses 247 638
649,110 567,895
---------- ----------
Net Net Net Net operating profitoperating profitoperating profitoperating profit 2,946,521 9,242,029
Finance costsFinance costsFinance costsFinance costs
Interest paid (213) (7)
Profit before taxationProfit before taxationProfit before taxationProfit before taxation 2,946,308 9,242,022
Taxation (53,322) (28,161)
Increase in net assets Increase in net assets Increase in net assets Increase in net assets
attributable to holders attributable to holders attributable to holders attributable to holders of of of of
redeemable units and total redeemable units and total redeemable units and total redeemable units and total
comprehensive incomecomprehensive incomecomprehensive incomecomprehensive income 2,892,986 9,213,861

JPMORGAN PACIFIC TECHNOLOGY FUNDJPMORGAN PACIFIC TECHNOLOGY FUNDJPMORGAN PACIFIC TECHNOLOGY FUNDJPMORGAN PACIFIC TECHNOLOGY FUND (Formerly known as JF Pacific Technology Fund)(Formerly known as JF Pacific Technology Fund)(Formerly known as JF Pacific Technology Fund)(Formerly known as JF Pacific Technology Fund)
SemiSemiSemiSemi----annual report for theannual report for theannual report for theannual report for the
period ended 31 March 2013period ended 31 March 2013period ended 31 March 2013period ended 31 March 2013
The notes on pages 231 to 233 form part of these financial statements.
- 230 -
Statement of Changes in Net Assets Attributable to Holders Statement of Changes in Net Assets Attributable to Holders Statement of Changes in Net Assets Attributable to Holders Statement of Changes in Net Assets Attributable to Holders
of Redeemable Unitsof Redeemable Unitsof Redeemable Unitsof Redeemable Units
For the period ended 31 March 2013For the period ended 31 March 2013For the period ended 31 March 2013For the period ended 31 March 2013 (Unaudited)(Unaudited)(Unaudited)(Unaudited)
1.10.20121.10.20121.10.20121.10.2012
totototo
31.3.201331.3.201331.3.201331.3.2013
1.10.20111.10.20111.10.20111.10.2011
totototo
31.3.201231.3.201231.3.201231.3.2012
US$US$US$US$ US$US$US$US$
Net assets attributable to holders Net assets attributable to holders Net assets attributable to holders Net assets attributable to holders
of redeemable units at the of redeemable units at the of redeemable units at the of redeemable units at the
beginning of the periodbeginning of the periodbeginning of the periodbeginning of the period 58,607,267 56,588,198
---------- ----------
Allotment of redeemable units 2,771,204 3,228,992
Redemption of redeemable units (9,901,291) (6,412,529)
Net redemptionNet redemptionNet redemptionNet redemption (7,130,087) (3,183,537)
---------- ----------
51,477,180 53,404,661
Increase in net assets Increase in net assets Increase in net assets Increase in net assets
attributable to holders of attributable to holders of attributable to holders of attributable to holders of
redeemable units and total redeemable units and total redeemable units and total redeemable units and total
comprehensive incomecomprehensive incomecomprehensive incomecomprehensive income 2,892,986 9,213,861
Net assets attributable to holders Net assets attributable to holders Net assets attributable to holders Net assets attributable to holders
of redeemable units at the end of redeemable units at the end of redeemable units at the end of redeemable units at the end
of the periodof the periodof the periodof the period 54,370,166 62,618,522
Statement of Cash FlowsStatement of Cash FlowsStatement of Cash FlowsStatement of Cash Flows
For the period ended 31 March For the period ended 31 March For the period ended 31 March For the period ended 31 March 2013201320132013 (Unaudited)(Unaudited)(Unaudited)(Unaudited)
1.10.20121.10.20121.10.20121.10.2012
totototo
31.3.201331.3.201331.3.201331.3.2013
1.10.20111.10.20111.10.20111.10.2011
totototo
31.3.201231.3.201231.3.201231.3.2012
US$US$US$US$ US$US$US$US$
Operating activitiesOperating activitiesOperating activitiesOperating activities
Purchase of investments and
derivatives (37,445,641) (12,167,251)
Proceeds from disposal of
investments and derivatives 45,112,756 15,068,546
Dividend received 232,825 291,793
Interest received 46 11
Trustee's fee paid (15,351) (23,822)
Registrar's fee paid (36,752) (37,074)
Tax paid (53,322) (28,161)
Transaction costs paid (165,740) (62,768)
Management fee paid (426,864) (433,415)
Others (103,393) 15,917
Net cash inflow from operating Net cash inflow from operating Net cash inflow from operating Net cash inflow from operating
activitiesactivitiesactivitiesactivities 7,098,564 2,623,776
---------- ----------
Financing activitiesFinancing activitiesFinancing activitiesFinancing activities
Interest paid (213) (7)
Receipts on allotment of
redeemable units 3,032,684 3,011,204
Payments on redemption of
redeemable units (9,899,390) (6,112,409)
Net cash outflow from Net cash outflow from Net cash outflow from Net cash outflow from
financing activitiesfinancing activitiesfinancing activitiesfinancing activities (6,866,919) (3,101,212)
---------- ----------
Increase/(decrease) in cash and Increase/(decrease) in cash and Increase/(decrease) in cash and Increase/(decrease) in cash and
cash equivalentscash equivalentscash equivalentscash equivalents 231,645 (477,436)
Cash and cash equivalents at the
beginning of the period 304,254 1,800,018
Exchange (losses)/gains on cash
and cash equivalents (19,314) 23,886
Cash and cash equivalents at Cash and cash equivalents at Cash and cash equivalents at Cash and cash equivalents at
the end of the periodthe end of the periodthe end of the periodthe end of the period 516,585 1,346,468
Analysis of balances of cash and cash equivalents:Analysis of balances of cash and cash equivalents:Analysis of balances of cash and cash equivalents:Analysis of balances of cash and cash equivalents:
Cash at banks 516,585 1,346,468

JPMORGAN PACIFIC TECHNOLOGY FUNDJPMORGAN PACIFIC TECHNOLOGY FUNDJPMORGAN PACIFIC TECHNOLOGY FUNDJPMORGAN PACIFIC TECHNOLOGY FUND (Formerly known as JF Pacific Technology Fund)(Formerly known as JF Pacific Technology Fund)(Formerly known as JF Pacific Technology Fund)(Formerly known as JF Pacific Technology Fund)
SemiSemiSemiSemi----annual report for theannual report for theannual report for theannual report for the
period ended 31 March 2013period ended 31 March 2013period ended 31 March 2013period ended 31 March 2013
- 231 -
Notes to the Financial StatementsNotes to the Financial StatementsNotes to the Financial StatementsNotes to the Financial Statements
1111 The FundThe FundThe FundThe Fund
JPMorgan Pacific Technology Fund (the "Fund") was established under a Trust Deed dated 14 August 1997, as amended, and is governed by
the laws of Hong Kong. The Fund is authorized by the Securities and Futures Commission of Hong Kong.
With effect from 4 February 2013, the name of the Fund was changed from JF Pacific Technology Fund to JPMorgan Pacific Technology Fund.
The investment objective of the Fund is to provide long-term capital growth through a portfolio consisting primarily of securities of technology
companies in the Pacific region, including Japan.
Pursuant to the Supplemental Trust Deed dated 4 January 2013, the Manager may decide to issue separate classes (each a "Class") whose
assets will be commonly invested but where a specific fee structure, currency or distribution policy may be applied. Each Class may have a
different charging structure with the result that the net asset value attributable to each Class may differ.
All unitholders' rights with regard to the convening, voting or otherwise acting at any meeting of unitholders are the same.
2222 Summary of principal accounting policiesSummary of principal accounting policiesSummary of principal accounting policiesSummary of principal accounting policies
(a)(a)(a)(a) Accounting policies of interim financial statementsAccounting policies of interim financial statementsAccounting policies of interim financial statementsAccounting policies of interim financial statements
The accounting policies and methods of computation used in the preparation of these unaudited condensed interim financial statements
are consistent with those used in the annual financial statements for the year ended 30 September 2012.
(b)(b)(b)(b) Investments and derivativesInvestments and derivativesInvestments and derivativesInvestments and derivatives
Classification
The Fund classifies its investments and derivatives as financial assets or financial liabilities at fair value through profit or loss. These
financial assets or financial liabilities are held-for-trading as they are acquired or incurred principally for the purpose of selling or
repurchasing in the near term or short-term profit taking.
All derivatives are carried in assets when amounts are receivable by the Fund and in liabilities when amounts are payable by the Fund.
The Fund makes short sales in which a borrowed security is sold in anticipation of a decline in the market value of that security, or it may
use short sales for various arbitrage transactions. Short sales are classified as financial liabilities at fair value through profit or loss.
Recognition, derecognition and measurement
Purchases and sales of investments and derivatives are accounted for on the trade date basis. Investments and derivatives are initially
recognized at fair value and are subsequently re-measured at fair value. Realized and unrealized gains and losses on investments and
derivatives are recognized in the Statement of Comprehensive Income. Investments and derivatives are derecognized when the rights to
receive cash flows from the investments and derivatives have expired or the Fund has transferred substantially all risks and rewards of
ownership.
Fair value estimation
Investments that are listed or traded on an exchange and investments with prices quoted in over-the-counter markets or by market
makers, are fair valued based on quoted "bid" prices on long investments and quoted "ask" prices on investments sold short. When
trading in the securities of an investee company is suspended, the investment is valued at the Manager's estimate of its fair value.
Debt securities are fair valued based on quoted prices inclusive of accrued interest.
Investments in collective investment schemes are stated at fair value based on the net asset value per unit of the respective funds as
determined by the administrators of the relevant funds or stated at "bid" prices if the collective investment schemes are listed or traded
on an exchange.
Open future and swap contracts are valued at "bid" prices for long positions and "ask" prices for short positions at the valuation date.
The differences between the bid/ask prices and the contract prices are recognized in the Statement of Comprehensive Income.
Open option contracts are valued at "bid" prices for long positions and "ask" prices for short positions at the valuation date. The
differences between the bid/ask prices and the premium amounts/contract prices are recognized in the Statement of Comprehensive
Income.

JPMORGAN PACIFIC TECHNOLOGY FUNDJPMORGAN PACIFIC TECHNOLOGY FUNDJPMORGAN PACIFIC TECHNOLOGY FUNDJPMORGAN PACIFIC TECHNOLOGY FUND (Formerly known as JF Pacific Technology Fund)(Formerly known as JF Pacific Technology Fund)(Formerly known as JF Pacific Technology Fund)(Formerly known as JF Pacific Technology Fund)
SemiSemiSemiSemi----annual report for theannual report for theannual report for theannual report for the
period ended 31 March 2013period ended 31 March 2013period ended 31 March 2013period ended 31 March 2013
- 232 -
Forward foreign exchange contracts are valued at the forward rates ruling at the valuation date. The differences between the forward
rates and the contract rates are recognized in the Statement of Comprehensive Income.
(c)(c)(c)(c) Securities borrowingSecurities borrowingSecurities borrowingSecurities borrowing
The Fund may enter into securities borrowing arrangements for short sale purposes. Short positions represent obligations to deliver
securities sold but not yet purchased, and are accounted for as investments and valued at their fair value. Securities borrowed during the
period/year are off-balance sheet transactions and are therefore not included in the investment portfolio of the Fund. Collateral placed
for the purpose of securities borrowed generally consist of cash collateral and are included in the Statement of Financial Position
separately.
(d)(d)(d)(d) Foreign currency translationForeign currency translationForeign currency translationForeign currency translation
Functional and presentation currency
The Fund has adopted United States dollar as its functional and presentation currency.
Transactions and balances
Foreign currency transactions are translated into the functional currency using the exchange rates prevailing at the dates of the
transactions.
Foreign exchange gains and losses resulting from the settlement of such transactions and from the translation of assets and liabilities
denominated in foreign currencies at period/year end exchange rates are recognized in the Statement of Comprehensive Income.
Foreign exchange gains and losses relating to cash and cash equivalents are presented in the Statement of Comprehensive Income
within "Net foreign currency exchange gains/losses". Foreign exchange gains and losses relating to the financial assets and liabilities
carried at fair value through profit or loss are presented in the Statement of Comprehensive Income within "Net gains/losses on
investments and derivatives".
(e)(e)(e)(e) Proceeds and payments on allotment and redemption of unitsProceeds and payments on allotment and redemption of unitsProceeds and payments on allotment and redemption of unitsProceeds and payments on allotment and redemption of units
The net asset value per unit is computed for each dealing day. The price at which units are allotted or redeemed is calculated by
reference to the net asset value per unit as at the close of business on the relevant dealing day in accordance with the provisions of the
Fund's Trust Deed dated 14 August 1997, as amended, which may be different from the accounting policies stated in the financial
statements.
3333 Number of units in issue and net assets attributable to holders of redeemable units (per unit)Number of units in issue and net assets attributable to holders of redeemable units (per unit)Number of units in issue and net assets attributable to holders of redeemable units (per unit)Number of units in issue and net assets attributable to holders of redeemable units (per unit)
31.3.2013 30.9.2012
Units Units
Number of units in issue 1,491,662.989 1,690,460.742
US$ US$
Net assets attributable to holders of redeemable units 54,370,166 58,607,267
Net assets attributable to holders of redeemable units (per unit) 36.45 34.67

JPMORGAN PACIFIC TECHNOLOGY FUNDJPMORGAN PACIFIC TECHNOLOGY FUNDJPMORGAN PACIFIC TECHNOLOGY FUNDJPMORGAN PACIFIC TECHNOLOGY FUND (Formerly known as JF Pacific Technology Fund)(Formerly known as JF Pacific Technology Fund)(Formerly known as JF Pacific Technology Fund)(Formerly known as JF Pacific Technology Fund)
SemiSemiSemiSemi----annual report for theannual report for theannual report for theannual report for the
period ended 31 March 2013period ended 31 March 2013period ended 31 March 2013period ended 31 March 2013
- 233 -
4444 Net gains/(losses) on investments and derivativesNet gains/(losses) on investments and derivativesNet gains/(losses) on investments and derivativesNet gains/(losses) on investments and derivatives
1.10.2012
to
31.3.2013
1.10.2011
to
31.3.2012
US$ US$
Change in unrealized gains/losses in value of investments and derivatives (1,655,518) 11,533,457
Realized gains/(losses) on sale of investments and derivatives 4,951,691 (2,106,898)
3,296,173 9,426,559
5555 Soft commission arrangementsSoft commission arrangementsSoft commission arrangementsSoft commission arrangements
The Investment Manager has entered into soft commission arrangements with brokers under which certain goods and services used to
support investment decision making are received by the Investment Manager. The Investment Manager does not make direct payment for
these services but transacts an agreed amount of business with the brokers on behalf of the Fund. Commission is paid from the Fund on these
transactions.
The goods and services must be of demonstrable benefit to the Fund and may include research and advisory services; economic and political
analysis; portfolio analysis, including valuation and performance measurement; market analysis, data and quotation services, computer
hardware and software incidental to the above goods and services; clearing and custodian services and investment-related publications.
6666 DistributionDistributionDistributionDistribution
No distribution was made during the period (31 March 2012: nil).

JPMORGAN PHILIPPINE FUNDJPMORGAN PHILIPPINE FUNDJPMORGAN PHILIPPINE FUNDJPMORGAN PHILIPPINE FUND (Formerly known as JF Philippine Fund)(Formerly known as JF Philippine Fund)(Formerly known as JF Philippine Fund)(Formerly known as JF Philippine Fund)
SemiSemiSemiSemi----annual report for theannual report for theannual report for theannual report for the
period ended 31 March 2013period ended 31 March 2013period ended 31 March 2013period ended 31 March 2013
- 234 -
Distributor StatusDistributor StatusDistributor StatusDistributor Status
The Fund has been certified by HMRC in the UK as a
distributing fund in respect of the period from 30 June 1987
to 30 September 2010. The principal effect of this
certification is that for unitholders resident or ordinarily
resident in the UK for taxation purposes any gains accruing
on the sale, redemption or other disposal of units during
the period will be taxed in the UK as a capital gain and not
as income. This treatment will continue under the new UK
reporting fund regime provided the Fund does not invest
more than 5% of its assets in other offshore funds which
are not themselves reporting funds. There will be no need
to formally apply for reporting fund status as the Fund is
transparent for UK tax purposes and therefore considered
out of scope of the requirements of this new regime.
As noted, the Fund is transparent for UK income tax
purposes and UK investors are subject to UK capital gains
tax on disposal of their units. UK investors are subject to tax
on their share of income of the Fund on an arising basis.
Information has been provided to UK investors of the
amount of their share of the underlying income, expenses
and overseas tax suffered.
Investment PortfolioInvestment PortfolioInvestment PortfolioInvestment Portfolio
As at 31 March 2013As at 31 March 2013As at 31 March 2013As at 31 March 2013 (Unaudited)(Unaudited)(Unaudited)(Unaudited)
HoldingHoldingHoldingHolding
FairFairFairFair
valuevaluevaluevalue
US$US$US$US$
% of% of% of% of
netnetnetnet
assetsassetsassetsassets
Listed/Quoted InvestmentsListed/Quoted InvestmentsListed/Quoted InvestmentsListed/Quoted Investments (100.0%)
EquitiesEquitiesEquitiesEquities (100.0%)
PhilippinesPhilippinesPhilippinesPhilippines (100.0%)
BanksBanksBanksBanks (13.0%)
Bank Of Philippine Islands 2,718,790 7,228,344 3.5
BDO Unibank 7,110,447 15,628,696 7.7
Metropolitan Bank & Trust 722,250 2,070,651 1.0
Rizal Commercial Banking 922,630 1,571,252 0.8
CommunicationsCommunicationsCommunicationsCommunications (13.4%)
ABS-CBN Hldgs PDR 6,005,200 6,047,874 3.0
Globe Telecom 104,880 3,081,380 1.5
Philippine Long Distance
Telephone 249,055 18,113,091 8.9
Diversified IndustrialsDiversified IndustrialsDiversified IndustrialsDiversified Industrials (4.8%)
Alliance Global Group 18,706,700 9,694,847 4.8
Financial ServicesFinancial ServicesFinancial ServicesFinancial Services (2.4%)
GT Capital Hldgs 276,984 4,974,988 2.4
Food, Beverages & TobaccoFood, Beverages & TobaccoFood, Beverages & TobaccoFood, Beverages & Tobacco (8.5%)
Jollibee Food 90 273 0.0
Pepsi-Cola Products
Philippines 16,538,300 2,540,925 1.2
RFM Corp 22,495,800 2,601,818 1.3
Universal Robina 4,405,960 12,199,791 6.0
(Continued)
HoldingHoldingHoldingHolding
FairFairFairFair
valuevaluevaluevalue
US$US$US$US$
% of% of% of% of
netnetnetnet
assetsassetsassetsassets
Holding FirmsHolding FirmsHolding FirmsHolding Firms (24.3%)
Aboitiz Equity Ventures 5,014,160 6,769,915 3.3
Ayala Corp 889,710 12,339,521 6.1
Century Properties Group 38,906,000 2,002,024 1.0
DMCI Hldgs 3,570,290 4,767,969 2.4
JG Summit Hldgs 3,466,700 3,610,261 1.8
SM Investments 723,791 19,775,226 9.7
Investment TrustsInvestment TrustsInvestment TrustsInvestment Trusts (1.0%)
Metro Pacific Inv 14,600,000 1,985,543 1.0
Manufacturing, Manufacturing, Manufacturing, Manufacturing, Distribution & TradingDistribution & TradingDistribution & TradingDistribution & Trading (0.8%)
Philippine Seven 709,590 1,530,113 0.8
MediaMediaMediaMedia (1.5%)
GMA Network PDR 12,569,000 3,049,084 1.5
MiningMiningMiningMining (0.0%)
Atlas Consolidated Mining 100 54 0.0
OilOilOilOil (1.2%)
Phoenix Petroleum Philippines 10,397,600 2,433,156 1.2
OthersOthersOthersOthers (2.1%)
Puregold Price Club 4,284,700 4,199,657 2.1
D&L Industries 20 3 0.0
Power & EnergyPower & EnergyPower & EnergyPower & Energy (5.7%)
Aboitiz Power 6,643,900 5,982,929 2.9
First Gen 3,173,200 1,924,447 1.0
Manila Electric 453,050 3,607,970 1.8
PropertyPropertyPropertyProperty (21.3%)
Ayala Land 25,362,760 20,011,782 9.9
Cebu Hldgs 17,524,000 1,975,261 1.0
Megaworld Corp 43,876,000 4,171,499 2.0
Rockwell Land 19,435,700 1,409,695 0.7
SM Development 660 137 0.0
SM Prime Hldgs 33,683,975 15,682,321 7.7
Total Listed/Quoted InvestmentsTotal Listed/Quoted InvestmentsTotal Listed/Quoted InvestmentsTotal Listed/Quoted Investments 202,982,497 100.0
Other net assetsOther net assetsOther net assetsOther net assets 53,991 0.0
Net assets attributable to holders of Net assets attributable to holders of Net assets attributable to holders of Net assets attributable to holders of
redeemable units at 31 March 2013redeemable units at 31 March 2013redeemable units at 31 March 2013redeemable units at 31 March 2013 203,036,488 100.0
Total Total Total Total investments, at costinvestments, at costinvestments, at costinvestments, at cost 162,208,110

JPMORGAN PHILIPPINE FUNDJPMORGAN PHILIPPINE FUNDJPMORGAN PHILIPPINE FUNDJPMORGAN PHILIPPINE FUND (Formerly known as JF Philippine Fund)(Formerly known as JF Philippine Fund)(Formerly known as JF Philippine Fund)(Formerly known as JF Philippine Fund)
SemiSemiSemiSemi----annual report for theannual report for theannual report for theannual report for the
period ended 31 March 2013period ended 31 March 2013period ended 31 March 2013period ended 31 March 2013
- 235 -
Statement of Movements in Portfolio HoldingsStatement of Movements in Portfolio HoldingsStatement of Movements in Portfolio HoldingsStatement of Movements in Portfolio Holdings
For the period ended 31 March 2013For the period ended 31 March 2013For the period ended 31 March 2013For the period ended 31 March 2013 (Unaudited)(Unaudited)(Unaudited)(Unaudited)
% holdings% holdings% holdings% holdings
of net assetsof net assetsof net assetsof net assets
31.3.201331.3.201331.3.201331.3.2013 30.9.201230.9.201230.9.201230.9.2012
Listed/Quoted InvestmentsListed/Quoted InvestmentsListed/Quoted InvestmentsListed/Quoted Investments
EquitiesEquitiesEquitiesEquities
PhilippinesPhilippinesPhilippinesPhilippines
Holding Firms 24.3 19.1
Property 21.3 19.3
Communications 13.4 8.8
Banks 13.0 14.5
Food, Beverages & Tobacco 8.5 7.8
Power & Energy 5.7 9.3
Diversified Industrials 4.8 7.1
Financial Services 2.4 2.1
Others 2.1 2.4
Media 1.5 -
Oil 1.2 -
Investment Trusts 1.0 -
Manufacturing, Distribution & Trading 0.8 0.9
Mining 0.0 1.0
Transportation Services - 2.7
Energy - 1.0
Construction & Related Products - 0.4
Total Listed/Quoted InvestmentsTotal Listed/Quoted InvestmentsTotal Listed/Quoted InvestmentsTotal Listed/Quoted Investments 100.0 96.4
Other net assetsOther net assetsOther net assetsOther net assets 0.0 3.6
Net assets attributable to holders of Net assets attributable to holders of Net assets attributable to holders of Net assets attributable to holders of
redeemable unitsredeemable unitsredeemable unitsredeemable units 100.0 100.0
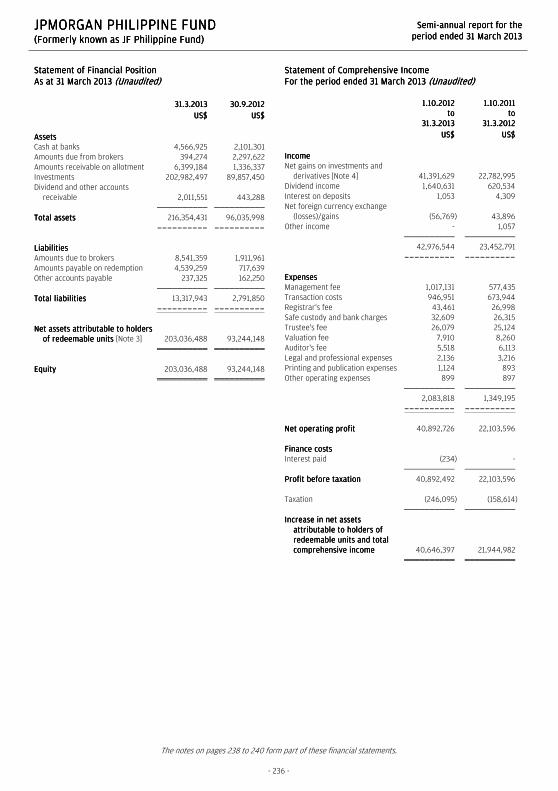
JPMORGAN PHILIPPINE FUNDJPMORGAN PHILIPPINE FUNDJPMORGAN PHILIPPINE FUNDJPMORGAN PHILIPPINE FUND (Formerly known as JF Philippine Fund)(Formerly known as JF Philippine Fund)(Formerly known as JF Philippine Fund)(Formerly known as JF Philippine Fund)
SemiSemiSemiSemi----annual report for theannual report for theannual report for theannual report for the
period ended 31 March 2013period ended 31 March 2013period ended 31 March 2013period ended 31 March 2013
The notes on pages 238 to 240 form part of these financial statements.
- 236 -
Statement of Financial PositionStatement of Financial PositionStatement of Financial PositionStatement of Financial Position
As at 31 March 2013As at 31 March 2013As at 31 March 2013As at 31 March 2013 (Unaudited)(Unaudited)(Unaudited)(Unaudited)
31.3.201331.3.201331.3.201331.3.2013 30.9.201230.9.201230.9.201230.9.2012
US$US$US$US$ US$US$US$US$
AssetsAssetsAssetsAssets
Cash at banks 4,566,925 2,101,301
Amounts due from brokers 394,274 2,297,622
Amounts receivable on allotment 6,399,184 1,336,337
Investments 202,982,497 89,857,450
Dividend and other accounts
receivable 2,011,551 443,288
Total assetsTotal assetsTotal assetsTotal assets 216,354,431 96,035,998
---------- ----------
LiabilitiesLiabilitiesLiabilitiesLiabilities
Amounts due to brokers 8,541,359 1,911,961
Amounts payable on redemption 4,539,259 717,639
Other accounts payable 237,325 162,250
Total liabilitiesTotal liabilitiesTotal liabilitiesTotal liabilities 13,317,943 2,791,850
---------- ----------
Net assets attributable to holders Net assets attributable to holders Net assets attributable to holders Net assets attributable to holders
of redeemable units of redeemable units of redeemable units of redeemable units [Note 3] 203,036,488 93,244,148
EquityEquityEquityEquity 203,036,488 93,244,148
Statement of Comprehensive IncomeStatement of Comprehensive IncomeStatement of Comprehensive IncomeStatement of Comprehensive Income
For the period ended 31 March 2013For the period ended 31 March 2013For the period ended 31 March 2013For the period ended 31 March 2013 (Unaudited)(Unaudited)(Unaudited)(Unaudited)
1.10.20121.10.20121.10.20121.10.2012
totototo
31.3.201331.3.201331.3.201331.3.2013
1.10.20111.10.20111.10.20111.10.2011
totototo
31.3.201231.3.201231.3.201231.3.2012
US$US$US$US$ US$US$US$US$
IncomeIncomeIncomeIncome
Net gains on investments and
derivatives [Note 4] 41,391,629 22,782,995
Dividend income 1,640,631 620,534
Interest on deposits 1,053 4,309
Net foreign currency exchange
(losses)/gains (56,769) 43,896
Other income - 1,057
42,976,544 23,452,791
---------- ----------
ExpensesExpensesExpensesExpenses
Management fee 1,017,131 577,435
Transaction costs 946,951 673,944
Registrar's fee 43,461 26,998
Safe custody and bank charges 32,609 26,315
Trustee's fee 26,079 25,124
Valuation fee 7,910 8,260
Auditor's fee 5,518 6,113
Legal and professional expenses 2,136 3,216
Printing and publication expenses 1,124 893
Other operating expenses 899 897
2,083,818 1,349,195
---------- ----------
Net operating profitNet operating profitNet operating profitNet operating profit 40,892,726 22,103,596
Finance costsFinance costsFinance costsFinance costs
Interest paid (234) -
Profit before taxationProfit before taxationProfit before taxationProfit before taxation 40,892,492 22,103,596
Taxation (246,095) (158,614)
Increase in net assets Increase in net assets Increase in net assets Increase in net assets
attributable to holders of attributable to holders of attributable to holders of attributable to holders of
redeemable units and total redeemable units and total redeemable units and total redeemable units and total
comprehensive incomecomprehensive incomecomprehensive incomecomprehensive income 40,646,397 21,944,982

JPMORGAN PHILIPPINE FUNDJPMORGAN PHILIPPINE FUNDJPMORGAN PHILIPPINE FUNDJPMORGAN PHILIPPINE FUND (Formerly known as JF Philippine Fund)(Formerly known as JF Philippine Fund)(Formerly known as JF Philippine Fund)(Formerly known as JF Philippine Fund)
SemiSemiSemiSemi----annual report for theannual report for theannual report for theannual report for the
period ended 31 March 2013period ended 31 March 2013period ended 31 March 2013period ended 31 March 2013
The notes on pages 238 to 240 form part of these financial statements.
- 237 -
Statement of Changes in Net Assets Attributable to Holders Statement of Changes in Net Assets Attributable to Holders Statement of Changes in Net Assets Attributable to Holders Statement of Changes in Net Assets Attributable to Holders
of Redeemable Unitsof Redeemable Unitsof Redeemable Unitsof Redeemable Units
For the period For the period For the period For the period ended 31 March 2013ended 31 March 2013ended 31 March 2013ended 31 March 2013 (Unaudited)(Unaudited)(Unaudited)(Unaudited)
1.10.20121.10.20121.10.20121.10.2012
totototo
31.3.201331.3.201331.3.201331.3.2013
1.10.20111.10.20111.10.20111.10.2011
totototo
31.3.201231.3.201231.3.201231.3.2012
US$US$US$US$ US$US$US$US$
Net assets attributable to holders Net assets attributable to holders Net assets attributable to holders Net assets attributable to holders
of redeemable units at the of redeemable units at the of redeemable units at the of redeemable units at the
beginning of the periodbeginning of the periodbeginning of the periodbeginning of the period 93,244,148 71,753,228
---------- ----------
Allotment of redeemable units 163,446,798 27,068,364
Redemption of redeemable units (94,300,855) (37,530,879)
Net allotment/(redemption)Net allotment/(redemption)Net allotment/(redemption)Net allotment/(redemption) 69,145,943 (10,462,515)
---------- ----------
162,390,091 61,290,713
Increase in net assets Increase in net assets Increase in net assets Increase in net assets
attributable to holders of attributable to holders of attributable to holders of attributable to holders of
redeemable units and total redeemable units and total redeemable units and total redeemable units and total
comprehensive incomecomprehensive incomecomprehensive incomecomprehensive income 40,646,397 21,944,982
Net assets attributable to holders Net assets attributable to holders Net assets attributable to holders Net assets attributable to holders
of redeemable units at the end of redeemable units at the end of redeemable units at the end of redeemable units at the end
of the periodof the periodof the periodof the period 203,036,488 83,235,695
Statement of Cash FlowsStatement of Cash FlowsStatement of Cash FlowsStatement of Cash Flows
For the period ended 31 March 2013For the period ended 31 March 2013For the period ended 31 March 2013For the period ended 31 March 2013 (Unaudited)(Unaudited)(Unaudited)(Unaudited)
1.10.20121.10.20121.10.20121.10.2012
totototo
31.3.201331.3.201331.3.201331.3.2013
1.10.20111.10.20111.10.20111.10.2011
totototo
31.3.201231.3.201231.3.201231.3.2012
US$US$US$US$ US$US$US$US$
Operating activitiesOperating activitiesOperating activitiesOperating activities
Purchase of investments and
derivatives (151,812,564) (57,092,008)
Proceeds from disposal of
investments and derivatives 88,042,077 69,899,956
Dividend received 656,816 411,228
Interest received 805 4,287
Trustee's fee paid (24,138) (28,283)
Registrar's fee paid (75,217) (57,213)
Tax paid (246,095) (158,614)
Management fee paid (897,707) (576,615)
Transaction costs paid (952,605) (649,175)
Others (130,229) (12,563)
Net cash (outflow)/inflow from Net cash (outflow)/inflow from Net cash (outflow)/inflow from Net cash (outflow)/inflow from
operating activitiesoperating activitiesoperating activitiesoperating activities (65,438,857) 11,741,000
---------- ----------
Financing Financing Financing Financing activitiesactivitiesactivitiesactivities
Interest paid (234) -
Receipts on allotment of
redeemable units 158,383,951 26,674,716
Payments on redemption of
redeemable units (90,479,235) (41,689,178)
Net cash inflow/(outflow) from Net cash inflow/(outflow) from Net cash inflow/(outflow) from Net cash inflow/(outflow) from
financing activitiesfinancing activitiesfinancing activitiesfinancing activities 67,904,482 (15,014,462)
---------- ----------
Increase/(decrease) in cash and Increase/(decrease) in cash and Increase/(decrease) in cash and Increase/(decrease) in cash and
cash equivalentscash equivalentscash equivalentscash equivalents 2,465,625 (3,273,462)
Cash and cash equivalents at the
beginning of the period 2,101,301 5,406,787
Exchange (losses)/gains on cash
and cash equivalents (1) 297
Cash and cash equivalents at Cash and cash equivalents at Cash and cash equivalents at Cash and cash equivalents at
the end of the periodthe end of the periodthe end of the periodthe end of the period 4,566,925 2,133,622
Analysis of balances of cash and cash equivalents:Analysis of balances of cash and cash equivalents:Analysis of balances of cash and cash equivalents:Analysis of balances of cash and cash equivalents:
Cash at banks 4,566,925 226,403
Short term deposits - 1,907,219
4,566,925 2,133,622

JPMORGAN PHILIPPINE FUNDJPMORGAN PHILIPPINE FUNDJPMORGAN PHILIPPINE FUNDJPMORGAN PHILIPPINE FUND (Formerly known as JF Philippine Fund)(Formerly known as JF Philippine Fund)(Formerly known as JF Philippine Fund)(Formerly known as JF Philippine Fund)
SemiSemiSemiSemi----annual report for theannual report for theannual report for theannual report for the
period ended 31 March 2013period ended 31 March 2013period ended 31 March 2013period ended 31 March 2013
- 238 -
Notes to the Financial StatementsNotes to the Financial StatementsNotes to the Financial StatementsNotes to the Financial Statements
1111 The FundThe FundThe FundThe Fund
JPMorgan Philippine Fund (the "Fund") was established under a Trust Deed dated 29 July 1974, as amended, and is governed by the laws of
Hong Kong. The Fund is authorized by the Securities and Futures Commission of Hong Kong.
With effect from 4 February 2013, the name of the Fund was changed from JF Philippine Fund to JPMorgan Philippine Fund.
The investment objective of the Fund is to provide investors with long-term capital growth through investment primarily in the securities of
companies based or operating in the Philippines.
Pursuant to the Supplemental Trust Deed dated 4 January 2013, the Manager may decide to issue separate classes (each a “Class”) whose
assets will be commonly invested but where a specific fee structure, currency or distribution policy may be applied. Each Class may have a
different charging structure with the result that the net asset value attributable to each Class may differ.
All unitholders' rights with regard to the convening, voting or otherwise acting at any meeting of unitholders are the same.
2222 Summary of principal accounting policiesSummary of principal accounting policiesSummary of principal accounting policiesSummary of principal accounting policies
(a)(a)(a)(a) Accounting policies of interim financial statementsAccounting policies of interim financial statementsAccounting policies of interim financial statementsAccounting policies of interim financial statements
The accounting policies and methods of computation used in the preparation of these unaudited condensed interim financial statements
are consistent with those used in the annual financial statements for the year ended 30 September 2012.
(b)(b)(b)(b) Investments and derivatives Investments and derivatives Investments and derivatives Investments and derivatives
Classification
The Fund classifies its investments and derivatives as financial assets or financial liabilities at fair value through profit or loss. These
financial assets or financial liabilities are held-for-trading as they are acquired or incurred principally for the purpose of selling or
repurchasing in the near term or short-term profit taking.
All derivatives are carried in assets when amounts are receivable by the Fund and in liabilities when amounts are payable by the Fund.
The Fund makes short sales in which a borrowed security is sold in anticipation of a decline in the market value of that security, or it may
use short sales for various arbitrage transactions. Short sales are classified as financial liabilities at fair value through profit or loss.
Recognition, derecognition and measurement
Purchases and sales of investments and derivatives are accounted for on the trade date basis. Investments and derivatives are initially
recognized at fair value and are subsequently re-measured at fair value. Realized and unrealized gains and losses on investments and
derivatives are recognized in the Statement of Comprehensive Income. Investments and derivatives are derecognized when the rights to
receive cash flows from the investments and derivatives have expired or the Fund has transferred substantially all risks and rewards of
ownership.
Fair value estimation
Investments that are listed or traded on an exchange and investments with prices quoted in over-the-counter markets or by market
makers, are fair valued based on quoted "bid" prices on long investments and quoted "ask" prices on investments sold short. When
trading in the securities of an investee company is suspended, the investment is valued at the Manager's estimate of its fair value.
Debt securities are fair valued based on quoted prices inclusive of accrued interest.
Investments in collective investment schemes are stated at fair value based on the net asset value per unit of the respective funds as
determined by the administrators of the relevant funds or stated at "bid" prices if the collective investment schemes are listed or traded
on an exchange.
Open future and swap contracts are valued at "bid" prices for long positions and "ask" prices for short positions at the valuation date.
The differences between the bid/ask prices and the contract prices are recognized in the Statement of Comprehensive Income.
Open option contracts are valued at "bid" prices for long positions and "ask" prices for short positions at the valuation date. The
differences between the bid/ask prices and the premium amounts/contract prices are recognized in the Statement of Comprehensive
Income.

JPMORGAN PHILIPPINE FUNDJPMORGAN PHILIPPINE FUNDJPMORGAN PHILIPPINE FUNDJPMORGAN PHILIPPINE FUND (Formerly known as JF Philippine Fund)(Formerly known as JF Philippine Fund)(Formerly known as JF Philippine Fund)(Formerly known as JF Philippine Fund)
SemiSemiSemiSemi----annual report for theannual report for theannual report for theannual report for the
period ended 31 March 2013period ended 31 March 2013period ended 31 March 2013period ended 31 March 2013
- 239 -
Forward foreign exchange contracts are valued at the forward rates ruling at the valuation date. The differences between the forward
rates and the contract rates are recognized in the Statement of Comprehensive Income.
(c)(c)(c)(c) Securities borrowing Securities borrowing Securities borrowing Securities borrowing
The Fund may enter into securities borrowing arrangements for short sale purposes. Short positions represent obligations to deliver
securities sold but not yet purchased, and are accounted for as investments and valued at their fair value. Securities borrowed during the
period/year are off-balance sheet transactions and are therefore not included in the investment portfolio of the Fund. Collateral placed
for the purpose of securities borrowed generally consist of cash collateral and are included in the Statement of Financial Position
separately.
(d)(d)(d)(d) Foreign currency translationForeign currency translationForeign currency translationForeign currency translation
Functional and presentation currency
The Fund has adopted United States dollar as its functional and presentation currency.
Transactions and balances
Foreign currency transactions are translated into the functional currency using the exchange rates prevailing at the dates of the
transactions.
Foreign exchange gains and losses resulting from the settlement of such transactions and from the translation of assets and liabilities
denominated in foreign currencies at period/year end exchange rates are recognized in the Statement of Comprehensive Income.
Foreign exchange gains and losses relating to cash and cash equivalents are presented in the Statement of Comprehensive Income
within "Net foreign currency exchange gains/losses". Foreign exchange gains and losses relating to the financial assets and liabilities
carried at fair value through profit or loss are presented in the Statement of Comprehensive Income within "Net gains/losses on
investments and derivatives".
(e)(e)(e)(e) Proceeds and payments on allotment and redemption of unitsProceeds and payments on allotment and redemption of unitsProceeds and payments on allotment and redemption of unitsProceeds and payments on allotment and redemption of units
The net asset value per unit is computed for each dealing day. The price at which units are allotted or redeemed is calculated by
reference to the net asset value per unit as at the close of business on the relevant dealing day in accordance with the provisions of the
Fund's Trust Deed dated 29 July 1974, as amended, which may be different from the accounting policies stated in the financial
statements.
3333 Number of units in issue and net assets attributable to holders of redeemable units (per unit)Number of units in issue and net assets attributable to holders of redeemable units (per unit)Number of units in issue and net assets attributable to holders of redeemable units (per unit)Number of units in issue and net assets attributable to holders of redeemable units (per unit)
31.3.2013 30.9.2012
Units Units
Number of units in issue 1,742,104.723 1,077,152.608
US$ US$
Net assets attributable to holders of redeemable units 203,036,488 93,244,148
Net assets attributable to holders of redeemable units (per unit) 116.55 86.57
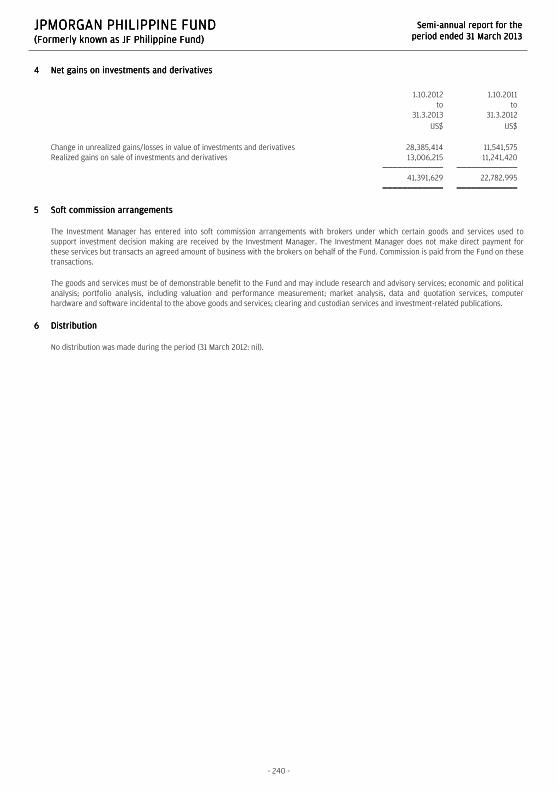
JPMORGAN PHILIPPINE FUNDJPMORGAN PHILIPPINE FUNDJPMORGAN PHILIPPINE FUNDJPMORGAN PHILIPPINE FUND (Formerly known as JF Philippine Fund)(Formerly known as JF Philippine Fund)(Formerly known as JF Philippine Fund)(Formerly known as JF Philippine Fund)
SemiSemiSemiSemi----annual report for theannual report for theannual report for theannual report for the
period ended 31 March 2013period ended 31 March 2013period ended 31 March 2013period ended 31 March 2013
- 240 -
4444 Net gains on investments and derivatives Net gains on investments and derivatives Net gains on investments and derivatives Net gains on investments and derivatives
1.10.2012
to
31.3.2013
1.10.2011
to
31.3.2012
US$ US$
Change in unrealized gains/losses in value of investments and derivatives 28,385,414 11,541,575
Realized gains on sale of investments and derivatives 13,006,215 11,241,420
41,391,629 22,782,995
5555 Soft commission arrangementsSoft commission arrangementsSoft commission arrangementsSoft commission arrangements
The Investment Manager has entered into soft commission arrangements with brokers under which certain goods and services used to
support investment decision making are received by the Investment Manager. The Investment Manager does not make direct payment for
these services but transacts an agreed amount of business with the brokers on behalf of the Fund. Commission is paid from the Fund on these
transactions.
The goods and services must be of demonstrable benefit to the Fund and may include research and advisory services; economic and political
analysis; portfolio analysis, including valuation and performance measurement; market analysis, data and quotation services, computer
hardware and software incidental to the above goods and services; clearing and custodian services and investment-related publications.
6666 Distribution Distribution Distribution Distribution
No distribution was made during the period (31 March 2012: nil).

JPMORGAN THAILAND FUNDJPMORGAN THAILAND FUNDJPMORGAN THAILAND FUNDJPMORGAN THAILAND FUND (Formerly k(Formerly k(Formerly k(Formerly known as JF Thailand Fund)nown as JF Thailand Fund)nown as JF Thailand Fund)nown as JF Thailand Fund)
SemiSemiSemiSemi----annual report for theannual report for theannual report for theannual report for the
period ended 31 March 2013period ended 31 March 2013period ended 31 March 2013period ended 31 March 2013
- 241 -
Distributor StatusDistributor StatusDistributor StatusDistributor Status
The Fund has been certified by HMRC in the UK as a
distributing fund in respect of the period from 8 August
1989 to 30 September 2010. The principal effect of this
certification is that for unitholders resident or ordinarily
resident in the UK for taxation purposes any gains accruing
on the sale, redemption or other disposal of units during
the period will be taxed in the UK as a capital gain and not
as income. This treatment will continue under the new UK
reporting fund regime provided the Fund does not invest
more than 5% of its assets in other offshore funds which
are not themselves reporting funds. There will be no need
to formally apply for reporting fund status as the Fund is
transparent for UK tax purposes and therefore considered
out of scope of the requirements of this new regime.
As noted, the Fund is transparent for UK income tax
purposes and UK investors are subject to UK capital gains
tax on disposal of their units. UK investors are subject to tax
on their share of income of the Fund on an arising basis.
Information has been provided to UK investors of the
amount of their share of the underlying income, expenses
and overseas tax suffered.
Investment PortfolioInvestment PortfolioInvestment PortfolioInvestment Portfolio
As at 31 March 2013As at 31 March 2013As at 31 March 2013As at 31 March 2013 (Unaudited)(Unaudited)(Unaudited)(Unaudited)
HoldingHoldingHoldingHolding
FairFairFairFair
valuevaluevaluevalue
US$US$US$US$
% of% of% of% of
netnetnetnet
assetsassetsassetsassets
Listed/Quoted InvestmentsListed/Quoted InvestmentsListed/Quoted InvestmentsListed/Quoted Investments (96.0%)
EquitiesEquitiesEquitiesEquities (96.0%)
ThailandThailandThailandThailand (96.0%)
BankingBankingBankingBanking (25.5%)
Bangkok Bank NVDR 3,464,100 26,733,365 4.2
Kasikornbank Public Co (F) 430,900 3,060,516 0.5
Kasikornbank Public Co NVDR 7,564,400 53,727,000 8.4
Krung Thai Bank (F) 38,426,408 32,803,831 5.2
Siam Commercial Bank (F) 4,895,200 30,088,305 4.7
TMB Bank (F) 184,616,000 15,886,369 2.5
Building & Furnishing MaterialsBuilding & Furnishing MaterialsBuilding & Furnishing MaterialsBuilding & Furnishing Materials (14.3%)
Siam Cement (F) 991,337 16,654,868 2.6
Siam Cement NVDR 2,202,163 36,696,450 5.8
Siam City Cement (F) 957,800 15,829,783 2.5
Siam Global House (F) 7,177,560 5,122,452 0.8
Siam Global House (F)
Await Cert 1,196,260 853,742 0.1
TPI Polene (F) 29,858,600 16,109,472 2.5
Chemicals & PlasticsChemicals & PlasticsChemicals & PlasticsChemicals & Plastics (4.3%)
PTT Global Chemical (F) 10,758,450 25,899,632 4.1
PTT Global Chemical NVDR 540,000 1,299,983 0.2
CommerceCommerceCommerceCommerce (2.3%)
Robinson Department
Store (F) 2,821,500 7,274,142 1.1
Siam Makro (F) 420,400 7,550,978 1.2
(Continued)
HoldingHoldingHoldingHolding
FairFairFairFair
valuevaluevaluevalue
US$US$US$US$
% % % % ofofofof
netnetnetnet
assetsassetsassetsassets
CommunicationsCommunicationsCommunicationsCommunications (6.4%)
Advanced Information (F) 4,993,900 40,926,618 6.4
EnergyEnergyEnergyEnergy (16.2%)
PTT Exploration &
Production (F) 8,163,385 41,255,967 6.5
PTT Exploration &
Production NVDR 1,825,000 9,223,152 1.5
PTT Public Co (F) 4,194,900 46,697,538 7.3
Ratchaburi Electricity (F) 2,895,000 5,881,936 0.9
Finance & SecuritiesFinance & SecuritiesFinance & SecuritiesFinance & Securities (3.2%)
Kiatnakin Bank (F) 8,530,229 20,025,721 3.2
Food & BeveragesFood & BeveragesFood & BeveragesFood & Beverages (1.9%)
CP ALL (F) 7,551,000 11,860,884 1.9
Health Care ServicesHealth Care ServicesHealth Care ServicesHealth Care Services (1.0%)
Bumrungrad Hospital (F) 2,121,300 6,211,421 1.0
Hotel & Travel ServicesHotel & Travel ServicesHotel & Travel ServicesHotel & Travel Services (2.5%)
Central Plaza Hotel (F) 11,911,400 15,761,200 2.5
Householding GoodsHouseholding GoodsHouseholding GoodsHouseholding Goods (1.0%)
Srithai Superware (F) 7,625,300 6,639,752 1.0
Machinery & EquipmentMachinery & EquipmentMachinery & EquipmentMachinery & Equipment (0.4%)
Sriracha Construction (F) 1,300,000 2,652,382 0.4
Property DevelopmentProperty DevelopmentProperty DevelopmentProperty Development (15.0%)
BTS Group Hldgs (F) 35,221,700 11,305,582 1.8
Hemaraj Land &
Development (F) 83,559,300 12,098,051 1.9
Land & Houses NVDR 36,172,600 15,810,459 2.5
LPN Development (F) 17,225,600 14,705,139 2.3
Sansiri Public Co (F) 84,807,600 13,842,593 2.1
Seafco Public Co (F) 9,345,600 3,159,346 0.5
Sino Thai Eng &
Construction (F) 12,291,700 12,067,146 1.9
Sino Thai Eng &
Construction (F)-AC 3,920,485 3,848,863 0.6
Ticon Industrial Connection (F) 8,466,100 7,516,428 1.2
Ticon Industrial
Connection NVDR 1,510,000 1,340,618 0.2
TransportationTransportationTransportationTransportation (2.0%)
Airports of Thailand (F) 3,004,000 12,411,952 2.0
Total Total Total Total Listed/Quoted InvestmentsListed/Quoted InvestmentsListed/Quoted InvestmentsListed/Quoted Investments 610,833,636 96.0
Other net assetsOther net assetsOther net assetsOther net assets 25,464,336 4.0
Net assets attributable to holders of Net assets attributable to holders of Net assets attributable to holders of Net assets attributable to holders of
redeemable units at 31 March 2013redeemable units at 31 March 2013redeemable units at 31 March 2013redeemable units at 31 March 2013 636,297,972 100.0
Total investments, at costTotal investments, at costTotal investments, at costTotal investments, at cost 429,430,784
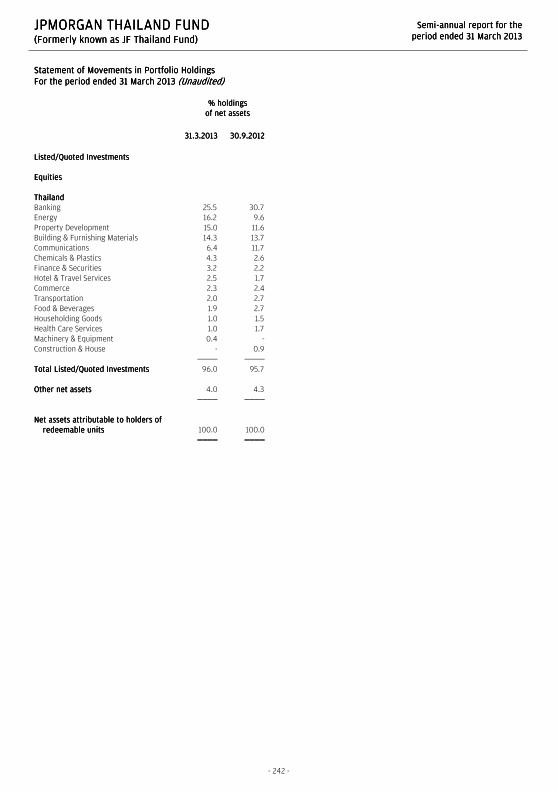
JPMORGAN THAILAND FUNDJPMORGAN THAILAND FUNDJPMORGAN THAILAND FUNDJPMORGAN THAILAND FUND (Formerly k(Formerly k(Formerly k(Formerly known as JF Thailand Fund)nown as JF Thailand Fund)nown as JF Thailand Fund)nown as JF Thailand Fund)
SemiSemiSemiSemi----annual report for theannual report for theannual report for theannual report for the
period ended 31 March 2013period ended 31 March 2013period ended 31 March 2013period ended 31 March 2013
- 242 -
Statement of Movements in Portfolio HoldingsStatement of Movements in Portfolio HoldingsStatement of Movements in Portfolio HoldingsStatement of Movements in Portfolio Holdings
For the period ended 31 March 2013For the period ended 31 March 2013For the period ended 31 March 2013For the period ended 31 March 2013 (Unaudited)(Unaudited)(Unaudited)(Unaudited)
% holdings% holdings% holdings% holdings
of net assetsof net assetsof net assetsof net assets
31.3.201331.3.201331.3.201331.3.2013 30.9.201230.9.201230.9.201230.9.2012
Listed/Quoted InvestmentsListed/Quoted InvestmentsListed/Quoted InvestmentsListed/Quoted Investments
EquitiesEquitiesEquitiesEquities
ThailandThailandThailandThailand
Banking 25.5 30.7
Energy 16.2 9.6
Property Development 15.0 11.6
Building & Furnishing Materials 14.3 13.7
Communications 6.4 11.7
Chemicals & Plastics 4.3 2.6
Finance & Securities 3.2 2.2
Hotel & Travel Services 2.5 1.7
Commerce 2.3 2.4
Transportation 2.0 2.7
Food & Beverages 1.9 2.7
Householding Goods 1.0 1.5
Health Care Services 1.0 1.7
Machinery & Equipment 0.4 -
Construction & House - 0.9
Total Listed/Quoted InvestmentsTotal Listed/Quoted InvestmentsTotal Listed/Quoted InvestmentsTotal Listed/Quoted Investments 96.0 95.7
Other net assetsOther net assetsOther net assetsOther net assets 4.0 4.3
Net assets Net assets Net assets Net assets attributable to holders of attributable to holders of attributable to holders of attributable to holders of
redeemable unitsredeemable unitsredeemable unitsredeemable units 100.0 100.0
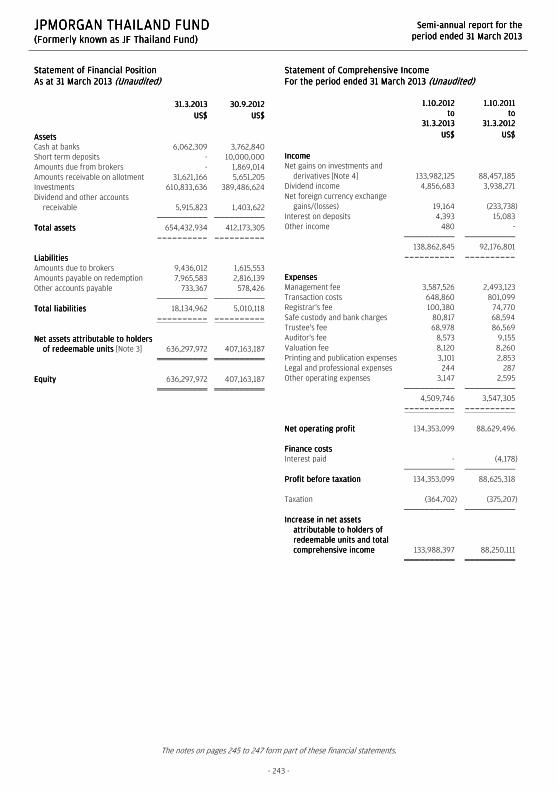
JPMORGAN THAILAND FUNDJPMORGAN THAILAND FUNDJPMORGAN THAILAND FUNDJPMORGAN THAILAND FUND (Formerly k(Formerly k(Formerly k(Formerly known as JF Thailand Fund)nown as JF Thailand Fund)nown as JF Thailand Fund)nown as JF Thailand Fund)
SemiSemiSemiSemi----annual report for theannual report for theannual report for theannual report for the
period ended 31 March 2013period ended 31 March 2013period ended 31 March 2013period ended 31 March 2013
The notes on pages 245 to 247 form part of these financial statements.
- 243 -
Statement of Financial PositionStatement of Financial PositionStatement of Financial PositionStatement of Financial Position
As at 31 March 2013As at 31 March 2013As at 31 March 2013As at 31 March 2013 (Unaudited)(Unaudited)(Unaudited)(Unaudited)
31.3.201331.3.201331.3.201331.3.2013 30.9.201230.9.201230.9.201230.9.2012
US$US$US$US$ US$US$US$US$
AssetsAssetsAssetsAssets
Cash at banks 6,062,309 3,762,840
Short term deposits - 10,000,000
Amounts due from brokers - 1,869,014
Amounts receivable on allotment 31,621,166 5,651,205
Investments 610,833,636 389,486,624
Dividend and other accounts
receivable 5,915,823 1,403,622
Total assetsTotal assetsTotal assetsTotal assets 654,432,934 412,173,305
---------- ----------
LiabilitiesLiabilitiesLiabilitiesLiabilities
Amounts due to brokers 9,436,012 1,615,553
Amounts payable on redemption 7,965,583 2,816,139
Other accounts payable 733,367 578,426
Total liabilitiesTotal liabilitiesTotal liabilitiesTotal liabilities 18,134,962 5,010,118
---------- ----------
Net assets attributable to holders Net assets attributable to holders Net assets attributable to holders Net assets attributable to holders
of redeemable units of redeemable units of redeemable units of redeemable units [Note 3] 636,297,972 407,163,187
EquityEquityEquityEquity 636,297,972 407,163,187
Statement of Comprehensive IncomeStatement of Comprehensive IncomeStatement of Comprehensive IncomeStatement of Comprehensive Income
For the period ended For the period ended For the period ended For the period ended 31 March 201331 March 201331 March 201331 March 2013 (Unaudited)(Unaudited)(Unaudited)(Unaudited)
1.10.20121.10.20121.10.20121.10.2012
totototo
31.3.201331.3.201331.3.201331.3.2013
1.10.20111.10.20111.10.20111.10.2011
totototo
31.3.201231.3.201231.3.201231.3.2012
US$US$US$US$ US$US$US$US$
IncomeIncomeIncomeIncome
Net gains on investments and
derivatives [Note 4] 133,982,125 88,457,185
Dividend income 4,856,683 3,938,271
Net foreign currency exchange
gains/(losses) 19,164 (233,738)
Interest on deposits 4,393 15,083
Other income 480 -
138,862,845 92,176,801
---------- ----------
ExpensesExpensesExpensesExpenses
Management fee 3,587,526 2,493,123
Transaction costs 648,860 801,099
Registrar's fee 100,380 74,770
Safe custody and bank charges 80,817 68,594
Trustee's fee 68,978 86,569
Auditor's fee 8,573 9,155
Valuation fee 8,120 8,260
Printing and publication expenses 3,101 2,853
Legal and professional expenses 244 287
Other operating expenses 3,147 2,595
4,509,746 3,547,305
---------- ----------
Net operating profitNet operating profitNet operating profitNet operating profit 134,353,099 88,629,496
Finance costsFinance costsFinance costsFinance costs
Interest paid - (4,178)
Profit before taxationProfit before taxationProfit before taxationProfit before taxation 134,353,099 88,625,318
Taxation (364,702) (375,207)
Increase in net assets Increase in net assets Increase in net assets Increase in net assets
attributable to holders of attributable to holders of attributable to holders of attributable to holders of
redeemable units and total redeemable units and total redeemable units and total redeemable units and total
comprehensive incomecomprehensive incomecomprehensive incomecomprehensive income 133,988,397 88,250,111

JPMORGAN THAILAND FUNDJPMORGAN THAILAND FUNDJPMORGAN THAILAND FUNDJPMORGAN THAILAND FUND (Formerly k(Formerly k(Formerly k(Formerly known as JF Thailand Fund)nown as JF Thailand Fund)nown as JF Thailand Fund)nown as JF Thailand Fund)
SemiSemiSemiSemi----annual report for theannual report for theannual report for theannual report for the
period ended 31 March 2013period ended 31 March 2013period ended 31 March 2013period ended 31 March 2013
The notes on pages 245 to 247 form part of these financial statements.
- 244 -
Statement of Changes in Statement of Changes in Statement of Changes in Statement of Changes in Net Assets Attributable to Holders Net Assets Attributable to Holders Net Assets Attributable to Holders Net Assets Attributable to Holders
of Redeemable Unitsof Redeemable Unitsof Redeemable Unitsof Redeemable Units
For the period ended 31 March 2013For the period ended 31 March 2013For the period ended 31 March 2013For the period ended 31 March 2013 (Unaudited)(Unaudited)(Unaudited)(Unaudited)
1.10.20121.10.20121.10.20121.10.2012
totototo
31.3.201331.3.201331.3.201331.3.2013
1.10.20111.10.20111.10.20111.10.2011
totototo
31.3.201231.3.201231.3.201231.3.2012
US$US$US$US$ US$US$US$US$
Net assets attributable to holders Net assets attributable to holders Net assets attributable to holders Net assets attributable to holders
of redeemable units at the of redeemable units at the of redeemable units at the of redeemable units at the
beginning of the periodbeginning of the periodbeginning of the periodbeginning of the period 407,163,187 298,618,922
---------- ----------
Allotment of redeemable units 318,433,206 107,681,760
Redemption of redeemable units (223,286,818) (128,130,037)
Net allotment/(redemption)Net allotment/(redemption)Net allotment/(redemption)Net allotment/(redemption) 95,146,388 (20,448,277)
---------- ----------
502,309,575 278,170,645
Increase in net assets Increase in net assets Increase in net assets Increase in net assets
attributable to holders of attributable to holders of attributable to holders of attributable to holders of
redeemable units and total redeemable units and total redeemable units and total redeemable units and total
comprehensive incomecomprehensive incomecomprehensive incomecomprehensive income 133,988,397 88,250,111
Net assets attributable to holders Net assets attributable to holders Net assets attributable to holders Net assets attributable to holders
of redeemable of redeemable of redeemable of redeemable units at the end units at the end units at the end units at the end
of the periodof the periodof the periodof the period 636,297,972 366,420,756
Statement of Cash FlowsStatement of Cash FlowsStatement of Cash FlowsStatement of Cash Flows
For the period ended 31 March 2013For the period ended 31 March 2013For the period ended 31 March 2013For the period ended 31 March 2013 (Unaudited)(Unaudited)(Unaudited)(Unaudited)
1.10.20121.10.20121.10.20121.10.2012
totototo
31.3.201331.3.201331.3.201331.3.2013
1.10.20111.10.20111.10.20111.10.2011
totototo
31.3.201231.3.201231.3.201231.3.2012
US$US$US$US$ US$US$US$US$
Operating activitiesOperating activitiesOperating activitiesOperating activities
Purchase of investments and
derivatives (216,400,359) (202,189,850)
Proceeds from disposal of
investments and derivatives 137,773,465 220,956,549
Dividend received 1,283,011 1,716,121
Interest received 4,310 15,172
Trustee's fee paid (64,807) (105,885)
Registrar's fee paid (178,969) (163,207)
Tax paid (364,702) (375,207)
Transaction costs paid (637,896) (816,750)
Management fee paid (3,337,592) (2,470,958)
Others (178,171) (350,054)
Net cash (outflow)/inflow from Net cash (outflow)/inflow from Net cash (outflow)/inflow from Net cash (outflow)/inflow from
operating operating operating operating activitiesactivitiesactivitiesactivities (82,101,710) 16,215,931
---------- ----------
Financing activitiesFinancing activitiesFinancing activitiesFinancing activities
Interest paid - (4,178)
Receipts on allotment of
redeemable units 292,463,245 105,064,509
Payments on redemption of
redeemable units (218,137,374) (128,430,104)
Net cash inflow/(outflow) from Net cash inflow/(outflow) from Net cash inflow/(outflow) from Net cash inflow/(outflow) from
financing activitiesfinancing activitiesfinancing activitiesfinancing activities 74,325,871 (23,369,773)
---------- ----------
Decrease in cash and cash Decrease in cash and cash Decrease in cash and cash Decrease in cash and cash
equivalentsequivalentsequivalentsequivalents (7,775,839) (7,153,842)
Cash and cash equivalents at the
beginning of the period 13,762,840 13,621,761
Exchange gains on cash and cash
equivalents 75,308 4
Cash and cash equivalents at Cash and cash equivalents at Cash and cash equivalents at Cash and cash equivalents at
the end of the periodthe end of the periodthe end of the periodthe end of the period 6,062,309 6,467,923
Analysis of balances of cash and cash equivalents:Analysis of balances of cash and cash equivalents:Analysis of balances of cash and cash equivalents:Analysis of balances of cash and cash equivalents:
Cash at banks 6,062,309 2,667,923
Short term deposits - 3,800,000
6,062,309 6,467,923

JPMORGAN THAILAND FUNDJPMORGAN THAILAND FUNDJPMORGAN THAILAND FUNDJPMORGAN THAILAND FUND (Formerly known as JF Thailand Fund)(Formerly known as JF Thailand Fund)(Formerly known as JF Thailand Fund)(Formerly known as JF Thailand Fund)
SemiSemiSemiSemi----annual report for theannual report for theannual report for theannual report for the
period ended 31 March 2013period ended 31 March 2013period ended 31 March 2013period ended 31 March 2013
- 245 -
Notes to the Financial StatementsNotes to the Financial StatementsNotes to the Financial StatementsNotes to the Financial Statements
1111 The FundThe FundThe FundThe Fund
JPMorgan Thailand Fund (the "Fund") was established under a Trust Deed dated 20 July 1989, as amended, and is governed by the laws of
Hong Kong. The Fund is authorized by the Securities and Futures Commission of Hong Kong.
With effect from 4 February 2013, the name of the Fund was changed from JF Thailand Fund to JPMorgan Thailand Fund.
The investment objective of the Fund is to provide investors with long-term capital appreciation through a portfolio consisting primarily of
securities of companies based, or operating principally, in Thailand.
Pursuant to the Supplemental Trust Deed dated 4 January 2013, the Manager may decide to issue separate classes (each a “Class”) whose
assets will be commonly invested but where a specific fee structure, currency or distribution policy may be applied. Each Class may have a
different charging structure with the result that the net asset value attributable to each Class may differ.
All unitholders' rights with regard to the convening, voting or otherwise acting at any meeting of unitholders are the same.
2222 Summary of principal accounting policiesSummary of principal accounting policiesSummary of principal accounting policiesSummary of principal accounting policies
(a)(a)(a)(a) AccountiAccountiAccountiAccounting policies of interim financial statementsng policies of interim financial statementsng policies of interim financial statementsng policies of interim financial statements
The accounting policies and methods of computation used in the preparation of these unaudited condensed interim financial statements
are consistent with those used in the annual financial statements for the year ended 30 September 2012.
(b)(b)(b)(b) Investments and derivatives Investments and derivatives Investments and derivatives Investments and derivatives
Classification
The Fund classifies its investments and derivatives as financial assets or financial liabilities at fair value through profit or loss. These
financial assets or financial liabilities are held-for-trading as they are acquired or incurred principally for the purpose of selling or
repurchasing in the near term or short-term profit taking.
All derivatives are carried in assets when amounts are receivable by the Fund and in liabilities when amounts are payable by the Fund.
The Fund makes short sales in which a borrowed security is sold in anticipation of a decline in the market value of that security, or it may
use short sales for various arbitrage transactions. Short sales are classified as financial liabilities at fair value through profit or loss.
Recognition, derecognition and measurement
Purchases and sales of investments and derivatives are accounted for on the trade date basis. Investments and derivatives are initially
recognized at fair value and are subsequently re-measured at fair value. Realized and unrealized gains and losses on investments and
derivatives are recognized in the Statement of Comprehensive Income. Investments and derivatives are derecognized when the rights to
receive cash flows from the investments and derivatives have expired or the Fund has transferred substantially all risks and rewards of
ownership.
Fair value estimation
Investments that are listed or traded on an exchange and investments with prices quoted in over-the-counter markets or by market
makers, are fair valued based on quoted "bid" prices on long investments and quoted "ask" prices on investments sold short. When
trading in the securities of an investee company is suspended, the investment is valued at the Manager's estimate of its fair value.
Debt securities are fair valued based on quoted prices inclusive of accrued interest.
Investments in collective investment schemes are stated at fair value based on the net asset value per unit of the respective funds as
determined by the administrators of the relevant funds or stated at "bid" prices if the collective investment schemes are listed or traded
on an exchange.
Open future and swap contracts are valued at "bid" prices for long positions and "ask" prices for short positions at the valuation date.
The differences between the bid/ask prices and the contract prices are recognized in the Statement of Comprehensive Income.
Open option contracts are valued at "bid" prices for long positions and "ask" prices for short positions at the valuation date. The
differences between the bid/ask prices and the premium amounts/contract prices are recognized in the Statement of Comprehensive
Income.

JPMORGAN THAILAND FUNDJPMORGAN THAILAND FUNDJPMORGAN THAILAND FUNDJPMORGAN THAILAND FUND (Formerly known as JF Thailand Fund)(Formerly known as JF Thailand Fund)(Formerly known as JF Thailand Fund)(Formerly known as JF Thailand Fund)
SemiSemiSemiSemi----annual report for theannual report for theannual report for theannual report for the
period ended 31 March 2013period ended 31 March 2013period ended 31 March 2013period ended 31 March 2013
- 246 -
Forward foreign exchange contracts are valued at the forward rates ruling at the valuation date. The differences between the forward
rates and the contract rates are recognized in the Statement of Comprehensive Income.
(c)(c)(c)(c) Securities borrowing Securities borrowing Securities borrowing Securities borrowing
The Fund may enter into securities borrowing arrangements for short sale purposes. Short positions represent obligations to deliver
securities sold but not yet purchased, and are accounted for as investments and valued at their fair value. Securities borrowed during the
period/year are off-balance sheet transactions and are therefore not included in the investment portfolio of the Fund. Collateral placed
for the purpose of securities borrowed generally consist of cash collateral and are included in the Statement of Financial Position
separately.
(d)(d)(d)(d) Foreign currency translationForeign currency translationForeign currency translationForeign currency translation
Functional and presentation currency
The Fund has adopted United States dollar as its functional and presentation currency.
Transactions and balances
Foreign currency transactions are translated into the functional currency using the exchange rates prevailing at the dates of the
transactions.
Foreign exchange gains and losses resulting from the settlement of such transactions and from the translation of assets and liabilities
denominated in foreign currencies at period/year end exchange rates are recognized in the Statement of Comprehensive Income.
Foreign exchange gains and losses relating to cash and cash equivalents are presented in the Statement of Comprehensive Income
within "Net foreign currency exchange gains/losses". Foreign exchange gains and losses relating to the financial assets and liabilities
carried at fair value through profit or loss are presented in the Statement of Comprehensive Income within "Net gains/losses on
investments and derivatives".
(e)(e)(e)(e) Proceeds and payments on allotment and redemption of unitsProceeds and payments on allotment and redemption of unitsProceeds and payments on allotment and redemption of unitsProceeds and payments on allotment and redemption of units
The net asset value per unit is computed for each dealing day. The price at which units are allotted or redeemed is calculated by
reference to the net asset value per unit as at the close of business on the relevant dealing day in accordance with the provisions of the
Fund's Trust Deed dated 20 July 1989, as amended, which may be different from the accounting policies stated in the financial
statements.
3333 Number of units in issue and net assets attributable to holders of redeemable units (per unit)Number of units in issue and net assets attributable to holders of redeemable units (per unit)Number of units in issue and net assets attributable to holders of redeemable units (per unit)Number of units in issue and net assets attributable to holders of redeemable units (per unit)
31.3.2013 30.9.2012
Units Units
Number of units in issue 4,426,058.620 3,731,326.515
US$ US$
Net assets attributable to holders of redeemable units 636,297,972 407,163,187
Net assets attributable to holders of redeemable units (per unit) 143.76 109.12

JPMORGAN THAILAND FUNDJPMORGAN THAILAND FUNDJPMORGAN THAILAND FUNDJPMORGAN THAILAND FUND (Formerly known as JF Thailand Fund)(Formerly known as JF Thailand Fund)(Formerly known as JF Thailand Fund)(Formerly known as JF Thailand Fund)
SemiSemiSemiSemi----annual report for theannual report for theannual report for theannual report for the
period ended 31 March 2013period ended 31 March 2013period ended 31 March 2013period ended 31 March 2013
- 247 -
4444 Net gains on investments and derivatives Net gains on investments and derivatives Net gains on investments and derivatives Net gains on investments and derivatives
1.10.2012
to
31.3.2013
1.10.2011
to
31.3.2012
US$ US$
Change in unrealized gains/losses in value of investments and derivatives 85,107,453 71,604,697
Realized gains on sale of investments and derivatives 48,874,672 16,852,488
133,982,125 88,457,185
5555 Soft commission arrangementsSoft commission arrangementsSoft commission arrangementsSoft commission arrangements
The Investment Manager has entered into soft commission arrangements with brokers under which certain goods and services used to
support investment decision making are received by the Investment Manager. The Investment Manager does not make direct payment for
these services but transacts an agreed amount of business with the brokers on behalf of the Fund. Commission is paid from the Fund on these
transactions.
The goods and services must be of demonstrable benefit to the Fund and may include research and advisory services; economic and political
analysis; portfolio analysis, including valuation and performance measurement; market analysis, data and quotation services, computer
hardware and software incidental to the above goods and services; clearing and custodian services and investment-related publications.
6666 Distribution Distribution Distribution Distribution
No distribution was made during the period (31 March 2012: nil).

JPMORGAN VIETNAM OPPORTUNITIES FUNDJPMORGAN VIETNAM OPPORTUNITIES FUNDJPMORGAN VIETNAM OPPORTUNITIES FUNDJPMORGAN VIETNAM OPPORTUNITIES FUND (Formerly known as JF Vietnam Opportunities Fund)(Formerly known as JF Vietnam Opportunities Fund)(Formerly known as JF Vietnam Opportunities Fund)(Formerly known as JF Vietnam Opportunities Fund)
SemiSemiSemiSemi----annual report for theannual report for theannual report for theannual report for the
period ended 31 March 2013period ended 31 March 2013period ended 31 March 2013period ended 31 March 2013
- 248 -
Investment PortfolioInvestment PortfolioInvestment PortfolioInvestment Portfolio
As at 31 March 2013As at 31 March 2013As at 31 March 2013As at 31 March 2013 (Unaudited)(Unaudited)(Unaudited)(Unaudited)
HoldingHoldingHoldingHolding
FairFairFairFair
valuevaluevaluevalue
US$US$US$US$
% of% of% of% of
netnetnetnet
assetsassetsassetsassets
Listed/Quoted InvestmentsListed/Quoted InvestmentsListed/Quoted InvestmentsListed/Quoted Investments (93.6%)
Equities and ConvertiblesEquities and ConvertiblesEquities and ConvertiblesEquities and Convertibles (93.6%)
Hong KongHong KongHong KongHong Kong (1.5%)
C P Pokphand 15,888,000 1,739,715 1.5
SingaporeSingaporeSingaporeSingapore (1.0%)
Thai Beverage 2,280,000 1,121,070 1.0
ThailandThailandThailandThailand (0.7%)
Srithai Superware NVDR 927,100 807,275 0.7
VietnamVietnamVietnamVietnam (90.4%)
Asia Commercial Bank 273,197 212,635 0.2
Bao Viet Securities 60 35 0.0
Baoviet Hldgs 200,000 473,678 0.4
Dong Phu Rubber 1,008,000 2,719,446 2.4
Dry Cell & Storage Battery 850,000 767,100 0.7
FPT Corp 1,623,600 2,930,504 2.5
HAGL Joint Stock 2,589,010 3,350,229 2.9
Hau Giang Pharmaceutical 1,114,308 4,336,450 3.8
Ho Chi Minh City Securities 1,715,266 1,719,975 1.5
Hoa Phat Group 3,306,252 4,088,906 3.6
Imexpharm
Pharmaceutical 440,000 718,539 0.6
JSC Bank for Foreign
Trade 4,931,082 7,534,660 6.5
Kinh Do 3,192,167 7,179,232 6.2
Lam Son Sugar CB 12%
10/10/14-AC VND22,270 112,387 0.1
Masan Group 1,757,400 10,321,604 9.0
Military Commercial JS Bk 8,315,406 5,122,060 4.4
Minh Phu Seafood 741,590 743,626 0.6
Petrovietnam Drilling &
Well Services 1,993,476 4,035,974 3.5
Petrovietnam Fertilizer &
Chemical 2,694,420 5,763,878 5.0
PetroVietnam Gas 4,554,720 11,526,807 10.0
PetroVietnam Low
Pressure 750,000 1,128,089 1.0
Pha Lai Thermal Power 1,160,360 936,377 0.8
Phuoc Hoa Rubber 1,500,000 2,220,365 1.9
Refrigeration Electrical
Engineer 3,040,000 2,772,544 2.4
Saigon Securities 2,346,040 1,949,199 1.7
Societe de Bourbon Tay
Ninh 1,724,390 1,243,323 1.1
Southern Rubber Industry 800,000 1,142,175 1.0
Tan Tien Plastic Packaging 342,168 441,138 0.4
Vietnam Dairy Products 2,053,215 11,274,667 9.8
Vietnam Export-Import
Comm JS Bank 5,365,435 3,714,877 3.2
(Continued)
HoldingHoldingHoldingHolding
FairFairFairFair
valuevaluevaluevalue
US$US$US$US$
% of% of% of% of
netnetnetnet
assetsassetsassetsassets
VietNam JS Comm Bk for
Ind & Trade 1,131,860 1,016,066 0.9
Vietnam Sun 845,380 1,408,798 1.2
Vinh Son-Song Hinh
Hydropower 1,127,340 635,197 0.6
VNDIRECT Securities 1,250,000 531,216 0.5
Total Listed/Quoted InvestmentsTotal Listed/Quoted InvestmentsTotal Listed/Quoted InvestmentsTotal Listed/Quoted Investments 107,739,816 93.6
Other net assetsOther net assetsOther net assetsOther net assets 7,351,107 6.4
Net assets attributable to holders of Net assets attributable to holders of Net assets attributable to holders of Net assets attributable to holders of
redeemable redeemable redeemable redeemable units at 31 March 2013units at 31 March 2013units at 31 March 2013units at 31 March 2013 115,090,923 100.0
Total investments, at costTotal investments, at costTotal investments, at costTotal investments, at cost 117,576,337
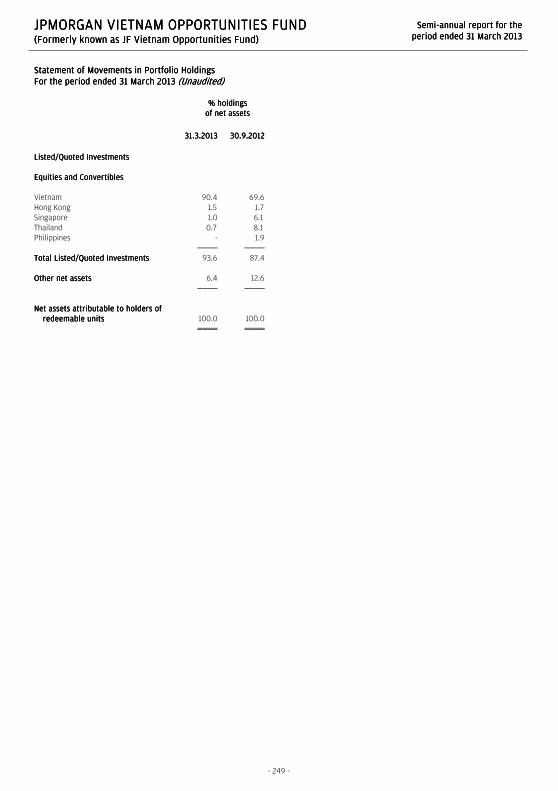
JPMORGAN VIETNAM OPPORTUNITIES FUNDJPMORGAN VIETNAM OPPORTUNITIES FUNDJPMORGAN VIETNAM OPPORTUNITIES FUNDJPMORGAN VIETNAM OPPORTUNITIES FUND (Formerly known as JF Vietnam Opportunities Fund)(Formerly known as JF Vietnam Opportunities Fund)(Formerly known as JF Vietnam Opportunities Fund)(Formerly known as JF Vietnam Opportunities Fund)
SemiSemiSemiSemi----annual report for theannual report for theannual report for theannual report for the
period ended 31 March 2013period ended 31 March 2013period ended 31 March 2013period ended 31 March 2013
- 249 -
Statement of Movements in Portfolio HoldingsStatement of Movements in Portfolio HoldingsStatement of Movements in Portfolio HoldingsStatement of Movements in Portfolio Holdings
For the period ended 31 March 2013For the period ended 31 March 2013For the period ended 31 March 2013For the period ended 31 March 2013 (Unaudited)(Unaudited)(Unaudited)(Unaudited)
% holdings% holdings% holdings% holdings
of net assetsof net assetsof net assetsof net assets
31.3.201331.3.201331.3.201331.3.2013 30.9.201230.9.201230.9.201230.9.2012
Listed/Quoted InvestmentsListed/Quoted InvestmentsListed/Quoted InvestmentsListed/Quoted Investments
Equities and ConvertiblesEquities and ConvertiblesEquities and ConvertiblesEquities and Convertibles
Vietnam 90.4 69.6
Hong Kong 1.5 1.7
Singapore 1.0 6.1
Thailand 0.7 8.1
Philippines - 1.9
Total Listed/Quoted InvestmentsTotal Listed/Quoted InvestmentsTotal Listed/Quoted InvestmentsTotal Listed/Quoted Investments 93.6 87.4
Other net assetsOther net assetsOther net assetsOther net assets 6.4 12.6
Net assets attributable to holders of Net assets attributable to holders of Net assets attributable to holders of Net assets attributable to holders of
redeemable unitsredeemable unitsredeemable unitsredeemable units 100.0 100.0

JPMORGAN VIETNAM OPPORTUNITIES FUNDJPMORGAN VIETNAM OPPORTUNITIES FUNDJPMORGAN VIETNAM OPPORTUNITIES FUNDJPMORGAN VIETNAM OPPORTUNITIES FUND (Formerly known as JF Vietnam Opportunities Fund)(Formerly known as JF Vietnam Opportunities Fund)(Formerly known as JF Vietnam Opportunities Fund)(Formerly known as JF Vietnam Opportunities Fund)
SemiSemiSemiSemi----annual report for theannual report for theannual report for theannual report for the
period ended 31 March 2013period ended 31 March 2013period ended 31 March 2013period ended 31 March 2013
The notes on pages 252 to 254 form part of these financial statements.
- 250 -
Statement of Financial PositionStatement of Financial PositionStatement of Financial PositionStatement of Financial Position
As at 31 March 2013As at 31 March 2013As at 31 March 2013As at 31 March 2013 (Unaudited)(Unaudited)(Unaudited)(Unaudited)
31.3.201331.3.201331.3.201331.3.2013 30.9.201230.9.201230.9.201230.9.2012
US$US$US$US$ US$US$US$US$
AssetsAssetsAssetsAssets
Cash at banks 7,242,762 5,567,477
Short term deposits - 7,300,384
Amounts due from brokers - 2,084,278
Amounts receivable on allotment 317,382 252,221
Investments 107,739,816 104,057,157
Dividend and other accounts
receivable 710,347 519,483
Total assetsTotal assetsTotal assetsTotal assets 116,010,307 119,781,000
---------- ----------
LiabilitiesLiabilitiesLiabilitiesLiabilities
Amounts due to brokers - 251,339
Amounts payable on redemption 779,194 245,896
Other accounts payable 140,190 199,366
Total liabilitiesTotal liabilitiesTotal liabilitiesTotal liabilities 919,384 696,601
---------- ----------
Net assets attributable to holders Net assets attributable to holders Net assets attributable to holders Net assets attributable to holders
of redeemable units of redeemable units of redeemable units of redeemable units [Note 3] 115,090,923 119,084,399
EquityEquityEquityEquity 115,090,923 119,084,399
Statement of Comprehensive IncomeStatement of Comprehensive IncomeStatement of Comprehensive IncomeStatement of Comprehensive Income
For the period ended For the period ended For the period ended For the period ended 31 March 201331 March 201331 March 201331 March 2013 (Unaudited)(Unaudited)(Unaudited)(Unaudited)
1.10.20121.10.20121.10.20121.10.2012
totototo
31.3.201331.3.201331.3.201331.3.2013
1.10.20111.10.20111.10.20111.10.2011
totototo
31.3.201231.3.201231.3.201231.3.2012
US$US$US$US$ US$US$US$US$
IncomeIncomeIncomeIncome
Net gains on investments and
derivatives [Note 4] 27,694,306 14,927,374
Dividend income 2,575,340 1,720,177
Interest on deposits 2,731 80
Net foreign currency exchange
losses (82,661) (47,911)
30,189,716 16,599,720
---------- ----------
ExpensesExpensesExpensesExpenses
Management fee 921,991 859,841
Transaction costs 347,377 114,051
Safe custody and bank charges 71,655 69,849
Registrar's fee 26,805 28,619
Trustee's fee 24,549 30,270
Valuation fee 8,190 8,470
Auditor's fee 6,986 7,559
Printing and publication expenses 2,344 1,189
Legal and professional expenses 2,127 95
Other operating expenses 4,558 5,436
1,416,582 1,125,379
---------- ----------
Net operating profitNet operating profitNet operating profitNet operating profit 28,773,134 15,474,341
Finance costsFinance costsFinance costsFinance costs
Interest paid (5) -
Profit before taxationProfit before taxationProfit before taxationProfit before taxation 28,773,129 15,474,341
Taxation (3,556) (32,159)
Increase in net assets Increase in net assets Increase in net assets Increase in net assets
attributable to holders of attributable to holders of attributable to holders of attributable to holders of
redeemable units and total redeemable units and total redeemable units and total redeemable units and total
comprehensive incomecomprehensive incomecomprehensive incomecomprehensive income 28,769,573 15,442,182

JPMORGAN VIETNAM OPPORTUNITIES FUNDJPMORGAN VIETNAM OPPORTUNITIES FUNDJPMORGAN VIETNAM OPPORTUNITIES FUNDJPMORGAN VIETNAM OPPORTUNITIES FUND (Formerly known as JF Vietnam Opportunities Fund)(Formerly known as JF Vietnam Opportunities Fund)(Formerly known as JF Vietnam Opportunities Fund)(Formerly known as JF Vietnam Opportunities Fund)
SemiSemiSemiSemi----annual report for theannual report for theannual report for theannual report for the
period ended 31 March 2013period ended 31 March 2013period ended 31 March 2013period ended 31 March 2013
The notes on pages 252 to 254 form part of these financial statements.
- 251 -
Statement of Changes in Net Assets Attributable to Holders Statement of Changes in Net Assets Attributable to Holders Statement of Changes in Net Assets Attributable to Holders Statement of Changes in Net Assets Attributable to Holders
of of of of Redeemable UnitsRedeemable UnitsRedeemable UnitsRedeemable Units
For the period ended 31 March 2013For the period ended 31 March 2013For the period ended 31 March 2013For the period ended 31 March 2013 (Unaudited)(Unaudited)(Unaudited)(Unaudited)
1.10.20121.10.20121.10.20121.10.2012
totototo
31.3.201331.3.201331.3.201331.3.2013
1.10.20111.10.20111.10.20111.10.2011
totototo
31.3.201231.3.201231.3.201231.3.2012
US$US$US$US$ US$US$US$US$
Net assets attributable to holders Net assets attributable to holders Net assets attributable to holders Net assets attributable to holders
of redeemable units at the of redeemable units at the of redeemable units at the of redeemable units at the
beginning of the periodbeginning of the periodbeginning of the periodbeginning of the period 119,084,399 113,824,093
---------- ----------
Allotment of redeemable units 33,483,608 12,289,708
Redemption of redeemable units (66,246,657) (19,720,240)
Net redemptionNet redemptionNet redemptionNet redemption (32,763,049) (7,430,532)
---------- ----------
86,321,350 106,393,561
Increase in net assets Increase in net assets Increase in net assets Increase in net assets
attributable to holders of attributable to holders of attributable to holders of attributable to holders of
redeemable units and total redeemable units and total redeemable units and total redeemable units and total
comprehensive incomecomprehensive incomecomprehensive incomecomprehensive income 28,769,573 15,442,182
Net assets attributable to holders Net assets attributable to holders Net assets attributable to holders Net assets attributable to holders
of redeemable units at the end of redeemable units at the end of redeemable units at the end of redeemable units at the end
of the periodof the periodof the periodof the period 115,090,923 121,835,743
Statement of Cash FlowsStatement of Cash FlowsStatement of Cash FlowsStatement of Cash Flows
For the period ended 31 March 2013For the period ended 31 March 2013For the period ended 31 March 2013For the period ended 31 March 2013 (Unaudited)(Unaudited)(Unaudited)(Unaudited)
1.10.20121.10.20121.10.20121.10.2012
totototo
31.3.201331.3.201331.3.201331.3.2013
1.10.20111.10.20111.10.20111.10.2011
totototo
31.3.201231.3.201231.3.201231.3.2012
US$US$US$US$ US$US$US$US$
Operating activitiesOperating activitiesOperating activitiesOperating activities
Purchase of investments and
derivatives (53,265,869) (19,921,532)
Proceeds from disposal of
investments and derivatives 78,822,212 20,417,091
Dividend received 2,676,445 1,816,084
Interest received 2,793 80
Tax paid (3,556) (32,159)
Trustee's fee paid (24,692) (33,510)
Registrar's fee paid (52,476) (59,695)
Transaction costs paid (353,377) (119,817)
Management fee paid (930,617) (854,379)
Others (190,975) (160,159)
Net cash inflow from operating Net cash inflow from operating Net cash inflow from operating Net cash inflow from operating
activitiesactivitiesactivitiesactivities 26,679,888 1,052,004
---------- ----------
Financing activitiesFinancing activitiesFinancing activitiesFinancing activities
Interest paid (5) -
Receipts on allotment of
redeemable units 33,418,447 10,903,998
Payments on redemption of
redeemable units (65,713,359) (15,561,516)
Net cash outflow from Net cash outflow from Net cash outflow from Net cash outflow from
financing activitiesfinancing activitiesfinancing activitiesfinancing activities (32,294,917) (4,657,518)
---------- ----------
Decrease in cash and cash Decrease in cash and cash Decrease in cash and cash Decrease in cash and cash
equivalentsequivalentsequivalentsequivalents (5,615,029) (3,605,514)
Cash and cash equivalents at the
beginning of the period 12,867,861 16,724,927
Exchange losses on cash and cash
equivalents (10,070) (4,970)
Cash and cash equivalents at Cash and cash equivalents at Cash and cash equivalents at Cash and cash equivalents at
the end of the periodthe end of the periodthe end of the periodthe end of the period 7,242,762 13,114,443
Analysis of balances of cash and cash equivalents:Analysis of balances of cash and cash equivalents:Analysis of balances of cash and cash equivalents:Analysis of balances of cash and cash equivalents:
Cash at banks 7,242,762 13,114,443

JPMORGAN VIETNAM OPPORTUNITIES FUNDJPMORGAN VIETNAM OPPORTUNITIES FUNDJPMORGAN VIETNAM OPPORTUNITIES FUNDJPMORGAN VIETNAM OPPORTUNITIES FUND (Formerly known as JF Vietnam Opportunities Fund)(Formerly known as JF Vietnam Opportunities Fund)(Formerly known as JF Vietnam Opportunities Fund)(Formerly known as JF Vietnam Opportunities Fund)
SemiSemiSemiSemi----annual report for theannual report for theannual report for theannual report for the
period ended 31 March 2013period ended 31 March 2013period ended 31 March 2013period ended 31 March 2013
- 252 -
Notes to the Financial StatementsNotes to the Financial StatementsNotes to the Financial StatementsNotes to the Financial Statements
1111 The FundThe FundThe FundThe Fund
JPMorgan Vietnam Opportunities Fund (the "Fund") was established under a Trust Deed dated 15 August 2006, as amended, and is governed
by the laws of Hong Kong. The Fund is authorized by the Securities and Futures Commission of Hong Kong.
With effect from and including 1 October 2012, the performance fee currently received by the Manager in respect of the Fund was removed.
Any cumulative performance fee accrued on each dealing day up to 28 September 2012 will be crystallized on 28 September 2012 and
become payable to the Manager (if any). On 28 September 2012, no performance fee was crystallized in relation to the fund.
With effect from 4 February 2013, the name of the Fund was changed from JF Vietnam Opportunities Fund to JPMorgan Vietnam
Opportunities Fund.
The investment objective of the Fund is to provide investors with long-term capital growth by investing primarily in securities of companies
either (i) domiciled or listed on a stock exchange in Vietnam, or (ii) with actual or prospective operations, assets or investments, direct or
indirect, in Vietnam in an aggregate amount of not less than either US$50 million or 10 per cent. of the gross assets of the investing company
(albeit such operations, assets or investments may at the time of investment be immaterial to the financial results of such company).
Pursuant to the Supplemental Trust Deed dated 31 August 2012, the Manager may decide to issue separate classes (each a “Class”) whose
assets will be commonly invested but where a specific fee structure, currency or distribution policy may be applied. Each Class may have a
different charging structure with the result that the net asset value attributable to each Class may differ.
All unitholders' rights with regard to the convening, voting or otherwise acting at any meeting of unitholders are the same.
2222 Summary of principal accounting policiesSummary of principal accounting policiesSummary of principal accounting policiesSummary of principal accounting policies
(a)(a)(a)(a) Accounting policies of interim financial statementsAccounting policies of interim financial statementsAccounting policies of interim financial statementsAccounting policies of interim financial statements
The accounting policies and methods of computation used in the preparation of these unaudited condensed interim financial statements
are consistent with those used in the annual financial statements for the year ended 30 September 2012.
(b)(b)(b)(b) Investments and derivatives Investments and derivatives Investments and derivatives Investments and derivatives
Classification
The Fund classifies its investments and derivatives as financial assets or financial liabilities at fair value through profit or loss. These
financial assets or financial liabilities are held-for-trading as they are acquired or incurred principally for the purpose of selling or
repurchasing in the near term or short-term profit taking.
All derivatives are carried in assets when amounts are receivable by the Fund and in liabilities when amounts are payable by the Fund.
The Fund makes short sales in which a borrowed security is sold in anticipation of a decline in the market value of that security, or it may
use short sales for various arbitrage transactions. Short sales are classified as financial liabilities at fair value through profit or loss.
Recognition, derecognition and measurement
Purchases and sales of investments and derivatives are accounted for on the trade date basis. Investments and derivatives are initially
recognized at fair value and are subsequently re-measured at fair value. Realized and unrealized gains and losses on investments and
derivatives are recognized in the Statement of Comprehensive Income. Investments and derivatives are derecognized when the rights to
receive cash flows from the investments and derivatives have expired or the Fund has transferred substantially all risks and rewards of
ownership.
Fair value estimation
Investments that are listed or traded on an exchange and investments with prices quoted in over-the-counter markets or by market
makers, are fair valued based on quoted "bid" prices on long investments and quoted "ask" prices on investments sold short. When
trading in the securities of an investee company is suspended, the investment is valued at the Manager's estimate of its fair value.
Debt securities are fair valued based on quoted prices inclusive of accrued interest.
Investments in collective investment schemes are stated at fair value based on the net asset value per unit of the respective funds as
determined by the administrators of the relevant funds or stated at "bid" prices if the collective investment schemes are listed or traded
on an exchange.

JPMORGAN VIETNAM OPPORTUNITIES FUNDJPMORGAN VIETNAM OPPORTUNITIES FUNDJPMORGAN VIETNAM OPPORTUNITIES FUNDJPMORGAN VIETNAM OPPORTUNITIES FUND (Formerly known as JF Vietnam Opportunities Fund)(Formerly known as JF Vietnam Opportunities Fund)(Formerly known as JF Vietnam Opportunities Fund)(Formerly known as JF Vietnam Opportunities Fund)
SemiSemiSemiSemi----annual report for theannual report for theannual report for theannual report for the
period ended 31 March 2013period ended 31 March 2013period ended 31 March 2013period ended 31 March 2013
- 253 -
Open future and swap contracts are valued at "bid" prices for long positions and "ask" prices for short positions at the valuation date.
The differences between the bid/ask prices and the contract prices are recognized in the Statement of Comprehensive Income.
Open option contracts are valued at "bid" prices for long positions and "ask" prices for short positions at the valuation date. The
differences between the bid/ask prices and the premium amounts/contract prices are recognized in the Statement of Comprehensive
Income.
Forward foreign exchange contracts are valued at the forward rates ruling at the valuation date. The differences between the forward
rates and the contract rates are recognized in the Statement of Comprehensive Income.
(c)(c)(c)(c) Securities borrowing Securities borrowing Securities borrowing Securities borrowing
The Fund may enter into securities borrowing arrangements for short sale purposes. Short positions represent obligations to deliver
securities sold but not yet purchased, and are accounted for as investments and valued at their fair value. Securities borrowed during the
period/year are off-balance sheet transactions and are therefore not included in the investment portfolio of the Fund. Collateral placed
for the purpose of securities borrowed generally consist of cash collateral and are included in the Statement of Financial Position
separately.
(d)(d)(d)(d) Foreign currency translationForeign currency translationForeign currency translationForeign currency translation
Functional and presentation currency
The Fund has adopted United States dollar as its functional and presentation currency.
Transactions and balances
Foreign currency transactions are translated into the functional currency using the exchange rates prevailing at the dates of the
transactions.
Foreign exchange gains and losses resulting from the settlement of such transactions and from the translation of assets and liabilities
denominated in foreign currencies at period/year end exchange rates are recognized in the Statement of Comprehensive Income.
Foreign exchange gains and losses relating to cash and cash equivalents are presented in the Statement of Comprehensive Income
within "Net foreign currency exchange gains/losses". Foreign exchange gains and losses relating to the financial assets and liabilities
carried at fair value through profit or loss are presented in the Statement of Comprehensive Income within "Net gains/losses on
investments and derivatives".
(e)(e)(e)(e) Proceeds and payments on allotment and redemption of unitsProceeds and payments on allotment and redemption of unitsProceeds and payments on allotment and redemption of unitsProceeds and payments on allotment and redemption of units
The net asset value per unit is computed for each dealing day. The price at which units are allotted or redeemed is calculated by
reference to the net asset value per unit as at the close of business on the relevant dealing day in accordance with the provisions of the
Fund's Trust Deed dated 15 August 2006, as amended, which may be different from the accounting policies stated in the financial
statements.
3333 Number of units in issue and net assets attributable to holders of redeemable units (per unit)Number of units in issue and net assets attributable to holders of redeemable units (per unit)Number of units in issue and net assets attributable to holders of redeemable units (per unit)Number of units in issue and net assets attributable to holders of redeemable units (per unit)
30.9.2012
31.3.2013 Class A
Units Units
Number of units in issue 12,921,568.063 16,681,889.735
US$ US$
Net assets attributable to holders of redeemable units 115,090,923 119,084,399
Net assets attributable to holders of redeemable units (per unit) 8.91 7.14
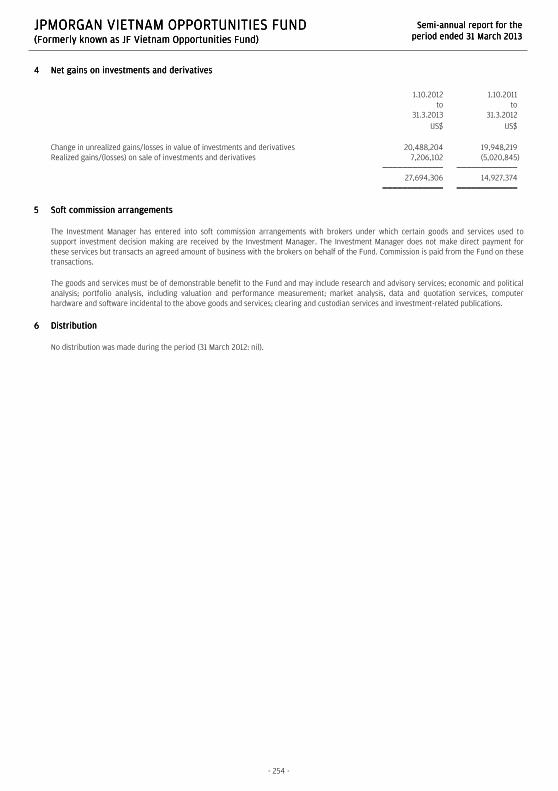
JPMORGAN VIETNAM OPPORTUNITIES FUNDJPMORGAN VIETNAM OPPORTUNITIES FUNDJPMORGAN VIETNAM OPPORTUNITIES FUNDJPMORGAN VIETNAM OPPORTUNITIES FUND (Formerly known as JF Vietnam Opportunities Fund)(Formerly known as JF Vietnam Opportunities Fund)(Formerly known as JF Vietnam Opportunities Fund)(Formerly known as JF Vietnam Opportunities Fund)
SemiSemiSemiSemi----annual report for theannual report for theannual report for theannual report for the
period ended 31 March 2013period ended 31 March 2013period ended 31 March 2013period ended 31 March 2013
- 254 -
4444 Net gains on investments and derivatives Net gains on investments and derivatives Net gains on investments and derivatives Net gains on investments and derivatives
1.10.2012
to
31.3.2013
1.10.2011
to
31.3.2012
US$ US$
Change in unrealized gains/losses in value of investments and derivatives 20,488,204 19,948,219
Realized gains/(losses) on sale of investments and derivatives 7,206,102 (5,020,845)
27,694,306 14,927,374
5555 Soft commission arrangementsSoft commission arrangementsSoft commission arrangementsSoft commission arrangements
The Investment Manager has entered into soft commission arrangements with brokers under which certain goods and services used to
support investment decision making are received by the Investment Manager. The Investment Manager does not make direct payment for
these services but transacts an agreed amount of business with the brokers on behalf of the Fund. Commission is paid from the Fund on these
transactions.
The goods and services must be of demonstrable benefit to the Fund and may include research and advisory services; economic and political
analysis; portfolio analysis, including valuation and performance measurement; market analysis, data and quotation services, computer
hardware and software incidental to the above goods and services; clearing and custodian services and investment-related publications.
6666 Distribution Distribution Distribution Distribution
No distribution was made during the period (31 March 2012: nil).

www.jpmorganam.com.hk
AAR(148x210)C1_4.ai 2 15/05/2013 10:22 AMAAR(148x210)C1_4.ai 2 15/05/2013 10:22 AM