prioritizing agricultural lands for riparian buffer placement in the raritan basin: a geographic...
TRANSCRIPT

Prioritizing Agricultural Lands for Riparian Buffer Placement
in the Raritan Basin: A Geographic Information
System (GIS) Model
Project Partners:North Jersey Resource Conservation &
Development (RC&D)NJ Water Supply Authority (NJWSA)
NJ Institute of Technology - NJITRaritan Watershed Agricultural Committee
(RWAC)USDA - NRCS

North Jersey Resource Conservation & Development 6 county Non-profit
1. Land Conservation - Protects the resource base and 2. Community Development - Improves economic and community development in rural areas.3. Water Management - Helps local people conserve, utilize and improve the quality and quantity of available water.4. Environmental Enhancement - Improves the environment.
Hunterdon, Morris, Somerset, Sussex, Warren, and Union Counties
Check us out on the Web!
http://northjerseyrcd.org
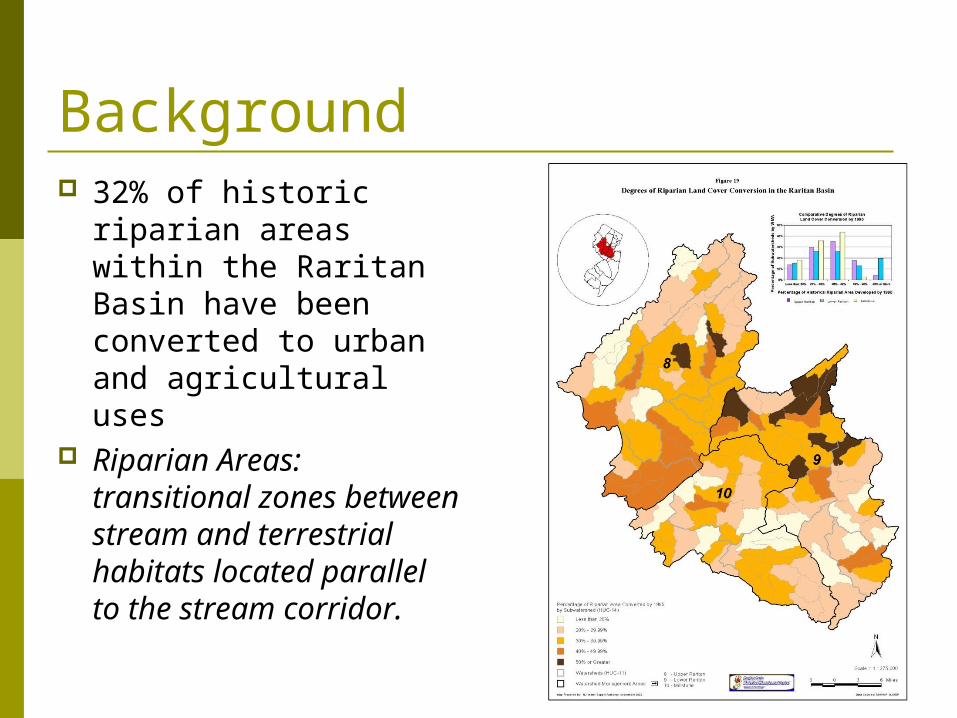
Background 32% of historic
riparian areas within the Raritan Basin have been converted to urban and agricultural uses
Riparian Areas: transitional zones between stream and terrestrial habitats located parallel to the stream corridor.

PurposeThe Raritan Watershed Agricultural Committee (RWAC)
recognized riparian restoration as a much needed best management practice (BMP) and supports the installation of stream corridor management practices on agricultural lands. In response, funding was sought to determine where BMPs could help the most.
Objectives:
1) Develop riparian restoration plan for agricultural lands in the Raritan Basin
2) Prioritization of ag lands for restoration projects
3) Identification and evaluation of available funding sources and institutional needs and methods for implementation of riparian projects
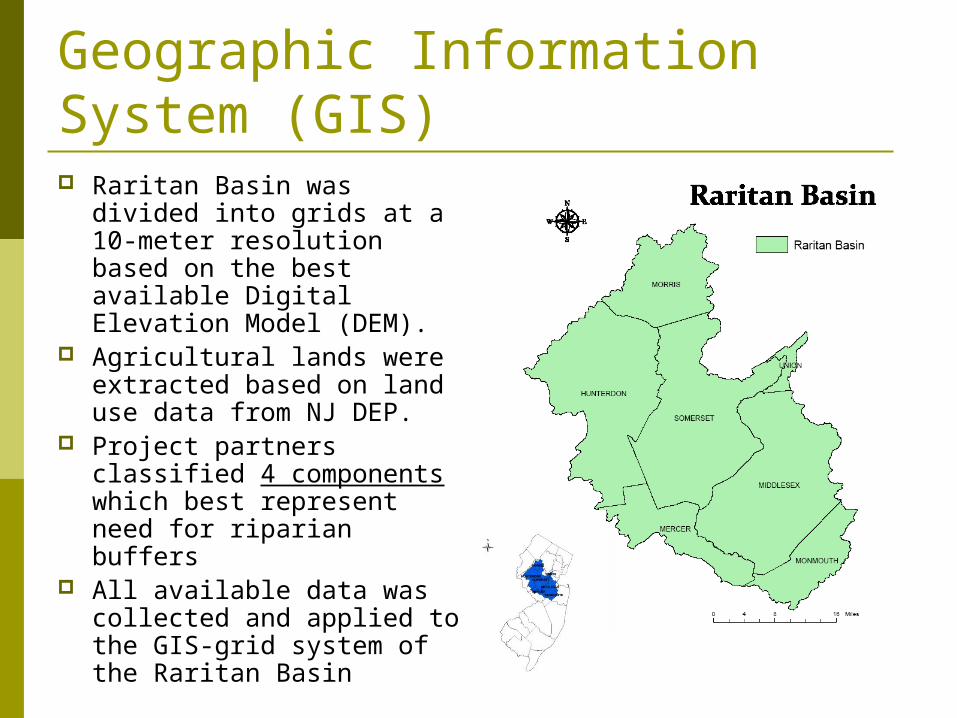
Geographic Information System (GIS) Raritan Basin was divided
into grids at a 10-meter resolution based on the best available Digital Elevation Model (DEM).
Agricultural lands were extracted based on land use data from NJ DEP.
Project partners classified 4 components which best represent need for riparian buffers
All available data was collected and applied to the GIS-grid system of the Raritan Basin
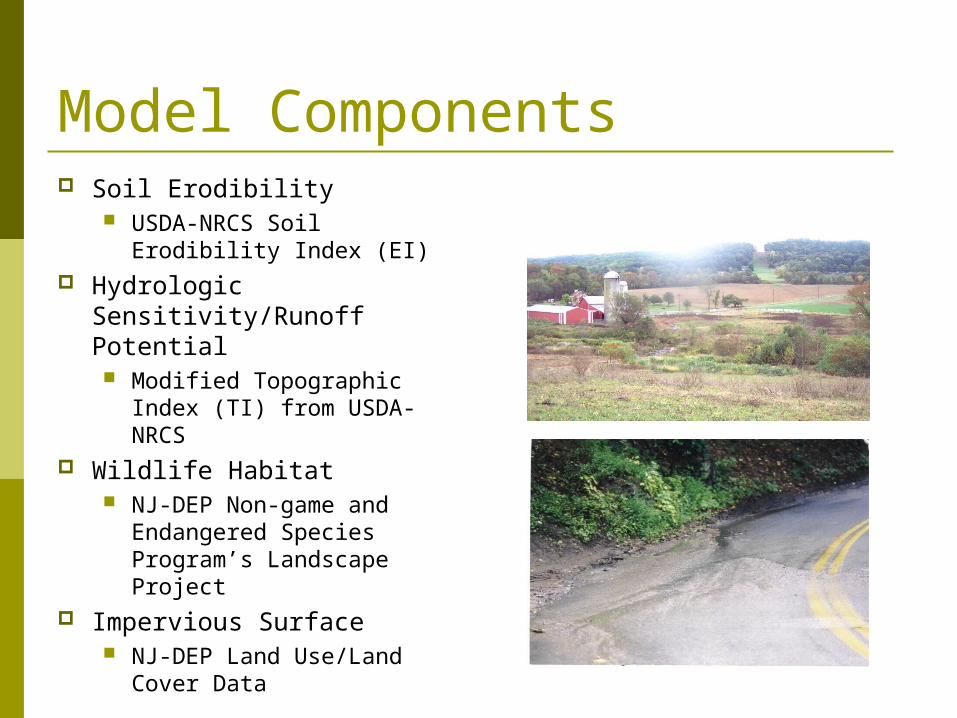
Model Components Soil Erodibility
USDA-NRCS Soil Erodibility Index (EI)
Hydrologic Sensitivity/Runoff Potential Modified Topographic
Index (TI) from USDA-NRCS
Wildlife Habitat NJ-DEP Non-game and
Endangered Species Program’s Landscape Project
Impervious Surface NJ-DEP Land Use/Land
Cover Data

Soil Erodibility A Erodibility index (EI)
score was calculated for each 10 m2 grid
These scores were split into 5 ranks
Ranks 1 – 5 demonstrate the severity of soil erodibility
Higher rank indicates greater erodibility
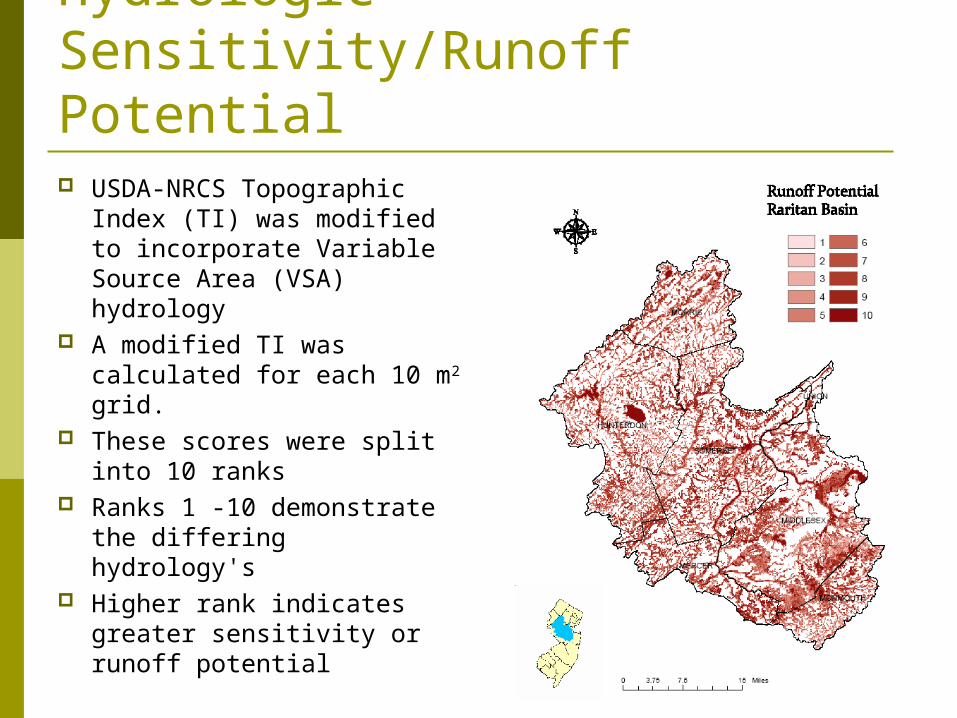
Hydrologic Sensitivity/Runoff Potential USDA-NRCS Topographic
Index (TI) was modified to incorporate Variable Source Area (VSA) hydrology
A modified TI was calculated for each 10 m2
grid. These scores were split
into 10 ranks Ranks 1 -10 demonstrate
the differing hydrology's Higher rank indicates
greater sensitivity or runoff potential

Wildlife Habitat Ranks 1 – 5 based on NJ DEP Landscape Project categories
Rank 5 = Areas containing one or more occurrences of at least one wildlife species listed as threatened or endangered on the Federal List
Rank 4 = Areas with one or more occurrences of a least one State endangered species.
Rank 3 = Areas containing one or more occurrences of at least one State threatened species.
Rank 2 = Areas containing one or more occurrences of species considered to be species of concern.
Rank 1 = Areas that meet habitat-specific suitability requirements such as minimum size criteria for endangered, threatened, or priority wildlife species, but do not intersect with any confirmed occurrences of such species.
Higher rank indicates a greater need to protect.
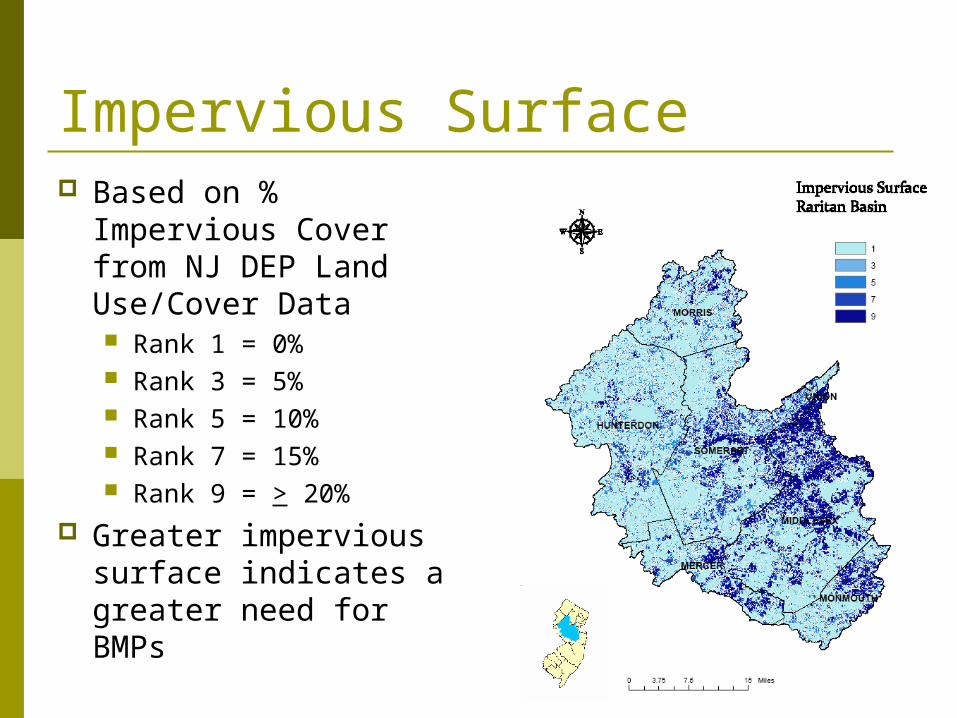
Impervious Surface Based on %
Impervious Cover from NJ DEP Land Use/Cover Data Rank 1 = 0% Rank 3 = 5% Rank 5 = 10% Rank 7 = 15% Rank 9 = > 20%
Greater impervious surface indicates a greater need for BMPs

Prioritizing ALL Ag All four components
were summed to establish a FINAL score
Scores ranged from 3 – 27 for all ag land
These were split into Low/Medium/High (approximately equal)

Prioritizing Riparian Ag
All four components were summed to establish a FINAL score
Scores ranged from 3 – 24 for riparian ag
These were split into Low/Medium/High (approximately equal)


Results 9,003 acres of riparian
agriculture are classified as high priority for buffer placement
32,958 acres of all agriculture are classified as high priority for BMPs.
Implementation is dependent on producer cooperation
Suitable funding sources must be available for the greatest impact
LowMedium
High

Funding Opportunities Agriculture Water
Enhancement Program (AWEP) Currently being used
as criteria USDA-NRCS: WHIP,
AWEP Farm Service Agency
(FSA):CREP, CRP US Fish & Wildlife, NJDEP,
US EPA How can we make these
better?


Have Questions? Contact Us:
Kathy Hale New Jersey Water Supply Authority74 East Main Street Somerville NJ 08876908-685-0315 ext. [email protected]
Jen HouseNorth Jersey RC&D54 Old Hwy 22 Suite 201Clinton NJ 08809908-735-0733 ext. [email protected]