private equity and advisors in mergers and acquisitions
TRANSCRIPT

Private Equity and Advisors in Mergers and Acquisitions

EFI Mission
EFI, the Economic Research Institute at the Stockholm School of Economics, is a scientific institution that works independently of economic, political and sectional interests. It conducts theoretical and empirical research in the management and economic sciences, including selected related disciplines. The Institute encourages and assists in the publication and distribution of its research findings and is also involved in the doctoral education at the Stockholm School of Economics. At EFI, the researchers select their projects based on the need for theoretical or practical development of a research domain, on their methodological interests, and on the generality of a problem.
Research Organization
The research activities at the Institute are organized into 20 Research Centres. Centre Directors are professors at the Stockholm School of Economics.
EFI Research Centre: Centre Director: Management and Organization (A) Sven-Erik Sjöstrand Entrepreneurship and Business Creation (E) Carin Holmquist Public Management (F) Nils Brunsson Information Management (I) Mats Lundeberg People and Organization (PMO) Andreas Werr Innovation and Operations Management (T) Pär Åhlström Media and Economic Psychology (P) Richard Wahlund Consumer Marketing (CCM) Magnus Söderlund Information and Communication Research (CIC) Per Andersson Marketing, Distribution and Industry Dynamics (D) Björn Axelsson Strategy and Competitiveness (CSC) Örjan Sölvell Accounting and Managerial Finance (B) Johnny Lind Financial Analysis and Managerial Economics in Accounting (BFAC) Kenth Skogsvik Finance (FI) Clas Bergström Health Economics (CHE) Magnus Johannesson International Economics and Geography (IEG) Mats Lundahl Economics (S) Paul Segerstrom Economic Statistics (ES) Anders Westlund Business Law (RV) Erik Nerep Tax Law (SR) Bertil Wiman
Chair of the Board: Professor Carin Holmquist Director: Associate Professor Filip Wijkström
Address
EFI, Box 6501, SE-113 83 Stockholm, Sweden • Website: www.hhs.se/efi/ Telephone: +46(0)8-736 90 00 • Fax: +46(0)8-31 62 70 • E-mail [email protected]

Private Equity and Advisors in Mergers and Acquisitions
Linus Siming

Dissertation for the Degree of Doctor of Philosophy, Ph.D. Stockholm School of Economics 2010.
Keywords: private equity, financial advisors, mergers and acquisitions, social networks, former employees, financial intermediation, corporate control, conflicts of interest, investment banking, quick flip
Private Equity and Advisors in Mergers and Acquisitions © EFI and Linus Siming, 2010 ISBN 978-91-7258-819-6 Printed in Sweden by: Intellecta Infolog, Göteborg 2010 Distributed by: EFI, The Economic Research Institute Stockholm School of Economics Box 6501, SE-113 83 Stockholm, Sweden www.hhs.se/efi

To my parents


vii
Preface This report is a result of a research project carried out at the Centre for Research in
Finance at the Economic Research Institute at the Stockholm School of
Economics.
This volume is submitted as a doctor‟s thesis at the Stockholm School of
Economics. As usual at the Economic Research Institute, the author has been
entirely free to conduct and present her research in her own ways as an expression
of her own ideas.
The institute is grateful for the financial support that has made it possible to fulfill
the project.
Filip Wijkström Clas Bergström
Director Director
Economic Research Institute Center for Research in Finance
Stockholm School of Economics Stockholm School of Economics

viii

ix
Acknowledgements I remain perpetually indebted and grateful to my faculty advisor Professor
Mariassunta Giannetti for her continuous support, guidance and counsel
throughout the process of writing this thesis.
My collective gratitude is extended to the finance faculty for all the helpful
comments on my research. In particular, I have greatly benefited from the advice
and suggestions of Professor Per Strömberg.
To my comrades-in-arms, the past and present finance PhD students, I
direct my warm appreciation for the good camaraderie. Thanks also to the
administrative staff that has always assisted me in the most kind and helpful way.
Part of this thesis was written when I was a visiting scholar at the Leonard
N. Stern School of Business, New York University. I thank the Stern Finance
Department and in particular my faculty sponsor Professor Viral Acharya for the
kind hospitality shown to me. My visit at Stern was made possible thanks to the
financial support of the Carl Silfvén and Staffan Burenstam Linder Foundations.
Bankforskningsinstitutet, the Jan Wallander and Tom Hedelius Foundation, and
the Stockholm School of Economics financed my doctoral student years in
Stockholm. I extend my deepest appreciation to all the generous financial
benefactors.
Finally, I wish to express my gratitude to my parents Per and Agneta for
their support in all my various undertakings by dedicating this doctoral thesis to
them.
Stockholm, April 2010

x
xi
Contents
Introduction ........................................................................................................................ 13
Paper One Your Former Employees Matter: Private Equity Firms and Their Financial Advisors ... 17
1.1 Data .................................................................................................................................................. 22
1.2 Mandate Probability Model ........................................................................................................... 24
1.3 Results of the Mandate Probability Model ................................................................................. 29
1.4 Instrumental Variable Approach and Robustness Checks ....................................................... 32
1.5 Mutual Networking Benefits......................................................................................................... 36
1.6 Conclusions ..................................................................................................................................... 43
1.7 References ....................................................................................................................................... 44
1.8 Tables ............................................................................................................................................... 48
1.9 Appendix ......................................................................................................................................... 65
Paper Two Dual Role Advisors and Conflicts of Interest .................................................................... 67
2.1 Hypothesis Development .............................................................................................................. 70
2.2 Empirical Methodology ................................................................................................................. 75
2.3 Empirical Results and Analysis..................................................................................................... 79
2.4 Conclusions ..................................................................................................................................... 86
2.5 References ....................................................................................................................................... 88
2.6 Tables ............................................................................................................................................... 92
2.7 Appendix ....................................................................................................................................... 107
Paper Three Private Equity Firms and Quick Flip Sales ..................................................................... 109
3.1 Background and Testable Predictions ....................................................................................... 111
3.2 Empirical Methodology ............................................................................................................... 114
3.3 Results ............................................................................................................................................ 115
3.4 Conclusions ................................................................................................................................... 119
3.5 References ..................................................................................................................................... 120
3.6 Tables ............................................................................................................................................. 123
3.7 Appendix ....................................................................................................................................... 127

xii

13
Introduction This doctoral thesis contains three empirical research papers in corporate finance.
The papers were written between the spring of 2007 and the spring of 2010 when I
was a PhD student at the Department of Finance at the Stockholm School of
Economics. A substantial amount of thesis work was conducted during the
academic year of 2008/2009 when I was a visiting scholar at the Finance
Department at the Leonard N. Stern School of Business, New York University.
The papers are self-contained and each written with the purpose of
eventually being published as separate articles in academic journals. In between
them, the papers share two common themes, private equity and the role of
advisors in mergers and acquisitions.
Private equity is equity capital in a firm that is not quoted on a public
exchange. A private equity firm receives capital from investors (the limited
partners) and the managers of the private equity firm (the general partners) use
those funds to make investments directly into private companies or to conduct
buyouts of publicly listed companies. For the management of the fund, the general
partners deduct fees from the capital invested by the limited partners. Private
equity investments often require long holding periods to allow for a turnaround of
a distressed company or a liquidity event such as a public floating or sale to
another company or investor.
Besides the private equity firm, the other main actor in this thesis is the
mergers and acquisitions advisor. The selling and buying parties in a merger or
acquisition typically seek advice from financial advisors on matters relating to the
transaction. Generally, these advisors are large bulge bracket investment banking
firms, specialized corporate advisory boutiques or transaction departments at
accounting firms.
The first paper, Your Former Employees Matter: Private Equity Firms and Their
Financial Advisors, merge the two main themes of the thesis. The paper is a study of
how social networks that are formed by previous employment relations affect
private equity firms‟ choice of financial advisors. The idea that inclusion in a
network can benefit their members centers on the notion of homophily, the
tendency of individuals to have a special affinity for similar others. Studies on
networks have been successful in explaining a number of observed features on
financial markets, but so far, network studies focusing on private equity are scarce.

14
In particular, I examine the effects of networks between private equity
professionals who have previously worked for advisory firms and their former
employers. The mechanisms through which the networks may be beneficial for
both private equity firms and financial advisors are evaluated with the help of a
hand collected data set. The data includes biographic information of 1,326 private
equity professionals, which makes it possible to identify with which financial
advisors a private equity professional has a previous employment relationship. The
first finding is that the probability to be mandated to advice on a deal increases if a
former employee of the financial advisor is among those private equity
professionals who constitute the private equity deal team for that particular
transaction. This is an interesting finding as it is the first documented empirical
evidence that former employees become important clients. I test if also private
equity firms benefit from the shared networks and find that information and deals
are sourced to private equity firms from sell-side financial advisors within the
previous employment network. Private equity firms have a higher probability to be
included in a bidding process and a higher probability of ultimately winning an
auction when the advisor responsible for the sale is the former employer of the
private equity firm‟s employees.
The role of financial advisors in mergers and acquisitions is further
scrutinized in the second paper, Dual Role Advisors and Conflicts of Interest, in which I
examine the potential conflicts of interest that may arise when an advisor to a firm
targeted in a merger or acquisition is simultaneously involved in financing the
bidder. Such an advisor who acts on both sides of a transaction is labeled a dual
role advisor. I find that deals that involve a dual role advisor are, compared to deals
with no dual role advisors, performed at lower bidding premium. I identify two
possible explanations for this result. One is that the dual role advisor‟s advice to
shareholders and board is polluted by a desire on the part of the advisor to obtain
additional fees from financing the successful bidder. The other is that dual role
advising could be a helpful feature in transactions that are difficult to finance for a
bidder. I attempt to distinguish these explanations by looking at the probability of
lawsuits, size of merger advisor fees and announcement returns for bidders.
Overall, the results suggest that dual role advisors may not have fulfilled their
obligation of obtaining the highest possible price on behalf of the seller and I find
no evidence that dual role advising is a helpful feature in transactions where it
might be difficult to otherwise obtain bidding financing. A resulting policy

15
implication is that investment banks should be forced to disclose any intentions of
theirs to finance bidders to the firms they are representing as sell-side advisors.
The third paper, Private Equity Firms and Quick Flip Sales, revisits the field of
private equity, which we encountered already in the first chapter. I earlier stated
that private equity funds typically require long holding periods of the firms they
invest in to allow for restructuring and operational improvement. However, in a
quick flip, private equity firms dispose of their holdings within only 18 months
after adding them to their portfolio of managed assets. This behaviour has
contributed to a long-running debate on the real contributions of private equity
firms. In this chapter I contrast established results from the academic literature on
related themes to see if any of them can explain what drives quick flips. 1,322
private-to-private transactions of which 188 were quick flips are analyzed. The first
hypothesis to be tested is that a quick flip is simply the result of a speedy
restructuring process of the asset under management. Though no previous studies
have looked at whether restructuring is driving quick flips, there is ample support
that private equity ownership leads to operational improvements of firms. The
second hypothesis is that quick flips are related to debt market conditions. If the
private equity firm, for one or the other reason, faces a dire financial situation this
may lead to asset fire sales. The third hypothesis is that quick flips are driven by
conflicts of interest between the general and limited partners of the private equity
firm. Contractual provisions may provides incentives for funds to exit investments
early because it offers them a chance to reinvest funds and thus effectively increase
the assets under management, which in turn leads to more fees. The results in this
paper generally support the later hypothesis; quick flips do not follow upon
operational improvements of the asset, private equity firms are not more likely to
sell an asset in a quick flip due to liquidity constraints and do not earn relatively
higher returns in these transactions compared to others.
The remainder of this thesis consists of the three papers introduced above,
which each make out a separate chapter. Accompanying tables to the text follow
the list of references for each chapter.

16

17
Paper One
Your Former Employees Matter: Private Equity Firms
and Their Financial Advisors*
Abstract: I study the impact of previous employment networks on private equity firms‟ choice of financial advisors. In a unique micro-level data set I observe 1,326 individuals, who have been directly involved in 1,285 transactions and their changes of occupation from financial advisors to private equity professionals. I find that the social networks arising from these labor market movements affect private equity firms‟ choice of financial advisors as well as the sourcing of information and deals from sell-side advisors to private equity firms. On average, the unconditional probability to be mandated as a financial advisor increases by 2.8 percentage points from 3.6% to 6.4% if a former employee of the financial advisor is among those private equity professionals who constitute the private equity deal team for that particular transaction. Private equity firms, on their part, have a 19.0 percentage points higher probability to be included in a bidding process and a 13.5 percentage points higher probability of winning an auction when their former employers conduct the auction. Moreover, I find that firms pay lower revenue transaction multiples in acquisitions where their former employers advise them compared to other deals.
* I thank for their comments Viral Acharya, Carsten Bienz, Jonathan Clarke, Mariassunta
Giannetti, Ulrich Hege, Magnus Johannesson, Björn Johnson, Samuel Lee, Bing Liang, Ludovic Phalippou, Per Strömberg, Daniel Sunesson, Björn Wallace, Betty Wu, David Yermack and seminar participants at the European Economic Association Congress in Barcelona, European Finance Association Doctoral Tutorial in Athens, Financial Intermediation Research Society Conference in Prague, Financial Management Association Conference in Prague, Nordic Finance Network Workshop in Bergen, Bocconi University, Copenhagen Business School, ESSEC Business School, HEC Paris, McGill University (Desaultes Faculty of Management), New York University (Pollack Center Workshop in Corporate Governance), Norwegian School of Economics and Business Administration, SIFR/Stockholm School of Economics, University of Cambridge (Judge Business School), University of New South Wales, and University of Toronto (Rotman School of Management).
18
Do previous employment relations influence how private equity (PE) firms choose
their financial advisors? Anecdotal evidence suggest that previous employees may
become important future clients as manifested through the following statement by
Stephen Patton, senior litigation partner at law firm Kirkland & Ellis LLP:1 “Our
alums are friends and cohorts, but they‟re also our current or future clients.”2
Similarly, when a corporate financier leaves employment it is the hope of the
former employer that the departing employee‟s new job is with a client, for
example a PE firm.3 The wish is that the former employee will be benevolent to
the previous employer when appointing advisors in future deals. As noted by
McPherson, Smith-Lovin and Cook (2001) the explanations for why inclusion in a
network can benefit their members centers on the notion of homophily, the
tendency of individuals to have a special affinity for similar others.
By using a unique and detailed micro-level data set I study how social
networks formed by such former employment relations affect PE firms‟ choice of
financial advisors and attempt to evaluate the mechanisms through which these
social networks may be beneficial. Financial advisors act as gatekeepers of
information to capital markets including PE, which to its nature is characterized by
a large degree of opaque information. The study of personal network ties between
individuals working for PE firms and financial advisory firms may thus offer
considerable insight into the workings of the PE industry.
My main goal is to test the hypothesis that both PE firms and financial
advisors gain increased levels of business through social networks based on
previous employment relations. From the viewpoint of the financial advisor, it may
be very valuable to have previous employees working for potential client firms. A
network can lower the cost of gathering information in that it takes fewer meetings
or calls to receive information for those inside a network. For example, it may be
the case that PE professionals are inclined to offer easy access to their previous
employers to discuss investment opportunities and potential advisory roles. It may
also be that a former corporate financier can tell his old employer how to best 1 Quote from “Former employees stay connected” by Barbara Rose, Chicago Tribune, January 2, 2006. 2 Although the terms alumnus, alums, alumna and alumni originally refer to former students, the term is nowadays also used by corporations to denote former employees. 3 See “Don‟t Burn Employee Bridges: Exit Interviews and Alumni Networks” by Hans H. Chen, Vault.com 2007, where the use of exit interviews is described as one method of finding out the departing employee‟s new employment.

19
pitch for a certain advisory mandate. In addition, the PE house can benefit directly
from cooperation with former employees. Important information can flow
through the network to the PE firm from the former employer. Efficiency in
cooperation between PE professionals and advisors may be increased since the PE
professionals have personal inside knowledge on the particular financial advisor‟s
modus operandi including bidding strategy and sensitive negotiation issues such as
fees.
I gather a unique data set that covers the period January 1998 to May 2007.
1,285 transactions consisting of 968 buy-side deals and 317 sell-side deals, which
have involved a total of 153 PE firms and 355 financial advisors, are analyzed. I
hand collect the CV:s of the 1,326 PE professionals who have been involved in
these transactions. This information enables me to construct a data set of the
professional work history of each of these individuals. The probability that a
certain financial advisor is awarded a deal mandate is estimated based on an
extension of the matching-probability model developed by Ljungqvist, Marston
and Wilhelm (2006).
This paper‟s central finding is that the awarding of advisor mandates is
significantly related to the social network that arises from corporate financiers‟
change of occupation to PE firms; former employees become important future
clients. These results hold for several subcategories of the data. On average, the
unconditional probability to be mandated as a financial advisor increases by 2.8
percentage points (pp.) from 3.6% to 6.4% if a former employee of the financial
advisor is among those PE professionals who constitute the deal team for that
particular transaction. The economic impact of the 2.8 pp. increase is large as it
corresponds to 78% of the unconditional base level probability. All regressions
include an extensive set of other independent variables that have previously been
found to be of importance in the advisor-matching literature. To examine if
endogeneity effects drive these empirical relationships I consider alternative
econometric specifications. With an instrumental variable approach, I find that
accounting for potential endogeneity bias does not explain away the causal effect
of previous employment relations on advisor selection. I subject the results to
robustness checks and consistently find that they continue to hold.
Whereas these results show that the previous employment networks are of
great benefit for former employers, I also find that PE firms reap tangible benefits
from the networks. I consider in particular two features that may potentially

20
benefit PE firms, information/deal sourcing and pricing. To explore
information/deal sourcing, I study if PE firms as bidders are being beneficially
treated by sell-side financial advisors from their previous employment network.
For 203 deals, it is known which firms participated in the bidding process. I find
that there is a 19.0 pp. higher probability to be included in the bidding process
(information sourcing) and a 13.5 pp. higher probability of winning the auction for
firms inside the network (deal sourcing). Results are statistically significant and
accounting for potential endogeneity does not explain away these results. This is
evidence that the social networks are used for funneling information and deals.
Being included in an auction process gives the bidder access to information
memorandum and data rooms containing information that might be very difficult
to obtain elsewhere. Thus, the mere inclusion in an auction process is valuable for
a PE firm. However, due to limitations of the data available I cannot measure the
efficiency of the deal sourcing and will thus not be able to directly address issues
such as the winner‟s curse.
If deals where a PE firm is being advised by a financial advisor with whom
they have a previous employer relationship were pursued at better prices than
other deals, this would offer an additional explanation for the observed principal-
agent matching from a pure profit maximization viewpoint. I find some support
that relative transaction prices are more attractive when former employers are used
as advisors. EV/Revenue is -23.5% for transactions that were advised within the
previous employment network compared to deals outside the network. For
Tobin‟s Q the coefficient of a former employer as advisor is -37.2%. EV/EBITDA
multiples also indicate that deals within the network take place at relatively lower
prices, but the results are not in general statistically significant at conventional
levels.
The contribution of this paper is twofold. In particular, it sheds new light
on the general workings of PE firms. Though studies of the economics of the PE
industry are plentiful [see for example Axelson, Jenkinson, Strömberg, and
Weisbach (2008), Axelson, Strömberg, and Weisbach (2009), Fenn, Liang and
Prowse (1997), Gottschalg and Phalippou (2009), Ivashina and Kovner (2008),
Ljungqvist and Richardson (2003), Metrick and Yasuda (2009), Kaplan (1991),
Kaplan and Schoar (2004), Kaplan and Stein (1993)], this paper bring forth novel
evidence of how deals are sourced to different PE firms through financial advisors.
It is also the first paper that details how PE firms choose those financial advisors.

21
The sheer magnitude of the advisory fees generated by PE driven acquisitions
makes the choice of advisors an interesting case to analyze in itself. PE firms spend
gigantic amounts on acquiring companies. In 2006, PE firms acquired companies
worth a total of $770 billion. The financial advisors hired by PE firms for these
transactions received a total of $11 billion in fees for their services, which
correspond to 16% of all advisory fees in that year.4
Secondly, this is the first paper to examine the importance of having
former employees as clients and the benefits arising from such social networks.
The existence and importance of social networks in financial markets has been
established in a range of recent papers. Cohen, Frazzini and Malloy (2008 and
2009) establish the importance of shared education networks in gaining valuable
information within securities markets. Within the venture capital industry
Hochberg, Ljungqvist and Lu (2007) find that social networks have a positive
impact on investment performance. Kuhnen (2008) finds evidence that network
connections among agents in the fund management industry foster favoritism in
appointments of advisors and directors. Several papers study the social networks of
directors. Kramarz and Thesmar (2006), Barnea and Guedj (2007) and Hwang and
Kim (2008) show that director‟s social networks affect CEO compensation and
corporate governance. Stuart and Yim (2008) find that public companies are more
likely to receive a PE buyout offer if they have a director with previous experience
from LBO transactions. In terms of networks‟ impact on labor market transitions,
Bramoullé and Saint-Paul (2006) find that a higher connectivity among
unemployed individuals reduces duration dependence. Much related, Cingano and
Rosolia (2008) find that job search outcomes for displaced workers is related to the
employment rates of people in their social networks. Clarke, Khorana, Patel and
Rau (2007) use a sample of all-star analysts who switch employment between
investment banks. Though analysts do not change their optimism or
recommendation levels when moving to a new firm, the amount of equity related
transaction deal flow is related to the new analyst‟s reputation. Much related,
Bradley, Choi and Clarke (2008) examine the impact of investment banker job
changes on the mergers and acquisitions (M&A) market shares of investment
banks. They find that the bank losing the banker experiences a decrease in their
4 See “Private equity groups pay Dollars 11bn” by Jeff Wagner, Financial Times, January 5, 2007. Wagner quotes figures from Freeman & Co. and Thomson Financial.

22
industry-level market share, which is partly due to that a significant number of
clients follow the banker from the old bank to the gaining bank. Both these articles
bring strong evidence that human capital is a critical component of investment
banking deal flow.
1.1 Data Transaction data are collected from the Mergermarket database, which contains
information on the world‟s 300 largest PE firms and data on the 6,908 deals
undertaken by these firms starting January 1998 for European deals, January 2001
for North American deals and January 2003 for Asia-Pacific deals and ending in
May 2007. For each deal, information is given on the target, bidders, sellers,
financial advisors, legal advisors, accountants, brokers, consultants and PR firms of
all parties involved. The financial advisors can be investment banks, corporate
finance practices linked to accountancy firms or separate advisory boutiques. The
greatest contribution of the Mergermarket database is that the names of the people
at the PE firm who worked with a particular transaction are listed for several deals.
Those individuals that are on the transaction team of a PE firm are denoted PE
professionals. Besides the identity of these PE professionals, their level of seniority
is detailed. For the purposes of this paper, I consider only deals that have included
an external financial advisor and where the identities of the PE professionals that
participated in the deal are disclosed. An advisor is deemed external if it does not
belong to the same corporate group as the PE firm.5 Unfortunately, the names of
the PE professionals are relatively seldom disclosed for deals outside of Europe,
which leads to that my data set to 94% consists of European transactions. In total,
1,285 transactions of the 6,908 deals reported fulfill my requirements and thus
constitute my data set.
1,408 PE professionals have been involved in these transactions. I gather
data on their career history from a number of sources. Foremost, I obtain CV:s
from the web pages of the PE firms for which they work. These are often quite
detailed as it is in the PE firms‟ self-interest to describe their employees‟ experience
and thereby signal their high competence. However, exact dates of employment
and length of tenure are not generally detailed. For example, out of the 883 people
5 For example, if the PE firm Goldman Sachs Private Equity Group uses Goldman Sachs Investment Banking Division as financial advisor, this deal is excluded from the dataset.

23
who have previously worked as financial advisors, tenure data are available only for
188 individuals. For those who have changed jobs or deceased, I use the web
archive service6 to go to the web pages as they looked when the individual was
employed at the specific PE firm. For those individuals whose CV:s cannot be
retrieved from any PE firm web page, I search a variety of online databases such as
LinkedIn7, ZoomInfo8 and the Financial Services Authority Register9. From these
combined sources, I obtain employment history for 1,326 individuals, which
represent 94% of the total sample of individuals. I merge the information of the
PE professionals‟ working history to my sample of Mergermarket transaction data.
As the Mergermarket database does not contain transaction values for all deals in
my sample, I merge information from the Zephyr database. However, the overlap
of missing information is large between the databases. The average disclosed deal
size of the 3,448 European deals over the sample period is EUR200 million which
is to be compared with the average of my sample of EUR219 million. The deals in
my sample are concentrated in time to the years 2005 (23%) and 2006 (23%). The
corresponding numbers for the full sample for those years are 21% and 24%
respectively. Thus, in terms of size and timing the deals that constitute my data set
resembles the average deals in the database.
1.1.1 Candidate Set
In order to estimate the probability of being selected to advise a particular deal,
data for both the mandated advisor as well as the competitors who were not
mandated is required. For every given transaction, I create a panel of candidate
advisors conditioning information for both mandate winning and non-mandate
winning advisors. In the data, 355 financial advisors have been awarded mandates.
To be included as a candidate advisor for a given deal with a certain PE firm
several restrictions are imposed. First, I filter the advisors based on attrition and
exclude those financial advisor firms that were not in existence when a specific deal
took place. Further, an advisor must be able to carry out advisory work from an
office within the transaction region. The transaction regions used are Europe,
North America and Rest of world. Similar to Ljungqvist et al. (2006) a candidate
6 http://web.archive.org/collections/web.html 7 http://www.linkedin.com 8 http://www.zoominfo.com/ 9 http://www.fsa.gov.uk/register/home.do

24
advisor must also have provided advisory business for the PE firm at some point
in time within the sample period. Through this limiting approach, I rule out those
of the 355 financial advisors that most likely would never be considered as advisors
by a specific PE firm. In my model, on average 27.8 candidate advisors compete
for each deal, which means that the unconditional mean for any advisor to receive
a mandate is 3.6%. As comparison, Ljungqvist et al. (2006) have on average 24.3
competing advisors for any given underwriting mandate. To ensure that the
inclusion restrictions are not driving unreasonable results, I rerun the regressions in
paragraph 1.4.3 with fewer restrictions as a robustness test on a subset of the data
and find that the general results still hold. Only deals that have been performed by
a top 50-ranked advisor are included for which all 50 advisors are used as
candidates. This approach follows Asker and Ljungqvist (2008) as well as Kale,
Kini and Ryan (2003) who use 50 banks in their candidate sets.
1.2 Mandate Probability Model The empirical probability model follows the methodology developed by Ljungqvist
et al. (2006). The probability Pr(Qj,k,n) that a financial advisor j is mandated by a PE
firm k for a particular deal n is estimated by a probit model formulated as:
Pr(Qj,k,n)=f(Zi,j,n, Dj,k, Rj,k, Gj, Hj,n, Kj,k, Sk, Tk, Vj) (1)
The dependent variable takes a value of one if the financial advisor won
the mandate, and zero otherwise. Z is an indicator variable of whether one of the
PE professionals i on the deal team for that particular transaction have previously
been employed at any of the candidate financial advisors for the specific mandate.
The Z variable is the key variable in this study as it indicates the existence of a
social network.
Variable D quantifies the strength of lending interaction between a
financial advisor and PE firm. D is measured as a percentage of previous deals with
the same debt provider over a five-year period. This measure is very similar to that
used by Ivashina and Kovner (2008) who find that PE firms‟ repeated borrowing
with banks in their networks is commensurate with favorable loan conditions. The
provision of funds may be either through direct lending or through underwriting
of debt securities. The nature of PE business relies on the ability to finance
acquisitions partly with debt and the importance of being able to provide debt
financing to win mandates is often stressed by investment banks themselves. For

25
example, investment bank Petrie Parkman & Co. state (SEC File 333-137297): “In
particular, the ability to provide debt financing has become an important advantage
for some of our larger competitors, and because we do not provide such financing,
we may be unable to compete as effectively for clients in a significant part of the
investment banking market.”10 As described by Povel and Singh (2009) it is not
only in buy-side deals where the ability of providing debt financing might play a
role. In sell-side deals, the financial advisor acting for the selling PE firm often
provides „stapled financing‟ which essentially is a statement that sums up the debt
capacity of the business being sold and outlines the amount buyers can borrow and
how much they will have to provide in equity. R is a measure of the strength of
previous interaction between the PE firm and a financial advisor in terms of M&A
advising. Various measures of previous relationships have been found to be of
importance in several advisor-matching studies.11 Similar to the D variable, R is
measured as a percentage of previous deals advised by the same financial advisor
the last five years. G is the explanatory variable for reputation, which is measured
as the overall ranking in the year preceding a deal. There are 1,893 advisor firms in
Mergermarket‟s league table. The top ranked firm is given the value 1,893 whereas
the lowest ranked firm is given the value one.12 H is an indicator variable denoting
expertise by a candidate financial advisor in the industry of the firm subject to the
transaction. I base expertise on the transaction value of the top ten advisors within
the industry.13 Several control variables are used. K is a measure of geographic
10 Similarly, the investment bank Cowen Group Inc. state (SEC File 000-52048): “In particular, the ability to provide debt financing has become an important advantage for some of our larger competitors. We do not provide debt financing and are just beginning to develop debt arrangement capabilities, and therefore we may be unable to compete as effectively for clients in a significant part of the investment banking market.” 11 See for example Ljungqvist et al. (2006), Yasuda (2005), Ellis, Michaely and O‟Hara (2006), Hayward (2003), Francis, Hassan and Sun (2006). 12 Carter and Manaster (1990) use relative placements in „tombstone‟ announcements. Kale, Kini and Ryan (2003) use the relative market share of the underwriters as a proxy for their reputation. Servaes and Zenner (1996) divide advisors in two tiers while Rau (2000) and Ellis, Michaely and O‟Hara (2006) use three tiers. 13 Asker and Ljunqvist (2008) establish the importance of industry expertise for underwriters using as proxy for expertise the combined product market share of an investment bank‟s previous clients within an industry sector.

26
proximity in kilometers between a financial advisor and the PE firm.14 To account
for that certain PE firms and/or financial advisors are so large that matching
between the PE professional and the former employer could be driven purely by
size effects, I implement controls for the size of each PE firm investment fund S,
the number of deals performed by each PE firm T and the number of deals
performed by each financial advisor V over the sample period. Variables G, K, S, T
and V are logged by the natural logarithm. For variable K, which can take the
value zero, I use the natural log of (K+1). Year and country fixed effects are
included throughout the analysis and I adjust the matching between the PE
professionals‟ previous employers and the financial advisors for mergers among
the financial advisors. Starting with the approval date of a merger and going
forward, the new company inherits all previous employments as well as previous
relations from the merged companies within a five years time span. Since my data
consist of multiple investments made by various PE firms, I cluster the standard
errors by PE firms. This allows the error term to be correlated within the deals
made by a PE firm, which imposes a conservative standard for accepting
statistically significant results.15
1.2.1 Descriptive Statistics
The basic properties of the data set are outlined in Table I. 1,285 deals include an
external advisor and disclosed information on the participating PE individuals. Of
these deals, 968 (75.3%) are buy-side deals and 317 (24.7%) are sell-side deals. Of
the buy-side deals, 30 (3.1%) are public-to-private transactions with the remaining
14 For example, Kedia, Panchapagesan and Uysal (2008) and Grote and Umber (2006) find that proximity is an important factor in M&A. I use the proximity measure data from Sarkissian and Schill (2004) which is available on http://web.management.mcgill.ca/Sergei.Sarkissian/. 15 It has been suggested that PE firm fixed effects should be included into the probit regressions. In linear regression models such an approach could mitigate bias due to that results are driven by, say, some reputable firms advising very desirable deals. However, when trying to estimate a probit fixed effect model I encounter the incidental parameters problem, which was first studied by Neyman and Scott (1948). In essence the problem is that the maximum likelihood estimator in nonlinear panel data models with fixed effects is biased and inconsistent when T, the length of the panel, is small and fixed. Heckman (1981) finds that the bias of the probit slope estimator in a fixed effects model is towards zero and on the order of 10% when T = 8 and N = 100. On average, I have a T of 9 which is too small a number to enable the inclusion of PE firm fixed effects. I do however include time and industry fixed effects as the T for these categories are sufficient large.

27
938 (96.9%) deals being private-to-private deals. Of the sell-side deals, 180 (56.8%)
are secondary buyouts to other PE firms, and 137 (43.2%) are trade sales, i.e. deals
were an industrial company buys the business. Deals are undertaken by 153 PE
firms, which have used 355 different financial advisors. Most deals take place in a
European country (94.3%) which is an effect of that data available on deals outside
Europe generally lack information on the identities of the PE professionals. The
most common deal value range is EUR100m-500m (31.3%) followed by deals
below EUR100m (30.7%).
The financial advisors are together awarded 1,721 mandates. The number
of mandates is higher than the number of deals because PE firms have used
multiple advisors in 353 (27.5%) deals. A financial advisor may be an investment
bank, corporate finance practice at an accountancy firm or a corporate finance
boutique. Boutiques differ from traditional investment banks in that they normally
only offer advisory services and not traditional banking services such as securities
trading or debt and equity offerings. Investment banks account for 758 (44.0%) of
the mandates, followed by accounting firms with 542 mandates (31.5%). Corporate
finance boutiques were awarded 421 (24.5%) of the mandates. Top 10 ranked
advisors account for about the same number as mandates as those ranked in
positions 11-25 (28.5% vs. 29.5%).
In Table II, the characteristics of the PE professionals are detailed. 2,672
PE professionals are listed for the 1,285 deals, yielding an average sized PE
transaction team of 2.1 individuals per deal. Several of the names listed refer to the
same individuals participating in different deals. The number of unique individuals
participating as PE deal team members is 1,408. The professionals‟ respective
seniority is labeled in the database as „Level‟ from one to four with one being the
most senior person on the deal team and four being the most junior.16 2,203
(82.5%) names are listed as Level 1; 343 (12.8%) names as Level 2; 96 (3.6%)
names as Level 3 and 30 (1.1%) names as Level 4. A deal team can consist of
several professionals with the same level designation.
16 The levels are assigned by the database. As a side note it could be mentioned that titles corresponding to a certain level can vary substantially between different PE firms. For example, Level 1 may refer to a principal, partner or managing partner, Level 2 includes directors, investment directors and associate directors, Level 3 refers to vice presidents, investment managers and senior associates while Level 4 is the group for investment professionals, associates and analysts.

28
In terms of their background, the majority (58.7%) has previously worked
as financial advisors. 17.0% have a background as operational professionals from
industrial firms followed by 12.3% with consultancy experience. 5.9% started their
careers directly at a PE firm whereas 6.2% have a background from other areas
such as law, government, military or academia. For those individuals who have
previously upheld a position with one or several financial advisory firms, the total
number of financial advisory workplaces is detailed according to league table
rankings and type. Top 10 ranked advisors account for 33.2% of the previous held
positions. Mid-ranked advisors (rank 11-25) make up 23.7% of previous advisor
occupations. The remaining 43.1% subsequently refer to advisors ranked lower
than top 25. The most common type of financial advisor for which PE
professionals have previously worked for is investment banks (63.6%), which is
not surprising as they are the largest actors within financial advising and employ
the bulk of corporate financiers. Accounting firms constitute 29.4% of previous
employers, whereas corporate finance boutiques only make up for 7.0%.
The correlation matrix of all independent variables is displayed in Table III.
Some strong relationships stand out. There is economically significant correlation
between the PE firm size and number of deals (0.599), which is expected. There is
also significant positive correlation (0.370) between a financial advisor with specific
industry expertise and the strength of previous debt relationships. This may be an
effect of that larger financial advisors which have financing capabilities are also
experts in one or several industries. Overall, the extent of correlation among most
pairs of variables raises little concern for multicollinearity in the forthcoming
regression analysis.
Table IV shows univariate comparisons between mandated and non-
mandated advisors for the constructed previous employment variable. A greater
fraction of mandated advisors (7.3%) has a former employee among the PE
professionals compared to the non-mandated advisors (2.2%). The difference is
statistically significant at the 1% level suggesting that a PE professional‟s prior
employment exert significant influence over which advisor a PE firm chooses for a
deal.

29
1.3 Results of the Mandate Probability Model To evaluate (1) I run several probit joint-test regressions with test and control
variables for different subsamples of the data set. Marginal effects are displayed in
panels A-C of Table V. Panel A displays results for all deals while Panels B and C
display results for buy- and sell-side deals respectively. Panel C also includes Wald
F-statistics of the differences across the coefficients in Panels B and C which
overall indicate that the differences between buy- and sell-side deals are significant.
1.3.1 Previous Employment of PE Professionals
Having a previous employee among the PE deal team members increases the
probability of receiving a mandate by 2.8 pp. The coefficient is statistically
significant at the 1% level. Thus, the existence of a previous employee increases
the unconditional mean probability of being mandated from 3.6% to 6.4%. The
results are similar when considering buy- and sell-side deals separately; the marginal
effect for buy-side deals is 3.1 pp. whereas the effect for sell-side deals is 1.9 pp.
The slightly lower economic and statistical significance for sell-side deals suggests
that PE professionals‟ previous employment is relatively more important for a
financial advisor when acting as buy-side advisor. To understand the difference we
need to skip ahead in the results table to the coefficients for industry expertise. For
sell-side deals, the expertise coefficient is as high as 1.1 pp. with significance on the
5% level. Though the previous employment link is still important, PE firms appear
to focus relatively more on the industry expertise of the advisor compared to buy-
side deals where the effect is an insignificant 0.6 pp. The difference can be
explained by that industry experts can act as a certifier of the quality of the asset
offered for sale in a sell-side deal. As will be shown in the second part of this
paper, sell-side advisors also appear to have important network links with
counterparty acquiring firms.
Since it is possible that the senior member of a team single-handedly
decides who should be mandated as advisor I also run the regressions including
only those PE professionals with the highest-level designation in each deal team.
The coefficients are virtually unchanged from the original model specification. The
effect of PE professionals‟ previous employment at a financial advisor firm is 2.7
pp. for all deals. When only considering buy-side deals the effect falls from 3.1 to
2.9 pp., whereas it increases for sell-side deals to 2.2 pp. These results indicate that
the mandate probability results are not to a major extent driven by the level of the

30
PE professionals. The similarity in results with the base specification is consistent
with the small average team size of 2.1 individuals and the fact that about 83% of
the individuals in the data set are listed as Level 1 professionals.
It is conceivable that the effect of having a previous employee among one‟s
potential clients is more important for lower ranked financial advisors than for
higher ranked advisors. To explore this I divide the sample and candidate groups in
two parts with the top 25 overall ranked advisors analyzed separately from the 330
lower ranked advisors. The difference between high- and low-ranked advisors is
however small and the effect of having a previous employee on the PE deal team
does not to a large extent seem to be affected by whether the advisors are high or
low ranked.
As was described above, 27.5% of the deals are done jointly by more than
one financial advisor. If previous employers are mostly hired as joint rather than as
sole advisors, this could indicate that they are brought on as a favor from their
former employers. However, for all deals taken together there is only a small
economic difference between the coefficients of a previous employee of a joint
advisor to one of a sole advisor. The statistical significance is stronger for sole
advisor deals though. For buy-side deals, the impact of being a previous employee
is economically stronger for sole advisors than for joint advisors whereas the
relation is the opposite for sell-side deals, but statistical significance is weak for
sell-side deals.
A previous employee network could be more important when the PE firm is
small or obscure as such firms could potentially receive less wooing from the
general advisor community. I divide the sample based on the size of the PE firm
separating out the top 25 PE firms. Whereas the effect is 3.0 pp. for the largest 25
PE firms, smaller firms yield an average effect of 5.3 pp. Both coefficients are
strongly significant. The results do confirm that previous employment networks
seem to lead to stronger matching with former employees that work for middle
market and smaller PE firms. The relative obscurity of these firms may make them
less exposed to interaction with potential advisors.
The last two columns show results from the sub-periods 1998-2003 and
2004-2007. As is described in Kaplan and Strömberg (2009), the former period
observed modest growth in PE investments compared to the later high-growth
period. The importance of previous employment is slightly larger in the earlier
period but the difference is not material.

31
Table V also shows how all variables change when previous employment is
included. Only very small changes of the coefficients are observed and we can note
that the coefficient for previous employment of PE professionals is the
economically strongest of all the explanatory variables. Overall, the results of Table
V support the anecdotal evidence that previous employees become important
clients.
1.3.2 Debt Provision
A financial advisor‟s likelihood to receive a deal mandate increases with the
strength of the previous financing relationship with the PE firm. The overall
marginal effect is 1.4 pp. When only considering buy-side deals the effect is quite
large (2.1 pp.), whereas for sell-side deals the effect is zero. The finding that
financing relationships are more important in buy-side deals is intuitively
convincing, as a selling firm does not need to obtain financing although they could
arrange stapled financing. The positive coefficient for buy-side deals is consistent
with Ivashina and Kovner (2008) who find that bank relationships formed through
repeated transactions reduce inefficiencies from the information asymmetry
between the lender and the leveraged buyout firm resulting in favorable financing
terms.
1.3.3 Previous Deal Relationships
The strength of previous advisory relationships between a PE firm and a financial
advisor increases the probability of securing a mandate with 1.5 pp. The results are
both economically and statistically stronger for buy- than for sell-side deals. The
positive sign is aligned with most of the findings of previous studies where a
relationship history generally increases the probability of receiving mandates such
as Ljungqvist et al. (2006) and Ellis et al. (2006) who find that prior underwriting
relationships increase the likelihood of winning follow-on capital markets business.
In addition, Hayward (2003) finds that clients are induced to hire the same
investment banks repeatedly.
1.3.4 Reputation and Industry Expertise
Each step higher in the ranking league table reduces, on average, the probability of
winning a mandate by 0.6 pp. whereas to be among the top 10 ranked financial
advisors in the industry sector of the target company has a positive marginal effect
of 0.7 pp. on the dependent variable. These results suggest that a financial advisor‟s

32
particular expert knowledge is more important than the overall general amount of
deals exposure. As was discussed above it is interesting to note that for sell-side
deals the expertise coefficient is 1.1 pp., which is an indication that PE firms hire
industry experts that can act as credible certifiers of the quality of the asset offered
for sale. These results differ from those in Kale et al. (2003) who find that the
likelihood of an investment bank winning an M&A mandate is related to
reputation. However, Bao and Edmans (2008) offer a potential explanation to the
negative sign of reputation. They show that reputation measured on market shares
of advisory services is problematic, because investment banks have an incentive to
push deals through to boost their rankings. The return of the acquirer is a better
predictor of the quality or reputation of the advisor. The negative sign of my
reputation coefficient could be picking up the effect documented in Bao and
Edmans (2008), although I cannot directly test this with my data.
1.3.5 Control Variables
Throughout the analysis, the overall impact of the control variables is small. In
essence, matching of advisors and PE firms is not driven by the size of the
participating actors. The coefficient for geographic distance has the expected
negative sign; the greater the distance between PE firm and candidate advisor, the
lower the probability of being mandated. Similar results are documented in Kedia,
Panchapagesan, and Uysal (2008) who find that information advantages associated
by geographic proximity is an important determinant in acquirer‟s returns and
Grote and Umber (2006) who find that acquirers have a strong and consistent
preference for geographically proximate target companies.
1.4 Instrumental Variable Approach and Robustness Checks To ensure that the presented estimations are valid, the issue of potential
endogeneity must be accounted for. In order to confirm that my results are robust
to omitted variables and reverse causality issues, I employ an instrumental variable
(IV) methodology. I also consider as a robustness test an alternative specification
of the candidate set.
1.4.1 Instrumental Variable
There is an obvious endogeneity problem to worry about since some firm and
advisor characteristics that I have not controlled for may explain why a PE firm

33
matches with certain advisors. For example, the PE firm and a financial advisor
may share some common expertise about the particular target firm but which is
not observable. There could also be other social networks than the one specified
by employment relations that affect the matching between PE firms and advisors.
This could lead to cases where a PE professional who has worked at a specific
financial advisor firm chooses to mandate this advisor but this would not
necessarily reflect a causal consequence of the previous employment. Furthermore,
if financial advisor employees depart to PE firms because the PE firms believe it
would be easier for them to mandate the former employers as advisors, my analysis
could suffer from reverse causality.17
To address these potential endogeneity biases, I need an instrument that is
independent of the mandate decision equation (1) but correlated with the previous
employment relation between advisors and PE firms. A common choice of
instrument is to use a measure of the local availability of the selected characteristic.
My approach follows mainly the methodology of Berger, Miller, Petersen, Rajan
and Stein (2005) who instrument an individual bank‟s size with the median size of
banks in the local market, Bottazzi, Da Rin and Hellman (2008) who instrument a
venture capitalist‟s business experience with the average business experience in the
local market, and Hellmann, Lindsey and Puri (2008) who uses various measures of
the availability of different financial intermediaries in a geographical area as
instruments for matching between venture capital investors and firms. A PE firm‟s
actual choice of financial advisor may be endogenous, but the local availability of
financial advisors in a country is exogenous. Clearly, the number of financial
advisors is related to the previous employment variable since this variable by
construction measures whether a PE professional has in fact worked as corporate
financier with one of the candidate advisors. Once a financial advisor is matched
with a PE firm, the local availability of advisors should not directly affect the
choice of advisor. I estimate an IV regression where the main regression is the
same as in (1), except for that previous employment is now instrumented by the
log of the number of employees at the median sized financial advisor firm in each
17 If I knew the exact starting dates for each individual and the PE firms‟ previous relationships with advisors prior to that starting date this issue could be addressed directly. As has been mentioned, the exact dates of employment and length of tenure are only available for 188 former corporate financiers whereof 108 individuals joined the PE firm after the start of my sample period. Hence, the nature of my data renders such an analysis unfeasible.

34
country where a deal takes place. An argument against the validity of this
instrument may be raised if the country has a low level of financial sophistication.
For such countries, it could be that the local PE firms would be less likely to hire
local financial advisors due to their low quality, an inferior-country bias. This
would be independent of the fact that less developed financial services also lead to
a lower chance that the PE firms employs a former worker from the local financial
advisors. The implication is that there would be a correlation through other
channels outside the relation of PE firms employing former employees of a
financial advisor and the proposed instrument would not be appropriate. However,
as was shown in Table I, 98.8% of the deals take place in Europe or North
America where financial markets are inarguably well developed. This should offer
some comfort that the instrument does not suffer from an inferior-country bias.
Data are obtained from the Orbis database. Results are displayed in Table VI. In
the first stage equations, we see that the instrument itself is strongly significant
which indicates that it is a valid instrument. The corresponding F-statistics of the
instrument is always above the often-used threshold of 10.18 Second step equations
reveal that the instrumented previous employment coefficient is strongly
significant and economically strong; 5.8% for all deals, 6.1% for buy-side deals and
4.6% for sell-side deals. Thus, the IV estimations do indicate that there is a causal
relationship on advisory mandating based on previous employment networks. The
IV estimates are higher than in the probit model, which could indicate that the
probit estimates are biased downwards. Such a downward bias could be due to
measurement errors in the biographic data collected which causes the observed
number of potential matches between former employees and mandated firms to
appear too low.
1.4.2 Alternative Analysis
I further investigate a subset of transactions that include only those PE
professionals that are present in more than one deal. Do the PE professionals who
have a background as corporate financiers use their old employers more often than
other advisors? Conditional on being mandated for at least more than one
transaction with the same PE professional, what is the total share of transactions
this financial advisor is included in with the given individual? In Table VII, we see
18 See for example Stock, Wright and Yogo (2002).

35
that the share is higher for those advisors where the PE professional is a previous
employee (70.9%) than those who are not (53.6%). The results are statistically
significant at the 10% level. I do not want to overemphasize these results due to
the small sample size of 31, but they do point in the same direction as the previous
findings; that previous employment matter in the selection of financial advisors.
1.4.3 Alternative Candidate Set
In the following robustness test, I vary the candidate set to equal the methodology
used in Asker and Ljungqvist (2008) and Kale et al. (2003). The data set now
consists of only the top 50 ranked financial advisors, which reduces my set of
transactions to 941 consisting of 701 buy- and 240 sell-side deals. Thus, the
unconditional probability for an advisor to receive a mandate is now 2.0%. Turning
to the results in Table VIII, we see that the coefficient for having a previous
employee among the PE deal team increases this probability from 2.0% by 1.6 pp
to 3.6%. The coefficient is statistically significant at the 1% level. Even though the
candidate set is defined very broadly, the previous employment of PE
professionals does have an important impact with coefficients of 1.6 pp., 1.3 pp.
and 1.9 pp. for all, buy- and sell-side deals. There may be conflicting views on the
best composition of a candidate set but the robustness test offers a lowest bound
on the magnitude of my results and as such serves as supportive proof of that my
results are not driven by an unreasonable construction of the candidate set.
1.4.4 Demotions
It is conceivable that an employee who is demoted or fired may be biased against
hiring a former employer as advisor. Thus, for financial advisors facing a PE
professional who is a former demoted employee, the probability of winning a
mandate could be greatly reduced. Overall, such effects would bias my results
downwards. To explore whether such cases are prevalent in the data I proxy a
potential demotion as when a PE professional at a bottom-25 firm (in terms of
funds under management) has previously worked at a top-25 ranked financial
advisor. An individual‟s move from a top firm to a small obscure PE firm could be
the result of an employer‟s discontent with an employee or indeed also the reverse.
As there are only 15 such cases in the data this suggest that my results are robust to
a downwards bias from demotions.

36
1.4.5 Alternative Interpretation
If the PE firm assigns a professional who is a former financial advisor employee
after they have decided to hire this professional‟s former employer as advisor the
analysis would suffer from a reversed team construction bias. For example, the
professional may be brought on to the team in a liaison role to facilitate
communication between the PE firm and the old employer. This would indicate
that the PE firm does not choose the financial advisors because they have a former
employee in the team. While it is not possible to know the exact time of when a
team is put together, the results from Table V can be used to address whether this
alternative interpretation is consistent with the data. Let us revisit the results where
the key independent variable is one if the senior deal team professional is a former
employee of the candidate financial advisor. As has already been noted the results
are unchanged to the base case specification of the professional being just any of
the team members, which suggests that results are not driven by a senior
professional effect. The results on senior professionals enable me to refute the
reversed team construction since the senior team member is to be expected to be
part of the team before the advisor is selected. However, if the alternative
explanation that matching is driven by ex post assignment of professionals in
liaison roles is true we should observe insignificant results on the senior
professional indicator, which we do not.
1.5 Mutual Networking Benefits The analysis so far clearly suggests that previous employment relations matter in
the matching between PE professionals and advisors. Having a former employee
on the PE firm deal team is beneficial for the financial advisors. Next, I examine
why PE firms hire their former employers as advisors. To assess the benefit of
financial advisors to the companies they are advising, previous research has
centered around two different measures. The first measure is the wealth gains to
acquirers, which has been studied by for example Hunter and Walker (1990),
Bowers and Miller (1990), McLaughlin (1992), Rau (2000) and Rau and Rodgers
(2002). The second approach has looked at the speed of deal completion [see for
example Rau (2000), Hunter and Jagtiani (2003)]. For my purposes the approaches
used in the previous literature, which have dealt exclusively with public deals, are
not feasible for my sample of transactions where 96.9% are private-to-private deals

37
and thus not subject to the same bidding process as public deals. Whereas the
announcement of a public takeover bid is to be followed by a period giving the
shareholders time to decide whether to tender their shares or not, private deals are
commonly pre-packaged in the sense that the shareholders have already agreed to
the bid. For private bids, this means that announcement date and completion date
are the same, which makes it impossible to measure speed of completion.
Furthermore, as only six of the 153 PE houses in my sample are publicly listed I do
not have a sufficient number of transactions to measure the impact of former
employee relations on stock returns of the acquirers. An alternative approach
would be to use PE firm fund performance but data are not available either
because the fund is not yet closed or because such data are not publicly reported.
As data may become available in the future, such an analysis could be the topic of
follow-up research to this paper. Hence, I will proceed along a somewhat different
route than previous studies and examine two other explanatory mechanisms using
a subset of the data from the mandate probability model:
i. Information and deal sourcing. Do PE firms as bidders benefit in auctions
held by their former employers as sell-side advisors? Such benefits could be
through inclusion into the bidding processes whereby they get access to
valuable non-public information (information sourcing) and an increased
probability of winning the auction (deal sourcing).
ii. Pricing. Are deals where a PE firm is advised by a financial advisor with
whom they have a previous employer relationship pursued at generally more
attractive prices?
1.5.1 Information and Deal Sourcing
I analyze information and deal sourcing in a probit framework where the
probability of winning an auction is conditional on having participated as bidder.
Pr(Γk,n)=f(Wi,m,n, Rm,k, A, B, Km,k, Sk ,Tk) (2)
Pr(Φk,n|Γk,n=1)=f(Wi,m,n, Rm,k, A, B, Km,k, Sk, Tk) (3)
Where Pr(Γk,n) is the probability that a PE firm k is participating in an
auction for a particular deal n and Pr(Φk,n) is the probability that the bidding PE
firms wins the auction. The dependent variable in equation (2) [equation (3)] takes
a value of one if the PE firm participates (wins) and zero otherwise. W is an
indicator variable on whether a PE professional i who is employed at the PE firm
at the time of the deal has previously been employed as corporate financier with

38
the sell-side financial advisor m. In the mandate probability model, the variable
measured professionals on the specific deal team. Now, I broaden the measure to
include any of the professionals employed at the PE firm at the time of the deal.
This captures the fact that whoever receives information on an upcoming sale may
easily pass that information on within the firm without actually themselves taking
part on the deal team. R measures the strength of relationships between the PE
firm and a selling financial advisor over the last five years. A is the number of
bidders in the auction and B is the number of financial advisors on the sell-side. K
is the measure of geographic proximity in kilometers between the closest offices of
the selling financial advisor to the PE firm. S is the size of the PE firm funds and
finally, T is the number of deals performed by the PE firm over the sample period.
Variables R, K, S and T are measured by the natural logarithm. I cluster the
standard errors by PE firm. To be able to estimate (2), data are needed for both
those PE firms that participated in the auction as well as for those that reasonably
could have participated in the auction. Again, a candidate set must be created. For
203 of the deals in my data set I have information of all participating bidders and
winners. For the creation of the candidate set needed to estimate the probability of
being a bidder, I partition the panel data to include all those PE firms that are
mentioned as bidders in any of these deals, conditional on that each PE firm must
have an office in the transaction region. This creates 15,381 potential bidders for
the 203 deals. For equation (3), the candidate set is already given since all bidders
are named in the data yielding 988 observations.
Table IX reports marginal results for the probability of bidding inclusion.
The previous relationship indicator indicates that the probability of participating in
an auction is increased by 19.0 pp. if one of the selling advisors has been a
previous employer of one of the PE professionals at the firm. In addition, for the
results of winning an auction, we see that the previous employment relation is
important; the marginal increase in the probability of winning the auction is 13.5
pp. for those PE firms who have professionals that previously have been employed
at one of the selling parties‟ financial advisors. To account for potential
endogeneity, I employ the previously used instrument, the log of the median size
of financial advisor employees in each country where a deal takes place. The first
stage equations indicate that the instrument is valid. The second step equations
yield estimates of the previous employee coefficient of 10.9 pp and 7.3 pp
respectively.

39
1.5.2 Pricing
To explore the possibility that PE professionals choose to hire their former
employers because of price effects I analyze transaction multiples and Tobin‟s Q.
1.5.2.1 Transaction Multiples
One role of a financial advisor is to advise their principals and negotiate as low a
transaction price as possible for buy-side deals. Based on the choices between
different financial advisors, I model that a PE firm k chooses the financial advisor j
that minimize the transaction price multiple Mn,x paid for the target company in
deal n where x denotes which kind of multiple that is used. The relevant
transaction multiples being reported in the Mergermarket and Zephyr databases are
trailing revenue and EBITDA multiples.19 These multiples are based on the
enterprise value (EV) of the underlying target company. EV is calculated as the
price paid for the equity (deal value) plus the market value of net-debt, minority
interests and preferred shares. Using EV rather than deal value when calculating
multiples allows for comparisons across companies with different capital
structures. The various measures Mn,x are thus defined as:
Mn,revenue ≡ (EVn/revenuen) (4)
Mn,EBITDA ≡ (EVn/EBITDAn) (5)
Average multiples Mc,x for groups of comparable deals c are constructed in
several steps and used as explanatory variables. Bargeron, Schlingemann, Stulz, and
Zutter (2008) document that PE bidders in general pay lower multiples and
acquisition premiums than strategic buyers but they do not find that the lower
prices are attributable to differences in target and deal characteristic. To account
for that PE firms differ from strategic acquirers in this respect, I base the set of
comparable deals only on transactions done by PE firms. I further divide the group
according to deal size, geographic region and industry sector. Deal size range from
small (below EUR100m), medium-low (EUR100m-500m), medium-high
(EUR500m-1,000m) and large (above EUR1,000m). Geographic regions are North
America, Europe and Rest of world. 28 industry sectors are specified. To allow for
that multiples may vary over time and are subject to both contractions and
expansions, comparison multiples are measured over three year windows ranging
from, and including, the year before the deal to the year after the deal. I take the
19 Other ratios such as EBIT and earnings multiples are reported for too few transactions to render statistical analysis possible.

40
natural logarithm of all monetary amounts and apply control variables. The
regression at hand is thus:
ln(Mn,x) = α+βZi,j,n+γln(Mc,x)+δA+ζGj+ηHj,n+ιKj,k+λSk+ςTk+ξVj+ε (6)
A is the credit spread between the yield on the bank prime loan rate and
the 10-year treasury bonds in the month of the deal, which is used as a proxy for
the cost of financing a PE deal. All other independent variables are as defined in
section 1.2. To ensure that results are not driven by that some financial advisors
always are better (worse) in obtaining relatively attractive (unattractive) prices or
that some PE firms always pay relatively less (more) than other bidders I run the
regression also with financial advisor and PE firm fixed effects. Before we turn to
the results it should again be pointed out that the revenue and EBITDA multiples
are only available for a subset of the data. Lack of availability is either due to that
the transaction value is undisclosed or because the financials of the target
companies are not public. The reasons for financials not being public are most
often due to that the target company is divested from a larger legal entity and there
are no separate public accounts for the part being sold. Whereas there are enough
data points to conduct an analysis of buy-side deals, it is however not possible to
do so for the sell-side deals. The following analysis is thus confined to 815 buy-side
deals for the revenue multiple and 573 deals for the EBITDA multiple. Regression
results for both multiple specifications are displayed in Table X. Coefficients for
Mn,c,revenue vary between -23.5% to -29.2%. When no fixed effects are used, using
ones previous employer as advisor yields on average 23.5% lower prices compared
to comparable transactions. The coefficient is statistically significant on the 5%
level. The result is more negative for the cases where either PE firm or advisor
firm fixed effects are included. The coefficients are -27.2% and -29.2% indicating
that some PE firms and some advisors appear to consistently obtain relatively
lower prices. With industry fixed effects the coefficient is -24.5%.
The regression results for Mn,c,EBITDA are generally of lower magnitude
compared to those of Mn,c,revenue, both with and without fixed effects. The benefit of
using ones previous employer as advisor yields on average -10.5% lower prices
compared to comparable transactions, when using the EBITDA measures.
However, the results are not generally statistically significant at conventional levels.
The coefficient is more negative when PE and advisor fixed effects are
implemented. With PE firm fixed effect the coefficient of -22.2% is significant on
the 5% level. Overall these results indicates that, on average, for those buy-side

41
deals where the PE professionals mandate their old employers as advisors, the
transaction price paid for the target company compared to the previous 12 months
revenue is relatively lower than in comparable transactions.20 However, due to the
low statistical significance, no strong conclusions on the profitability multiple
EV/EBITDA can be drawn.
1.5.2.2 Tobin‟s Q
An alternative method of examining a financial advisor‟s impact on prices is to
analyze Tobin‟s Q, the ratio of the market value of a firm to the replacement cost
of its assets. If Tobin‟s Q is consistently lower for those deals where a PE firm has
been advised by their former employers this would support the pricing argument.
In the data, it is possible to calculate Tobin‟s Q for 549 buy-side transactions.
Tobin‟s Q is calculated as the EV paid in the transaction over the total book value
of assets of the target. Data on latest book values prior to the transaction are
collected from Orbis. With the exception for the comparable multiples, the same
independent variables as in (6) are used. OLS regression results are displayed in
Table X. The results are consistent with those of the transaction multiples analyses.
Using a previous employer as advisor reduces Tobin‟s Q with -37.2%. The
coefficient is significant on the 10% level. Coefficients are not significant when PE
firm and advisor fixed effects are included: With industry fixed effects the previous
employee coefficient is -47.5% and significant on the 10% level.
1.5.3 Endogeneity
To control for potential endogeneity concerns in the multiples and Tobin‟s Q
regressions, I again instrument the PE professional indicator variable with the log
of the median size of financial advisor employees in each country where a deal
takes place. IV results, which are displayed in Table XI, are lower both in
economic magnitude and statistical significance compared to results in Table X.
Coefficients for EV/Revenue and Tobin‟s Q are -16.1% and -16.5% respectively
and both significant on the 5% level. The coefficient for EV/EBITDA is however
still not significant. First stage regressions and F-statistics indicate that the
instrument is valid and strong for the EV/Revenue and Tobin‟s Q measures.
20 I run several robustness tests where I allow for different compositions of the comparison group. In the first alternative specification I allow only for deals performed in the same year and in the second specification I remove the constraint of only considering deals by PE firms. Results are similar to the base case specification and they are available upon request.

42
Overall, after controlling for endogeneity bias, the prices paid in transactions
within the previous employment network are statistically lower than for those deals
outside the network.
1.5.4 Discussion
The revenue multiple and Tobin‟s Q results indicate that when financial advisors
are matched with their former employees, they negotiate deals with relatively lower
prices. However, due to lack of company data I cannot control directly for whether
some firms within an industry are inferior companies. Companies that are inferior
relative to the control groups should be sold at lower prices to reflect their lower
potential for earnings generation. Another concern is the low statistical significance
of the profitability multiple EV/EBITDA.
The results on information flow and deal sourcing are however statistically
strong and robust, indicating that PE firms hire their former employers as advisors
because of the beneficial treatment they receive from advisors in sell-side roles.
Information on PE markets is mostly private to its nature. Being included in an
auction process gives a bidder access to information memorandum and data rooms
containing information that might be very difficult to obtain elsewhere. Thus, the
mere inclusion in an auction process is valuable for a PE firm. Once in the bidding
process it is conceivable that beneficial advisors disperse information to their old
employees to induce bidding or present favorable opinions regarding the PE
bidder to sellers. A potential concern for a winner of an auction is that of the
winner‟s curse; that the highest and winning bidder in an auction paid too much.
As I do not have return data of the acquired firms I cannot directly address the
question of whether winner‟s curse is present in my transactions. However, it is of
particular interest to discuss the findings of Boone and Mulherin (2008) as they
study the private bidding processes prior to the announcement of a public deal.
Though a range of studies has discussed the winner‟s curse, 21 the empirical study
conducted in Boone and Mulherin (2008) is the one that offers the closest
comparison with the settings in this paper. For a sample of 308 major takeovers
announced in the 1990:s they find evidence against the winner‟s curse after
controlling for endogeneity between bidder returns and takeover competition.
Further, they also find that prestigious investment banks hired by the bidder do
21 See for example McAfee and McMillan (1987), Laffont (1997) and Klemperer (1999) for surveys on the topic.

43
not promote the winner‟s curse. Nevertheless, truly addressing this issue remains
an empirical question that can be addressed only as data becomes available for my
sample.
1.6 Conclusions The PE industry is characterized by private information. This papers shows that
personal networks between the individuals working as PE professionals and
financial advisor firms, the gatekeepers of information, greatly affect the
economics of the industry on a deal level.
As the first paper to explore the importance of having former employees as
clients and the benefits arising from such social networks, the central finding is
that the likelihood that a financial advisor is mandated to advise on either a buy-
side or sell-side transaction for a PE firm is increased by 2.8 pp. from 3.6% to
6.4% if the PE professionals responsible on the deal team have previously worked
for the financial advisor. Results are statistically significant and accounting for
potential endogeneity bias does not explain away these results.
In addition, PE firms benefit from the networks. Analysis of transaction
multiples and Tobin‟s Q indicates that PE firms pay less in transactions in which
they are advised by their former employers compared to other deals. Enterprise
values over revenue multiples are 23.5% lower in network deals. I also find strong
support that financial advisors source deals to their former employees who now
work as PE professionals. PE firms both participate in auctions and win these
auctions to a larger extent if the financial advisor of the selling party is the former
employer of professionals at the PE firm. There is a 19.0 pp. higher probability to
be included in the bidding process and a 13.5 pp. higher probability of winning the
auction for firms inside the network.

44
1.7 References Asker, John William and Alexander Ljungqvist, 2008, Competition and the
structure of vertical relationships in capital markets, Working paper.
Axelson, Ulf, Tim Jenkinson, Per Strömberg and Michael S. Weisbach, 2008, The
financing of large buyouts: an empirical analysis, Working paper.
Axelson, Ulf, Per Strömberg and Michael S. Weisbach, 2009, Why are buyouts
levered? The financial structure of private equity funds, Journal of Finance 64,
1549-1582.
Bao, Jack and Alex Edmans, 2008, Do investment banks have skill? Performance
persistence of M&A advisors, Working paper.
Bargeron, Leonce, Frederik P. Schlingemann, René M. Stulz and Chad J. Zutter,
2008, Why do private acquirers pay so little compared to public acquirers?,
Journal of Financial Economics 89, 375-390.
Barnea, Amir and Illan Guedj, 2007, CEO compensation and director networks,
Working paper.
Berger, Allen, Nathan Miller, Mitchell Petersen, Raghuram Rajan and Jeremy Stein,
2005, Does function follow organizational form? Evidence from the lending
practices of large and small banks, Journal of Financial Economics 76, 237-269.
Boone, Audra L. and J. Harold Mulherin, 2008, Do auctions induce a winner‟s
curse? New evidence from the corporate takeover market, Journal of Financial
Economics 89, 1-19.
Bottazzi, Laura, Marco Da Rin and Thomas Hellman, 2008, Who are the active
investors? Evidence from venture capital, Journal of Financial Economics 89, 488-
512.
Bowers, Helen M. and Robert E. Miller, 1990, Choice of investment banker and
shareholder wealth of firms involved in acquisitions, Financial Management 19, 34-
44.
Bradley, Daniel J., Hyung-Suk Choi and Jonathan Clarke, 2008, Working for the
enemy: an examination of investment banker job changes, Working paper.
Bramoullé, Yann and Gilles Saint-Paul, 2006, Social networks and labour market
transitions, Working paper.
Carter, Richard and Steven Manaster, 1990, Initial public offerings and underwriter
reputation, Journal of Finance 45, 1045-1067.

45
Cingano, Federico and Alfonso Rosolia, 2008, People I know: job search and social
networks, Working paper.
Clarke, Jonathan, Ajay Khorana, Ajay Patel and Raghavendra Rau, 2007, The
impact of all-star analyst job changes on their coverage choices and investment
banking deal flow, Journal of Financial Economics 84, 713-737.
Cohen, Lauren, Andrea Frazzini and Christopher Malloy, 2008, The small world of
investing: board connections and mutual fund returns, Journal of Political Economy
116, 951-979.
Cohen, Lauren, Andrea Frazzini and Christopher Malloy, 2009, Sell side school
ties, Journal of Finance, Forthcoming.
Ellis, Katrina, Roni Michaely and Maureen O‟Hara, 2006, Competition in
investment banking: proactive, reactive, or retaliatory?, Working paper.
Fenn, George W., Nellie Liang and Stephen Prowse, 1997, The private equity
market: an overveiw, Financial Markets, Institutions & Instruments 6, 1-105.
Francis, Bill, Iftekhar Hassan and Xian Sun, 2006, Why do firms switch financial
advisors in M&As?, Working paper.
Gottschalg, Oliver and Ludovic Phalippou, 2009, The performance of private
equity funds, Review of Financial Studies 22, 1747-1776.
Grote, Michael H. and Marc P. Umber, 2006, Home biased? A spatial analysis of
the domestic merging behavior of US firms, Working paper.
Hayward, Mathew, 2003, Professional influence: the effects of investment banks
on clients‟ acquisition financing and performance. Strategic Management Journal 24,
783-801.
Heckman, James J., 1981, The incidental parameters problem and the problem of
initial conditions in estimating a discrete time-discrete data stochastic process, in
Manski, Charles F. and Daniel L. McFadden (Editors), “Structural Analysis of
Discrete Data with Econometric Applications”, MIT Press, Cambridge, 114-
178.
Hellmann, Thomas, Laura Lindsey and Manju Puri, 2008, Building relationships
early: banks in venture capital, Review of Financial Studies 21, 513-541.
Hochberg, Yael, Alexander Ljungqvist and Yang Lu, 2007, Whom you know
matters: venture capital networks and investment performance, Journal of Finance
72, 251-302.
Hunter, William C., and Julapa Jagtiani, 2003, An analysis of adviser choice, fees,
and effort in mergers and acquisitions, Review of Financial Economics 12, 65-81.

46
Hunter, William C. and Mary Beth Walker, 1990, An empirical examination of
investment banking merger fee contracts, Southern Economic Journal 56, 7-30.
Hwang, Byoung-Hyoun and Seoyoung Kim, 2008, It pays to have friends, Journal of
Financial Economics, Forthcoming.
Ivashina Victoria and Anna Kovner, 2008, The private equity advantage: leveraged
buyout firms and relationship banking, Working paper.
Kale, Jayant, Omesh Kini and Harley E. Ryan, 2003, Financial advisors and
shareholder wealth gains in corporate takeovers, Journal of Financial and
Quantitative Analysis 38, 475-501.
Kaplan, Steven N., 1991, The staying power of leveraged buyouts, Journal of
Financial Economics 29, 287-313.
Kaplan, Steven N. and Antoinette Schoar, 2004, Private equity performance:
returns, persistence and capital flows, Journal of Finance 60, 1791-1824.
Kaplan, Steven N. and Jeremy Stein, 1993, The evolution of buyout pricing and
financial structure in the 1980s, Quarterly Journal of Economics 108, 313-357.
Kaplan, Steven N. and Per Strömberg, 2009, Leveraged buyouts and private equity,
Journal of Economic Perspectives 23, 121–146.
Kedia Simi, Venkatesh Panchapagesan and Vahap B. Uysal, 2008, Geography and
acquirer returns, Journal of Financial Intermediation 17, 256-275.
Klemperer, Paul, 1999. Auction theory: a guide to the literature. Journal of Economic
Surveys 13, 227-286.
Kramarz, Francis and David Thesmar, 2006, Social networks in the boardroom,
Working paper.
Kuhnen, Camelia M., 2009, Business networks, corporate governance and
contracting in the mutual fund industry, Journal of Finance 64, 2185-2220.
Laffont, Jean-Jacques, 1997, Game theory and empirical economics: the case of
auction data, European Economic Review 41, 1-35.
Ljungqvist, Alexander, Felicia Marston and William J. Wilhelm, 2006, Competing
for securities underwriting mandates: banking relationships and analyst
recommendations, Journal of Finance 61, 301-340.
Ljungqvist, Alexander and Matthew Richardson, 2003, The investment behavior of
private equity fund managers, Working Paper.
McAfee, Preston and John McMillan, 1987, Auctions and bidding, Journal of
Economic Literature 25, 699-738.

47
McLaughlin, Robyn M., 1992, Does the form of compensation matter? Investment
banker fee contracts in tender offers, Journal of Financial Economics 32, 223-260.
McPherson, Miller, Lynn Smith-Lovin and James M. Cook, 2001, Birds of a
feather: homophily in social networks, Annual Review of Sociology 27, 415-44.
Metrick, Andrew, and Ayako Yasuda, 2009, The economics of private equity funds,
Review of Financial Studies, Forthcoming.
Neyman, Jerzy and Elizabeth L. Scott, 1948, Consistent estimates based on
partially consistent observations, Econometrica 16, 1-32.
Povel, Paul and Rajdeep Singh, 2009, Stapled finance, Journal of Finance,
Forthcoming.
Rau, P. Raghavendra, 2000, Investment bank market share, contingent fee
payments, and performance of acquiring firms, Journal of Financial Economics 56,
293-324.
Rau, P. Raghavendra and Kimberly J. Rodgers, 2002, Do bidders hire top-tier
investment banks to certify value?, Working paper.
Sarkissian, Sergei and Michael J. Schill, 2004, The overseas listing decision: new
evidence of proximity preference, Review of Financial Studies 17, 769-809.
Servaes, Henri and Marc Zenner, 1996, The role of investment banks in
acquisitions, Review of Financial Studies 9, 787-815.
Stock, James H., Jonathan H. Wright and Motohiro Yogo, 2002, A survey of weak
instruments and weak identification in generalized method of moments, Journal
of Business & Economic Statistics 20, 518-529.
Stuart, Toby E. and Soojin Yim, 2008, Board interlocks and the propensity to be
targeted in private equity transactions, Journal of Financial Economics, Forthcoming.
Yasuda, Ayako, 2005, Do bank relationships affect the firm‟s underwriter choice in
the corporate-bond underwriting market?, Journal of Finance 60, 1259-1292.

48
1.8 Tables Table I. Summary of data
Overview of the 1,285 PE transactions obtained from the Mergermarket database over the period 1998 to 2007. All Buy-side Sell-side
# % # % # %
Siz
e (
mE
UR
) < 100 394 30.66 326 33.68 68 21.45
100 – 500 402 31.28 280 28.93 122 38.49
500 – 1000 126 9.81 89 9.19 37 11.67
1000 < 149 11.60 120 12.40 29 9.15
Not disclosed 214 16.65 153 15.81 61 19.24
Reg
ion
Europe 1212 94.32 906 93.60 306 96.53
North America 57 4.44 48 4.96 9 2.84
Rest of world 16 1.25 14 1.45 2 0.63
Deal
typ
e Public-to-private 30 3.10
Private-to-private 938 96.90
Trade sales 137 43.22
Secondary buyout 180 56.78
Man
date
s Deals 1285 100 968 75.33 317 24.67
Total 1721 100 1351 78.50 370 21.50
# PE house 153 147 79
# Advisor 355 229 78
# A
dvi
sors
1 advisor 932 72.53 668 69.01 264 27.27
2 advisors 269 20.93 221 22.83 48 4.96
3 advisors 66 5.14 62 6.40 4 0.41
4 advisors 18 1.40 17 1.76 1 0.10
Ad
viso
r
typ
e
Investment bank 758 44.04 536 39.67 222 60.00
Corporate finance at accounting firm
542 31.49 480 35.53 62 16.76
Corporate finance boutique 421 24.46 335 24.80 86 23.24
Ad
viso
r
ran
kin
g Top 10 ranked 490 28.47 335 24.80 155 41.89
Rank 11-25 507 29.46 436 32.27 71 19.19
26 and lower 724 42.07 580 42.93 144 38.92

49
Tab
le I
I. P
E p
rofe
ssio
nals
, d
esc
rip
tive
data
Exp
erie
nce
det
ails
th
e ar
eas
in w
hic
h i
ndiv
idual
s h
ave
pre
vio
usl
y w
ork
ed p
rio
r to
th
eir
PE
ap
po
intm
ent.
An
in
div
idual
can
hav
e ex
per
ien
ce
fro
m m
ore
th
an o
ne
sect
or
and f
rom
sev
eral
fin
anci
al a
dvis
ors
wit
h d
iffe
ren
t ra
nki
ngs.
Sen
iori
ty i
s in
dic
ated
th
rough
lev
el d
esig
nat
ion
s w
ith
Lev
el 1
bei
ng
the
mo
st s
enio
r. F
or
tho
se i
ndiv
idual
s w
ho
hav
e p
revio
usl
y uph
eld a
po
siti
on
wit
h a
fin
anci
al a
dvi
sory
fir
m,
the
tota
l n
um
ber
of
fin
anci
al a
dvis
ory
work
pla
ces
is d
etai
led a
cco
rdin
g to
lea
gue
tab
le r
ankin
gs a
nd t
ype.
Advis
or
ran
kin
gs a
re b
ased
on
to
tal tr
ansa
ctio
n v
alues
over
the
per
iod 1
998
to 2
007.
Fin
an
cia
l ad
viso
r ty
pe
%
63.6
0
29.3
9
7.0
1
100.0
0
#
699
323
77
1099
Inves
tmen
t b
ank
Co
rpo
rate
fin
ance
at
acco
un
tin
g fi
rm
Co
rpo
rate
fin
ance
bo
uti
que
To
tal
Fin
an
cia
l ad
viso
r ra
nk
ing
%
33.2
1
23.6
6
43.1
3
100.0
0
#
365
260
474
1099
To
p 1
0
ran
ked
Ran
k 1
1-2
5
Ran
k 2
6 a
nd
low
er
To
tal
PE
pro
fess
ion
als
’
sen
iori
ty
%
82.4
5
12.8
4
3.5
9
1.1
2
100.0
0
#
2203
343
96
30
2672
Lev
el 1
Lev
el 2
Lev
el 3
Lev
el 4
To
tal
PE
pro
fess
ion
als
’ exp
eri
ence
%
58.6
7
17.0
1
12.2
9
5.8
5
6.1
8
100.0
0
#
883
256
185
88
93
1505
Fin
anci
al
advis
or
Op
erat
ion
al
Co
nsu
ltan
cy
Dir
ectl
y to
PE
Oth
er
To
tal

50
Table III. Correlation matrix This matrix show the correlation between the main explanatory variables used. Previous employee is an indicator variable taking the value one if a PE deal team member has previously worked for the financial advisor. Debt interaction measures the percentage ratio of the number of times a financial advisor has provided debt financing to the PE firm within the previous five years. Previous interaction measures the percentage ratio of the number of times a financial advisor has advised on a deal with the PE firm within the previous five years. Ln(Advisor rank) is the natural logarithm of a financial advisor‟s ranking in the previous year. Expertise indicates if the financial advisor is among the top ten in the transaction league table for the specific industry sector. Ln(Geographic distance) is the natural logarithm of the distance in km between the capital of the transaction country and the capital of the nearest country in which the financial advisor has an office. Ln(PE firm size) is the natural logarithm of the total investment funds at the PE firm over the sample period. Ln(# PE firm deals) and Ln(# Advisor deals) are the natural logarithms of the number of deals performed by the PE firms and financial advisors, respectively, over the sample period.
Correlations (1) (2) (3) (4) (5) (6) (7) (8) (9)
(1) Previous employee 1.000 (2) Debt interaction 0.029 1.000 (3) Previous interaction 0.061 0.028 1.000 (4) Ln(Advisor rank) 0.056 0.218 0.077 1.000 (5) Expertise 0.107 0.370 0.072 0.167 1.000 (6) Ln(Geographic distance) -0.060 -0.099 0.001 -0.126 -0.133 1.000 (7) Ln(PE firm size) -0.061 0.101 0.010 -0.010 0.028 0.134 1.000 (8) Ln(# PE firm deals) -0.099 -0.108 0.007 -0.121 -0.149 0.121 0.599 1.000 (9) Ln(# Advisor deals) 0.151 0.393 0.138 0.546 0.451 -0.276 -0.078 -0.250 1.000

51
Tab
le I
V.
Pre
vio
us
emp
loym
en
t in
dic
ato
r va
riab
le
Th
e es
tim
atio
n d
ata
set
con
sist
s o
f 1,2
85 b
uy-
an
d s
ell-
side
tran
sact
ion
s o
ver
th
e p
erio
d J
anuar
y 1998 t
o M
ay 2
007 o
f w
hic
h 3
55 f
inan
cial
advis
ors
are
dee
med
to
co
mp
ete
to r
ecei
ve
a m
andat
e. F
or
each
dea
l, a
fin
anci
al a
dvis
or
is c
on
sider
ed a
s a
can
did
ate
for
rece
ivin
g a
man
dat
e if
it;
1)
has
at
leas
t on
ce p
erfo
rmed
advis
ory
busi
nes
s w
ith t
he
PE
fir
m d
uri
ng
the
sam
ple
per
iod,
2) i
s ab
le t
o c
arry
out
advis
ory
wo
rk w
ith
in a
dea
l‟s g
eogr
aph
ic r
egio
n. T
her
e ar
e 36,8
32 s
uch
advis
or-
dea
l p
airs
. T
he
colu
mns
hea
ded
Man
dat
ed r
efer
to
th
e ad
vis
or-
dea
l p
airs
wit
h f
inan
cial
advis
ors
th
at w
ere
awar
ded
a m
andat
e, w
hile
th
e co
lum
n h
eaded
No
n-m
andat
ed r
efer
s to
advis
ors
th
at w
ere
can
did
ates
for
an a
dvis
or
man
dat
e
but
did
no
t re
ceiv
e it
. P
revi
ous
empl
oyee
is
an i
ndic
ato
r var
iab
le t
akin
g th
e val
ue
on
e if
a P
E d
eal
team
mem
ber
has
pre
vio
usl
y w
ork
ed f
or
the
fin
anci
al a
dvis
or.
Th
e t-
test
s ar
e o
f th
e dif
fere
nce
s in
fra
ctio
ns
bet
wee
n M
andat
ed a
nd
No
n-m
andat
ed a
dvis
ors
. *
den
ote
s si
gnif
ican
ce a
t 10%
;
** d
eno
tes
sign
ific
ance
at
5%; **
* den
ote
s si
gnif
ican
ce a
t 1%
.
Sell
-sid
e
t-te
st
3.4
9**
*
No
n-
man
date
d
10057
178
1.7
7%
Man
date
d
370
23
6.2
2%
Bu
y
t-te
st
7.0
5**
*
No
n-
man
date
d
25054
599
2.3
9%
Man
date
d
1351
102
7.5
5%
All
t-te
st
7.8
2**
*
No
n-
man
date
d
35111
777
2.2
1%
Man
date
d
1721
125
7.2
6%
Ob
serv
atio
ns
Pre
vio
us
emp
loye
e
Per
cen
tage

52
Table V. Mandate winning characteristic Panels A, B and C report marginal results from probit regressions on a sample of 1,285 buy- and sell-side transactions over the period January 1998 to May 2007. For each deal, a financial advisor is considered as a candidate for receiving a mandate if it has at least once performed advisory business with the PE firm during the sample period and is able to carry out advisory work within a deal‟s geographic region. For the fifth and sixth columns only top 25 and below top 25 advisors are included in the candidate set. The dependent variable equals one if a financial advisor is mandated for a deal. Previous employee (Senior previous employee) is an indicator variable taking the value one if a PE deal team member (the deal team member of the highest level) has previously worked for the financial advisor. Debt interaction measures the percentage ratio of the number of times a financial advisor has provided debt financing to the PE firm within the previous five years. Previous interaction measures the percentage ratio of the number of times a financial Panel A All deals
All advisors Top 25
advisors Below 25 advisors
Previous employee 0.028*** 0.044*** 0.041***
(0.007) (0.012) (0.014)
Senior previous employee 0.027***
(0.007)
Debt interaction 0.014*** 0.014*** 0.014*** 0.024*** 0.014***
(0.004) (0.004) (0.004) (0.009) (0.003)
Previous interaction 0.014** 0.015** 0.015** -0.016 0.017**
(0.006) (0.006) (0.006) (0.015) (0.007)
Ln(Advisor rank) -0.006* -0.006* -0.006*
(0.003) (0.003) (0.003)
Expertise 0.008** 0.007** 0.007**
(0.004) (0.004) (0.004)
Ln(Geographic distance) -0.003*** -0.003*** -0.003*** -0.005*** -0.004***
(0.000) (0.000) (0.000) (0.001) (0.001)
Ln(PE firm size) -0.003*** -0.003*** -0.003*** 0.003 -0.007***
(0.001) (0.001) (0.001) (0.003) (0.001)
Ln(# PE firm deals) -0.018*** -0.017*** -0.017*** -0.032*** -0.013***
(0.002) (0.002) (0.002) (0.004) (0.002)
Ln(# Advisor deals) 0.009*** 0.009*** 0.009***
(0.001) (0.001) (0.001)
Year fixed effects Yes Yes Yes Yes Yes
Country fixed effects Yes Yes Yes Yes Yes
PE firm cluster Yes Yes Yes Yes Yes
Observations 36832 36832 36832 11981 25577

53
advisor has advised on a deal with the PE firm within the previous five years. Ln(Advisor rank) is the natural logarithm of a financial advisor‟s ranking in the previous year. Expertise indicates if the financial advisor is among the top ten in the transaction league table for the specific industry sector. Ln(Geographic distance) is the natural logarithm of the distance in km between the capital of the transaction country and the capital of the nearest country in which the financial advisor has an office. Ln(PE firm size) is the natural logarithm of the total investment funds at the PE firm over the sample period. Ln(# PE firm deals) and Ln(# Advisor deals) are the natural logarithms of the number of deals performed by the PE firms and financial advisors, respectively, over the sample period. Coefficients for marginal effects are shown for each indicator and continuous variable. Wald F-statistic of the differences across the coefficients in Panels B and C are reported in Panel C. Robust standard errors, clustered on PE firm, are in parentheses. * denotes significance at 10%; ** denotes significance at 5%; *** denotes significance at 1%.
Sole advisor
Joint advisor
Top 25 PE firms
Below 25 PE firms
1998 – 2003 2004-2007
0.027*** 0.027* 0.030*** 0.053*** 0.034*** 0.024***
(0.008) (0.017) (0.010) (0.015) (0.011) (0.009)
0.012*** 0.020*** 0.005 0.030*** -0.020** 0.028***
(0.004) (0.007) (0.004) (0.005) (0.009) (0.006)
0.009* 0.042*** 0.004 0.055*** -0.009 -0.003
(0.004) (0.015) (0.006) (0.016) (0.006) (0.002)
-0.003 -0.018** -0.006 -0.003 0.009 0.007*
(0.002) (0.008) (0.004) (0.007) (0.007) (0.004)
0.000 0.027*** 0.012* -0.001 -0.002** -0.003***
(0.003) (0.008) (0.007) (0.006) (0.001) (0.001)
-0.002*** -0.006*** -0.002*** -0.006*** -0.003** -0.004***
(0.000) (0.001) (0.000) (0.001) (0.001) (0.001)
-0.005*** -0.011*** -0.016*** -0.018***
(0.001) (0.003) (0.002) (0.002)
-0.010*** -0.026*** 0.009*** 0.008***
(0.001) (0.005) (0.002) (0.001)
0.007*** 0.013*** 0.009*** 0.012*** 0.034*** 0.024***
(0.001) (0.003) (0.001) (0.001) (0.011) (0.009)
Yes Yes Yes Yes Yes Yes
Yes Yes Yes Yes Yes Yes
Yes Yes Yes Yes Yes Yes
27206 9626 19278 17554 10479 26353

54
Panel B Buy-side deals
All advisors Top 25
advisors Below 25 advisors
Previous employee 0.031*** 0.044*** 0.047***
(0.009) (0.015) (0.016)
Senior previous employee 0.029***
(0.008)
Debt interaction 0.021*** 0.021*** 0.021*** 0.040*** 0.016***
(0.004) (0.004) (0.004) (0.009) (0.004)
Previous interaction 0.020*** 0.021*** 0.021*** -0.017 0.026***
(0.007) (0.007) (0.007) (0.017) (0.009)
Ln(Advisor rank) -0.008* -0.008* -0.008*
(0.005) (0.005) (0.005)
Expertise 0.007 0.006 0.006
(0.005) (0.005) (0.005)
Ln(Geographic distance) -0.003*** -0.003*** -0.003*** -0.003 -0.005***
(0.001) (0.001) (0.001) (0.002) (0.001)
Ln(PE firm size) -0.002 -0.002 -0.002 0.005 -0.006***
(0.002) (0.001) (0.001) (0.004) (0.002)
Ln(# PE firm deals) -0.021*** -0.021*** -0.021*** -0.033*** -0.016***
(0.002) (0.002) (0.002) (0.005) (0.002)
Ln(# Advisor deals) 0.009*** 0.009*** 0.009***
(0.002) (0.002) (0.002)
Year fixed effects Yes Yes Yes Yes Yes
Country fixed effects Yes Yes Yes Yes Yes
PE firm cluster Yes Yes Yes Yes Yes
Observations 26405 26405 26405 8745 18173

55
Sole advisor
Joint advisor
Top 25 PE firms
Below 25 PE firms
1998 – 2003 2004-2007
0.034*** 0.024 0.025** 0.068*** 0.032*** 0.028***
(0.009) (0.019) (0.012) (0.016) (0.011) (0.011)
0.019*** 0.026*** 0.008** 0.041*** -0.016* 0.038***
(0.004) (0.007) (0.004) (0.006) (0.009) (0.008)
0.012** 0.052*** 0.009 0.064*** -0.011 -0.005
(0.005) (0.017) (0.009) (0.019) (0.007) (0.003)
-0.004 -0.022** -0.005 -0.006 0.011 0.004
(0.003) (0.011) (0.008) (0.009) (0.007) (0.006)
-0.004 0.027*** 0.014 -0.006 -0.001 -0.004***
(0.004) (0.010) (0.008) (0.007) (0.001) (0.001)
-0.003*** -0.006*** -0.002*** -0.007*** -0.003* -0.002
(0.001) (0.001) (0.001) (0.001) (0.002) (0.002)
-0.003*** -0.011*** -0.017*** -0.022***
(0.001) (0.003) (0.003) (0.002)
-0.013*** -0.029*** 0.010*** 0.008***
(0.002) (0.006) (0.002) (0.002)
0.007*** 0.014*** 0.010*** 0.012*** 0.032*** 0.028***
(0.001) (0.003) (0.001) (0.002) (0.011) (0.011)
Yes Yes Yes Yes Yes Yes
Yes Yes Yes Yes Yes Yes
Yes Yes Yes Yes Yes Yes
18504 7901 13193 13212 8856 17549

56
Panel C Sell-side deals
All advisors Top 25
advisors Below 25 advisors
Previous employee 0.019* 0.045** 0.027
(0.014) (0.028) (0.032)
Senior previous employee 0.022**
(0.015)
Debt interaction 0.000 -0.000 -0.000 -0.021 0.010**
(0.006) (0.005) (0.005) (0.013) (0.005)
Previous interaction 0.001 0.002 0.002 -0.011 0.001
(0.005) (0.005) (0.005) (0.016) (0.005)
Ln(Advisor rank) -0.001 -0.001 -0.000
(0.005) (0.005) (0.005)
Expertise 0.011** 0.011** 0.011**
(0.005) (0.005) (0.005)
Ln(Geographic distance) -0.002*** -0.002*** -0.002*** -0.008*** -0.002**
(0.001) (0.001) (0.001) (0.003) (0.001)
Ln(PE firm size) -0.006*** -0.007*** -0.007*** -0.003 -0.008***
(0.001) (0.001) (0.001) (0.004) (0.001)
Ln(# PE firm deals) -0.008*** -0.008*** -0.008*** -0.027*** -0.005***
(0.001) (0.001) (0.001) (0.003) (0.002)
Ln(# Advisor deals) 0.008*** 0.007*** 0.007***
(0.001) (0.001) (0.001)
Year fixed effects Yes Yes Yes Yes Yes
Country fixed effects Yes Yes Yes Yes Yes
PE firm cluster Yes Yes Yes Yes Yes
Observations 10427 10427 10427 3236 7404
F-statistic; panels B:C 2.942*** 1.978*** 4.342*** 94.397*** 2,637***

57
Sole advisor
Joint advisor
Top 25 PE firms
Below 25 PE firms
1998 – 2003 2004-2007
0.014 0.030 0.043*** 0.003 0.049 0.015
(0.012) (0.031) (0.017) (0.018) (0.035) (0.015)
0.001 -0.003 0.001 0.000 -0.034*** 0.001
(0.005) (0.009) (0.007) (0.005) (0.012) (0.006)
0.002 0.004 -0.007 0.025* -0.001 0.009
(0.005) (0.022) (0.006) (0.013) (0.010) (0.006)
0.003 -0.011 -0.007 0.008 0.005 -0.001
(0.005) (0.011) (0.008) (0.010) (0.010) (0.005)
0.007* 0.028* 0.010 0.012 -0.004** 0.012**
(0.004) (0.015) (0.007) (0.009) (0.002) (0.005)
-0.001 -0.008*** -0.002*** -0.002 -0.004** -0.001**
(0.001) (0.002) (0.000) (0.002) (0.002) (0.001)
-0.007*** -0.008*** -0.008*** -0.007***
(0.001) (0.003) (0.002) (0.001)
-0.005*** -0.011*** 0.004*** -0.007***
(0.001) (0.003) (0.001) (0.002)
0.007*** 0.011*** 0.006*** 0.012*** 0.049 0.008***
(0.001) (0.004) (0.001) (0.002) (0.035) (0.001)
Yes Yes Yes Yes Yes Yes
Yes Yes Yes Yes Yes Yes
Yes Yes Yes Yes Yes Yes
8702 1725 6085 4342 1623 8804
5.457*** 16.361*** 257.10*** 5.21*** 6.54*** 12.69***

58
Table VI. Mandate winning characteristic, instrumental variables The table reports results from IV regressions performed on a sample of 1,285 buy- and sell-side transactions over the period January 1998 to May 2007. For each deal, a financial advisor is considered as a candidate for receiving a mandate if it; 1) has at least once performed advisory business with the PE firm during the sample period, 2) is able to carry out advisory work within a deal‟s geographic region. The dependent variable equals one if a financial advisor is mandated for a deal. Previous employee is an indicator variable taking the value one if a PE deal team member has previously worked for the financial advisor. Debt interaction measures the percentage ratio of the number of times a financial advisor has provided debt financing to the PE firm within the previous five years. Previous interaction measures the percentage ratio of the number of times a financial advisor has advised on a deal with the PE firm within the previous five years. Ln(Advisor rank) is the natural logarithm of a financial advisor‟s ranking in the previous year. All deals 1st stage 2nd stage
Previous employee 0.058*** (0.012) Debt interaction 0.013*** 0.020*** (0.002) (0.002) Previous interaction 0.025*** 0.023*** (0.003) (0.004) Ln(Advisor rank) -0.009*** -0.008*** (0.002 (0.002) Expertise 0.020*** 0.015*** (0.002) (0.004) Ln(Geographic distance) -0.000 -0.003*** (0.000) (0.000) Ln(PE firm size) -0.002*** -0.006*** (0.001) (0.002) Ln(# PE firm deals) 0.008*** -0.020*** (0.001 ) (0.001) Ln(# Advisor deals) 0.010*** 0.009*** (0.001) (0.001) Ln(Median # of employees) 0.203*** (0.000) Year fixed effects Yes Yes Country fixed effects Yes Yes PE firm cluster Yes Yes Observations 36832 36832 First stage F-statistic 12.324***

59
Expertise indicates if the financial advisor is among the top ten in the transaction league table for the specific industry sector. Ln(Geographic distance) is the natural logarithm of the distance in km between the capital of the transaction country and the capital of the nearest country in which the financial advisor has an office. Ln(PE firm size) is the natural logarithm of the total investment funds at the PE firm over the sample period. Ln(# PE firm deals) and Ln(# Advisor deals) are the natural logarithms of the number of deals performed by the PE firms and financial advisors, respectively, over the sample period. First and second stage IV regressions are displayed. The instrument is Ln(Median # of employees), the log of the median number of corporate finance employees on a country level. Robust standard errors, clustered on PE firm, in parentheses. * denotes significance at 10%; ** denotes significance at 5%; *** denotes significance at 1%.
Buy-side deals Sell-side deals
1st stage 2nd stage 1st stage 2nd stage
0.061*** 0.046** (0.013) (0.023)
0.013*** 0.027*** 0.012*** -0.000 (0.002) (0.003) (0.003) (0.004)
0.028*** 0.031*** 0.018*** 0.004 (0.004) (0.006) (0.005) (0.007)
-0.010*** -0.010*** -0.007** -0.004** (0.003) (0.003) (0.003) (0.002)
0.020*** 0.010** 0.018*** 0.029*** (0.003) (0.005) (0.004) (0.007) -0.00 -0.003*** -0.001 -0.002**
(0.000) (0.001) (0.001) (0.001) -0.002*** -0.005** -0.001 -0.012***
(0.001) (0.002) (0.002) (0.004) 0.008*** -0.023*** 0.008*** -0.009*** (0.001) (0.002) (0.002) (0.003)
0.011*** 0.010*** 0.009*** 0.007*** (0.001) (0.001) (0.001) (0.001)
0.201*** 0.211*** (0.001) (0.008)
Yes Yes Yes Yes Yes Yes Yes Yes Yes Yes Yes Yes
26405 26405 10427 10427 14.123*** 10.231***

60
Table VII. PE Professionals and advisors in multiple deals The table reports the total share of transactions a financial advisor is participating in, conditional on being mandated for at least more than one transaction with the same PE professional who is a former corporate financier. Two-sample t-test with unequal variances reported. Standard errors in parenthesis. * denotes significance at 10%; **denotes significance at 5%; ***denotes significance at 1%. Previous employee Not a previous employee t-test Mean 0.709* 0.536* -1.625* (0.080) (0.071) Observations 19 12
Table VIII. Mandate winning characteristic, robustness test Marginal results from probit regressions are presented. A financial advisor is considered as a candidate for receiving a deal mandate if it is able to carry out advisory work within a deal‟s geographic region and is a top 50 ranked advisor. Dependent variable equals one if a financial advisor is mandated for a deal. Previous employee indicates if a PE deal team member has previously worked for the financial advisor. Debt interaction (Previous interaction) measures the percentage ratio of the number of times a financial advisor has provided debt financing (advised on a deal) the previous five years. Ln(Advisor rank) is the natural logarithm of a financial advisor‟s ranking in the previous year. Expertise indicates if the financial advisor is among the top ten in the transaction league table for the specific industry sector. Ln(Geographic distance) is the natural logarithm of the distance in km between the capital of the transaction country and the capital of the nearest country in which the financial advisor has an office. Ln(PE firm size) measures the total investment funds at the PE firm over the sample period. Ln(# PE firm deals) and Ln(#Advisor deals) measures the number of deals performed by the PE firms and financial advisors, respectively, over the sample period. Robust standard errors clustered on PE firm in parentheses. * denotes significance at 10%; ** denotes significance at 5%; *** denotes significance at 1%. All deals Buy-side deals Sell-side deals Previous employee 0.016*** 0.013*** 0.019** (0.004) (0.004) (0.010) Debt interaction 0.006*** 0.006*** 0.002 (0.001) (0.002) (0.002) Previous interaction 0.014*** 0.016*** 0.003 (0.002) (0.003) (0.003) Ln(Advisor rank) -0.005*** -0.005*** -0.006*** (0.001) (0.001) (0.002) Expertise 0.001 -0.000 0.006** (0.001) (0.001) (0.003) Ln(Geographic distance) -0.000 -0.000 -0.000 (0.000) (0.000) (0.000) Ln(PE firm size) 0.001*** 0.001*** 0.001** (0.000) (0.000) (0.000) Ln(# PE firm deals) -0.002*** -0.002*** -0.001*** (0.000) (0.000) (0.000) Ln(# Advisor deals) 0.012*** 0.011*** 0.012*** (0.001) (0.001) (0.001) Year fixed effects Yes Yes Yes Country fixed effects Yes Yes Yes PE firm cluster Yes Yes Yes Observations 47050 35050 11950

61
Table IX. Deal sourcing Regressions are performed on a sample of 203 auctions over the period January 1998 to May 2007. For Bidding inclusion, a PE firm is considered as a potential bidder if it is in the Mergermarket data as a bidder for any of the deals and has been active in the transaction region. For Winning a PE firm is considered as a bidder if listed as such for that deal. Dependent variable equals one if a PE firm is bidding in (winning) an auction. IV columns report first and second stage regressions using as instrument Ln(Median # of employees), which is the log of the median number of corporate finance employees on a country level. Previous employee is an indicator variable taking the value one if a PE deal team member has previously worked for the financial advisor. Previous interaction measures the percentage ratio of the number of times a financial advisor has advised on a deal with the PE firm within the previous five years. # Bidders is the number of all bidders including both trade buyers and PE firms. # Sell-side advisors is the number of sell-side financial advisors for each deal. Ln(Geographic distance) is the natural logarithm of the distance in km between the capital of the transaction country and the capital of the nearest country in which the PE firm has an office. Ln(PE firm size) is the natural logarithm of the total investment funds at the PE firm over the sample period. Ln(# PE firm deals) is the natural logarithms of the number of deals performed by the PE firms over the sample period. Robust standard errors, clustered on PE firm, are in parentheses. * denotes significance at 10%; ** denotes significance at 5%; *** denotes significance at 1%. Bidding inclusion Winning
Marginal
effects IV:
1st stage IV:
2nd stage Marginal
effects IV:
1st stage IV:
2nd stage
Previous employee 0.190*** 0.109* 0.135*** 0.073* (0.026) (0.042) (0.041) (0.032) Previous interaction 0.007* 0.004 0.016 0.007 0.003 0.008 (0.004) (0.004) (0.009) (0.019) (0.003) (0.004) # Bidders 0.002*** 0.002 0.004*** -0.012*** -0.003 -0.002* (0.000) (0.001) (0.000) (0.002) (0.002) (0.001) # Sell-side advisors 0.018*** 0.025** 0.042*** -0.044** -0.041*** -0.024* (0.002) (0.009) (0.004) (0.019) (0.009) (0.008) Ln(Geographic distance) 0.016*** -0.000 0.033*** 0.008 0.000 0.003 (0.004) (0.000) (0.009) (0.016) (0.000) (0.009) Ln(PE firm size) 0.014*** 0.021*** 0.036*** 0.009 0.011*** 0.006 (0.002) (0.001) (0.007) (0.021) (0.001) (0.017) Ln(# PE firm deals) 0.016*** 0.029*** 0.015*** 0.007 0.024*** 0.019 (0.004) (0.007) (0.004) (0.021) (0.007) (0.023) Ln(Median # of employees) 0.190** 0.105** (0.082) (0.032) Year fixed effects Yes Yes Yes Yes Yes Yes Country fixed effects Yes Yes Yes Yes Yes Yes PE firm cluster Yes Yes Yes Yes Yes Yes Observations 15381 15381 15381 988 988 988 First stage F-statistic 13.237*** 10.342**
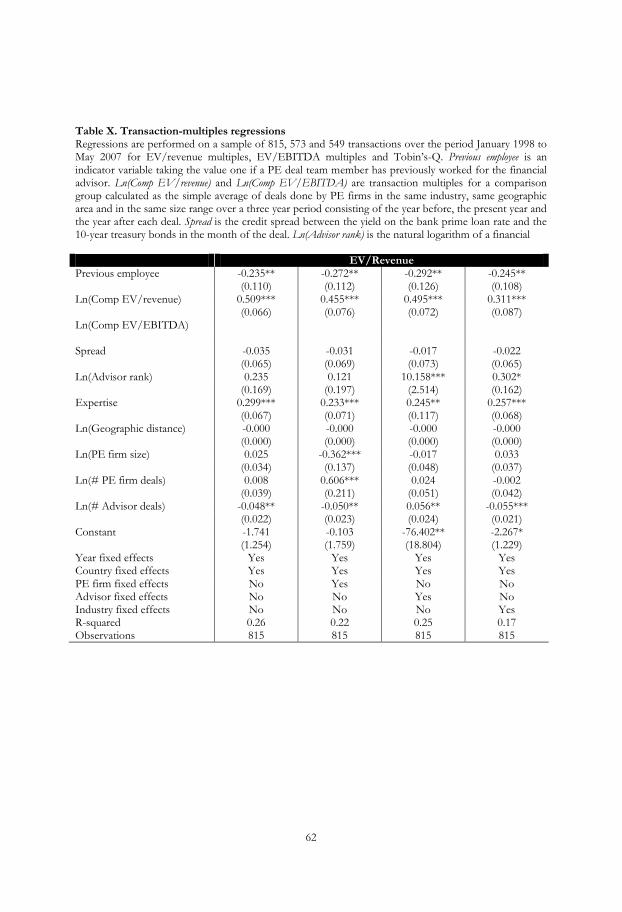
62
Table X. Transaction-multiples regressions Regressions are performed on a sample of 815, 573 and 549 transactions over the period January 1998 to May 2007 for EV/revenue multiples, EV/EBITDA multiples and Tobin‟s-Q. Previous employee is an indicator variable taking the value one if a PE deal team member has previously worked for the financial advisor. Ln(Comp EV/revenue) and Ln(Comp EV/EBITDA) are transaction multiples for a comparison group calculated as the simple average of deals done by PE firms in the same industry, same geographic area and in the same size range over a three year period consisting of the year before, the present year and the year after each deal. Spread is the credit spread between the yield on the bank prime loan rate and the 10-year treasury bonds in the month of the deal. Ln(Advisor rank) is the natural logarithm of a financial EV/Revenue Previous employee -0.235** -0.272** -0.292** -0.245** (0.110) (0.112) (0.126) (0.108) Ln(Comp EV/revenue) 0.509*** 0.455*** 0.495*** 0.311*** (0.066) (0.076) (0.072) (0.087) Ln(Comp EV/EBITDA) Spread -0.035 -0.031 -0.017 -0.022 (0.065) (0.069) (0.073) (0.065) Ln(Advisor rank) 0.235 0.121 10.158*** 0.302* (0.169) (0.197) (2.514) (0.162) Expertise 0.299*** 0.233*** 0.245** 0.257*** (0.067) (0.071) (0.117) (0.068) Ln(Geographic distance) -0.000 -0.000 -0.000 -0.000 (0.000) (0.000) (0.000) (0.000) Ln(PE firm size) 0.025 -0.362*** -0.017 0.033 (0.034) (0.137) (0.048) (0.037) Ln(# PE firm deals) 0.008 0.606*** 0.024 -0.002 (0.039) (0.211) (0.051) (0.042) Ln(# Advisor deals) -0.048** -0.050** 0.056** -0.055*** (0.022) (0.023) (0.024) (0.021) Constant -1.741 -0.103 -76.402** -2.267* (1.254) (1.759) (18.804) (1.229) Year fixed effects Yes Yes Yes Yes Country fixed effects Yes Yes Yes Yes PE firm fixed effects No Yes No No Advisor fixed effects No No Yes No Industry fixed effects No No No Yes R-squared 0.26 0.22 0.25 0.17 Observations 815 815 815 815

63
top advisor‟s ranking in the previous year. Expertise indicates if the financial advisor is among the top ten in the transaction league table for the specific industry sector. Ln(Geographic distance) is the natural logarithm of the distance in km between the capital of the transaction country and the capital of the nearest country in which the financial advisor has an office. Ln(PE firm size) is the natural logarithm of the total investment funds at the PE firm over the sample period. Ln(# PE firm deals) and Ln(# Advisor deals) are the natural logarithms of the number of deals performed by the PE firms and financial advisors, respectively, over the sample period. Industry fixed effects comprise 28 different industries. Robust standard errors are in parentheses. * denotes significance at 10%; ** denotes significance at 5%; *** denotes significance at 1%.
EV/EBITDA Tobin’s Q -0.105 -0.222** -0.120 -0.106 -0.373** -0.375 -0.308 -0.457** (0.104) (0.113) (0.124) (0.099) (0.174) (0.292) (0.206) (0.209)
0.139* 0.200*** 0.095* 0.100 (0.076) (0.075) (0.055) (0.105) 0.072 0.035 0.047 0.096 -0.170 -0.306 -0.177 -0.117
(0.066) (0.082) (0.087) (0.073) (0.168) (0.197) (0.207) (0.185) 0.304* 0.462* 0.000 0.348** 1.545** 0.777 11.813* 1.657* (0.173) (0.238) (0.000) (0.162) (0.761) (0.667) (6.737) (0.905) 0.076 0.064 0.072 0.044 0.571 0.274 -0.052 0.677
(0.067) (0.075) (0.120) (0.064) (0.416) (0.432) (0.279) (0.484) -0.000 -0.000 -0.000 -0.000 -0.000 0.000 -0.000 -0.000 (0.000) (0.000) (0.000) (0.000) (0.000) (0.000) (0.000) (0.000) 0.021 -1.652*** 0.014 0.030 -0.176 0.133 -0.212 -0.173
(0.031) (0.371) (0.042) (0.033) (0.185) (0.365) (0.259) (0.181) -0.034 3.809*** -0.016 -0.055 0.250** -1.842 0.362** 0.192* (0.038) (1.112) (0.047) (0.037) (0.106) (1.459) (0.177) (0.107) 0.002 -0.021 -0.005 0.004 -0.218 -0.131 0.094** -0.206
(0.026) (0.030) (0.033) (0.028) (0.133) (0.116) (0.045) (0.136) -0.995 -2.943 1.917*** -0.906 -9.755** 0.358 -89.448* -10.740** (1.290) (2.067) (0.522) (1.129) (4.587) (5.617) (50.986) (5.327)
Yes Yes Yes Yes Yes Yes Yes Yes Yes Yes Yes Yes Yes Yes Yes Yes No Yes No No No Yes No No No No Yes No No No Yes No No No No Yes No No No Yes 0.15 0.17 0.15 0.14 0.09 0.10 0.10 0.09 573 573 573 573 549 549 549 549

64
Table XI. Transaction-multiples, instrumental variables Dependent variables are EV/revenue multiples, EV/EBITDA multiples and Tobin‟s-Q. IV first and second stage regressions are reported. The instrument Ln(Median # of employees) is the log of the median number of corporate finance employees on a country level. Previous employee is an indicator variable taking the value one if a PE deal team member has previously worked for the financial advisor. Ln(Comp EV/revenue) and Ln(Comp EV/EBITDA) are transaction multiples for a comparison group calculated as the simple average of deals done by PE firms in the same industry, same geographic area and in the same size range over a three year period consisting of the year before, the present year and the year after each deal. Spread is credit spread between the yield on the bank prime loan rate and the 10-year treasury bonds in the month of the deal. Ln(Advisor rank) is the natural logarithm of a financial advisor‟s ranking in the previous year. Expertise indicates if the financial advisor is among the top ten in the transaction league table for the specific industry sector. Ln(Geographic distance) is the natural logarithm of the distance in km between the capital of the transaction country and the capital of the nearest country in which the financial advisor has an office. Ln(PE firm size) is the natural logarithm of the total investment funds at the PE firm over the sample period. Ln(# PE firm deals) and Ln(# Advisor deals) are the natural logarithms of the number of deals performed by the PE firms and financial advisors, respectively, over the sample period. Robust standard errors are in parentheses. * denotes significance at 10%; ** denotes significance at 5%; *** denotes significance at 1%. EV/Revenue EV/EBITDA Tobin’s Q 1st stage 2nd stage 1st stage 2nd stage 1st stage 2nd stage
Previous employee -0.161* -0.425 -0.165* (0.093) (0.428) (0.094) Ln(Comp EV/revenue) -0.025 0.478*** (0.016) (0.079) Ln(Comp EV/EBITDA) 0.000 0.139* (0.016) (0.076) Spread -0.014 -0.056 -0.001 0.073 -0.017 -0.193 (0.021) (0.075) (0.024) (0.067) (0.021) (0.174) Ln(Advisor rank) 0.067 0.327* 0.051 0.322* 0.0602 0.162** (0.068) (0.187) (0.083) (0.174) (0.0682) (0.072) Expertise 0.043* 0.355*** 0.046 0.091 0.004* 0.620 (0.024) (0.094) (0.028) (0.066) (0.0243) (0.390) Ln(Geographic distance) 0.000* 0.000 0.000** 0.000 0.000** -0.000 (0.000) (0.000) (0.000) (0.000) (0.000) (0.000) Ln(PE firm size) -0.006 0.016 -0.002 0.019 -0.007 -0.184 (0.010) (0.037) (0.012) (0.032) (0.010) (0.178) Ln(# PE firm deals) -0.024** -0.027 -0.025* -0.042 -0.024** 0.218 0.015 (0.055) (0.014) (0.038) (0.012) (0.140) Ln(# Advisor deals) 0.015** -0.026 0.0130 0.006 0.015** -0.198 (0.007) (0.033) (0.008) (0.027) (0.007) (0.153) Constant -0.146 -2.383* -0.272 -0.642 -0.066 -0.778* (0.505) (1.251) (0.611) (1.250) (0.503) (0.454) Ln(Median # of employees) 0.053** 0.027* 0.049** (0.026) (0.010) (0.026) Year fixed effects Yes Yes Yes Yes Yes Yes Country fixed effects Yes Yes Yes Yes Yes Yes R-squared 0.08 0.10 0.12 0.14 0.10 0.11 Observations 815 815 573 573 549 549 First stage F-statistics 11.293*** 8.923* 13.230***

65
1.9 Appendix Variable Description
EV/EBITDA Enterprise value over last twelve months reported EBITDA.
EV/Revenue Enterprise value over last twelve months reported revenue.
Expertise Indicates if a financial advisor is ranked top ten in the transaction league table for the specific industry sector.
Ln(# Advisor deals) Natural logarithms of the number of deals performed by the financial advisor firm over the sample period.
Ln(# PE firm deals) Natural logarithms of the number of deals performed by the PE firm over the sample period.
Ln(Advisor rank) Natural logarithm of a financial advisor‟s ranking in the previous year.
Ln(Comp EV/EBITDA) & Ln(Comp EV/revenue)
Ratios of a PE control group matched with the sample transaction in terms of deal size, geographic region and industry sector.
Debt interaction The percentage ratio of the number of times a financial advisor has provided debt financing to the PE firm within the previous five years.
Ln(Geographic distance) Distance in km between the capital of the transaction country and the capital of the nearest country in which the financial advisor has an office.
Ln(Median # of employees) Number of employees at the median sized financial advisor firm in each country where a deal takes place.
Ln(PE firm size) The natural logarithm of the total investment funds at the PE firm over the sample period.
Previous interaction Percentage ratio of the number of times a financial advisor has advised on a deal with the PE firm within the previous five years.
Previous employee Indicator variable taking the value one if a PE deal team member has previously worked for the financial advisor.
Senior previous employee Indicator variable taking the value one if the senior PE deal team member has previously worked for the financial advisor.
Spread Credit spread between the yield on the bank prime loan rate and the 10-year treasury bonds in the month of the deal.

66

67
Paper Two
Dual Role Advisors and Conflicts of Interest*
Abstract: An advisor to a firm targeted in a merger or acquisition that simultaneously is involved in financing the bidding part of the deal is referred to as a dual role advisor. Being a dual role advisor can create conflicts of interest through the possible perception that the investment bank's advice to the seller in the bidding process is tainted by a desire on the part of the advisor to obtain additional fees from financing the successful bidder. I find support for this fear in a study of 1,023 public US mergers and acquisitions over the period 1993 to 2008. Conflicts of interest are manifested through that deals which involve a dual role advisor are, compared to deals with no dual role advisors; (a) performed at lower premium, (b) are more likely to be subject to a lawsuit, (c) feature lower merger advisor fees and (d) are commensurate with higher announcement returns for bidders. Overall, the results suggest that investment banks may not have fulfilled their obligation of obtaining the highest possible price on behalf of the seller and I find no evidence that dual role advising is a helpful feature in transactions where it might be difficult to otherwise obtain bidding financing. Interestingly, target firms with sound corporate governance practices are less likely to encounter dual role situations.
*
I thank Katrien Craninckx, Mariassunta Giannetti, Björn Johnson, Samuel Lee, Gino Loyola and seminar participants at the European Financial Management Association Conference in Milan and the Financial Management Association Conference in Turin for helpful comments.

68
In this paper, I study a potential source of conflicts of interest between a financial
advisor to a firm who is a target in a merger or acquisition (M&A) and the
shareholders of that firm: dual role advising. A financial advisor who is involved in
both sell-side advising and buy-side financing of a transaction is denoted a dual
role advisor. Being a dual role advisor could raise fears that the investment bank's
advice to the seller throughout a bidding process is tainted by a desire on the part
of the advisor to obtain additional fees from financing the successful bidder. Thus,
dual role advising may create conflicts of interest with the selling shareholders to
the extent that the advisor‟s concern about the profit it earns from lending to the
bidding counterparty of the target shareholders distorts the advice they give.
The practice of dual role advising was recently put to public focus when
the Toys “R” Us shareholder litigation was brought to court in 2005 (Cons. C.A.
No. 1212-N). The lawsuit dealt with the takeover of the toys manufacturer Toys
“R” Us by private equity firm Kohlberg Kravis Roberts & Co (KKR). The
investment bank Credit Suisse First Boston (CSFB) acted as advisor to Toys “R”
Us when KKR bought the company in an auction process. However, CSFB was
also soliciting the role as financer to KKR. CSFB‟s dual roles led to litigation by
shareholders against the board of Toys “R” Us and CSFB for tilting the playing
field in favor of KKR in the bidding contest. Although the court ultimately found
no evidence that the financial advisor‟s actions improperly influenced the board‟s
decision-making process, the court did in its ruling question the practice of having
the same bank provide financial services on both sides of a deal (Cons. C.A. No.
1212-N pp 53-54): “In general … it is advisable that investment banks representing
sellers not create the appearance that they desire buy-side work, especially when it
might be that they are more likely to be selected by some buyers for that lucrative
role than by others.” Indeed, CSFB earned $10 million in financing fees in addition
to its $7 million advisory fee1
I find empirical evidence that justifies the court‟s skeptical stand on dual
role advising. 1,023 US mergers over the period 1993 to 2008 are analyzed whereof 1 The Toys “R” Us verdict to this day remains the only case where a court has made a ruling on dual role advising although a related litigation example is found in Gerald Ortsman v. Dennis O. Green, et al. ( C.A. No. 2670-N). The later litigation concerns the takeover of vehicle auction company Adesa Inc by a private equity consortium led by Kelso & Co. The court found evidence that the dual role advisor UBS had steered a deal away from potential bidders not interested in a leveraged transaction towards Kelso & Co, but the litigation was settled outside of court with shareholders eventually agreeing on the merger.

69
97 (9.5%) deals involve a dual role advisor. Deals where a bank engages in dual
role advising are associated with a range of conflicts of interest, which are
manifested through value distorting features. Results suggest that investment banks
may not have fulfilled their obligation of obtaining the highest possible price on
behalf of the seller, and I find no evidence that dual role lending is a helpful feature
of transactions where it might be difficult to otherwise obtain financing for a
bidder.
Firstly, I find that that target firms with good corporate governance
practices encounter slightly fewer dual role situations. The higher the score of
corporate governance quality, as measured by the Brown and Caylor (2004, 2006)
Gov-score index, the lower is the prevalence of dual role advising. The main
question addressed in this paper is how shareholder gains are affected when the
investment bank who is advising a client is also involved with financing the bidder,
either as direct lender or as underwriter of securities. After controlling for a range
of firm and transaction specific features, I find that the average deal premium –
measured as the offer price over the share price one month prior to deal
announcement – is 12.0 percentage points (pp.) lower for dual role deals compared
to deals where there is no involvement of a dual role advisor. The results are
significant at the 5% level and robust for premium measured over periods of one
week and one day. Shifting to the other participant in a transaction I find that the
bidding firm gains a cumulative abnormal return around the announcement day
(CAR -1,+1) that is 1.9 pp. higher in deals with dual role advising compared to
deals without. I further find that deals involving a dual role advisor are more often
subject to lawsuits led by target shareholders than deals with no dual role advisors,
which points to disproportionately deep shareholder discontent with deal terms in
dual role deals. Moreover, the merger advising fees collected by dual role advisors
are lower than for non-dual role advisors, which could be an effect of discontent
shareholders paying their advisors relatively low fee percentages.
An alternative explanation for the occurrence of dual role advising is that it
could be a helpful or even necessary service to the acquirer in transactions that are
difficult to finance. However, I find that all main results hold after employing both
propensity score matching and instrumental variable methods. Thus, firms that
encounter dual role advising do not seem to differ materially in observable or
unobservable characteristics from those firms whose advisors do not engage in
dual role behavior. In particular, these findings point to that target firms in dual

70
role deals do not appear to be in an overall worse financial or operational shape
than target firms in non-dual role deals, which we might have expected if the firms
would be more difficult to finance. In addition, the results on the increased
probability of lawsuits and the lower fees in dual role transactions are difficult to
reconcile with the alternative hypothesis.
The overall results that dual role advisors give rise to conflicts of interest
with the shareholders they are hired to represent are in line with several recent
papers that study various forms of concurrent advisor and financing relationships.
Povel and Singh (2009) study the related issue of stapled financing, which is a
procedure mostly used by private equity firms when they divest of portfolio firms.
They find that although stapled financing can under certain conditions be an
optimal part of a sale process, it is also commensurate with conflicts of interests.
M&A related misuse of information by advisors is documented by Ivashina, Nair,
Saunders, Massoud and Stover (2009) who find that banks play an important role
as informal dispersers of information that they may well spread in a way benefiting
themselves. Evidence that banks offer loans to acquiring firms at below market
prices to win buy-side merger advisory business is found in Allen and Peristiani
(2007). Allen, Jagtiani, Peristiani, and Saunders (2004) find that banks that provide
both buy-side advice and deal financing to acquiring firms do benefit their clients
by serving a certification function but that this function is dominated by conflicts
of interest with the client. Hogan (2006) as well as Hall (2006) analyze the above
mentioned Toys “R” Us verdict from a legal perspective and both conclude that
the future of dual role advising post the ruling remain an open question although
the court did not find dual role advising illegal.
Besides being the first paper that addresses dual lending from the
perspective of an investment bank financing the bidder while simultaneously acting
as advisor to the target, this paper contributes to the growing literature on conflicts
of interest in M&A, which is detailed in the following section.
2.1 Hypothesis Development To understand the potential effects that dual role advising may have, it is useful to
establish that investment banks may behave in a way that the client did not foresee
both because of the conflicting incentives they face but also because of outright
unlawful behavior. The literature is rich in giving examples of both kinds of

71
behavior. Furthermore, it is interesting to relate dual role advising to the concept
of stapled financing, a practice commonly used by sellers in private acquisitions.
2.1.1 Self-centered Incentives
Kesner, Shapiro and Sharma (1994) study conflicts of interest arising from self-
interested investment banking agents who do not properly perform their duties for
clients. They find that advisors to acquirers generally receive larger compensation
for acquisitions when their clients pay a higher premium, which could lead advisors
to encourage overbidding. Lex and Sebenius (1986) go further and argues that
misalignments of the goals of investment bankers and their clients are so
omnipotent that bankers must choose between creating values for all parties or
pursue opportunistic tactics that yield value primarily to themselves. On a less
general level, Calomiris and Singer (2004) examine all hostile takeovers over a ten-
year period and find that advisors to the acquirer have often previously represented
the takeover target in some way. They argue that the existence of overlapping
relationships provides incentives for clients and investment banks to limit flows of
private information about clients but find no evidence that the acquisition
premium are significantly different in acquisitions where there may be a potential
conflict. Much related, Ivashina et al. (2009) document that bank lending intensity
within client networks has a positive effect on borrowing firms becoming takeover
targets. In particular, they show that banks play a very important role as informal
dispersers of information. Focusing on banks that have previously had a lending
relationship with both the bidder and target they explore whether a potential
motive for the transfer of information is because banks seek to earn fees on
financing takeovers, but do not find any evidence supporting this hypothesis. Allen
and Peristiani (2007) investigate the primary and secondary syndicated bank loan
market to analyze the effect on pricing when the financial institution commingles
syndicated lending with merger advisory services. Focusing on the connection
between the acquirer's choice of merger advisor and future financing commitments
from that advisor, they find evidence of under-pricing of syndicated bank loans in
both the primary and secondary market. All in all their findings point to that loans
priced at below market terms are offered by the acquirer's relationship bank
advisor in order to win merger advisory business. Allen et al. (2004) study the role
of both commercial and investment banks in providing merger advisory services.
They argue that banks who provide both advice and financing to acquiring firms

72
can be viewed as serving a certification function. This function may however be
diminished by potential conflicts of interest. Whereas the certification effect
dominates for target firms, conflicts of interest dominate the certification effect
when banks are advisors to acquirers.
2.1.2 Unlawful Behavior
The Toys “R” Us ruling marked the start of a series of articles in practitioner
oriented finance and law journals discussing the pros- and cons of having a dual
role advisor.2 Hogan (2006) suggests that one way of overcoming the potential
conflicts of interest is to hire several advisors. One of these advisors would then
have the specific task of providing a fairness opinion, a supposedly independent
statement on whether a proposed offer price is to be considered fair or not.
However, this proposed effect has little empirical support as Kisgen, Qian and
Song (2009) find that fairness opinions do not affect deal outcomes when used by
targets. Although dual role advising was not deemed unlawful, the Court did label
it as improper behavior. Several studies have found evidence that investment banks
do balance on a thin line between unlawful and improper behavior. Though most
investment banks have implemented information barriers (Chinese walls) to
prevent unauthorized disclosure of information from advisory teams to financing
teams, crossing such a barrier may not constitute a breach of any law other than
internal policies and may also well be agreed to by the selling firm as was the
situation in the Toys “R” Us case. Another feature of this lawsuit was that the dual
role advisor approached the bidder after the deal was announced, an effective way
of outflanking a Chinese wall. As long as no private information is used in the
marketing of financing packages, no laws are broken. Several studies find that 2 In fact, Grant Murgatroyd and Richard Rivlin reported on the issue already before the Toys “R” Us litigation in the article “Packaged for Sale” printed in the 2005 February issue of Corporate Financier pp 10- 13. They highlight a very interesting caveat emptor viewpoint on the problems with stapled financing (p 12): “The possibility of conflict is so obvious that any vendor that accepted a package without testing the water elsewhere would pretty much deserve what they got.” Kevin Miller specifically addresses Toys “R” Us in “In Defense of Stapled Finance”, The M&A Lawyer, January 2006, Volume 10, No1 pp 1-3. He points out that the seller‟s financial advisor generally has a duty to act in good faith in a manner it believes is not opposed to the interest of its client. But as a financier for a prospective buyer the advisor could insist on the ability to exercise rights in its own interest. In “Toys ”R” Us Case Provides Guidance on Corporate Sales Process”, Pillsbury Winthrop Shaw Pittman Client Alert, Vol 0801, No. 8012. July 21, 2005, David R. Lamarre points out that the Court should have a strong reluctance in second-guessing the tactical decisions made by the Board in a sell process.

73
Chinese walls are often crossed or misused [see e.g. Bodnaryk, Massa and Simonov
(2009), Acharya and Johnson (2007), Ivashina and Sun (2007), Massa and Rehman
(2005)].
2.1.3 Stapled Financing
Associated with the issue of dual role advising is the practice of stapled financing.
Though closely related, it is however not correct to view dual role advising and
stapled financing as identical means of financing. Stapled finance is a loan
commitment by the investment bank advising the seller in an M&A transaction.
Anyone who wins a bidding contest may use the stapled finance, but is not obliged
to do so. As described by Povel and Singh (2009), stapled finance is usually offered
early in the bidding process and provides potential buyers with an estimate of how
much they can borrow against the target's assets and cash. Thus, whereas an
advisor may not become a dual role lender until long after a deal announcement is
made, stapled financing is something that is clearly disclosed in the investment
memorandum and available to all bidders. However, notwithstanding the
difference between stapled financing and dual role advising, Povel and Singh
(2009) derive important predictions that may well be relevant also in a dual role
setting. In particular, they find that an optimally designed stapled package can
benefit the seller, lender and buyer only under certain conditions; there must be at
least one financial bidder (as opposed to strategic or industrial buyers) and the
terms of the financing package have to be fixed before the bidding starts. They also
discuss the possible conflicts of interest that stapled finance might give rise to.
Interestingly, the concern that the investment bank may push the seller to accept
an offer from a bidder is now reversed; the investment bank may favor a bidder
who is not going to accept the stapled finance package. The reason for this is that
Povel and Singh (2009) find that the investment bank cannot expect to breakeven,
as the bidder will only accept the stapled financing if she expects to benefit from it.
This implies that the lender will make a loss. The bank will thus need to be
compensated by the seller for providing financing. To avoid making a loss on the
stapled financing the bank may thus by biased against firms willing to take up the
financing packages they themselves offer.

74
2.1.4 General Hypothesis Formulation
The preceding review on related finance and law literature as well as recent court
cases point to that the feature of a dual role advisor is expected to be
commensurate with a high degree of conflicts of interest between the advisor and
shareholders of the target. The possibility that the investment bank's advice to the
seller throughout a bidding process is stained by a desire to obtain additional fees
from financing the successful bidder is the driving force of such conflicts. This
standpoint implies that dual role lending is unconditionally bad for sellers but an
alternative hypothesis, which is in line with the Povel and Singh (2009) findings on
the related issue of stapled financing, would state that the financing from the
selling advisor could in certain special cases actually increase the price. For a seller
this would be the case if financing were not readily available to any acquirer or only
available at very unattractive terms. The selling advisor could then facilitate the
transaction by offering financing at a discount, for which the seller must
compensate them. One could also conjure a scenario where the seller benefits from
a speedy sale process where the diligence process and getting access to credit for
buyers are greatly simplified. Dual role advisors could also possibly play a
certification role similar to the one mentioned in Allen et al. (2004) or simply
eliminate financing as a buyer‟s bargaining tool.
To examine empirically whether dual role advising is commensurate with
conflicts of interests, which lead to value destruction for target shareholders, or if
it is a value-enhancing ingredient in a sale process I will turn to areas where either
event may manifest itself. The most noticeable areas to investigate are shareholder
premium and bidder returns but evidence may be found through indirect effects
such as the likelihood of lawsuits or the level of advisor fees. The testable
predictions and their expected coefficients for the base and alternative hypotheses
are outlined in Figure I. Figure I. Testable predictions Coefficient of dual role advisor Base hypothesis Alternative hypothesis
Target shareholder returns – + Lawsuits + – / insignificant Bidder CAR + – / insignificant Advisor fees – +

75
The predictions stipulate that in accordance with the base (alternative) hypothesis;
dual role advising should affect target shareholder returns negatively (positively),
lawsuits should be more (less) common, bidder returns should be higher (lower)
and advisor fees should be lower (higher).
2.2 Empirical Methodology M&A deals are compiled from the SDC M&A database over the 15-year period 1
July 1993 to 30 June 2008. All targets firms are publicly traded in the United States
when bid for. No firms are allowed to be in bankruptcy at the time of the merger
announcement and the bidder must acquire at least 50 percent of votes. To be able
to explore any dual relationship status only deals which have been financed
through external financing and where the financial advisor to the target or seller is
known are included. This forces the exclusion of any deals that have been financed
by a bidder's existing corporate funds or exiting credit lines. An advisor may be an
investment bank hired specifically by the target to deliver a fairness opinion of the
deal or a general advisor that in addition to an assessment of the transaction
pricing performs supplementary services such as advice on the overall approach to
the transaction, negotiating tactics and assistance with the assembly of a team of
professional advisors.
The SDC M&A data do not always list the identity of the lender or provider
of bidder financing. For deals where such information is missing, I manually search
and extract information from SEC filings or the deal prospectuses and
memoranda. This information is gathered from a variety of sources such as
EDGAR, SDC New Issues database, Perfect Information Debt and Perfect
Information Filings. For transactions where any key financial information is
missing in the SDC database, such information is manually added from the
Compustat North America database. Bidder financing can come in a variety of
sources such as direct lending, new credit facilities, underwriting of equity
securities or underwriting of debt securities.3 Matching financing bank with
advisors enables me to single out the dual role deals. Of the 1,023 transactions
there are 97 (9.5%) cases where any of the dual role requirements are fulfilled. I
search for documentation of financing up to one year after the deal announcement.
3 The type of financing is always disclosed in the SDC data although the identity of the provider is not always given.

76
Although a target advisor might prepare to try to be assigned a dual role far prior
to a deal being announced, the actual existence of a dual role advisor situation may
not arise until after the deal announcement. In the Toys “R” Us case the dual role
bank did not approach bidders with financing until after two months after the
merger agreement was signed.4
2.2.1 Summary Statistics
Panels A and B of Table I provide an overview of all transactions divided into dual
role, non-dual role and total number of deals. In Panel A, we see that the median
one-month deal premium is lower for deals with a dual role advisor (33.0%)
compared to deals without dual role advisors (35.9%). Dual role deals also have a
higher occurrence of lawsuits by shareholders (6.2% versus 2.9%). These are first
indications of that dual role advising is commensurate with conflicts of interests.
The median ranking of dual role advising is Tier 3, whereas non-dual role
advisors median rank is Tier 1. This indicates that lower ranked banks may be
more prone to engage in dual role lending. The mean number of advisors is slightly
higher for dual role transactions with 1.59 versus 1.29 for non-dual role deals.
Target firms in dual role transactions are on average slightly higher valued
compared to target firms in non-dual role deals, as their median market-to-book
ratio (M/B) is 2.58 versus 2.47. Whereas it is surprising that the dual role deals,
which are larger on average than non-dual role deals, have lower ranked advisors,
this is counterbalanced for by that these deals also have more advisors involved.
Interestingly, the median past 12 months return on equity (ROE) is 11.0% for dual
role deals, which is somewhat higher than that for the non-dual role group at
9.59%. Hence, firms in dual role deals may not necessarily be firms with financial
troubles.
Levels of advisory fees are indistinguishable between groups. Both have a
median of 0.10%. Median leverage levels are at comparable levels with 0.54 for
4 The lag in time from announcement of the deal to documentation of the financier‟s identity makes it difficult to study the otherwise interesting case of withdrawn or failed transactions. In SDC there are 5,550 withdrawn bids over the period. 1,160 entries have a named advisor and of these, 179 were to be financed through one of the external financing methods listed (borrowing, bridge loan, common stock issue, debt issue, foreign provider, junk bonds, new line of credit, mezzanine, preferred stock issue, rights issue). However, only 15 cases disclose the name of the intended financier, which makes it infeasible to study if dual role situations have an impact on the probability of deal failure.

77
non-dual role versus 0.61 for dual roles. Whereas the median for the amount of
deals performed within the same state is higher for dual role deals (18.6%) than for
non-dual role deals (16.2%), the relationship is the reverse for the number of deals
done within the same industry (47.4% versus 51.0%). The incidence of hostile
deals is slightly higher in the non-dual role group (2.48%) compared to dual role
deals (2.06%). The same holds for number of deals with competing bidders with
ratios of 3.24% against 1.03%. Median size of transaction value is $1,270 million
for dual role and $349 million for non-dual role deals. The median size of the
target‟s assets is $1,570 million for dual role targets and $417 million for non-dual
role targets. Cash only as well as shares only considerations are more common in
non-dual deals (77.2% and 3.13%) compared to dual role deals (67.0% and 1.03%).
Subsequently, hybrid consideration is more often used in dual role transactions
with 24.7% versus 16.5% for non-dual role transactions.
In Panel B, some characteristics on the type of bidder financing are
outlined. Comparing the various external means of financing, we see that the most
prevalent financing form for non-dual role deals is bank borrowing, which
constitute 59.2% of the transactions. This is followed by new lines of credit
(29.5%), issuance of debt securities (19.3%) and issuance of common stock
(8.86%). The pattern is slightly different for dual role deals with bank borrowing
being the most common source of financing (48.5%) and thereafter followed by
issuance of debt securities (43.3%), new credit lines (22.7%) and issuance of
common stock (13.4%). Forms of financing such as the use of bridge loans, using
a foreign provider of funds, junk bonds, mezzanine and the issuance of preferred
stock are less common in both groups of deals. Note that a deal can include several
different types of financing. Last, but not least, we see that the median CAR of
bidders for non-dual role deals is 0.11%, which is considerably lower than the
0.50% enjoyed in dual role deals. This is an early indication of that acquirers may
gain disproportionally on behalf of sellers in deals where they are financed by the
target‟s advisor. A t-test between dual role and non-dual role transactions reveals
that there are significant differences in the means for all three premium variables as
well as for the fee ratio but not for the occurrence of lawsuits or for bidder CAR.
Though these results do not unambiguously point in one or the other direction,
they still suggest that dual role deals may carry with them manifested conflicts of
interest.

78
Figure II shows the timing of dual role deals in absolute numbers and as
percentages of the sample. Dual deal timing is measured from the announcement
date. Whereas the number of dual role deals is on its highest level in 1999, the
relative contribution to the total amount of deals peaks in 2005. The slightly higher
number for the first half of 2008 should be viewed cautiously as only 6 deals were
announced in that period.
Figure II. Time line of dual role deals
2.2.2 Model
The 1,023 deals are analyzed with a standard OLS model:
y = α+βx+δZ+ε (1)
In the base model y is the deal premium measured as the offer price over the
market price of stock for periods of one month, one week and one day prior to the
deal announcement.5 x is the key independent variable of this paper as it indicates
the presence of a dual role advisor. Z is a vector of 25 variables, which control for
5 The corresponding numbers of calendar days are 30, 7 and 1 respectively.
0,0%
2,0%
4,0%
6,0%
8,0%
10,0%
12,0%
14,0%
16,0%
18,0%
0
2
4
6
8
10
12
14
16
18
1993 1994 1995 1996 1997 1998 1999 2000 2001 2002 2003 2004 2005 2006 2007 2008
# Dual role deals (lhs) Percentage dual role deal (rhs)

79
firm and deal characteristics. The vector includes variables for size, target
profitability, leverage, geographic data, industry data, bidder hostility, lawsuits,
number of competing bidders, method of payment, type of bidder financing,
advisor rankings etc.6 All variables are detailed in the Appendix. I cluster standard
errors by industry and employ year fixed effects for the 15-year sample period
throughout the analysis.
2.3 Empirical Results and Analysis 2.3.1 Determinants of Dual Role Advising
Before turning to the possible impact of dual role advising, I first estimate the
probability that such advising occurs using a probit model.
Pr(Dual role=1) = α+βW+ε (2)
W includes the vector of standard controls Z, as well as measures for corporate
governance and the strength of relations between target firms and advisors.
Corporate governance is measured through the Gov-Score index, which is
available for 478 of the transactions in my sample. For full details on the
construction of Gov-Score and its 51 underlying components, see Brown and
Caylor (2004, 2006).7 The strength of relations between the advisor and the target
firm is measured as a percentage of the number of times the target has used the
advisor as advisor in any M&A situation in the past 5 years using SDC data. This
method of measuring the strength of advisory relations resembles that in Ivashina
and Kovner (2008). The second column in Table II shows the marginal effects
when the Gov-Score index is included in the regression. The higher the score of
corporate governance quality, the lower is the prevalence of dual role advising. The 6 Because only 468 of the acquiring firms in my sample are public firms, I have to leave out some variables that have previously been found to affect takeover premium. E.g., Shleifer and Vishny (2003), Rhodes-Kropf and Viswanathan (2004) and Rhodes-Kropf, Viswanathan and Robinson (2005) find that the acquiring firm‟s market-to-book ratio prior to deal announcement is positively related to the premium, which is argued to be driven by the fact that growth firms (acquirers with high market-to-book ratios) may be overvalued which makes the acquirer‟s stock an attractive method of payment in a merger. 7 Brown and Caylor (2006) find that the factors that are the most significant valuation drivers are; the company either has no poison pill or a pill that was shareholder approved, option re-pricing did not occur within the last three years, directors are subject to stock ownership guidelines, all directors attended at least 75% of board meetings or had a valid excuse for non-attendance, the average options granted in the past three years as a percentage of basic shares outstanding did not exceed 3%.
80
coefficient, which is significant on the 1% level, indicates that the probability of
dual role advising is decreasing with 3.0 pp. for each higher score point. Leverage
has the opposite impact. The higher the target leverage, the more likely that dual
role advising will occur. The coefficient is 4.2 pp. and statistically significant on the
1% level. The coefficient for previous interaction is negative but not statistically
significant. Whether a bidder is friendly or hostile does not significantly affect the
probability of dual role advising. Some further results of interest, which all are
significant at the 5% level, relate to the number of competing bidders and the
number of advisors. When competition is present in a takeover situation the
prevalence of dual role advising is reduced by 10.4 pp. This result indicates that the
more bidders, the less easy it is for the target advisor to control all events and
secure both sides of a deal. We also see that the probability of dual role situations
is increasing in the number of advisors that are hired.
2.3.2 Deal Premium
Table III presents results from OLS regressions with deal premium, defined as the
percentage premium of offer price over target price one month, one week, and one
day prior to deal announcement, as the dependent variable. After controlling for
firm and deal characteristics, I find a negative, economically and on the 5% level
statistically significant relation between a dual role advisor and deal premium.
When the target advisor is a dual role advisor, one month deal premiums are 12.0
pp. lower compared to deals without a dual role advisor. Corresponding results for
the one week and one day periods are 7.7 pp. and 7.3 pp. respectively.
These results point to that dual role advisors‟ integrity in advising a target is
infected by the prospects of the fees they might obtain on the buy side. Overall,
the hypothesis that dual role advisors bring along conflicts of interest between
themselves and shareholders is supported. The magnitude of this conflict is large
with shareholders losing out on comparatively low bid premiums. Focusing on the
results for one-month premium, we see that, though not generally statistically
significant, the control variables have the expected signs. For example, deals in the
same state incur a premium, which is consistent with Kedia, Panchapagesan and
Uysal (2008) as well as Grote and Umber (2006) who find that acquirers have a
strong and consistent preference for geographically proximate target companies.
As one might have expected, I find that M&A in the same industry, which can give
rise to synergy effects, as well as the presence of competing bidders are both

81
features that drive up transaction premium. The effects are 3.4 pp. and 2.3 pp.
respectively.
As suggested by Hogan (2006) it may be that conflicts of interest can be
mitigated by the use of several advisors where the key role of one is to provide a
fairness opinion. However, we see that the premium is actually decreasing by 1.8
pp. per advisor engaged by the target. This could indicate that the conflict-
mitigating effect of employing several advisors is dominated by the free riding
problems that arise when several agents are hired to perform largely the same or
overlapping tasks. Anecdotal, but highly entertaining, evidence of free riding
among jointly hired advisors is given in William D. Cohen‟s comprehensive
account of investment banking firm Lazard Frères & Co.8 Cohen tells the story of
a deal where Lazard acted as co-advisor with Salomon Brothers (p 213): “…[the
Salomon Brothers banker] couldn‟t get over the fact that the Lazard bankers had
produced nothing in writing but [the Lazard banker] had figured, correctly, that the
Salomon bankers would.” The results are also consistent with Kisgen et al. (2009)
who find that fairness opinions do not affect deal outcomes when used by targets.
We see that those deals where target shareholders file a lawsuit carry with
them lower premium on average. The relatively high coefficient of -5.0 pp. is quite
unsurprising. Even though lawsuits do not arise until after a deal is proposed, it
serves as a proxy for general shareholder discontent, which may otherwise be
unobservable. Other conventional results are that hostile takeovers are associated
with 8.3 pp. higher bidding premium than in friendly deals and that the larger the
target firms, the lower the deal premium. In terms of the method of financing,
bridge loans, a foreign lender and junk bond deals are performed at large deal
premium discounts. Whereas the use of junk bonds in particular could be an
indicator of that a target company is in a very poor shape, the results on borrowing
source should not be overplayed as the number of observations for these
categories are very small, which was shown earlier in Table I.
2.3.3 Lawsuits
It is well established that lawsuits related to M&A are very costly for firms for
numerous reasons. Thompson and Thomas (2003) document that plaintiffs
generally receive large monetary settlements in acquisition related class action
8 William D. Cohen, The Last Tycoons: The Secret History of Lazard Frères & Co. Broadway Books New York 2007, ISBN 9780767919791.

82
lawsuits. Lawsuits are of course costly for both bidding and target firms. It has
even been suggested in some professional journals that acquisitions in general are
bad because the lawsuits they bring with them cause firms to fall behind their
competitors.9 Gong, Louis and Sun (2008) find that post-merger announcement
losses for bidders can partly be attributed to the probability that the acquirer will
face a lawsuit. They also find that lawsuits are costly for the firm because of not
only settlement costs and lawyer fees but also because it tends to distract
management at the very moment when it should be concentrating on the merger at
hand. In Table IV, I examine whether deals with a dual role advisor are more likely
to be brought to court by shareholders than deals with no dual role advisors. A
probit model with lawsuit as dependent variable on all remaining variables show
that deals with dual role advisors are 3.0 pp. more likely to end up in a court. The
result is statistically significant on the 10% level. Clearly, the action by shareholders
to file legal charges against the board for accepting a bid for the firm is a strong
indication of discontent with the deal and deal terms. Although the effects are not
very strong, the results do support the hypothesis that dual role advisors are a
feature that brings with it costly conflicts of interest with shareholders.
2.3.4 Target Advisor Fees
Another approach to examining if dual role advisors give rise to conflicts of
interest is to look at merger fees as a percentage of the transaction value paid to
the target advisors. McLaughlin (1990, 1992) document that fees paid to target
advisors are contingent on the price realized and that different payoff functions
may influence tender offer outcomes. Kale, Kini and Ryan (2003) observe that
fixed fees are greater for target advisors than for acquirer advisors and conclude
that target advisors have little incentive to complete a deal at any cost. Hunter and
Walker (1990) examine different merger fee contracts and find that they commonly
consist of a combination of a fixed fee and a fee based on the transaction price.
Importantly, they find that this type of contract appears to provide the proper
incentive for advisors to increase their efforts to generate better outcomes. Hunter
and Jagtiani (2003) show that buy-side advisor fees are associated with greater
acquisition gains realized by the acquirer.
9 This is for example argued by Barbara Etzel, “A chill wind on tech mergers: HP-Compaq controversy could stall further M&A activity in sector”. Investment Dealers Digest, April 15, 2002.

83
To examine whether there are differences in the fees of dual role advisors
compared to non-dual role advisors, I run an OLS regression with fee as
percentage of transaction value as dependent variable and all independent variables
as in (1). We see in Table V that dual role advisors on average receive 0.2 pp. lower
fees. The coefficient is significant on the 10% level. The economic effect is not
trivial since the average fee ratio, as shown in Table I, is 0.52%. This could be an
indication of that the target shareholders are unhappy with their advisory
performance and thus pay them less. Again, this points to a conflict between
shareholders and dual role advisors. We can also note that the levels of fees
increase by 0.2 pp. per tier of advisor ranking. Pay is increasing in the size of the
target. Both cash-only and shares-only considerations reduce the fee levels.
Overall, my results are consistent with existing literature to the extent that
I also find that fees are related to the client‟s perceived notion of the quality of
advice. I will return to these results as they play an important role in discussing the
alternative hypothesis of dual role advisors being a value-increasing feature in
mergers.
2.3.5 Bidder Returns
The announcement returns for acquiring firms around the deal announcement has
been studied extensively in the finance literature. Most studies document negative
bidder returns. Roll (1986), followed by Moeller, Schinglemann and Stulz (2004),
suggest that this is due to management entrenchment or hubris. However, Becher
(2009) notes that the literature on bidder returns generally suggest that mergers are
likely motivated by synergies rather than managerial hubris. Jensen and Ruback
(1983), Malatesta (1983), Asquith, Brunner and Mullins (1983) instead suggest that
results may be driven by problems in measuring bidder returns. Both Bhagat,
Ming, Hirshleifer and Noah (2004) and Hietala, Kaplan and Robinson (2003) point
to that results may be caused by a surprise effect of the merger announcement
rather than the pure economics of the deal itself. Boone and Mulherin (2008) find
that low bidder returns are a function of a competitive takeover market. Fuller,
Petrie, Netter and Stegmoeller (2002) study shareholder returns for firms that
acquired five or more firms within a short time period. They find that whereas
shareholders of the bidding firm gain when the bid is for buying a private firm or
subsidiary they lose when the firm purchases a public firm. Mitchell, Pulvino and
Stafford (2004) observe that price pressure from merger arbitrage bias bidder

84
returns downward. I study bidder returns with three day CAR around the
acquisition announcement (-1, +1). CAR is computed using a market model with
an estimation period from 180 trading days to 21 trading days prior to the
announcement date. Table VI displays results with the CAR as dependent variable.
We see that mergers with a dual role advisor have better announcement returns
than deals without dual role advisors. The CAR is 1.9 pp. and statistically
significant on the 10% level. Thus, dual role advising seems to be bad for the target
party and good for the bidding party.
2.3.6 Alternative Hypothesis
As previously mentioned, an alternative explanation for the use of dual role
advisors is that they may be needed as financiers in deals that are, for one or the
other reason, difficult to finance. If this is the case, then the results that premiums
are lower in dual role deals would not necessarily mean that the net effect for target
shareholders is negative compared to the counterfactual effect of a deal not talking
place. To control for whether there are observable or unobservable differences in
the data that could explain dual role advising within the alternative story, I would
like to compare deals with similar characteristic. Since it is difficult to match the
transactions directly based on multiple relevant characteristics, I first use
propensity score matching, which reduces the multiple-dimension matching
problem to that of a single-dimension. To control for unobservable characteristics
I use an instrumental variable (IV) approach.
2.3.6.1 Propensity Score
By using the propensity score, I can take into account that the characteristics of
dual role transactions may differ from non-dual loan transactions and ensure that
these characteristic do not drive the results. I follow the methodology used in
Giannetti and Ongena (2009) and Hellman, Lindsey and Puri (2008) who use the
matching techniques suggested by Rosenbaum and Rubin (1983). Algorithms for
Stata estimation follow Becker and Ichino (2002). Using the probit model specified
in (2), I estimate the propensity score that a firm in the sample encounters a dual
role advisor. Since measures for the targets‟ level of corporate governance is only
available for 478 transactions, regression (2) is estimated without including the
Gov-Score index. The average effect of treatment on the treated is computed by
matching each treatment observation (transaction with a dual role advisor) with

85
non-dual role transactions of similar propensity score and taking the average
difference between these matched transactions. I report four different methods of
measuring the average effect in Table VII. The Nearest-neighbor method performs
matching with equal weights on the closest propensity score. The Radius method
matches propensity scores that all fall into a neighborhood of 0.10. Gaussian
kernel matching uses weights that are inversely proportional to the distance
between the propensity scores of treated and controls. Finally, the Stratification
method matches the range of score values within an interval were treated and
control units have on average the same propensity score. Overall, we see that deals
with dual role advisors consistently have lower premiums, higher probability of
lawsuits and lower fees paid to advisors. Statistical significance varies across the
various matching methods with the nearest neighbor matching standing out as
yielding the weakest results. Statistically significant estimates for the one month
premium vary from -12.2 pp. to -14.0 pp. Thus, controlling for observable
differences in firm characteristic does not drive away the previously reported
results that dual role advising is a feature that brings with it costly conflicts of
interest with target shareholders.
In Table IV, we saw that there is an increased probability of lawsuits in dual
role deals. These results hold also in the propensity score matching. Lawsuits are
between 4.3 pp. and 5.2 pp. more likely when a dual role advisor is present
compared to the control group of non-dual role advisor deals. As it is difficult to
reconcile these results with the alternative explanation that dual role advising could
be a good thing for target shareholders, they present strong evidence against the
alternative story. In the related situation of stapled financing, Povel and Singh
(2009) argue that for staples to be optimally provided the lender cannot expect to
breakeven, but must be compensated by the seller for offering the loan. In the
previous analysis of fees (Table VI), we saw that advisor fees are generally lower in
dual role transactions than in other deals. This suggests that lenders do not receive
special compensation for overly favorable loans. The propensity score estimates
confirm that results hold after accounting for matching. Statistically significant
results vary from -0.2 to -0.3 pp. Overall, the results in the propensity score
analysis point to that the results obtained in the earlier regressions are not driven
by observable differences between deals with dual role advisors compared to deals
without.

86
2.3.6.2 Instrumental Variable
The propensity score is based only on observable characteristics and cannot take
into account any bias coming from unobservable heterogeneity between treatment
and control groups. To directly address such bias, I need an instrument that does
not directly affect deal premium but is correlated with the dual-role advising
indicator. Inspired by Allen and Dudley (2009) who instrument the quality of a
financial advisor with the mean advisor quality in the same state and year and
whether the issuer used an advisor on the previous issue, I use as instrumental
variable the mean occurrence of dual role advising in the same state and year of the
transaction. The general occurrence of advisors that turn out to be dual role
advisors in a given state and year should affect the likelihood that a transaction is
performed with a dual role advisor, but should not affect the size of the premium
paid in the transaction once the target firm has chosen the advisor.10 Thus, the
instrument satisfies the exclusion restriction requirement. First- and second-stage
regressions are reported in Table VI where we see that the negative and significant
impact of a dual role advisor on deal premium is robust in the premium regression
after controlling for unobservable private information. Coefficients in the second
stage regression are -18.47 pp., -11.84 pp. and -12.35 pp. for the one month, one
week, and one day time periods. Results for one month and one day are significant
on the 10% level. Finally, we can revisit the predicted outcomes in Figure I and
conclude that the obtained results support the base hypothesis that dual role
advising is bad for shareholders.
2.4 Conclusion I study 1,023 US M&A over the period 1993 to 2008 and find that in deals where a
bank engages in dual role advising, deal premiums are 12.0 pp. lower than in deals
with no dual role advisor. Whereas sellers lose out, the bidding firm gains a CAR
around the announcement day that is 1.9 pp. higher in deals with dual role advising
compared to deals without. Furthermore, deals with dual role advisors are more
likely to be taken to court by shareholders and the advisor fees are lower compared
to non-dual role deals. Overall, the results do not support an alternative hypothesis
that dual role lending is a helpful feature in transactions where it might be difficult
10 Similar motivations for using geographically related instruments are found in a range of papers, e.g. Hellman et al. (2008) and Berger, Miller, Petersen, Rajan and Stein (2005).

87
to otherwise obtain bidding financing. Results hold after both propensity score
matching and instrumental variable analysis.
The findings in this paper are consistent with Delaware court statements,
finance and law practitioners‟ views, as well as related literature on investments
banks and conflicts of interests with shareholders. Altogether, these results point
to that dual role advisors hired by target firms may not have fulfilled their
obligation of improving the pricing of the transaction. Being a dual role advisor
appears to create costly conflicts of interests, which stem from that the advice to
target shareholders and board is polluted by a desire on the part of the advisor to
obtain additional fees from financing the successful bidder. Importantly, sound
corporate governance practices in target firms is associated with fewer occurrences
of dual role situations. The results suggest that selling firms should be very careful
in scrutinizing the activities of their advisors and should demand full disclosure of
which activities the advisor is planning to engage in with the bidding firm.

88
2.5 References Acharya, Viral and Timothy Johnson, 2007, Insider trading in credit derivatives,
Journal of Financial Economics 84, 110–141.
Allen, Arthur and Donna Dudney, 2009, Does the quality of financial advice affect
prices?, The Financial Review, Forthcoming.
Allen, Linda, Julapa Jagtiani, Stavros Peristiani and Anthony Saunders, 2004, The
role of bank advisors in mergers and acquisitions, Journal of Money, Credit, and
Banking 36, 197-224.
Allen, Linda and Stavros Peristiani, 2007, Loan under pricing and the provision of
merger advisory services, Journal of Banking and Finance 31, 3539-3562.
Asquith, Paul, Robert F. Brunner and David Mullins, 1983, The gains to bidding
firms from mergers, Journal of Financial Economics 11, 121-139.
Becher, David A., 2009, Bidder returns and merger anticipation: evidence from
banking deregulation, Journal of Corporate Finance 15, 85-98.
Becker, Sascha O. and Andrea Ichino, 2002, Estimation of average treatment
effects based on propensity scores, Stata Journal 2, 358-377.
Berger, Allen, Nathan Miller, Mitchell Petersen, Raghuram Rajan and Jeremy Stein,
2005, Does function follow organizational form? Evidence from the lending
practices of large and small banks, Journal of Financial Economics 76, 237-269.
Bhagat, Sanjai, Dong Ming, David A. Hirshleifer and Robert B. Noah, 2005, Do
tender offers create value? New methods and evidence, Journal of Financial
Economics 76, 3-60.
Bodnaryk, Andriy, Massimo Massa and Andrei Simonov, 2009, Investment banks
as insiders and the market for corporate control, Review of Financial Studies 22,
4989-5026.
Boone, Audra L. and J. Harold Mulherin, 2008, Do auctions induce a winner‟s
curse? New evidence from the corporate takeover market. Journal of Financial
Economics 89, 1-19.
Brown, Lawrence D. and Marcus L. Caylor, 2004, Corporate governance and firm
performance, Working paper.
Brown, Lawrence D. and Marcus L. Caylor, 2006, Corporate governance and firm
valuation, Journal of Accounting and Public Policy 25, 409-434.

89
Calomiris, Charles W. and Hal J. Singer, 2004, How often do “conflicts of
interests” in the investment banking industry arise during hostile takeovers?,
Working paper.
Fuller, Kathleen Petrie, Jeffry Netter and Mike Stegmoeller, 2002, What do returns
to acquiring firms tell us? Evidence from firms that make many acquisitions,
Journal of Finance 57, 1763-1793.
Giannetti, Mariassunta and Steven Ongena, 2009, Lending by example: direct and
indirect effects of foreign banks in emerging markets, Working paper.
Gong, Guojin, Henock Louis and Amy X. Sun, 2008, Earnings management,
lawsuits, and stock-for-stock acquirers' market performance, Working paper.
Grote, Michael H. and Marc P. Umber, 2006, Home biased? A spatial analysis of
the domestic merging behavior of US firms, Working Paper.
Hall, Richard, 2006, Stapled finance packages under scrutiny, International Financial
Law Review April Edition, Supplement.
Hellman, Thomas, Laura Lindsey and Manju Puri, 2008, Building relationships
early: banks in venture capital, Review of Financial Studies 21, 513-541.
Hietala, Pekka, Steven N. Kaplan and David T. Robinson, 2003, What is the price
of hubris? Using takeover battles to infer overpayment and synergies, Financial
Management 32, 5-31.
Hogan, Joris, 2006, Shareholder rights plans: self-limiting features and
redemptions; what‟s up with stapled financing?, Securities Regulation Law Journal
34, 221-231.
Hunter, William C. and Julapa Jagtiani, 2003, An analysis of adviser choice, fees,
and effort in mergers and acquisitions, Review of Financial Economics 12, 65-81.
Hunter, William C. and Mary Beth Walker 1990, An empirical explanation of
investment banking merger fee contracts, Southern Economic Journal 56, 1117-
1130.
Ivashina, Victoria and Anna Kovner, 2008, The private equity advantage: leveraged
buyout firms and relationship banking, Working paper.
Ivashina, Victoria, Vinay B. Nair, Anthony Saunders, Nadia Massoud and Roger
Stover, 2009, Bank debt and corporate governance, Review of Financial Studies 22,
41-77.
Ivashina, Victoria and Zheng Sun, 2007, Institutional stock trading on loan market
information, Working paper.

90
Jensen, Michael C and Richard S. Ruback, 1983, The market for corporate control,
Journal of Financial Economics 11, 5-50.
Kale, Jayant R., Omesh Kini and Harley E. Ryan, 2003, Financial advisors and
shareholder wealth gains in corporate takeovers, Journal of Financial and
Quantitative Analysis 38, 475-501.
Kedia Simi, Venkatesh Panchapagesan and Vahap B. Uysal, 2008, Geography and
acquirer returns, Journal of Financial Intermediation 17, 256-275.
Kesner, Idalene F., Debra L. Shapiro and Anurag Sharma, 1994, Brokering
mergers: an agency theory perspective on the role of representatives, Academy of
Management Journal 37, 703-721.
Kisgen, Darren J., Jun Qian and Weihon Song, 2009, Are fairness opinions fair?
The case of mergers and acquisitions, Journal of Financial Economics 91, 179-207.
Lex, David A. and James K. Sebenius, 1986, “The Manager as Negotiator”, Free
Press, NY.
Malatesta, Paul H. 1983, The wealth effects of merger activity and the objective
function of merging firms, Journal of Financial Economics 11, 155-181.
Massa, Massimo and Zahid Rehman, 2008, Information flows within financial
conglomerates: evidence from the bank–mutual funds relationship, Journal of
Financial Economics 89, 288-306.
McLaughlin, Robyn M., 1990, Investment banking contracts in tender offers,
Journal of Financial Economics 28, 209-232.
McLaughlin, Robyn M., 1992, Does the form of compensation matter? Investment
banker fee contracts in tender offers, Journal of Financial Economics 32, 223-260.
Mitchell, Mark, Todd Pulvino and Erik Stafford, 2004, Price pressure around
mergers, Journal of Finance 59, 31-63.
Moeller, Sara B., Frederik P. Schinglemann and René M. Stulz, 2004, Firm size and
the gains from acquisitions, Journal of Financial Economics, 73, 201-228.
Povel, Paul and Rajdeep Singh, 2009, Stapled finance, Journal of Finance,
Forthcoming.
Rhodes-Kropf, Matthew and S. Viswanathan, 2004. Market valuation and merger
waves, Journal of Finance 59, 2685-2718.
Rhodes-Kropf, Matthew, S. Viswanathan and David T. Robinson, 2005. Valuation
waves and merger activity: the empirical evidence, Journal of Financial Economics
77, 561-604.

91
Roll, Richard, 1986, The hubris hypothesis of corporate takeovers, Journal of
Business 59, 197-216.
Rosenbaum Paul R. and Donald B. Rubin, 1983, The central role of the propensity
score in observational studies for causal effects, Biometrika 70, 41-55.
Shleifer, Andrei and Robert Vishny, 2003, Stock market driven acquisitions, Journal
of Financial Economics 70, 295-311.
Thompson, Robert B. and Randall S. Thomas, 2003, The new look of shareholder
litigation: acquisition oriented class actions, Vanderbilt Law Review 57, 141-209.

92
2.6 Tables Table I. Summary statistics
Premium is the offer price over the market price of stock for periods of one day, one week and one month
prior to the deal announcement. Fee ratio is the target/seller advisor fee as percentage of transaction value.
Target M/B is market value of total assets divided by the book value of total assets. Target ROE is
measured as last twelve-month net income over latest reported common equity. Target leverage is measured
as book value of total debt divided by the book value of total assets. Acquirer-target same state indicates if
acquirer and target are incorporated in the same state. Acquirer-target same ind. indicates if target and
acquirer industries are classified at the same 2-digit SIC level. Hostile takes value one if bid is hostile.
Lawsuit indicates if bid is contested in a lawsuit. Competing bidders indicates if competing bids are
announced after deal announcement. Target/seller advisor rank ranks advisors in three tiers based on market
value advised over the sample period. Transaction value is the natural log of transaction value. Target assets is
the natural log of total assets. #Target/seller advisors give the numbers of advisors retained by target and/or
seller. Previous interaction is the percentage of the number of times the target has used the advisor in an
M&A situation in the past 5 years. Gov-score is a measure of the level of corporate governance. Bidder CAR
is cumulative abnormal returns from -1 to +1 with date 0 being the announcement date. Cash only
consideration, Shares only consideration and Hybrid consideration are indicator variables of whether the bid is in
cash, shares or combination of both. Bidder financing is denoted by indictor variables for Borrowing, bridge
loan, Common stock issue, Debt issue, Foreign provider of funds, Junk bond issue, New line of credit, Mezzanine, Preferred
stock issue and New rights issue. * significant at 10%; ** significant at 5%; *** significant at 1%.

93
Median Mean No
Dual Role
Dual Role
All No Dual Role
Dual Role
All t-test of means
Panel A: Deal characteristics (%)
Premium 1 month 35.9 33.0 35.5 44.5 32.7 43.1 -2.26** Premium 1 week 32.1 28.4 31.8 38.6 32.9 37.6 -2.83*** Premium 1 day 27.3 23.8 26.8 32.9 32.5 32.2 -2.30** Fee ratio 0.10 0.10 0.10 0.56 0.11 0.52 -5.00*** Target M/B 2.47 2.58 2.49 3.34 1.17 3.14 -1.13 Target ROE 9.59 11.0 9.70 6.77 2.16 8.17 -0.11 Target leverage 0.54 0.61 0.55 0.64 0.59 0.63 5.41*** Acquirer/target same state 16.2 18.6 16.4 16.2 18.6 16.4 0.57 Acquirer/target same ind. 51.0 47.4 50.6 51.0 47.4 50.6 -0.66 Hostile 2.48 2.06 2.44 2.48 2.06 2.44 -0.27 Lawsuit 2.92 6.19 3.23 2.92 6.19 3.23 1.30 Competing bidders 3.24 1.03 3.03 3.24 1.03 3.03 -1.87** Target/seller advisor rank 1 3 1 1.47 1.92 1.52 3.15*** Transaction value (mUSD) 349 1,270 410 1,590 2,470 1,670 2.53** Target assets (mUSD) 417 1,570 481 482 674 500 1.16 # Target/seller advisors 1 1 1 1.29 1.59 1.31 3.79*** Previous interaction 0.20 0.19 0.20 0.26 0.23 0.26 -1.53 Gov-score 9 6 9 9.04 7.41 8.71 -5.65*** Bidder CAR 0.11 0.50 0.17 0.63 0.79 0.65 0.18 Cash only consideration 77.2 67.0 76.3 77.2 67.0 76.3 -2.04** Shares only consideration 3.13 1.03 2.93 3.13 1.03 2.93 -1.78* Hybrid consideration 16.5 24.7 17.3 16.5 24.7 17.3 1.80*
Panel B: Bidder financing (%)
Borrowing 59.2 48.5 58.2 59.2 48.5 58.2 -2.00** Bridge loan 6.48 6.19 6.45 6.48 6.19 6.45 -0.11 Common stock issue 8.86 13.4 9.29 8.86 13.4 9.29 1.26 Debt issue 19.3 43.3 21.6 19.3 43.3 21.6 4.59 Foreign provider of funds 3.88 5.15 4.00 3.88 5.15 4.00 0.54 Junk bond issue 0.11 0.00 0.10 0.11 0.00 0.10 -1.00 New line of credit 29.5 22.7 28.8 29.5 22.7 28.8 -1.50 Mezzanine 0.54 1.03 0.59 0.54 1.03 0.59 0.46 Preferred stock issue 2.27 7.21 2.74 2.27 7.21 2.74 1.84* New rights issue 0.97 0.00 0.88 0.97 0.00 0.88 -3.01** Observations 926 97 1023 926 97 1023

94
Table II. Determinants of dual role advising The table presents marginal effect from probit regressions of each explanatory variable on the probability of a deal role situation. Gov-score is a measure of the level of corporate governance. Target M/B is market value of total assets divided by the book value of total assets. Previous interaction is the percentage of the number of times the target has used the advisor in an M&A situation in the past 5 years. Target ROE is measured as last twelve-month net income over latest reported common equity. Target leverage is measured as book value of total debt divided by the book value of total assets. Acquirer-target same state indicates if acquirer and target are incorporated in the same state. Acquirer-target same industry indicates if target and acquirer industries are classified at the same 2-digit SIC level. Hostile takes value one if bid is hostile. Competing bidders indicates if competing bids are announced after deal announcement. Target/seller advisor ranking ranks advisors in three tiers based on market value advised over the sample period. Ln(Transaction value) is the natural log of transaction value. Ln(Target assets) is the natural log of total assets. #Target/seller advisors give the numbers of advisors retained by target and/or seller. Cash only consideration, Shares only consideration and Hybrid consideration are indicator variables of whether the bid is in cash, shares or combination of both. Bidder financing is denoted by indictor variables for Bridge loan, Common stock issue, Debt issue, Foreign provider of funds, New line of credit, Mezzanine and Preferred stock issue. Standard errors adjusted for clustering on target industry in parentheses. * significant at 10%; ** significant at 5%; *** significant at 1%.

95
Dual Role Advising Gov-score -0.030*** (0.007) Target M/B -0.001* -0.002 (0.001) (0.002) Previous interaction -0.029 -0.070 (0.028) (0.075) Target ROE 0.002 0.019 (0.003) (0.015) Target leverage 0.010*** 0.042*** (0.003) (0.014) Acquirer-target same state 0.020 0.035 (0.017) (0.045) Acquirer-target same industry -0.013 -0.005 (0.012) (0.033) Hostile -0.010 -0.014 (0.033) (0.084) Competing bidders -0.035** -0.104** (0.016) (0.048) Target/seller advisor ranking 0.010** 0.032** (0.005) (0.013) Ln(Transaction value) 0.020*** 0.018 (0.007) (0.023) Ln(Target assets) -0.005 -0.026 (0.007) (0.022) # Target/seller advisors 0.019** 0.051** (0.008) (0.026) Cash only consideration -0.076* -0.173* (0.044) (0.100) Shares only consideration -0.043*** -0.123*** (0.009) (0.038) Hybrid consideration -0.030* -0.073 (0.018) (0.061) Bidder financing: bridge loan 0.001 0.031 (0.024) (0.086) Bidder financing: common stock issue 0.040 0.041 (0.030) (0.064) Bidder financing: debt issue 0.077*** 0.143*** (0.022) (0.042) Bidder financing: foreign provider of funds -0.002 0.008 (0.022) (0.054) Bidder financing: new line of credit -0.001 0.001 (0.010) (0.032) Bidder financing: mezzanine 0.036 -0.036 (0.086) (0.105) Bidder financing: preferred stock issue 0.110 0.412*** (0.067) (0.147) Year fixed effects Yes Yes Observations 1023 478

96
Table III. Deal premium OLS regressions of each explanatory variable on deal premium. Dual role indicator is one if the bid is financed by the seller or target advisor and zero otherwise. Target M/B is market value of total assets divided by the book value of total assets. Target ROE is measured as last twelve-month net income over latest reported common equity. Target leverage is measured as book value of total debt divided by the book value of total assets. Acquirer-target same state indicates if acquirer and target are incorporated in the same state. Acquirer-target same industry indicates if target and acquirer industries are classified at the same 2-digit SIC level. Hostile takes value one if bid is hostile. Lawsuit indicates if bid is contested in a lawsuit. Competing bidders is one if competing bids are announced after deal announcement. Target/seller advisor
1 month 1 week 1 day Dual role indicator -12.038** -7.744** -7.250** (5.627) (3.444) (3.604) Target M/B -0.794 -0.143 -0.127** (0.922) (0.091) (0.050) Target ROE 2.877 0.467 0.489* (3.118) (0.330) (0.281) Target leverage 0.027 -0.045 -0.001 (0.171) (0.167) (0.153) Acquirer-target same state 2.722 -1.093 0.561 (4.179) (3.637) (3.759) Acquirer-target same industry 3.376 0.307 -0.183 (4.916) (2.424) (2.231) Hostile 8.263 9.884 12.530* (7.464) (7.615) (7.267) Lawsuit -5.054 -1.769 -0.591 (7.396) (8.634) (8.683) Competing bidders 2.269 5.065 3.590 (6.161) (4.296) (4.566) Target/seller advisor ranking -0.428 0.089 0.312 (1.295) (0.828) (0.686) Ln(Transaction value) 5.376* 1.175 2.058 (3.118) (1.591) (1.496) Ln(Target assets) -6.078** -2.511* -2.675** (2.484) (1.312) (1.246) # Target/seller advisors -1.832 -2.518 -2.131 (2.333) (1.690) (1.732) Cash only consideration 0.095 3.258 1.343 (6.901) (6.276) (5.821)

97
ranking is a three-tier ranking of advisors based on market value advised over the sample period. Tier 1 includes advisors ranked 1-5, Tier 2 includes advisors ranked 6-15 and Tier 3 includes advisors below rank 16. Ln(Transaction value) is the natural log of transaction value. Ln(Target assets) is the natural log of total assets. # Target/seller advisors give the numbers of advisors retained by target and/or seller. Cash only consideration, Shares only consideration and Hybrid Consideration are indicator variables of whether the bid is in cash, shares or combination of both. Bidder financing is denoted by indictor variables for Borrowing, Bridge loan, Common Stock Issue, Debt Issue, Foreign Provider of funds, Junk bond issue, New line of credit, Mezzanine, Preferred stock issue and New rights issue. Standard errors adjusted for clustering on target industry in parentheses. * significant at 10%; ** significant at 5%; *** significant at 1%.
continued 1 month 1 week 1 day Shares only consideration -10.728 -4.580 -4.443 (10.153) (8.281) (7.920) Hybrid consideration -5.616 2.198 1.193 (7.306) (6.846) (6.877) Bidder financing: borrowing -2.572 -0.782 -2.345 (3.491) (2.845) (2.799) Bidder financing: bridge loan -14.198*** -9.897** -9.543** (5.224) (4.666) (4.259) Bidder financing: common stock issue -4.009 -6.810** -3.626 (4.910) (3.147) (3.368) Bidder financing: debt issue 0.181 1.415 1.208 (3.664) (3.141) (3.097) Bidder financing: foreign provider of funds -11.527** -8.039** -7.870* (5.181) (3.788) (4.028) Bidder financing: junk bond issue -49.535*** -61.337*** -52.353*** (12.208) (9.928) (9.008) Bidder financing: new line of credit 5.871** 2.338 1.533 (2.589) (1.940) (2.094) Bidder financing: mezzanine 7.856 9.109* 8.442 (7.302) (4.811) (5.868) Bidder financing: preferred stock issue 9.263 9.384 8.551 (7.486) (8.362) (7.172) Bidder financing: new rights issue -6.158 -7.245 -6.146 (11.433) (7.076) (5.918) Constant 56.797*** 54.634*** 46.042*** (12.172) (11.700) (9.280) Year fixed effects Yes Yes Yes Observations 1023 1023 1023 R-squared 0.09 0.10 0.08

98
Table IV. Lawsuits The table reports marginal effects from probit regressions of each explanatory variable on the probability that a deal is subject to a lawsuit from target shareholders. Dual role indicator is one if the bid is financed by the seller or target advisor and zero otherwise. Target M/B is market value of total assets divided by the book value of total assets. Target ROE is measured as last twelve-month net income over latest reported common equity. Target leverage is measured as book value of total debt divided by the book value of total assets. Acquirer-target same state indicates if acquirer and target are incorporated in the same state. Acquirer-target same industry indicates if target and acquirer industries are classified at the same 2-digit SIC level. Hostile takes value one if bid is hostile. Premium is the offer price over the market price of stock for periods of one day, one week and one month prior to the deal announcement. Target/seller advisor ranking is a three-tier ranking of advisors based on market value advised over the sample period. Tier 1 includes advisors ranked 1-5, Tier 2 includes advisors ranked 6-15 and Tier 3 includes advisors below rank 16. Ln(Transaction value) is the natural log of transaction value. Ln(Target assets) is the natural log of total assets. # Target/seller advisors give the numbers of advisors retained by target and/or seller. Cash only consideration, Shares only consideration and Hybrid consideration are indicator variables of whether the bid is in cash, shares or combination of both. Bidder financing is denoted by indictor variables for Borrowing, Bridge loan, Common stock issue, Debt issue, New line of credit and Preferred stock issue. All variables as described in the Appendix. Standard errors in parentheses. * significant at 10%; ** significant at 5%; *** significant at 1%.

99
Lawsuit Dual role indicator 0.030* 0.031* 0.031* (0.024) (0.024) (0.024) Target M/B -0.000 -0.000 -0.000 (0.000) (0.000) (0.000) Target ROE 0.000 0.000 0.000 (0.002) (0.002) (0.002) Target leverage -0.000 -0.000 -0.000 (0.000) (0.000) (0.000) Acquirer-target same state 0.009 0.009 0.009 (0.012) (0.012) (0.012) Acquirer-target same industry -0.001 -0.001 -0.001 (0.008) (0.008) (0.008) Hostile 0.047 0.046 0.045 (0.051) (0.050) (0.050) Premium 1 month prior to announcement -0.000 (0.000) Premium 1 week prior to announcement 0.000 (0.000) Premium 1 day prior to announcement 0.000 (0.000) Target/seller advisor ranking 0.003 0.003 0.003 (0.003) (0.003) (0.003) Ln(Transaction value) -0.003 -0.003 -0.003 (0.004) (0.004) (0.004) Ln(Target assets) -0.000 -0.000 0.000 (0.004) (0.004) (0.004) # Target/seller advisors -0.005 -0.004 -0.004 (0.007) (0.007) (0.007) Cash only consideration -0.084** -0.085** -0.085** (0.039) (0.039) (0.039) Shares only consideration -0.019*** -0.019*** -0.019*** (0.005) (0.005) (0.005) Hybrid consideration -0.025*** -0.025*** -0.025*** (0.008) (0.007) (0.007) Bidder financing: borrowing -0.010 -0.010 -0.010 (0.011) (0.011) (0.011) Bidder financing: bridge loan -0.010 -0.010 -0.010 (0.010) (0.010) (0.010) Bidder financing: common stock issue 0.024 0.024 0.024 (0.020) (0.020) (0.020) Bidder financing: debt issue -0.010 -0.010 -0.010 (0.008) (0.008) (0.008) Bidder financing: new line of credit -0.016* -0.016* -0.016* (0.008) (0.008) (0.008) Bidder financing: preferred stock issue -0.007 -0.007 -0.008 (0.015) (0.014) (0.014) Year fixed effects Yes Yes Yes Observations 1023 1023 1023

100
Table V. Fees Table presents results from OLS regression of each explanatory variable on the fees received by the target/seller advisor. Dual role indicator is one if the bid is financed by the seller or target advisor and zero otherwise. Target M/B is market value of total assets divided by the book value of total assets. Target ROE is measured as last twelve-month net income over latest reported common equity. Target leverage is measured as book value of total debt divided by the book value of total assets. Acquirer-target same state indicates if acquirer and target are incorporated in the same state. Acquirer-target same industry indicates if target and acquirer industries are classified at the same 2-digit SIC level. Hostile takes value one if bid is hostile. Lawsuit indicates if bid is contested in a lawsuit. Competing bidders indicates if competing bids are announced after deal announcement. Target/seller advisor ranking is a three-tier ranking of advisors based on
Fees Dual role indicator -0.002* (0.001) Target M/B 0.000 (0.000) Target ROE 0.000 (0.000) Target leverage -0.001** (0.001) Acquirer-target same state 0.003 (0.003) Acquirer-target same industry 0.001 (0.001) Hostile 0.001 (0.002) Lawsuit -0.004 (0.004) Competing bidders -0.004 (0.004) Target/seller advisor ranking 0.002*** (0.001) Ln(Transaction value) -0.005 (0.007) Ln(Target assets) 0.003** (0.001) # Target/seller advisors 0.002 (0.001) Cash only consideration -0.007** (0.003) Shares only consideration -0.007** (0.004) Hybrid consideration 0.001 (0.004) Bidder financing: borrowing -0.000 (0.002) Bidder financing: bridge loan 0.004* (0.002)

101
market value advised over the sample period. Tier 1 includes advisors ranked 1-5, Tier 2 includes advisors ranked 6-15 and Tier 3 includes advisors below rank 16. Ln(Transaction value) is the natural log of transaction value. Ln(Target assets) is the natural log of total assets. # Target/seller advisors give the numbers of advisors retained by target and/or seller. Cash only consideration, Shares only consideration and Hybrid consideration are indicator variables of whether the bid is in cash, shares or combination of both. Bidder financing is denoted by indictor variables for Borrowing, Bridge loan, Common stock issue, Debt issue, Foreign provider of funds, Junk bond issue, New line of credit, Mezzanine, Preferred stock issue and New rights issue. All variables as described in the Appendix. Standard errors in parentheses. * significant at 10%; ** significant at 5%; *** significant at 1%.
continued Fees Bidder financing: common stock issue 0.001 (0.001) Bidder financing: debt issue 0.001 (0.002) Bidder financing: foreign provider of funds 0.003* (0.001) Bidder financing: junk bond issue -0.005 (0.005) Bidder financing: new line of credit 0.002* (0.001) Bidder financing: mezzanine 0.005** (0.002) Bidder financing: preferred stock issue -0.004* (0.002) Bidder financing: new rights issue -0.000 (0.002) Constant 0.007 (0.005) Year fixed effects Yes Observations 1023 R-squared 0.34

102
Table VI. Bidder CAR Table presents results from OLS regressions of each explanatory variable on the cumulative abnormal returns of bidders from announcement day -1 to announcement day +1. Estimation period is from -180 to -21 with 0 being the announcement date. Dual role indicator is one if the bid is financed by the seller or target advisor and zero otherwise. Premium is the offer price over the market price of stock for periods of one day, one week and one month prior to the deal announcement. Target M/B is market value of total assets divided by the book value of total assets. Target ROE is measured as last twelve-month net income over latest reported common equity. Target Leverage is measured as book value of total debt divided by the same state. Acquirer-target same industry indicates if target and acquirer industries are classified at the same 2-
Bidder CAR Dual role indicator 0.019* 0.019* 0.019* (0.011) (0.010) (0.011) Premium 1 month prior to announcement -0.000** (0.000) Premium 1 week prior to announcement -0.000 (0.000) Premium 1 day prior to announcement -0.000 (0.000) Target M/B -0.001 -0.000 -0.000 (0.000) (0.000) (0.000) Target ROE 0.001 -0.003 -0.003 (0.005) (0.006) (0.006) Target leverage 0.000 0.000 0.000 (0.000) (0.000) (0.000) Acquirer-target same state 0.010 0.008 0.008 (0.010) (0.010) (0.010) Acquirer-target same industry 0.007 0.006 0.006 (0.007) (0.007) (0.007) Hostile -0.013 -0.013 -0.013 (0.021) (0.021) (0.022) Ln(Transaction value) -0.006 -0.007 -0.007 (0.005) (0.005) (0.005) Ln(Target assets) -0.004 -0.003 -0.003 (0.006) (0.006) (0.006) Cash only consideration 0.020 0.021 0.021 (0.026) (0.026) (0.026) Shares only consideration -0.012 -0.010 -0.011 (0.031) (0.031) (0.031) Hybrid consideration -0.005 -0.002 -0.002 (0.027) (0.028) (0.027) Bidder financing: borrowing 0.006 0.007 0.007 (0.010) (0.010) (0.010) Bidder financing: bridge loan -0.019* -0.020* -0.020* (0.011) (0.011) (0.011) Bidder financing: common stock issue 0.001 0.002 0.002 (0.012) (0.013) (0.013)

103
digit SIC level. Hostile takes value one if bid is hostile. Ln(Transaction value) is the natural log of transaction book value of total assets. Acquirer-target same state indicates if acquirer and target are incorporated in the value. Ln(Target assets) is the natural log of total assets. Cash only consideration, Shares only consideration and Hybrid consideration are indicator variables of whether the bid is in cash, shares or combination of both. Bidder financing is denoted by indictor variables for Borrowing, Bridge loan, Common stock issue, Debt issue, Foreign provider of funds, Junk bond issue, New line of credit, Mezzanine, Preferred stock issue and New rights issue. All variables as described in the Appendix. Standard errors in parentheses. * significant at 10%; ** significant at 5%; *** significant at 1%. continued Bidder CAR Bidder financing: debt issue -0.004 -0.002 -0.003 (0.011) (0.010) (0.011) Foreign provider of funds -0.012 -0.010 -0.011 (0.025) (0.025) (0.026) Bidder financing: junk bond issue -0.069 -0.076 -0.074 (0.055) (0.060) (0.061) Bidder financing: new line of credit -0.007 -0.007 -0.008 (0.011) (0.012) (0.012) Bidder financing: mezzanine 0.000 0.000 0.000 (0.000) (0.000) (0.000) Bidder financing: preferred stock issue -0.014 -0.013 -0.013 (0.018) (0.018) (0.018) Bidder financing: new rights issue 0.008 0.014 0.015 (0.024) (0.027) (0.027) Constant 0.110 0.110 0.108 (0.069) (0.071) (0.072) Observations 468 468 468 Year fixed effects Yes Yes Yes R-squared 0.14 0.13 0.13

104
Table VII. Propensity score analysis The table presents differences in deal premium for periods of 1 day, 1 week and 1 month before deal announcement for transactions, which involved a dual role advisor, and their matching transactions where no dual role advisor was involved. Propensity score is estimated using a probit model with the dependant variable taking the value one if the deal included a dual role advisor (treatment) and zero otherwise. All independent variables are as described in the Appendix. 22 blocks of equal score range is used and the analysis is restricted to the common support. Balancing tests are performed at the significance level 0.005. Matching is performed using Nearest-neighbor with equal weight (matching on the closest propensity score), Radius (matching on propensity score that falls into a neighborhood of 0.1), Gaussian kernel (matching with weights that are inversely proportional to the distance between the propensity scores of treated and controls), and Stratification (dividing the range of variation of the propensity score in intervals such that within each interval, treated and control units have on average the same propensity score). Bootstrapped standard errors in parentheses, * significant at 10%; ** significant at 5%; *** significant at 1%, two tailed.
1 month premium
1 week premium
1 day premium
Lawsuits Fees
Nearest-neighbor -6.521 -5.893 -4.330 0.052* -0.000
(14.447) (7.110) (4.495) (0.028) (0.001)
Radius -12.222*** -9.808** -7.843** 0.036 -0.003***
(3.867) (4.013) (3.528) (0.032) (0.001)
Gaussian kernel -14.001*** -9.288** -7.014** 0.043* -0.002***
(5.092) (4.063) (3.573) (0.024) (0.000)
Stratification -13.323*** -8.957** -8.053* 0.045 -0.001*
(4.837) (3.809) (4.525) (0.03) (0.000)

105
Table VIII. Instrumental variable approach of dual role advisors impact on deal premium Table presents first and second stage regressions of each explanatory variable on the deal premium. Dual role indicator is one if the bid is financed by the seller or target advisor and zero otherwise. The variable is instrumented by the Average occurrence of dual role advisors per state/year. Target M/B is market value of total assets divided by the book value of total assets. Target ROE is measured as last twelve-month net income over latest reported common equity. Target leverage is measured as book value of total debt divided by the book value of total assets. Acquirer-target same state indicates if acquirer and target are incorporated in the same state. Acquirer-target same industry indicates if target and acquirer industries are classified at the same 2-digit SIC level. Hostile takes value one if bid is hostile. Lawsuit indicates if bid is contested in a lawsuit. Competing bidders indicates if competing bids are announced after deal announcement. Target/seller advisor 1 month 1 week 1 day 1st stage 2nd stage 2nd stage 2nd stage
Dual role indicator -18.473* -11.840 -12.346* (10.857) (7.658) (6.577) Target M/B -0.002* -0.811*** -0.154 -0.140 (0.001) (0.208) (0.146) (0.126) Target ROE 0.001 2.884*** 0.471 0.494 (0.004) (0.782) (0.552) (0.474) Target leverage 0.001 0.032 -0.042 0.003 (0.001) (0.195) (0.137) (0.118) Acquirer-target same state 0.018 2.852 -1.010 0.664 (0.020) (4.561) (3.217) (2.763) Acquirer-target same industry -0.007 3.292 0.254 -0.249 (0.015) (3.444) (2.429) (2.086) Hostile -0.007 8.154 9.815 12.443* (0.049) (10.870) (7.667) (6.586) Lawsuit 0.025 -4.417 -1.364 -0.087 (0.043) (9.675) (6.824) (5.861) Competing bidders -0.076* 1.932 4.851 3.323 (0.044) (9.901) (6.984) (5.999) Target/seller advisor ranking 0.012* -0.330 0.151 0.390 (0.007) (1.471) (1.038) (0.891) Ln(Transaction value) 0.019** 5.552*** 1.288 2.198* (0.009) (1.967) (1.387) (1.192) Ln(Target assets) -0.002 -6.086*** -2.517* -2.682** (0.009) (1.904) (1.343) (1.154) # Target/seller advisors 0.040*** -1.544 -2.335 -1.903 (0.013) (2.921) (2.060) (1.770) Cash only consideration -0.041 -0.485 2.889 0.884 (0.042) (9.443) (6.661) (5.721) Shares only consideration -0.089 -11.742 -5.225 -5.246 (0.061) (13.680) (9.649) (8.288) Hybrid consideration -0.035 -6.023 1.939 0.870 (0.045) (10.029) (7.074) (6.076) Bidder financing: borrowing 0.012 -2.660 -0.838 -2.415 (0.019) (4.149) (2.926) (2.514) Bidder financing: bridge loan -0.014 -14.278** -9.948** -9.606** (0.032) (7.045) (4.969) (4.268)

106
ranking is a three-tier ranking of advisors based on market value advised over the sample period. Tier 1 includes advisors ranked 1-5, Tier 2 includes advisors ranked 6-15 and Tier 3 includes advisors below rank 16. Ln(Transaction value) is the natural log of transaction value. Ln(Target assets) is the natural log of total assets. # Target/seller advisors give the numbers of advisors retained by target and/or seller. Cash only consideration, Shares only consideration and Hybrid consideration are indicator variables of whether the bid is in cash, shares or combination of both. Bidder financing is denoted by indictor variables for Borrowing, Bridge loan, Common stock issue, Debt issue, Foreign provider of funds, Junk bond issue, New line of credit, Mezzanine, Preferred stock issue and New rights issue. All variables as described in the Appendix. Standard errors in parentheses. * significant at 10%; ** significant at 5%; *** significant at 1%. continued 1 month 1 week 1 day 1st stage 2nd stage 2nd stage 2nd stage
(0.032) (7.045) (4.969) (4.268) Bidder financing: common stock issue 0.055** -3.705 -6.616 -3.385 (0.027) (6.125) (4.320) (3.711) Bidder financing: debt issue 0.075*** 0.801 1.810 1.700 (0.020) (4.585) (3.234) (2.778) Bidder financing: foreign funds 0.023 -11.579 -8.071 -7.911 (0.042) (9.310) (6.567) (5.640) Bidder financing: junk bond issue 0.046 -49.282 -61.176 -52.152 (0.244) (54.446) (38.403) (32.985) Bidder financing: new line of credit 0.008 5.845 2.321 1.512 (0.019) (4.295) (3.029) (2.602) Bidder financing: mezzanine 0.102 8.126 9.281 8.656 (0.098) (21.759) (15.348) (13.182) Bidder financing: preferred stock issue 0.103** 10.210 9.987 9.301 (0.046) (10.464) (7.380) (6.339) Bidder financing: new rights issue -0.088 -6.767 -7.632 -6.628 (0.082) (18.366) (12.955) (11.127) Average occurrence of dual role advisors per state & year
0.939*** (0.046)
Constant -0.198*** 55.640 53.898 45.126 (0.075) (16.923)*** (11.937)*** (10.253)*** Year fixed effects Yes Yes Yes Yes Observations 1023 1023 1023 1023 R-squared 0.39 0.09 0.10 0.08

107
2.7 Appendix Variable Description # Target/seller advisors The numbers of advisors in total retained by target and /or seller. Acquirer-target same industry Indicates if target and acquirer industries are classified at the same
2-digit SIC level. Acquirer-target same state Indicates if acquirer and target are incorporated in the same state. Bidder CAR Cumulative abnormal returns from -1 to +1 with date 0 being the
announcement date. Estimation period is -180 to -21 trading days. Bidder financing: borrowing Indicates if bid is financed by bank borrowing. Bidder financing: bridge loan Indicates if bid is financed by bridge loan. Bidder financing: common stock issue
Indicates if an issue of common stock finances the bid.
Bidder financing: debt issue Indicates if bid is financed by issue of debt securities. Bidder financing: foreign provider of funds
Indicates if bid is financed by a foreign domiciled financier.
Bidder financing: junk bond issue Indicates if bid is financed by junk bonds. Bidder financing: mezzanine Indicates if bid is financed by mezzanine debt. Bidder financing: new line of credit Indicates if bid is financed by new line of credit. Bidder financing: preferred stock issue
Indicates if bid is financed by new issue of preferred stock.
Bidder financing: new rights issue Indicates if bid is financed by new rights issue. Cash only consideration Indicates if bid is cash only. Competing bidders Indicates if competing bids are announced after deal
announcement. Dual role indicator Indicates if bid is financed by the seller or target advisor. Fee ratio The target/seller advisor fee as percentage of transaction value. Gov-score Measure of the level of corporate governance obtained from Brown
and Caylor (2004, 2006). Hostile Indicates if bid is hostile as indicated by SDC. Hybrid consideration Indicates if bid is both cash and shares. Lawsuit Indicates if bid is contested in a lawsuit as indicated by SDC. Ln(Target assets) Natural log of total assets. Ln(Transaction value) Natural log of transaction value. Premium Offer price over the market price of stock for periods of one day,
one week and one month prior to the deal announcement. Previous interaction Percentage of the number of times the target has used the advisor
in an M&A situation in the past 5 years. Shares only consideration Indicates if bid is shares only. Target leverage Target leverage is measured as the book value of total debt divided
by the book value of total assets. Target M/B Market value of total assets divided by the book value of total
assets. Target ROE Target ROE is the last twelve-month net income over reported
common equity. Target/seller advisor ranking Three-tier ranking of advisors based on market value advised over
the sample period. Tier 1: advisors ranked 1-5, Tier 2: advisors ranked 6-15, Tier 3: advisors below rank 16.

108

109
Paper Three
Private Equity Firms and Quick Flip Sales*
Abstract: The norm for a private equity firm is to view their portfolio of companies as three to five year investments. However, sometimes a company is divested already after less than 18 months of ownership in a so called quick flip. Starting from established results in the academic literature on related themes, I contrast three hypotheses that might explain what drives quick flips; are quick flips the result of a speedy restructuring process, related to debt market conditions or driven by conflicts of interest between the limited and general partners of the private equity fund. 1,322 private-to-private transactions that took place over the period 1998 to 2008 are examined. Of these transactions, 188 were exited in less than 18 months after being added to the private equity firm portfolio. I find that quick flips do not follow upon operational improvements of the company, private equity firms are neither more likely to sell a company in a quick flip due to liquidity constraints nor do they earn relatively higher returns in these transactions compared to others. In addition, I find that as time passes by, the probability that a company is sold to an industrial buyer in a trade sale is reduced. Whereas these results offer little support for the debt market and the fast restructuring hypotheses, they do support the arguments that quick flips may stem from contractual conflicts of interests between investors and private equity managers.
* I thank José-Miguel Gaspar and Mariassunta Giannetti for helpful comments.

110
The practice of quick flips, whereby private equity (PE) firms dispose of assets
within one to two years after adding them to their investment portfolio has added
new fuel to the debate on the real contributions of PE firms.1 Practitioner and
stakeholder arguments for and against the merits of quick flips have been voiced
both in US Congress hearings2 and in the press.3 In this chapter I contrast
established results from the academic literature on related themes to see if any of
them can explain what drives quick flips.
The first hypothesis to be tested is that a quick flip is simply the result of a
speedy restructuring process of the asset under management as described in Rappaport
(1990). Though no previous studies have looked at whether restructuring drives
quick flips, there is ample support for that PE ownership in general leads to
operational improvements of firms.4
The second hypothesis is that quick flips are related to debt market conditions.
If the PE firm, for one or the other reason, faces a dire financial situation this may
lead to asset fire sales in the spirit of Shleifer and Vishny (1992). Or reversely,
quick flips may occur due to PE firms‟ market timing of debt-equity markets as
suggested in Kaplan and Strömberg (2009).
The third hypothesis is that quick flips are driven by conflicts of interest
between the limited and general partners of the PE fund. Phalippou (2009) studies
such agency conflicts and suggests that the PE general partners have an incentive
to sell good investment immediately and to delay exit of the poorly performing
investments. Partly, this behaviour is explained through the contracts between the
1 The term asset denotes the companies owned by a PE firm. 2 See “Congress warns private equity over excess profits” by Stephen Foley, The Independent, May 17, 2007. 3 See eg. “The Great Global Buyout Bubble” by Andrew Sorkin, New York Times, November 13, 2005 who states that “In recent months, several high-profile quick flips have left critics wondering whether buyout firms were using such offerings simply to line their pockets, rather than using the proceeds to support companies.” and “Quick flips criticised in study” by Fransesco Guerrera and James Politi, Financial Times, September 20, 2006; “Private equity executives retort that quick sales can be in the interest of the institutions that invest in buyout funds if they maximise returns and free up capital for further investments.” 4 See eg. Kaplan (1989), Lichtenberg and Siegel (1990), Muscarella and Vetsuypens (1990), Smith (1990), Wright, Thompson and Robbie (1992), Harris, Siegel and Wright (2005), Cressy, Munari and Malipiero (2007), Guo, Hotchkiss and Song (2009), Lerner, Sørensen and Strömberg (2008), Popov and Roosenboom (2008), Palepu (1990), Baker and Wruck (1989), Bull (1989), Ofek (1994), Smart and Waldfogel (1994), Holthausen and Larcker (1996), Weir and Laing (1998), Cotter and Peck (2001).

111
limited and general partners where, for example, some contracts allow re-
investment of capital coming from investments that are shorter than 18 months.
This provision provides a clear incentive for funds to exit investments early
because it offers them a chance to reinvest funds and thus effectively increase the
assets under management, which in turn leads to more fees.
I test these hypotheses using a sample of 1,322 private-to-private
transactions that took place over the period 1998 to 2008. Of these transactions,
188 were quick flips; investments exited in less than 18 months after being added
to the PE firm‟s portfolio of assets.
The results in this chapter generally support the third hypothesis. Most
importantly, quick flips do not follow upon operational improvements of the asset,
PE firms are not more likely to sell an asset in a quick flip due to liquidity
constraints and do not earn relatively higher returns on these transactions. In
addition, I find that as time passes by, the probability that an asset is sold to an
industrial buyer in a trade sale is reduced. Trade sales are also commensurate with
higher asset returns than other private-to-private exit transactions. Whereas there is
little support for neither the debt market nor the fast restructuring hypotheses,
these results do support the arguments raised in Phalippou (2009) on the
underlying reasons for quick flips as stemming from contractual features between
investors and PE fund managers
3.1 Background and Testable Predictions The norm for a PE firm is to view their portfolio of assets as three to five year
investments. The standard methods of exiting an investment is either by floating
the company in an IPO, sell it to another PE firm (secondary buyout) or sell it to
an industrial buyer for whom the asset would be a good strategic fit into their
existing operations (trade sale). However, sometimes an asset is divested after
much shorter holding periods than three to five years. Strömberg (2007) is one of
the first papers that discuss the prevalence of quick flips. In a sample of 6,834 exits
over the period 1970 – 2007 he finds that the share of one and two year exits are
2.9% and 12% respectively. Quick flips are more likely to occur in larger
transactions, but controlling for size they are less likely for going private
transactions. Lopez-de-Silanes, Phalippou and Gottschalg (2009) study 7,453 PE
investments undertaken between 1971 and 2005. They find that exits within 24

112
months represent 12% in the full sample and 25% of firms exited through sales.
Similar to Strömberg (2007), they do not find evidence that the frequency of quick
flips has increased over time although quick flips are more frequent in good times.
Phalippou (2009) finds that out of 2,500 exited buyout investments in his dataset,
6% are sold within one year, 23% within two years, and 44% within three years.
Short term investments have similar transaction multiples as long term
investments, but IRR:s of 69% versus 10% for longer term investments. Lopez-de-
Silanes et al. (2009) find that investments held less than two years have an average
IRR of 79%, those held between two and four years average 35% and the
remainder average 10%. Thus, these two studies show that more successful
investments are being exited more quickly. Cao and Lerner (2006) focus on reverse
leverage buyouts and find that PE groups that flip companies by floating them on
a stock exchange within a year of acquisition fail to create long-term value for
equity investors. Such flips underperform other listings and the market.
3.1.1 Fast Restructuring
If quick flips occur as direct results of operational improvements we should expect
to see evidence of that such improvements have taken place during the time of PE
ownership. The first hypothesis to be explored is if quick flips are driven by
operational improvements. From the classic view of PE firms as restructurers, a
quick flip could indicate that the asset is “operationally cured” and has gone
through a successful restructuring and improvement period. Thoughts on speedy
restructuring formed the basis of the early debates on the purpose of PE in the
1980:s [see Jensen (1989) and Rappaport (1990)].
The testable predictions are two. Firstly, if quick flips are results of fast
restructuring processes we should observe tangible improvements in operational
measures. Secondly, if a quick flip take place among assets that are ready for
industrial ownership, then such assets should relatively more often be purchased
by industrial buyers in trade-sells compared to secondary buyouts to other financial
sponsors. An industrial buyer might prefer to purchase an asset that needs little
restructuring work and can generate positive cash flows early on.
3.1.2 Debt Market Conditions
Whereas this paper is focused on exits through trade sales and secondary buyouts,
the literature on leverage buyout waves (in which publicly owned firms transfer to

113
private ownership) has identified liquidity as a key driver of cyclicality. A number
of papers have suggested that buyout patterns are related to credit market
conditions. Kaplan and Stein (1993) document this for the 1980:s, Guo et al.
(2009) for the 1990:s, Kaplan and Strömberg (2009) and Axelson, Jenkinson,
Strömberg, and Weisbach (2008) for the period 1982-2006. Whereas these studies
stress the possibility that PE firms have the ability to buy low and sell high because
they are able to time the debt-equity market, one could imagine the opposite
situation; that shortage of liquidity due to debt market conditions force sales of
assets under management. Shleifer and Vishny (1992) describe how a situation
where liquidity disappears can be very costly for a forced seller. Such asset fire sales
are possible when financial distress clusters through time within an industry with
specialized assets. A firm that must sell assets because of financial distress may find
that the potential buyers with the highest valuation for the specialized asset are
other firms in the same industry, who are also likely to be in similar financial
difficulties, and therefore will be unable to supply liquidity. Industry outsiders, who
have lower valuations for the asset but no financial constraints, thus emerge as
winning bidders. If quick flips are forced through liquidity sales we should see that
they occur more often in periods of liquidity shortages for PE firms.
3.1.3 Conflicts of Interest
Phalippou (2009) studies the agency conflicts between the limited and general
partners in PE funds and find that PE contracts often contain provisions that
encourage early exit from investments. He suggests that quick flips could be driven
by that the PE general partners have an incentive to sell good investment
immediately and to delay exit of the poorly performing investments. Such
behaviour is explained through the contracts between the limited and general
partners where, for example, some contracts allow re-investment of capital coming
from investments that are shorter than 18 months. This provision provides a clear
incentive for funds to exit investments early because it offers them a chance to
reinvest funds and thus effectively increase the assets under management, which in
turn leads to more fees. The testable prediction is that PE firms do not earn higher
returns on quick flips relative non quick flip assets.5
5 With the data available, it is however not possible to examine if quick flips are optimal from a fee perspective; do the increased management fees stemming from a higher turnover outweigh lower incentive fees induced by a possibly relatively lower IRR?

114
3.2 Empirical Methodology Transactions data is gathered from the Mergermarket database. A total of 5,294
deals are listed as exited PE deals in the database. A minimum level of required
information is available for 1,322 deals, which constitute my data sample. Crucially,
information on the method of sale and valuation measures is required.6 The
selected deals all have in common that they have been sold to a private or public
firm (thus excluding IPO:s) from a PE firm‟s portfolio. Sellers may include more
than one PE firm and also individuals such as the asset‟s management team. Pure
venture capital deals are excluded so all firms have transferred into PE ownership
as mature firms and not as start-ups. Quick flips are defined as assets held by PE
firms for period up to 18 months.7
To properly calculate the internal rate of return (IRR), detailed information
on the cash flows to and from the PE firm is needed. However, the only
information available is the purchase and sale price as well as any major events
such as a sell-off or add-on acquisition to the original assets during the course of
the asset‟s lifespan with the PE fund. The return used in this paper, asset return,
therefore excludes intermediate changes in the capital structure through dividends
and capital injections and measures only the annualized return on the asset as the
equity remaining at time of sale over equity contribution put in as investment per
year of PE ownership. As pointed out in Driessen, Lin and Phalippou (2009), the
IRR (and similarly the asset returns) does not account for risk, but by including
industry fixed effects I control for industry specific risk in calculating the return.8
A range of explanatory variables are used to address the testable predictions
described above. These variables include measures for operational results such as
growth in revenue and profitability measures such as EBITDA, EBIT and net
income. In addition, transaction specific details including method of purchase,
holding periods and method of exits are included.9 The full range of variables used
is described in the Appendix. Market development is controlled for both by
6 For some deals equity value is not implicitly given but the deal value and debt values are. I thus backward calculate implied equity as deal value. 7 Strömberg (2007) defines a quick flips using both 12 and 24 month holding periods, Lopez-de-Silanes et al. (2008) use 24 months and Phalippou (2009) use 18 months. 8 Another important control that impacts risk, but is not available to me at this point in time, is transaction leverage. 9 Purchase methods are management buyout, management buy-in, institutional buyout, institutional buy-in and buy-in management buyout.

115
including dummy variables for year of purchase and sale and the prevailing credit
spreads at these times. As is argued in Phalippou (2009), the difference in yield on
the bank prime loan rate and the 10-year treasury bonds in the month of the deal
can be used as a proxy for the cost of financing a PE deal. This measure controls
for whether liquidity concerns are driving quick flips. Industry fixed effects are
included for all 30 industries and standard errors are clustered by each of the 48
countries in the data. Consistent with Sørensen (2007), who finds that a main
driver of venture capitalist success rate with their portfolio companies is
experience, I include the natural logarithm of the size of the fund as proxy for
experience. Larger PE firms can be expected to have more resources in terms of
employees, databases, and external experts and thus a larger total mass of
experience. Demiroglu and James (2007) find that PE funds receive better
financing conditions the higher reputation they have. I include their main
reputational measures, the number of transactions performed by the PE firm the
previous three years.
3.3 Results In Table I, the particulars of quick flip transactions are compared to other, non-
quick flip PE transactions. Trade-sales account for more than 70% of quick flips
transactions compared to 53% in other deals. Some other notable results are that
credit spreads at time of investment are wider in non-quick flips and that quick
flips are typically performed by a smaller than average PE firm. The average length
of PE firm ownership is 12.7 months for quick flips versus 39.3 months for
remaining assets. Figure I displays the distribution of quick flips and non-quick
flips across industries. We see that there is no clustering of quick flips to certain
industries, but that they on the whole are dispersed over the full range of industries
represented in the sample.
3.3.1 Operational Improvements and Quick Flips
Table II displays results on whether quick flips are driven by operational
improvement made by the PE house on the asset. Operational improvements are
measured as the logarithmic differences of revenue, EBITDA, EBIT and net
income occurring over the PE firms holding period. The results do not indicate
that quick flips drive operational improvements. Economic effects are low and the

116
Figure I. Industry distribution
only result which is statistically significant is that for EBIT, but observations are
few. We can conclude that quick flips do not appear to be quick fixes; assets sold
in quick flips are not sold following a quick turnaround process.
Another key finding is that credit conditions do not seem to drive either
the original purchase or exit of an asset that is sold in a quick flip. The coefficient
of credit spreads at time of exit is not statistically significant, indicating that asset
fire sales are not causing quick flips. Neither do credit market conditions at the
time of purchase seem to be driving which assets are sold in quick flips. When
coupled with improvements in revenue, initial credit market conditions does
indicate that the marginal impact of a widening credit spread increases the
probability of a quick flip by 3.2 percentage points (pp.), but when looking at other
measures of operational improvements this effect disappears.
Reputation has a weakly negative effect. More reputable firms are less likely
to pursue a quick flip, but the effect is not robust across the various measures of
operational improvements. The results in Table II point to that neither operational
improvements nor debt market conditions are drivers of quick flips.
0%
2%
4%
6%
8%
10%
12%
14%
16%
Agr
icu
ltu
re
Au
tom
oti
ve
Bio
tech
no
logy
Ch
emic
als
Co
mp
ute
r h
ard
war
e
Co
mp
ute
r se
mic
on
du
cto
rs
Co
mp
ute
r se
rvic
e
Co
mp
ute
r so
ftw
are
Co
nst
ruct
ion
Co
nsu
mer
fo
od
s
Co
nsu
mer
oth
er
Co
nsu
mer
ret
ail
Def
ence
Ener
gy
Fin
anci
al s
eric
es
Ind
ust
rial
au
tom
atio
n
Ind
ust
rial
pro
du
cts
& s
ervi
ces
Ind
ust
rial
ele
ctro
nic
s
Inte
rnet
eco
mm
erce
Leis
ure
Man
ufa
ctu
rin
g
Med
ia
Med
ical
Ph
arm
aceu
tica
ls
Rea
l est
ate
Serv
ices
oth
er
Tele
com
mu
nic
atio
ns
har
dw
are
Tele
com
mu
nic
atio
ns
carr
iers
Tran
spo
rtat
ion
Uti
litie
s
Quick flip Non-quick flip

117
3.3.2 Time and Type of Exit
If quick flips take place among assets that are ready for industrial ownership, these
assets may be relatively more often purchased by industrial buyers in trade-sells
early after an addition to the PE firm inventory compared to secondary buyouts to
other financial sponsors. Figure II indicates that trade sales are indeed more
commonplace in quick flips. As time passes by, the relative amount of trade sales is
decreasing compared to secondary buyouts. This is an indication of that for short
and mid-term holding periods, the norm is to sell an asset to an industrial buyer
rather than another PE house. After some 36 months the ratio is close to a steady
state. It must be pointed out that the number of observed transactions up to 18
months is fairly small, but the main observation that trade sales are relatively less
common as time passes buy still holds.
Figure II. Percentage of trade sale (TS) exits
Table III confirms these observations. We see that the probability for an
exit to take place through a trade sale diminishes with time, as was indicated in
Figure II. In the first and third columns, the probability of a trade sale is regressed
on time (measured as the natural logarithm of the number of months) whereas the
0
5
10
15
20
25
30
35
40
40%
50%
60%
70%
80%
90%
100%
1 5 9
13
17
21
25
29
33
37
41
45
49
53
57
61
65
69
73
77
81
85
89
95
10
2
10
7
11
4
Obs per month Cummulative TS (%)

118
second and forth columns make use of a dummy variable indicating a quick flip or
not. On average, an increase in the logarithmic number of months under PE
ownership reduces the probability of a trade sale with 9.7 pp. The magnitude
increases to 22.0 pp. when controls for buy and sell side values are employed.
An asset sold in a quick flip is 0.12 to 0.18 pp. more likely to be sold in a
trade sale transaction compared to a secondary buyout. The overall conclusions are
that trade sales are common for quick flips and that they diminish with time. These
results could indicate that the firms that are sold in quick flips have indeed
undergone a sufficient amount of restructuring to be attractive for industrial
buyers.
3.3.3 Asset Returns
Table IV shows that asset returns are 21.4% higher in trade sales than in secondary
buyouts. The coefficient is significant at the 10% level when no PE firm fixed
effects are in place. Results on quick flips versus non-quick flips are not statistically
significant and offer little direction on their comparative merits, though
economically, quick flips are associated with higher returns. Most variables are
insignificant with the exception of PE firm size. The larger the value of the PE
firm, the lower the asset returns. But results are only weakly significant. The main
message in Table IV is that PE firms do not earn relatively higher returns in quick
flip transactions compared to non-quick flips. The results are similar to those in
Phalippou (2009). As mentioned above the asset return measure is not as good a
measure as the IRR. Phalippou (2009) uses a similar measure to the asset return,
the multiple,10 whereby he finds that short term investments have similar
transaction multiples as long term investments.
3.3.4 Selection Bias
A general problem in studies on the PE market is that the data available are to
some extent voluntary disclosed. Hence, PE firms may therefore not disclose
details on poor performing investments. Basically all studies on PE returns
encounter selection bias in one way or another and several attempts have been
made to address the issue. Ljungqvist and Richardson (2003) attempt to outwit
self-reported biases by using PE investment data from one of the largest US
10 The multiple is the undiscounted sum of the cash flows received at exit divided by the sum of cash flows initially paid.

119
institutional investors. However, their data are also subject to selection bias since
that data is not necessarily representative of the universe of deals. Cochrane (2005)
address selection bias through a maximum likelihood estimate but the results relies
heavily on the validity of his statistical assumptions. Hwang, Quigley, and
Woodward (2005) apply a different approach (hybrid repeat sales) to account for
potential selection bias. Jegadeesh, Kräussl and Pollet (2009) claim to side-step
selection bias by analyzing funds of funds but run into a different form of selection
bias as the funds may be biased in their investment in a non-representative sample
of PE funds. Due to the nature of my data it is not possible for me to employ any
of the approaches suggested by the above authors.
3.4 Conclusions Whereas the collection of results offer little support for the fast restructuring and
the debt market timing hypotheses, they do match with the conflicts of interest
arguments raised in Phalippou (2009) as the underlying reasons for quick flips.
Market timing or liquidity concerns do not appear to be the driving force
behind quick flips and PE firms do not earn significantly higher returns in quick
flips than in other transactions. Most importantly, quick flips do not appear to be
quick fixes. Firms that are being sold as quick flips are not sold because their
underlying operational performance has been improved. However, the amount of
work that has been done on the asset could be sufficient enough, as a quick flip is
more likely to go to a trade buyer than to another PE firm. These two results could
indicate that firms that are sold in quick flips were in good shape already when
acquired by the PE firm and did not need improvements on. This raises the
question whether the asset was originally acquired to be improved upon.

120
3.5 References Axelson, Ulf, Tim Jenkinson, Per Strömberg and Michael Weisbach, 2008, The
financing of large buyouts: An empirical analysis, Working paper.
Baker, George P. and Karen H. Wruck, 1989, Organisational changes and value
creation in leveraged buyouts, Journal of Financial Economics 25, 163-190.
Bull, Ivan, 1989, Financial performance of leveraged buyouts, an empirical analysis,
Journal of Business Venturing 4, 263–279.
Cao, Jerry and Josh Lerner, 2006, The performance of reverse leveraged buyouts,
Working paper.
Cochrane, John, 2005, The risk and return of venture capital, Journal of Financial
Economics 75, 3–52.
Cotter, James F. and Sarah W. Peck, 2001, The structure of debt and active equity
investors: the case of the buyout specialist, Journal of Financial Economics 59, 101-
147.
Cressy, Robert Clive, Federico Munari and Allesandro Malipiero, 2007, Playing to
their strengths? Evidence that specialization in the private equity industry
confers competitive advantage, Journal of Corporate Finance 13, 647-669.
Demiroglu, Cem and Christopher James, 2007, The role of private equity group
reputation in buyout financing, Journal of Financial Economics, Forthcoming.
Driessen, Joost, Tse-Chun Lin, and Ludovic Phalippou, 2009, measuring the risk
of private equity funds: a new methodology, Working paper.
Guo, Shorun, Edith S. Hotchkiss and Weihong Song, 2009, Do buyouts (still)
create value?, Journal of Finance, Forthcoming.
Harris, Richard, Donald S. Siegel, and Mike Wright, 2005, Assessing the impact of
management buyouts on economic efficiency: plant-level evidence from the
United Kingdom, Review of Economics and Statistics, 87, 148–153.
Holthausen, Robert W. and David F. Larcker, 1996, The financial performance of
reverse leverage buyouts, Journal of Financial Economics 42, 293-332.
Hwang, Min, John M. Quigley and Susan E. Woodward, 2005. An Index for
Venture Capital 1987-2003, Contributions to Economic Analysis & Policy 4, 1-43. Jegadeesh, Narasimhan, Roman Kräussl and Joshua Matthew Pollet, 2009. Risk
and expected returns of private equity investments: evidence based on market
prices, Working paper.

121
Jensen, Michael C., 1989, Eclipse of the Public Corporation, Harvard Business Review
67, 61-74.
Kaplan, Steven N., 1989, The effects of management buyouts on operating
performance and value, Journal of Financial Economics, 24, 217–254.
Kaplan, Steven N. and Stein, Jeremy C., 1993, The evolution of buyout pricing and
financial structure, Quarterly Journal of Economics 108, 313–357.
Kaplan, Steven N. and Per Strömberg, 2009, Leveraged buyouts and private equity,
Journal of Economic Perspectives 23, 121–46.
Lerner, Josh, Morten Sørensen and Per Strömberg, 2008, Private equity and long-
run investment: the case of innovation, Working paper.
Lichtenberg, Frank R. and Donald Siegel, 1990, The effects of leveraged buyouts
on productivity and related aspects of firm behavior, Journal of Financial
Economics, 27, 165–94.
Ljungqvist, Alexander, and Matthew Richardson 2003, The cash flow, return, and
risk characteristics of private equity, Working paper.
Lopez-de-Silanes, Florencio, Ludovic Phalippou and Oliver Gottschalg, 2009,
Giants at the gate: diseconomies of scale in private equity, Working paper.
Muscarella, Chris J. and Michael R. Vetsuypens, 1990, Efficiency and
organizational structure: a study of reverse LBOs, Journal of Finance 45, 1389–
413.
Ofek, Eli, 1994, Efficiency gains in unsuccessful management buyouts, Journal of
Finance 49, 637-654.
Palepu, Krishna G., 1990, Consequences of leveraged buyouts, Journal of Financial
Economics 27, 247-262.
Phalippou, Ludovic, 2009, Beware when venturing into private equity, Journal of
Economics Perspectives, Forthcoming.
Popov, Alexander and Peter Roosenboom, 2008, On the real effects of private
equity investment: evidence from new business creation, Working paper.
Rappaport, Alfred, 1990, The staying power of the public corporation, Harvard
Business Review 68, 96-104.
Shleifer, Andrei and Robert W. Vishny, 1992, Liquidation Values and Debt
Capacity: A Market Equilibrium Approach, Journal of Finance 47, 1343-1366.
Smart, Scott B. and Joel Waldfogel, 1994, Measuring the effect of restructuring on
corporate performance: the case of management buyouts, Review of Economics and
Statistics 76, 503-511.

122
Smith, Abbie J., 1990, Corporate ownership structure and performance: the case of
management buyouts, Journal of Financial Economics, 27, 143–64.
Strömberg, Per, 2007, The new demography of private equity, Working Paper.
Sørensen, Morten, 2007, How smart is smart money? A two-sided matching model
of venture capital, Journal of Finance 62, 2725-2762.
Weir, Charlie and David Liang, 1998, Management buyouts: The impact of
ownership changes on performance, Journal of Small Business and Enterprise
Development 5, 261-269.
Wright, Mike, Steve Thompson, and Ken Robbie, 1992, Venture capital and
management-led buyouts: European evidence, Journal of Business Venturing, 7, 47–
71.

123
3.6 Tables Table I. Summary statistics
The table shows means and t-test statistic of quick flips versus non-quick flips. Trade sale takes the value one if the firm was sold to an industrial buyer. Asset return is the annualized return on equity of the asset. Months of ownership gives the number of months under PE firm ownership. Reputation measures the number of transaction per PE firm the past three years. PE firm value measures the total activity of the PE firm over the period 1999 to 2008. Deal value is the total transaction value including equity and debt contributions. Ln(REVt/REVt-1), Ln(EBITDAt/EBITDAt-1), Ln(EBITt/EBITt-1) and Ln(NETINCt/ NETINCt-1) measures growth in revenue, EBITDA, EBIT and Net income over the holding period. Credit spreads are measured as the difference in yield on the bank prime loan rate and the 10-year treasury bonds in the month of the purchase and sale of asset. * significant at 10%; ** significant at 5%; *** significant at 1%. Means Full sample Quick flips Non-quick flips t-test
Observations 1322 188 1134
Trade sales 0.552 0.702 0.527 4.149***
(0.497) (0.458) (0.450)
Asset returns (%) 0.572 1.245 0.497 1.764*
(1.334) (2.468) (1.121)
Months of ownership 39.295 12.734 43.698 -39.877***
(21.042) (4.521) (19.401)
Reputation 3.6 3.2 3.7 -1.231
(2.1) (2.3) (2.2)
PE firm value (mEUR) 22843.43 18515.46 23560.95 -1.786*
(31903.112) (30963.312) (32013.042)
Deal value sell 276.990 232.622 283.094 -0.816
(557.822) (580.973) (554.610)
Deal value buy 165.063 157.139 166.161 -0.246
(347.900) (334.659) (349.867)
Ln(REVt/REVt-1) -0.095 -0.465 -0.0629 -1.019
(1.738) (1.964) (1.716)
Ln(EBITDAt/EBITDAt-1) -0.129 -1.673 -0.011 -1.461
(1.92) (2.303) (1.849)
Ln(EBITt/EBITt-1) -0.305 -0.833 -0.234 -0.970
(1.877) (1.287) (1.941)
Ln(NETINCt/NETINCt-1) 0.120 -2.017 0.232 -1.031
(2.554) (2.875) (2.521)
Credit spread (buy) 2.442 2.344 2.459 -2.226**
(0.677) (0.647) (0.681)
Credit spread (sell) 1.887 1.988 1.871 1.886*
(0.744) (0.800) (0.733)

124
Table II. Drivers of quick flips The table presents marginal results from probit regressions on the determinants of quick flips. Ln(REVt/REVt-1), Ln(EBITDAt/EBITDAt-1)], Ln(EBITt/EBITt-1) Ln(NETINCt/NETINCt-1) measures growth in enterprise value, revenue, EBITDA, EBIT and Net income over the holding period. Ln(PE firm value) measures the total activity of the PE firm over the period 1998 to 2008. Value represents the natural logarithm of the total value of the deals the PE firm has been involved in over the period. Ln(Buy deal value) [Ln(Sell deal value)] are the natural logarithms of the total value of purchase [sale] including equity and debt contributions. Credit spreads are measured as the difference in yield on the bank prime loan rate and the 10-year treasury bonds in the month of the purchase and sale of asset. Ln(Reputation) measures the number of transaction per PE firm the past three years. Robust standard errors in parentheses clustered by country. * significant at 10%; ** significant at 5%; *** significant at 1% Quick flip Ln(REVt/REVt-1) 0.002 (0.009) Ln(EBITDAt/EBITDAt-1) -0.000 (0.002) Ln(EBITt/EBITt-1) 0.017** (0.007) Ln(NETINCt/NETINCt-1) -0.015 (0.016) Ln(PE firm value) -0.009 -0.005 -0.010 -0.004 (0.006) (0.006) (0.009) (0.003) Ln(Buy deal value) 0.004 0.006 0.039*** 0.002 (0.009) (0.007) (0.014) (0.002) Ln(Sell deal value) -0.017** -0.006 -0.035** 0.002 (0.008) (0.009) (0.015) (0.001) Credit spread (buy) 0.032*** 0.002 0.025 -0.002 (0.009) (0.007) (0.016) (0.002) Credit spread (sell) 0.008 0.002 0.009 -0.003 (0.015) (0.005) (0.040) (0.004) Ln(Reputation) -0.007* -0.004 -0.005 -0.002 (0.003) (0.004) (0.009) (0.002) Purchase method fixed effect Yes Yes Yes Yes Errors clustered by country Yes Yes Yes Yes Observations 221 57 50 35

125
Table III. Probability of trade sale The table presents marginal effects of probit regressions of each explanatory variable on the probability of a trade sale. A trade sale is coded as one and a secondary buyout is coded as zero. Quick flip is an indicator variable for whether the firm was sold within 18 months after purchase by the PE firm. Ln(# month) measures the number of months the firm was owned by the PE firm. Ln(PE firm value) measures the total activity of the PE firm over the period 1998 to 2008. Value represents the natural logarithm of the total value of the deals the PE firm has been involved in over the period. Ln(Buy deal value) [Ln(Sell deal value)] are the natural logarithms of the total value of purchase [sale] including equity and debt contributions. Credit spreads are measured as the difference in yield on the bank prime loan rate and the 10-year treasury bonds in the month of the purchase and sale of asset. Ln(Reputation) measures the number of transaction per PE firm the past three years. Robust standard errors in parentheses clustered by country. * significant at 10%; ** significant at 5%; *** significant at 1% Trade sale Quick flip 0.120** 0.181** (0.051) (0.078) Ln( # months) -0.097* -0.220* (0.058) (0.124) Ln(PE firm value) -0.019*** -0.018*** 0.010 0.009 (0.006) (0.006) (0.017) (0.018) Ln(Buy deal value) -0.104*** -0.101*** (0.022) (0.023) Ln(Sell deal value) -0.033** -0.034** (0.014) (0.015) Credit spread (buy) -0.062 -0.068 -0.134 -0.143* (0.047) (0.047) (0.087) (0.085) Credit spread (sell) 0.000 0.002 -0.066 -0.061 (0.030) (0.030) (0.113) (0.109) Ln(Reputation) 0.012 0.018 0.013 0.009 (0.037) (0.040) (0.021) (0.035) Purchase method fixed effect Yes Yes Yes Yes Buy year fixed effects Yes Yes Yes Yes Sell year fixed effects Yes Yes Yes Yes Industry fixed effects Yes Yes Yes Yes Errors clustered by country Yes Yes Yes Yes # Observations 1317 1317 429 429

126
Table IV. Asset return The table presents results from OLS regressions of each explanatory variable on the Asset return. Trade sale is coded as one and a secondary buyout is coded as zero. Quick flip is an indicator variable for whether the firm was sold within 18 months after purchase by the PE firm. Ln(PE firm value) measures the total activity of the PE firm over the period 1998 to 2008. Value represents the natural logarithm of the total value of the deals the PE firm has been involved in over the period. Credit spreads are measured as the difference in yield on the bank prime loan rate and the 10-year treasury bonds in the month of the purchase and sale of asset. Ln(Reputation) measures the number of transaction per PE firm past three years. Robust standard errors in parentheses clustered by country. * significant at 10%; ** significant at 5%; *** significant at 1%
Asset return Trade sale 0.214* 0.069 (0.125) (0.150) Quick flip 0.180 0.142 (0.252) (0.328) Ln(PE firm value) -0.198* -0.103* -0.195* -0.114 -0.199 -0.106* (0.098) (0.049) (0.094) (0.100) (0.114) (0.051) Credit spread (buy) -0.069 -0.213 -0.046 -0.207 -0.089 -0.193 (0.258) (0.280) (0.257) (0.281) (0.259) (0.284) Credit spread (sell) 0.146 0.026 0.148 0.029 0.129 0.037 (0.207) (0.241) (0.206) (0.241) (0.208) (0.243) Ln(Reputation) 0.179 0.030 0.182 0.039 0.153 0.045 (0.252) (0.298) (0.253) (0.296) (0.256) (0.301) Constant 6.684*** 5.153* 5.545*** 5.188* 5.750*** 5.205* (1.851) (2.770) (1.848) (2.776) (1.849) (2.778) Purchase method fixed effect Yes Yes Yes Yes Yes Yes PE firm fixed effects No Yes No Yes No Yes Buy year fixed effects Yes Yes Yes Yes Yes Yes Sell year fixed effects Yes Yes Yes Yes Yes Yes Industry fixed effects Yes Yes Yes Yes Yes Yes Errors clustered by country Yes Yes Yes Yes Yes Yes Observations 429 429 429 429 429 429 R-squared 0.28 0.30 0.29 0.29 0.28 0.32

127
3.7 Appendix Variable Description Asset return Annualized return on the equity. Return is measured as equity stake
collected at time of sale over the original equity stake put in by the PE firm.
Credit spread buy (exit) Difference in yield on the bank prime loan rate and the 10-year treasury bonds in the month and country of the purchase (sale) of the asset.
Ln(# month) The natural logarithm of the number of months the firm was owned by the PE firm.
Ln(Buy deal value) The natural logarithm of the total value of purchase including equity and debt contributions.
Ln(EBITDAt/EBITDAt-1) Measures growth in EBITDA over the holding period. Ln(EBITt/EBITt-1) Measures growth in EBIT over the holding period. Ln(EVt/EVt-1) Measures growth in enterprise value over the holding period. Ln(NETINCt/NETINCt-1) Measures growth in net income over the holding period. Ln(PE firm value) Measures the total activity of the PE firm over the period 1998 to 2008.
Value represents the natural logarithm of the total value of the deals the PE firm has been involved in over the period.
Ln(Reputation) The number of transaction per PE firm past three years. Ln(REVt/REVt-1) Measures growth in revenue over the holding period. Ln(Sell deal value) The natural logarithm of the total value of sale including equity and debt
contributions. Purchase method Purchase methods may be either a management buyout (MBO) which
takes place when the management already works for the firm, Management buy-in (MBI) when a manager or a management team from outside the company raises the necessary finance, buys it, and becomes the company's new management. Institutional buyout (IBO) denotes that an institutional investor initiated the buyout together with existing management. The term institutional buy-in (IBI) is used when the acquiring institution brings along their own management team. Fixed effects are employed relative the baseline specification of buyout management buy in (BIMBO) which takes place when existing management, along with outside managers, decides to buyout a company. The existing management represents the buyout portion while the outside managers represent the buy-in portion.
Quick flip Indicates if the firm was sold within 18 months after purchase by the PE firm.
Trade sale Indicates if the firm was sold to an industrial buyer in a trade sale.


EFI, The Economic Research Institute Published in the language indicated by the title. A complete publication list can be found at www.hhs.se/efi Books and dissertations can be ordered from EFI via e-mail: [email protected]
Reports since 2006
2009
Books Engwall, Lars. Mercury meets Minerva: business studies and higher education: the Swedish case. Hagberg, Axel. Bankkrishantering. Forskning i Fickformat. Henriksson, Lars. Marknad eller reglering?: vägval för europeisk telekommunikation. Forskning i
Fickformat. Holmberg, Carina and Filip Wijkström (eds). Kunskapsbyggaren: meningsfulla möten och kunskap utan
gränser: en vänbok till Åke Danielsson. Krohwinkel-Karlsson, Anna. Oändliga projekt?: Om projektförvaltningens tidsproblematik. Forskning i
Fickformat. Schriber, Svante. Att realisera synergier: ledning av värdeskapande vid företagsköp. Forskning i
Fickformat. Sjöblom, Lisa. Partner eller kontrollant: en studie av Sidas uppföljning. EFI Civil Society Reports. Winberg, Hans, Jon Rognes and Claes-Fredrik Helgesson (eds). Leading Health Care: organizing
healthcare for greater value. Östman, Lars. Towards a general theory of financial control for organisations.
Dissertations Almenberg, Johan. Difficult choices: essays on economic behavior. Amado, Cristina. Four essays on the econometric modelling of volatility and durations. Arbin, Katarina. Individual information system acceptance behavior: an electronic ordering system case. Brettell Grip, Anna-Karin. Funding and accountability: studies of a Swedish and a British chamber orchestra. Broback, Anna. Den värdefulla nöjdheten?: en studie om kundnöjdhet och upplevt värde med kläder
över tid. Darin, Karin. Social positions in self-employment: a study of employment structures in artistic production and
management consulting. Dreber Almenberg, Anna. Determinants of economic preferences. Eriksson Giwa, Sebastian. Procedural justice, social norms and conflict: human behavior in resource allocation. Hasseltoft, Henrik. Essays on the term structure of interest rates and long-run risks. Hellström, Katerina. Financial accounting quality in a European transition economy: the case of the Czech
republic. Hernant, Mikael. Profitability performance of supermarkets: the effects of scale of operation, local market
conditions, and conduct on the economic performance of supermarkets. Jamal, Mayeda. Creation of social exclusion in policy and practice. Lakomaa, Erik. The economic psychology of the welfare state. Lazareva, Olga. Labor market outcomes during the Russian transition. Lee, Samuel. Information and control in financial markets.

Lid Andersson, Lena. Ledarskapande retorik: Dag Hammarskjöld och FN:s övriga generalsekreterare som scen för karisma, dygder och ledarideal.
Lindqvist, Göran. Disentangling clusters: agglomeration and proximity effects. Korpi, Martin. Migration, wage inequality, and the urban hierarchy: empirical studies in international and
domestic population movements, wage dispersion and income: Sweden, 1993–2003. Kragh, Martin. Exit and voice dynamics: an empirical study of the Soviet labour market, 1940–1960s. Melander, Ola. Empirical essays on macro-financial linkages. Melén, Sara. New insights on the internationalisation process of SMEs: a study of foreign market knowledge
development. Murgoci, Agatha. Essays in mathematical finance. Rovira Nordman, Emilia. Interaction across borders: a study about experiential knowledge development in
internationalizing SMEs. Salomonsson, Marcus. Essays in applied game theory. Sjöström, Emma. Shareholder influence on corporate social responsibility. Törn, Fredrik. Challenging consistency: effects of brand-incongruent communications. Wennberg, Karl. Entrepreneurial exit. Wetter, Erik. Patterns of performance in new firms: estimating the effects of absorptive capacity. Zubrickas, Robertas. Essays on contracts and social preferences. Åge, Lars-Johan. Business manoeuvring: a grounded theory of complex selling processes.
2008
Books Breman, Anna. Forskning om filantropi. Varför skänker vi bort pengar? Forskning i Fickformat. Einarsson, Torbjörn. Medlemskapet i den svenska idrottsrörelsen: En studie av medlemmar i fyra
idrottsföreningar. EFI Civil Society Reports. Helgesson, Claes-Fredrik and Hans Winberg (eds). Detta borde vårddebatten handla om. Jennergren, Peter, Johnny Lind, Walter Schuster and Kenth Skogsvik (eds). Redovisning i fokus.
EFI:s Årsbok 2008. EFI/Studentlitteratur. Kraus, Kalle. Sven eller pengarna? Styrningsdilemman i äldrevården. Forskning i Fickformat. Petrelius Karlberg, Pernilla. Vd under press: om medialiseringen av näringslivets ledare. Forskning i
Fickformat. Portnoff, Linda. Musikbranschens styrningsproblematik. Forskning i Fickformat. Sjöstrand, Sven-Erik. Management: från kontorsteknik till lednings- och organisationsteori: utvecklingen på
Handelshögskolan under 100 år: 1909–2009. Östman, Lars. Den finansiella styrningens realiteter och fiktioner: de finansiella styrformernas svenska historia,
berättelser om Petersson och "Ericsson", finansiell styrning – en ansats till generell teori. Östman, Lars. Mycket hände på vägen från Buchhaltung till Accounting: delar av Handelshögskolan under
100 år.
Dissertations Axelson, Mattias. Enabling knowledge communication between companies: the role of integration mechanisms in
product development collaborations. Benson, Ilinca. Organisering av övergångar på arbetsmarknaden: en studie av omställningsprogram. Elhouar, Mikael. Essays on interest rate theory. Farooqi Lind, Raana. On capital structure and debt placement in Swedish companies.

Granström, Ola. Aid, drugs, and informality: essays in empirical economics. Hvenmark, Johan. Reconsidering membership: a study of individual members’ formal affiliation with
democratically governed federations. Höglin, Erik. Inequality in the labor market: insurance, unions, and discrimination. Johansson, Marjana. Engaging resources for cultural events: a performative view. Kallenberg, Kristian. Business at risk. Four studies on operational risk management. Kviselius, Niklas Z. Trust-building and communication in SME internationalization: a study of Swedish-
Japanese business relations. Landberg, Anders. New venture creation: resistance, coping and energy. Pemer, Frida. Framgång eller fiasko? En studie av hur konsultprojekt värderas i klientorganisationer. Rosengren, Sara. Facing clutter: on message competition in marketing communication. Schilling, Annika. Kan konsulter fusionera?: en studie av betydelsen av identitet vid en fusion mellan
konsultföretag. Schriber, Svante. Ledning av synergirealisering i fusioner och förvärv. Sjödin, Henrik. Tensions of extensions: adverse effects of brand extension within consumer relationship. Strandqvist, Kristoffer. Kritiska år: formativa moment för den svenska flygplansindustrin 1944–1951. Strömqvist, Maria. Hedge funds and international capital flow. Söderström, Johan. Empirical studies in market efficiency. Sölvell, Ingela. Formalization in high-technology ventures. Thorsell, Håkan. The pricing of corporate bonds and determinants of financial structure. Ulbrich, Frank. The adoption of IT-enabled management ideas: insights from shared services in government
agencies. Östling, Robert. Bounded rationality and endogenous preferences.
2007
Books Andersson, Per, Ulf Essler and Bertil Thorngren (eds). Beyond mobility. EFI Yearbook 2007.
EFI/Studentlitteratur. Einarsson, Torbjörn and Filip Wijkström. Analysmodell för sektorsöverskridande statistik: fallet vård och
omsorg. EFI Civil Society Reports. Ericsson, Daniel. Musikmysteriet: organiserade stämningar och motstämningar. Samuelson, Lennart (ed). Bönder och bolsjeviker: den ryska landsbygdens historia 1902–1939. Dissertations Ahlersten, Krister. Empirical asset pricing and investment strategies. Alexius, Susanna. Regelmotståndarna: om konsten att undkomma regler. Andersson, Magnus. Essays in empirical finance. Berg, Bengt Åke. Volatility, integration and grain bank: studies in harvests, rye prices and institutional
development of the parish magasins in Sweden in the 18th and 19th centuries. Bianchi, Milo. Of speculators, migrants and entrepreneurs: essays on the economics of trying your fortune. Brodin, Karolina. Consuming the commercial break: an ethnographic study of the potential audiences for
television advertising. Elger, Max. Three essays on investment-specific technical change. Hagberg, Axel. Bankkrishantering: aktörer, marknad och stat. Hinnerich, Mia. Derivatives pricing and term structure modeling.

Hjalmarson, Hanna. En växande marknad: studie av nöjdheten med konsumtionsrelaterade livsområden bland unga konsumenter.
Hjelström, Tomas. The closed-end investment company premium puzzle: model development and empirical tests on Swedish and British data.
Kraus, Kalle. Sven, inter-organisational relationships and control: a case study of domestic care of the elderly. Lindqvist, Erik. Essays on privatization, identity, and political polarization.
Macquet, Monica. Partnerskap för hållbar utveckling: systrar av Oikos och guvernanten som blev diplomat. Melian, Catharina. Progressive open source. Nilsson, Daniel. Transactions in cyberspace: the continued use of Internet banking. Petrelius Karlberg, Pernilla. Den medialiserade direktören. Portnoff, Linda. Control, cultural production and consumption: theoretical perspectives, empirical dilemmas,
and Swedish music industry practices. Sköld, Martin. Synergirealisering: realisering av produktsynergier efter företagssammanslagningar. Sonnerby, Per. Contract-theoretic analyses of consultants and trade unions. Tyrefors, Björn. Institutions, policy and quasi-experimental evidence. Valiente, Pablo. Re-innovating the existing: a study of wireless IS capabilities to support mobile workforces.
2006
Books
Lundeberg, Mats, Pär Mårtensson and Magnus Mähring (eds) IT & business performance: a dynamic relationship. EFI Yearbook 2006. EFI / Studentlitteratur.
Thodenius, Björn. Organisering av kunskap: en studie av Wallenberg Consortium North. EFI Civil Society Reports.
Wijkström, Filip and Torbjörn Einarsson. Från nationalstat till näringsliv?: det civila samhällets organisationsliv i förändring.
Wijkström, Filip, Stefan Einarsson and Ola Larsson. Staten och det civila samhället: idétraditioner och tankemodeller i den statliga bidragsgivningen till ideella organisationer.
Östman, Lars. Lysande ögonblick och finansiella kriser: Dramaten under ett sekel.
Dissertations Argenton, Cedric. Quality provision in duopoly. Beckerman, Carina. The clinical eye: constructiong and computerizing an anesthesia patient record.
Borglund, Tommy. Aktievärden i fokus: internationell påverkan på intressentrelationer vid förvärv och fusion. Breman, Anna. The Economics of altruism, paternalism and self-control. Edquist, Harald. Technological breakthroughs and productivity growth.
Eklund, Jana. Essays on forecasting and Bayesian model averaging. Frostenson, Magnus. Legitimitetskontrollen: en studie av etiska värderingars roll i gränsöverskridande förvärv
och fusioner.
Gaspar, Raquel M. Credit risk and forward price models.
Gustafsson, Peter. Essays on trade and technological change. Hopkins, Elisabeth. Is a higher degree of local currency pricing associated with lower exchange rate pass-
through?: a study of import pricing in 51 Swedish industries.
Kling, Ragnar. Developing product development in times of brutal change.
Langenskiöld, Sophie. Peer influence on smoking: causation or correlation?

Lychnell, Lars-Olof. ”Och fungerar det inte, gör vi på något annat sätt”: en klinisk fallstudie av IT-relaterat förändringsarbete i småföretag
Meitz, Mika. Five contributions to econometric theory and the econometrics of ultra-high-frequency data. Mendicino, Caterina. Financial market imperfections, business cycle fluctuations and economic growth. Ovanfors, Anna. Essays on nonlinear time series analysis and health economics. Paltseva, Elena. Essays on commitment and inefficiency in political economy. Rogberg, Martin. Den modeföljande organisationen: om acceptansen av TQM och andra populära
managementmodeller.
Silvennoinen, Annastiina. Essays on autoregressive conditional heteroskedasticity.
Sjögren, Ebba. Reasonable drugs: making decisions with ambiguous knowledge.
Slinko, Irina. Essays in option pricing and interest rate models. Wilander, Fredrik. Essays on exchange rates and prices.
