private fixed investment
TRANSCRIPT

CHAPTER 6: PRIVATE FIXED INVESTMENT Definitions and Concepts Recording in the NIPAs Overview of Source Data and Estimating Methods Benchmark-year estimates
Nonbenchmark-year estimates Current quarterly estimates Quantity and price estimates Table 6.A—Summary of Methodology for Private Fixed Investment in Structures Table 6.B—Summary of Methodology for Private Fixed Investment in Equipment and Software Technical Note: Special Estimates Petroleum and natural gas New single-family structures Own-account software Used equipment Private fixed investment (PFI) measures spending by private businesses, nonprofit institutions, and households on fixed assets in the U.S. economy. Fixed assets consist of structures, equipment, and software that are used in the production of goods and services. PFI encompasses the creation of new productive assets, the improvement of existing assets, and the replacement of worn out or obsolete assets. The PFI estimates serve as an indicator of the willingness of private businesses and nonprofit institutions to expand their production capacity and as an indicator of the demand for housing. Thus, movements in PFI serve as a barometer of confidence in, and support for, future economic growth. PFI also provides comprehensive information on the composition of business fixed investment. Thus, for example, it can be used to assess the penetration of new technology. In addition, the investment estimates are the building blocks for BEA’s estimates of capital stock, which are used in measuring rates of return on capital and in analyzing multifactor productivity. The PFI estimates are an integral part of the U.S. national income and product accounts (NIPAs), a set of accounts that provide a logical and consistent framework for presenting statistics on U.S. economic activity (see “Chapter 2: Fundamental Concepts”).
6-1

The PFI estimates are also a primary element of BEA’s fixed assets and consumer durable goods accounts.1
Definitions and Concepts
PFI is a measure of the additions to, and replacements of, the U.S. stock of private fixed assets. As noted in chapter 2, fixed assets are produced assets that are used repeatedly or continuously in the production process—that is, in the production of other goods (including other fixed assets) or of services—for more than 1 year. Table 6.1 shows the types of transactions that are included in, and excluded from, PFI. The bulk of PFI consists of capital expenditures by private business—including expenditures on new structures, equipment, and software; net transactions in used assets; and own-account production (production by a business for its own use) of structures, equipment, and software.2 PFI also includes capital expenditures by nonprofit institutions serving households, and it includes capital expenditures for the acquisition of new residential structures and for improvements to existing residential structures by households in their capacity as owner-occupants.3 In the NIPAs, the construction of a new house (excluding the value of the unimproved land) is treated as an investment, the ownership of the house (regardless of whether the residence is owner- or tenant-occupied) is treated as a productive business enterprise, and a service is assumed to flow over its economic life from the house to the occupant.4 However, as noted in chapter 2, purchases of durable goods by persons are treated as personal consumption expenditures rather than as capital expenditures.
1 For a description of the methodology for BEA’s estimates of the stocks and depreciation of fixed assets and of the investment flows used to derive them, see U.S. Bureau of Economic Analysis, Fixed Assets and Consumer Durable Goods in the United States 1925–97, September 2003, at http://www.bea.gov/national/pdf/Fixed_Assets_1925_97.pdf. 2 In the NIPAs, private business consists of all corporate and noncorporate businesses that are organized for profit, other entities that produce goods and services for sale at a price intended to at least approximate the costs of production, and certain other private entities that are treated as business in the NIPAs. These other entities include mutual financial institutions, private noninsured pension funds, cooperatives, nonprofit organizations that primarily serve business (that is, entities classified as nonprofit by the Internal Revenue Service in determining income tax liability), federal reserve banks, and federally sponsored credit agencies. 3 Capital expenditures by government enterprises are included in gross investment by government. 4 This treatment is consistent with that of the international System of National Accounts (SNA): “Households that own the dwellings they occupy are formally treated as owners of unincorporated enterprises that produce housing services consumed by those same households” (SNA 2008: 6.117).
6-2

Table 6.1—Content of Private Fixed Investment
Category of expenditure Comments
Investment in structures by private business Includes construction of new nonresidential and residential buildings. Includes improvements (additions, alterations, and major structural
replacements) to nonresidential and residential buildings. Includes certain types of equipment (such as plumbing and heating
systems and elevators) that are considered an integral part of the structure.
Includes nonbuilding construction (such as pipelines, railroad tracks, power lines and plants, and dams and levees).
Includes mobile structures (such as office trailers at construction sites and temporary trailer classrooms) and manufactured homes.
Includes petroleum and natural gas well drilling and exploration, including “dry holes.”
Includes digging and shoring of mines. Includes brokers’ commissions on sales of new and existing structures. Includes net purchases (purchases less sales) of existing structures
from governments. Excludes maintenance and repair of nonresidential and residential
buildings. Excludes demolition costs not related to the construction of new
structures. Investment in equipment and software by
private business Includes equipment with service lives of 1 year or more that are
normally capitalized in business accounting records. Includes equipment (such as furniture and household equipment) that is
purchased by landlords for rental to tenants. Includes dealers’ margins on sales of used equipment. Includes net business purchases of used equipment and software from
governments, persons, and nonresidents. Excludes certain types of equipment that are integral parts of structures
and that are included in the value of structures. Investment in residential structures by owner
occupants Same as for private business.
Investment in structures and in equipment and software by nonprofit institutions serving households
Same as for private business.
Using business-tax-accounting practices for depreciable assets as a guide, all structures are capitalized in the NIPAs, and equipment commodities are capitalized if they meet all three of the following criteria:
• The commodity must have a useful life of more than 1 year, • The commodity must not be an integral part of a structure or included in the value
of that structure (for example, an elevator), and • The commodity, if purchased by a business, would be charged to a capital account
under normal accounting procedures. However, there are certain cases for which the NIPA treatment differs from that used in business-tax-accounting. For example, the exploration and drilling costs associated with unsuccessful drilling activities (“dry” holes) are treated as expenses by the petroleum industry but as investment in the NIPAs. In addition, business-accounting practices may differ from one industry to another, from one period to another, or from one type of asset to another. For example, some businesses may expense the purchase of certain types of software, while others may capitalize it; for consistency, all software purchases are treated as investment in the NIPAs,.
6-3

These capitalization rules and the selection of commodities that are treated as fixed assets are reviewed and updated during the preparation of BEA’s benchmark input-output (I-O) accounts. Additionally, during a comprehensive revision of the NIPAs, when the estimates from the most recent I-O benchmark are incorporated, BEA may change its treatment of certain types of structures and of equipment and software.5 The NIPA measure of PFI records capital expenditures on structures in the United States regardless of whether the structure is U.S.-owned or foreign-owned.6 It records capital expenditures on equipment and software in the United States regardless of whether the equipment and software are domestically produced or imported. In contrast, capital expenditures by U.S. residents on structures in other countries and U.S. exports of equipment and software are excluded from the PFI measure. In the NIPAs, the broadest measure of PFI is gross private fixed investment. It is measured without deduction of consumption of fixed capital (CFC), which is a measure of capital used up in production. Gross private fixed investment less CFC equals net private fixed investment. Gross private fixed investment comprises nonresidential fixed investment in structures and in equipment and software and residential fixed investment in structures and equipment. Nonresidential structures consists of new construction—including own-account construction;7 improvements to existing structures;8 expenditures on new mobile structures; expenditures on mining exploration, shafts, and wells; brokers’ commissions on sales of structures;9 and net purchases of used structures by private businesses and by nonprofit institutions from government agencies.10 In addition, it includes equipment that
5 For instance, as a result of technological and institutional changes and of revisions to international guidelines, some items that were once treated as current expenditures in the NIPAs are now capitalized. These items include software, nuclear fuel rods, drilling costs and construction of mine shafts, major replacements to residential structures and to railroad tracks, construction of manufactured homes and other mobile structures, and major appliances installed in tenant-occupied units. Conversely, small tools (such as an auto mechanic’s toolbox) that were once capitalized in the NIPAs are now expensed. As part of the upcoming 2013 comprehensive revision, BEA is planning to incorporate research and development spending as investment into its core accounts. In addition, BEA is exploring the feasibility of creating satellite accounts that would report investment in a variety of other intangible assets, such as individuals’ investments in human capital (see Ana Aizcorbe, Carol E. Moylan, and Carol A. Robbins, “BEA Briefing: Toward Better Measurement of Innovation and Intangibles,” Survey of Current Business 89 (January 2009): 10–23). 6 Ownership of a structure in a country signifies a long-term economic interest in that country, and thus the owner is considered a resident of that country. 7 For nonresidential fixed investment, own-account construction consists of the value of construction materials supplied by the project owner and the value of the labor supplied by the owner’s own construction employees assigned to the project. 8 Improvements to nonresidential structures are included with new construction but are not separately identified. 9 These commissions are considered part of the total price paid by the purchaser for the structure and thus are counted as part of the value of investment. 10 These transactions are included so that private and government ownership of the net stock of fixed assets is properly recorded; by definition, such transfers net to zero and do not affect gross domestic product.
6-4

is considered to be an integral part of the structure (such as plumbing, heating, and electrical systems). Nonresidential equipment and software consists of purchases by private businesses and by nonprofit institutions of new equipment (such as machinery, furniture, and motor vehicles) and of computer software that meet the above definition of a fixed asset. It also includes dealers’ margins on sales of used equipment to businesses and to nonprofit institutions; net purchases of used equipment from government agencies, from persons, and from the rest of the world; and own-account production of equipment and software. It is measured net of the value of worn out equipment sold for scrap. Residential structures consists of new construction of permanent-site single-family and multifamily housing units, improvements (additions, alterations, and major structural replacements) to housing units,11 expenditures on manufactured homes, brokers’ commissions on the sale of residential property, and net purchases of used structures from government agencies. Residential structures also includes some types of equipment (such as heating and air conditioning equipment) that are built into the structure. Residential equipment consists of equipment, such as furniture or household appliances, that is purchased by landlords for rental to tenants.
Recording in the NIPAs As described in chapter 2, the NIPAs can be viewed as aggregations of accounts belonging to individual transactors in the economy. PFI represents the final demand for structures and for equipment and software by private businesses and by other entities that are treated similarly to businesses in the NIPAs. In the seven summary accounts of the NIPAs, PFI appears in the Domestic Income and Product Account (account 1) as the dominant component of gross private domestic investment and in the Domestic Capital Account (account 6) as the dominant component of gross domestic investment. In the NIPAs, PFI is shown by type of product classification rather than by industry classification. Annual estimates of gross fixed investment and net fixed investment (that is, investment less CFC) by major type are provided in NIPA table group 5.2. PFI by type is presented in NIPA table group 5.3. PFI in structures by type is shown
11 Improvements to residential structures—which, unlike those to nonresidential structures, are shown separately in the NIPAs—consist of additions, alterations, and major replacements to structures subsequent to their completion. They include construction of additional housing units in existing residential structures, finishing of basements and attics, remodeling of kitchens and bathrooms, and the addition of swimming pools and garages. They include major replacements—such as new roofs, water heaters, furnaces, and central air conditioners—that prolong the expected life of the structure or add to its value; routine maintenance and repair work is not included. For residential fixed investment, own-account construction (“do-it-yourself” projects) consists of the value of the materials supplied only and does not include the value of the labor supplied by the property owner.
6-5
in table group 5.4, and PFI in equipment and software by type is shown in table group 5.5. The following is a list of the principal NIPA tables that present the PFI estimates: 5.2.3 Real Gross and Net Domestic Investment by Major Type, Quantity Indexes 5.2.5 Gross and Net Domestic Investment by Major Type 5.2.6 Real Gross and Net Domestic Investment by Major Type, Chained Dollars 5.3.1 Percent Change From Preceding Period in Real Private Fixed Investment by Type 5.3.2 Contributions to Percent Change in Real Private Fixed Investment by Type 5.3.3 Real Private Fixed Investment by Type, Quantity Indexes 5.3.4 Price Indexes for Private Fixed Investment by Type 5.3.5 Private Fixed Investment by Type 5.3.6 Real Private Fixed Investment by Type, Chained Dollars 5.4.1 Percent Change From Preceding Period in Real Private Fixed Investment in
Structures by Type 5.4.2 Contributions to Percent Change in Real Private Fixed Investment in Structures
by Type 5.4.3 Real Private Fixed Investment in Structures by Type, Quantity Indexes 5.4.4 Price Indexes for Private Fixed Investment in Structures by Type 5.4.5 Private Fixed Investment in Structures by Type 5.4.6 Real Private Fixed Investment in Structures by Type, Chained Dollars 5.5.1 Percent Change From Preceding Period in Real Private Fixed Investment in
Equipment and Software by Type 5.5.2 Contributions to Percent Change in Real Private Fixed Investment in Equipment
and Software by Type 5.5.3 Real Private Fixed Investment in Equipment and Software by Type, Quantity
Indexes 5.5.4 Price Indexes for Private Fixed Investment in Equipment and Software by Type 5.5.5 Private Fixed Investment in Equipment and Software by Type 5.5.6 Real Private Fixed Investment in Equipment and Software by Type, Chained
Dollars BEA also prepares “Underlying Detail” tables for PFI that provide current-dollar, chained-dollar, and price estimates at a greater level of detail than are shown in the above tables. BEA does not include these detailed estimates in the published tables because their quality is significantly less than that of the higher level categories of which they are a part. In particular, the detailed estimates are more likely to be based on judgmental trends, on trends in the higher level category, or on less reliable source data. The underlying detail tables for PFI consist of tables that provide quarterly estimates that are in the same format as, and consistent with, the annual estimates shown in NIPA table groups 5.2, 5.4, and 5.5. In addition, estimates of PFI by industry and by legal form of organization are presented as part of BEA’s fixed assets and consumer durable goods accounts.12 12 Go to www.bea.gov/national/FA2004/index.asp.
6-6

Overview of Source Data and Estimating Methods
As described earlier, the NIPA estimates, including those for PFI, are prepared using a wide variety of source data (see “Chapter 3: Principal Source Data”) and using estimating methods that adjust the source data to the required NIPA concepts and that fill in gaps in coverage and timing (see “Chapter 4: Estimating Methods”). For PFI, the estimates are based on government statistical reports, primarily from the U.S. Bureau of the Census but also from other federal government agencies, and on reports from private organizations, such as trade associations. The following are among the principal source data used for the PFI estimates: BEA’s benchmark I-O accounts, which are primarily based on the Census Bureau’s economic censuses, and BEA’s international transactions accounts; the Census Bureau’s annual and monthly surveys of manufacturers, monthly construction statistics, and monthly foreign trade data; and the Bureau of Labor Statistics’ (BLS) producer price indexes (PPIs) and import price indexes. Table 6.A (investment in structures) and table 6.B (investment in equipment and software) at the end of this chapter summarize the source data and estimating methods that are used to prepare the current-dollar benchmark, nonbenchmark, and current quarterly estimates and the quantity and price indexes for the detailed categories shown by type in NIPA table groups 5.4 and 5.5. Benchmark-year estimates For benchmark years, BEA’s benchmark I-O accounts are used to establish the levels of PFI and its components. The I-O accounts show the domestic output of each commodity and its disposition—either as intermediate consumption by industries or as purchases for final use, including business investment. In the I-O accounts, PFI is presented as the sum of detailed commodities purchased by business for final use.13 These commodities are then grouped into the PFI categories shown in the NIPA tables.14
For structures, the benchmark I-O estimates are primarily based on detailed value-
put-in-place data from the Census Bureau’s monthly survey of construction spending. The “value of construction put in place” is defined as the value of construction installed or erected at the construction site during a given period, regardless of when the work on the project was started or completed, when the structure was sold or delivered, or when payment for the structure was made.15 BEA adjusts the value-put-in-place data to account
13 For more information on the preparation of the I-O benchmark accounts, see U.S. Bureau of Economic Analysis, Concepts and Methods of the U.S. Input-Output Accounts, September 2006, at http://www.bea.gov/papers/IOmanual_092906.pdf. 14 A complete listing of the commodities underlying each category of PFI in equipment and software is available at http://www.bea.gov/faq/industry/IOCompPESv1.xls. 15 Value put in place is measured as the sum of the cost of materials installed or erected; cost of labor supplied by contractors and by project owners; and a proportionate share of the cost of construction equipment rental, contractors’ profit, cost of architectural and engineering work, miscellaneous overhead
6-7

for coverage gaps that are implied by comparing these data with those from the Census Bureau’s economic census.16 In addition, BEA uses data from other government sources and from trade sources in estimating the following structures categories: mobile structures; oil and natural gas well drilling and exploration; other mining exploration, shafts, and wells; residential manufactured homes; brokers’ commissions on the sale of structures; and net purchases of used structures from government agencies.
For equipment and software, the benchmark estimates are largely prepared using
the commodity-flow method (for a general description of this method, see “Commodity-flow method” in chapter 4). This method, which is implemented in its most complete form in preparing the benchmark I-O accounts, generally begins with a value of domestic output (principally manufacturers’ shipments) based on detailed data from the economic censuses. Next, the domestic supply of each commodity—the amount available for domestic consumption—is estimated by adding imports and subtracting exports, both based on the Census Bureau’s international trade data. The domestic supply is then allocated among domestic purchasers—business, government, and consumers. For most commodities, the allocation of purchases to business, and the subsequent allocation of those purchases between intermediate and final use, is based on economic census data. In a few cases, the allocation is entirely to final use (for example, motor vehicles) or to intermediate use (for example, semiconductors).17 The commodity-flow calculations also include estimates of trade margins and transportation costs18 and estimates of transactions in used equipment (see the technical note at the end of this chapter).
The following estimates are prepared directly rather than by commodity flow:
installation costs for communication equipment, industrial process design costs, and expenditures for nuclear fuel rods, for scrap metal, and for own-account software (for a description of the estimation procedure for investment in own-account software, see the technical note). Nonbenchmark-year estimates The estimates of structures for nonbenchmark years are generally prepared at the same level of detail as those for benchmark years. For most components, the estimates are prepared by using the monthly construction spending data as an indicator series to extrapolate the benchmark-year estimates (see “Interpolation and extrapolation using an indicator series” in chapter 4) and by assuming that the relationships underlying the benchmark estimates remain unchanged. For example, the coverage adjustments made to
and office costs chargeable to the project on the owners’ books, and interest and taxes paid during construction. 16 These adjustments are for own-account construction, for small projects that are excluded from the value-put-in-place data, and for nonresidential improvements. 17 For a description of the methodology used to prepare the estimates for new motor vehicles, see the technical note in “Chapter 5: Personal Consumption Expenditures.” 18 Trade margins measure the cost of marketing goods from producers to final purchasers, including markups by wholesalers and retailers. Transportation costs measure the costs of carrying goods by rail, truck, water, air, and liquid and gas pipelines.
6-8

the construction spending data for the benchmark year are assumed to be a constant proportion for periods after the benchmark year until the next benchmark estimates are available. The estimates of equipment and software for nonbenchmark years are generally prepared at a more aggregate level of detail than those for benchmark years, primarily because data on shipments are not available for the detailed product groupings. For most components, the estimates are prepared using an abbreviated form of the commodity-flow method that accommodates the available source data. For years except the most recent year, the primary source for domestic manufacturers’ shipments is the Census Bureau’s annual survey of manufactures (ASM), which collects data by product class; for the most recent year, the primary source for shipments is the Census Bureau’s monthly survey of manufacturers’ shipments, inventories, and orders, which collects data by industry group. For most components, estimates of exports and imports (based on international trade data), government purchases (based on Federal agency administrative data and on Census Bureau surveys of state and local government finance), and inventories (based on Census Bureau surveys and on IRS tabulations of business tax returns) are available. The estimates of the distributions of purchases among consumers, business final use, and business intermediate purchases are largely based on the benchmark relationships. Current quarterly estimates The current-dollar quarterly estimates—that is, the estimates for the quarters that have not yet been subject to an annual revision—for most categories of structures are prepared by extrapolation, using the same data sources as those used for the nonbenchmark-year estimates. For net purchases of used structures, the current quarterly estimates are based on judgmental trends. For petroleum and natural gas exploration and drilling, the quantity estimates for the current quarter are prepared first by extrapolating the quantity annual series using indicator series; these estimates are then converted (reflated) to current-dollar values using quarterly price indexes (see the technical note at the end of this chapter). The current quarterly estimates for equipment and software are prepared by the abbreviated commodity-flow method at the same aggregated level and based on the same data source as that used for the most-recent-year estimates (chart 6.1).
6-9
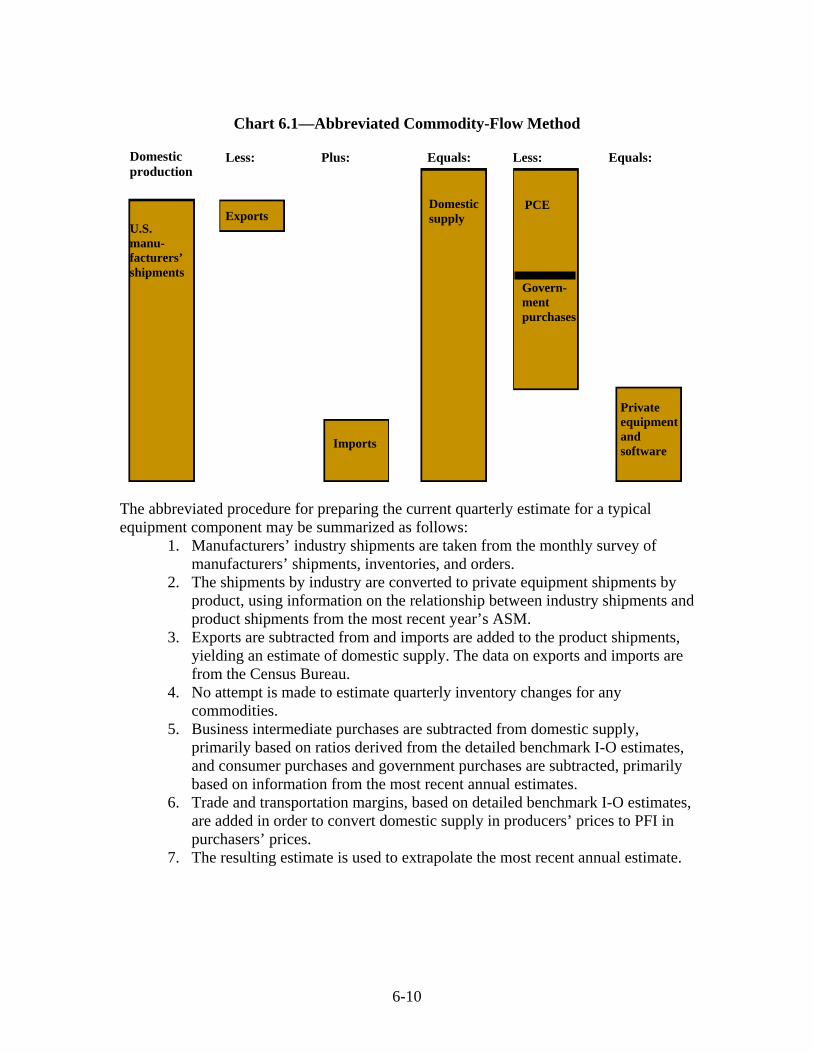
Chart 6.1—Abbreviated Commodity-Flow Method
Domestic production
Equals: Plus: Less: Less: Equals: Domestic
supply PCE
Exports U.S. manu-facturers’ shipments
Govern-ment purchases
Private
equipment and software
Imports The abbreviated procedure for preparing the current quarterly estimate for a typical equipment component may be summarized as follows:
1. Manufacturers’ industry shipments are taken from the monthly survey of manufacturers’ shipments, inventories, and orders.
2. The shipments by industry are converted to private equipment shipments by product, using information on the relationship between industry shipments and product shipments from the most recent year’s ASM.
3. Exports are subtracted from and imports are added to the product shipments, yielding an estimate of domestic supply. The data on exports and imports are from the Census Bureau.
4. No attempt is made to estimate quarterly inventory changes for any commodities.
5. Business intermediate purchases are subtracted from domestic supply, primarily based on ratios derived from the detailed benchmark I-O estimates, and consumer purchases and government purchases are subtracted, primarily based on information from the most recent annual estimates.
6. Trade and transportation margins, based on detailed benchmark I-O estimates, are added in order to convert domestic supply in producers’ prices to PFI in purchasers’ prices.
7. The resulting estimate is used to extrapolate the most recent annual estimate.
6-10

6-11
Quantity and price estimates The estimates of quantities purchased, or real spending, for most of the detailed PFI categories are prepared by deflation. Under this method, the quantities are calculated by dividing the current-dollar value of the component by an “appropriate” price index (with the reference year set equal to 100). For petroleum and natural gas exploration and drilling, the quantity estimates are prepared by direct valuation (see the technical note). (For a general description of these methods, see “Estimates for detailed components” in chapter 4.)
For structures, a wide variety of price indexes from public and private sources are used as deflators. For some components of nonresidential structures, quality-adjusted output price measures, such as PPIs, are not available, and BEA uses combinations of input-cost measures and output-cost measures in an effort to capture productivity and quality changes.19 For most equipment categories, detailed PPIs and import price indexes from BLS are used. The aggregate PFI measures are calculated from the detailed components as chain-type quantity and price indexes (for information about these calculations, see “Estimates for NIPA aggregates” in chapter 4). BEA also prepares measures of real PFI and its components in a dollar-denominated form, designated “chained-dollar” estimates (see “Chained-dollar measures” in chapter 4).20
19 For more information, see Paul R. Lally, “BEA Briefing: How BEA Accounts for Investment in Private Structures,” Survey 89 (February 2009): 11. 20 BEA does not provide chained-dollar measures (as distinct from chain-weighted indexes and percent changes) for computers, which are affected by highly volatile changes in prices and quantities (see J. Steven Landefeld, Brent R. Moulton, and Cindy M. Vojtech, “Chained-Dollar Indexes: Issues, Tips on Their Use, and Upcoming Changes,” Survey 83 (November 2003): 16.

Table 6.A—Summary of Methodology Used to Prepare Estimates of Private Fixed Investment in Structures Current-dollar estimates
Indicator series used to interpolate and extrapolate
Line in NIPA table group
5.4
Component
Benchmark year
Nonbenchmark years except the most
recent year
Most recent year
Current quarterly estimates
Quantity and price estimates
(quantity estimate prepared by deflating with the price index unless otherwise indicated)
2 Nonresidential: 3 Commercial and health care: 4 Office1 BEA’s benchmark I-O
accounts, primarily based on value put in place from MCS.
Value put in place from MCS.
Same as for nonbenchmark years.
Same as for nonbenchmark years.
PPI for office building construction.
5–9 Health care BEA’s benchmark I-O accounts, primarily based on value put in place from MCS.
Value put in place from MCS.
Same as for nonbenchmark years.
Same as for nonbenchmark years.
Unweighted average of Census Bureau price index for new one-family houses under construction and of Turner Construction Co. building-cost index.
10 Multimerchandise shopping
BEA’s benchmark I-O accounts, primarily based on value put in place from MCS.
Value put in place from MCS.
Same as for nonbenchmark years.
Same as for nonbenchmark years.
PPI for warehouses.
11 Food and beverage establishments
BEA’s benchmark I-O accounts, primarily based on value put in place from MCS.
Value put in place from MCS.
Same as for nonbenchmark years.
Same as for nonbenchmark years.
PPI for warehouses.
12 Warehouses BEA’s benchmark I-O accounts, primarily based on value put in place from MCS.
Value put in place from MCS.
Same as for nonbenchmark years.
Same as for nonbenchmark years.
PPI for warehouses.
13 Other commercial2 Mobile structures: commodity-flow method, starting with manufacturers’ shipments from EC. Other components: BEA’s benchmark I-O accounts, primarily based on value put in place from MCS.
Mobile structures: shipments from Manufactured Housing Institute times average retail price from Census Bureau monthly manufactured homes survey. Other components:
Same as for nonbenchmark years.
Same as for nonbenchmark years.
Mobile structures: PPI for mobile structures. Other components: PPI for warehouses.
6-12

Table 6.A—Summary of Methodology Used to Prepare Estimates of Private Fixed Investment in Structures Current-dollar estimates
Indicator series used to interpolate and extrapolate
Line in NIPA table group
5.4
Component
Benchmark year
Nonbenchmark years except the most
recent year
Most recent year
Current quarterly estimates
Quantity and price estimates
(quantity estimate prepared by deflating with the price index unless otherwise indicated)
Value put in place from MCS.
14 Manufacturing BEA’s benchmark I-O accounts, primarily based on value put in place from MCS.
Value put in place from MCS.
Same as for nonbenchmark years.
Same as for nonbenchmark years.
PPI for industrial buildings.
15 Power and communication: 16 Power: 17 Electric BEA’s benchmark I-O
accounts, primarily based on value put in place from MCS.
Value put in place from MCS.
Same as for nonbenchmark years.
Same as for nonbenchmark years.
For annual, weighted average of Handy-Whitmanconstruction cost indexes for electric light and power plants and for utility building; for quarterly, three-quarter moving average of Bureau of Reclamation composite index of construction costs.
18 Other power BEA’s benchmark I-O accounts, primarily based on value put in place from MCS.
Value put in place from MCS.
Same as for nonbenchmark years.
Same as for nonbenchmark years.
For annual, Handy-Whitman gas index of public utility construction costs; for quarterly, unweighted average of three-quarter moving average of Bureau of Reclamation composite index of construction costs and of PPI for steel pipe and tubes.
19 Communication BEA’s benchmark I-O accounts, primarily based on value put in place from MCS.
Value put in place from MCS.
Same as for nonbenchmark years.
Same as for nonbenchmark years.
For annual, AUS telephone plant cost index; for quarterly, Engineering News Record construction cost index.
20 Mining exploration, shafts, and wells: 21 Petroleum and
natural gas [For more detail, see “Technical Note: Special Estimates.”]
BEA’s benchmark I-O accounts, primarily based on expenditures data from EC.
Based on footage drilled from American Petroleum Institute (API) times base-yearcost per foot from Joint Association Survey on Drilling
Based on footage drilled from API times base-year cost per foot from JAS, reflated using weighted average of PPI for oil and
Based on footage drilled from API and from Department of Energy and on Baker Hughes rotary rig counts,
For annual, direct valuation method using footage drilled from API times base-year cost per foot from JAS; for quarterly, extrapolated using weighted average of API footage drilled, Department of Energy footage drilled, and Baker Hughes rotary rig counts.
6-13

Table 6.A—Summary of Methodology Used to Prepare Estimates of Private Fixed Investment in Structures Current-dollar estimates
Indicator series used to interpolate and extrapolate
Line in NIPA table group
5.4
Component
Benchmark year
Nonbenchmark years except the most
recent year
Most recent year
Current quarterly estimates
Quantity and price estimates
(quantity estimate prepared by deflating with the price index unless otherwise indicated)
Costs (JAS), reflated using weighted average of PPI for oil and gas wells, PPI for oil and gas field services, and Census Bureau annual capital expenditures survey.
gas wells and of PPI for oil and gas field services.
reflated using weighted average of PPI for oil and gas wells and of PPI for oil and gas field services.
22 Mining BEA’s benchmark I-O accounts, primarily based on expenditures data from EC.
Expenditures from Census Bureau annual capital expenditures survey.
BEA data on private investment in mining equipment.
Same as for most recent year.
Unweighted average of Census Bureau price index for new one-family houses under construction and of Turner Construction Co. building-cost index.
23 Other structures: 24 Religious BEA’s benchmark I-O
accounts, primarily based on value put in place from MCS.
Value put in place from MCS.
Same as for nonbenchmark years.
Same as for nonbenchmark years.
Unweighted average of Census Bureau price index for new one-family houses under construction and of Turner Construction Co. building-cost index.
25 Educational and vocational
BEA’s benchmark I-O accounts, primarily based on value put in place from MCS.
Value put in place from MCS.
Same as for nonbenchmark years.
Same as for nonbenchmark years.
PPI for new school construction.
26 Lodging BEA’s benchmark I-O accounts, primarily based on value put in place from MCS.
Value put in place from MCS.
Same as for nonbenchmark years.
Same as for nonbenchmark years.
Unweighted average of Census Bureau price index for new one-family houses under construction and of Turner Construction Co. building-cost index.
27 Amusement and recreation
BEA’s benchmark I-O accounts, primarily based on value put in place from MCS.
Value put in place from MCS.
Same as for nonbenchmark years.
Same as for nonbenchmark years.
Unweighted average of Census Bureau price index for new one-family houses under construction and of Turner Construction Co. building-cost index.
28 Transportation: 29 Air BEA’s benchmark I-O
accounts, primarily Value put in place from MCS.
Same as for nonbenchmark
Same as for nonbenchmark
Unweighted average of Census Bureau price index for new one-family houses under
6-14

Table 6.A—Summary of Methodology Used to Prepare Estimates of Private Fixed Investment in Structures Current-dollar estimates
Indicator series used to interpolate and extrapolate
Line in NIPA table group
5.4
Component
Benchmark year
Nonbenchmark years except the most
recent year
Most recent year
Current quarterly estimates
Quantity and price estimates
(quantity estimate prepared by deflating with the price index unless otherwise indicated)
based on value put in place from MCS.
years. years. construction and of Turner Construction Co. building-cost index.
30 Land3 BEA’s benchmark I-O accounts, primarily based on value put in place from MCS.
Value put in place from MCS.
Same as for nonbenchmark years.
Same as for nonbenchmark years.
Railroad: weighted average of BLS employment cost index for the construction industry, of Bureau of Reclamation construction cost trends for bridges and for power plants, of PPI for material and supply inputs to construction industries, and of PPI for communications equipment. Other components: unweighted average of Census Bureau price index for new one-family houses under construction and of Turner Construction Co. building-cost index.
31 Farm BEA’s benchmark I-O accounts, primarily based on value put in place from MCS.
Value put in place from MCS.
Same as for nonbenchmark years.
Same as for nonbenchmark years.
Unweighted average of Census Bureau price index for new one-family houses under construction and of Turner Construction Co. building-cost index.
32 Other4 BEA’s benchmark I-O accounts, primarily based on value put in place from MCS.
Value put in place from MCS.
Same as for nonbenchmark years.
Same as for nonbenchmark years.
Highways: Federal Highway Administration composite index for highway construction costs. Water: for annual, Handy-Whitman water index of public utility construction costs; for quarterly, Bureau of Reclamation composite index of construction costs. Other components: unweighted average of Census Bureau price index for new one-family houses under construction and of Turner Construction Co. building-cost index.
33 Brokers’ commissions on sale of structures
BEA’s benchmark I-O accounts, primarily based on revenue data from EC.
Value put in place for new nonresidential buildings from MCS.
Same as for nonbenchmark years.
Same as for nonbenchmark years.
PPI for real estate brokerage, nonresidential property sales and rental.
34 Net purchases of BEA’s benchmark I-O Data from GF and Data from federal Judgmental Unweighted average of BEA implicit price
6-15

Table 6.A—Summary of Methodology Used to Prepare Estimates of Private Fixed Investment in Structures Current-dollar estimates
Indicator series used to interpolate and extrapolate
Line in NIPA table group
5.4
Component
Benchmark year
Nonbenchmark years except the most
recent year
Most recent year
Current quarterly estimates
Quantity and price estimates
(quantity estimate prepared by deflating with the price index unless otherwise indicated)
used structures accounts, based on data from federal government agencies, primarily Government Services Administration, and from COG.
from federal government sources.
government agencies and judgmental trend.
trend. deflators for nonresidential buildings, for utilities, for farm buildings, and for other private structures.
35 Residential: 36 Permanent site: 37 Single-family
structures [For more detail, see “Technical Note: Special Estimates.”]
Value put in place, based on phased pattern of housing starts and average construction costs, from MCS.
Same as for benchmark year.
Same as for benchmark year.
Same as for benchmark year.
Census Bureau price index for new one-family houses under construction.
38 Multifamily structures
Value put in place from MCS.
Same as for benchmark year.
Same as for benchmark year.
Same as for benchmark year.
For annual, Census Bureau price index for multifamily houses; for quarterly, Census Bureau price index for new one-family houses under construction.
39 Other structures: 40 Manufactured
homes Commodity-flow method, starting with manufacturers’ shipments from EC.
Shipments from Manufactured Housing Institute times average retail price from Census Bureau monthly manufactured homes survey.
Same as for nonbenchmark years.
Same as for nonbenchmark years.
PPI for mobile structures.
41 Dormitories Value put in place from MCS.
Same as for benchmark year.
Same as for benchmark year.
Same as for benchmark year.
Census Bureau price index for new one-family houses under construction.
42 Improvements BEA’s benchmark I-O accounts, primarily based on value put in
Value put in place from MCS.
Same as for nonbenchmark years.
Sales data from Census Bureau monthly retail
Unweighted average of Census Bureau price index for new one-family houses under construction, of PPI for home maintenance and
6-16

Table 6.A—Summary of Methodology Used to Prepare Estimates of Private Fixed Investment in Structures Current-dollar estimates
Indicator series used to interpolate and extrapolate
Line in NIPA table group
5.4
Component
Benchmark year
Nonbenchmark years except the most
recent year
Most recent year
Current quarterly estimates
Quantity and price estimates
(quantity estimate prepared by deflating with the price index unless otherwise indicated)
place from MCS. trade survey and earnings data from BLS current employment statistics.
repair construction, and of BLS employment cost index for the construction industry.
43 Brokers’ commissions on sale of structures
Number of one-family houses sold times mean sales price, from Census Bureau data on new home sales and from National Assn. of Realtors data on existing home sales, times BEA estimate of average commission rate.
Same as for benchmark year.
Same as for benchmark year.
Same as for benchmark year.
PPI for real estate brokerage, residential property sales and rental. .
44 Net purchases of used structures
BEA’s benchmark I-O accounts, based on data from federal government agencies, primarily Federal Housing Administration, and from COG.
Data from GF and from federal government agencies.
Data from federal government agencies and judgmental trend.
Judgmental trend.
Census Bureau price index for new one-family houses under construction.
ASM Annual survey of manufactures, Census Bureau BEA Bureau of Economic Analysis BLS Bureau of Labor Statistics COG Census of governments, Census Bureau CPI Consumer price index, BLS EC Economic census, Census Bureau GF Annual survey of government finances, Census Bureau I-O Input-output accounts, BEA MCS Monthly construction spending, Census Bureau
6-17

6-18
PPI Producer price index, BLS 1 Consists of office buildings, except those constructed at manufacturing sites and those constructed by power utilities for their own use. Includes all financial buildings. 2 Includes buildings and structures used by the retail, wholesale, and selected service industries. Consists of auto dealerships, garages, service stations, drug stores, restaurants, mobile structures, and other structures used for commercial purposes. Bus or truck garages are included in transportation. 3 Consists primarily of railroads. 4 Includes water supply, sewage and waste disposal, public safety, highway and street, and conservation and development.

Table 6.B—Summary of Methodology Used to Prepare Estimates of Private Fixed Investment in Equipment and Software Current-dollar estimates
Indicator series used to interpolate and extrapolate
Line in NIPA table group
5.5
Component
Benchmark year
Nonbenchmark years except the most
recent year
Most recent year
Current quarterly estimates
Quantity and price estimates
(quantity estimate prepared by deflating with the price index unless otherwise indicated)
2 Nonresidential equipment and software: 3 Information processing equipment and software: 4 Computers, software, and communication: 5 Computers and
peripheral equipment
Commodity-flow method, starting with manufacturers’ shipments from EC.
Abbreviated commodity-flow method, starting with manufacturers’ shipments from ASM.
Abbreviated commodity-flow method, starting with manufacturers’ shipments based on Federal Reserve Board industrial production index and on MSM.
Same as for most recent year.
PPI for host computers, multiusers, PPI for portablecomputers, laptops, PDAs, and other single user computers, PPI for personal computers and workstations (except portable computers), PPI for computer storage devices, PPI for computer terminals, and PPI for other computer peripheral equipment; IPI for computers, IPI for computer storage devices, IPI for computer displays, including monitors and terminals, and IPI for computer printers.
6 Software:1 Prepackaged
software Commodity-flow method, starting with industry receipts data from EC.
Abbreviated commodity-flow method, starting with industry receipts data from Census Bureau service annual survey.
Same as for nonbenchmark years.
For third estimate, QSS total revenue data; for second and advance estimates, receipts from company reports.
BEA price index based on PPI for application software publishing.
Custom software Commodity-flow method, starting with industry receipts data from EC.
Abbreviated commodity-flow method, starting with industry receipts data from Census Bureau service annual survey.
Same as for nonbenchmark years.
For third estimate, QSS total revenue data; for second and advance estimates, receipts from company reports.
Weighted average of the prepackaged software price and of an input-cost index based on BLS data on wage rates for computer programmers and systems analysts and on intermediate input costs associated with the production of software.
Own-account software [For more
Production costs based on BLS
Production costs based on BLS
Same as for nonbenchmark
Based on BLS current
Weighted average of the prepackaged software price and of an input-cost index based on BLS data
6-19

Table 6.B—Summary of Methodology Used to Prepare Estimates of Private Fixed Investment in Equipment and Software Current-dollar estimates
Indicator series used to interpolate and extrapolate
Line in NIPA table group
5.5
Component
Benchmark year
Nonbenchmark years except the most
recent year
Most recent year
Current quarterly estimates
Quantity and price estimates
(quantity estimate prepared by deflating with the price index unless otherwise indicated)
detail, see “Technical Note: Special Estimates.”]
employment occupational survey data and on EC data.
employment occupational survey data.
years. employment statistics data.
on wage rates for computer programmers and systems analysts and on intermediate input costs associated with the production of software.
7 Communications equipment
Commodity-flow method, starting with manufacturers’ shipments from EC.
Abbreviated commodity-flow method, starting with manufacturers’ shipments from ASM.
Abbreviated commodity-flow method, starting with manufacturers’ shipments from MSM.
Same as for most recent year.
For annual, Federal Reserve Board (FRB) price indexes for data networking equipment, telephone switching equipment, carrier line equipment, and wireless networking equipment; PPI for telephone apparatus, PPI for communications equipment, PPI for broadcast, studio, and related electronic equipment, PPI for search, detection, navigation, and guidance systems and equipment, and PPI for engineering services; IPI for telecommunications equipment and IPI for scientific and medical machinery. For current quarterly, same as for annual except PPI for host computers price index in place of FRB price indexes.
8 Medical equipment and instruments
Commodity-flow method, starting with manufacturers’ shipments from EC.
Abbreviated commodity-flow method, starting with manufacturers’ shipments from ASM.
Abbreviated commodity-flow method, starting with manufacturers’ shipments from MSM.
Same as for most recent year.
PPI for surgical and medical instruments, PPI for dental equipment and supplies, PPI for irradiation apparatus, PPI for electromedical apparatus, and PPI for engineering services; IPI for scientific and medical machinery.
9 Nonmedical instruments
Commodity-flow method, starting with manufacturers’ shipments from EC.
Abbreviated commodity-flow method, starting with manufacturers’ shipments from ASM.
Abbreviated commodity-flow method, starting with manufacturers’ shipments from MSM.
Same as for most recent year.
PPI for irradiation apparatus, PPI for laboratory apparatus and furniture, PPI for industrial process variable instruments, PPI for integrating and totalizing meters for gas and liquids, PPI for physical properties testing and inspection equipment and kinematic testing and measuring equipment, PPI for commercial, geophysical, meteorological, and general-purpose instruments and equipment, and PPI for engineering services; IPI for scientific and medical machinery and IPI for
6-20

Table 6.B—Summary of Methodology Used to Prepare Estimates of Private Fixed Investment in Equipment and Software Current-dollar estimates
Indicator series used to interpolate and extrapolate
Line in NIPA table group
5.5
Component
Benchmark year
Nonbenchmark years except the most
recent year
Most recent year
Current quarterly estimates
Quantity and price estimates
(quantity estimate prepared by deflating with the price index unless otherwise indicated)
measuring, testing, and control instruments.
10 Photocopy and related equipment
Commodity-flow method, starting with manufacturers’ shipments from EC.
Abbreviated commodity-flow method, starting with manufacturers’ shipments from ASM.
Abbreviated commodity-flow method, starting with manufacturers’ shipments from MSM.
Same as for most recent year.
BEA photocopy equipment price index, PPI for analytical laboratory instruments, PPI for optical instruments and lenses, and PPI for engineering services; IPI for recreational equipment and materials.
11 Office and accounting equipment
Commodity-flow method, starting with manufacturers’ shipments from EC.
Abbreviated commodity-flow method, starting with manufacturers’ shipments from ASM.
Abbreviated commodity-flow method, starting with manufacturers’ shipments from MSM.
Same as for most recent year.
PPI for calculating and accounting machines, PPI for office machinery, and PPI for engineering services; IPI for business machinery and equipment, except computers.
12 Industrial equipment:
13 Fabricated metal products
Commodity-flow method, starting with manufacturers’ shipments from EC.
Abbreviated commodity-flow method, starting with manufacturers’ shipments from ASM.
Abbreviated commodity-flow method, starting with manufacturers’ shipments from MSM.
Same as for most recent year.
Department of Energy reported prices of uranium and uranium enrichment services, PPI for metal shipping barrels, drums, kegs, and pails, PPI for fabricated plate work (boiler shops), PPI for power boiler and heat exchanger, PPI for metal tank, heavy gauge, PPI for other metal valve and pipe fitting, PPI for fabricated pipe and pipe fitting, PPI for all other miscellaneous fabricated metal products, and PPI for engineering services; IPI for finished metals related to durable goods and IPI for taps, cocks, valves, and similar appliances.
14 Engines and turbines
Commodity-flow method, starting with manufacturers’ shipments from EC.
Abbreviated commodity-flow method, starting with manufacturers’
Abbreviated commodity-flow method, starting with manufacturers’
Same as for most recent year.
PPI for turbine and turbine generator set units, PPI for gasoline engines, PPI for diesel, semi-diesel, and dual fuel engines (except automotive), PPI for other engine equipment manufacturing, and PPI for
6-21

Table 6.B—Summary of Methodology Used to Prepare Estimates of Private Fixed Investment in Equipment and Software Current-dollar estimates
Indicator series used to interpolate and extrapolate
Line in NIPA table group
5.5
Component
Benchmark year
Nonbenchmark years except the most
recent year
Most recent year
Current quarterly estimates
Quantity and price estimates
(quantity estimate prepared by deflating with the price index unless otherwise indicated)
shipments from ASM. shipments from MSM.
engineering services; IPI for generators, transformers, and accessories and IPI for spark-ignition internal combustion piston engines.
15 Metalworking machinery
Commodity-flow method, starting with manufacturers’ shipments from EC.
Abbreviated commodity-flow method, starting with manufacturers’ shipments from ASM.
Abbreviated commodity-flow method, starting with manufacturers’ shipments from MSM.
Same as for most recent year.
PPI for metal cutting machine tools, PPI for metal grinding, polishing, buffing, honing, and lapping machines, PPI for other metal cutting machine tools, PPI for parts for metal cutting machine tools (sold separately) and rebuilt machine tools, PPI for metal forming machine tools, PPI for metal punching and shearing (power and manual), and bending and forming machines (power only), PPI for metalworking presses (except forging and die-stamping presses), PPI for special tool, die, jig, and fixture, PPI for rolling mill machinery and equipment, PPI for assembly machines, and PPI for engineering services; IPI for metal working machine tools and rolling mills.
16 Special industry machinery, n.e.c.
Commodity-flow method, starting with manufacturers’ shipments from EC.
Abbreviated commodity-flow method, starting with manufacturers’ shipments from ASM.
Abbreviated commodity-flow method, starting with manufacturers’ shipments from MSM.
Same as for most recent year.
PPI for food product machinery, PPI for textile machinery, PPI for sawmill and woodworking machinery, PPI for paper industries machinery, PPI for printing machinery and equipment, PPI for chemical manufacturing machinery, equipment, and parts, PPI for plastics working machinery and equipment, PPI for rubber working machinery and equipment, PPI for semiconductor machinery and parts, and PPI for engineering services; IPI for other industrial machines and IPI for industrial and service machinery.
17 General industrial, including materials handling, equipment
Commodity-flow method, starting with manufacturers’ shipments from EC.
Abbreviated commodity-flow method, starting with manufacturers’ shipments from ASM.
Abbreviated commodity-flow method, starting with manufacturers’ shipments from
Same as for most recent year.
PPI for conveyor and conveying equipment, PPI for industrial truck, trailer, and stacker, PPI for power-driven handtools, PPI for packing, packaging, and bottling machinery, PPI for pump and pumping equipment, PPI for air and gas compressors and
6-22

Table 6.B—Summary of Methodology Used to Prepare Estimates of Private Fixed Investment in Equipment and Software Current-dollar estimates
Indicator series used to interpolate and extrapolate
Line in NIPA table group
5.5
Component
Benchmark year
Nonbenchmark years except the most
recent year
Most recent year
Current quarterly estimates
Quantity and price estimates
(quantity estimate prepared by deflating with the price index unless otherwise indicated)
MSM. vacuum pumps, PPI for industrial spraying equipment, PPI for industrial and commercial fan and blower, PPI for air purification equipment, PPI for industrial process furnaces and ovens and industrial electrical heating equipment, PPI for scale and balance, except laboratory, equipment, PPI for welding and soldering equipment, and PPI for engineering services; IPI for oil drilling, mining, and construction machinery, IPI for metal working machine tools and rolling mills, and IPI for industrial and service machinery.
18 Electrical transmission, distribution, and industrial apparatus
Commodity-flow method, starting with manufacturers’ shipments from EC.
Abbreviated commodity-flow method, starting with manufacturers’ shipments from ASM.
Abbreviated commodity-flow method, starting with manufacturers’ shipments from MSM.
Same as for most recent year.
PPI for electrical measuring and integrating instruments, PPI for electric power and specialty transformer, PPI for switchgear and switchboard apparatus, PPI for motors and generators, PPI for relay and industrial control equipment, PPI for semiconductor power conversion apparatus, and PPI for engineering services; IPI for nonelectrical machinery, IPI for electric generating equipment, and IPI for electric apparatus and parts, n.e.c.
19 Transportation equipment: 20 Trucks, buses, and truck trailers: 21 Light trucks
(including utility vehicles)2 [For more detail, see the technical note to “Chapter 5: Personal Consumption Expenditures.”]
Based on unit sales from Wards’ Automotive Reports and registration data from R.L. Polk & Co. times average sales price from J.D. Power and Assoc.
Same as for benchmark year.
Same as for benchmark year.
Same as for benchmark year.
CPI for new trucks.
6-23

Table 6.B—Summary of Methodology Used to Prepare Estimates of Private Fixed Investment in Equipment and Software Current-dollar estimates
Indicator series used to interpolate and extrapolate
Line in NIPA table group
5.5
Component
Benchmark year
Nonbenchmark years except the most
recent year
Most recent year
Current quarterly estimates
Quantity and price estimates
(quantity estimate prepared by deflating with the price index unless otherwise indicated)
22 Other trucks, buses, and truck trailers2
Commodity-flow method, starting with manufacturers’ shipments from EC.
Abbreviated commodity-flow method, starting with manufacturers’ shipments from ASM.
Heavy trucks: unit sales from Wards’ Automotive Reportstimes average sales price based on PPI for trucks, over 14,000 lbs. gross vehicle weight. Truck trailers: shipments from Americas Commercial Transportation Research Co.
Same as for most recent year.
PPI for trucks, over 14,000 lbs. gross vehicle weight, PPI for truck, bus, car, and other vehicle bodies, for sale separately, PPI for truck trailers and chassis, with axle rating of 10,000 lbs. or more, PPI for truck trailers and chassis, with axle rating of less than 10,000 lbs., and PPI for engineering services; IPI for automotive vehicles, parts, and engines.
23 Autos2 [For more detail, see the technical note to “Chapter 5: Personal Consumption Expenditures.”]
Based on unit sales from Wards’ Automotive Reports and registration data from R.L. Polk & Co. times average sales price from J.D. Power and Assoc.
Same as for benchmark year.
Same as for benchmark year.
Same as for benchmark year.
CPI for new autos.
24 Aircraft Commodity-flow method, starting with manufacturers’ shipments from EC.
Abbreviated commodity-flow method, starting with manufacturers’ shipments from ASM
Abbreviated commodity-flow method, starting with manufacturers’ shipments from Census Bureau current industrial report.
Same as for most recent year.
PPI for civilian aircraft, PPI for aircraft engines and engine parts, and PPI for aeronautical, nautical, and navigational instruments.
25 Ships and boats Commodity-flow method, starting with manufacturers’
Abbreviated commodity-flow method, starting with
Abbreviated commodity-flow method, starting
Same as for most recent year.
PPI for ship building and repairing, PPI for boat building, PPI for outboard motorboats, including commercial and military, and PPI for inboard
6-24

Table 6.B—Summary of Methodology Used to Prepare Estimates of Private Fixed Investment in Equipment and Software Current-dollar estimates
Indicator series used to interpolate and extrapolate
Line in NIPA table group
5.5
Component
Benchmark year
Nonbenchmark years except the most
recent year
Most recent year
Current quarterly estimates
Quantity and price estimates
(quantity estimate prepared by deflating with the price index unless otherwise indicated)
shipments from EC. manufacturers’ shipments from ASM.
with manufacturers’ shipments from MSM.
motorboats, including commercial and military.
26 Railroad equipment Commodity-flow method, starting with manufacturers’ shipments from EC.
Abbreviated commodity-flow method, starting with manufacturers’ shipments from ASM.
Abbreviated commodity-flow method, starting with manufacturers’ shipments from MSM.
Same as for most recent year.
PPI for railroad rolling stock, PPI for locomotives and locomotive parts, PPI for passenger and freight train cars, and PPI for engineering services.
27 Other equipment: 28 Furniture and
fixtures Commodity-flow method, starting with manufacturers’ shipments from EC.
Abbreviated commodity-flow method, starting with manufacturers’ shipments from ASM.
Abbreviated commodity-flow method, starting with manufacturers’ shipments from MSM.
Same as for most recent year.
PPI for nonupholstered wood household furniture, PPI for upholstered household furniture, PPI for metal household furniture, PPI for mattresses, PPI for wood office furniture, PPI for institutional furniture, PPI for showcases, partitions, shelving, and lockers, PPI for window shades and window shade accessories, and PPI for engineering services; IPI for furniture, household items.
29 Agricultural machinery
Commodity-flow method, starting with manufacturers’ shipments from EC.
Abbreviated commodity-flow method, starting with manufacturers’ shipments from ASM.
Abbreviated commodity-flow method, starting with manufacturers’ shipments from MSM.
Same as for most recent year.
PPI for farm machinery and equipment, PPI for farm-type (power take-off hp) wheel tractors, PPI for agricultural equipment, and PPI for engineering services; IPI for agricultural machinery and equipment.
30 Construction machinery
Commodity-flow method, starting with manufacturers’ shipments from EC.
Abbreviated commodity-flow method, starting with manufacturers’ shipments from ASM.
Abbreviated commodity-flow method, starting with manufacturers’ shipments from MSM.
Same as for most recent year.
PPI for construction machinery, PPI for mixers, pavers, and related equipment, PPI for tractor shovel loaders, PPI for graders, rollers, compactors, and forklifts, and PPI for engineering services; IPI for excavating, paving, and construction machinery.
31 Mining and oilfield machinery
Commodity-flow method, starting with
Abbreviated commodity-flow
Abbreviated commodity-flow
Same as for most recent year.
PPI for mining machinery and equipment, PPI for oil and gas field machinery and equipment, PPI for
6-25

Table 6.B—Summary of Methodology Used to Prepare Estimates of Private Fixed Investment in Equipment and Software Current-dollar estimates
Indicator series used to interpolate and extrapolate
Line in NIPA table group
5.5
Component
Benchmark year
Nonbenchmark years except the most
recent year
Most recent year
Current quarterly estimates
Quantity and price estimates
(quantity estimate prepared by deflating with the price index unless otherwise indicated)
manufacturers’ shipments from EC.
method, starting with manufacturers’ shipments from ASM.
method, starting with manufacturers’ shipments from MSM.
pump and pumping equipment, and PPI for engineering services; IPI for oil drilling, mining, and construction machinery.
32 Service industry machinery
Commodity-flow method, starting with manufacturers’ shipments from EC.
Abbreviated commodity-flow method, starting with manufacturers’ shipments from ASM.
Abbreviated commodity-flow method, starting with manufacturers’ shipments from MSM.
Same as for most recent year.
PPI for automatic vending machines; PPI for commercial laundry and drycleaning industry, PPI for commercial refrigerators and related equipment, PPI for refrigeration condensing units, PPI for measuring and dispensing pumps, PPI for commercial and service industry machinery, PPI for other commercial and service machinery, and PPI for engineering services; IPI for industrial and service machinery and IPI for nonelectrical machinery.
33 Electrical equipment, n.e.c.
Commodity-flow method, starting with manufacturers’ shipments from EC.
Abbreviated commodity-flow method, starting with manufacturers’ shipments from ASM.
Abbreviated commodity-flow method, starting with manufacturers’ shipments from MSM.
Same as for most recent year.
PPI for electric (including microwave) household ranges, ovens, surface cooking units, and equipment, PPI for household refrigerators, including combination refrigerator-freezers, PPI for small electric household appliances, PPI for all other miscellaneous special industry machinery and equipment, PPI for household water heaters, except electric, PPI for residential electric lighting fixtures, PPI for commercial and institutional-type electric lighting fixtures, including parts and accessories, PPI for industrial-type electric lighting fixtures, including parts and accessories, PPI for all other miscellaneous electric and nonelectric lighting equipment, PPI for storage batteries, PPI for miscellaneous electrical equipment, and PPI for engineering services; IPI for household and kitchen appliances, IPI for other industrial machines, IPI for electric generating equipment, and IPI for scientific and medical machinery.
6-26

Table 6.B—Summary of Methodology Used to Prepare Estimates of Private Fixed Investment in Equipment and Software Current-dollar estimates
Indicator series used to interpolate and extrapolate
Line in NIPA table group
5.5
Component
Benchmark year
Nonbenchmark years except the most
recent year
Most recent year
Current quarterly estimates
Quantity and price estimates
(quantity estimate prepared by deflating with the price index unless otherwise indicated)
34 Other Commodity-flow method, starting with manufacturers’ shipments from EC.
Abbreviated commodity-flow method, starting with manufacturers’ shipments from ASM.
Abbreviated commodity-flow method, starting with manufacturers’ shipments from MSM.
Same as for most recent year.
PPI for carpets and rugs, PPI for farm machinery and equipment, PPI for commercial turf and grounds care equipment, PPI for lawn and garden equipment, PPI for motorcycles, including three-wheel motorbikes, PPI for travel trailers, PPI for self-propelled golf carts and industrial in-plant personnel carriers, PPI for automobile and light truck trailers, PPI for musical instruments, PPI for sporting and athletic goods, PPI for electric signs, PPI for nonelectric signs and displays, PPI for all other miscellaneous equipment, and PPI for engineering services; IPI for textile supplies and related materials, IPI for agricultural machinery and equipment, IPI for automotive vehicles, parts, and engines, IPI for optical, photo, measuring, medical, and musical instruments, and timepieces, IPI for toys, shooting and sporting goods, and IPI for durables, manufactured.
35 Less: Sale of equipment scrap, excluding autos
BEA’s benchmark I-O accounts, primarily based on wholesale trade data from EC.
Quantity sold times unit price, both from U.S. Geological Survey.
Same as nonbenchmark years.
Private fixed investment in nonresidential equipment.
PPI for ferrous metal scrap and PPI for nonferrous metal scrap.
36 Residential equipment
Commodity-flow method, starting with manufacturers’ shipments from EC.
Retail control method, using retail sales from Census Bureau annual retail trade survey.
Retail control method, using retail sales from Census Bureau monthly retail trade survey.
Same as for most recent year.
CPI for furniture and bedding, CPI for major appliances, CPI for floor coverings, and CPI for televisions.
ASM Annual survey of manufactures, Census Bureau BEA Bureau of Economic Analysis BLS Bureau of Labor Statistics CPI Consumer price index, BLS EC Economic census, Census Bureau
6-27

6-28
IPI Import price index, BLS MSM Monthly survey of manufacturers’ shipments, inventories, and orders, Census Bureau n.e.c. Not elsewhere classified PPI Producer price index, BLS QSS Quarterly service annual survey, Census Bureau 1 Excludes software “embedded,” or bundled, in computers and other equipment. 2 Includes net purchases of used vehicles.

Technical Note: Special Estimates
This section provides additional detail on the sources and methods used to
estimate the following key components of private fixed investment (PFI): petroleum and natural gas, new single-family structures, own-account software, and used equipment.
Petroleum and natural gas This PFI component includes all costs incurred in drilling oil and gas wells, regardless of whether the drilling activities were successful or unsuccessful.
For benchmark years, the current-dollar estimates of exploration expenditures and of all other drilling costs are prepared separately, based on data from the Census Bureau’s economic census.
For nonbenchmark years except the most recent year, the current-dollar estimates
are prepared by interpolation and extrapolation using indicator series.1 For estimates before 2006, the indicator series is based on data on footage drilled (onshore and offshore) from the American Petroleum Institute (API) and on data on the average cost per foot from a survey of drilling costs conducted by the API and the Independent Petroleum Association and published in the Joint Association Survey on Drilling Costs (JAS). Beginning with 2006, the estimates of exploration expenditures are prepared by reflating quantity estimates that are based on data on the count of seismic crews from the U.S. Department of Energy (DOE) using the PPI for oil and gas field services. Beginning with 2006, the estimates of all other drilling costs are based on API data on footage drilled times JAS data on base-year cost per foot, reflated using the PPIs for oil and gas well drilling and for oil and gas field services and data for the oil and gas extraction industry from the Census Bureau’s annual capital expenditures survey.
The current-dollar estimates for the most recent year and for the current quarters
are prepared by “reflating” the quantity estimates (described next) by multiplying them by a weighted average of the PPI for oil and gas well drilling and the PPI for oil and gas field services.
Quantity estimates. The annual estimates of real petroleum and natural gas well
drilling are prepared using the direct valuation method.2 The estimates of exploration expenditures are based on the DOE data on active seismic crews, and the estimates of all other drilling costs are based on API footage drilled and on the base-year average cost per foot from the JAS. The current quarterly estimates of real petroleum and natural gas well drilling are based on a weighted average of the API data on footage drilled, the DOE data on footage drilled, and data from Baker Hughes on rotary rig counts.
1 For a general description of this method, see the section “Interpolation and extrapolation using an indicator series” in “Chapter 4: Estimating Methods.” 2 For a general description of this method, see the section “Estimates for detailed components” in chapter 4.
6-29

New single-family structures
This PFI component measures the construction of fully detached units and of other units (such as rowhouses and townhouses) that are separated from adjacent units by a ground-to-roof wall and that do not share heating/air conditioning systems or other interstructural public utilities (such as water supply, power supply, or sewage disposal lines). The value of new single-family construction excludes the value of land, marketing costs, closing costs, and movable appliances. The annual and quarterly estimates of investment in new single-family structures are based on the Census Bureau’s monthly construction statistics on the value of new construction put in place for one-unit structures. The Census Bureau determines the construction cost of new single-family houses started each month using data from its monthly survey of new residential construction. Construction costs are estimated separately for units built to be sold or rented and for units built by an owner or for an owner on contract. The estimated cost of all single-family units started is then distributed into monthly value put in place by applying fixed 12-month patterns of monthly construction progress.3 The patterns vary somewhat depending on the particular month the unit is started; in general, the progress pattern assumes that about 16 percent of the project is completed in the first month, about 23 percent in the second month, about 20 percent in the third month, about 15 percent in the fourth month, about 10 percent in the fifth month, and the remainder is distributed in declining amounts over the succeeding 7 months.
For the advance current quarterly estimate, only 2 months of value-put-in-place data are available. BEA estimates the value put in place for the third month, primarily based on data on housing starts for that month and on the Census Bureau’s construction progress pattern.
Quantity estimates. The estimates of investment in real new single-family
structures are prepared by deflation, using the Census Bureau price index for new one-family houses under construction.
3 For more information, see “Construction Methodology” at http//:www.census.gov/const/C30/methodology.pdf.
6-30

Own-account software This PFI component measures the software that is produced by private businesses
for their own use.4 Own-account software consists of expenditures for new or significantly enhanced software that the business enterprise develops in-house rather than purchases from companies that are primarily engaged in software development. Own-account software includes the development of software originals from which copies are made for sale or incorporation into other products (such as motor vehicles or appliances), but it does not include the software copies.
The commodity-flow method is not used to prepare the estimates of expenditures
for own-account software. Instead, these expenditures are measured as the sum of production costs, which are limited to compensation (wage and nonwage) of employees and to the costs of intermediate inputs.
The estimates of wages for all years are derived by multiplying the number of
programmers and systems analysts in selected industries times the wage rate in those industries. Wages are reduced by half under the assumption that these programmers and analysts spend only about half their time working on the development of new or enhanced own-account software. In addition, wages are reduced by subtracting the portion of wages of programmers and analysts employed by the “computer systems design and related services industry” that represents the production of custom software for sale; sales of the custom software produced by this industry are already included in the PFI estimates of custom software. The data on the number of programmers and analysts by industry and the data on wages by occupation are from the BLS occupational employment statistics survey.
The estimates of nonwage compensation are based on relationships between wage
and nonwage compensation derived from NIPA data by industry. The estimates of input costs are based on relationships between intermediate inputs and compensation that are derived primarily from the Census Bureau’s economic census.
The estimates of expenditures for own-account software for the current quarters
are prepared by extrapolation, using an index of employment in four industries for which computer-related occupations account for a relatively high portion of total employment. The index is derived using BLS current employment data for computer systems design and related services; software publishers; data processing, hosting, and related services; and computer and peripheral equipment manufacturing.5
4 The treatment of business and government purchases of software and of own-account production of software as investment was introduced in the 1999 NIPA comprehensive revision; see Brent R. Moulton, Robert P. Parker, and Eugene P. Seskin, “A Preview of the Comprehensive Revision of the National Income and Product Accounts: Definitional and Classificational Changes,” Survey 79 (August 1999): 8–11. 5 This methodology was introduced in the 2010 annual revision of the NIPAs; see Eugene P. Seskin and Shelly Smith, “Annual Revision of the National Income and Product Accounts,” Survey 90 (August 2010): 22–23.
6-31

Quantity estimates. The estimates of real expenditures for own-account software are derived by deflation, using a weighted average of a BEA input-cost index and of a BEA price index for prepackaged software. The input-cost index is based on BLS data on wage rates for computer programmers and systems analysts and on a BEA index of intermediate input costs associated with the production of software. The prepackaged software price index is based on the PPI for application software publishing.
6-32

6-33
Used equipment Aside from trade margins and commissions earned by the services of brokers and
dealers, transactions in secondhand fixed assets among sectors do not reflect current production activity and so do not affect gross domestic product. However, these transfers of assets between sectors are recorded in the NIPAs so that the estimates of fixed investment are consistent with the estimates of the net stock of private fixed assets. Moreover, the estimates of saving by the individual sectors of the economy must reflect purchases of used equipment as well as purchases of new equipment. Thus, net purchases of used equipment by private business from households, governments, and the rest of the world are added to investment in equipment and software and are subtracted (as net sales) from personal consumption expenditures, from government fixed investment, and from net exports, respectively. Sales of used motor vehicles by business to persons account for the bulk of these intersectoral transactions; thus in the NIPAs, total net purchases of equipment by private business is negative. (For a detailed description of the methodology used to prepare the NIPA estimates for net purchases of used motor vehicles, see the technical note in “Chapter 5: Personal Consumption Expenditures”).
For benchmark years, transactions in used equipment by commodity (other than
motor vehicles) are derived as the sum of the trade margins on sales of used equipment and of net sales of used equipment between business and the other sectors of the economy. The trade margins are estimated using information from the Census Bureau’s economic census. Net sales between business and persons are also from the economic census. Net sales between business and the federal government are from federal agency source data, primarily from the Government Services Administration; net sales between business and state and local governments are from the Census Bureau’s census of governments. Net exports of used equipment are based on Census Bureau foreign trade data.
For nonbenchmark years other than the most recent year, net exports are based on
foreign trade data, net sales between business and government are from federal agency source data and from the annual survey of government finances, and trade margins and net sales between business and other sectors are prepared by extrapolation using the change in new nonresidential equipment.
For the most recent year and for the current quarters, the estimates by component
are prepared by extrapolation using the change in new nonresidential equipment for that component.
Quantity estimates. For all years and for current quarters, the estimates of real net
transactions in used equipment by component are prepared by deflating the current-dollar estimates using the component deflators listed in table 6.B.