proactive financial reporting enforcement and firm … · proactive financial reporting enforcement...
TRANSCRIPT
Proactive Financial Reporting Enforcement and Firm Value
By HANS B. CHRISTENSEN, LISA YAO LIU, and MARK MAFFETT*
February 2017
Abstract: We examine the effect of increasing the intensity of proactive enforcement of
financial reporting regulation on equity values. Theoretically, it is unclear whether the benefits to
shareholders of an increase in enforcement outweigh the costs. Using a setting in the United
Kingdom where a regulator periodically selects specific market sectors for increased scrutiny, we
find that an approximately 150% increase in the likelihood of regulator-initiated reviews of
financial reports on average (at the median) reduces equity values by 2.0% (1.7%). Reductions in
equity values are greater for firms listed on the self-regulated AIM market. Further evidence
suggests that the permanent increases in compliance costs and myopic investment arising from
increased enforcement contribute to the observed declines in equity values.
Keywords: Financial reporting enforcement, costs and benefits of enforcement, unintended
consequences of regulation.
JEL Classification: G14, G18, G38, K22, M41, M48
_______________________________________________
* Christensen, Liu, and Maffett: University of Chicago Booth School of Business, 5807 S. Woodlawn Ave. Chicago,
IL 60637 ([email protected]; [email protected]; [email protected]). We
appreciate helpful comments from Ralph Ewert, Eugene Fama, Richard Frankel, Katherine Schipper, Brian
Singleton-Green, Peter Pope, Suhas Sridharan, Martin Walker, Annika Wang, Steve Young, and workshop
participants from the University of Washington St. Louis, the 2016 SMU Accounting Research Symposium, the
2017 FARS meeting, and UCLA. Christensen, Liu, and Maffett gratefully acknowledge financial support from the
University of Chicago Booth School of Business. This work is supported by the Centel Foundation/Robert P. Reuss
Faculty Research Fund at the University of Chicago Booth School of Business.

1
1. Introduction
In most developed countries, the extent of public enforcement of financial reporting
regulation has increased dramatically over the past two decades. Increased public oversight is
typically justified by externalities and difficulties privately enforcing disclosure-policy
commitments. In the presence of such frictions, a publicly-enforced, mandatory-reporting regime
could increase aggregate shareholder wealth by bringing disclosure closer to the value-
maximizing level. A substantial body of research documents capital-market benefits of tighter
public enforcement (see Leuz and Wysocki 2016 for a review). Yet, despite this evidence, there
are reasons to be skeptical about the net benefits to shareholders of increasing public oversight.
First, the case for public enforcement depends crucially on the presumed inability of
private contracting and market discipline to mitigate the factors that give rise to suboptimal
financial reporting. Although private solutions are likely imperfect, the economic importance of
the frictions such mechanisms leave unresolved is unclear. Second, public oversight is also
subject to problems, such as inefficient bureaucracies and regulatory capture, which could also
lead to outcomes that reduce firm value (Stigler 1971; Watts and Zimmerman 1978, 1986).
Moreover, even if public regulators are effective in enforcing penalties for observed violations, it
is less clear whether they have the resources and expertise to proactively identify and correct
reporting deficiencies market participants cannot. Although prior research acknowledges the
existence of enforcement costs, there is little direct evidence on their magnitudes, and hence on
the net benefits of proactive public enforcement of financial-reporting regulation.1
1 While there are some notable exceptions, including, for example, papers that focus on the net benefits of Sarbanes-
Oxley (SOX) (e.g., Zhang 2007; Li et al. 2008), these papers examine bundled regulatory changes and do not
specifically focus on proactive financial reporting enforcement.
2
In this paper, we exploit a setting with unanticipated, within-country changes in
enforcement intensity to provide evidence on whether, and under what conditions, additional
proactive financial reporting enforcement (FRE) increases equity values. We examine the
proactive focus sector review program of the Financial Reporting Review Panel (FRRP)—a
regulatory body charged with ensuring compliance with accounting standards in the U.K. From
2004 to 2011, the FRRP annually selected a subset of “focus sectors,” within which companies
were subject to enhanced regulatory scrutiny in the form of a higher likelihood of having an
FRRP review of their financial statements. The establishment of this proactive program
represents a substantial departure from the prior (reactive) regime, where most inspection and
enforcement actions arose as a result of complaints from investors or other interested parties (see
Brown and Tarca 2007).
Similar to the Securities and Exchange Commission’s (SEC) comment and review
process, deficiencies identified during an FRRP review can lead to prospective reporting
changes, accounting restatements, and/or public announcement of the deficiency through a press
release. In an effort to deter misreporting, the FRRP publicly announces its focus sectors, usually
consisting of four to five targeted industries, in a press release prior to the end of the fiscal year
that will be subject to the planned increase in regulatory scrutiny. We estimate that there is a
nearly 150% increase in enforcement intensity for firms in focus sectors relative to those in non-
focus sectors.
Our empirical identification strategy exploits the sharp increase in expected enforcement
intensity for focus industries relative to non-focus industries by comparing changes in the market
value of equity in a narrow window around the eight FRRP focus-sector announcements. To
mitigate the potential influence of confounding industry events that coincide with the
3
announcements, we adjust U.K. returns using U.S. (and alternatively German) returns from the
same industry. Hence, our identification strategy controls for concurrent events that are U.K.
specific (focus relative to non-focus sector returns) and industry specific (U.K. relative to
U.S./German returns). Because the treatment is determined by industry, our estimates include
any potential positive within-industry externalities, but not cross-industry effects.2
Using an eight-day window around the announcement date, we find that an increase in
expected enforcement intensity leads to an average (median) reduction in the market value of
equity of 2.0% (1.7%) for focus-sector firms relative to non-focus-sector firms. For the average
(median) focus-sector firm, the loss in equity value is approximately $32 ($3) million relative to
non-focus-sector firms. While this effect is economically large, it is important to recognize that
our estimate captures the combined impact of the increase in enforcement for focus-sector firms
and the decrease in enforcement for non-focus-sector firms. Looking individually at each
announcement, the average (median) difference in returns is negative in seven (six) out of eight
years and significantly so in five (six) years, indicating that the sign of the effect is unambiguous.
Next, we examine whether variation in the level of regulation a firm chooses explains the
market reactions to increased public oversight. On the London Stock Exchange (LSE) there are
two core segments, the Main Market, on which listed firms are subject to all aspects of securities
regulation, and the Alternative Investment Market (AIM), which is a self-regulated exchange
where firms are subject to less public oversight. Ex ante, it is unclear which market segment is
likely to be most disrupted by increased public oversight. On the one hand, an increase in
enforcement intensity could benefit shareholders of AIM firms more if the already weak
2 Prior research typically assumes that positive externalities from disclosure accrue within industry (e.g., Wang
2014, Shroff et al. 2016). Relatedly, our estimates do not include any economic benefits of transparency that accrue
to stakeholders other than shareholders, such as tax authorities or bondholders (e.g., Chow 1983).

4
enforcement level is below the level that maximizes the value of equity. On the other hand, it is
also possible that firms self-select into the regulatory regime that maximizes their equity values
and that AIM firms select less public oversight because tighter enforcement destroys firm value.
If the latter is true, we expect that more public oversight reduces the market value of AIM firms
more than Main Market firms.
Consistent with firms self-selecting into the enforcement regime that maximizes their
equity values, we find that the decrease in the market value of equity for AIM firms included in
focus sectors is approximately 0.8 percentage points larger than for Main Market firms. These
results suggest that firms choose the value-maximizing level of enforcement and, that, from the
standpoint of shareholders, private contracting allows firms to sort into the optimal regime
without government intervention.
An important identifying assumption of our analysis is that the FRRP is not endowed
with private, value-relevant information, which is then used to select focus sectors. If the FRRP
did have private, value-relevant information, the market reactions could be caused by the
revelation of this information through the selection of focus sectors rather than (or in addition to)
the impact of enforcement. On a conceptual level, this explanation seems unlikely. The
accounting policies examined by the FRRP are publicly observable and the FRRP
announcements are for entire industries, rather than specific firms. It is unlikely that the FRRP
would know more about industry-wide (value-relevant) accounting deficiencies than
sophisticated market participants.3
Nevertheless, to assess this possibility, we examine cross-sectional variation in the
magnitude of the market reactions to the FRRP focus sector announcements. Among firms
3 Anecdotally, our discussions with a member of the FRRP panel tasked with the annual selection of the focus
sectors support this conjecture.

5
within the focus sectors, accounting deficiencies are most likely to be uncovered, and the market
response the FRRP announcements most negative, where investors know relatively less about the
quality of a firm’s financial reporting prior to the announcement. Inconsistent with the FRRP
announcements revealing private information, we find no evidence of stronger market reactions
for firms that are small, have no large blockholders, have no analyst following or hire Big-4
auditors.
To provide evidence on potential mechanisms through which increased enforcement
could decrease shareholder value, we examine two specific channels: changes in compliance
costs and investment policies. Increased enforcement could provide an incentive for managers to
expend additional resources to ensure compliance with accounting regulation because corrective
enforcement actions could impose private costs on managers. For example, these additional
expenditures could be used to: improve information systems, obtain a more thorough external or
internal audit, and/or increase managerial scrutiny of the financial reports. We proxy for
compliance costs using the level of external audit fees, which are widely available for a broad
sample of firms and likely associated with the overall amount of resources used on compliance
(e.g., Ball et al. 2012, De George et al. 2012 and Kim et al. 2012). We find evidence of a
significant increase in audit fees in the fiscal year subsequent to a firm’s selection into an FRRP
focus sector, relative to other non-focus sector firms and years.
Despite the observed increase, compliance costs alone are unlikely to be large enough to
fully explain the observed reduction in firm value for focus-sector firms. Increases in
transparency could also lead to less efficient investment by creating an incentive for managers to
pursue a myopic investing approach to meet short-term, financial-reporting objectives (Stein
1989; Ewert and Wagenhofer 2005; Gigler et al. 2014). Using a novel measure of investment

6
horizon based on the association between current capital expenditures and future short- and long-
term cash flows, we find evidence of an increase (a decrease) in the correlation between capital
expenditures and short-term (long-term) cash flows for firms that have been subject to increased
enforcement relative to those that have not. While, viewed in isolation, this result does not
necessarily imply a decrease in investment efficiency, coupled with the observed negative
market reactions to the focus-sector announcements, this evidence is consistent with firms’
switch to more short-term investments being a channel through which increased enforcement
leads to a decline in firm value.
Our paper contributes to several streams of the extant literature. First, a large literature in
accounting and finance finds significant benefits of enforcement (e.g., a lower cost of capital
Hail and Leuz, 2006 and Li, 2010; or higher liquidity Christensen et al. 2013, 2016). While,
these studies acknowledge that greater enforcement also likely has costs, they cannot identify
them in their settings. In contrast, our setting allows us to estimate the net benefits to
shareholders of increased enforcement. Because enforcement changes are often motivated by a
desire to protect shareholders (e.g., Securities Act of 1933 and 1934), isolating the effect on
shareholder wealth is particularly important.
In prior research, the evidence on the benefits of securities regulation is mixed and
existing studies focus on major reforms that affect many aspects of regulation at the same time,
including both disclosure requirements and the enforcement thereof, such as the Securities Acts
of 1933 and 1934, the Sarbanes-Oxley Act, or Regulation Fair Disclosure.4 Our paper provides
4 See, for example: Stigler 1964; Benston 1969 and 1973; Jarrell 1981; Chow 1983; Shehata 1991; Mahoney and
Mei 2013; Heflin et al. 2003; Bushee et al. 2004; Gintschel and Markov 2004; Francis et al. 2006; Chhaochharia and
Grinstein 2007; Wang 2007; Zhang 2007; Li et al. 2008; Doidge et al. 2010; Coates and Srinivasan 2014; and Chen
and Yuan 2004.

7
an empirical examination of the effect of increased financial reporting enforcement on
shareholder wealth independent of other regulatory changes.
Further, our paper provides empirical evidence on the role of compliance costs and
changes in investment horizon as mechanisms through which increased enforcement can lead to
a decline in firm value. Prior research has found a positive association between disclosure and
investment efficiency (Biddle and Hilary 2006; Biddle et al. 2009; Shroff et al. 2013).
Alternatively, we examine an increase in regulatory enforcement intensity and find that firms
shift towards shorter-term (and potentially less efficient) investment.
There is also a large literature that examines the effects of ex-post remedial actions
undertaken by the SEC and FRRP, including enforcement actions (Feroz et al. 1991; Dechow et
al. 1996; Beatty et al. 1998; Bonner et al. 1998; Beneish 1999; Hines et al. 1999; Peasnell et al.
2001; Farber 2005) and comment letters (Johnson and Petacchi, 2015). In contrast, in our
primary analyses, we examine ex-ante increases in expected enforcement as opposed to ex-post
enforcement actions. This ex-ante focus allows us to speak to the net benefits to shareholders of
an increase in enforcement intensity, which is not possible when examining the ex-post outcomes
(i.e., while an ex-post corrective enforcement action pursued against a firm is unambiguously
bad news, an increase in the level of enforcement could reveal both good and bad types,
benefiting some firms and harming others).
2. Costs and Benefits of Public Enforcement
Conceptually, there are arguments both for and against securities regulation and
enforcement. On the benefits side, numerous papers highlight the potential for positive
externalities, the limitations of private enforcement, the need for a binding commitment
mechanism, and general cost savings (e.g., Coffee 1984; Easterbrook and Fischel 1984; Zingales
8
2009; Johnson, et al. 2002; Leuz and Wysocki 2016). On the costs side, others point out the
difficulties of ensuring effective enforcement and the potential for regulatory capture (e.g.,
Stigler 1971; Posner 1974; Peltzman 1976; and Becker 1983). Ultimately, as illustrated by
Djankov et al. (2003), given the tradeoff between the competing costs of ‘disorder and
dictatorship’ faced in designing a regulatory framework, the net benefits of publicly enforced
securities regulation are an empirical matter.
In the specific context of financial reporting, public enforcement is generally motivated
by either externalities or the lack of private commitment mechanisms for disclosure policies
(Kothari et al. 2010). Positive externalities may arise because corporate disclosures can provide
information that is relevant to the valuation of other firms (e.g., Foster 1981; Dye 1990; Admati
and Pfleiderer 2000). For instance, one firm’s disclosure may provide information on investment
risks or technological shocks that are relevant to the valuation of other firms in the same industry
(Badertscher et al. 2013). Although there are strong conceptual arguments for positive
externalities, the economic importance of these effects when it comes to public enforcement of
accounting standards is less clear.
Another argument for public enforcement is that the lack of a private commitment
mechanism for managers and ex-post coordination problems among dispersed shareholders leads
to a suboptimal level of disclosure without regulatory intervention (Coffee, 1984). This lack of
disclosure exacerbates agency conflicts between managers and shareholders, which leads
investors to price protect, and, in turn, will prevent otherwise profitable investments from being
financed. However, many potential market-based solutions exist that could mitigate commitment
and coordination problems (e.g., auditors, analysts, outside blockholders, and private litigation),
which casts doubt on the need for a government solution.

9
If the market failures created by externalities and commitment problems are not as
pervasive as predicted by proponents of increased public enforcement, increasing the level of
regulatory oversight could impose significant costs on firms by forcing them into a suboptimal
level of transparency. Beyond basic compliance costs, financial reporting enforcement could also
lead managers to make less efficient (e.g., myopic) investment decisions (e.g., Stein 1989; Ewert
and Wagenhofer 2005, 2016; Gigler et al. 2014). Common intuition suggests that, because
increased disclosure reduces informational differences between traders, more information is
always preferable to less. However, such a perspective confuses “price efficiency” with
“economic efficiency” and thereby overlooks the possibility that increased disclosures could
create an incentive for firms to alter their business decisions in a way that that has real economic
consequences (Gigler et al. 2014).
Specifically, Stein (1989) shows, analytically, that an increase in the informativeness of
earnings can increase the price pressure managers face, which can lead to a less efficient, myopic
investing approach. Explicitly in the context of improving financial reporting, Ewert and
Wagenhofer (2005) show that tightening accounting standards strengthens the relationship
between accounting earnings and market prices, which increases the cost of accrual-based
earnings management and creates a greater incentive to achieve financial reporting objectives
through “real” earnings management. This line of research illustrates that, although increased
enforcement should unambiguously lead to an increase in the informativeness of reported
earnings, it can also increase managers’ incentives to alter their real investment decisions in an
effort to achieve their financial reporting objectives. Because such changes in real activities lead
to a deviation from the otherwise optimal actions, they have negative consequences for the value
of the firm.

10
In the end, there are arguments both for and against increasing public oversight and, as
with securities regulation more generally, it is an empirical question whether an increase in the
enforcement of financial reporting provides net benefits for shareholders.
3. Institutional Setting
The settings used in prior research on the capital market effects of financial reporting
enforcement (FRE) have generally precluded researchers from drawing conclusions on FRE’s
net benefits to shareholders for two reasons. First, FRE changes are often bundled with other
regulatory changes (e.g., SOX, IFRS, and Reg. FD) making it hard to separately identify the
effect of FRE. Second, the costs of enforcement are rarely observable and most research, while
acknowledging their existence, only examines the benefits of FRE (e.g., Christensen et al. 2016).
The FRRP setting overcomes both of these issues.5
The FRRP was set up in 1991 as a subsidiary of the Financial Reporting Council (FRC),
a legally mandated, private-sector body, with the aim of improving compliance with the U.K.
regulatory framework for financial reporting.6 The FRRP is responsible for the enforcement of
financial reporting rules for listed companies, PLCs, and large private companies in the U.K.
However, detecting fraud is not the objective of the FRRP. In the U.K., the main legal provisions
on fraud are contained in the Fraud Act of 2006 and the Theft Act of 1968 and as such are not
the responsibility of the FRRP (Peasnell et al. 2001). From its inception until the early 2000s, the
FRRP was a reactive body that reviewed financial reports only in response to investor
complaints, referrals from other regulators, or press reports. This reactive approach gave the
FRRP limited choice in the cases it reviewed and matters it considered (Brown and Tarca 2007).
5 Of course, the FRRP setting also has some limitations. For example, cannot capture any across-industry
externalities, such as a general increase in the confidence in financial markets. 6 The information in this section is compiled from the FRRP’s annual activity reports (see, www.frc.org.uk).

11
In 2002, following the collapse of Enron and the turbulence in U.K. equity markets that
followed, the Chancellor of the Exchequer ordered a review of financial regulation in the U.K.,
including financial reporting and auditing standards (Fearnly and Hines 2003b). A report by the
Coordinating Group on Audit and Accounting Issues (CGAA) to the Department of Trade and
Industry (DTI) and the Treasury in January 2003, called for the adoption of a proactive, risk-
based enforcement regime similar to the SEC’s comment and review process. The U.K.
Secretary of State announced major reforms on January 29, 2003—including an explicit mandate
for a proactive regime for monitoring accounts by the FRRP. The establishment of this proactive
program represented a substantial departure from the prior (reactive) regime (see Christensen et
al. 2013).
Under the proactive review process, in addition to investigating complaints, the FRRP
began sampling based on firm characteristics associated with risk. The FRRP’s risk-based
approach selects accounts for review based on the probability of a breach of accounting
requirements and the impact that such a breach would have on market and investor confidence.7
If the FRRP identifies a possible breach, it engages the management of the potentially non-
compliant firm through a comment and review process. If the FRRP continues to believe the
company is not compliant, it will try to persuade the company to change accounting practices
either through a restatement or a prospective change in reporting practices. Once this process is
complete, the FRRP may decide to issue a company-specific press release that explains the
changes in accounting practices. If this process fails, the FRRP can sue to force the courts to
decide whether the report at issue complies with the law.
7 The fact that the FRRP selects focus sectors based on risk is not a problem for our analysis as long as these risk
factors are publicly observable to investors. We also empirically address this issue in Section 4.4.
12
From 2004 to 2011, one of the key aspects of the FRRP’s proactive review process was
the selection of focus sectors that would be subject to enhanced regulatory scrutiny in the form of
a higher likelihood of having a proactive FRRP review of the next year’s financial statements.8
To deter misreporting and give companies a chance to improve their financial reporting
compliance in advance of publishing their accounts, focus sectors are announced (several
months) in advance of the release of the financial statements for the fiscal year subject to the
increased likelihood of inspection. Hence, upon the announcement of next year’s focus sectors,
there is an abrupt increase in the probability of a financial statement review for the subset of
firms that are in the announced focus sectors and a similar abrupt decrease in the probability of
inspection for those firms that are not in focus sectors. Importantly, because all firms in
announced focus sectors are subject to an increased likelihood of FRRP inspection, treatment is
not limited to firms within a focus sector that are actually reviewed ex post.
To estimate the increase in the probability of a future review at the time of the focus
sector announcements, we use data on the number of companies selected for review from focus
and non-focus sectors in 2007—the only year the FRRP made this data publicly available. We
estimate this change by comparing the probability of a review for both focus- and non-focus-
sector firms to the probability of a review not distinguishing between focus- and non-focus-
sector firms. Based on this approach, and assuming that there is no anticipation of the selected
sectors, the estimated change in the probability of a review upon the announcement of the focus
8 In 2012, the FRRP was replaced by the Monitoring Committee as part of a change in the overall structure of the
FRC. Under the Monitoring Committee, the practice of having focus sectors still exists, however, the Monitoring
Committee has a broader scope than the FRRP (e.g., includes reviews of auditors) and they do not announce the
priority sectors in press releases, which prevents us from using our identification strategy to assess its impact on
equity values. For these reasons, we limit our tests to the eight announcements by the FRRP from 2004 to 2011.

13
sectors is 148 percent (see Table 1 for calculation).9 It is this abrupt change in the probability of
a financial statement review that allows us to estimate the net benefits of FRE using share price
reactions in narrow event windows around the announcements.
Table 2 reports the announcement dates, priority sectors, and number of sample firms in
focus and non-focus sectors. Some sectors are focus sectors in multiple years. The most
frequently selected focus sector is retail (6 years) whereas telecommunication, advertisement,
recruitment, information technology, and insurance are focus sectors in only one year. The
practice of selecting the same focus sector for multiple years likely makes it difficult for market
participants to predict future focus sectors. Over the sample period, there are 15 unique focus
sectors, 639 firms are in a focus sector at least once, and 832 firms are never in a focus sector.
In Table A1 of Appendix A, we provide descriptive statistics on the annual review
activity of the FRRP. Consistent with our empirical analyses, we include only statistics for the
proactive reviews of U.K. public companies. Panel A reports that, on average, 178 companies are
reviewed each year. An average of 69 of those inspections (about 42%) arose from the proactive
focus sector review program.10
Panel B reports that, of the companies reviewed, on average, 103
of those companies (about 58%) were contacted in regard to an identified reporting issue. The
time-series variation in the number of companies the FRRP approaches suggests that their
activities increased for fiscal years after 2005/06. Panel C reports that, of the companies
contacted, on average, 48 (about 47%) agreed to make prospective changes in their financial
reporting. Panel D reports that of the 178 companies reviewed, on average, the FRRP filed press
releases for 2 of those companies (about 1%) announcing reporting changes.
9 Of course, it is highly unlikely that there is no anticipation of any of the selected focus sectors. Thus, this estimate
represents an upper bound on the increase in enforcement intensity. 10
The FRRP annual activity reports provide specific details on the number of companies selected under the focus
sector review program only in 2006 and 2007.

14
The high level of company cooperation with the FRRP is likely attributable to the
severity of the penalties the FRRP can indirectly impose on managers for a lack of compliance.
Specifically, while the FRRP has no direct authority to make legal decisions, after first seeking
to persuade the firm question to voluntarily make the requested reporting changes, the FRRP
then has the power to seek a court order requiring the changes be made. In the event the court
approves the request, the company’s managers and directors who approved the defective
statements are liable for all court costs and expenses incurred by the company in connection with
the preparation of revised financials (Companies Act 2006, s456(5)). To date, the FRRP has
never taken a case to court indicating that the threat is sufficient to incentivize managers to make
the requested changes.
In Table A2 of Appendix A, we provide details on the specific reporting issues identified
by the FRRP during each inspection year based on summaries of the annual activity reports.11
Overall, the vast majority of the issues highlighted pertain to inadequate, incomplete, or
uninformative disclosures rather than disclosures that are technically incorrect. Thus, the
summaries in Tables A1 and A2 highlight the fact the overwhelming majority of the issues
identified by the FRRP’s proactive focus-sector inspections lead to future improvements in
reporting transparency, rather than retroactive restatements of accounts. The wide-ranging nature
of the identified issues, the significance of the accounts to which they pertain (e.g., revenue
recognition, liability, and segment disclosures), and the severity of the penalties that can be
applied if corrective action is not taken, make it plausible that material changes in reporting
related to these issues could lead to substantial prospective increases in transparency and, as a
consequence, real changes in firm activities.
11
The FRRP activity reports do not specifically disclose which issues were identified as a result of the proactive
focus sector reviews and which arose from their other targeted reviews.
15
Despite the dramatic regulatory changes, many saw the FRRP’s existing operations as
relatively successful given its small budget and staff—as compared to larger agencies such as the
U.S. SEC (e.g., Bruce 2003; Fearnley and Hines 2003a). Critics contended that the adoption of
the proactive financial reporting reviews was largely a political move intended to increase the
visibility of the FRRP and to combat the loss in credibility suffered by all regulators in the wake
of the SEC’s failure to detect the Enron and other scandals, rather than an economically
grounded attempt to improve the FRRP’s effectiveness (Bruce 2003; Fearnley and Hines 2003a).
In the absence of a clearly identified and articulated economic motivation and set of objectives
for the FRRP’s proactive focus-sector review program, it remains uncertain whether the financial
reporting changes recommended by the FRRP can enhance firm value.
4. The Effect of Proactive Financial Reporting Enforcement on Firm Value
We organize our empirical analyses of the impact of proactive financial reporting
enforcement intensity on firm value as follows: first, we investigate the average effect on the
market value of equity of being in a focus sector (i.e., the effect of the revelation that the firm
will be subject to an increase in enforcement intensity in the subsequent fiscal year); second, we
examine cross-sectional variation in the effect of enforcement on equity values based on the prior
level of enforcement and market-based monitoring to which a firm is exposed.
4.1 Research Design and Identification Strategy
As discussed in Section 2, there are theoretical arguments for both a positive and negative
effect of FRE on equity values. We employ short-window returns in our analysis and hence our
identification strategy relies on the abrupt change in enforcement intensity around the FRRP
focus-sector announcements for focus-sector relative to non-focus-sector firms (and the
assumption that equity markets quickly incorporate this information). We obtain return data from

16
Thomson Reuter’s Datastream database and financial data from Worldscope through the QA
Direct Quantitative Analysis platform. After imposing the data requirements and the sample
filters discussed in Appendix B, our final sample consists of 7,209 firm-year observations from
2004-2011.
Non-focus-sector firms provide a natural benchmark to control for any contemporaneous
U.K.-economy-wide return news. A remaining concern is the potential confounding effect of any
contemporaneous, industry-specific news. Because FRE affects all U.K. firms in a particular
industry, there is no natural industry-level benchmark in the U.K. As an alternative, we use the
return of firms within the same four-digit ICB industry in the U.S that are listed on NASDAQ,
AMEX, or NYSE. Given the close economic ties between the U.S. and the U.K., industry-level
shocks within the U.K are likely to be highly correlated with those in the U.S.12
Because it is unclear ex ante when exactly any updating in market expectations related to
FRE might occur, we begin by plotting the difference in the U.S. industry-adjusted, cumulative
average abnormal return for focus sector versus non-focus-sector firms over a horizon of -15 to
+15 days. Figure 1 presents the results, which show clear evidence of a strong negative reaction
beginning approximately five days prior to the announcement of the focus sectors. This plot
provides some initial evidence that shareholders perceive FRE to be costly and also suggests that
there is some anticipation of the announcement.
Based on the evidence in Figure 1, we select a return measurement window of eight days,
beginning five days prior to the focus sector announcements—to incorporate the apparent
anticipation—and ending two days subsequent to the announcement, at which point it appears
12
Results throughout the paper are similar if we instead use German firms as a benchmark.
17
the information is fully incorporated.13
For our main analyses, we estimate the following
univariate regression (subscript i indicates a firm and t a year):
, 0 1 , ,i t i t i tCAR FRE (1)
CAR is defined as the cumulative abnormal return in an eight-day window (from day t-5 to t+2)
around the focus sector announcement date. FRE, the variable of interest, is an indicator coded as
one if, in year t, firm i is in an announced focus sector (i.e., a treated firm), and zero otherwise.
The control group is comprised of firms not included in an FRRP focus sector in year t. We
cluster observations by the focus-sector announcement year to account for cross-sectional
correlation in daily returns.14
4.2 Equity Value Effects of Proactive Financial Reporting Enforcement
Table 3 Panel A reports results for the average effect of increased enforcement intensity
on the market value of equity across the eight FRRP focus-sector announcements from 2004 to
2011. Column (1) presents results using an unadjusted CAR (i.e., without adjusting for the U.S.
industry return but still relative to non-focus-sector firms). The estimated coefficient for FRE
indicates a decrease in shareholder’s equity of -1.2% (and is significant at the 1% level).
Columns (2)-(4) report results based on U.S.-industry-adjusted returns. Column (2) presents
results for the average effect of FRE using ordinary least squares (OLS). Column (3) shows
results for the median effect using a quantile regression. Column (4) provides results using the
13
In additional sensitivity tests, we assess the robustness of our results to alternative return accumulation windows
of five days (-2 to +2) and eleven days (-5 to +5) and reach similar conclusions. However, as is apparent from
Figure 1, the magnitude of the return differential is lower in each of these specifications (-1.5% and -1.3%,
respectively). 14
Because we only have eight unique event dates, we have a relatively small number of and clusters, and thus our
standard errors could be inconsistently estimated. For this reason, we also report t-statistics using the Fama-MacBeth
(1973) approach. Besides accounting for cross-sectional correlations within events, another advantage of the Fama-
MacBeth approach is that it does not require the assumption of homogeneity (e.g., Bester et al. 2011 and 2016).

18
Fama-MacBeth (1973) approach. Across the three specifications, the treatment effect ranges
from -1.5% to -2.0% and is significant at the 1% level.
Next, to assess the consistency of the pooled results, we separately examine each of the
eight annual FRRP focus-sector announcements. Table 3 Panel B presents results repeating each
of the specifications from Panel A with the exception of the Fama-MacBeth (1973) approach,
which is not applicable to a single-period analysis. Across all eight announcements and in each
of the three specifications, the market reaction is generally negative and is often statistically
significant (the frequency of negative [significant] coefficients is as follows: Column (1): 7[4];
Column (2): 7[4]; Column (3): 6[5]).
With respect to the insignificant announcement periods, two consistent patterns emerge.
The first is the absence of a significant effect in the first two announcement years. One potential
explanation is the FRRP’s low enforcement activity noted in Table 2 for 2004 and 2005. Another
explanation is that shareholders initially have difficultly assessing the implications of the FRRP
focus sector review program and gradually learn of its costs over time. The second empirical
consistency is the lack of a significant effect in 2008. A potential explanation for this is that the
2008 FRRP announcement date (October 30th
) occurred in the midst of the 2008 financial crisis
and significant uncertainty and volatility in the global stock markets, which makes it difficult to
separately identify the effect of increased enforcement.15
Finally, to provide further evidence on the consistency of the negative effect of
enforcement on returns, we separately examine the market reaction for each focus sector in each
year (untabulated). From 2004-2011, the FRRP announced 41 focus sectors (with some
15
During the week of October 26th
, 2008 several significant events related to the ongoing financial crisis occurred,
including the announcement of additional national funding for many financial institutions, which lead to extremely
volatile stock prices for financial institutions during this period. Banks were one of the selected focus sectors in
2008. The focus-sector announcement return for 2008 is significantly negative if we exclude banks.

19
repetition among the sectors). Across all the sectors, we find evidence of negative market
reactions for 80% (33) of the sectors, 34% (14) of which are statistically significant. Only 5% (2)
of the announcements have significantly positive market reactions.16
Overall, the results in this section provide evidence of a robust, economically significant,
negative market reaction to FRE and suggest that the market perceives the additional
enforcement scrutiny to be costly.
4.3 Variation in the Existing Enforcement Regime—AIM vs. the Main Market
In this section, we examine whether the reaction to FRRP announcements varies based on
firms’ existing enforcement regimes. On the LSE there are two core segments, the Main Market
and AIM. The Main Market is an EU-regulated market which means that it is subject to all
aspects of the E.U.’s securities regulation. AIM, on the other hand, is a self-regulated exchange
that is exempt from many E.U. regulatory provisions (Gerakos et al. 2013). If firms choose to list
on AIM because its relatively low regulatory oversight maximizes firm value, we expect more
negative market reactions for AIM firms subject to FRRP focus sector reviews. Alternatively, if
AIM’s private enforcement regime allows insiders to expropriate from outsiders, we expect
increased public oversight to lead to increases in AIM share prices.
Table 4 Panel A presents market reactions to the FRE focus-sector announcements
conditional on market segment. For ease of comparison, for this (and all subsequent) cross-
sectional comparisons, we present the total coefficient for each group (i.e., we add, and jointly
assess significance for, both the main effect and interaction coefficients). Market reactions to the
16
For firms that are selected in three or more consecutive years (e.g., retail, commercial property, travel and leisure,
and utilities), we observe that the return response is generally more negative the more times an industry has
previously been selected as a focus sector. This suggests that firms make additional reporting changes each time
their industry is included in a focus sector and that these additional disclosure changes move firm value farther away
from the optimal level at an increasing rate (i.e., that firm value is a concave function of the level of transparency).
20
FRE announcements for both the Main Market and AIM are significantly negative, -1.6%
and -2.4%, respectively. The larger negative response for the AIM market of 0.8% is statistically
significant at the 5% level.
Overall, these results suggest that market forces lead firms to choose the value-
maximizing level of enforcement and, therefore, that additional enforcement is more costly for
firms that self-select into regimes with less public oversight. From the standpoint of
shareholders, private contracting allows firms to sort into the optimal level of regulation without
government interference.
4.4 The potential revelation of private information by the FRRP
An important identifying assumption of our analysis is that the FRRP is not endowed
with private, value-relevant information, which is used to select focus sectors.17
If this
assumption is invalid, a potential alternative explanation for our results is that, rather than a
response to increased enforcement, the observed market reactions to the focus sector
announcements are attributable to the FRRP revealing private information through their selection
of focus sectors.
Although it seems implausible that the FRRP has general information about which
industries are overvalued (or would be interested in conveying such information), it is possible
the FRRP has private information about industry-wide, accounting deficiencies. The revelation
of accounting deficiencies could be value relevant if the market expects an improvement in
reporting quality to uncover bad news. Among firms within the focus sectors, bad news is most
17
Our discussions with a member of the FRRP panel tasked with the annual selection of the focus sectors support
this conjecture. Specifically, this panel member noted that, while the selection of the focus sectors is not completely
random (i.e., there is some consideration of sectors where it is public knowledge there might be an accounting
issue), there is “some arbitrariness in the choice for at least some of the sectors” and little indication that the
selection group knows “anything significant the market didn’t already know.”
21
likely to be uncovered, and the market response the FRRP announcements most negative, where
investors know relatively less about the quality of a firm’s financial reporting prior to the
announcement. We expect investors to have more uncertainty about potential accounting
deficiencies for firms that are small, lack a large independent blockholder, have low analyst
following and Big-4 auditors. To assess this possibility, we examine cross-sectional variation,
among focus sector firms, in the magnitude of the market reactions to the FRRP focus sector
announcements.
In Table 5 Panel A, we partition the sample based on size. Investors are likely relatively
more informed about the reporting quality of large firms. Column (1) [(2), (3)], presents results
for the pooled [Main Market, AIM] sample. We measure size based on the firm’s book value of
total assets and classify large firms as those with above median assets, calculated by exchange
segment. Across all three samples, the magnitude of the market reactions to the FRE focus sector
announcements is similar for both small and large firms, suggesting that observed negative
responses to the FRRP announcements is unlikely driven by the revelation of private
information. These results also suggest that the observed difference in the magnitude of the
response for AIM firms relative to Main Market firms is unlikely to be attributable to size
differences between the two markets [see Table 4].18
Next, we partition the sample based on whether the firm has an outside blockholder.
Outside blockholders, whose large ownership positions give them a strong incentive to monitor
management, represent an alternative means of mitigating agency conflicts and coordination
problems between managers and shareholders (Shleifer and Vishny 1997; Edmans 2009; Edmans
18
In additional untabulated analyses, we confirm that the larger negative response for AIM firms is consistent across
the majority of focus sectors and years.

22
and Manso 2011). In other words, the FRRP is less likely to have private information about
accounting deficiencies for firms with large blockholders.
We obtain data on share ownership from the Argus Vickers Owners Service Share
Register Analysis System (AVSR). The AVSR database classifies owners into six mutually
exclusive categories: 1) Execution-Only Stockbrokers, 2) Full-Service Stockbrokers, 3) Private-
Client Investment Managers, 4) Private Banks, 5) Institutions, 6) Large Individual and Private
Clients. Insider ownership is captured in the Large Individual and Private Client classification,
which means an external share block could be obtained through any of the other five
classifications. Accordingly, we define an indicator, Blockholder, which equals one if any unique
owner in AVSR classifications 1 through 5 holds a position larger than 5%, and zero otherwise.
For our sample of 7,209 firm-years, AVSR has data for 6,367 and in 81% of these firm-years
there is at least one blockholder.
Table 5 Panel B presents market reactions to the FRE announcements separately for
treated firms with and without large blockholders for the pooled, Main Market, and AIM
samples. Across all three samples, the market reaction to FRE is negative (and significantly so in
five of six instances). The market reaction is more negative for firms with large blockholders—
the difference ranges from -1.4% to -0.5%—which is inconsistent with the market reactions
being attributable to the revelation of private information by the FRRP through the selection of
focus sectors.
Table 5 Panel C presents market reactions to the FRE announcements separately for
treated firms with above and below mean analyst coverage for the pooled, Main Market, and
AIM samples. Table 5 Panel D presents the same market reactions for treated firms with and
without a Big-4 auditor. We expect uncertainty about potential accounting deficiencies to be
23
higher for firms with low analyst following (e.g., Lang and Lundholm 1996), and for firms
without a Big-4 auditor (e.g., DeAngelo 1984). The results, in both panels, provide no indication
of a larger market response for firms with lower analyst following or a Big-4 auditor, which is
again inconsistent with the FRRP announcements revealing private information.
If FRRP focus sector selection were indicative of the FRRP’s awareness of unrevealed
problems in that sector, those problems would likely be more severe for companies with more
uncertainty about potential accounting deficiencies. On the contrary, overall in the four tests in
this section, we find the most negative (or similar) responses for firms that likely have relatively
less uncertainty about potential accounting deficiencies.
5. Financial Reporting Enforcement and Changes in Resource Allocation
The large reductions in shareholder wealth documented in Section 4 suggest that firms
make significant changes in resource allocation following an increase in enforcement intensity.
In this section, we examine two specific changes in firms’ resource allocation decisions that
could lead to a decline in shareholder value: increased expenditures on reporting compliance and
changes in investment policies.19
5.1 Compliance Costs
Increased enforcement likely provides an incentive to increase expenditures on systems
to ensure compliance with accounting regulations. The additional resources expended could be
used to deal with the immediate administrative burden associated with the increased regulatory
scrutiny during FRRP inspection years and also as a way to commit to an ongoing higher level of
disclosure (Ball et al. 2012, De George et al. 2012 and Kim et al. 2012). That firms simply
ignore regulators’ demands that lead a sub-optimally high level of transparency is an unlikely
19
Our analyses presume that investors have rational expectations and correctly anticipate the firm value implications
of future changes in firm behavior (e.g., Stein 1989 and Gigler et al. 2014).
24
response since managers are personally responsible for legal costs in cases where the FRRP’s
dispute is successful (see Section 2). We use audit fees to proxy for these compliance costs, but
consistent with Ball et al. (2012), we assume that the level of audit fees is positively associated
with the quantity and quality of a wide range of firm disclosure-related activities.
We obtain data on audit fees and control variables from Worldscope. Our sample includes
a panel of firm-year observations from 1995 through 2012. We employ a difference-in-
differences design that compares the change in audit fees for firms included in FRRP focus
sectors to those that are not. Specifically, to assess the effect of FRE on audit fees, we estimate
the following regression:
, ,( ) i t t t t i tLn AuditFees FRE Controls Fixed Effects (2)
Ln(AuditFees) is the natural log of audit fees measured in millions of USD. FRE, the variable of
interest, is an indicator coded as one for all years subsequent to a firm’s inclusion in an
announced focus sector (i.e., a treated firm), and zero otherwise. Following prior research (e.g.,
Craswell et al. 1995), we include several controls known to be determinants of the level of audit
fees, including: the natural log of total assets, the ratio of total liabilities to total assets
(Leverage), and the ratio of net income to total assets (ROA). We include industry and year fixed
effects to control for cross-sectional differences in audit fees across industries and to flexibly
account for changes in audit fees over time. We winsorize all variables at the 1% and 99% level
and cluster standard errors by industry.
Table 6 Panel A presents descriptive statistics. The median firm pays audit fees of
$172,000 per year, has $61 million of total assets, has leverage of about one half of total assets,
and has a return on assets of 3.8%. Table 6 Panel B presents regression results. Consistent with
prior research, coefficients for the control variables indicate that audit fees are higher for larger,
25
more leveraged firms, with lower profitability (e.g., Chaney et al. 2004, Choi et al. 2009 and
Iliev 2010). The coefficient of interest, FRE(t=0 to t=n), is positive and statistically significant at the
1% level. The magnitude of the coefficient indicates that, relative to firms not inspected by the
FRRP, FRRP-focus-sector firms experience a 7.7% increase in audit fees following their
inclusion in a focus sector, or approximately $75,000.
Next, we test whether the observed increase in audit fees is attributable to additional costs
incurred only in the year of the enforcement increase, or whether firms, as part of their
commitment to a higher transparency level, permanently increase expenditures on compliance.
Specifically, following Florou et al. (2016), we partition the FRE(t=0 to t=n) variable into three
separate indicators, FRE(t=0), FRE(t=1), and FRE(t=2 to t=n), where FRE(t=0) (FRE(t=1); FRE(t=1 to t=n))
takes a value of one during the year of the FRRP focus sector reviews (in the year following the
focus sector reviews; for all years subsequent to the FRRP review) for focus-sector firms, and
zero otherwise. The results reported in Column (2) Table 6 Panel B suggest a permanent increase
in expenditures on compliance in the year following the focus sector reviews (but not in the year
of the reviews).20
Although, the percentage increase in audit fees of 7.8% indicated by the
coefficient on FRE(t=1) is larger than FRE(t=2 to t=n) for subsequent years of 6.4% and, consistent
with a lasting increase in transparency arising from the prospective recommendations of the
FRRP, the difference is not statistically significant.21
5.2 Investment Policies
Changes in firms’ investment policies are another potential real effect of increased
enforcement and greater firm transparency. Gigler et al. (2014) show analytically that increased
20
The lack of a significant increase in audit fees in the year of review could be a result of a lag in the timing of
negotiating or insufficient provisioning for the year’s audit fees. 21
Our finding of a positive association between audit fees and enforcement is consistent with the complementary
relationship predicted for certain levels of enforcement by Ewert and Wagenhofer (2016).

26
disclosure can increase the market pressure managers face and lead to a less efficient, myopic
investing approach as firms pursue alternative approaches for meeting their financial reporting
objectives. Kraft et al. (2016) provides empirical support for this conjecture by examining the
association between increased reporting frequency and the level of investments.
Faced with fewer options for meeting reporting objectives and increased capital market
scrutiny in light of increased disclosure, managers could substitute projects with relatively short-
term cash flows for (more profitable) long-term investment activities to boost current period
reporting. Although we cannot directly measure investment efficiency, we can, with the benefit
of hindsight (i.e., using data not available to investors at the time the investments are made),
observe the level of investment and its correlation with future cash flows. Coupled with the
observed negative market reactions to the focus sector industries, subsequent changes in
investment activity are likely to be less efficient.
We obtain data on investments and operating cash flows from Worldscope. Our sample
includes a panel of firm-year observations from 1995 through 2012. We assess the potential
substitution toward relatively shorter-horizon investment projects based on the association
between current capital expenditures and future short- and long-term cash flows. The correlation
between current investment and the timing of future cash flows is likely indicative of the horizon
of the selected investment. We measure investment using capital expenditures and research and
development (R&D) spending. To assess the effect of FRE on future investment, we estimate the
following difference-in-differences regression:
0 1 2 3 ( 0 to )
4 ( 0 to ) 5 ( 0 to )
- -
- -
t t n
t t n t t n
Investment S T Cash Flows L T Cash Flows FRE
S T Cash Flows FRE L T Cash Flows FRE
Fixed Effects
(3)

27
The dependent variable, Investment, is defined as the sum of capital expenditures and R&D over
a firm’s fiscal year (t). S-T Cash Flows is defined as the sum of operating cash flows measured
one to two years subsequent to the fiscal year when the investment is made (i.e., t+1 and t+2).
L-T Cash Flows is defined as the sum of operating cash flows three to five years subsequent to
the fiscal year when the investment is made (i.e., t+3, t+4, and t+5). FRE is an indicator coded
as one for all years subsequent to a firm’s inclusion in an announced focus sector (i.e., a treated
firm), and zero otherwise.
The primary variables of interest are S-T Cash Flows× FRE(t=0 to t=n) and L-T Cash
Flows× FRE(t=0 to t=n), where S-T Cash Flows×FRE (L-T Cash Flows× FRE(t=0 to t=n)) captures the
incremental change in the correlation between current period investment and short-term (long-
term) future cash flows for firms included in an FRRP focus sector. If firm managers become
more myopic as a result of the increased scrutiny and disclosure arising from the FRRP review
process, we expect firms to shift to relatively more short-term investments (i.e. a positive S-T
Cash Flows× FRE(t=0 to t=n) coefficient) and away from longer-term investments (i.e. a negative
L-T Cash Flows× FRE(t=0 to t=n) coefficient). We include industry and year fixed effects to control
for cross-sectional differences in investments across industries and to flexibly account for
changes in investments over time. We winsorize all variables at the 1% and 99% level and
cluster standard errors by industry.
Table 7 Panel A presents descriptive statistics. The median firm invests approximately $3
million per year (Investment) and has about $8 million of short-term cash flows (S-T Cash
Flows) and $15 million in long-term cash flows (L-T Cash Flows). Table 7 Panel B presents
results for the investment horizon analysis. The coefficient on S-T Cash Flows of 0.130 is
positive and statistically significant (1% level) and indicates that each dollar of investment is
28
associated with 13 cents in cash flows over the next two years. The coefficient on L-T Cash
Flows of 0.039 is positive and statistically significant (1% level) and indicates that each dollar of
investment is associated with about 4 cents in cash flows from three to five years after the
investment. Consistent with an increase in managerial myopia, S-T Cash Flows×FRE(t=0 to t=n) is
positive and statistically significant (1% level), indicating the association between investments
and short-term cash flows increase after FRRP inspections. In contrast, the coefficient on L-T
Cash Flows×FRE(t=0 to t=n) is negative and statistically significant (5% level), indicating a
substitution to a relatively shorter investment horizon.
Overall, the evidence suggests that, when subject to FRE, firms in our sample change to a
shorter investment horizon. While, viewed in isolation, this result does not imply a decrease in
investment efficiency, coupled with the observed negative market reactions to the focus sector
industries, this evidence is consistent FRE causing managers to become more myopic.
6. Conclusion
Prior research documents numerous capital market benefits of greater enforcement of
financial reporting regulation, but provides little evidence on its costs, leaving the net effect of
enforcement on equity value unresolved. Our paper sheds light on the net benefits to
shareholders of increasing the intensity of proactive enforcement of financial reporting
regulation on equity values.
Our results indicate that an estimated 148 percent increase in the likelihood of regulator-
initiated financial statement reviews on average (at the median) reduces equity values by 2.0%
(1.7%). The reductions in equity values are greater for firms that self-select into a weaker
enforcement regime and for firms subject to alternative market-based monitoring mechanisms,
which suggests that, from the standpoint of shareholders, private contracting sorts firms into the

29
optimal level of regulation without government interference. We also document two specific
changes in firms’ resource allocation decisions—increased expenditures on reporting compliance
and changes in investment horizon—that likely contribute to the observed decline in shareholder
value. Overall, our results demonstrate an instance where the costs of increased (proactive)
enforcement outweigh the benefits to shareholders.
Importantly, the results in this paper do not contradict prior evidence that financial
reporting enforcement causes (or is associated with) transparency improvements and capital
market benefits (e.g., Preiato et al. 2013; Byard et al. 2011; Christensen et al. 2013, 2016; Daske
et al. 2008; Lang et al. 2012; Hope 2003). In fact, the mechanism behind our theoretical
framework is improved transparency (Stein 1989; Gigler et al. 2014). The difference in our paper
is that we can observe the net benefits to shareholders of increased transparency—in the setting
we examine, the costs exceed the benefits.
We acknowledge that our interpretation of the results is subject to several limitations.
Importantly, maximizing equity values does not equate to maximizing social welfare in the
presence of externalities. Positive financial reporting externalities can arise from network effects
or because certain financial statement users cannot pass the costs of poor financial reporting on
to shareholders (e.g., the IRS). To the extent that externalities occur within sectors, our analysis
incorporates them. However, our analysis does not speak to cross-sector externalities or the
economic benefits of transparency that for other reasons do not fall to shareholders.
Furthermore, we observe the change in enforcement in only one equity market, the
U.K.’s LSE. Because the effects we document may depend on the initial level of enforcement, it
is unclear to what extent these results can be generalized to other settings with different
preexisting levels of regulation. However, it is worth noting that regulators in many different

30
jurisdictions pursue approaches similar to that of the FRRP in terms of choosing particular areas
of focus for increased regulatory scrutiny.

31
References
Admati, A. R., Pfleiderer, P. (2000). Forcing firms to talk: Financial disclosure regulation and
externalities. Review of Financial Studies, 13(3), 479-519.
Ball, R., Jayaraman, S., Shivakumar, L. (2012). Audited financial reporting and voluntary disclosure as
complements: A test of the confirmation hypothesis. Journal of Accounting and Economics, 53(1),
136-166.
Badertscher, B., Shroff, N., White, H. D. (2013). Externalities of public firm presence: Evidence from
private firms' investment decisions. Journal of Financial Economics, 109(3), 682-706.
Beatty, R. P., Bunsis, H., Hand, J. R. (1998). The indirect economic penalties in SEC investigations of
underwriters. Journal of Financial Economics, 50(2), 151-186.
Becker, G. S. (1983). A theory of competition among pressure groups for political influence. The
Quarterly Journal of Economics, 371-400.
Beneish, M. D. (1999). Incentives and penalties related to earnings overstatements that violate GAAP.
The Accounting Review, 74(4), 425-457.
Benston, G. J. (1969). The value of the SEC's accounting disclosure requirements. The Accounting
Review, 44(3), 515-532.
Benston, G. J. (1973). Required disclosure and the stock market: An evaluation of the Securities
Exchange Act of 1934. The American Economic Review, 63(1), 132-155.
Bester, C. A., Conley, T. G., Hansen, C. B. (2011). Inference with dependent data using cluster
covariance estimators. Journal of Econometrics, 165(2), 137-151.
Bester, C. A., Conley, T. G., Hansen, C. B. (2016). Performing Statistical Inference with Dependence: A
Review. Working paper.
Biddle, G. C., Hilary, G. (2006). Accounting quality and firm-level capital investment. The Accounting
Review, 81(5), 963-982.
Biddle, G. C., Hilary, G., Verdi, R. S. (2009). How does financial reporting quality relate to investment
efficiency? Journal of Accounting and Economics, 48(2), 112-131.
Bonner, S. E., Palmrose, Z. V., Young, S. M. (1998). Fraud type and auditor litigation: An analysis of
SEC accounting and auditing enforcement releases. The Accounting Review, 503-532.
Brown, P., Tarca, A. N. (2007). Achieving high quality, comparable financial reporting: A review of
independent enforcement bodies in Australia and the United Kingdom. Abacus, 43(4), 438-473.
Bruce, R. (2003, April 24). A proactive policeman. Financial Times.
Bushee, B. J., Matsumoto, D. A., Miller, G. S. (2004). Managerial and investor responses to disclosure
regulation: The case of Reg FD and conference calls. The Accounting Review, 79(3), 617-643.
Byard, D., Li, Y., Yu, Y. (2011). The effect of mandatory IFRS adoption on financial analysts’
information environment. Journal of Accounting Research, 49(1), 69-96.
Chaney, P. K., Jeter, D. C., Shivakumar, L. (2004). Self-selection of auditors and audit pricing in private
firms. The Accounting Review, 79(1), 51-72.
Chen, K. C., Yuan, H. (2004). Earnings management and capital resource allocation: Evidence from
China's accounting-based regulation of rights issues. The Accounting Review, 79(3), 645-665.
Chhaochharia, V., Grinstein, Y. (2007). Corporate governance and firm value: The impact of the 2002
governance rules. The Journal of Finance, 62(4), 1789-1825.
Choi, J. H., Kim, J. B., Liu, X., Simunic, D. A. (2009). Cross-listing audit fee premiums: Theory and
evidence. The Accounting Review, 84(5), 1429-1463.
Chow, C. W. (1983). The impacts of accounting regulation on bondholder and shareholder wealth: the
case of the securities acts. The Accounting Review, 485, 489-502.
Christensen, H. B., Hail, L., Leuz, C. (2013). Mandatory IFRS reporting and changes in enforcement.
Journal of Accounting and Economics, 56(2), 147-177.
Christensen H., Hail L., Leuz C. (2016). Capital-market effects of securities regulation: prior conditions,

32
implementation, and enforcement. Review of Financial Studies, forthcoming.
Coates, J. C., Srinivasan, S. (2014). SOX after ten years: A multidisciplinary review. Accounting
Horizons, 28(3), 627-671.
Coffee Jr, J. C. (1984). Market failure and the economic case for a mandatory disclosure system. Virginia
Law Review, 717-753.
Craswell, A. T., Francis, J. R., Taylor, S. L. (1995). Auditor brand name reputations and industry
specializations. Journal of Accounting and Economics, 20(3), 297-322.
Daske, H., Hail, L., Leuz, C., Verdi, R. (2008). Mandatory IFRS reporting around the world: Early
evidence on the economic consequences. Journal of Accounting Research, 46(5), 1085-1142.
DeAngelo, L. (1981). Auditor size and auditor quality. Journal of Accounting and Economics, 3(3), 183-
199.
Dechow, P. M., Sloan, R. G., Sweeney, A. P. (1996). Causes and consequences of earnings manipulation:
An analysis of firms subject to enforcement actions by the SEC. Contemporary Accounting Research,
13(1), 1-36.
De George, E. T., Ferguson, C. B., Spear, N. A. (2012). How much does IFRS cost? IFRS adoption and
audit fees. The Accounting Review, 88(2), 429-462.
Djankov, S., Glaeser, E., La Porta, R., Lopez-de-Silanes, F., Shleifer, A. (2003). The new comparative
economics. Journal of Comparative Economics, 31(4), 595-619.
Doidge, C., Karolyi, G. A., Stulz, R. M. (2010). Why do foreign firms leave US equity markets?. The
Journal of Finance, 65(4), 1507-1553.
Dye, R. A. (1990). Mandatory versus voluntary disclosures: The cases of financial and real externalities.
Accounting Review, 1-24.
Easterbrook, F. H., Fischel, D. R. (1984). Mandatory disclosure and the protection of investors. Virginia
Law Review, 669-715.
Edmans, A. (2009). Blockholder trading, market efficiency, and managerial myopia. The Journal of
Finance, 64(6), 2481-2513.
Edmans, A., Manso, G. (2011). Governance through trading and intervention: A theory of multiple
blockholders. Review of Financial Studies, 24(7), 2395-2428.
Ewert, R., Wagenhofer, A. (2005). Economic effects of tightening accounting standards to restrict
earnings management. The Accounting Review, 80(4), 1101-1124.
Ewert, R., Wagenhofer, A. (2016). Effects of increasing enforcement on firm value and financial
reporting quality. Working paper.
Fama, E. F., MacBeth, J. D. (1973). Risk, return, and equilibrium: Empirical tests. The Journal of
Political Economy, 607-636.
Farber, D. B. (2005). Restoring trust after fraud: Does corporate governance matter?. The Accounting
Review, 80(2), 539-561.
Fearnley, S. and T. Hines (2003a, September 25). Sour taste of a bad law. Financial Times.
Fearnley, S. and T. Hines (2003b). The regulatory framework for financial reporting and auditing in the
United Kingdom: the present position and impending changes. The International Journal of
Accounting 38, 215-233.
Feroz, E. H., Park, K. J., Pastena, V. (1991). The financial and market effects of the SEC's accounting and
auditing enforcement releases. Journal of Accounting Research, 29, 107-142.
Florou, A., Morricone, S., Pope, P. F. (2016). Is there an enforcement premium in audit fees?. Working
paper.
Foster, G. (1981). Intra-industry information transfers associated with earnings releases. Journal of
Accounting and Economics, 3(3), 201-232.
Francis, J., Nanda, D., Wang, X. (2006). Re-examining the effects of regulation fair disclosure using
foreign listed firms to control for concurrent shocks. Journal of Accounting and Economics, 41(3),
271-292.

33
Gerakos, J., Lang, M., Maffett, M. (2013). Post-listing performance and private sector regulation: The
experience of London's Alternative Investment Market. Journal of Accounting and Economics, 56(2),
189-215.
Gigler, F., Kanodia, C., Sapra, H., Venugopalan, R. (2014). How Frequent Financial Reporting Can
Cause Managerial Short-Termism: An Analysis of the Costs and Benefits of Increasing Reporting
Frequency. Journal of Accounting Research, 52(2), 357-387.
Gintschel, A., Markov, S. (2004). The effectiveness of Regulation FD. Journal of Accounting and
Economics, 37(3), 293-314.
Hail, L., Leuz, C. (2006). International differences in the cost of equity capital: Do legal institutions and
securities regulation matter?. Journal of Accounting Research, 44(3), 485-531.
Heflin, F., Subramanyam, K. R., Zhang, Y. (2003). Regulation FD and the financial information
environment: Early evidence. The Accounting Review, 78(1), 1-37.
Hines, T., McBride, K., Page, M. (1999). An investigation into the stock market reaction to press notices
issued by the Financial Reporting Review Panel. Journal of Applied Accounting Research, 5(2), 54-
82.
Hope, O. K. (2003). Disclosure practices, enforcement of accounting standards, and analysts' forecast
accuracy: An international study. Journal of Accounting Research, 41(2), 235-272.
Iliev, P. (2010). The effect of SOX Section 404: Costs, earnings quality, and stock prices. The Journal of
Finance, 65(3), 1163-1196.
Ince, O. S., Porter, R. B. (2006). Individual equity return data from Thomson Datastream: Handle with
care! Journal of Financial Research, 29(4), 463-479.
Jarrell, G. A. (1981). The economic effects of federal regulation of the market for new security issues.
The Journal of Law Economics, 24(3), 613-675.
Johnson, S., McMillan, J., Woodruff, C. (2002). Courts and relational contracts. Journal of Law,
Economics, and Organization, 18(1), 221-277.
Johnston, R., Petacchi, R. (2015) Regulatory oversight of financial reporting: Securities and Exchange
Commission comment letters. Working paper.
Karolyi, G. A., Lee, K. H., Van Dijk, M. A. (2012). Understanding commonality in liquidity around the
world. Journal of Financial Economics, 105(1), 82-112.
Kim, J. B., Liu, X., Zheng, L. (2012). The impact of mandatory IFRS adoption on audit fees: Theory and
evidence. The Accounting Review, 87(6), 2061-2094.
Kothari, S. P., Ramanna, K., Skinner, D. J. (2010). Implications for GAAP from an analysis of positive
research in accounting. Journal of Accounting and Economics, 50(2), 246-286.
Kraft, A., Vashishtha, R., and Venkatachalam, M. (2016). Frequent Financial Reporting and Managerial
Myopia. Working paper.
Lang, M., Lins, K. V., Maffett, M. (2012). Transparency, liquidity, and valuation: International evidence
on when transparency matters most. Journal of Accounting Research, 50(3), 729-774.
Lang, M., Lundholm, R., (1996). Corporate Disclosure Policy and Analyst Behavior. The Accounting
Review, 71(4), 467-492.
Lang, M., Maffett, M., (2011). Transparency and liquidity uncertainty in crisis periods. Journal of
Accounting and Economics, 52(2), 101-125.
Leuz, C., Wysocki, P. D. (2016). The economics of disclosure and financial reporting regulation:
Evidence and suggestions for future research. Journal of Accounting Research, 54(2), 525-622.
Lesmond, D. A. (2005). Liquidity of emerging markets. Journal of Financial Economics, 77(2), 411-452.
Li, S. (2010). Does mandatory adoption of International Financial Reporting Standards in the European
Union reduce the cost of equity capital? The Accounting Review, 85(2), 607-636.
Li, H., Pincus, M., Rego, S. O. (2008). Market reaction to events surrounding the Sarbanes Oxley Act of
2002 and earnings management. Journal of Law and Economics, 51(1), 111-134.
Mahoney, P., Mei., J. 2013. Mandatory vs. contractual disclosure in securities markets: Evidence from the

34
1930s. Working paper.
Peasnell, K. V., Pope, P. F., Young, S. (2001). The characteristics of firms subject to adverse rulings by
the Financial Reporting Review Panel. Accounting and Business Research, 31(4), 291-311.
Peltzman, S. (1976). Towards a more general theory of regulation. Journal of Law and Economics 19,
211–40.
Posner, R. (1974). Theories of economic regulation. Bell Journal of Economics and Management Science
5, 335–58.
Preiato, J. P., Brown, P. R., Tarca, A. (2013). Mandatory Adoption of IFRS and Analysts’ Forecasts: How
Much Does Enforcement Matter?. UNSW Australian School of Business Research Paper.
Shehata, M. (1991). Self-selection bias and the economic consequences of accounting regulation: An
application of two-stage switching regression to SFAS No. 2. The Accounting Review, 768-787.
Shleifer, A., Vishny, R. W. (1997). A survey of corporate governance. The Journal of Finance, 52(2),
737-783.
Shroff, N., Verdi, R. S., Yost, B. P. (2016). Inter-temporal variation in the externalities of peer-firm
disclosures. Working paper.
Shroff, N., Verdi, R. S., Yu, G. (2013). Information environment and the investment decisions of
multinational corporations. The Accounting Review, 89(2), 759-790.Stein, J. C. (1989). Efficient
capital markets, inefficient firms: A model of myopic corporate behavior. The Quarterly Journal of
Economics, 655-669.
Stigler, G. J. (1964). Public regulation of the securities markets. The Journal of Business, 37(2), 117-142.
Stigler, G. J. (1971). The theory of economic regulation. The Bell Journal of Economics and Management
Science, 3-21.
Watts, R. L., Zimmerman, J. L. (1978). Towards a positive theory of the determination of accounting
standards. The Accounting Review, 112-134.
Watts, R., Zimmerman, J. (1986). Positive theory of accounting. Englewood Cliffs, NY: Prentice-Hall.
Wang, C. (2014). Accounting standards harmonization and financial statement comparability: Evidence
from transnational information transfer. Journal of Accounting Research, 52(4), 955-992.
Wang, I. Y. (2007). Private earnings guidance and its implications for disclosure regulation. The
Accounting Review, 82(5), 1299-1332.
Zhang, I. X. (2007). Economic consequences of the Sarbanes Oxley Act of 2002. Journal of Accounting
and Economics, 44(1), 74-115.
Zingales, L. (2009). The future of securities regulation. Journal of Accounting Research, 47(2), 391-425.

35
Appendix A: Details on FRRP review activity
Table A1: FRRP review activity by year
Panel A: Number of accounts reviewed
Year Accounts Reviewed
Focus Sector
Reviews
FTSE
100
FTSE
250 Other AIM
2005 165 n.d. 52 55 58 n.d.
2006 135 66 28 31 42 34
2007 195 72 46 33 74 42
2008 116 n.d. 31 42 29 14
2009 188 n.d. 27 50 38 73
2010 186 n.d. 25 34 50 77
2011 219 n.d. 23 67 49 80
2012 221 n.d. 38 51 77 55
Average 178 69 42 40 58 38
Panel B: Number of companies contacted
Year Company Contacted
Focus Sector
Reviews
FTSE
100
FTSE
250 Other AIM
2005 67 n.d. 16 24 27 n.d.
2006 58 n.d. 15 9 18 16
2007 112 n.d. 18 24 46 24
2008 99 n.d. 18 37 26 18
2009 96 n.d. 16 24 25 31
2010 136 n.d. 19 22 40 55
2011 133 n.d. 11 37 30 55
2012 122 n.d. 20 25 42 35
Average 103 - 16 19 30 20
Panel C: Number of companies agreeing to changes
Year
Companies Agreeing to
Changes
Focus Sector
Reviews
FTSE
100
FTSE
250 Other AIM
2005 32 n.d. 12 9 11 n.d.
2006 30 10 7 4 8 11
2007 82 22 14 21 34 13
2008 n.d. n.d. n.d. n.d. n.d. n.d.
2009 n.d. n.d. n.d. n.d. n.d. n.d.
2010 n.d. n.d. n.d. n.d. n.d. n.d.
2011 n.d. n.d. n.d. n.d. n.d. n.d.
2012 n.d. n.d. n.d. n.d. n.d. n.d.
Average 48 16 11 11 18 12

36
Appendix A: cont.
Panel D: Number of press releases issued
Year Press Releases
2005 0
2006 3
2007 4
2008 2
2009 2
2010 3
2011 4
2012 0
Average 2
Notes: This table presents actions taken by the FRRP over the sample period from 2004 to 2011. Information on
actions taken is collected from FRRP annual reports. n.d. indicates that the item in question was not disclosed in the
FRRP annual report for that year.

37
Appendix A: cont.
Table A2: Issues identified by the FRRP reviews and highlighted in the FRRP’s annual
reports
2005
Cash flow statements Inconsistencies, incorrect classification of cash flows, insufficient
disclosures.
Provisions and contingent
liabilities
Insufficient explanation of the nature of the obligations.
Accounting policies Insufficient detail to enable reasonably knowledgeable users to
understand the policy applied in practice.
Goodwill and intangible
assets
Insufficient disclosure detail.
Revenue Recognition Insufficient disclosure of practices and procedures (e.g., warranties and
sales returns).
2006
Provisions and contingent
liabilities
Insufficient explanation of the nature of the obligations.
Accounting policies Insufficient detail to enable reasonably knowledgeable users to
understand the policy applied in practice.
Consolidation/acquisitions Some entities not consolidated and insufficient information for
unconsolidated entities. Incorrect calculation of acquisition value or
insufficient disclosure of acquisition value.
Revenue Recognition Insufficient disclosure of practices and procedures.
Derivatives and other
financial instruments
Insufficient disclosure of all the necessary information relevant to holding
or issuing of financial instruments during the year.
2007
Accounting policies Insufficient disclosure of practices and procedures (e.g., warranties and
sales returns).
Consolidation/acquisitions Some entities not consolidated and insufficient information for
unconsolidated entities. Incorrect calculation of acquisition value or
insufficient disclosure of acquisition value.
Cash flow statements Inconsistencies, incorrect classification of cash flows, insufficient
disclosures.
Reporting financial
performance
Failure to present separately the aggregate results of continuing
operations, acquisitions and discontinued operations.
Fair values in acquisition
accounting
Insufficient disclosure detail.
Associates and joint ventures Insufficient disclosure detail.
Goodwill and intangible
assets
Weak disclosures on the presumptions of accounting treatments.
Impairment of fixed assets
and goodwill
Insufficient disclosure of the accounting treatments.
Provisions and contingent
liabilities
Insufficient explanation of the nature of the obligations.
Retirement benefits Insufficient disclosure of the accounting measurements.

38
Income taxes, deferred tax Unable to recognize deferred tax expenses.
Financial instruments
disclosures and presentation
Insufficient disclosure about risk arising from financial instruments.
Earnings per share Incorrect calculation of the diluted and basic eps.
2008
Judgements, Estimates, and
Risks
Disclosures tend towards boiler-plate and do not refer to the specific
issues faced by individual companies.
Accounting policies Insufficient detail to enable reasonably knowledgeable users to
understand the policy applied in practice.
Consolidation/acquisitions Some entities not consolidated and insufficient information for
unconsolidated entities. Incorrect calculation of acquisition value or
insufficient disclosure of acquisition value.
Departure from standards Departures from the requirements of IFRS
Revenue Recognition Insufficient disclosure of practices and procedures.
Consolidation/acquisitions Some entities not consolidated and insufficient information for
unconsolidated entities. Incorrect calculation of acquisition value or
insufficient disclosure of acquisition value.
Banks' annual financial
statements
Need for refinement of certain disclosures.
Transparency of disclosure
about financial instruments
Insufficient disclosure about risk arising from financial instruments.
Presentation of financial
statements
Insufficient disclosure of narrative and descriptive comparative
information.
Inventories Insufficient disclosure of recognition and valuation.
Construction Contracts Insufficient disclosure of the determinants of the stage of completion of
construction contracts.
Income taxes, deferred tax Unable to recognize deferred tax expenses.
Leases Failure to disclose significant leasing arrangements (i.e., the total of the
future minimum lease obligation).
The effects of changes in
foreign exchange rates
Insufficient disclosure of recognition and measurement details.
Borrowing costs Insufficient disclosure of the capitalization rate.
Related Party Disclosures Lack of disclosures for related parties and the relationship.
Consolidation / acquisitions Some entities not consolidated and insufficient information for
unconsolidated entities. Incorrect calculation of acquisition value or
insufficient disclosure of acquisition value.
Impairment of Assets Insufficient disclosures regarding the assumptions underlying
management’s cash flow projection, discount and growth rates.
Share - based payment Insufficient disclosure of the weighted average share price.
Business Combinations Insufficient disclosure of the factors related to the cost of a business and
information on the combined entity.
2009
Judgements, Estimates, and
Risks
Disclosures tend towards boiler-plate and do not refer to the specific
issues faced by individual companies.
Accounting policies Insufficient detail to enable reasonably knowledgeable users to
understand the policy applied in practice.

39
Impairment of Assets Insufficient disclosures regarding the assumptions underlying
management’s cash flow projections and discount and growth rates.
Capital disclosures Insufficient disclosures to help users evaluate a company's objectives,
policies and processes for managing capital.
Assets and liabilities
classification
Inappropriate classification.
Leases Failure to disclose significant leasing arrangements (i.e., the total of the
future minimum lease obligation).
Revenue Recognition Insufficient disclosure of practices and procedures.
Consolidation/acquisitions Some entities not consolidated and insufficient information for
unconsolidated entities. Incorrect calculation of acquisition value or
insufficient disclosure of acquisition value.
Financial instruments
disclosures
Insufficient disclosure about risk arising from financial instruments.
Operating segments Insufficient explanations of the decision to aggregate operating segments.
2010
Segment disclosures Segments omitted although it is clear that the entity has multiple entities
from qualitative discussion of the business.
Provisions and contingent
liabilities
Insufficient explanation of the nature of the obligations.
Judgements, Estimates, and
Risks
Disclosures tend towards boiler-plate and do not refer to the specific
issues faced by individual companies.
Accounting policies Insufficient detail to enable reasonably knowledgeable users to
understand the policy applied in practice.
Consolidation/acquisitions Some entities not consolidated and insufficient information for
unconsolidated entities. Incorrect calculation of acquisition value or
insufficient disclosure of acquisition value.
Impairment of Assets Insufficient disclosures regarding the assumptions underlying
management’s cash flow projections and discount and growth rates.
Related-party disclosures Lack of disclosures for non-executives directors. Insufficient disclosures
regarding the nature of certain relationships and management
compensation.
Cash flow statements Inconsistencies, incorrect classification of cash flows and insufficient
disclosures.
Capital disclosures Insufficient disclosures to help users evaluate a company's objectives,
policies and processes for managing capital.
Leases Failure to disclose the total of future minimum lease and sub-lease
payments under non-cancellable operating leases in the periods specified
by the standard.
Revenue Insufficient disclosure of practices and procedures (e.g., how the stage of
completion was established).
Business combinations and
intangible assets
Insufficient disclosure of the recognition and measurement criteria.
Financial instruments
disclosures
Insufficient disclosure about risk arising from financial instruments.
Operating segments Insufficient explanations of the decision to aggregate operating segments.

40
2011
Segment disclosures Segments omitted although it is clear that the entity has multiple entities
from qualitative discussion of the business.
Provisions and contingent
liabilities
Insufficient explanation of the nature of the obligations.
Judgements, Estimates, and
Risks
Disclosures tend towards boiler-plate and do not refer to the specific
issues faced by individual companies.
Accounting policies Insufficient detail to enable reasonably knowledgeable users to
understand the policy applied in practice.
Consolidation/acquisitions Some entities not consolidated and insufficient information for
unconsolidated entities. Incorrect calculation of acquisition value or
insufficient disclosure of acquisition value.
Impairment of Assets Insufficient disclosures regarding the assumptions underlying
management’s cash flow projection, discount and growth rates.
Related Party Disclosures Lack of disclosures for non-executives directors. Insufficient disclosures
regarding the nature of certain relationships and management
compensation.
Cash flow statements Inconsistencies, incorrect classification of cash flows, insufficient
disclosures.
Comparative information Insufficient disclosure of relevant explanations required by the standard
(e.g., the reasons for reclassification).
Income taxes, deferred tax Unable to recognize deferred tax expenses.
Leases Failure to disclose the total of future minimum lease and sub-lease
payments under non-cancellable operating leases in the periods specified
by the standard.
Revenue Insufficient disclosure of practices and procedures (e.g., how the stage of
completion was established).
Share-based payment Insufficient disclosure of practices.
Business combinations Insufficient disclosure of the recognition criteria.
Renegotiation of borrowing
facilities
Insufficient disclosure of the modification of the terms of the loan due to
the renegotiation.
Operating segments Insufficient explanations of the decision to aggregate operating segments.
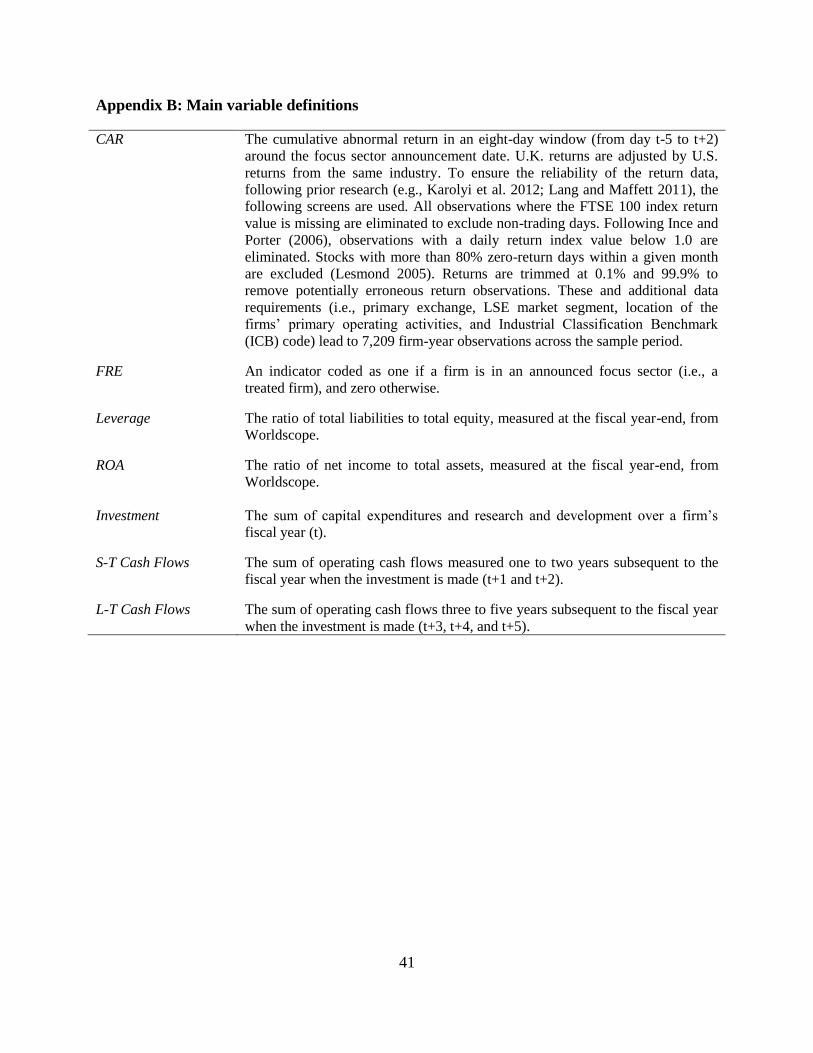
41
Appendix B: Main variable definitions
CAR The cumulative abnormal return in an eight-day window (from day t-5 to t+2)
around the focus sector announcement date. U.K. returns are adjusted by U.S.
returns from the same industry. To ensure the reliability of the return data,
following prior research (e.g., Karolyi et al. 2012; Lang and Maffett 2011), the
following screens are used. All observations where the FTSE 100 index return
value is missing are eliminated to exclude non-trading days. Following Ince and
Porter (2006), observations with a daily return index value below 1.0 are
eliminated. Stocks with more than 80% zero-return days within a given month
are excluded (Lesmond 2005). Returns are trimmed at 0.1% and 99.9% to
remove potentially erroneous return observations. These and additional data
requirements (i.e., primary exchange, LSE market segment, location of the
firms’ primary operating activities, and Industrial Classification Benchmark
(ICB) code) lead to 7,209 firm-year observations across the sample period.
FRE An indicator coded as one if a firm is in an announced focus sector (i.e., a
treated firm), and zero otherwise.
Leverage The ratio of total liabilities to total equity, measured at the fiscal year-end, from
Worldscope.
ROA The ratio of net income to total assets, measured at the fiscal year-end, from
Worldscope.
Investment The sum of capital expenditures and research and development over a firm’s
fiscal year (t).
S-T Cash Flows The sum of operating cash flows measured one to two years subsequent to the
fiscal year when the investment is made (t+1 and t+2).
L-T Cash Flows The sum of operating cash flows three to five years subsequent to the fiscal year
when the investment is made (t+3, t+4, and t+5).

42
Figure 1: Effect of Enforcement on the Market Value of Equity in Event Time
Notes: This figure plots, in event time, the daily cumulative average abnormal returns (CAARs). CAARs are
computed as the average difference between the U.S. industry-adjusted CAR for focus-sector compared to non-
focus-sector firms. The vertical axis indicates CAAR. The horizontal axis indicates the event day in a 31 day
estimation window [t-15, t+15], where t = 0 denotes the focus-sector announcement day, and time is counted in
trading days.
-0.015
-0.010
-0.005
0.000
0.005
0.010
0.015
-15 -14 -13 -12 -11 -10 -9 -8 -7 -6 -5 -4 -3 -2 -1 0 1 2 3 4 5 6 7 8 9 10 11 12 13 14 15
CAARCAACAAR
day, t
day, t

43
Table 1: Enforcement Intensity for Focus-Sector and Non-Focus-Sector Firms
Notes: This table reports the enforcement intensity for firms in focus sectors relative to those in non-focus sectors.
The data is obtained from the FRRP annual report for 2008 (i.e., the 2007 focus-sector announcement). The change
in the probability of review upon announcement is calculated by comparing the probability of a review conditional
on knowing the focus sectors announced in 2007 to the unconditional probability. For instance, for focus-sector
firms the expected probability of a review increases by (11.4%-5.9%)/5.9%=93% if you know the firm is in a focus
sector. Based on this approach and assuming that there is no anticipation of the selected sectors, the estimated
change in the expected probability of a review is 148% upon the announcement of the focus sectors (i.e., (11.4%-
4.6%)/4.6%=148%).
All firmsFocus-Sector
Firms
Non-Focus-
sector Firms
Number of reviews 195 72 123
Number of firms 3,305 633 2,672
Probability of review 5.9% 11.4% 4.6%
Change in probability upon knowing focus sectors — 93% -22%
Incremental probability for focus sector firms — 148% —

44
Table 2: Focus Sectors from 2004 to 2011
Notes: This table presents the announcement dates, the review year, focus sectors announced, and the number of
treated and non-treated firms each year. Announcement dates and focus sectors are collected from FRRP press
releases.
First Second Third Fourth Fifth Treated Non-treated
(1) (2) (3) (4) (5) (6) (7)
December 21, AutomobilePharma-
ceuticalRetail Transport Utilities
2004 3 14 41 11 11 80 569
December 12, AutomobilePharma-
ceuticalRetail Transport Utility
2005 3 20 41 12 11 87 709
December 11,Travel and
leisureRetail Utility
Telecom-
municationsMedia
2006 51 45 14 12 52 174 725
November 9 Banking Retail Travel and
leisure
Commercial
property
House
builders
2007 105 48 60 43 12 268 834
October 30, Banking RetailTravel and
leisure
Commercial
property
House
builders
2008 96 45 58 36 12 247 759
December 9, Commercial
PropertyAdvertising Recruitment Media
Information
technology
2009 28 17 12 20 74 151 744
November 25,Commercial
PropertyInsurance
Support
servicesTravel —
2010 30 24 103 17 174 807
December 9, Commercial
PropertyRetail
Support
services— —
2011 27 40 96 163 718
Focus Sectors (treated) N (firms)
2009/10
2011/12
Periods
2010/11
Announce-
ment DatesFiscal Year
2006/07
2005/06
2004/05
2007/08
2008/09

45
Table 3: Effect of Enforcement on the Market Value of Equity
Notes: This table reports results from our analysis of the effect of FRE on the market value of equity. The sample
period is from 2004 to 2011. In Panel A, we report the average effect across all years and in Panel B we report
results by year. FRE is a binary indicator that takes the value of one for firms in focus sectors in a given year and
zero for all other firms. In Column (1), the dependent variable is the raw cumulative abnormal return (CAR). In
Columns (2) to (4), the dependent variable is the U.S. industry-adjusted CAR. See Appendix A for further details on
the calculation of CAR. In Columns (1) and (2), we estimate the effect using OLS. In Columns (3) and (4) we use
quantile and Fama-MacBeth regressions, respectively. In Columns (1) to (3) we cluster standards errors by
announcement. T-statistics are reported in parentheses. *, **, and *** indicate significance (two-sided) at the 10%,
5%, and 1% levels, respectively.
Unadjusted
Average Average Median Fama-MacBeth
(1) (2) (3) (4)
FRE -0.012*** -0.020*** -0.017*** -0.015***
(-4.22) (-6.36) (-4.40) (-3.86)
R-squared 0.002 0.007 0.007 0.007
N (firm-announcements) 7,209 7,209 7,209 7,209
Panel B: Effect by Announcement
Treatment effects:
FRE_2004 0.001 0.001 0.009 —
(0.24) (0.12) (1.25)
FRE_2005 -0.001 -0.006 0.006 —
(-0.17) (-0.95) (1.00)
FRE_2006 -0.013** -0.023*** -0.020*** —
(-2.01) (-3.60) (-4.04)
FRE_2007 -0.012** -0.029*** -0.030*** —
(-2.47) (-5.54) (-6.20)
FRE_2008 -0.007 -0.010 -0.006 —
(-0.65) (-0.88) (-0.52)
FRE_2009 -0.002 -0.015* -0.017*** —
(-0.22) (-1.92) (-2.71)
FRE_2010 -0.011* -0.009 -0.008* —
(-1.74) (-1.37) (-1.76)
FRE_2011 -0.016** -0.027*** -0.018*** —
(-2.49) (-4.04) (-3.10)
Panel A: All (eight) Announcements
Dependent Variable: Cumulative Abnormal
Returns (-5 to +2)
US-Industry-Adjusted

46
Table 4: Effect of Enforcement Conditional on Existing Enforcement Regime
Notes: This table reports treatment effects conditional on whether firms are listed in the Main Market or the
Alternative Investment Market (AIM). The sample period is from 2004 to 2011 and the dependent variable is the
U.S. industry-adjusted CAR. FRE_Main Market (FRE_AIM) is a binary indicator that takes on the value of one for
firms in focus sectors listed on the Main Market (AIM). See Appendix A for further details on variable definitions.
We cluster standards errors by announcement and report t-statistics in parentheses. *, **, and *** indicate
significance (two-sided) at the 10%, 5%, and 1% levels, respectively.
All
Announcements
Treatments effects:
FRE_Main Market -0.016***
(-9.59)
FRE_AIM -0.024***
(-5.03)
Incremental effect for AIM:
FRE_AIM minus FRE_Main Market -0.008**
(-2.12)
R-squared 0.007
N (firm-announcements) 7,078
Dependent Variable: CAR (US-Industry-Adj., -5 to +2)

47
Table 5: Cross-Sectional variation in the Effect of Increased Enforcement Intensity on the
Market Value of Equity
Pooled Main Market AIM
(1) (2) (3)
Panel A: Big vs. small firms
Treatment Effects:
FRE_Small Firms -0.019*** -0.015*** -0.025**
(-3.94) (-9.05) (-2.09)
FRE_Large Firms -0.019*** -0.017*** -0.024***
(-6.00) (-4.33) (-4.50)
Incremental effect for large firms:
FRE_Large minus FRE_Small Firms -0.000 -0.002 0.001
(-0.08) (-0.54) (0.08)
R-squared 0.006 0.007 0.006
N (firm-announcements) 7,078 3,877 3,201
Panel B: Blockholder vs. no blockholder
Treatment effects:
FRE_No Blockholders -0.009* -0.005 -0.024***
(-2.17) (-0.83) (-5.65)
FRE_Blockholders -0.023*** -0.018*** -0.029***
(-5.73) (-8.30) (-5.05)
Incremental effect for blockholders:
FRE_Blockholders minus FRE_No Blockholders -0.014** -0.013* -0.005
(-2.33) (-1.95) (-0.91)
R-squared 0.007 0.006 0.008
N (firm-announcements) 6,367 3,497 2,870
Panel C: Analysts following vs. no analysts following
Treatment effects:
FRE_Low Analyst Following -0.020*** -0.016*** -0.024***
(-4.01) (-4.36) (-3.05)
FRE_High Analyst Following -0.020*** -0.016** -0.025***
(-3.39) (-2.13) (-3.01)
Incremental effect for high analyst following:
FRE_High Analyst Following minus FRE_Low Analyst Following 0.000 -0.000 -0.001
(0.00) (-0.04) (-0.04)
R-squared 0.007 0.008 0.006
N (firm-announcements) 7,079 3,862 3,217
Panel D: Big4 vs. Not Big4
Treatment effects:
FRE_Not Big4 Auditor -0.021*** -0.010* -0.024***
(-4.05) (-1.85) (-3.97)
FRE_Big4 Auditor -0.020*** -0.018*** -0.024**
(-6.61) (-9.57) (-2.30)
Incremental effect for Big4 auditors:
FRE_Big4 Auditor minus FRE_Not Big4 Auditor 0.001 -0.008 -0.000
(0.27) (-1.27) (-0.03)
R-squared 0.006 0.008 0.007
N (firm-announcements) 7,079 3,862 3,217
Dependent Variable: CAR (US-Industry-Adj., -5 to +2)

48
Table 5 continued
Notes: This table reports treatment effects of FRE conditional on the size of firms (Panel A), blockholder ownership
(Panel B), and Analyst following (Panel C). The sample period is from 2004 to 2011 and the dependent variable is
the U.S. industry-adjusted CAR. FRE_Small Firms (FRE_Large Firms) is a binary indicator that takes on the value
of one for firms in focus sectors that are below (above) the median assets in each market segment.
FRE_Blockholders (FRE_No Blockholders) is a binary indicator that takes the value of one for firms in focus sectors
with (without) at least one blockholder. Blockholder is defined as a firm with any unique owner holding a position
larger than 5% in AVSR database with the classifications:1. Execution-Only Stockbrokers; 2. Full-Service
Stockbrokers; 3. Private-Client Investment Managers; 4. Private Banks; 5. Institutions. FRE_Low Analyst Following
(FRE_High Analyst Following) is a binary indicator that takes on the value of one for firms in focus sectors that are
below (above) the mean number of analysts in each market segment. FRE_Big4 Auditor (FRE_Not Big4 Auditor) is
a binary indicator that takes the value of one for firms in focus sectors with (without) a Big-4 auditor. We classify
Deloitte, PwC, EY, and KPMG as Big-4 Auditors. See Appendix A for further details on variable definitions. We
cluster standards errors by announcement and report t-statistics in parentheses. *, **, and *** indicate significance
(two-sided) at the 10%, 5%, and 1% levels, respectively.

49
Table 6: Enforcement and Compliance Costs
Notes: This table reports results from our analysis of the effect of FRE on compliance costs, which we proxy for
using audit fees. The sample period is from 1995 to 2012. Panel A presents descriptive statistics for firms included
in the analyses and Panel B presents OLS regression estimates of the effect of FRE on audit fees. Audit Fee is the
total annual audit fees. Size is the natural log of total assets. Leverage is the ratio of total liabilities to total assets.
ROA is the ratio of net income to total assets. FRE(t=0 to t=n) is a binary indicator that takes on the value of one for
firms in focus sectors beginning the year of increased scrutiny thru the end of the sample period. FRE(t=0) is a binary
indicator that takes on the value of one for firms in focus sectors in the year of increased scrutiny. FRE(t=1) is a
binary indicator that takes on the value of one for firms in focus sectors in the year after increased scrutiny. FRE(t=2
to t=n) is a binary indicator that takes the value of one for firms in focus sectors in all years subsequent to the year
after increased scrutiny. See Appendix A for further details on variable definitions. We cluster standards errors by
industry and report t-statistics in parentheses. All regressions include industry and year fixed effects. *, **, and ***
indicate significance (two-sided) at the 10%, 5%, and 1% levels, respectively.
Panel A: Descriptive Statistics for Audit Fee Analyses
N Mean Std. Dev. p1 Median p99
Audit Fee ($m) 23,077 0.983 2.921 0.007 0.172 16.866
Total Assets ($m) 23,077 1,368 6,669 0 61 28,715
Leverage 23,077 0.561 0.619 0.013 0.497 2.827
ROA 23,077 -0.116 0.621 -3.031 0.038 0.365
Dependent Variable: Log(Audit Fee)
First &
Subsequent
Years
First vs.
Subsequent
Years
(1) (2)
Treatment effects:
FRE(t=0 to t=n) 0.077*** —
(3.08)
FRE(t=0) — 0.018
(0.94)
FRE(t=1) — 0.078***
(3.61)
FRE(t=2 to t=n) — 0.064*
(1.94)
Control variables:
Log(Total Assets) 0.652*** 0.652***
(59.87) (59.83)
Leverage 0.122*** 0.122***
(5.87) (5.86)
ROA -0.288*** -0.288***
(-14.47) (-14.51)
Fixed Effects:
Industry Yes Yes
Year Yes Yes
Observations 23,077 23,077
R-squared 0.812 0.812
Panel B: Change in Audit Fees Around Increased Enforcement Intensity
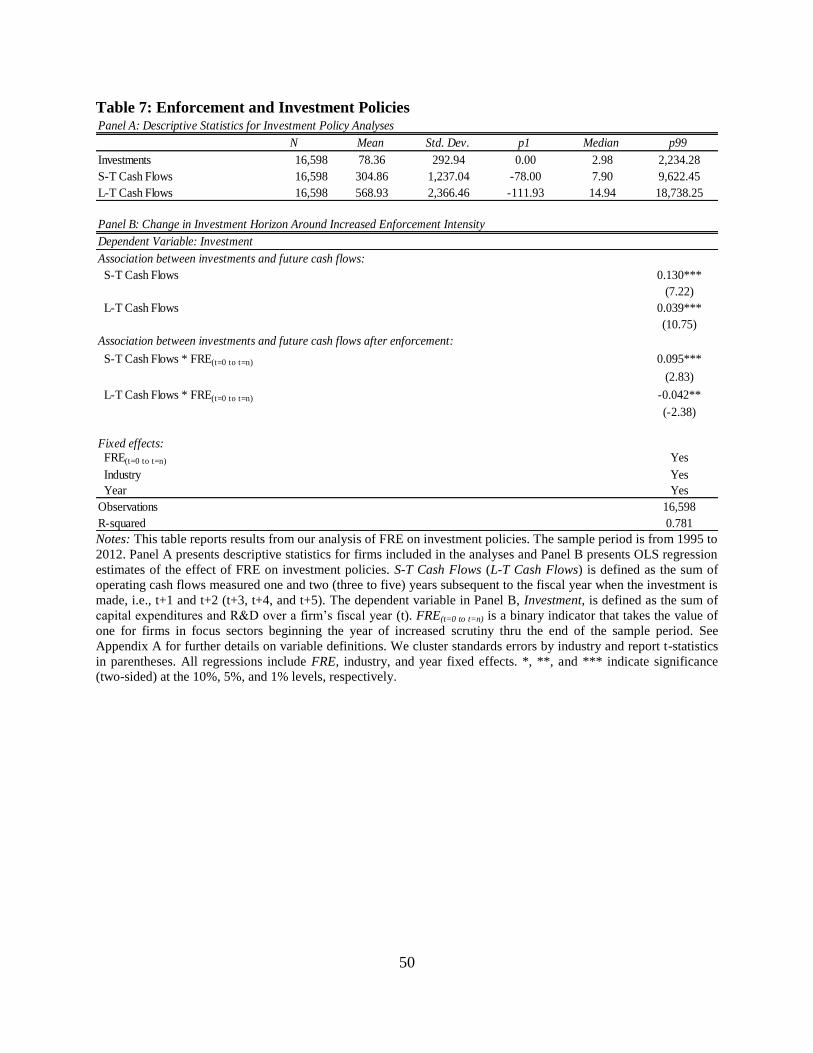
50
Table 7: Enforcement and Investment Policies
Notes: This table reports results from our analysis of FRE on investment policies. The sample period is from 1995 to
2012. Panel A presents descriptive statistics for firms included in the analyses and Panel B presents OLS regression
estimates of the effect of FRE on investment policies. S-T Cash Flows (L-T Cash Flows) is defined as the sum of
operating cash flows measured one and two (three to five) years subsequent to the fiscal year when the investment is
made, i.e., t+1 and t+2 (t+3, t+4, and t+5). The dependent variable in Panel B, Investment, is defined as the sum of
capital expenditures and R&D over a firm’s fiscal year (t). FRE(t=0 to t=n) is a binary indicator that takes the value of
one for firms in focus sectors beginning the year of increased scrutiny thru the end of the sample period. See
Appendix A for further details on variable definitions. We cluster standards errors by industry and report t-statistics
in parentheses. All regressions include FRE, industry, and year fixed effects. *, **, and *** indicate significance
(two-sided) at the 10%, 5%, and 1% levels, respectively.
Panel A: Descriptive Statistics for Investment Policy Analyses
N Mean Std. Dev. p1 Median p99
Investments 16,598 78.36 292.94 0.00 2.98 2,234.28
S-T Cash Flows 16,598 304.86 1,237.04 -78.00 7.90 9,622.45
L-T Cash Flows 16,598 568.93 2,366.46 -111.93 14.94 18,738.25
Panel B: Change in Investment Horizon Around Increased Enforcement Intensity
Dependent Variable: Investment
Association between investments and future cash flows:
S-T Cash Flows 0.130***
(7.22)
L-T Cash Flows 0.039***
(10.75)
Association between investments and future cash flows after enforcement:
S-T Cash Flows * FRE(t=0 to t=n) 0.095***
(2.83)
L-T Cash Flows * FRE(t=0 to t=n) -0.042**
(-2.38)
Fixed effects: FRE(t=0 to t=n) Yes
Industry Yes
Year Yes
Observations 16,598
R-squared 0.781