proactive planning for catastrophic events in supply chains
TRANSCRIPT
-Shriram Prabhu S & Shanmukha Sreenivas P
1
Journal of Operations ManagementA.Micheal Knemeyer, Walter Zinn, Cuneyt Eroglu
Shriram Prabhu.S Shanmukha
Sreenivas.P
Proactive planning for catastrophic events in supply chains
-Shriram Prabhu S & Shanmukha Sreenivas P
2
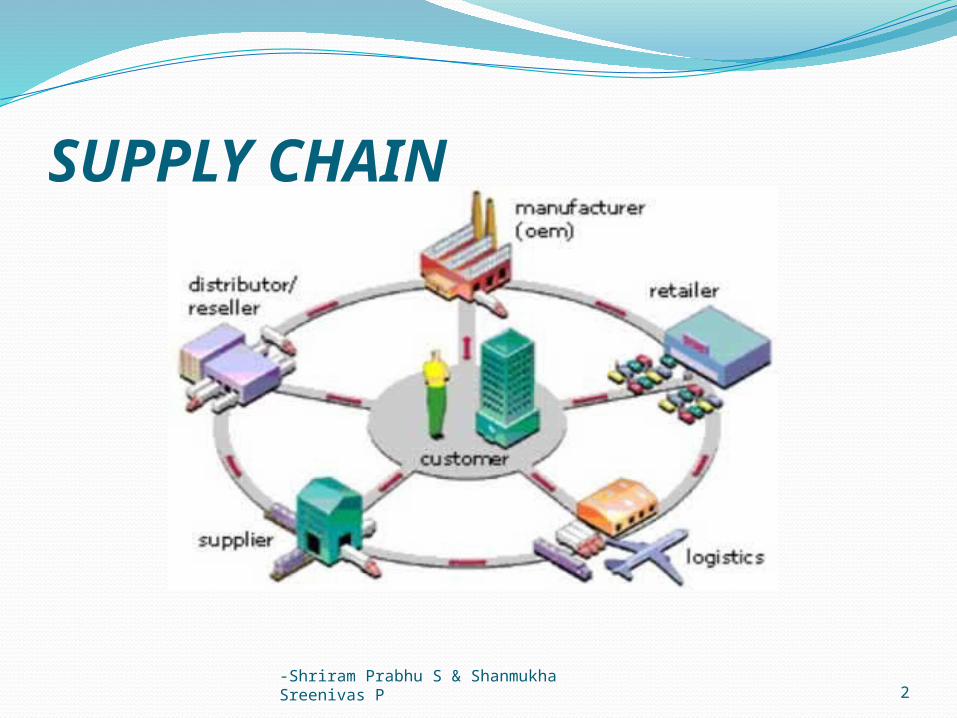
SUPPLY CHAIN
-Shriram Prabhu S & Shanmukha Sreenivas P
3
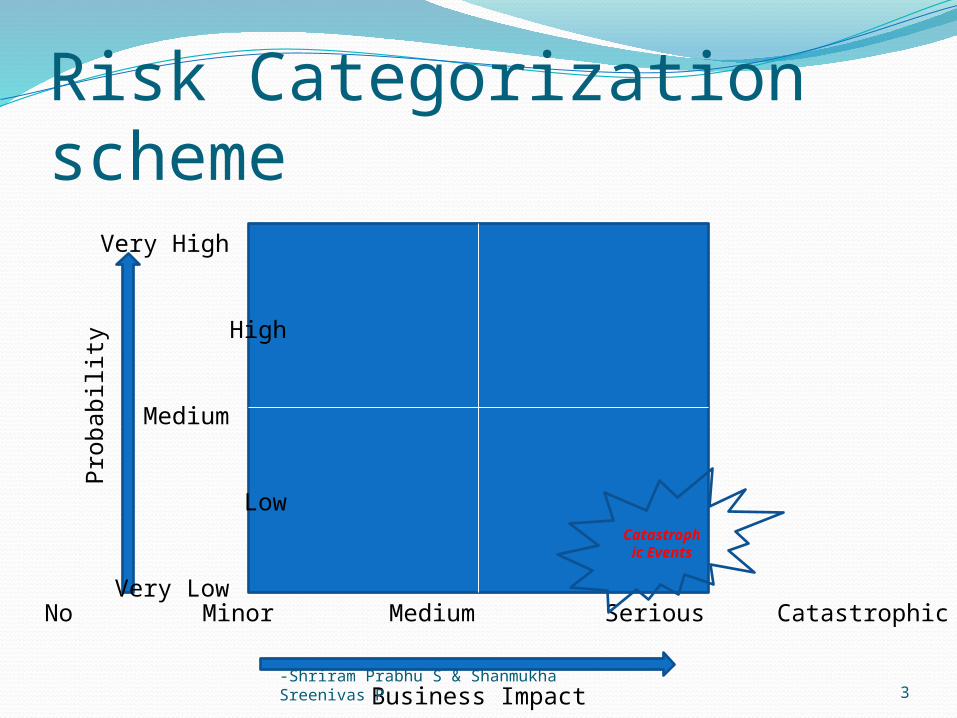
Risk Categorization scheme
No Minor Medium Serious Catastrophic
Business Impact
Pro
bab
ilit
y
Very High
High
Medium
Low
Very Low
Catastrophic
Events
-Shriram Prabhu S & Shanmukha Sreenivas P
4
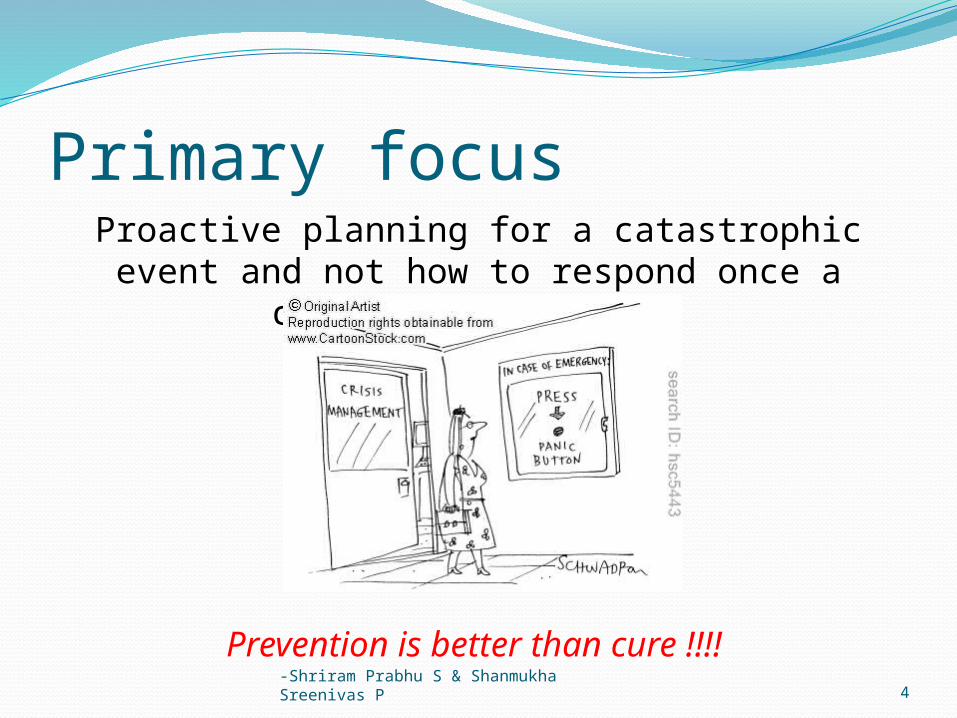
Primary focusProactive planning for a catastrophic event and not how to respond once a catastrophe occurs .
Prevention is better than cure !!!!
-Shriram Prabhu S & Shanmukha Sreenivas P
5
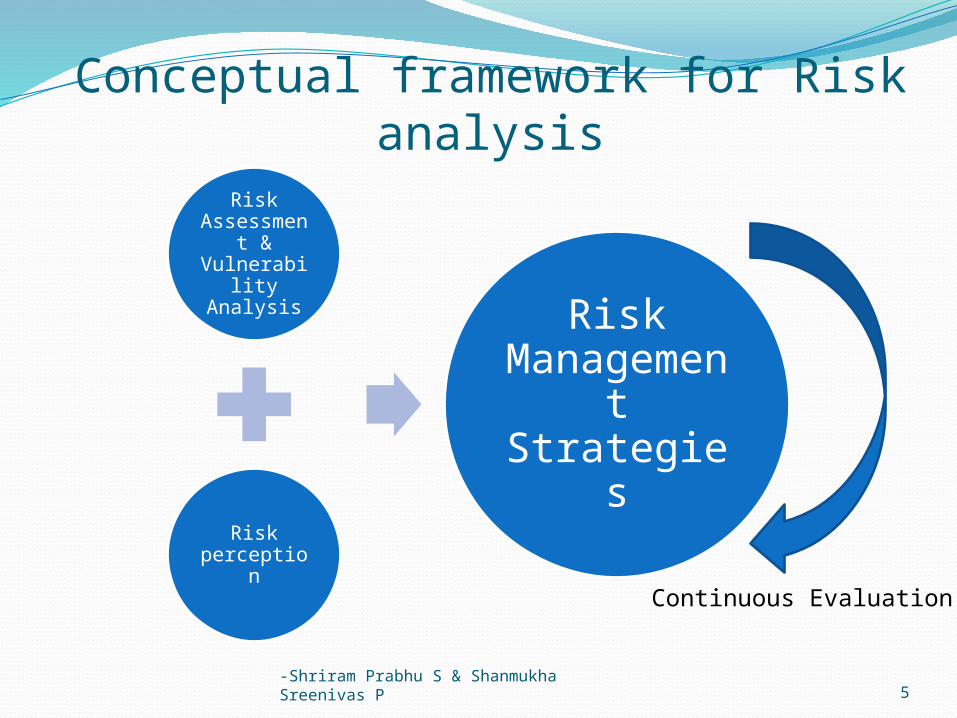
Conceptual framework for Risk analysisRisk
Assessment &
Vulnerability Analysis
Risk perception
Risk Manageme
nt Strategies
Continuous Evaluation
-Shriram Prabhu S & Shanmukha Sreenivas P
6
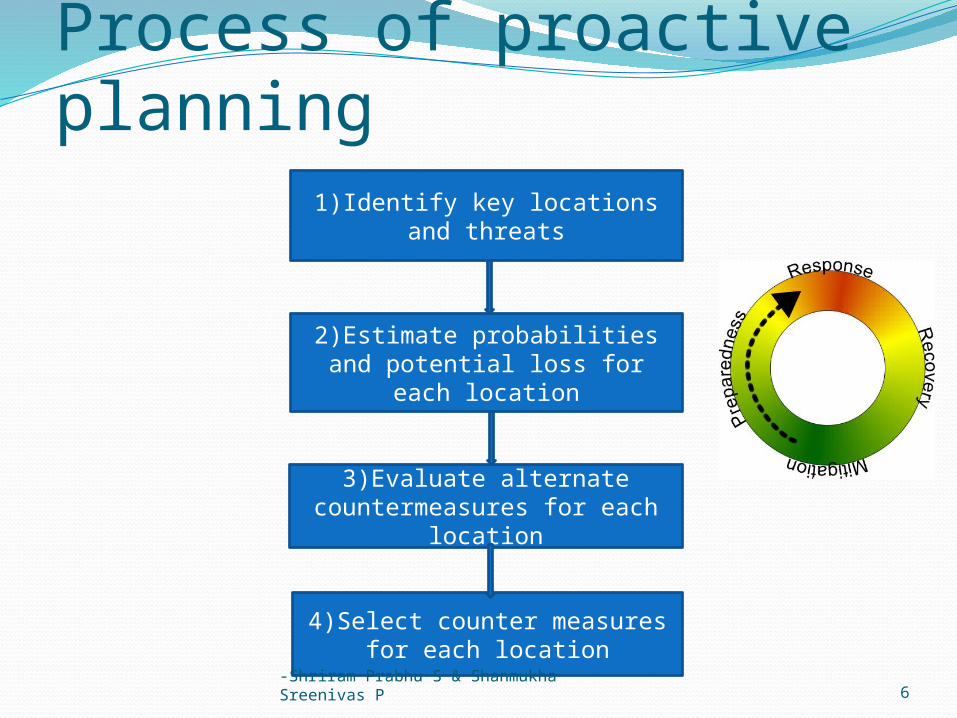
Process of proactive planning1)Identify key locations and
threats
4)Select counter measures for each location
3)Evaluate alternate countermeasures for each
location
2)Estimate probabilities and potential loss for each
location
-Shriram Prabhu S & Shanmukha Sreenivas P
7
Step 1a: Identify key locationsA location is considered key if interruption of
its operations results in a major disruption in the flow of goods in the supply chain.
One methodology used for the same is supply chain mapping.
-Shriram Prabhu S & Shanmukha Sreenivas P
8
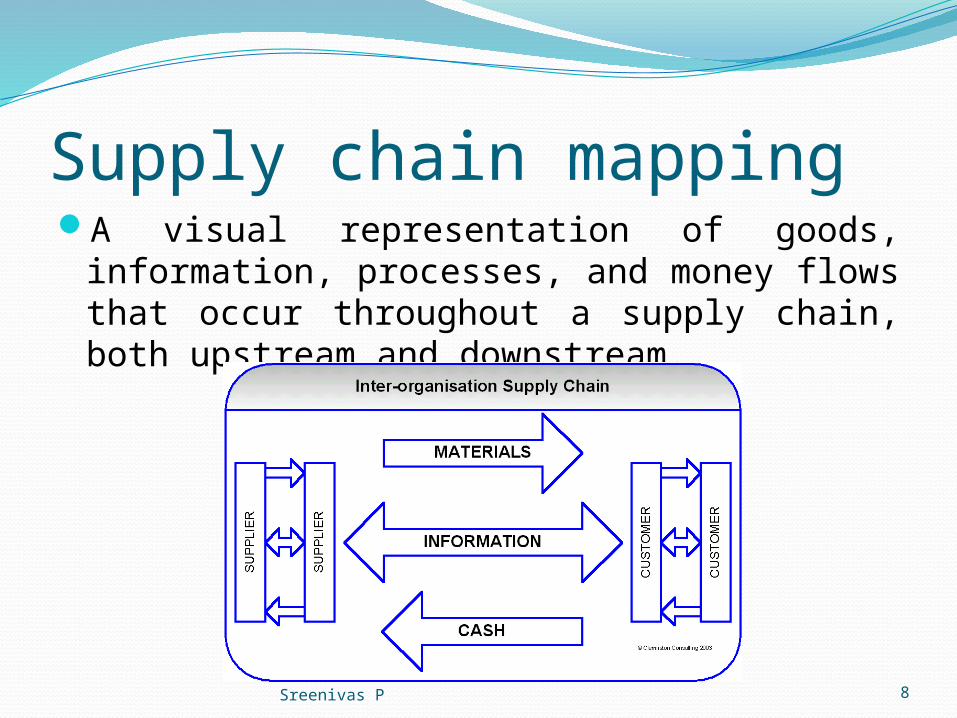
Supply chain mappingA visual representation of goods, information,
processes, and money flows that occur throughout a supply chain, both upstream and downstream.
-Shriram Prabhu S & Shanmukha Sreenivas P
9
Why supply chain mapping?Supply chains must now compete against
other supply chainsSupply chains are a points of strategic
advantageMaps highlight inefficienciesProvide a methodology for analyzing
processes
-Shriram Prabhu S & Shanmukha Sreenivas P
10
Step 1b: Listing of threatsOnce key locations are identified , a list of
potential threats to each location should be established.
Possible sources – Public sources, Insurance companies.
-Shriram Prabhu S & Shanmukha Sreenivas P
11
Step 2a: Estimation of probabilitiesIn this step, we estimate probabilities for
each potential catastrophe for each key location
Simulators are used typically. These use historical data as input.
-Shriram Prabhu S & Shanmukha Sreenivas P
12
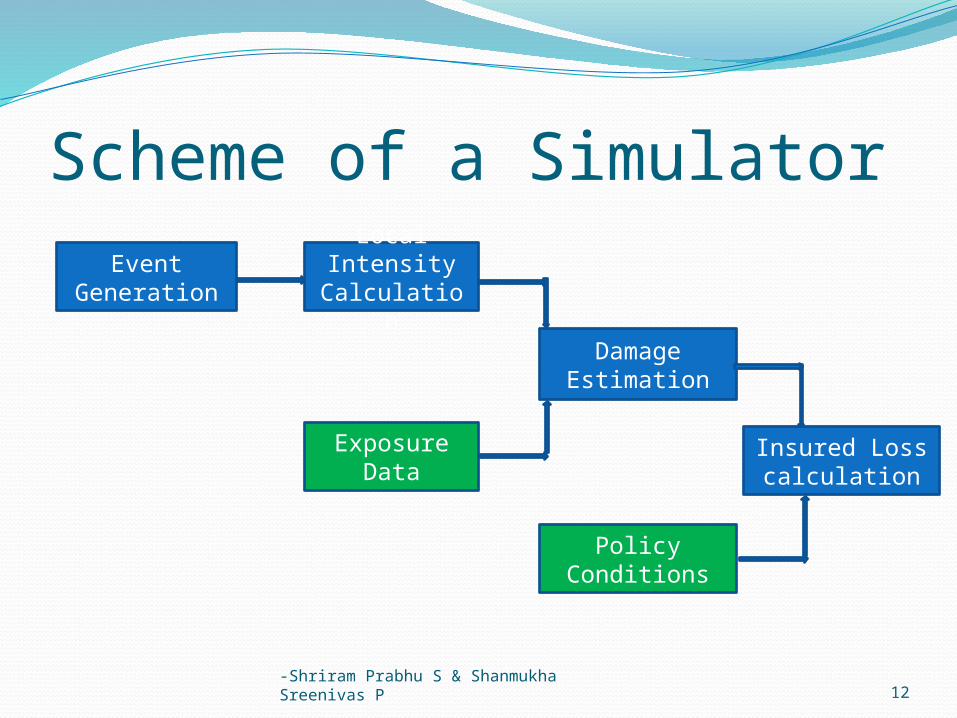
Scheme of a Simulator
Policy Conditions
Damage Estimation
Exposure Data
Local Intensity
Calculation
Event Generation
Insured Loss calculation
-Shriram Prabhu S & Shanmukha Sreenivas P
13
Step 2a: Contd. The probability distributions for different
potential catastrophes are convolved to produce a consolidated probability distribution for each key location
Point estimates are generated by looking at hypothetical loss values.
Disruption Analysis Network DA_NET Wu et al. (2007)This paper presents a network-based modelling methodology to determine how changes or disruptions propagate in supply chains and how those changes or disruptions affect the supply chain system.
-Shriram Prabhu S & Shanmukha Sreenivas P
14
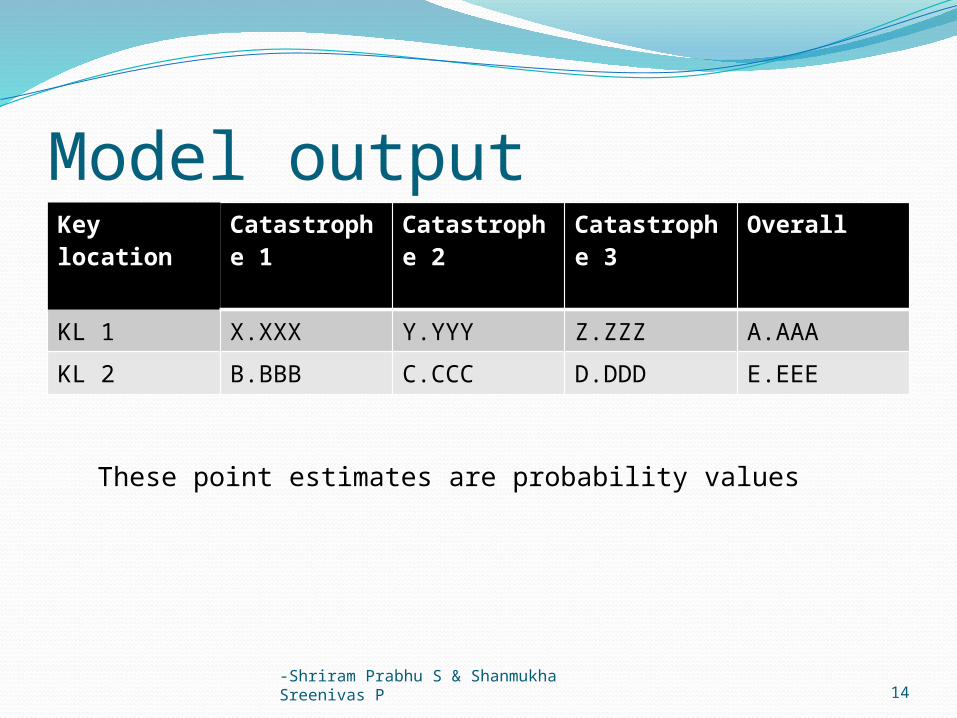
Model outputKey location
Catastrophe 1
Catastrophe 2
Catastrophe 3
Overall
KL 1 X.XXX Y.YYY Z.ZZZ A.AAA
KL 2 B.BBB C.CCC D.DDD E.EEE
These point estimates are probability values
-Shriram Prabhu S & Shanmukha Sreenivas P
15
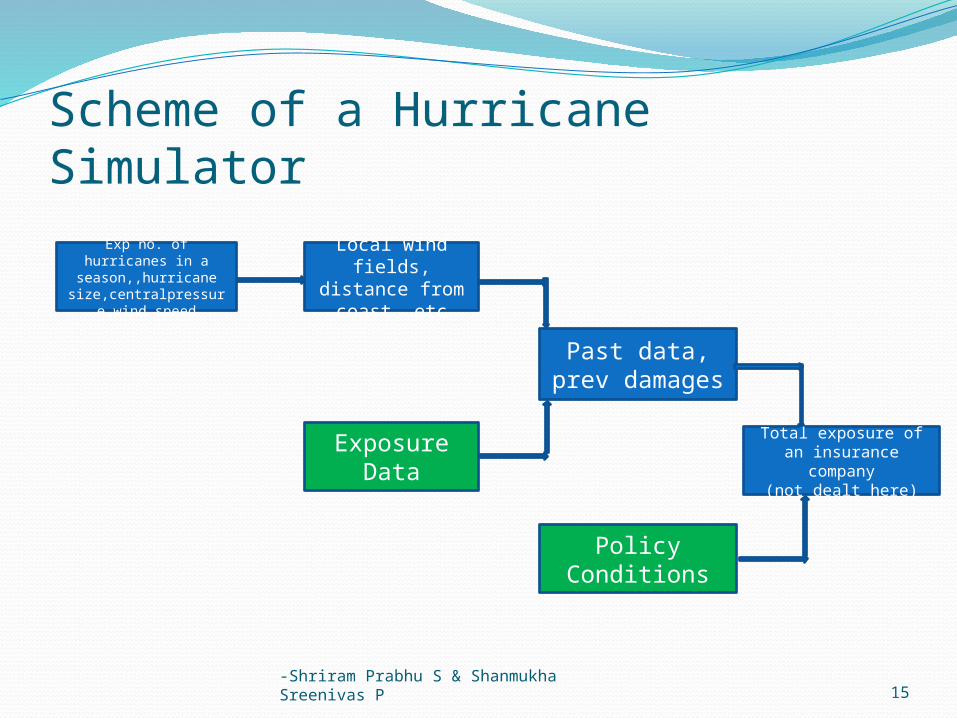
Scheme of a Hurricane Simulator
Policy Conditions
Past data, prev damages
Exposure Data
Local wind fields, distance from coast..etc
Exp no. of hurricanes in a season,,hurricane size,centralpressure,w
ind speed
Total exposure of an insurance company
(not dealt here)
-Shriram Prabhu S & Shanmukha Sreenivas P
16
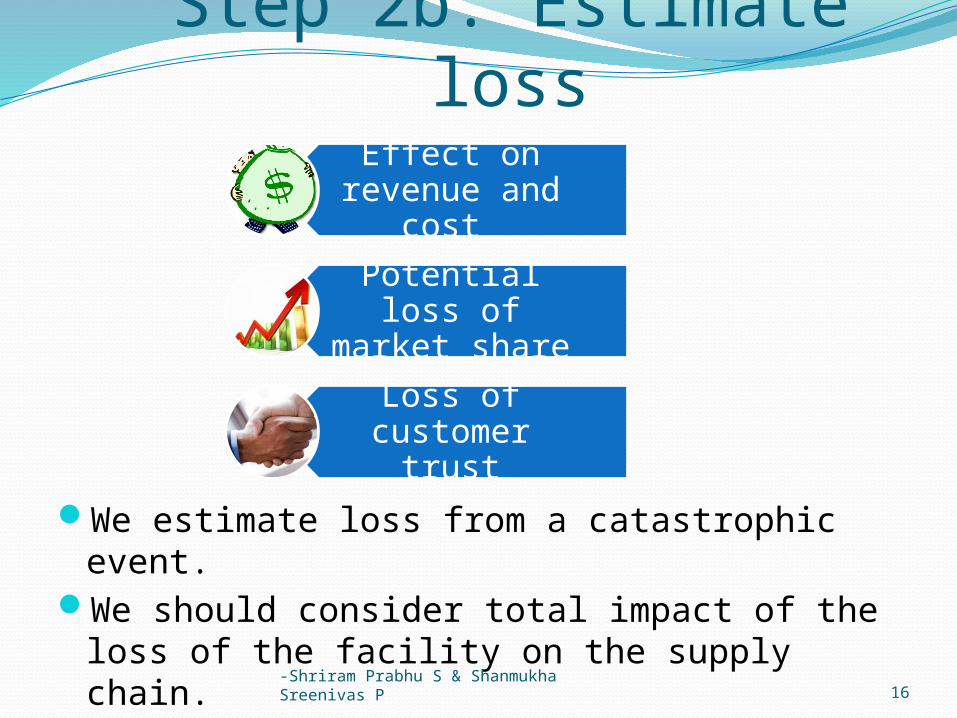
Step 2b: Estimate loss
We estimate loss from a catastrophic event.We should consider total impact of the loss of
the facility on the supply chain.
Effect on revenue and
cost
Potential loss of market share
Loss of customer trust
-Shriram Prabhu S & Shanmukha Sreenivas P
17
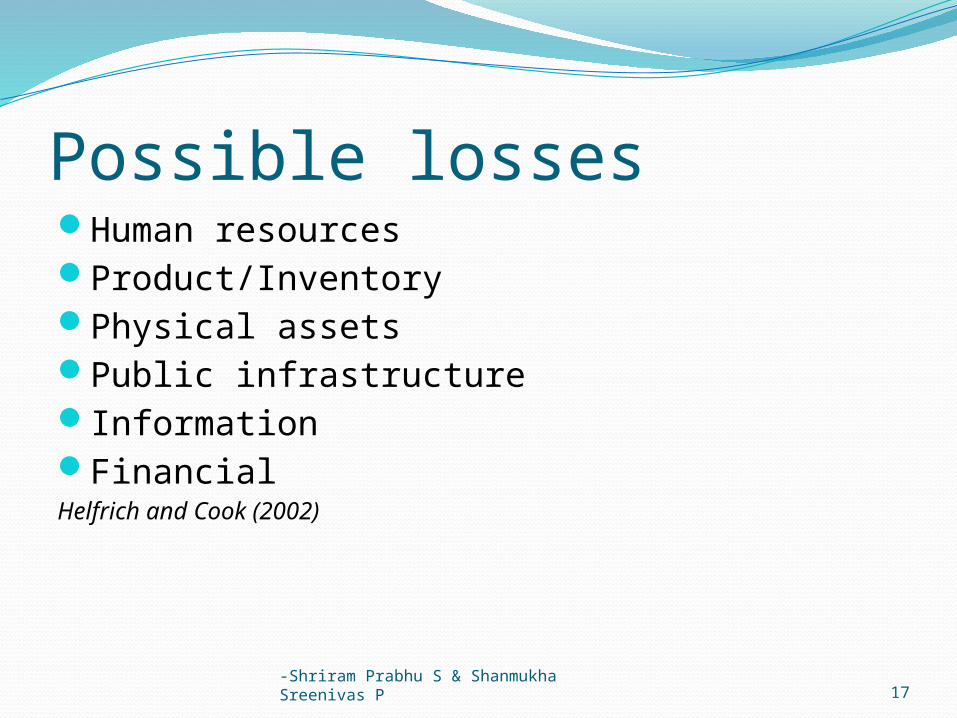
Possible lossesHuman resourcesProduct/InventoryPhysical assetsPublic infrastructureInformationFinancialHelfrich and Cook (2002)

-Shriram Prabhu S & Shanmukha Sreenivas P
18
Approach with lossesLook at quantifiable losses at first.
Use managerial discretion and know how to estimate qualitative items
-Shriram Prabhu S & Shanmukha Sreenivas P
19
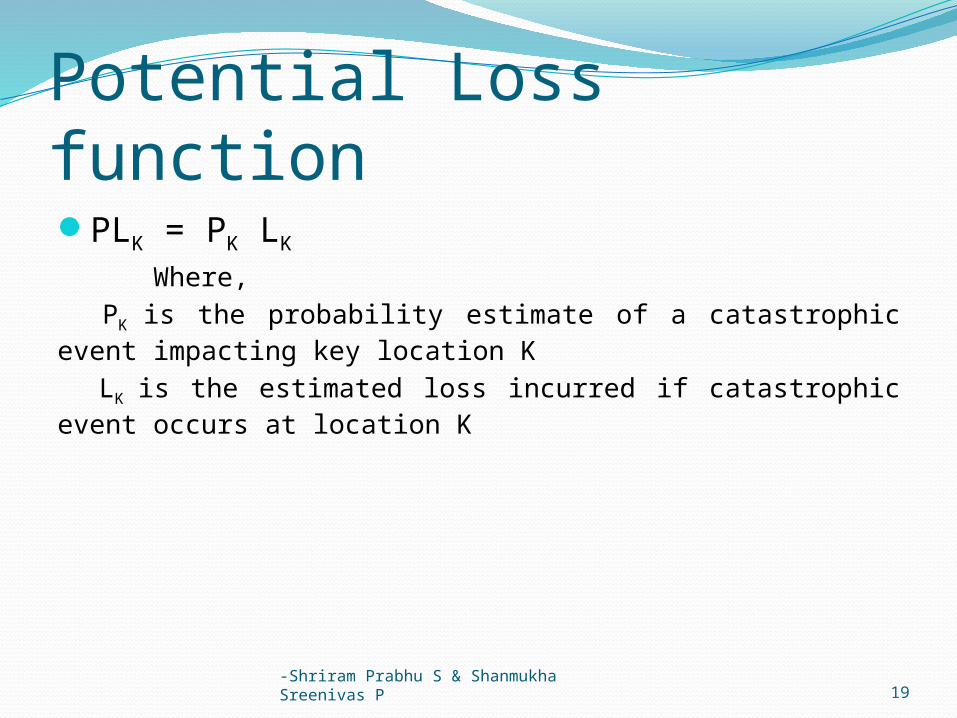
Potential Loss functionPLK = PK LK
Where, PK is the probability estimate of a catastrophic event impacting key location K LK is the estimated loss incurred if catastrophic event occurs at location K
-Shriram Prabhu S & Shanmukha Sreenivas P
20
Step 3: Evaluate CountermeasuresTo manage risk we make use of a
catastrophic risk management matrix.
It shows the probability estimate of a catastrophic event against the estimated loss exposure for each of the firm’s key locations.

-Shriram Prabhu S & Shanmukha Sreenivas P
21
Catastrophic risk management Matrix
•Managers prepare and implement counter measures to mitigate risk from ‘C’ Events
•Managers accept the risk as potentially less costly than counter measures
•Managers prepare and implement counter measures to mitigate loss & risk from ‘C’ Events
•Managers prepare and implement counter measures to mitigate loss from ‘C’ Events
Loss Mitigatio
n
Risk & Loss
Mitigation
Risk Mitigatio
n
Risk & Loss
Acceptance
Proability
Est
imate
d l
oss
fro
m t
he c
ata
stro
ph
ic e
ven
t
Lower Higher
Low
er
Hig
her
-Shriram Prabhu S & Shanmukha Sreenivas P
22
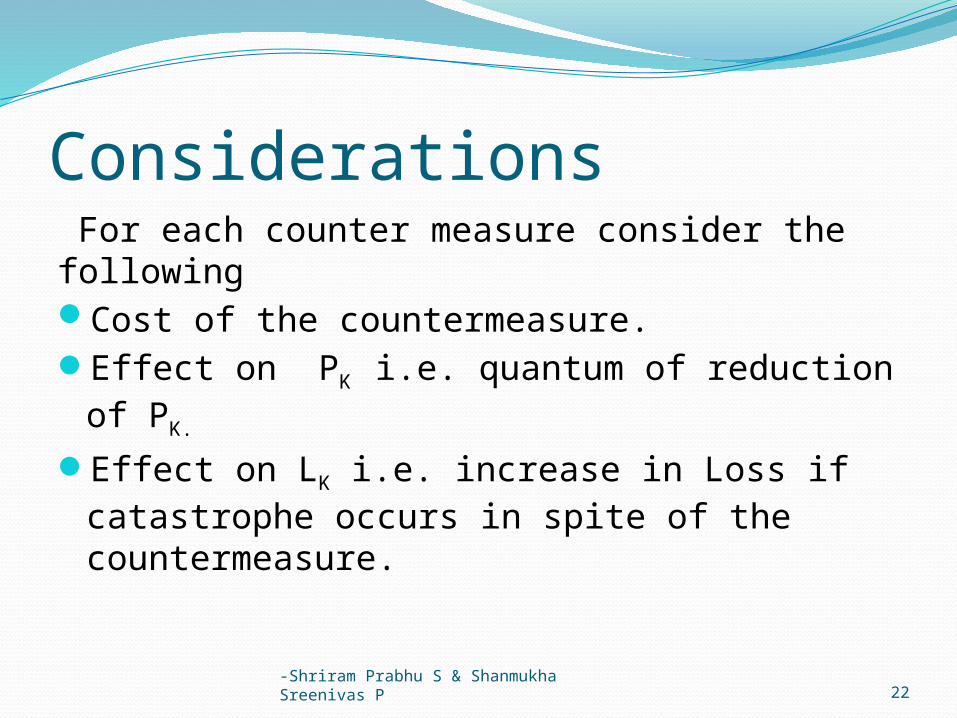
Considerations For each counter measure consider the followingCost of the countermeasure.Effect on PK i.e. quantum of reduction of PK.
Effect on LK i.e. increase in Loss if catastrophe occurs in spite of the countermeasure.
-Shriram Prabhu S & Shanmukha Sreenivas P
23
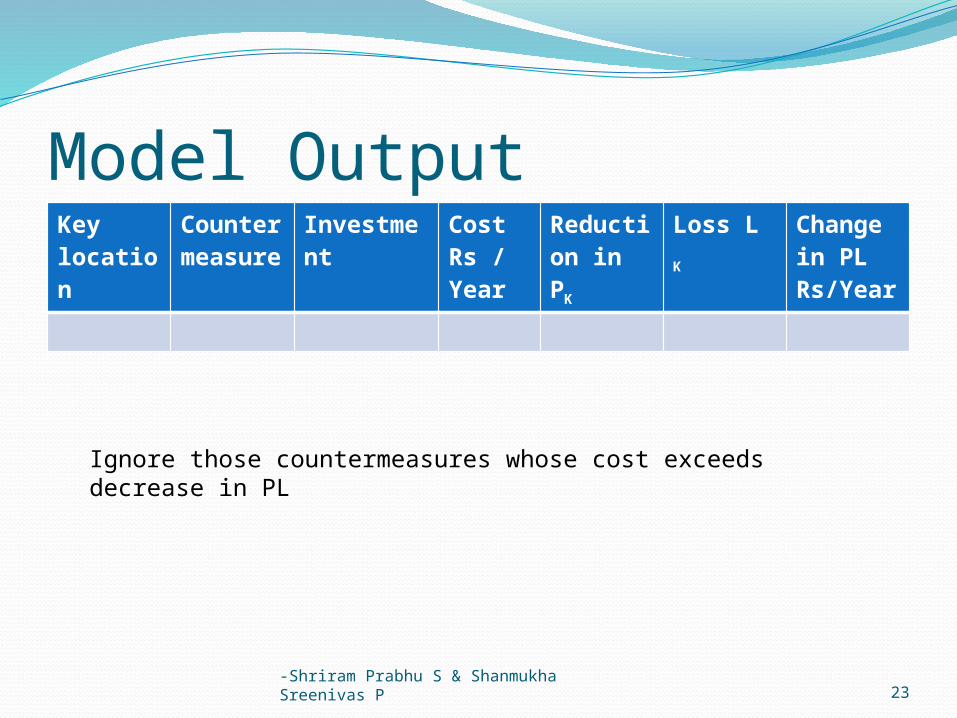
Model OutputKey location
Counter measure
Investment
CostRs / Year
Reduction in PK
Loss L K
Change in PLRs/Year
Ignore those countermeasures whose cost exceeds decrease in PL
-Shriram Prabhu S & Shanmukha Sreenivas P
24
ImplementationImplementation team needs to decide the
frequency of this exercise.Organizational commitment and zest to this
complex process is vital

-Shriram Prabhu S & Shanmukha Sreenivas P
25