probing the transient dark state of substrate binding to groel
TRANSCRIPT

Probing the transient dark state of substrate bindingto GroEL by relaxation-based solution NMRDavid S. Libicha,1, Nicolas L. Fawzia,b,1, Jinfa Yinga, and G. Marius Clorea,2
aLaboratory of Chemical Physics, National Institute of Diabetes and Digestive and Kidney Diseases, National Institutes of Health, Bethesda, MD 20892-0520;and bDepartment of Molecular Pharmacology, Physiology, and Biotechnology, Brown University, Providence, RI 02912
Edited* by George H. Lorimer, University of Maryland, College Park, MD, and approved May 20, 2013 (received for review March 25, 2013)
The mechanism whereby the prototypical chaperonin GroEL per-formswork on substrate proteins has not yet been fully elucidated,hindered by lack of detailed structural and dynamic information onthe bound substrate. Previous investigations have produced con-flicting reports on the state of GroEL-bound polypeptides, largelydue to the transient and dynamic nature of these complexes. Here,we present a unique approach, based on combined analysis of fourcomplementary relaxation-based NMR experiments, to probe di-rectly the “dark” NMR-invisible state of the model, intrinsically dis-ordered, polypeptide amyloid β (Aβ40) bound to GroEL. The fourNMR experiments, lifetime line-broadening, dark-state exchangesaturation transfer, relaxation dispersion, and small exchange-in-duced chemical shifts, are dependent in differentways on the over-all exchange rates and populations of the free and bound states ofthe substrate, as well as on residue-specific dynamics and structurewithin the bound state as reported by transverse magnetizationrelaxation rates and backbone chemical shifts, respectively. Globalfitting of all the NMR data shows that the complex is transient witha lifetime of <1 ms, that binding involves two predominantly hy-drophobic segments corresponding to predicted GroEL consensusbinding sequences, and that the structure of the bound polypep-tide remains intrinsically and dynamically disordered with minimalchanges in secondary structure propensity relative to the free state.Our results establish a unique method to observe NMR-invisibledynamic states of GroEL-bound substrates and to describe atatomic resolution the events between substrate binding and en-capsulation that are crucial for understanding the normal andstress-related metabolic function of chaperonins.
supramolecular machine | protein–protein interactions |conformational sampling
Molecular chaperones are proteins that are ubiquitous to allthree domains of life and assist native cellular proteins to
reach their correct fate in vivo by facilitating folding, transport,oligomeric assembly, and controlled conformational switching (1–3). The chaperone system comprises a network of interconnectedand redundant, yet unrelated, proteins that function via a broadrange of mechanisms and under various physiological contexts. Inaddition to assisting in basal protein function, the chaperone sys-tem functions as a cellular quality control network tuned to miti-gate the deleterious and toxic effects of environmental andpathological stress on proteins by preventing and, in some cases,reversing macromolecular aggregation (4). The energy barrierseparating the folded and unfolded states is small formost proteins;consequently, many proteins are under continual risk of unfoldingand aggregating, a risk that becomes particularly acute in responseto extracellular stress. To carry out their protective role, chaper-ones have to interact transiently with myriad nonnative proteinsubstrates to promote correct folding or assembly without the aid ofstereospecific information on the native structure of the substrates.Generally, chaperones achieve this by presenting a hydrophobicsurface that is able to bind exposed hydrophobic patches on par-tially folded or misfolded proteins (2, 3).Chaperonins are a subclass of molecular chaperones character-
ized by cylindrical, stacked ring structures that form interior cavitieslarge enough to encapsulate substrate proteins. The most studied
and best understood chaperonin, both mechanistically and struc-turally, is GroEL, a 780-kDa supramolecular machine comprisingseven identical 56-kDa subunits per cylindrical ring that assistsprotein folding through a multistep reaction cycle (2, 3). GroELinitially binds substrate proteins on exposed hydrophobic patchesfacing the inside of the cavity. Through a series of ATP-drivenconformational rearrangements of the GroEL subunits and re-cruitment of the cochaperone GroES, GroEL encapsulates thesubstrate within the central chamber (2, 3). However, the structureand dynamics of substrate interactions with GroEL, as well as ex-actly howGroEL assists substrates to attain their native state (5–7),remain poorly understood, because the bound substrate, exceptunder special circumstances, is generally invisible to conventionalbiophysical and structural techniques.Previous investigations of GroEL have provided conflicting
reports on the state of GroEL-bound peptides and proteins. Well-ordered β-hairpin and extended conformations have been observedby crystallography (8, 9), but these conformations were likely se-lected preferentially during crystallization. NMR-based transferrednuclear Overhauser enhancement studies have reported both he-lical and hairpin conformations (10–12), but interpretation iscomplicated by extensive spin diffusion (13) within GroEL. Con-versely, hydrogen–deuterium exchange experiments (14, 15) implythat the secondary structure is sufficiently destabilized or disruptedupon binding to GroEL to allow substantial backbone amide hy-drogen–deuterium exchange to occur. Likewise, 1H-15N correla-tion experiments, designed specifically for large (>>100 kDa)protein assemblies, suggest that bound protein substrates are dy-namic and largely unfolded, because the few cross-peaks observedare located at characteristic random coil positions (16, 17).The majority of physical studies on GroEL–substrate inter-
actions have been carried out on heterologous systems, an ap-proach validated by the high degree of conservation of chaperoninsacross evolution (2, 3). To address the conformational preferencesand dynamics of a GroEL-bound substrate directly at atomic res-olution, we have made use of four complementary relaxation-based NMR experiments (18–22) to probe directly and quantita-tively the “dark” NMR-invisible state of the model, intrinsicallydisordered, polypeptide amyloid β (Aβ40) bound to GroEL. Al-though we use Aβ40 as a model system here to probe the in-teraction of intrinsically disordered, aggregation-prone proteinswith GroEL, we note that the interaction of Aβ with the humanhomolog of GroEL, heat shock protein 60 (51% sequence iden-tity), is involved in the translocation of Aβ to the mitochondria,where accumulation of Aβ plaques is thought to lead to mito-chondrial dysfunction and to represent an important component ofAlzheimer’s disease (23).
Author contributions: D.S.L., N.L.F., J.Y., and G.M.C. designed research, performed re-search, analyzed data, and wrote the paper.
The authors declare no conflict of interest.
*This Direct Submission article had a prearranged editor.1D.S.L. and N.L.F. contributed equally to this work.2To whom correspondence should be addressed. E-mail: [email protected].
This article contains supporting information online at www.pnas.org/lookup/suppl/doi:10.1073/pnas.1305715110/-/DCSupplemental.
www.pnas.org/cgi/doi/10.1073/pnas.1305715110 PNAS | July 9, 2013 | vol. 110 | no. 28 | 11361–11366
BIOPH
YSICSAND
COMPU
TATIONALBIOLO
GY

Results and DiscussionWe used a unique multipronged approach, based on the com-bined analysis of four relaxation-based NMR experiments, tostudy the dynamic interaction of Aβ40 with GroEL at atomicresolution. Specifically, lifetime line-broadening (20), dark-stateexchange saturation transfer (DEST) spectroscopy (21, 22),Carr–Purcell–Meinboom–Gill (CPMG) relaxation dispersionspectroscopy (18, 24), and quantitative interpretation of verysmall exchange-induced chemical shifts (19) report in differentways on the overall exchange rates and populations of the freeand bound states of Aβ40, as well as on residue-specific dynamicsand structure within the bound state as reported by transversemagnetization relaxation rate constants (R2) and backbonechemical shift values, respectively.
ΔR2 Measurements. Fig. 1A displays the difference in 15N-R2values (15N-ΔR2) of 50 μMmonomeric Aβ40 (21) in the presenceand absence of GroEL. Line-broadening can arise from twosources: differences in chemical shifts between the free and
bound states giving rise to chemical exchange line-broadeningand lifetime line-broadening due to large R2 values in the boundstate, leading to rapid decay of magnetization (20). At a CPMGfield of 550 Hz, exchange-induced line-broadening is virtuallycompletely suppressed and the observed increases in 15N-R2values arise almost exclusively from lifetime line-broadening.This is evident from the absence of any correlation between 15N-ΔR2 values and
15N exchange-induced shifts (Fig. 2E), as well asfrom analysis of the CPMG relaxation dispersion data (see be-low), which indicate that the largest contribution of exchangeline-broadening to the measured 15N-ΔR2 values is less than0.5 s−1 (Fig. S1). The 15N-ΔR2 values are linearly dependent onthe concentration of GroEL (up to the highest concentrationof GroEL used in the study, 40 μM in subunits) (Fig. S2 C andD), reflecting the linear dependence of 15N-ΔR2 on the pseudo–first-order association rate constant, kappon , given by kappon =kon½GroEL�free ≈ kon½GroEL�total=ð½Aβ40�total KA + 1Þ, where konis the second order association rate constant and KA is theequilibrium association constant. In contrast to our previous
400 10 20 30
15N
-ΔR
2 (s
-1)
10
0
15
20
25
5
A
D
1 10 20 30 40
V24
15N frequency offset (kHz)
Nor
mal
ized
inte
nsity
0
C
E3 I32A21 V40
Residue number
E3
CPMG field (Hz)
A21
V24I32
V40
HHHPHHHPHHHXP H
25
20
15
10
5
02520151050
15N-ΔR2,calc (s-1)
B40 μM GroEL20 μM GroEL
0000
RF field
0-7.5-15 157.5
0.5
1.0
0-7.5-15 157.5 0-7.5-15 157.50-7.5-15 157.5 0-7.5-15 157.5
2
6
14
10
0 1000500
12
8
4
0 10005004
8
16
12
14
10
6
0 1000500
4
8
16
12
14
10
6
0 10005004
8
16
12
14
10
6
0 1000500
2
6
14
10
12
8
4
+ GroEL (900 MHz)+ GroEL (600 MHz)- GroEL (600 MHz)
250 Hz 500 Hz
+ 40 μM GroEL (900 MHz)+ 40 μM GroEL (600 MHz)+ 20 μM GroEL (900 MHz)+ 20 μM GroEL (600 MHz)+ 20 μM GroEL + 2.9 μM Rubisco (600 MHz)
GroEL substrate consensus sequence
900
15N
-ΔR
2,ob
s (s
-1)
900
15N
-R2
(s-1
)
Fig. 1. 15N-ΔR2,15N-DEST, and 15N relaxation dispersion profiles of Aβ40 in the presence of GroEL. (A) 15N-ΔR2 (CPMG field = 550 Hz) for 50 μM 15N-labeled
Aβ40 in the presence of 20 (circles) and 40 (diamonds) μM (in subunits) GroEL at spectrometer frequencies of 600 (blue) and 900 (red) MHz. 15N-ΔR2 at 600MHz for a control sample (green squares) containing 50 μM 15N-labeled Aβ40, 2.9 μM acid-denatured Rubisco, and 20 μM GroEL [in subunits, corresponding to2.9 μM in Rubisco binding sites (i.e., one binding site per GroEL cavity)] demonstrates that acid-denatured Rubisco displaces GroEL-bound Aβ40. (B) Com-parison of observed (obs) 15N-ΔR2 values with the calculated (calc) values obtained from global fitting of all experimental data to a two-state exchangemodel. (C) Examples of 15N-DEST profiles (plotted as normalized cross-peak intensities as a function of frequency offset from the 15N carrier at 118.5 ppm)obtained with rf (RF) field strengths of 250 (open circles) and 500 (closed circles) Hz for the 15N continuous wave saturation pulse recorded at a spectrometerfrequency of 900 MHz on a sample containing 50 μM 15N-labeled Aβ40 in the presence of 20 μM (in subunits) GroEL. (D) 15N-CPMG relaxation dispersion curvesat spectrometer frequencies of 600 (blue) and 900 (red) MHz observed for 50 μM 15N-labeled Aβ40 in the presence of 20 μM (in subunits) GroEL. Referencedispersion curves at 600 MHz for 15N-labeled Aβ40 in the absence of GroEL are shown in green. The red and blue dashed and solid lines in A and D are thebest-fit curves obtained by simultaneously fitting all the experimental data to a two-state exchange model. The green lines in A and D serve to guide the eye.The sequence of Aβ40 is shown at the top of the figure with hydrophobic residues highlighted in green and the GroEL substrate consensus sequences (where Pstands for polar residues and H stands for hydrophobic residues) (28) aligned above the Aβ40 sequence for reference. All experiments were conducted at 5 °C.Error bars = 1 SD.
11362 | www.pnas.org/cgi/doi/10.1073/pnas.1305715110 Libich et al.

work on the interaction of monomeric Aβ40 on the surface ofAβ40 protofibrils, where ΔR2 was found to be independent ofthe nucleus and magnetic field (20), the observed ΔR2 profiles inthe current study are dependent on the field (Fig. 1A and Fig.S2B) and nucleus (compare Fig. S2 E and F, which show that theΔR2 values for backbone amide protons are just over 50% largerthan for 15N). This immediately suggests that the dissociationrate constant, koff, is of the same order of magnitude or largerthan the R2 values in the bound state (predicted to be ∼1,000 s−1
for 15N at 5 °C and 900 MHz for a rigid N-H bond vector ina globular molecule the size of GroEL) and that kappon must begreater than ΔRmax
2 ; otherwise, there would be no mechanismto create the observed residue-specific R2 relaxation enhancement.Addition of acid-denatured ribulose-1,5-bisphosphate carboxylase(Rubisco) (25), a protein known to bind with high affinity specif-ically to the hydrophobic patches on the interior surface of theGroEL cavity, to a sample containing Aβ40 and GroEL reduces15N-ΔR2 to values very close to zero (Fig. 1A), indicating thatRubisco and Aβ40 compete for the same binding site(s) on GroELand that the lifetime line-broadening effect arises from a specificinteraction of Aβ40 with GroEL.
15N-DEST. Fig. 1C displays examples of 15N-DEST profiles createdby applying a weak 15N saturation pulse at intervals from −21 to+21 kHz off-resonance of the spectrum of free Aβ40, therebyimprinting with single residue resolution dynamic informationon the Aβ40 GroEL-bound species onto the easily observed1H-15N correlation spectrum of free Aβ40 (21). When Aβ40 isbound to GroEL, reorientational motions within the peptidebackbone of Aβ40 are dramatically slowed, resulting in 15N-R2values that are several orders of magnitude larger than in thefree state. Although these large 15N-R2 values preclude directobservation of the bound state, they allow for efficient partialsaturation by a weak rf field even at large offsets, where themagnetization in the free state is completely unaffected, thatis subsequently transferred back to the free state via chemicalexchange and observed as a decrease in cross-peak intensity(21, 22). The profiles are dependent on koff, and variations inwidth reflect residue-specific variations in 15N-R2 values inthe bound state.
15N-CPMG Relaxation Dispersion and Exchange-Induced ChemicalShifts. Fig. 1D provides some examples of 15N-CPMG re-laxation dispersion curves. Although no relaxation dispersion isobserved in the absence of GroEL, small but clear-cut relaxationdispersion effects for some residues are apparent in the presenceof GroEL. Relaxation dispersion is dependent on chemical shiftdifferences between the free and bound states (24), and, in-terestingly, the largest dispersion is observed for the C-terminalresidue Val40. Very small (≤1 Hz) but measurable exchange-induced chemical shifts are also observed for 15N, 1HN,
13Cα, and13Cβ resonances (Fig. 2 A and B). The exchange-induced shiftsare field-dependent (Fig. 2C) and directly proportional to theconcentration of GroEL (Fig. 2D).
Global Analysis of Relaxation-Based NMR Experiments. The data forall four relaxation-based NMR experiments at two fields (600and 900 MHz) and several concentrations of GroEL were ana-lyzed simultaneously using a simple two-state exchange model(Fig. 3A). All the experimental observables can be described bysolutions to the McConnell equations (26) (SI Materials andMethods). The 15N DEST profiles and 15N-ΔR2 values werecalculated numerically (Eqs. S2 and S3), whereas analyticalsolutions were used for the 15N relaxation dispersion data (Eqs.S4 and S5) and exchange-induced chemical shifts (15N-δex) (Eq.S6). Global nonlinear least-squares fitting (Eq. S7) was carriedout by optimizing the values of two global parameters (whosevalues are determined by the data for all residues), namely, thepseudo–first-order association ðkappon Þ rate constant and the frac-tion pA of free Aβ40 [where the dissociation rate constant koff isgiven by kappon pA=ð1− pAÞ, and the fraction pB of GroEL-bound
Aβ40 is given by (1− pA)]; and two sets of residue-specificparameters, namely, 15N‐RGroEL‐bound
2;calc ðiÞ values in the bound stateand the differences in 15N chemical shift values, 15N-Δδ(i), be-tween the bound and free states, whose values are determined by
E
120.
8512
0.90
8.218.23
V24
126.
4812
6.52
8.36 8.34
I32
128.
5012
8.60
7.877.89
V40
8.308.31
126.
3012
6.40
A21
15N
(pp
m)
13C
α (p
pm)
C
13C
β (p
pm)
55.7
55.6
4.564.59
H13
61.9
61.8
3.973.99
V18
56.4
56.3
4.214.24
K16
31.1
31.0
1.681.70
R5
32.5
32.4
1.871.89
V12 V36
32.7
32.6
2.022.051.301.3219.6
19.4A21
A30
63.7
63.8
V40
3.994.01
B
0.2
-0.2
-0.6
-1.0
-1.4
20 μM GroEL
0.2-0.2-0.6-1.0-1.4
1H (ppm)
0.2
-0.2
-0.6
-1.0
-1.4
0.2-0.2-0.6-1.0-1.4
0.2-0.2-0.6-1.0-1.4
12
8
4
00.2-0.2-0.6-1.0-1.4
0.2
-0.2
-0.6
-1.0
-1.4
900 MHz600 MHz
D
F
0.40.0
-0.4-0.8-1.2-1.60.40.0
-0.4-0.8-1.2-1.6
15N
-δex
(H
z)1 H
N-δ
ex (
Hz)
13C
α-δex
(H
z)
0.0
-0.5
0.5
1.0
13C
β-δex
(H
z)
-0.5
-1.0
0.0
0.5
400 10 20 30Residue number
A 1 10 20 30 40HHHPHHHPHHHXP H
1.0
slope=1.5 corr. coeff. = 0.9
slope=2.0 corr. coeff. = 0.92
10 μM GroEL 15N-δex (Hz) 900
15N
-δex
(H
z)
20 μ
M G
roE
L15
N-δ
ex
(Hz)
90
0
15N
-ΔR
2
(s-
1 )90
090
0
15N
-δex
(H
z)ob
s
15N-δex (Hz)calc
15N-δex (Hz)900
15N-δex (Hz)600
Fig. 2. Observed exchange-induced chemical shifts for Aβ40 in the presence ofGroEL. (A) 15N, 1HN,
13Cα, and 13Cβ chemical shift differences (in hertz) between50 μM 15N-labeled Aβ40 samples containing 20 and 0 μM GroEL at a spectrom-eter frequency of 900 MHz. (B) Expansions of selected regions of the 1H-15NHSQC spectra and 1H-13C constant timeHSQC spectra of 50 μM15N-labeledAβ40in the absence (black contours) and presence (red contours) of 20 μM GroEL.Correlation of 15N exchange-induced chemical shifts of 15N-labeled Aβ40 at twospectrometer frequencies (C) and two GroEL concentrations (D) is shown. corr.coeff., correlation coefficient. (E) 15N-ΔR2 values are not correlated to the 15Nexchange-induced chemical shifts. (F) Comparison of observed 15N exchange-induced shifts with the calculated values obtained by simultaneously fitting allthe experimental data to a two-state exchange model. Error bars = 1 SD.
Libich et al. PNAS | July 9, 2013 | vol. 110 | no. 28 | 11363
BIOPH
YSICSAND
COMPU
TATIONALBIOLO
GY

the data for each individual residue. Comparisons of observedand calculated values for the 15N-ΔR2,
15N-DEST, and 15N re-laxation dispersion curves are shown in Fig. 1 A, C, and D, re-spectively, and correlation plots between observed and calculatedvalues for 15N-ΔR2 and
15N-δex are shown in Fig. 1B (also Fig. S2A)and Fig. 2F, respectively.It is important to note that the combined use of all experiments is
critical to finding the unique solution for the global kinetic param-eters as well as the residue-specific 15N‐RGroEL‐bound
2;calc ðiÞ and 15N-Δδ(i)values (SI Materials and Methods). The observables in each experi-ment have a unique dependence on the global and residue-specificparameters (compare Eqs. S2–S6). Thus, global fitting to a com-bination of observables using several orthogonal experiments notonly results in a deeper minimum on the optimization landscape(critical in the presence of inevitable experimental uncertainty inthe data) but, equally importantly, circumvents correlations in thevalues of the optimized parameters present in any one experiment(27) (further discussion is provided in SI Materials and Methods).Further, because there are only two global parameters, with theremaining parameters being entirely local to each residue position(and therefore uncorrelated from one residue to the next), therange of possible solutions in multidimensional parameter space isreadily sampled.The exchange model and global best-fit kinetic parameters
are provided in Fig. 3A. At 20 μM (in subunits) GroEL, thepopulation pB of bound Aβ40 is 2.3 ± 0.1%, kappon has a value of34.8 ± 0.8 s−1, and koff has a value of 1,440 ± 83 s−1. Conver-gence of the solution was confirmed by varying initial values forall optimized parameters and obtaining the same solution withinreported uncertainties. Assuming that one Aβ40 molecule bindsper GroEL cavity, the value of the second-order associationrate constant (kon) is computed to be ∼2 × 10⁷ M−1·s−1 and thevalue of the equilibrium dissociation constant (Kd) is ∼70 μM.
Alternatively, if we assume that it takes three Aβ40 moleculesto saturate each cavity instead of one, and that the three Aβ40molecules bind to each GroEL cavity completely independentlyfrom one another, the values of kon and Kd are computed to be4.7 × 106 M−1·s−1 and 307 μM, respectively.
Residue-Specific 15N-R2 Values of Aβ40 in the GroEL-Bound State. Theoptimized values of 15N‐RGroEL‐bound
2;calc ðiÞ for Aβ40 bound toGroEL are shown in Fig. 4A. There are two regions that showparticularly large 15N‐RGroEL‐bound
2;calc values (350–650 s−1 at 900MHz), namely, the central (residues 16–21) and C-terminal(residues 30–36) hydrophobic regions, which correspond to theGroEL-binding consensus sequences (28). With eight residuesspanning the two hydrophobic regions, one would anticipate thatthe latter two segments of the polypeptide chain bind to adjacentsubunits on GroEL. Thus, even if a single GroEL cavity can onlyaccommodate one Aβ40 molecule, there are numerous potentialbinding modes: If we consider the central hydrophobic patch ofAβ40 first, each GroEL cavity has seven potential binding sitesavailable, each with two adjacent sites available to bind theC-terminal hydrophobic patch (Fig. 3B). (Thus, the overall affinitycan reach the micromolar range even if the individual contactsare much lower in affinity). The observation that the maximum15N‐RGroEL‐bound
2;calc value at 900 MHz is about 60–70% of theexpected value for a rigid N-H group suggests that the two hy-drophobic regions retain significant internal mobility on thenanosecond time scale when bound to GroEL and/or that thetwo hydrophobic regions bind to GroEL independently of oneanother. In the latter case, there would be two hemiassociatedstates in which only one hydrophobic region is in direct contactwith GroEL at a given time, in addition to the fully bound statein which both hydrophobic regions are bound simultaneously. Athird partially hydrophobic segment (Tyr-Glu-Val) from resi-dues 10–12 displays intermediate 15N‐RGroEL‐bound
2;calc values (∼300 s−1at 900 MHz), suggesting that this region may also transiently in-teract with GroEL, although to a lesser degree than the two mainhydrophobic regions. The relatively low 15N‐RGroEL‐bound
2;calc for the Nand C termini (100–200 s−1) suggests that these regions are sig-nificantly more mobile, and hence not in direct contact with GroELbut rather tethered to the surface of GroEL via the direct inter-actions between GroEL and the hydrophobic regions.In contrast to the interaction of monomeric Aβ40 on the
surface of Aβ40 protofibrils, where the bound state for eachresidue had to be kinetically partitioned between direct contactand tethered states (21), the current data are fully described bya simple two-state exchange model in which Aβ40 is either freeor bound to GroEL. This implies that the interconversion ratesbetween hemiassociated and fully associated states, as well asthose between direct contact and tethered states for any givenresidue, are significantly faster than koff (∼1,400 s−1).
Chemical Shifts and Structural Characteristics of Aβ40 in the GroEL-Bound State. The calculated differences in 15N shifts (15N-Δδ)between bound and free Aβ40 are shown in the upper first panelof Fig. 4B. With only two exceptions (residues 21 and 30), all 15Nresonances are upfield-shifted in the bound state. The largestdifferences in 15N shifts (−0.5 to −0.8 ppm) are observed forPhe20 and Ala21 in the central hydrophobic region; residues31–36 (IIGLMV) within the C-terminal hydrophobic region; and,interestingly enough, three residues (Gly37, Val39, and Val40)at the C terminus. Indeed, the 15N resonance of Val40 exhibitsthe largest chemical shift difference (∼−0.8 ppm) between thebound and free states, as well as the largest relaxation disper-sion (Fig. 1D, Right). Because the 15N‐RGroEL‐bound
2;calc value forVal40 is low (∼100 s−1; Fig. 4A), this shift presumably arisesthrough a secondary effect (e.g., through proximity to the boundC-terminal hydrophobic region).Given the global exchange rate constants and the R2 values in
the GroEL-bound state, the 1HN,13Cα, and 13Cβ chemical shift
differences (Δδ) between the bound and free states can becomputed from the observed exchange-induced shifts (δex) using
{ {A
B
= 2%pA = 98% pB
KD μMkon
7 M-1s-1
(20 μM) (20 μM)Aβ40free Aβ40GroEL-bound
koff 1400 s-1
konapp(20 μM)
35 s-1
Aβ40GroEL-bound
Fig. 3. Kinetic scheme for Aβ40 binding to GroEL. (A) Two-state exchangemodel describing the association of Aβ40 with GroEL. The values listed forkappon and the populations of free (pA) and GroEL-bound (pB) Aβ40 are those
obtained in the presence of 20 μM GroEL. The equilibrium dissociationconstant Kd and the second-order association rate constant kon are calcu-lated assuming each GroEL cavity only accommodates a single molecule ofAβ40 with numerous available binding modes. (B) Rapid interconversion(with a rate constant >koff) between different GroEL-bound configurationsof Aβ40 consisting of the central hydrophobic, C-terminal hydrophobic, orboth hydrophobic regions in contact with GroEL is possible.
11364 | www.pnas.org/cgi/doi/10.1073/pnas.1305715110 Libich et al.
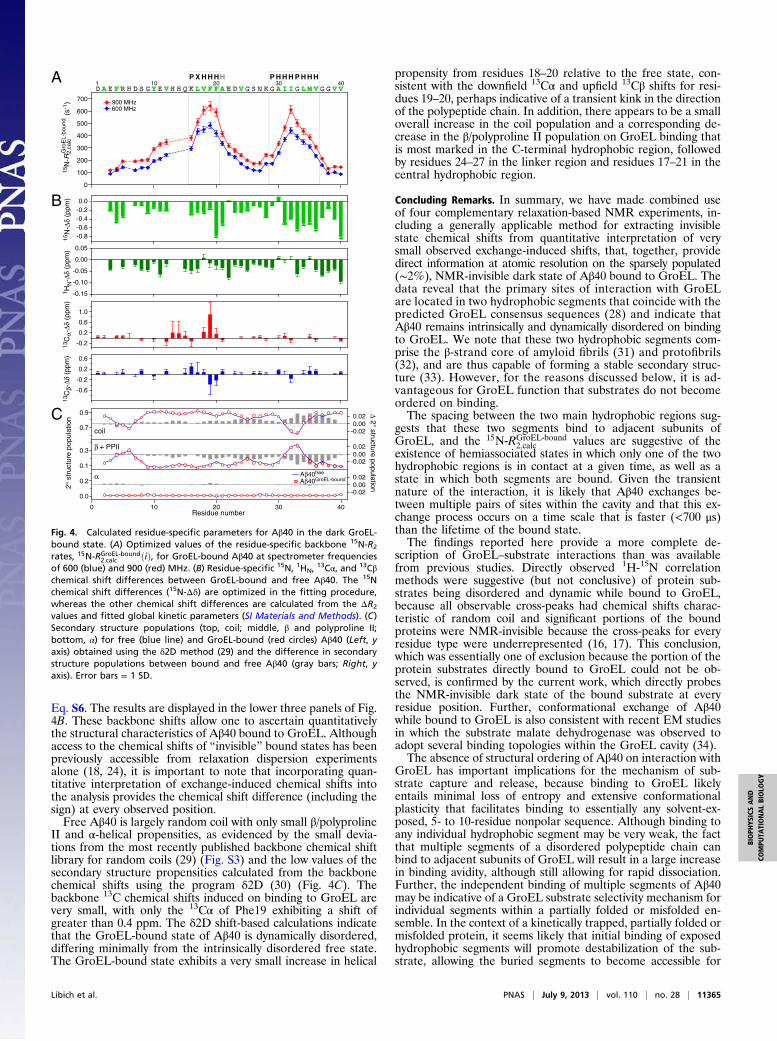
Eq. S6. The results are displayed in the lower three panels of Fig.4B. These backbone shifts allow one to ascertain quantitativelythe structural characteristics of Aβ40 bound to GroEL. Althoughaccess to the chemical shifts of “invisible” bound states has beenpreviously accessible from relaxation dispersion experimentsalone (18, 24), it is important to note that incorporating quan-titative interpretation of exchange-induced chemical shifts intothe analysis provides the chemical shift difference (including thesign) at every observed position.Free Aβ40 is largely random coil with only small β/polyproline
II and α-helical propensities, as evidenced by the small devia-tions from the most recently published backbone chemical shiftlibrary for random coils (29) (Fig. S3) and the low values of thesecondary structure propensities calculated from the backbonechemical shifts using the program δ2D (30) (Fig. 4C). Thebackbone 13C chemical shifts induced on binding to GroEL arevery small, with only the 13Cα of Phe19 exhibiting a shift ofgreater than 0.4 ppm. The δ2D shift-based calculations indicatethat the GroEL-bound state of Aβ40 is dynamically disordered,differing minimally from the intrinsically disordered free state.The GroEL-bound state exhibits a very small increase in helical
propensity from residues 18–20 relative to the free state, con-sistent with the downfield 13Cα and upfield 13Cβ shifts for resi-dues 19–20, perhaps indicative of a transient kink in the directionof the polypeptide chain. In addition, there appears to be a smalloverall increase in the coil population and a corresponding de-crease in the β/polyproline II population on GroEL binding thatis most marked in the C-terminal hydrophobic region, followedby residues 24–27 in the linker region and residues 17–21 in thecentral hydrophobic region.
Concluding Remarks. In summary, we have made combined useof four complementary relaxation-based NMR experiments, in-cluding a generally applicable method for extracting invisiblestate chemical shifts from quantitative interpretation of verysmall observed exchange-induced shifts, that, together, providedirect information at atomic resolution on the sparsely populated(∼2%), NMR-invisible dark state of Aβ40 bound to GroEL. Thedata reveal that the primary sites of interaction with GroELare located in two hydrophobic segments that coincide with thepredicted GroEL consensus sequences (28) and indicate thatAβ40 remains intrinsically and dynamically disordered on bindingto GroEL. We note that these two hydrophobic segments com-prise the β-strand core of amyloid fibrils (31) and protofibrils(32), and are thus capable of forming a stable secondary struc-ture (33). However, for the reasons discussed below, it is ad-vantageous for GroEL function that substrates do not becomeordered on binding.The spacing between the two main hydrophobic regions sug-
gests that these two segments bind to adjacent subunits ofGroEL, and the 15N‐RGroEL‐bound
2;calc values are suggestive of theexistence of hemiassociated states in which only one of the twohydrophobic regions is in contact at a given time, as well as astate in which both segments are bound. Given the transientnature of the interaction, it is likely that Aβ40 exchanges be-tween multiple pairs of sites within the cavity and that this ex-change process occurs on a time scale that is faster (<700 μs)than the lifetime of the bound state.The findings reported here provide a more complete de-
scription of GroEL–substrate interactions than was availablefrom previous studies. Directly observed 1H-15N correlationmethods were suggestive (but not conclusive) of protein sub-strates being disordered and dynamic while bound to GroEL,because all observable cross-peaks had chemical shifts charac-teristic of random coil and significant portions of the boundproteins were NMR-invisible because the cross-peaks for everyresidue type were underrepresented (16, 17). This conclusion,which was essentially one of exclusion because the portion of theprotein substrates directly bound to GroEL could not be ob-served, is confirmed by the current work, which directly probesthe NMR-invisible dark state of the bound substrate at everyresidue position. Further, conformational exchange of Aβ40while bound to GroEL is also consistent with recent EM studiesin which the substrate malate dehydrogenase was observed toadopt several binding topologies within the GroEL cavity (34).The absence of structural ordering of Aβ40 on interaction with
GroEL has important implications for the mechanism of sub-strate capture and release, because binding to GroEL likelyentails minimal loss of entropy and extensive conformationalplasticity that facilitates binding to essentially any solvent-ex-posed, 5- to 10-residue nonpolar sequence. Although binding toany individual hydrophobic segment may be very weak, the factthat multiple segments of a disordered polypeptide chain canbind to adjacent subunits of GroEL will result in a large increasein binding avidity, although still allowing for rapid dissociation.Further, the independent binding of multiple segments of Aβ40may be indicative of a GroEL substrate selectivity mechanism forindividual segments within a partially folded or misfolded en-semble. In the context of a kinetically trapped, partially folded ormisfolded protein, it seems likely that initial binding of exposedhydrophobic segments will promote destabilization of the sub-strate, allowing the buried segments to become accessible for
15N
-Δδ
(ppm
)13
Cα-
Δδ (
ppm
)
-0.15
-0.10
-0.05
0.00
0.05
0
100
200
300
400
500
600
700
1 10 20 30 40HHHXP HHHPHHHP
1 HN
-Δδ
(ppm
)13
Cβ-
Δδ (
ppm
)
A15
N-R
2,ca
lc
(s-
1 )
H
-0.8-0.6-0.4-0.20.0B
C
400 10 20 30Residue number
2° s
truc
ture
pop
ulat
ion
900 MHz600 MHz
coil
Aβ40free
Aβ40GroEL-boundα
β + PPII
-0.02
0.020.00
-0.02
0.020.00
-0.02
0.020.00
Δ 2° structure population
-0.2
0.2
0.6
1.0
-0.2
0.2
0.6
-0.6
0.1
0.3
0.9
0.7
0.2
0.0
Gro
EL-
boun
d
Fig. 4. Calculated residue-specific parameters for Aβ40 in the dark GroEL-bound state. (A) Optimized values of the residue-specific backbone 15N-R2
rates, 15N‐RGroEL‐bound2;calc ðiÞ, for GroEL-bound Aβ40 at spectrometer frequencies
of 600 (blue) and 900 (red) MHz. (B) Residue-specific 15N, 1HN,13Cα, and 13Cβ
chemical shift differences between GroEL-bound and free Aβ40. The 15Nchemical shift differences (15N-Δδ) are optimized in the fitting procedure,whereas the other chemical shift differences are calculated from the ΔR2
values and fitted global kinetic parameters (SI Materials and Methods). (C)Secondary structure populations (top, coil; middle, β and polyproline II;bottom, α) for free (blue line) and GroEL-bound (red circles) Aβ40 (Left, yaxis) obtained using the δ2D method (29) and the difference in secondarystructure populations between bound and free Aβ40 (gray bars; Right, yaxis). Error bars = 1 SD.
Libich et al. PNAS | July 9, 2013 | vol. 110 | no. 28 | 11365
BIOPH
YSICSAND
COMPU
TATIONALBIOLO
GY
GroEL binding, and thereby rapidly propagating the unfoldingprocess. Moreover, binding to adjacent subunits within the cavityis likely to promote stretch-induced unfolding (35), followed bydissociation into the cavity, as the distance between binding siteson the apical domains of adjacent subunits is increased from ∼25to ∼33 Å on transition from the closed state to ATP-bound openstate (2). In the case of Aβ40, for example, the two GroEL-binding regions are separated by 14 residues center-to-center(Fig. 4A), which corresponds to an average end-to-end distanceof 32–38 Å for a random coil calculated using well-establishedstandard polymer theory (36) (SI Materials and Methods). Hence,the probability of the two hydrophobic regions of Aβ40 beingbound to adjacent GroEL subunits simultaneously, and thereforethe avidity of Aβ40 for GroEL, would be predicted to be higherin the closed state than in the open state.In conclusion, the results presented here expand current para-
digms of GroEL–substrate interactions by providing previouslyunobservable, residue-specific details of exchange kinetics, struc-ture, and dynamics of polypeptides in theGroEL-bound dark state.
Materials and MethodsUniformly 15N-labeled Aβ40 was prepared from NaOH-treated stocks asdescribed (20). Escherichia coli GroEL (37) and acid-denatured Rubisco (25) atnatural isotopic abundance were purified as described previously and werea gift from George Lorimer and Don Yang (University of Maryland, CollegePark, MD). Aβ40 (50 μM) was combined with GroEL at 40, 20, 10, and0 (reference sample) μM (in monomer units). An additional control samplewas also prepared comprising Aβ40 (50 μM), GroEL (20 μM in monomersubunits), and Rubisco (2.9 μM). Sample conditions were 50 mM Hepes(pH 6.6) and 92% H2O/8% D2O. All samples were prepared and maintained
at 5 °C at all times. Under these conditions, Aβ40 remains essentially entirelymonomeric (>95%) for several weeks (21) (Fig. S4). NMR experiments wereconducted at 5 °C on Bruker 900-MHz and 600-MHz spectrometers, eachequipped with a triple-resonance, z-gradient cryoprobe.
The 15N-R2 (with a relaxation-compensated CPMG scheme at a CPMG fieldof 550 Hz to eliminate virtually all chemical exchange line-broadening) (20),15N-longitudinal magnetization relaxation rate R1 (Fig. S5) (21),
15N-R1ρ (Fig.S6) (38), 15N-DEST (Fig. S7) (21), and 15N-CPMG (single quantum) relaxationdispersion (39) experiments were carried out as described previously. 15Nand 1HN, as well as 13Cα and 13Cβ, exchange-induced shifts were measuredfrom high-resolution 1H-15N heteronuclear single quantum coherence(HSQC) experiments and constant-time 1H-13C HSQC experiments, re-spectively (further details are provided in SI Materials and Methods).
All the DEST, ΔR2, CPMG relaxation dispersion, and exchange-inducedchemical shift data for 15N were simultaneously fit to a two-state (free/bound) model (see Fig. 3) using a combination of numerical and analyticalsolutions to the McConnell equations (26) to determine the global kineticparameters and the GroEL-bound 15N-R2 values and 15N chemical shifts ateach residue as described in SI Materials and Methods (Eqs. S2–S7). TheGroEL-bound 1HN and 13Cα/β shifts were determined from the correspondingexchange-induced shifts in conjunction with the R2 rates and global kineticparameters as described in SI Materials and Methods.
ACKNOWLEDGMENTS. We thank Dusty Baber and Dan Garrett for NMRtechnical assistance, Dennis Torchia and George Lorimer for valuablediscussions, and George Lorimer and Dong Yang for their generous gift ofGroEL and Rubisco. This study used the high-performance computationalcapabilities of the Biowulf Linux cluster at the National Institutes of Health(NIH). This work was supported by the intramural program of the NationalInstitute of Diabetes and Digestive and Kidney Diseases, NIH, and by theAIDS Targeted Antiviral Program of the NIH Director (G.M.C.).
1. Hendrick JP, Hartl FU (1993) Molecular chaperone functions of heat-shock proteins.Annu Rev Biochem 62:349–384.
2. Thirumalai D, Lorimer GH (2001) Chaperonin-mediated protein folding. Annu RevBiophys Biomol Struct 30:245–269.
3. Horwich AL, Fenton WA (2009) Chaperonin-mediated protein folding: Using a centralcavity to kinetically assist polypeptide chain folding. Q Rev Biophys 42(2):83–116.
4. Saibil HR (2008) Chaperone machines in action. Curr Opin Struct Biol 18(1):35–42.5. Todd MJ, Lorimer GH, Thirumalai D (1996) Chaperonin-facilitated protein folding:
Optimization of rate and yield by an iterative annealing mechanism. Proc Natl AcadSci USA 93(9):4030–4035.
6. Walter S, Lorimer GH, Schmid FX (1996) A thermodynamic coupling mechanism forGroEL-mediated unfolding. Proc Natl Acad Sci USA 93(18):9425–9430.
7. Frieden C, Clark AC (1997) Protein folding: How the mechanism of GroEL action isdefined by kinetics. Proc Natl Acad Sci USA 94(11):5535–5538.
8. Chen L, Sigler PB (1999) The crystal structure of a GroEL/peptide complex: Plasticity asa basis for substrate diversity. Cell 99(7):757–768.
9. Buckle AM, Zahn R, Fersht AR (1997) A structural model for GroEL-polypeptide rec-ognition. Proc Natl Acad Sci USA 94(8):3571–3575.
10. Landry SJ, Jordan R, McMacken R, Gierasch LM (1992) Different conformations for thesame polypeptide bound to chaperones DnaK and GroEL. Nature 355(6359):455–457.
11. Wang Z, Feng Hp, Landry SJ, Maxwell J, Gierasch LM (1999) Basis of substrate bindingby the chaperonin GroEL. Biochemistry 38(39):12537–12546.
12. Li Y, Gao X, Chen L (2009) GroEL recognizes an amphipathic helix and binds to thehydrophobic side. J Biol Chem 284(7):4324–4331.
13. Bodner CR, Dobson CM, Bax A (2009) Multiple tight phospholipid-binding modes ofα-synuclein revealed by solution NMR spectroscopy. J Mol Biol 390(4):775–790.
14. Zahn R, Spitzfaden C, Ottiger M, Wüthrich K, Plückthun A (1994) Destabilization ofthe complete protein secondary structure on binding to the chaperone GroEL. Nature368(6468):261–265.
15. Robinson CV, et al. (1994) Conformation of GroEL-bound α-lactalbumin probed bymass spectrometry. Nature 372(6507):646–651.
16. Horst R, et al. (2005) Direct NMR observation of a substrate protein bound to thechaperonin GroEL. Proc Natl Acad Sci USA 102(36):12748–12753.
17. Koculi E, Horst R, Horwich AL, Wüthrich K (2011) Nuclear magnetic resonance spec-troscopy with the stringent substrate rhodanese bound to the single-ring variant SR1of the E. coli chaperonin GroEL. Protein Sci 20(8):1380–1386.
18. Korzhnev DM, Kay LE (2008) Probing invisible, low-populated states of protein mol-ecules by relaxation dispersion NMR spectroscopy: An application to protein folding.Acc Chem Res 41(3):442–451.
19. Skrynnikov NR, Dahlquist FW, Kay LE (2002) Reconstructing NMR spectra of “in-visible” excited protein states using HSQC and HMQC experiments. J Am Chem Soc124(41):12352–12360.
20. Fawzi NL, Ying J, Torchia DA, Clore GM (2010) Kinetics of amyloid β monomer-to-oligomer exchange by NMR relaxation. J Am Chem Soc 132(29):9948–9951.
21. Fawzi NL, Ying J, Ghirlando R, Torchia DA, Clore GM (2011) Atomic-resolutiondynamics on the surface of amyloid-β protofibrils probed by solution NMR. Nature480(7376):268–272.
22. Fawzi NL, Ying J, Torchia DA, Clore GM (2012) Probing exchange kinetics and atomicresolution dynamics in high-molecular-weight complexes using dark-state exchangesaturation transfer NMR spectroscopy. Nat Protoc 7(8):1523–1533.
23. Walls KC, et al. (2012) Swedish Alzheimer mutation induces mitochondrial dysfunc-tion mediated by HSP60 mislocalization of amyloid precursor protein (APP) and beta-amyloid. J Biol Chem 287(36):30317–30327.
24. Palmer AG, 3rd, Kroenke CD, Loria JP (2001) Nuclear magnetic resonance methodsfor quantifying microsecond-to-millisecond motions in biological macromolecules.Methods Enzymol 339:204–238.
25. van der Vies SM, Viitanen PV, Gatenby AA, Lorimer GH, Jaenicke R (1992) Confor-mational states of ribulosebisphosphate carboxylase and their interaction withchaperonin 60. Biochemistry 31(14):3635–3644.
26. McConnell HM (1958) Reaction rates by nuclear magnetic resonance. J Chem Phys28(3):430–431.
27. Vallurupalli P, Bouvignies G, Kay LE (2011) Increasing the exchange time-scalethat can be probed by CPMG relaxation dispersion NMR. J Phys Chem B 115(49):14891–14900.
28. Stan G, Brooks BR, Lorimer GH, Thirumalai D (2006) Residues in substrate proteinsthat interact with GroEL in the capture process are buried in the native state. ProcNatl Acad Sci USA 103(12):4433–4438.
29. Kjaergaard M, Brander S, Poulsen FM (2011) Random coil chemical shift for intrinsicallydisordered proteins: Effects of temperature and pH. J Biomol NMR 49(2):139–149.
30. Camilloni C, De Simone A, Vranken WF, Vendruscolo M (2012) Determination ofsecondary structure populations in disordered states of proteins using nuclear mag-netic resonance chemical shifts. Biochemistry 51(11):2224–2231.
31. Petkova AT, et al. (2002) A structural model for Alzheimer’s β-amyloid fibrils based onexperimental constraints from solid state NMR. Proc Natl Acad Sci USA 99(26):16742–16747.
32. Scheidt HA, Morgado I, Rothemund S, Huster D, Fändrich M (2011) Solid-state NMRspectroscopic investigation of Aβ protofibrils: Implication of a β-sheet remodeling uponmaturation into terminal amyloid fibrils. Angew Chem Int Ed Engl 50(12):2837–2840.
33. Carulla N, Zhou M, Giralt E, Robinson CV, Dobson CM (2010) Structure and in-termolecular dynamics of aggregates populated during amyloid fibril formationstudied by hydrogen/deuterium exchange. Acc Chem Res 43(8):1072–1079.
34. Elad N, et al. (2007) Topologies of a substrate protein bound to the chaperonin GroEL.Mol Cell 26(3):415–426.
35. Shtilerman M, Lorimer GH, Englander SW (1999) Chaperonin function: Folding byforced unfolding. Science 284(5415):822–825.
36. Cantor CR, Schimmel PR (1980) The Behavior of Biological Macromolecules, Part III(Freeman, San Francisco).
37. Todd MJ, Lorimer GH (1998) Criteria for assessing the purity and quality of GroEL.Methods Enzymol 290:135–141.
38. Lakomek NA, Ying JF, Bax A (2012) Measurement of ¹⁵N relaxation rates in perdeu-terated proteins by TROSY-based methods. J Biomol NMR 53(3):209–221.
39. Yip GN, Zuiderweg ER (2004) A phase cycle scheme that significantly suppresses offset-dependent artifacts in the R2-CPMG 15N relaxation experiment. J Magn Reson 171(1):25–36.
11366 | www.pnas.org/cgi/doi/10.1073/pnas.1305715110 Libich et al.

Supporting InformationLibich et al. 10.1073/pnas.1305715110SI Materials and MethodsSample Preparation. Aβ40 was prepared as described previouslyto produce samples >98% free of Aβ aggregates (1). Briefly,uniformly 15N- or 13C-labeled Aβ40, as received in the hexa-fluoroisopropanol-treated form from rPeptide, was dissolved in3 mM NaOH and titrated to pH 11.0 with 50 mM NaOH [withall solutions treated with Chelex 100 (Sigma) to remove tracemultivalent metal ions (2)] (final peptide concentrations of ∼400μM), aliquoted in volumes to reconstitute 50 μM in 1 mL, flash-frozen, and lyophilized. Escherichia coli GroEL (3) and acid-denatured ribulose-1,5-bisphosphate carboxylase (Rubisco) (4)at natural isotopic abundance were purified as described pre-viously and were a gift from George Lorimer and Dong Yang(University of Maryland, College Park, MD).NMR samples were carefully prepared in matched pairs (with
and without GroEL) by dissolving a single aliquot in 560 μL ofChelex 100-treated ultrapure (Milli-Q; Millipore) water, splittingthe resulting mixture into two new microcentrifuge tubes, andadding 200 μL of either NMR buffer [50 mM Hepes (pH 6.3),20% (vol/vol) D2O, 0.02% NaN3] or NMR buffer containingconcentrated GroEL such that the final concentration of GroELwas 10, 20, or 40 μΜ in subunits. The GroEL stock solution wasmaintained in NMR buffer to ensure sample preparations re-sulted in a consistent pH of 6.6 and that sample-to-sample dif-ferences in pH were very small (<0.1 pH units) as judged bydirect pH measurement. The chemical shifts of histidine 1HN/
15Ncross-peaks in 1H-15N heteronuclear single quantum coherence(HSQC) correlation spectra are extremely sensitive to smallchanges in pH in this range and were used as an additional checkfor sample-to-sample consistency. Final sample conditions com-prised 43 mM Hepes buffer (pH 6.6), 8% (vol/vol) D2O, and 0.01NaN3, and samples were maintained at a temperature between 2and 5 °C at all times. The matched reference samples (containingonly Aβ40, without GroEL) showed no significant spectral dif-ferences, as expected.A control sample comprising Aβ40, GroEL, and acid-denatured
Rubisco was prepared to demonstrate that Aβ40 and acid-dena-tured Rubisco bind to the same sites on GroEL. Because acid-denatured Rubisco binds to GroEL very tightly, the presence ofacid-denatured Rubisco is predicted to reduce the fraction ofbound Aβ40 significantly, thereby eliminating lifetime line-broadening of Aβ40 15N resonances in the presence of GroEL.An aliquot of GroEL stock solution to yield a final concentrationof 20 μM was diluted 100-fold in NMR buffer. Acid-denaturedRubisco was prepared from recombinant dimeric Rubisco dis-solved in 1 mM Tris (pH 7.4) by diluting with an equal volume of20 mM HCl (4). The acid-denatured Rubisco was slowly titratedinto the diluted GroEL sample to a final concentration of 1.2-fold molar excess over GroEL binding sites (calculated as onebinding site per seven GroEL monomers). The resulting mixturewas concentrated using a 100-kDa molecular weight cutoff spin-filter (Amicon), diluted 100-fold, and reconcentrated (repeatedthree times). Rubisco binding to GroEL was assessed using BlueNative PAGE (Invitrogen) and electrospray MS (Agilent), andthe resulting concentrated GroEL-Rubisco sample was used tomake a 20 μM GroEL, 50 μM 15N Aβ40, 2.9 μM acid-denaturedRubisco NMR sample in 43 mM Hepes (pH 6.6), 8% (vol/vol)D2O, and 0.01% NaN3 as described above.
NMR Spectroscopy.NMR experiments were recorded at 5 °C usingBruker Avance-III spectrometers operating at 1H frequencies of900.27 and 600.13 MHz, each equipped with Bruker TCI z-axis
gradient cryogenic probes. Temperature differences betweenspectrometers were corrected by matching the chemical shiftdifference between residual water and 4,4-dimethyl-4-silpentane-1-sulfonate (DSS; 0 ppm) in a sample containing 43 mM Hepes(pH 6.6), 0.5% DSS, 0.01% NaN3, and 99.9% D2O. The settemperature on the 600-MHz spectrometer was adjusted tomatch the offset measured on the 900-MHz instrument. Thisprocedure resulted in a correction of −0.3 °C (i.e., a set tem-perature of 4.7 °C) at 600 MHz. The 15N dark-state exchangesaturation transfer (DEST) experiments, differences in 15N-transvere magnetization relaxation rate (R2) values (15N-ΔR2),and 15N Carr–Purcell–Meinboom–Gill (CPMG) relaxation dis-persion experiments, as well as 15N chemical shift differences,were measured at several combinations of external field andGroEL concentrations.
15N Relaxation Measurements. 15N-R2 measurements using a re-laxation-compensated CPMG scheme at 600 and 900 MHz werecarried out using a 1H-15N HSQC-based 2D experiment exactly asdescribed previously (5) on samples containing 50 μM 15N-labeledAβ40 in the absence and presence of 20 and 40 μM (in subunits)GroEL and in the presence of 20 μM GroEL and 2.9 μM acid-denatured Rubisco. The effective CPMG field was 550 Hz, whichis sufficiently high to suppress chemical exchange-induced line-broadening completely or almost completely (Fig. S1). The15N-longitudinal magnetization relation rate (R1) measurementsfor the reference Aβ40 sample (i.e., in the absence of GroEL)and with 20 μM GroEL (in monomer units) were carried out asdescribed previously (1) (Fig. S5). In addition, 15N-R1ρ mea-surements (6) were carried out at 600 and 900 MHz on samplescontaining 50 μM 15N-labeled Aβ40 in the absence and presenceof 20 μM (in subunits) GroEL.
15N-DEST Spectroscopy. 2D 15N-DEST experiments using the pulsesequence described previously (1) were carried out at 600 and900 MHz on samples containing 50 μM 15N-labeled Aβ40 inthe presence of 20 and 40 μM GroEL. For each combinationof external field and GroEL concentration, experiments wereacquired as 32 interleaved spectra. Each interleaved spectrumrepresents a combination of the 15N continuous wave (CW)saturation pulse integral to the DEST experiment applied for0.7 s at one of 15 different offsets (21, 15, 12.5, 10, 7, 4, 2, 0, −2,−4, −7, −10, −12.5, −15, and −21 kHz at 600 MHz at bothconcentrations and 900 MHz at 20 μM GroEL; at 900 MHz and40 μM GroEL, offsets used were 28, 21, 15, 10, 7, 4, 2, 0, −2, −4,−7, −10, −15, −21, and −28 kHz) from the 15N carrier frequency(set at 118.5 ppm located at the center of the Aβ40 spectrum) attwo rf field strengths (250 and 500 Hz), as well as two controlexperiments with offsets of 35 kHz and a CW field of 0 Hz.Each 2D experiment is composed of 100* × 1,260* (600 MHz) or126* × 1,900* (900 MHz) complex points in the indirect 15N anddirect 1H dimensions, respectively. These parameters correspondto acquisition times of 75 and 164 ms in the 15N and 1H di-mensions, respectively, at 600 MHz, and to acquisition timesof 63 and 169 ms, respectively, at 900 MHz. Experiments wereacquired with 16 transients per free induction decay and an in-terscan delay of 1.7 s, resulting in total experiment times of about3 d (600 MHz) and 3.5 d (900 MHz).Processing of the 2D 15N-DEST data followed that of our
previous work (1). DEST profiles (i.e., ratio of cross-peak in-tensities as a function of CW saturation pulse frequency offsetto the corresponding cross-peak intensity without saturation)
Libich et al. www.pnas.org/cgi/content/short/1305715110 1 of 13

were extracted from the ratio of cross-peak heights in the ex-periments with saturation to the average of the heights of thecorresponding cross-peaks in the reference experiments withoutsaturation. To improve the signal-to-noise ratio in the mea-surement of the reference intensities further, and because nomeasurable saturation was detected at very large offsets, datacollected for absolute offsets >20 kHz were also treated as ref-erence experiments. The fitted/predicted saturation profiles (seebelow) display <1% signal intensity attenuation (far less than theexperimental noise) at these large offsets, further justifying thisnormalization procedure in an ex post fashion.
15N Relaxation Dispersion. 15N-CPMG (single quantum) relaxationdispersion experiments measuring 15N-R2 as a function of theCPMG field were acquired at 600 and 900 MHz for samplescomprising 50 μM Aβ40 in the presence of 20 μM GroEL usinga relaxation dispersion block with phase cycling designed tominimize off-resonance artifacts in the dispersion curve (7).CPMG fields, νCP, of 80, 160, 240, 320, 400, 640, 800, and 1,000Hz, where νCP = 1/(2τCP) and τCP is the time between 180° 15N-CPMG pulses, were applied for a constant transverse 15N re-laxation period of 100 ms. A reference experiment with no τCPdelay was also recorded. All CPMG experiments at a givenmagnetic field were recorded in an interleaved manner.
1HN and 15N Exchange-Induced Chemical Shifts. The 1HN and 15Nchemical shifts for Aβ40 at 900 MHz in the absence and presenceof 10 and 20 μM GroEL were measured from a high-resolution2D 1H-15N HSQC spectrum with 512* × 1,900* complex datapoints in the 15N (indirect, F1) and
1H (direct, F2) dimensions,respectively, corresponding to acquisition times of 225 and 169ms, respectively. Time domain data in the 15N and 1H dimen-sions were apodized with a 90°-shifted sine function and zero-filled to yield a 4,096* × 4,096* data matrix with digital reso-lutions of 0.56 and 2.6 Hz, respectively. It is important to notethat absolute chemical shifts are sensitive in the 1-Hz rangeto small, otherwise undetectable, sample-to-sample differences(e.g., pH, salt concentration); therefore, a reference sampleprepared in parallel from the same lyophilized Aβ40 aliquot wasused as the chemical shift reference for each condition (i.e., theAβ40 samples with 10 and 20 μM GroEL each had a distinctreference sample) to permit measurement of exchange-inducedshifts to an accuracy of better than 0.1 Hz. The accuracy of thisprotocol is evident from the excellent correlation between theexchange-induced shifts measured in the presence of 10 and20 μM GroEL (Fig. 2D). Chemical shifts in each spectrum wereextracted by automated peak picking in NMRPipe (8) using acustomized script in which the interpolation region was set tobe approximately half of the average line width (taken over allpeaks) and the detection region was set to half of the value usedfor the interpolation region. Errors in the peak positions due torandom noise were determined using NMRPipe as described (9).
13C Exchange-Induced Chemical Shifts. 13Cα and 13Cβ chemical shiftchanges on addition of GroEL were measured from 1H-13Cconstant time (CT)-HSQC spectra (10, 11). To achieve thenecessary high resolution to permit accurate determination ofsmall 13C chemical shift differences, a 56-ms CT delay was usedfor the CT-HSQC experiments, permitting the one-bond 13C-13CJ coupling (1JCC) coupling of the aliphatic side chains to evolvefor two full cycles, and thereby to be effectively removed. Agradient-enhanced detection scheme (12) was used, which notonly yields higher sensitivity but facilitates solvent suppression byapplication of the decoding gradient pulse before 1H detection inthe acquisition dimension. To suppress the solvent signal further,a very weak presaturation pulse with an rf field strength of ∼31Hz was applied on resonance with the water peak during theinterscan delay of 1 s. Although saturation transfer from water to
exchangeable protons (e.g., amide, side-chain hydroxyl groups),followed by spin diffusion to aliphatic protons, may potentiallyreduce the sensitivity of 13C-1H CT-HSQC spectra, we found thiseffect was negligible in the case of the essentially unstructuredAβ40. The 1H-13C CT-HSQC spectra were acquired with 594* ×1,900* complex data points and acquisition times of 54.7 and 145ms in the 13C (indirect) and 1H (direct) dimensions, respectively.Time domain data were apodized with a 90°-shifted sine functionand zero-filled, resulting in a 4,096* × 4,096* complex datamatrix with digital resolutions of 2.4 and 3.0 Hz in the 13C and1H dimensions, respectively. Chemical shifts in each spectrumwere measured and extracted as described for 15N shifts; how-ever, in addition, because the 13C exchange-induced shifts arevery small, the measurements were repeated three times each inthe presence and absence of GroEL.
13C-R2 Measurements on Free Aβ40. For the determination of13C-R2,
13C-R1ρ and13C-R1 measurements were carried out using
the same basic CT-HSQC pulse scheme as used for measuringexchange-induced 13C chemical shifts (see above) but were ex-tended for 13C relaxation measurements by incorporation ofsuitable blocks. Similar to 15N relaxation (6) and methyl 13C-R1ρ(13) relaxation measurements, additional pulse sequence seg-ments were incorporated into the basic CT-HSQC scheme forrephasing 2CzHz magnetization into Cz after the initial in-sensitive nuclei enhanced by polarization transfer (INEPT),performing a spin lock in the case of R1ρ or allowing a variabledelay for R1 measurements, and dephasing back to antiphasemagnetization during the CT t1 before gradient-enhanceddetection. 13Cα and 13Cβ R1ρ rates were measured with separateexperiments by setting the carrier to 58 ppm and 35.8 ppm forCα and Cβ, respectively. R1ρ spectra were recorded in an in-terleaved fashion with variable spin-lock periods of 3, 12, 25, 50,and 113 ms at 3.8 kHz (900 MHz) or at 3, 8, 20, 50, 90, and 150ms at 2.8 kHz (600 MHz), whereas R1 experiments used delays of0, 80, 240, 400, 480, and 640 ms. Note that for methylene CH2groups, refocusing into a pure Cz term at the end of the re-phasing INEPT is difficult due to the presence of a 4CzH
1zH
2z
term that cannot be completely eliminated by a simple protonpurge pulse. In addition, unlike the case for the Cα of nonglycineresidues, the 13C magnetization of CH2 groups is expected todecay nonexponentially, largely as a result of 1H-13C dipole-dipolecross-correlated relaxation. The same is true of alanine methylgroups, where multiexponential behavior is expected owing todifferent decay rates for the 1/2 and 3/2 manifolds. Although thesecaveats complicate the measurement of methyl and methylene 13Crelaxation rates needed for precise probing of the dynamics ofthese groups, the resulting apparent 13C-R2 rates are sufficient toestablish the approximate ratio of 13Cα to 13Cβ R2 values withina given residue of free Aβ40. The 13C-R2 values were calculatedfrom 13C-R1ρ and
13C-R1 values using the equation:
R2 =�R1ρ −R1cos2ðθÞ
��sin2ðθÞ; [S1]
where θ is the angle between the effective spin-lock field and theexternal magnetic field (where 90° represents a resonance exactlyon-resonance with the spin-lock field). The ratio of 13Cβ to 13CαR2 values was found to be ∼0.9 with the exception of alaninemethyl groups, in which the apparent ratio was about 0.5.
Simultaneous Fitting of 15N DEST, ΔR2, Relaxation Dispersion, andObserved Chemical Shift Deviations to a Two-State Kinetic Model.The experimental 15N-DEST profiles (eight datasets from twosamples containing 50 μM Aβ40 in the presence of 20 and 40 μMGroEL recorded at spectrometer frequencies of 600 and 900MHz with CW rf field strengths of 250 and 500 Hz), 15N-ΔR2values (four datasets comprising the same two samples at 600
Libich et al. www.pnas.org/cgi/content/short/1305715110 2 of 13
and 900 MHz vs. the matched samples in the absence of GroEL),15N relaxation dispersion (two datasets at 600 and 900 MHz usingthe sample containing 20 μM GroEL), and 15N chemical shiftdifferences between the Aβ40 samples in the absence and presenceof 20 μM GroEL (two datasets at 600 and 900 MHz) were usedtogether to perform a single simultaneous fit to a two-state model(Fig. 3) optimizing two global parameters, kappon and the fraction pAof free Aβ40, and two sets of residue-specific parameters, the15N‐RGroEL‐bound
2;calc ðiÞ values for GroEL-bound Aβ40 and the 15Nchemical shift differences ΔωN(i) between GroEL-bound and freeAβ40. [Note the fraction pB of GroEL-bound Aβ40 is given by 1 −pA and the dissociation constant koff is given by kappon pA=ð1− pAÞ].The four different experiments for all measured residues de-termine the optimized values of kappon and pA. The four differentexperiments for any given residue i determine the optimized valueof that residue’s 15N‐RGroEL‐bound
2;calc ðiÞ, and the 15N relaxation dis-persion and exchange-induced 15N-shift data for any given residuei determine the optimized value of that residue’s ΔωN(i).As we described previously (1, 5), the time-dependent mag-
netization in both DEST and ΔR2 experiments can be repre-sented by a homogeneous form of the McConnell equations (14,15). For a single isolated spin in two-site exchange:
where I represents the rotating frame magnetization of a 15Nnucleus in the free and GroEL-bound states (denoted by thesuperscripts A and B, respectively). R1 and R2 are the longitu-dinal and transverse magnetization relaxation rates (where theadditional superscript 0 for R2 signifies the transverse relaxationrate in the absence of exchange between states A and B); Ω is thedifference between the peak resonant frequency and the fre-quency of the applied saturation field; ω is the strength of theCW saturation field (0 for ΔR2 experiments) about the given axis(x or y); E is unity; and Θn =Rn
1Inz;0, where Inz;0 is the equilibrium
longitudinal magnetization of state n. The initial magnetizationis entirely longitudinal (i.e., only the Iz terms are nonzero) forthe DEST experiment and transverse (i.e., only the Ix terms arenonzero) for the ΔR2 experiment (1).The DEST experimental observable κ, the ratio of the signal
intensity of the resonance as a function of saturation offset andsaturation field to that without saturation, can be calculated asdescribed previously (1, 16). Briefly, the numerical solution forIAz after the CW saturation time of 0.7 s at each combination ofsaturation offset Ω, saturation field ωx, residue position, externalfield condition (900 and 600 MHz), and concentration of GroEL(20 and 40 μM) was calculated as a function of saturation offsetby solving Eq. S2 using the matrix exponential function in theprogram MATLAB (MathWorks). The value of κ was computedby calculating IAz for both initial 15N magnetization conditionsduring the saturation period (on the +z and −z axes, I+z and I−z);the difference, I+z − I−z, is then computed and finally normalizedto the solution without saturation. RA;0
2 , RA1 (Fig. S5), and ΩA for
each residue were set to the experimental values measured in the
absence of GroEL, and RB1 for Aβ40 in the dark state bound to
GroEL was set to an estimated constant value of 0.5 s−1, the valueof which we have previously shown does not affect the results bydesign of the experiment (1). The value of kappon in the presence of40 μM GroEL was assumed to be twice as high as that in thepresence of 20 μM GroEL, an assumption that is perfectly reason-able because the observed values ofΔR2 are linearly proportional tothe concentration of GroEL over a range of 10–40 μM in subunits(Fig. S2 C and D), reflecting the linear dependence of 15N-ΔR2on the pseudo-first order association rate constant, kappon , given bykappon = kon½GroEL�free ≈ kon½GroEL�total=ð½Aβ40�totalKA + 1Þ, wherekon is the second order association rate constant and KA is theequilibrium association constant. For the purposes of fitting the15N-DEST data, one can readily assume that the 15N chemicalshifts in the visible and dark states are equal (ΩA = ΩB), since anyshift differences are very small compared with the width of theDEST saturation profiles (16). However, in this instance, thechemical shifts in the bound state are afforded from fitting the 15Nrelaxation dispersion and exchange-induced 15N shift data (seebelow), allowing the ΩB values to be obtained explicitly.ΔR2 was calculated by propagating Eq. S2 with initial mag-
netization only on the transverse (e.g., x) axis using a simple
two-time point single exponential decay for computing the ef-fective 15N-R2:
ΔR2 =ln�IAx ðτ1Þ=IAx ðτ2Þ
�τ2 − τ1
−RA;02 ; [S3]
where the delays τ1 and τ2 were set to 10 and 30 ms, respectively;τ1 was chosen to remove any small deviations from exponentialbehavior at very short delays, and τ2 was chosen to match theorder of magnitude of the experimental delays used to measureR2 in the case of fast relaxation (R2 ∼ 25 s−1). For the fitting ofΔR2, states A and B were assumed, for ease of implementation,to have the same chemical shift, because relaxation enhancementarising from chemical exchange is virtually completely sup-pressed in the experimental 15N-R2 measurements, which incor-porate a 550-Hz CPMG train (i.e., the increase in 15N-R2 valuesfor Aβ40 in the presence of GroEL is almost entirely due tolifetime broadening arising from the higher intrinsic 15N-R2 val-ues of the dark GroEL-bound state). For Aβ40 in the absence ofGroEL, no measurable 15N relaxation dispersion is observed forany residue; in the presence of GroEL, a few residues of Aβ40show a very small amount of 15N relaxation dispersion in CPMGexperiments, which entail very small corrections in the observedΔR2 values (the largest of which is less than 0.5 s−1 in the pres-ence of 20 μM GroEL at a spectrometer frequency of 900 MHzand a CPMG field of 550 Hz; Fig. S1). To completely removeany contribution to ΔR2 from residual chemical exchange effectsat a CPMG field of 550 Hz, experimental ΔR2 values at eachresidue and B0 field were corrected by simply subtracting any
ddt
26666666664
E=2IAxIAyIAzIBxIByIBz
37777777775=
26666666664
0 0 0 0 0 0 00 RA;0
2 + kappon ΩA −ωy −koff 0 00 −ΩA RA;0
2 + kappon ωx 0 −koff 0−2ΘA ωy −ωx RA
1 + kappon 0 0 −koff0 −kappon 0 0 RB;0
2 + koff ΩB −ωy
0 0 −kappon 0 −ΩB RB;02 + koff ωx
−2ΘB 0 0 −kappon ωy −ωx RB1 + koff
37777777775×
26666666664
E=2IAxIAyIAzIBxIByIBz
37777777775; [S2]
Libich et al. www.pnas.org/cgi/content/short/1305715110 3 of 13
residual intermediate chemical exchange contributions still presentat 550 Hz [estimated by R2(550 Hz) − R2(5,000 Hz) for the pre-vious fit iteration of the relaxation dispersion curves; see below].For the 15N-CPMG experiments, an analytical expression for
the apparent R2ðRapp; 1=ð2τCPÞ2 Þ of the resonances of free Aβ40
as a function of CPMG field (1/2τCP), valid in all exchange andpopulation regimes, was used (17):
Rapp;1=ð2τCPÞ2 =
12
�RA;02 +RB;0
2 + kex −1τCP
cosh−1½D+coshðη+Þ
−D−cosðη−Þ��;
[S4]
where τCP is the delay between 180° pulses in the CPMG pulsetrain:
D± =12
"Ψ+ 2 ·Δω2
N�Ψ2 + ζ2
�1=2 ± 1
#
η± =τCPffiffiffi2
ph�Ψ2 + ζ2
�1=2±Ψ
i1=2
Ψ=hRA;02 −RB;0
2 − kexðpA − pBÞi2
−Δω2N + 4pApBðkexÞ2
ζ= 2 ·ΔωN
hRA;02 −RB;0
2 − kexðpA − pBÞi; [S5]
and ΔωN is the chemical shift difference (in units of rad·s−1) be-tween the free and GroEL-bound states of Aβ40, kexð= kappon + koffÞis the overall exchange rate, and pA and pB (= 1 − pA) are thefractions of free and GroEL-bound Aβ40, respectively.The exchange-induced 15N shifts (δexN in units of hertz) observed
for Aβ40 in the presence of GroEL were calculated using (18)
δexN =kappon koffΔωN=2π
koff +RB;02 −RA;0
2
�2+Δω2
N
; [S6]
where ΔωN/2π is the difference in 15N chemical shifts (15N-Δδ)in units of hertz between the free and GroEL-bound states.All the experimental data were fit simultaneously byminimizing
the sum of the squared difference, F, between the observed andcalculated values of the experimental observables using a customMATLAB program implementing Eqs. S2–S6:
where the subscripts i, j, k, l, m, and n refer to residue number,DEST offset, DEST field strength (250 and 500 Hz), GroELconcentration (20 and 40 μM), 1H spectrometer frequency (600and 900 Hz), and CPMG field, respectively, and α1, α2, α3, and α4represent empirically determined constants used to weight thedifferent data types appropriately and have numerical values of
0.1, 1, 10, and 500, respectively. Note that because the un-certainties in the measured values of ΔR2 and the relaxationdispersion ðRapp;1=ð2τCPÞ
2 Þ data vary significantly, the differencesbetween observed and predicted values were divided by theuncertainties in the observed values. The uncertainties in thevalues of the optimized parameters, corresponding to confidenceintervals of ±1 SD, were determined from the nonlinear fitJacobian matrix using the MATLAB function nlparci. Conver-gence of the solution was confirmed by varying initial values for allparameters and obtaining the same solution within reported un-certainties. Because there are only two global parameters (kapponand pA) with the remaining parameters, 15N‐RGroEL‐bound
2;calc ðiÞ andΔωN(i), entirely local to each residue position, the rangeof possible solutions in multidimensional parameter space iseasily sampled.It is important to note that the four experiments are influenced
in different ways by the interplay of the exchange rates andresidue-specific 15N‐RGroEL‐bound
2;calc ðiÞ and, as a result, are highlycomplementary to one another. For example, the ΔR2 mea-surements place a lower limit on the value of kappon because theextent of lifetime line-broadening cannot exceed the value ofkappon , and the value of ΔR2(i) is only influenced by the values ofkoff and 15N‐RGroEL‐bound
2;calc ðiÞ when the magnitude of koff is com-parable to or larger than 15N‐RGroEL‐bound
2;calc ðiÞ (as is the case here).When koff � 15N‐RGroEL‐bound
2;calc ðiÞ, ΔR2 = kappon . The 15N-DESTprofiles are sensitive to the values of both koff and kappon , as well asto the values of 15N‐RGroEL‐bound
2;calc ðiÞ of course, but they are ef-fectively independent of the chemical shift differences ΔωN(i)between free and bound Aβ40 (as are the values of ΔR2). Boththe relaxation dispersion curves and exchange-induced shifts aredependent on the chemical shift differences ΔωN(i) between freeand bound Aβ40; however, whereas the exchange-induced shiftvalues (which can be measured very accurately) are directly de-pendent on ΔωN(i), ΔωN(i) values modulate both the amplitudeand shape of the dispersion curves. The exchange-induced shifts,however, are only dependent on 15N‐RGroEL‐bound
2;calc ðiÞ when15N‐RGroEL‐bound
2;calc ðiÞ is of the same order of magnitude or largerthan koff (as is the case here). When koff � 15N‐RGroEL‐bound
2;calc ðiÞ,the exchange-induced shift is independent of 15N‐RGroEL‐bound
2;calc ðiÞ.It is worth noting that for the current system, the relaxation
dispersion data alone are insufficient to determine the exchangerates precisely because the small magnitude of the observeddispersions (Fig. 1D) and the concomitant experimental uncer-tainties result in a shallow minimum with reasonably acceptablefits for quite a broad range of kinetic parameters. For exam-ple, when the experimental 15N exchange-induced shifts ðδexN Þ are
omitted from the global optimization, the relaxation dispersion,DEST, and ΔR2 data can be equally well fit with a kappon value aslow as 15 s−1 (and koff = 1,180 s−1) but the calculatedδexN;calcvalues are underpredicted (the maximum value of jδexN;calcjis 0.9 Hz compared with an observed value of 1.3 Hz, and manyδexN;calc values are zero because there is no measurable dispersion
F = α1Xi
X2l= 1
X2m= 1
ΔRobs;i;l;m
2 −ΔRcalc;i;l;m2
σΔRobs;i;l;m2
!2
+ α2Xi
Xj
X2k= 1
X2l= 1
X2m= 1
�κobs;i;j;k;l;m − κcalc;i;j;k;l;m
�2
+ α3Xi
Xn
X2m= 1
Rapp;obs;i;n;m2 −Rapp;calc;i;n;m
2
σRapp;obs;i;n;m2
!2
+ α4Xi
X2m= 1
δex;obs;iN − δex;calc;iN
�2;
[S7]
Libich et al. www.pnas.org/cgi/content/short/1305715110 4 of 13

at many residues) and the maximum value of 15N‐RGroEL‐bound2;calc is
∼2,500 s−1, a factor of 2.5 larger than expected for a system ofthis size. If only the relaxation dispersion data for the 12 resi-dues (F4, R5, V18, F19, F20, A21, K28, G33, M35, V36,V39, and V40) that show any significant dispersion are usedin the minimization, a reasonable fit can be obtained withkappon = 162 s�1 and koff = 6,040 s−1; however, the δexN;calc values arefar too large with a maximum value of 23 Hz and the maximum15N‐RGroEL‐bound
2;calc value (240 s−1) is too small. Inclusion of theexchange-induced chemical shifts was therefore critical for ac-curate determination of the exchange rate constants and furtherprovided chemical shift information at almost every residueposition. Thus, analysis of exchange-induced chemical shifts,which are readily measured from a pair of 2D heteronuclearcorrelation spectra, represents a generally applicable approachfor quantitative analysis of chemical exchange in interactingsystems that display small relaxation dispersion effects eitherbecause the exchange regime lies close to or outside the rangethat can be probed by relaxation dispersion or because thechemical shift differences between the major and minor statesare small.Conversely, it is also important to note that the relaxation
dispersion data, although insufficient to define the values of theglobal exchange parameters uniquely in the absence of the ob-served exchange-induced chemical shifts, are also dependent onthe chemical shift differences between free and bound Aβ40, andprovide critical restraints on the fit. When the relaxation dis-persion data are omitted, global kinetic and local chemical shiftparameters that result in reasonably good fits to the other ex-perimental data within experimental error can be found. How-ever, the solutions obtained on exclusion of the relaxationdispersion data are not unique. Although solutions can be foundthat fit the data adequately with values of the various optimizedparameters that differ quite significantly (i.e., outside the ±1 SDconfidence intervals) from those obtained when the relaxationdispersion data are included in the global fitting, these solutionsdo not predict the observed relaxation dispersion curves correctly.Although the solutions found by including the relaxation disper-sion data are among the possible solutions of course, the potentialsolutions found when the relaxation dispersion data are excludedspan a large range of parameters, predicting anything from largerelaxation dispersions that are clearly not observed in the experi-mental data to very little dispersion at all sites. Thus, inclusion ofthe relaxation dispersion data in the global fitting is also critical.As noted above, only 12 residues show significant relaxation
dispersion above experimental noise and artifacts. In the globalfitting, however, we included the relaxation dispersion data for allresidues. Although not strictly required, the latter are usefulbecause they place stringent upper limits on the chemical shiftdifferences between the free and bound states for residues that donot exhibit any measurable relaxation dispersion.
15N-R2 Rates Measured by Relaxation-Compensated CPMG vs. R1ρ.Both relaxation-compensated CPMG (19) and R1ρ (6) wereused for the measurement of 15N-R2 rates. The R1ρ experiment(corrected for off-resonance effects; see Eq. S1) measures the R2rate of in-phase Nx coherence; the relaxation-compensatedCPMG experiment, on the other hand, measures the averagerelaxation rate of antiphase 2NyHz and in-phase Nx coherences.Although the difference between the relaxation rates of 2NyHzand Nx for an isolated 15N-1H spin system is negligibly small, fora protonated polypeptide, the antiphase term relaxes faster thanthe in-phase coherence by a term Rext (also known as scalar re-laxation of the second kind) given by:
Rext = ρHH + kwaterex ; [S8]
where ρHH is the sum of the amide 1H relaxation rates as a resultof dipolar interaction of the backbone amide proton with allother nearby protons in space and kwaterex is the water exchangerate. The relaxation-compensated CPMG R2 therefore containsan additional Rext/2 term relative to the pure in-phase R2ðRin‐phase
2 Þ measured in the R1ρ experiment:
RCPMG2 =Rin‐phase
2 +Rext=2: [S9]
Under the experimental conditions used (pH 6.5 at 5 °C), thecontribution from solvent exchange ðkwaterex Þ is small even for anunstructured peptide. Moreover, the kwaterex contribution is can-celed out forΔR2, because this rate is expected to be the same inthe free and bound states. The ρHH, however, can make a signif-icant contribution to the value of the relaxation-compensatedCPMG R2 ðRCPMG
2 Þ in the GroEL-bound state, because ρHH isproportional to the effective correlation time (on a residue ba-sis), and therefore to Rin‐phase
2 . Thus, as expected, ΔRCPMG2 and
ΔRin‐phase2 are highly correlated with a slope of 1.11 at 900 MHz
(Fig. S6A). Similarly, RCPMG;bound2 and Rin‐phase;bound
2 , calculated byleast-squares optimization (see Eqs. S2 and S3) from the exper-imental 900-MHz RCPMG
2 and Rin‐phase2 data, respectively, measured
in the presence and absence of GroEL, with the kinetic rate con-stants set to the values determined independently from theCPMG relaxation dispersion curves and exchange-induced shiftdata, are highly correlated with a slope of 1.12 at 900 MHz (Fig.S6B). Because ρHH is field-independent in the spin-diffusionlimit, the slope of RCPMG;bound
2 vs. Rin‐phase;bound2 will increase at
a lower magnetic field: At 600 MHz, that slope is calculated tobe 1.15.Both 15N-R2 of free Aβ40 and 15N-ΔR2 are used in the joint
fits to the DEST, ΔR2, CPMG relaxation dispersion, and ex-change-induced chemical shift data. The question then arisesabout which R2 should be used in fitting the different typesof data.The computation of ΔR2, as formulated by Eqs. S2 and S3,
formally uses the ratio of in-phase magnetization at times τ1 andτ2, and is therefore directly applicable to the analysis of ΔRin‐phase
2measured from the R1ρ experiments. However, the same for-mulation is equally applicable to ΔRCPMG
2 obtained using therelaxation-compensated CPMG experiment by simply replacingthe Rin-phase
2 terms in Eq. S2 by RCPMG2 . The experimental ΔR2
data used in the global fitting presented in the main text andshown in the figures of the main text relate to ΔRCPMG
2 . This wasdone to simplify the calculations, because RCPMG
2 is naturally theappropriate R2 for the analysis of the relaxation-compensatedCPMG relaxation dispersion data, as well as the exchange-inducedchemical shifts (see below).The 1HN and 15N exchange-induced chemical shifts were
measured from HSQC experiments in which the one-bond N-H Jcoupling (1JNH) Hamiltonian evolves for t1/2, although theoverall evolution is refocused by a 180° proton pulse in themiddle of t1. This results in the presence of both in-phase andantiphase magnetization for an approximately equal amount oftime, on average. Therefore, RCPMG
2 is the relevant R2 for fittingthe exchange-induced chemical shifts using Eq. S6. The same istrue for the 13C exchange-induced shifts from a CT-HSQC ex-periment.In the DEST experiment (see the pulse scheme shown in figure
S8 of ref. 1), the 15N saturation pulse is applied to in-phase Nzmagnetization, and Eq. S2 only includes in-phase transversecoherence terms in both free and bound states. Thus, in princi-ple, the Rin‐phase
2 values obtained from an R1ρ experiment shouldbe used for fitting the DEST data. However, it should be notedthat the in-phase transverse magnetization created during theDEST saturation could potentially evolve into a small amountof antiphase coherence. To evaluate how the use of only the in-
Libich et al. www.pnas.org/cgi/content/short/1305715110 5 of 13

phase basis coherences in Eq. S2 may affect the accuracy of theDEST effect, the attenuation of the observable IAz intensity wassimulated using both Eq. S2 and the expanded equation below,which includes both in-phase and antiphase coherences:
where RA;12 =RA;0;in‐phase
2 + ρAHH + kappon and RB;12 =RB;0;in‐phase
2 +ρBHH + koff ; ηAxy and ηBxy are the transverse cross-correlated re-laxation rates in states A and B, respectively; ηAz and ηBz are thelongitudinal cross-correlated relaxation rates in states A and B,respectively; and J is 1JNH = 92 Hz. The cross-correlated termsare only included in Eq. S10 for completeness, because they aresuppressed in the DEST experiment by the application ofa 180° 1H pulse every 100 ms during the 15N CW saturationperiod. In addition, the approximations R2(2IxyHz) ≅ R2(Ixy) +ρHH and R1(2IzHz) ≅ R1(Iz) + ρHH are made because for a givenstate, ρHH should be the same in R2(2IxyHz) and R1(2IzHz). Thetime course of the magnetization explicitly incorporating bothin-phase and antiphase terms can then be simulated. For stateA (the free state), ρHH was calculated for each residue using theformula 2ðRCPMG
2 −Rin‐phase2 Þ, where RCPMG
2 and Rin‐phase2 were ex-
perimentally measured on free Aβ (in the absence of GroEL). Forstate B (the bound state), Rin‐phase
2 was estimated by RCPMG2 =γ,
where γ is the empirically determined slope of the correlation plot
between RCPMG;bound2 and Rin‐phase;bound
2 , and ρHH was estimated by2RCPMG
2 ðγ − 1Þ=γ. At 900 MHz, γ = 1.12 (Fig. S6B).Numerical simulations show that Eq. S2 is sufficient, because
the simulated DEST profiles calculated using Eq. S2 or Eq. S10
are effectively indistinguishable (Fig. S7A). Even the DEST pro-files calculated using Eq. S2 with either Rin‐phase
2 or RCPMG2 differ
minimally, and these differences are well within the experimentaluncertainties in the measured cross-peak intensities as a functionof the frequency offset of the 15N saturation pulse (Fig. S7B).Global simultaneous fitting to all the DEST, ΔRCPMG
2 , CPMGrelaxation dispersion, and exchange-induced shift data resulted inno significant differences in the fitted parameters for any give case:(i) explicitly including in-phase and antiphase terms in fitting to theDEST data (Eq. S10); (ii) simply assuming transverse relaxationrates in the free and bound states are represented by the optimizedresidue-specific values for RCPMG;bound
2 directly; or (iii) substitutingmeasured in-phase values for the free relaxation rate and scalingthe RCPMG;bound
2 parameter by 1/γ in the DEST fitting to accountfor slightly slower in-phase relaxation.
Numerical Simulation of Exchange-Induced Shifts in Real-Time and CTNMR Experiments. 13Cα and 13Cβ 13C chemical shifts were in-directly recorded using a 56-ms CT period, thereby eliminating
ddt
266666666666666666666666666664
E=2IAxIAyIAzIBxIByIBz
2IAx HAz
2IAy HAz
2IAz HAz
2IBx HBz
2IBy HBz
2IBz HBz
377777777777777777777777777775
=
−
266666666666666666666666666666664
0 0 0 0 0 0 0 0 0 0 0 0 00 RA;0;in‐phase
2 + kapponΩA −ωy −koff 0 0 ηAxy πJ 0 0 0 0
0 −ΩA RA;0;in‐phase2 + kappon
ωx 0 −koff 0 −πJ ηAxy 0 0 0 0
−2ΘA ωy −ωx RA1 + kappon 0 0 −koff 0 0 ηAz 0 0 0
0 −kappon 0 0 RB;0;in‐phase2+ koff
ΩB −ωy 0 0 0 ηBxy πJ 0
0 0 −kappon 0 −ΩB RB;0;in‐phase2+ koff
ωx 0 0 0 −πJ ηBxy 0
−2ΘB 0 0 −kappon ωy −ωx RB1 + koff 0 0 0 0 0 ηBz
0 ηAxy πJ 0 0 0 0 RA;12 ΩA −ωy −koff 0 0
0 −πJ ηAxy 0 0 0 0 −ΩA RA;12 ωx 0 −koff 0
0 0 0 ηAz 0 0 0 ωy −ωx RA1 + ρAHH+ kappon
0 0 −koff
0 0 0 0 ηBxy πJ 0 −kappon 0 0 RB;12 ΩB −ωy
0 0 0 0 −πJ ηBxy 0 0 −kappon 0 −ΩB RB;12 ωx
0 0 0 0 0 0 ηBz 0 0 −kappon ωy −ωx RB1 + ρBHH+ koff
377777777777777777777777777777775
266666666666666666666666666664
E=2IAxIAyIAzIBxIByIBz
2IAx HAz
2IAy HAz
2IAz HAz
2IBx HBz
2IBy HBz
2IBz HBz
377777777777777777777777777775
;
[S10]
Libich et al. www.pnas.org/cgi/content/short/1305715110 6 of 13

the 1JCC evolution for improved spectral resolution that is crucialfor this study. We note, however, that Eq. S6 for the exchange-induced shift (18) was derived for the case of real-time evolution.The potential impact of the CT delay on the exchange-inducedshift therefore needed to be assessed before the 13C chemicalshift changes observed for Aβ40 in the presence of GroEL couldbe analyzed using this equation. To this end, numerical simu-lations of both real-time and CT spectra were performed basedon the equation (18):
ddt
�VAðtÞVBðtÞ
=
"−iωA − kappon −RA;0
2 koffkappon −iωB − koff −RB;0
2
#�VAðtÞVBðtÞ
;
[S11]
where VA(t) and VB(t) are the amounts of coherence V in theA (free) and B (GroEL-bound) states at time t; ωA and ωB arethe corresponding Zeeman frequencies in radians·s–1; kapponand koff are the pseudo–first-order on-rate and off-rate, re-spectively (corresponding to the transition from A to B andfrom B to A, respectively); and RA;0
2 and RB;02 are the corre-
sponding transverse spin relaxation rates in the absence ofexchange (18).The solution to the above equation for the real-time experi-
ment can be written as follows:
�VAðtÞVBðtÞ
= exp
"−iωA − kappon −RA;0
2 koff
kappon −iωB − koff −RB;02
#t
!
×�VAð0ÞVBð0Þ
;
[S12]
with initial conditions VAð0Þ= koff=ðkappon + koffÞ and VBð0Þ=kappon =ðkappon + koffÞ for a two-state chemical exchange processin equilibrium. The matrix exponential in Eq. S12 can benumerically evaluated using the matrix exponential functionwithin MATLAB, which allows the real-time spectrum FRT
Ain the free state to be obtained by Fourier transformationof VA(t).For the CT spectrum with a CT period of 2T, FCT
A in the freestate is acquired at T + t/2 and T − t/2 before and after the re-focusing 13C pulse, respectively. We first used Eq. S12 and as-sociated initial conditions to calculate both VA(T + t/2) andVB(T + t/2) (i.e., the amounts of coherence V in the free andbound states at time point T + t/2, immediately before the re-focusing pulse). The subsequent 180° pulse with phase x flips thesign of the y component of coherence V, and its effect can besimply represented by taking the complex conjugate of VA(T + t/2) and VB(T + t/2). The complex conjugate of these two terms isthen used as the new initial condition to replace VA(0) and VB(0)in Eq. S12, which computes the additional evolution of co-herence V during the time T − t/2. The overall CT evolution ofcoherence V is thus formulated as follows:
where conj stands for taking the complex conjugate of each termin the resulting column vector. Fourier transformation of thefinal coherence in the free state VA(t) then yields the CT spec-trum FCT
A .Numerical simulations were performed in MATLAB using
a CT delay 2T of 56 ms, with values of kappon and koff of 34.8 and1,440 s−1, as determined in the main text, and a range of ap-propriate 13C-R2 values in the free (12.5–16.5 s−1) and bound(520–1,740 s−1) states derived from the backbone 15N-R2 ratesdetermined from global fitting in the main text. Using a spectralwidth of 400 Hz, the evolution of VA(t) in both real-time andCT experiments was calculated from t = 0 to 56 ms in intervals of2.5 ms, apodized using a cosine window function, and zero-filledto 2,048 points before Fourier transformation to obtain the real-time FRT
A and CT FCTA spectra. The point with the highest in-
tensity in each spectrum was first picked, and together with theimmediately adjacent points on the upfield and downfield sides,was best-fitted to a parabolic function whose maximum is thendetermined as the observed peak position of the free state. Thisapproach provides a much more accurate peak position than thedirect pick of the most intense point when the simulated timedomain data are only moderately zero-filled. The exchange-in-duced shift is then obtained from the difference between thesimulated peak position and ωA/2π (−100 Hz used throughoutthe simulations, whereas the frequency for the bound B statevaried from −82 to 105 Hz). Within the range of relaxation andexchange parameters observed in our study, we found that thedifference between the exchange-induced shifts observed in thereal-time and CT experiments was less than 2% (i.e., around 0.02Hz for a 1.0-Hz exchange-induced shift), smaller than the ex-perimental accuracy attainable for this type of measurement inour study. The simulated shifts in the two experiments are es-sentially the same as the value calculated using the analyticalexpression given by Eq. S6, thereby validating the use of Eq. S6for the analysis of exchange-induced shifts in CT spectra over therange of conditions applicable to the current study.
Calculating 1HN Chemical Shifts for GroEL-Bound Aβ40. The 1HNexchange-induced shifts were measured from the same spectraused to determine the 15N exchange-induced shifts. The 1HN-R2measurements were carried out as described previously (5).Given the experimental 1HN-R2 values in the absence andpresence of GroEL, the 1HN-R2 values in the GroEL-boundform were determined by nonlinear least-squares minimizationof the difference between observed and calculated (from Eqs. S2and S3) 1HN-ΔR2 values, optimizing the 1HN-R2 values in theGroEL-bound state while holding fixed the global rate constantparameters derived from the 15N data and the experimental 1HN-R2 values in the free state. With the calculated 1HN-R2 values forthe GroEL-bound form and the experimental exchange-induced1HN shifts in hand, the 1HN chemical shift differences betweenthe GroEL-bound and free forms of Aβ40 were calculated usingEq. S6 (with 1HN shifts replacing 15N shifts) solved for Δω.
�VAðtÞVBðtÞ
= exp
"−iωA − kappon −RA;0
2 koffkappon −iωB − koff −RB;0
2
#ðT − t=2Þ
!
conj
exp
"−iωA − kappon −RA;0
2 koffkappon −iωB − koff −RB;0
2
#ðT + t=2Þ
!�VAð0ÞVBð0Þ
!; [S13]
Libich et al. www.pnas.org/cgi/content/short/1305715110 7 of 13

Calculating 13Cα and 13Cβ Chemical Shifts for GroEL-Bound Aβ40. The13Cα and 13Cβ shifts in the GroEL-bound state were calculatedfrom the corresponding experimental exchange-induced 13C shiftsand calculated 13C-R2 values for the GroEL-bound state, usingEq. S6 (with 13C shifts replacing 15N shifts), as described for the1HN shifts above. The 13C-R2 values in the GroEL-bound state,however, could not be determined experimentally because thebroadness of the cross-peaks in the CT-HSQC spectrumprecludedthe making of accurate 13C-R2 measurements in the presence ofGroEL. The 13Cα and 13Cβ R2 values in the GroEL-bound statewere therefore calculated directly from the corresponding 15N-R2values taking into account the different gyromagnetic ratios of 13Cand 15N and the different N-H and C-H bond lengths (see below).This approach is justified because motion of N-H and Cα-H vec-tors of a given residue will be virtually identical, and 13C-R2measurements on free Aβ40 indicate that the ratio of 13Cβ to 13CαR2 values of the same residue is ∼0.9, with the exception of thealanine methyl groups, where the apparent ratio is close to 0.5.As noted above, the calculation of bound 13C chemical shifts
requires the values of 13C‐RCPMG;bound2 to be known. At 900 MHz,
the ratio (α)13C‐Rin‐phase;bound2 =15N‐Rin‐phase;bound
2 (assuming thesame order parameter for the N-H and Cα-H bond vectorswithin a given residue) is calculated to be 2.7, based on theknown values of N-H and C-H bond lengths, as well as the gy-romagnetic ratios and chemical shift anisotropies of 13C and 15N.Assuming to a first approximation that the proton density
surrounding HN, Hα, and Hβ is the same, such that the Rext term(see Eq. S8) has roughly the same value for 15N, 13Cα, and 13Cβ,13C‐RCPMG;bound
2 at 900 MHz can be readily calculated from15N‐RCPMG;bound
2 at 900 MHz using the equation:
13C‐RCPMG;bound2 = λ15N‐RCPMG;bound
2 ½ðα+ γ − 1Þ=γ�; [S14]
where λ is the ratio of the 13C- to 15N-order parameters S2C=S2N
with values of 1, 0.9, and 0.5 (see above) for 13Cα, 13Cβ, and13Cβ-methyl, respectively, and γ is the ratio of 15N‐RCPMG;bound
2 to15N‐Rin‐phase;bound
2 , which is equal to 1.12 at 900 MHz (Fig. S6B).
Average End-to-End Distance Between the Centers of the Two GroEL-Binding Aβ40 Hydrophobic Regions. From both the experimental15N-ΔR2 data (Fig. 1A) and the computed 15N‐RGroEL‐bound
2;calc val-ues (Fig. 4A), one can conclude that the centers of the two mainGroEL-binding hydrophobic regions are located at residues 19and 32. For a random coil, the expected average rms end-to-end distance hr2i1=20 between residues 19 and 32 is expected tolie between 32 and 38 Å, calculated from hr2i1=20 = ðCnnl2Þ1=2,where l is the Cα-Cα distance (3.8 Å), n is the number of residues(14 in this instance), and Cn is the characteristic ratio (estimated tobe between 5 and 7 for a polypeptide of n = 14 with only oneglycine) (20).
1. Fawzi NL, Ying J, Ghirlando R, Torchia DA, Clore GM (2011) Atomic-resolutiondynamics on the surface of amyloid-β protofibrils probed by solution NMR. Nature480(7376):268–272.
2. Iwahara J, Anderson DE, Murphy EC, Clore GM (2003) EDTA-derivatizeddeoxythymidine as a tool for rapid determination of protein binding polarity to DNAby intermolecular paramagnetic relaxation enhancement. J Am Chem Soc 125(22):6634–6635.
3. Grason JP, Gresham JS, Lorimer GH (2008) Setting the chaperonin timer: Atwo-stroke, two-speed, protein machine. Proc Natl Acad Sci USA 105(45):17339–17344.
4. van der Vies SM, Viitanen PV, Gatenby AA, Lorimer GH, Jaenicke R (1992)Conformational states of ribulosebisphosphate carboxylase and their interactionwith chaperonin 60. Biochemistry 31(14):3635–3644.
5. Fawzi NL, Ying J, Torchia DA, Clore GM (2010) Kinetics of amyloid β monomer-to-oligomer exchange by NMR relaxation. J Am Chem Soc 132(29):9948–9951.
6. Lakomek NA, Ying JF, Bax A (2012) Measurement of 15N relaxation rates inperdeuterated proteins by TROSY-based methods. J Biomol NMR 53(3):209–221.
7. Yip GN, Zuiderweg ER (2004) A phase cycle scheme that significantly suppressesoffset-dependent artifacts in the R2-CPMG 15N relaxation experiment. J Magn Reson171(1):25–36.
8. Delaglio F, et al. (1995) NMRPipe: A multidimensional spectral processing systembased on UNIX pipes. J Biomol NMR 6(3):277–293.
9. Kontaxis G, Clore GM, Bax A (2000) Evaluation of cross-correlation effects andmeasurement of one-bond couplings in proteins with short transverse relaxationtimes. J Magn Reson 143(1):184–196.
10. Santoro J, King GC (1992) A constant-time 2D Overbodenhausen experiment forinverse correlation of isotopically enriched species. J Magn Reson 97(1):202–207.
11. Vuister GW, Bax A (1992) Resolution enhancement and spectral editing of uniformly13C-enriched proteins by homonuclear broad-band 13C decoupling. J Magn Reson 98:428–435.
12. Kay LE, Keifer P, Saarinen T (1992) Pure absorption gradient enhanced heteronuclearsingle quantum correlation spectroscopy with improved sensitivity. J Am Chem Soc114:10663–10665.
13. Baldwin AJ, Kay LE (2012) Measurement of the signs of methyl 13C chemical shiftdifferences between interconverting ground and excited protein states by R(1ρ): Anapplication to αB-crystallin. J Biomol NMR 53(1):1–12.
14. McConnell HM (1958) Reaction rates by nuclear magnetic resonance. J Chem Phys28(3):430–431.
15. Helgstrand M, Härd T, Allard P (2000) Simulations of NMR pulse sequences duringequilibrium and non-equilibrium chemical exchange. J Biomol NMR 18(1):49–63.
16. Fawzi NL, Ying J, Torchia DA, Clore GM (2012) Probing exchange kinetics and atomicresolution dynamics in high-molecular-weight complexes using dark-state exchangesaturation transfer NMR spectroscopy. Nat Protoc 7(8):1523–1533.
17. Palmer AG, 3rd, Kroenke CD, Loria JP (2001) Nuclear magnetic resonance methodsfor quantifying microsecond-to-millisecond motions in biological macromolecules.Methods Enzymol 339:204–238.
18. Skrynnikov NR, Dahlquist FW, Kay LE (2002) Reconstructing NMR spectra of“invisible” excited protein states using HSQC and HMQC experiments. J Am Chem Soc124(41):12352–12360.
19. Loria JP, Rance M, Palmer AG (1999) A relaxation-compensated Carr-Purcell-Meiboom-Gill sequence for characterizing chemical exchange by NMR spectroscopy.J Am Chem Soc 121:2331–2332.
20. Cantor CR, Schimmel PR (1980) The Behavior of Biological Macromolecules, Part III(Freeman, San Francisco).
Libich et al. www.pnas.org/cgi/content/short/1305715110 8 of 13

0
0.1
0.2
0.3
0.4
residue
15N
-R2
(s-1
)co
rr.
100 20 30 40
900 MHz600 MHz
1 10 20 30 40HHHPHHHPHHHXP H
Fig. S1. Chemical exchange line-broadening correction factors used for the 15N-ΔR2 data. The15N-ΔR2 measurements were carried out at a CPMG field of 550
Hz. At this field strength, there is minimal chemical exchange-induced line-broadening in the presence of GroEL. The correction (corr.) factors plotted are thecontributions from chemical exchange line-broadening at a CPMG field of 550 Hz in the presence of 20 μM GroEL derived from fitting the 15N relaxationdispersion measurements (SI Materials and Methods). The contribution of exchange line-broadening to ΔR2 is negligible compared with the lifetime line-broadening effect (up to ∼25 s−1) arising from the very large R2 values when Aβ40 is bound to GroEL, leading to very rapid decay of magnetization of Aβ40resonances in the bound state. The fact that exchange line-broadening is negligible compared with lifetime line-broadening is further evidenced by theobservation that ΔR2 is completely uncorrelated to the small but observable chemical exchange-induced 15N shifts in the presence of GroEL (Fig. 2E).
Libich et al. www.pnas.org/cgi/content/short/1305715110 9 of 13

25
20
15
10
5
02520151050
15N-ΔR2,calc (s-1)600
15N
-ΔR
2,ob
s (s
-1)
600
A40 μM GroEL20 μM GroEL
25
20
15
10
5
02520151050
15N
-ΔR
2,ob
s (s
-1)
900
15N-ΔR2,obs (s-1)600
B40 μM GroEL20 μM GroEL
slope = 1.3corr. coeff. = 0.98
C
slope = 2.0corr. coeff = 0.96
600 MHz 900 MHz
[GroEL] (μM)
0
2
4
6
8
<ΔR
2
> (
s-1)
0 10 20 30 40
900
D
252015105020 μM GroEL 15N-ΔR2 (s
-1)
25
20
15
10
5
0
40 μ
M G
roE
L15
N-Δ
R2 (s
-1)
1 HN-Δ
R2,
obs
(s-1
)
100 20 30 40residue
A VVVMLIIAVAFFVLVYF1 10 20 30 40HHHPHHHPHHHXP HE F
15
20
25
30
40
0
10
35
5
40 μM GroEL20 μM GroEL
25
20
15
10
5
02520151050 30 35 40
30
35
40
slope = 1.6corr. coeff. = 0.93
15N-ΔR2,obs (s-1)600
1 HN-Δ
R2,
obs (s
-1)
600
40 μM GroEL20 μM GroEL
600
Fig. S2. ΔR2 measurements. ΔR2 is given by the difference in R2 for Aβ40 in the presence and absence of GroEL. (A) Correlation between observed (obs) andcalculated (calc) 15N-ΔR2 values at a spectrometer frequency of 600 MHz. (B) Correlation between observed 15N-ΔR2 values at spectrometer frequencies of 900and 600 MHz. corr. coeff., correlation coefficient. (C) Correlation between observed 15N-ΔR2 values in the presence of 20 and 40 μMGroEL. (D) Average 15N-ΔR2
as a function of GroEL concentration at a spectrometer frequency of 900 MHz. (E) 1HN-ΔR2 values at 600 MHz in the presence of 20 (blue) and 40 (red) μMGroEL. (F) Correlation between 1HN-ΔR2 and 15N-ΔR2 values. Error bars = 1 SD.
Libich et al. www.pnas.org/cgi/content/short/1305715110 10 of 13

4
0
2
-2
-0.4
0.0
0.4
-0.8
-1.0
1.0
-1.0
0.0
1.0
-0.4
-0.2
0.0
1 HN
-Δδ
(pp
m)R
C
13C
α-Δδ
(pp
m) R
C
13C
β-Δδ
(pp
m) R
C
1 Hα-
Δδ (
ppm
) RC
0.0
15N
-Δδ
(pp
m)R
C
1 10 20 30 40HHHPHHHPHHHXP H
1 10 20 30 40Residue
Fig. S3. Deviations (ΔδRC) of 15N, 1HN,13Cα, 13Cβ and 1Hα chemical shifts of free Aβ40 (50 μM and 5 °C) from random coils. The random coil (RC) shifts are those
recently published by Kjaergaard and Poulsen (1) that incorporate neighbor correction factors, and the deviations from random coil shifts were calculatedusing the Web server http://spin.niddk.nih.gov/bax/nmrserver/Poulsen_rc_CS. The bars for the terminal residues 1 and 40 that are shaded as the larger devi-ations from random coil shifts are due to end effects.
1.2
1.0
0.8
0.6
0.4
0.2
00 161284
A
Nor
mal
ized
inte
nsity
time (days)
20 μM GroEL
+ 50 μM 15N Aβ40
50 μM 15N Aβ40
15N-R2 (s-1)0 days
2018161412108642
18
16
14
12
10
8
6
4
2
15N
-R2
(s-1
)17
day
s
slope = 0.96corr. coeff. = 0.98
C
slope = 0.96corr. coeff. = 0.98
15N-R2 (s-1)0 days
2018161412108642
18
16
14
12
10
8
6
4
2
15N
-R2
(s-1
)11
day
s
B20 20
Fig. S4. Stability of Aβ40 samples in the presence of GroEL. (A) Average normalized 1HN-15N cross-peak intensity as a function of time. There is a very small
decrease in intensity (<5%) in the first 2 d; thereafter, the sample remains stable. Correlation of measured 15N-R2 values at time 0 with the correspondingvalues measured after 11 (B) and 17 (C) d, respectively, at a spectrometer frequency of 600 MHz in the presence of 20 μM GroEL. Error bars = 1 SD.
1. Kjaergaard M, Poulsen FM (2011) Sequence correction of random coil chemical shifts: Correlation between neighbor correction factors and changes in the Ramachandran distribution. JBiomol NMR 50(2):157–165.
Libich et al. www.pnas.org/cgi/content/short/1305715110 11 of 13

0
0.5
1.0
1.5
2.0
2.5
residue
15N
-R1
(s-1
)60
0
100 20 30 40
20 μM GroEL + 50 μM 15N Aβ4050 μM 15N Aβ40
1 10 20 30 40HHHPHHHPHHHXP H
Fig. S5. 15N-R1 in the presence (blue) and absence (red) of GroEL.
A
12
8
4
012840
10
6
2
2 6 10
15N
-ΔR
2
(
s-1)
CP
MG
15N-ΔR2 (s-1)in-phase
14
14
slope = 1.11corr. coeff. = 0.97
B
600400200015N-R2 (s
-1)bound, in-phase
600
400
200
0
15N
-R2
(s-1
)bo
und,
CP
MG
800
800
slope = 1.12corr. coeff. = 0.97
C
600
400
200
0
800
6004002000 800
slope = 1.32corr. coeff. = 0.99
15N
-R2,
900
(s
-1)
boun
d,in
-pha
se
15N-R2,600 (s-1)
bound,in-phase
900 MHz 900 MHz
Fig. S6. Correlation between R2 values measured from CPMG (average of in-phase and antiphase R2) and R1ρ (in-phase). Correlation between measured 15N-ΔRCPMG
2 and ΔRin‐phase2 values at 900 MHz (A), calculated RCPMG; bound
2 and Rin‐phase; bound2 values at 900 MHz (B), and calculated Rin‐phase; bound
2 values at 900 and 600MHz (C).
Libich et al. www.pnas.org/cgi/content/short/1305715110 12 of 13
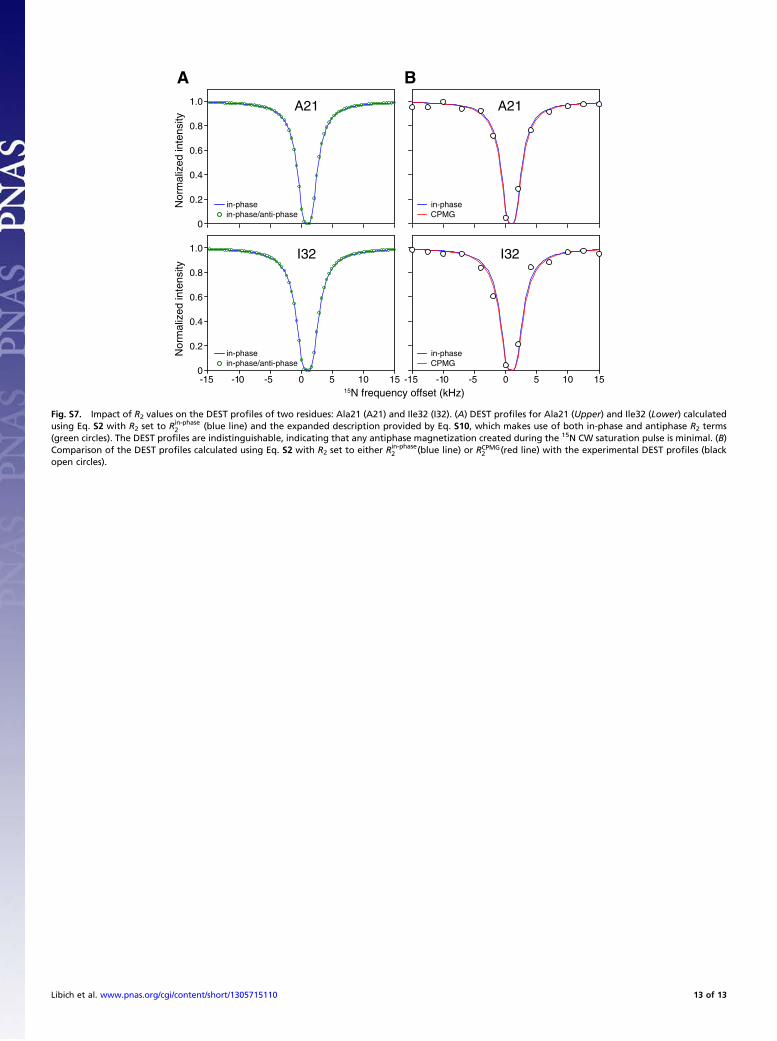
15N frequency offset (kHz)
Nor
mal
ized
inte
nsity
0
A
0
Nor
mal
ized
inte
nsity
A21
I32
A21
I32
B
0-10-15 155 10-5 0-10-15 155 10-5
0.4
0.6
0.8
1.0
0.2
0.4
0.6
0.8
1.0
0.2
in-phaseCPMG
in-phasein-phase/anti-phase
in-phasein-phase/anti-phase
in-phaseCPMG
Fig. S7. Impact of R2 values on the DEST profiles of two residues: Ala21 (A21) and Ile32 (I32). (A) DEST profiles for Ala21 (Upper) and Ile32 (Lower) calculatedusing Eq. S2 with R2 set to Rin‐phase
2 (blue line) and the expanded description provided by Eq. S10, which makes use of both in-phase and antiphase R2 terms(green circles). The DEST profiles are indistinguishable, indicating that any antiphase magnetization created during the 15N CW saturation pulse is minimal. (B)Comparison of the DEST profiles calculated using Eq. S2 with R2 set to either Rin‐phase
2 (blue line) or RCPMG2 (red line) with the experimental DEST profiles (black
open circles).
Libich et al. www.pnas.org/cgi/content/short/1305715110 13 of 13