problem gambling intervention services in new …...problem gambling intervention services in new...
TRANSCRIPT
Problem Gambling Intervention Services in New Zealand 2005 Service-user statistics

The authors in this report were Miranda Devlin (Advisor, Statistics), Karen Blakey (Advisor, Epidemiology) and Jason Landon (Senior Advisor, Problem Gambling).
Citation: Ministry of Health. 2006. Problem Gambling Intervention Services in New Zealand: 2005 Service-user statistics. Wellington: Ministry of Health.
Published in September 2006 by the Ministry of Health
PO Box 5013, Wellington, New Zealand
ISBN 0-478-30056-5 (Book) ISBN 0-478-30059-X (Website)
HP 4305
This document is available on the Ministry of Health’s website: http://www.moh.govt.nz
–

Problem Gambling Intervention Services in New Zealand iii
Foreword Gambling-related harm is a social and health issue. The determinants and impacts of gambling harm, and the continuum of interventions required to minimise and prevent gambling harm, are complex. The Strategic Plan for Preventing and Minimising Gambling Harm 2004–2010 (Ministry of Health 2005) gives the development of a programme of research and evaluation as one of its objectives. Routine data collection and analyses of service utilisation information are fundamental components of the research agenda. Public Health Intelligence monitors the Ministry of Health’s problem gambling research programme, which includes monitoring the prevalence of problem gambling and problem gambling intervention service use in New Zealand. The present report presents critically important information on the use of Gambling Helpline Ltd and face-to-face counselling services for problem gambling in New Zealand in 2005. This routine monitoring information contributes to an understanding of problem gambling and its associated health inequalities in the New Zealand context. Comments on the report are welcome and should be sent to Public Health Intelligence, Public Health Directorate, Ministry of Health, PO Box 5013, Wellington. Dr Barry Borman Dr Janice Wilson Manager Deputy Director General Public Health Intelligence Mental Health Directorate

iv Problem Gambling Intervention Services in New Zealand
Acknowledgements We would like to thank Grant Paton-Simpson and Gambling Helpline Ltd, who developed and maintain the problem gambling information systems and provide analysis of the data from the intervention services. We are also grateful to the service providers around the country who continue to collect and enter data into the problem gambling information system. John Hannifin and Margaret Gruys of the Problem Gambling Purchasing Agency (which provided purchasing and planning services to the Problem Gambling Committee) developed the problem gambling information system1 and ensured a long-term commitment to its ongoing development. The authors gratefully acknowledge input from the peer reviewers: Krista Ferguson,
1 Gambling Helpline Ltd maintains a separate database and contributes statistics from that database to
this publication (see Appendix 1).
Dr Grant Paton-Simpson, Kylie Mason and Vicki Berkahn.

Problem Gambling Intervention Services in New Zealand v
Contents
Foreword iii
Executive Summary ix Gambling Helpline Ltd ix Face-to-face counselling services x Measurement of client progress x
Introduction 1 Intervention services framework for problem gambling 1 Service delivery contributing to national statistics 2
Gambling Helpline Ltd Services 5 Helpline trends in services 6 Helpline client characteristics 9
Face-to-Face Counselling Services 22 Face-to-face counselling trends in services 22 Client characteristics of face-to-face intervention services 25 Measurement of client progress 40
References 61
Appendix 1: Gambling Helpline Ltd 62 Data 62 Definitions 63
Appendix 2: Face-to-face Intervention Services 65 Data 65 Definitions 65 Mental Health Directorate (Ministry of Health) problem gambling intervention service contracts 67
List of Tables Table 1: Gambling Helpline Ltd: new clients, by type, 1998–2005 7 Table 2: Gambling Helpline Ltd: number of client contacts, new and follow-up, 1998–2005 7 Table 3: Gambling Helpline Ltd: number of all clients, by frequency of contact, 2005 7 Table 4: Gambling Helpline Ltd: website statistics, 2004–2005 8 Table 5: Gambling Helpline Ltd: primary mode of problem gambling for gamblers, new clients,
1999–2005 11 Table 6: Gambling Helpline Ltd, primary mode of problem gambling cited by significant others,
new clients, 1999–2005 12

vi Problem Gambling Intervention Services in New Zealand
Table 7: Gambling Helpline Ltd: origin of contacts, all new clients, by region, 1995–2005 14 Table 8: Gambling Helpline Ltd: number and type of new clients, 1998–2005 15 Table 9: Gambling Helpline Ltd: ethnicity of gamblers, new clients, 1999–2005 18 Table 10: Gambling Helpline Ltd: suicidal behaviour of all new clients, 1999–2005 21 Table 11: Face-to-face intervention services: total clients, by type, 1997–2005 23 Table 12: Face-to-face intervention services: episode duration, all clients, 2002–2005 24 Table 13: Face-to-face intervention services: primary mode of problem gambling for gamblers,
new clients, 1997–2005 26 Table 14: Face-to-face intervention services: additional mode of problem gambling for gamblers,
new clients, 1997–2005 27 Table 15: Face-to-face intervention services: primary and additional modes of problem gambling
for gamblers combined, new clients, 2005 27 Table 16: Face-to-face intervention services: primary mode of problem gambling for gamblers,
all clients, 2005 28 Table 17: Face-to-face intervention services: main geographic location (clinic location), new
clients, 1999–2005 29 Table 18: Face-to-face intervention services: client composition, new clients, 2005 30 Table 19: Face-to-face intervention services: primary mode of problem gambling for gamblers,
new clients, by gender, 2005 32 Table 20: Face-to-face intervention services: primary mode of problem gambling for gamblers,
new clients, by age, 2005 35 Table 21: Face-to-face intervention services: ethnicity of gamblers, new clients, 1999–2005 36 Table 22: Face-to-face intervention services: primary mode of problem gambling, new clients, by
gender and ethnicity, 2005 39 Table 23: Face-to-face intervention services: gender and ethnicity of gambler outcome clients,
2005 41 Table 24: Face-to-face intervention services: SOGS-3M summary statistics for first
assessments, outcome clients, 1999–2005 43 Table 25: Face-to-face intervention services: SOGS-3M summary statistics for first
assessments, outcome clients, by gender, 2005 43 Table 26: Face-to-face intervention services: SOGS-3M summary statistics for first
assessments, outcome clients, by age group, 2005 44 Table 27: Face-to-face intervention services: SOGS-3M summary statistics for first
assessments, outcome clients, by ethnicity, 2005 44 Table 28: Face-to-face intervention services: SOGS-3M summary statistics for first
assessments, outcome clients, by primary gambling mode, 2005 45 Table 29: Face-to-face intervention services: distribution of dollars lost in four weeks before first
assessment, outcome clients, 1999–2005 46 Table 30: Face-to-face intervention services: summary statistics of dollars lost in four weeks
before first assessments, outcome clients, 1999–2005 46 Table 31: Face-to-face intervention services: summary statistics of dollars lost in four weeks
before first assessment, outcome clients, by gender, 2005 47 Table 32: Face-to-face intervention services: summary statistics of dollars lost in four weeks
before first assessment, outcome clients, by age group, 2005 48 Table 33: Face-to-face intervention services: summary statistics of dollars lost in four weeks
before first assessment, outcome clients, by ethnicity, 2005 49 Table 34: Face-to-face intervention services: summary statistics of dollars lost in four weeks
before first assessment, outcome clients, by primary mode of gambling, 2005 50 Table 35: Face-to-face intervention services: distribution of gambling control ratings at first
assessment, outcome clients, 1999–2005 51 Table 36: Face-to-face intervention services: change in SOGS-3M scores, outcome clients, 2005 52

Problem Gambling Intervention Services in New Zealand vii
Table 37: Face-to-face intervention services: change in dollars lost as a percentage of amount
reported lost at initial assessment, outcome clients, 2005 53
List of Figures Figure 1: Gambling Helpline Ltd: new clients, by type, 1998–2005 6 Figure 2: Gambling Helpline Ltd: information packs distributed to clients, 1999–2005 8 Figure 3: Gambling Helpline Ltd: primary mode of problem gambling for gamblers and
significant others, new clients, 2005 9 Figure 4: Gambling Helpline Ltd: primary mode of problem gambling for gamblers, new clients,
2005 10 Figure 5: Gambling Helpline Ltd: primary mode of problem gambling cited by significant others,
new clients, 2005 11 Figure 6: Gambling Helpline Ltd: additional mode of problem gambling for gamblers and
significant others, new clients, 2005 13 Figure 7: Gambling Helpline Ltd: origin of contacts, all new national clients, by region, 2005 14 Figure 8: Gambling Helpline Ltd: gamblers, new clients, by gender, 1999–2005 15 Figure 9: Gambling Helpline Ltd: significant others, new clients, by gender, 1999–2005 16 Figure 10: Gambling Helpline Ltd: age distribution of gamblers, new clients, 2005 16 Figure 11: Gambling Helpline Ltd: age distribution of significant others, new clients, 2005 17 Figure 12: Gambling Helpline Ltd: ethnicity of gamblers, new clients, 1999–2005 18 Figure 13: Gambling Helpline Ltd: ethnicity of significant others, new clients, 1999–2005 19 Figure 14: Gambling Helpline Ltd: suicidal behaviour of all new clients, 1999–2005 20 Figure 15: Face-to-face intervention services: total treatment duration, all clients and discharged
clients, 2005 24 Figure 16: Face-to-face intervention services: primary mode of problem gambling for gamblers,
new clients, 2005 25 Figure 17: Face-to-face intervention services: additional mode of problem gambling for gamblers,
new clients, 2005 26 Figure 18: Face-to-face intervention services: primary mode of problem gambling for gamblers,
all clients, 2005 28 Figure 19: Face-to-face intervention services: new clients, by main geographic location (clinic
location), 2005 29 Figure 20: Face-to-face intervention services: gamblers, new clients, by gender, 1997–2005 30 Figure 21: Face-to-face intervention services: significant others and interested others, new
clients, by gender, 1997–2005 31 Figure 22: Face-to-face intervention services: primary mode of problem gambling for gamblers,
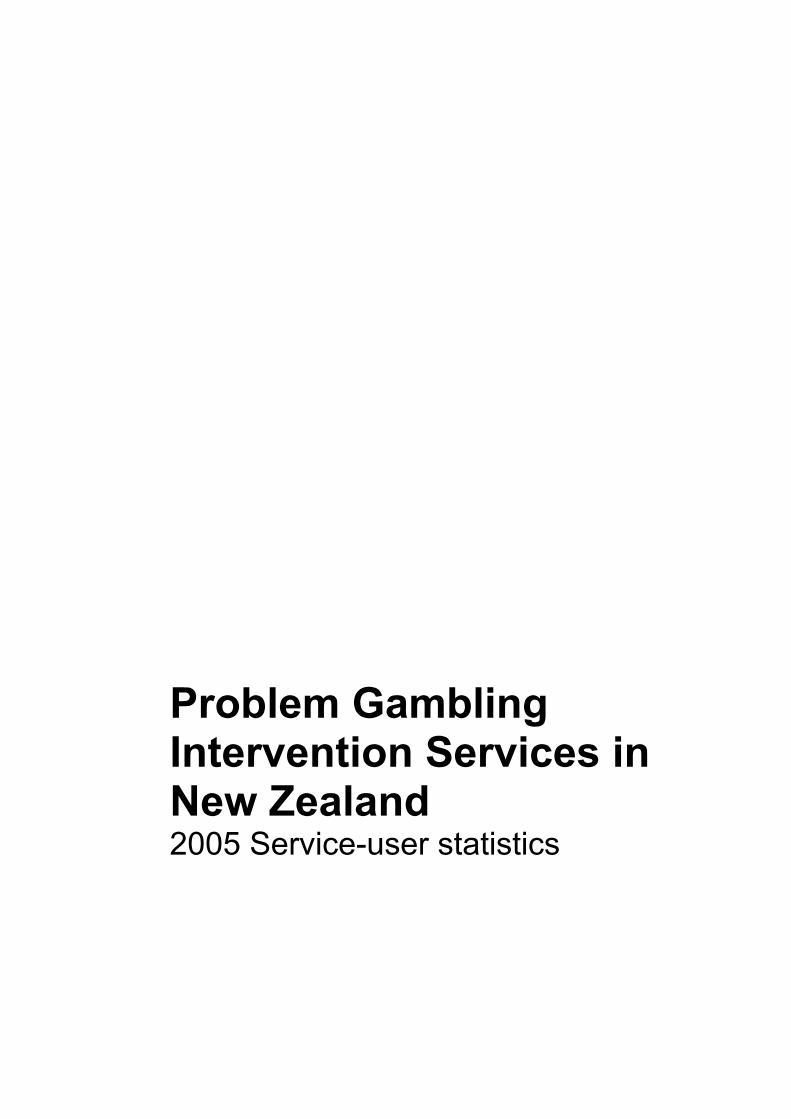
new clients, by gender, 2005 32 Figure 23: Face-to-face intervention services: age distribution of gamblers, new clients, 2005 33 Figure 24: Face-to-face intervention services: age distribution of significant others and interested
others, new clients, 2005 34 Figure 25: Face-to-face intervention services: ethnicity of gamblers, new clients, 1999–2005 36 Figure 26: Face-to-face intervention services: ethnicity of significant others and interested others,
new clients, 1999–2005 37 Figure 27: Face-to-face intervention services: primary mode of gambling for gamblers, new
clients, by ethnicity, 2005 38 Figure 28: Face-to-face intervention services: distribution of SOGS-3M scores at first
assessment, outcome clients, 2005 42 Figure 29: Face-to-face intervention services: distribution of dollars lost in four weeks before first
assessment, outcome clients, 2005 46

viii Problem Gambling Intervention Services in New Zealand
Figure 30: Face-to-face intervention services: dollars lost in four weeks before first assessment,
outcome clients, by gender, 2005 47 Figure 31: Face-to-face intervention services: dollars lost in four weeks before first assessment,
outcome clients, by ethnicity, 2005 49 Figure 32: Face-to-face intervention services: distribution of gambling control ratings at first
assessment, outcome clients, 1999–2005 51 Figure 33: Face-to-face intervention services: change in SOGS-3M scores, outcome clients,
2005 52 Figure 34: Face-to-face intervention services, SOGS-3M scores at initial assessment and follow
up, outcome clients 53 Figure 35: Face-to-face intervention services: change in dollars lost as a percentage of the
original loss, outcome clients, 2005 54 Figure 36: Face-to-face intervention services: change in control over gambling, by level of
control, outcome clients, 2005 55 Figure 37: Face-to-face intervention services: change in control over gambling, by rating,
outcome clients, 2005 55 Figure 38: Face-to-face intervention services: change in SOGS-3M score, outcome clients, by
degree of treatment completion, 2005 56 Figure 39: Face-to-face intervention services: change in dollars lost as proportion of original loss,
outcome clients, by degree of treatment completion, 2005 57 Figure 40: Face-to-face intervention services: change in sense of control, outcome clients, by
degree of treatment completion, 2005 57 Figure 41: Face-to-face intervention services: change in SOGS-3M scores, outcome clients, by
gender, 2005 58 Figure 42: Face-to-face intervention services: change in dollars lost as proportion of original loss,
outcome clients, by gender, 2005 59 Figure 43: Face-to-face intervention services: change in SOGS-3M scores, outcome clients, by
ethnicity, 2005 60 Figure 44: Face-to-face intervention services: change in dollars lost as proportion of original loss,
outcome clients, by ethnicity, 2005 60

Problem Gambling Intervention Services in New Zealand ix
Executive Summary This report presents and summarises the data collected by problem gambling service providers in 2005. It provides an overview of clients seeking help via the Gambling Helpline Ltd (the Helpline) and face-to-face outpatient counselling during that period. Ongoing publication of these data allows for the identification of changes over time in the characteristics of clients seeking help for gambling issues. An indication of client progress is presented based on data collection from face-to-face counselling services. The 2005 data show a substantial decrease in user numbers for both the national Helpline and the face-to-face services. Both of these showed a decrease in the proportion of New Zealand European/Pākehā gamblers to below 50% for the first time since the reporting of these figures began. Asian peoples were the only ethnic group to increase in absolute numbers and as a proportion of clients for both the Helpline and the face-to-face services. There was an over-representation of Māori clients compared to the percentage in the general population, although this proportion was consistent with the established prevalence of problem gambling in New Zealand (Ministry of Health 2006). As in previous years, non-casino gaming machines were the primary mode of problem gambling for the majority of people using services. In contrast to the reduced numbers of clients using the national services, the Auckland-based Asian Gambling Hotline had 263 new callers, an increase of 11% from 237 in 2004, although this increase was much reduced on the 2003/04 increase (64.5%). The majority of new callers (71.5%) were calling about their own gambling problems, and over three-quarters of these (77.1%) were male.
Gambling Helpline Ltd Casino-based gambling has increased as the primary mode of problem gambling from approximately 10% to 13.5%. Non-casino gaming machines decreased as the primary mode of problem gambling, while still remaining the primary mode for over three-quarters of new clients. Despite a decrease in overall numbers of new clients, there were increases over 2004 levels in both the percentages and absolute numbers of new clients who had planned, attempted or were assessed as currently at risk of suicide. Consistent with the reduction in new clients, there was a substantial reduction in the number of information packs that were distributed by the Helpline. However, usage of the Helpline’s website increased substantially, with 69.1% more visits per day, and 92.9% more different visitors per day in 2005.

x Problem Gambling Intervention Services in New Zealand
Face-to-face counselling services2
primary mode of problem gambling cited by clients (13.5% in 2004, 16.2% in 2005). Non-casino gaming machines decreased as the primary mode of problem gambling, while still remaining the primary mode for seven in ten new clients. Non-casino gaming machines increased as an additional mode of problem gambling for the first time since 1998 (10.9% in 2004, 13.7% in 2005). However, when primary and additional modes were combined there was a 6.6% drop in non-casino gaming machines from 2004 to 2005 cited as a primary or additional mode of gambling problems. Asian clients were more likely than other ethnic groups to cite casino tables as their primary mode of problem gambling. A substantial majority of Māori females (95.4%) cited electronic gaming machines (casino and non-casino combined) as the primary mode of their problem gambling.
Measurement of client progress The South Oaks Gambling Screen (SOGS) has been adapted to measure the client’s gambling behaviour in the three months prior to assessment (SOGS-3M). A score of 3 or greater indicates a client may be considered a problem gambler (Abbott and Volberg 1991). This was the case for 95% of new clients. Just over half (51.3%) of the new gambler clients scored 10 or greater. Clients in the 25–29 years age group had noticeably higher SOGS-3M scores at first assessment than other age groups, and Māori had higher SOGS-3M scores at first assessment than other ethnic groups. Females had higher SOGS-3M scores at first assessment than males. The median total dollars lost in the four weeks before first assessment in 2005 was higher than in previous years ($900). This may reflect a slight increase in both the $5,000–$9,999 and the $10,000 and over categories of both actual numbers and percentages of clients, despite a reduction in the number of clients assessed. The total reported losses dropped just below $4 million. However, when compared with the 30% decrease in people contributing to this total, the decline in total dollars lost in the four weeks before first assessment was much smaller, at less than 9%. Although contributing just 55.4% of the clients, males accounted for almost 70% of the dollars lost. Consistent with previous reports, Asian clients reported much higher losses than other ethnicities ($4,050 compared to an overall median of $900). Asian clients represented just 6% of clients contributing to these data, while accounting for 35.4% of reported losses.
2 The data are based on outpatient clients who access face-to-face counselling services. Inpatient data
are not included in this publication.
As is the case with the Helpline, casino-based gambling showed a slight increase as the

Problem Gambling Intervention Services in New Zealand xi
Over half (57.1%) of follow-up clients had substantial reductions in SOGS-3M scores (decreases of 6 or more) after counselling; a further 27.9% had smaller reductions. This was comparable with 87.3% of clients reporting they had lost less money in the four weeks prior to follow-up than in the four weeks prior to initial assessment (67.9% of these reported losing 80–100% less) and 70.5% of clients reporting an improvement in their sense of control. Using these outcome measures, approximately one in five follow-up clients were unchanged or experiencing more severe problem gambling. In terms of changes in SOGS-3M scores, 15% either scored higher or were unchanged. The percentage of clients that reported higher or unchanged dollars lost was 12.7%. The percentage of clients that reported an unchanged or reduction in sense of control over their gambling was 29.6%.

Problem Gambling Intervention Services in New Zealand 1
Introduction
presents national statistics for problem gambling services for the 2005 calendar year. This is the ninth national statistics report and the second to be published by Public Health Intelligence, Ministry of Health, since the Ministry of Health took responsibility for preventing and minimising gambling harm on 1 July 2004. This document contains data pertaining to the utilisation of services funded by the Ministry of Health’s Mental Health Directorate.3 The purpose of the national statistics is to provide objective and reliable data about people seeking assistance for their own or someone else’s problem gambling through specialist problem gambling treatment services. The annual report of national statistics has proven to be a unique and useful data set in the sector, and it continues to advance the collective knowledge base of gambling harm, including problem gambling. Over the 2005 year, the brief and early intervention category was developed. This category is not included in the statistics in this publication, however will be captured from 2006. For notes on corrections to Helpline data and definitions used throughout the report, see Appendix 1.
Intervention services framework for problem gambling For people with gambling problems and their significant others, a range of psychosocial interventions is needed. The aim of problem gambling intervention services is to support people affected by gambling problems to identify and manage those problems, thus minimising gambling-related harm to themselves and others. The interventions for problem gambling are similar to those used with other addictive behaviours, ranging from screening and early intervention approaches through to more specialist interventions for people with moderate to severe problems. The Ministry’s service framework includes service descriptions for general, dedicated Māori and dedicated Pacific problem gambling intervention services, including: • helpline and information services • peer support – significant other • brief and early interventions • short-course interventions (community setting)
3 Data presented in this report for years prior to 1 July 2004 pertain to services funded by the Problem
Gambling Committee (PGC), which was established in 1996 and was made up of equal numbers of gambling industry and service provider representatives. The PGC, which wound up as a trust in 2005,
was funded by negotiated contributions from the gambling industry. funded problem gambling counselling, helpline services and a number of public health programmes, and
Problem Gambling Intervention Services in New Zealand: 2005 Service-user statistics

2 Problem Gambling Intervention Services in New Zealand
• short-course interventions (residential setting) • community assessment and intervention services • community follow-up support service. The intervention services are aimed at increasing an individual’s ability to manage their gambling problems. They are available to people: • with gambling problems • with co-existing gambling problems and mental health (including substance use)
disorders • with co-occurring gambling and financial/social problems • at risk of developing pathological gambling problems • who have been affected by the gambling of a significant other. Dedicated Māori problem gambling intervention services provide a range of options that reflect the needs of whānau, hapū and other Māori communities. Dedicated Pacific services recognise that culture can be a vehicle for seeking and maintaining wellness. These services offer a holistically oriented framework for understanding people in their particular ethnic, social, cultural, spiritual, physical and economic contexts.
Service delivery contributing to national statistics
1. Telephone helpline services
Rationale The Helpline services provide a first point of contact for people experiencing some form of gambling-related harm, either directly or as a result of a significant other’s gambling. Such services also provide an avenue for aftercare for those who require ongoing support. Providers of telephone helpline services are: • Gambling Helpline (Gambling Helpline Ltd) • Asian Gambling Hotline (Problem Gambling Foundation of New Zealand).
Gambling Helpline Ltd (0800 654 655) Gambling Helpline Ltd is a national free telephone service for problem gamblers, their families/whānau and the general public seeking information about problem gambling. The national service provides direct information and access by phone or other electronic means (web or email) for screening, brief intervention, referral and follow-up services. The national Helpline also works with other organisations providing

Problem Gambling Intervention Services in New Zealand 3
psychosocial interventions and support through referrals and an integrated care programme.
• the main gambling Helpline every day of the year 0800 654 655 (Monday–Friday 8 am–10 pm, Saturday–Sunday 9 am–10 pm)
• Māori Gambling Helpline 0800 654 656 (Wednesday 5–9 pm, Saturday 8 am–12 noon)
• Pasifika Gambling Helpline 0800 654 657 (Tuesday 5–9 pm, Thursday 6–9 pm, Friday 12 noon–4 pm)
• Youth Gambling Helpline 0800 654 659 (Monday 5–8 pm) • gambling debt and budget counselling and programmes: Gambling Debt Helpline
0800 654 658 (Saturday 12 noon–4 pm) Clients can ring outside these hours in an emergency and they will be connected with
• problem gambling counselling and support • counsellors with specialist experience • problem gambling crisis support and intervention • gambling self-help tools and other written information on gambling • referrals to local face-to-face services (one-on-one or group sessions) and other
relevant agencies • regular phone calls to clients to provide ongoing support • in partnership with face-to-face counselling agencies, an integrated care programme
to help clients achieve long-term improvement of their gambling problems • an online web log where gamblers and others can share their stories
(www.gamblingproblem.co.nz/talkingpoint) • problem gambling background information and statistics for other health providers,
territorial authorities, researchers, students and the general public.
Asian Gambling Hotline (0800 862 342) The Problem Gambling Foundation of New Zealand provides an Asian Gambling Hotline4 which operates separately from the national Helpline. The Asian Gambling Hotline provides services to Asian clients nationally in Mandarin, Cantonese and Korean languages. In 2005, the Asian Gambling Hotline had 263 new callers, an increase of 11% from 237 in 2005, although this increase is much lower than that from 2003 to 2004 (64.5%). The majority of new callers (71.5%) were calling about their own gambling problems,
4 The Asian Gambling Hotline figures were collated from paper-based records. A computer database is
currently being developed.
The Helpline hours include:
help.
The Helpline offers:

4 Problem Gambling Intervention Services in New Zealand
and over three-quarters of these (77.1%) were male. This is a different proportion to that found in the national gambling Helpline, reported later. The remaining 28.5% were calling regarding the gambling problems of significant others, and nearly two-thirds of these (64%) were female. This proportion is much the same as that reported later for significant others calling the national gambling Helpline. The Asian Gambling Hotline figures are not included in the analysis that follows, so it is possible that the Asian figures in the Gambling Helpline could be under-reported. 2. Face-to-face intervention services
Rationale Strategies to limit problem gambling span the continuum of prevention, from population approaches to individual approaches for those personally affected by gambling harm. A range of intervention services is required for problem gamblers and their families, including assessments, short-course interventions and specialist services, a helpline (see above), and brief and early interventions in primary care settings.
Psychosocial intervention and support services Early identification and brief intervention to target social and health services in primary care settings provide an important overlap between primary prevention and intervention services, and potentially lessen the need for more intensive services. Secondary prevention activity may include information dissemination, screening, brief interventions and referral. Specialist intervention services will include assessment, a range of interventions, active case management, referrals, aftercare, and consultation and liaison. Dedicated problem gambling services are provided for Māori, Pacific and Asian service users, their families, whānau and significant others.
Providers There are two national providers of problem gambling services – the Problem Gambling Foundation of New Zealand (PGFNZ) and the Salvation Army’s Oasis Centre for Problem Gambling – as well as a number of regional or local providers, including providers of services for Māori and Pacific peoples. Asian services are provided by the Asian team of the PGFNZ. A full list of providers of psychosocial interventions and support services are given in Appendix 2.

Problem Gambling Intervention Services in New Zealand 5
Gambling Helpline Ltd Services Please note the Asian Gambling Hotline figures are not included in these analyses.
Summary: Gambling Helpline Ltd
• The Gambling Helpline had 2875 new clients in 2005. This represents a substantial (33.1%) decrease from the number of new clients in 2004.
• Underlying this overall decrease were substantial decreases in the numbers of new gambler clients (36.8%), new significant other clients (29.9%), and interested other clients (15.4%).
• The majority of new clients (76.5%) continued to cite non-casino gaming machines as the primary mode of problem gambling. Similar figures were obtained from new gambler clients (78.6%) and new significant other clients (72.5%). Overall, 86.1% of new clients cited electronic gaming machines (casino and non-casino) as the primary mode of problem gambling.
• Contacts were received from throughout New Zealand, with approximately one-third of contacts originating from the Auckland area (33.7%).
• Approximately half of new gambler clients were female (48.7%), while approximately three-quarters of new significant other clients were female (76.7%).
• The percentage of new gambler clients that were New Zealand European/Pākehā dropped below 50% for the first time (48.6%). The percentages of new gambler clients that were Māori (29.4%) and Pacific people (9.2%) remained relatively constant. The percentage of new gambler clients that were Asian rose to 8.1%, and this was the only ethnic group in which there was not a substantial decrease in the number of new gambler clients.
• The majority (74.5%) of new significant other clients were New Zealand European/ Pākehā.
• The majority (89%) of new clients reported no suicidal thoughts or behaviours. However, 11% of new clients did, and there were increases in both the percentage and absolute numbers of clients that had planned, attempted, or were assessed as currently at risk of committing suicide over the 2004 levels – despite the substantial decrease in the number of new clients.
• The distribution of information packs by the Helpline fell by 33.5% in 2005. However, usage of the Helpline’s website (http://www.gamblingproblem.co.nz) increased substantially, with 69.1% more visits per day, and 92.9% more different visitors per day in 2005.

6 Problem Gambling Intervention Services in New Zealand
Helpline trends in services
Number of clients accessing the Helpline In 2003 and 2004 small decreases were recorded in the numbers of new clients accessing the Helpline (Figure 1 and Table 1). In 2003, this was solely attributable to a substantial (-23.7%) drop in the number of new ‘interested other’ clients. In 2004, however, a small overall decrease (-5.2%) was the result of decreases in the number of new gambler clients (-5.4%) and significant other clients (-7.9%). Please note that data from previous years presented here may differ from previous reports (see Appendix 1 for details). In 2005, there were substantial drops in all categories of clients, resulting in an overall 33.1% decrease in the number of new clients. Specifically, the 2005 data show that there were: • 1748 new gambler clients, a decrease of 36.8% from the 2004 level (2768) • 814 new significant other clients, a decrease of 29.9% from the 2004 level (1162) • 313 interested other clients, a decrease of 15.4% from the 2004 level (370). Figure 1: Gambling Helpline Ltd: new clients, by type, 1998–2005
0
500
1000
1500
2000
2500
3000
3500
1998* 1999 2000 2001 2002 2003 2004 2005
Year
GamblerSignificant otherInterested other
Number of clients
* Note: 1998 figures have not been updated as figures predate the electronic database.

Problem Gambling Intervention Services in New Zealand 7
Table 1: Gambling Helpline Ltd: new clients, by type, 1998–2005
1998 1999 2000 2001 2002 2003 2004 2005 Type
N N % change
N % change
N % change
N % change
N % change
N % change
N % change
Gambler 1552 2069 +33.3 2193 +6.0 2307 +5.2 2906 +26.0 2926 +0.7 2768 -5.4 1748 -36.8 Significant other
868 1067 +22.9 1166 +9.3 1096 -6.0 1228 +12.0 1261 +2.7 1162 -7.9 814 -29.9
Interested other
208 257 +23.6 236 -8.2 332 +40.7 460 +38.6 351 -23.7 370 +5.4 313 -15.4
Total 2628 3393 +29.1 3595 +6.0 3735 +3.9 4594 +23.0 4538 -1.2 4300 -5.2 2875 -33.1
Table 2: Gambling Helpline Ltd: number of client contacts, new and follow-up, 1998–2005
1998 1999 2000 2001 2002 2003 2004 2005 Contact
N N % change
N % change
N % change
N % change
N % change
N % change
N % change
New contacts/ clients
2628 3393 +29.1 3595 +6.0 3735 +3.9 4594 +23.0 4538 -1.2 4300 -5.2 2875 -33.1
Follow-up contacts
5133 7634 +48.7 10,562 +38.4 9799 -7.2 14,565 +48.6 15,927 +9.4 17,108 +7.4 15,497 -9.4
Total 7761 11,027 +42.1 14,157 +28.4 13,534 -4.4 19,159 +41.6 20,465 +6.8 21,408 +4.6 18,372 -14.2
Trends in total contact numbers Consistent with the drop in the numbers of new clients, there was an overall drop in the total number of contacts5 to the Helpline. In 2005, a total of 18,372 contacts were received (Table 2), a decrease of 14.2% below 2004 levels. This overall decrease resulted from a 33.1% decrease in the number of new clients, and a 9.4% decrease in the number of follow-up contacts. Table 3: Gambling Helpline Ltd: number of all clients, by frequency of contact, 2005
Gambler Significant other / interested other Total Frequency of contact
N % N % N %
1 call only 1406 40.9 1053 70.1 2459 49.8 2–4 contacts 1483 43.2 376 25.0 1859 37.6 5–9 contacts 438 12.8 70 4.7 508 10.3 10+ contacts 108 3.1 4 0.3 112 2.3
Total 3435 1503 4938
Consistent with previous years, in 2005 the majority of both categories of new clients to the Helpline made between one and four contacts (Table 3). However, as has been the case previously, there were differences in the numbers of contacts made by new gambler clients and new significant other / interested other clients. The majority of significant other / interested other clients (70.1%) made just one call to the Helpline, although the percentage of these clients making two or more contacts has risen to 30%. The majority (59.1%) of new gambler clients in 2005 made two or more contacts.
5 Contacts include phone calls and emails where an update is made to the Helpline database.

8 Problem Gambling Intervention Services in New Zealand
Information packs distributed For the fourth successive year the number of information packs distributed by the Helpline decreased. In 2005, 1557 information packs were distributed, a drop of 33.5% from the 2004 level (2342 packs) (Figure 2). This follows decreases of 18.9% in 2004 and 5.3% in 2003. Figure 2: Gambling Helpline Ltd: information packs distributed to clients, 1999–2005
2232
26742820
30512889
2342
1557
0
500
1000
1500
2000
2500
3000
3500
1999 2000 2001 2002 2003 2004 2005
Year
Number
Table 4: Gambling Helpline Ltd: website statistics, 2004–2005
Website statistic 2004 2005 Visits per visitor 2.98 2.62 Visitors per day 55.0 106.1 Visits per day 164.1 277.5 Talking Point* postings – 2171 Visits to home page 6095 10,849
Visitor email addresses 20,132 38,726 Total visits 60,077 101,290
* The Talking Point (http://www.gamblingproblem.co.nz/cgi-bin/talkingpoint/discus.cgi) is an online message board with postings from people directly experiencing problems related to gambling. It did not exist in 2004. It is a
large growth service use area.

Problem Gambling Intervention Services in New Zealand 9
The Helpline website (http://www.gamblingproblem.co.nz) has continued to experience rapid growth in its usage in all of the measures reported, with the sole exception of ‘visits per visitor’, which remained relatively constant (Table 4). The number of visits per day (277.5) increased by 69.1% over the 2004 level, which itself was an increase of 52% from 2003. The number of visitors per day (106.1) increased by 92.9% over the level recorded in 2004.
Helpline client characteristics
Primary mode of problem gambling Clients are asked to identify a mode of gambling that is causing them the most problems (the ‘primary’ mode of problem gambling). As has been the case in previous years, the majority of new clients (76.5%) cited non-casino gaming machines as their primary mode of problem gambling (Figure 3). This reflects a small drop from the figure of 82.4% recorded in 2004. Casinos (gaming machines and tables) have shown an increase as the primary mode of problem gambling from about 10% (10.3% in 2003, 10.8% in 2004) to 13.4%. This is the result of an increase in both casino gaming machines (9.6%) and casino tables (3.9%). The percentages of new clients citing track betting (6.3%) and sports betting (1.5%) both increased above their 2004 percentages (4.2% and 0.7% respectively). In a change from previous reports, the primary modes of problem gambling cited by new gambler clients and significant other clients have been analysed and presented separately here. Figure 3: Gambling Helpline Ltd: primary mode of problem gambling for gamblers and
significant others, new clients, 2005
Casino tables3.9%
Track betting6.3%
Sports betting1.5%
Non-casino gaming machines
76.5%
Casino gaming machines9.6%
Other and multiple2.2%

10 Problem Gambling Intervention Services in New Zealand
As has been the case since data reporting began, the majority of new gambler clients (78.6%) (Figure 4 and Table 5) and new significant other clients (72.5%) (Figure 5 and Table 6) cited non-casino gaming machines as their primary mode of problem gambling. However, both of these percentages dropped slightly below the 2004 levels; as noted earlier, the total number of new clients dropped substantially from the 2004 levels. When the primary modes of gambling are looked at individually, the numbers of new clients (gambler and significant others) citing non-casino gaming machines also dropped substantially (by 36.4% and 25.2% respectively). The decreases in other primary modes were smaller, and in many cases the very small numbers involved mean that no sound conclusions can be drawn. The second most commonly cited primary mode of gambling for both new gambler clients and significant other clients remained casino gaming machines. The percentage of new clients (gambler and significant others) citing casino gaming machines increased over 2004 levels (7.3% to 9.0% for gamblers, and 9.8% to 10.8% for significant others). These increases were underpinned by decreases in the absolute numbers of clients from the 2004 levels (16.8% and 8.8% respectively). These percentage decreases were much smaller than for non-casino gaming machines. Overall, 86.3% of new gambler and significant other clients cited gaming machines as their primary mode, a small decrease from 2004 (90.3%). Figure 4: Gambling Helpline Ltd: primary mode of problem gambling for gamblers, new
clients, 2005
Casino tables4.4%
Track betting5.2%
Sports betting1.1%
Non-casino gaming machines
78.6%
Casino gaming machines9.0%
Other and multiple1.6%

Problem Gambling Intervention Services in New Zealand 11
Table 5: Gambling Helpline Ltd: primary mode of problem gambling for gamblers, new clients, 1999–2005
1999 2000 2001 2002 2003 2004 2005 Gambling mode
N % N % N % N % N % N % N %
Non-casino gaming machines
1246 64.9 1391 73.4 1645 81.6 1818 80.5 1830 83.7 1563 83.2 994 78.6
Casino gaming machines
249 13.0 252 13.3 164 8.1 216 9.6 170 7.8 137 7.3 114 9.0
Casino tables 83 4.3 70 3.7 62 3.1 68 3.0 51 2.3 66 3.5 56 4.4Track betting 256 13.3 146 7.7 111 5.5 101 4.5 85 3.9 80 4.3 66 5.2Sports betting 15 0.8 8 0.4 8 0.4 20 0.9 23 1.1 9 0.5 14 1.1Lotto/Keno/ scratchies
19 1.0 9 0.5 12 0.6 7 0.3 11 0.5 6 0.3 8 0.7
Housie 11 0.6 3 0.2 4 0.2 4 0.2 3 0.1 1 0.1 3 0.2Internet 8 0.4 2 0.1 1 0.0 3 0.1 1 0.0 1 0.1 0.0Cards 16 0.8 7 0.4 8 0.4 5 0.2 3 0.1 5 0.3 2 0.2Other and multiple 18 0.9 8 0.4 2 0.1 16 0.7 10 0.5 10 0.5 7 0.6
Total 1921 1896 2017 2258 2187 1878 1264
Note: Percentages may not total to 100 due to rounding. Figure 5: Gambling Helpline Ltd: primary mode of problem gambling cited by significant
others, new clients, 2005
Casino tables2.6%
Track betting8.5%
Internet1.7%
Sports betting2.3%
Non-casino gaming machines
72.5%
Casino gaming machines10.8%
Other and multiple1.6%

12 Problem Gambling Intervention Services in New Zealand
Table 6: Gambling Helpline Ltd, primary mode of problem gambling cited by significant others, new clients, 1999–2005
1999 2000 2001 2002 2003 2004 2005 Gambling mode
N % N % N % N % N % N % N %
Non-casino gaming machines 454 58.8 533 62.1 594 70.5 618 73.5 664 79.9 556 80.0 416 72.5 Casino gaming machines 113 14.6 115 13.4 103 12.2 102 12.1 71 8.5 68 9.8 62 10.8 Casino tables 34 4.4 36 4.2 31 3.7 29 3.4 19 2.3 20 2.9 15 2.6 Track betting 130 16.8 141 16.4 86 10.2 58 6.9 49 5.9 29 4.2 49 8.5 Sports betting 5 0.6 7 0.8 10 1.2 13 1.5 9 1.1 10 1.4 13 2.3 Lotto/Keno/scratchies 11 1.4 2 0.2 2 0.2 0.0 3 0.4 2 0.3 1 0.2 Housie 3 0.4 2 0.2 3 0.4 2 0.2 1 0.1 1 0.1 0.0 Internet 0.0 0.0 2 0.2 6 0.7 5 0.6 2 0.3 10 1.7 Cards 5 0.6 2 0.2 4 0.5 0.0 1 0.1 1 0.1 1 0.2 Other and multiple 17 2.2 20 2.3 8 0.9 13 1.5 9 1.1 6 0.9 7 1.2
Total 772 858 843 841 831 695 574
Additional mode of problem gambling Compared to the primary mode, a much smaller set of secondary modes is cited by clients, so new gambler clients and new significant other clients are combined for analyses. When new clients cited a secondary mode of problem gambling, over half cited gaming machines (non-casino gaming machines 29.3%, and casino gaming machines 26.4%) (Figure 6). Track betting was cited by 17.3%, and other and multiple (8.1%), sports betting (7.1%), and casino tables (6.3%) were cited by reasonable percentages of clients. Lotto/Keno/scratchies (1.6%), cards (1.3%) and housie (2.6%) were each cited by small percentages. These data are reasonably comparable with those reported in 2004, although as expected some year-by-year variation is evident given the relatively small numbers involved.

Problem Gambling Intervention Services in New Zealand 13
Figure 6: Gambling Helpline Ltd: additional mode of problem gambling for gamblers and significant others, new clients, 2005
Cards1.3%
Housie2.6%
Lotto/Keno/scratchies1.6%
Track betting17.3%
Casino tables6.3%
Sports betting7.1%
Non-casino gaming machines
29.3%
Casino gaming machines26.4%
Other and multiple8.1%
Origin of contacts The Helpline received contacts from throughout New Zealand, as well as seven from overseas. The geographic distribution of these contacts remained very similar to that in previous years, despite the drop in call numbers evident in all regions (the two exceptions were Wanganui and the West Coast, where small increases in the numbers of contacts were recorded). As previously, one in three contacts originated from the Auckland area (33.7%) (Table 7). The other regions where more than 10% of contacts originated were Canterbury (12.2%) and Wellington (11.1%) (Table 7).

14 Problem Gambling Intervention Services in New Zealand
Figure 7: Gambling Helpline Ltd: origin of contacts, all new national clients, by region, 2005
Invercargill/Southland2.0%
Wanganui2.0%
Taranaki1.5%
Central North Island1.0%
West Coast/Upper South Island
3.7%Hawke's Bay/East Coast
3.4%
Northland3.2%
Dunedin/Otago3.8%
Auckland35.3%
Christchurch/Canterbury13.7%
Wellington/Wairarapa12.4%
Hamilton/Waikato7.1%
Bay of Plenty/Coromandel7.0%
Palmerston North/ Manawatu
3.9%
Note: Percentages may differ from table, due to region groupings and exclusion of not stated/unknown/other and overseas. Table 7: Gambling Helpline Ltd: origin of contacts, all new clients, by region, 1995–2005
1999 2000 2001 2002 2003 2004 2005 Region
N % N % N % N % N % N % N %
Northland 62 1.8 78 2.2 93 2.5 104 2.3 101 2.2 109 2.5 87 3.0 Auckland 1113 32.8 1223 34.0 1288 34.5 1626 35.4 1512 33.3 1433 33.3 970 33.7 Waikato 147 4.3 180 5.0 193 5.2 242 5.3 317 7.0 254 5.9 194 6.7 Coromandel/ Thames Valley
15 0.4 29 0.8 24 0.6 28 0.6 28 0.6 26 0.6 22 0.8
Bay of Plenty 188 5.5 186 5.2 211 5.6 247 5.4 285 6.3 285 6.6 171 5.9 Central North Island 47 1.4 56 1.6 31 0.8 41 0.9 38 0.8 28 0.7 28 1.0 Gisborne 6 0.2 24 0.7 25 0.7 31 0.7 42 0.9 37 0.9 23 0.8 Hawke’s Bay 110 3.2 154 4.3 161 4.3 155 3.4 125 2.8 95 2.2 69 2.4 Taranaki 90 2.7 62 1.7 68 1.8 74 1.6 89 2.0 84 2.0 41 1.4 Wanganui 46 1.4 43 1.2 53 1.4 49 1.1 45 1.0 51 1.2 54 1.9 Manawatu 155 4.6 146 4.1 146 3.9 155 3.4 141 3.1 148 3.4 108 3.8 Wairarapa 9 0.3 26 0.7 38 1.0 33 0.7 34 0.7 30 0.7 22 0.8 Wellington 398 11.7 435 12.1 388 10.4 525 11.4 573 12.6 491 11.4 318 11.1 Tasman 2 0.1 2 0.1 1 0.0 1 0.0 0 0.0 1 0.0 0 0.0 Nelson 71 2.1 66 1.8 67 1.8 73 1.6 68 1.5 98 2.3 69 2.4 Marlborough 32 0.9 31 0.9 38 1.0 47 1.0 29 0.6 25 0.6 10 0.3 West Coast 21 0.6 19 0.5 24 0.6 24 0.5 31 0.7 14 0.3 23 0.8 Canterbury 463 13.6 495 13.8 507 13.6 663 14.4 629 13.9 582 13.5 350 12.2 South Canterbury 74 2.2 63 1.8 48 1.3 65 1.4 55 1.2 68 1.6 27 0.9 Otago 200 5.9 146 4.1 162 4.3 170 3.7 160 3.5 171 4.0 103 3.6 Southland 84 2.5 104 2.9 91 2.4 140 3.0 118 2.6 110 2.6 55 1.9 Overseas 0 0.0 0 0.0 11 0.3 11 0.2 6 0.1 10 0.2 7 0.2 Not stated / unknown/ other
60 1.8 27 0.8 67 1.8 90 2.0 112 2.5 150 3.5 124 4.3
Total 3393 3595 3735 4594 4538 4300 2875
Note: Percentages may not total to 100 due to rounding.

Problem Gambling Intervention Services in New Zealand 15
Reasons for contacting the Helpline In 2005, the percentage of clients that were gamblers, significant others and interested others remained consistent with the percentages reported since 1998 (Table 8). When compared with 2004, there was a drop in the percentage of gambler clients (64.4% to 60.8%), and an increase in interested other clients (8.6% to 10.9%). Table 8: Gambling Helpline Ltd: number and type of new clients, 1998–2005
1998 1999 2000 2001 2002 2003 2004 2005 Type of client
N % N % N % N % N % N % N % N %
Gambler 1552 59.1 2069 61.0 2193 61.0 2307 61.8 2906 63.3 2926 64.5 2768 64.4 1748 60.8 Significant other 868 33.0 1067 31.4 1166 32.4 1096 29.3 1228 26.7 1261 27.8 1162 27.0 814 28.3 Interested other 208 7.9 257 7.6 236 6.6 332 8.9 460 10.0 351 7.7 370 8.6 313 10.9
Total 2628 3393 3595 3735 4594 4538 4300 2875
Gender: gamblers and significant others Since 2000, new gambler clients to the Helpline have been fairly evenly split between males and females (Figure 8). In 2005 this was the case again, with 831 new female gambler clients, and 875 new male gambler clients. These figures contrast with new significant other clients (Figure 9), where historically approximately three-quarters have been female. This was repeated in 2005, with 615 new female significant other clients and just 187 new male significant other clients. Figure 8: Gambling Helpline Ltd: gamblers, new clients, by gender, 1999–2005
56.8
52.050.3 49.3 48.8
50.6 51.3
43.2
48.049.7 50.7 51.2
49.4 48.7
0
10
20
30
40
50
60
70
1999 2000 2001 2002 2003 2004 2005
Year
MalesFemales
Percent

16 Problem Gambling Intervention Services in New Zealand
Figure 9: Gambling Helpline Ltd: significant others, new clients, by gender, 1999–2005
21.523.7
27.4 25.8 24.626.7
23.3
78.576.3
72.6 74.2 75.473.3
76.7
0
10
20
30
40
50
60
70
80
90
100
1999 2000 2001 2002 2003 2004 2005
Year
MalesFemales
Percent
Age distribution
Gamblers The age distribution of new gambler clients in 2005 was very similar to that evident in previous years. Over half (56.9%) of new gambler clients were under 40 years of age, and a substantial majority (82.5%) were under 50 years of age (Figure 10). Figure 10: Gambling Helpline Ltd: age distribution of gamblers, new clients, 2005
2.3
9.6
15.015.9
14.1 14.5
11.1
8.2
3.82.9 2.7
0
2
4
6
8
10
12
14
16
18
< 20 20–24 25–29 30–34 35–39 40–44 45–49 50–54 55–59 60–64 65+
Age group (years)
Percent

Problem Gambling Intervention Services in New Zealand 17
Significant others As with new gambler clients, the age distribution of new significant other clients reflected that evident in previous years. When compared with new gambler clients, new significant other clients were generally slightly older, with 45.7% aged under 40
Figure 11: Gambling Helpline Ltd: age distribution of significant others, new clients, 2005
1.4
6.1
9.6
13.914.7
11.8
10.811.4
8.4
4.1
7.8
0
2
4
6
8
10
12
14
16
< 20 20–24 25–29 30–34 35–39 40–44 45–49 50–54 55–59 60–64 65+
Age group (years)
Percent
Ethnicity
Gamblers There are two baselines against which this profile has been assessed: the ethnic profile of the general New Zealand population (Statistics New Zealand 2001), and the ethnic profile of problem gamblers identified in nationally representative studies of the prevalence of problem gambling (Abbott and Volberg 2000, Ministry of Health 2006). The latter comparison can be useful in assessing any relative successes or issues with help-seeking or treatment accessibility for particular ethnic groups. Comparisons with other data should be interpreted with caution due to different ethnicity classifications being used (see Appendix 1 for further details).
years, and 68.2% under 50 years of age (Figure 11). Compared with 2004, the 65 and has older age group has increased to 7.8% and the under 20 age group has dropped to 1.4%, but in both cases the actual numbers decreased.

18 Problem Gambling Intervention Services in New Zealand
Figure 12: Gambling Helpline Ltd: ethnicity of gamblers, new clients, 1999–2005
Table 9: Gambling Helpline Ltd: ethnicity of gamblers, new clients, 1999–2005
1999 2000 2001 2002 2003 2004 2005 Ethnicity
N % N % N % N % N % N % N %
New Zealand European/Pākehā
1182 64.4 1169 58.6 1162 58.0 1336 57.0 1097 53.1 866 50.5 578 48.6
Māori 419 22.8 543 27.2 546 27.3 636 27.1 591 28.6 506 29.5 349 29.4 Pacific peoples 85 4.6 122 6.1 128 6.4 180 7.7 194 9.4 161 9.4 109 9.2 Asian peoples 28 1.5 41 2.1 50 2.5 82 3.5 91 4.4 101 5.9 96 8.1 Other/multi 122 6.6 120 6.0 116 5.8 111 4.7 93 4.5 82 4.8 57 4.8
Total 1836 1995 2002 2345 2066 1716 1189
Note: Percentages may not total to 100 due to rounding. For the first time since reporting began, the percentage of new gambler clients that were New Zealand European/Pākehā dropped below 50% (Figure 12 and Table 9). This is also the case for the face-to-face clients, as reported later, and continues the gradual decline in the percentage of New Zealand European/Pākehā clients since 1999. The percentages of new gambler clients that were Māori (29.4%) and Pacific people (9.2%) remained at their 2004 levels. With the exception of Pacific clients, who are under-represented, these rates are consistent with the established prevalence of problem gambling among the major ethnic groups in the general population (Ministry of Health 2006). The percentage of new gambler clients that were Asian people continued to rise, and in 2005 reached 8.1% (from 5.9%).
0
10
20
30
40
50
60
70
NZ European/Pākehā NZ Māori Pacific peoples Asian peoples Other/multi
Ethnicity
1999 2000 2001 2002 2003 2004 2005
Percent

Problem Gambling Intervention Services in New Zealand 19
The absolute number of new gambler clients in each ethnic group fell substantially, with the notable exception of new Asian gambler clients, which has remained constant after considerable increases between 1999 and 2002. Asian peoples, Māori and Pacific peoples are over-represented as new gambler clients when compared with the general New Zealand population of the 2001 census (6%, 14% and 5% respectively), while New Zealand European/Pākehā new gambler clients are under-represented when compared with the census figures (74%). Ethnicity
Significant others
Figure 13: Gambling Helpline Ltd: ethnicity of significant others, new clients, 1999–2005
0
10
20
30
40
50
60
70
80
NZ European/Pākehā New Zealand Māori Pacific peoples Asian peoples Other/multi
Ethnicity
1999 2000 2001 2002 2003 2004 2005
Percent
Historically, the ethnicity of new significant other clients has differed substantially from that of new gambler clients. This continued to be the case in 2005. Consistent with the 2004 data, approximately three-quarters of new significant other clients were New Zealand European (74.5%) (Figure 13). The percentage of new significant other clients that were Māori dropped slightly to 12.1%, and the percentage of clients that were Asian people rose slightly to 5.4%. These percentages more closely reflect the
in the number of new significant other clients.
representation of ethnicities in New Zealand. In each ethnic group there were decreases

20 Problem Gambling Intervention Services in New Zealand
Suicidal behaviour: gamblers and significant others As has been the case in previous years, the substantial majority of new gambler and significant other clients (89%) reported no suicidal thoughts or behaviours,6 but this still means that 11.0% of clients did (Figure 14). The percentage of new clients that
this was a fall in the absolute number of clients (Table 10). In the other three categories, increases were evident in both the percentage and number of clients. •
(0.3%) in 2004. •
increase from 16 (0.4%) in 2004. • In 2005, 20 clients (0.7%) were assessed as being at current risk, an increase from
13 (0.3%) in 2004. While these numbers are small, and as such difficult to interpret with any certainty, the changes are particularly interesting in the context of the substantial overall drop in client numbers. Figure 14: Gambling Helpline Ltd: suicidal behaviour of all new clients, 1999–2005
0
1
2
3
4
5
6
7
8
9
10
Thought about suicide Planned suicide Attempted in past 12 months Currently at risk
Ethnicity
1999 2000 2001 2002 2003 2004 2005
Percent
Note: 1999 and 2000 figures have not been updated due to changes in the database and reflect figures as calculated at that period.
6 It is important to note that these are ‘snapshots’ of the status at one point in time for any one client.
For example, a client may attempt suicide five or six times during any particular year, but the date recorded in the database captures the latest episode only. Effectively this means that only one attempt during a particular year for this client is calculated in the statistics presented.
however, reported thinking about suicide rose from 7.2% in 2004 to 8.5% in 2005, note
In 2005, 32 clients (1.1%) reported planning suicide, an increase from 14 clients
In 2005, 20 clients (0.7%) reported attempting suicide in the last 12 months, an

Problem Gambling Intervention Services in New Zealand 21
Table 10: Gambling Helpline Ltd: suicidal behaviour of all new clients, 1999–2005
1999 2000 2001 2002 2003 2004 2005 Suicidal behaviour
N % N % N % N % N % N % N %
None reported 3015 87.7 3194 87.1 3401 91.1 4144 90.2 4143 91.3 3949 91.8 2559 89.0 Thought about suicide
303 8.8 340 9.3 234 6.3 368 8.0 328 7.2 308 7.2 244 8.5
Planned suicide 63 1.8 63 1.7 30 0.8 24 0.5 21 0.5 14 0.3 32 1.1 Attempted in the past 12 months
19 0.6 35 1.0 28 0.7 26 0.6 30 0.7 16 0.4 20 0.7
Currently at risk 39 1.1 35 1.0 42 1.1 32 0.7 16 0.4 13 0.3 20 0.7
Total 3439 3667 3735 4594 4538 4300 2875
Note: 1. 1999 and 2000 figures have not been updated due to changes in the database and reflect figures as calculated at that period. 2. Percentages may not total to 100 due to rounding.

22 Problem Gambling Intervention Services in New Zealand
Face-to-Face Counselling Services Over the 2005 year, the brief and early intervention category was developed. This category is not included in the statistics in this publication, however will be captured from 2006.
Summary: Face-to-face counselling
• There has been a decrease (7.1%) in non-casino gaming machines as the primary mode of problem gambling cited by new clients, but a slight increase in casino-based gambling (13.5% in 2004, 16.2% in 2005).
• Non-casino gaming machines have increased as an additional mode of problem gambling for the first time since 1998 (10.9% in 2004, 13.7% in 2005). However, when primary and additional modes were combined there was a 6.6% drop in non-casino gaming machines from 2004 to 2005.
• Auckland (28.7%) and Christchurch/Canterbury (18.1%) remained the areas with the largest numbers of new clients.
• The percentage of new female clients decreased for the first time since 1997, resulting in slightly more male clients than female clients.
• There was over-representation of both Māori and Pacific clients, although these proportions were consistent with the established prevalence of problem gambling in New Zealand (Ministry of Health 2006).
• The number of New Zealand European/Pākehā clients dropped below 50% for the first time since reporting began in 1999.
• Asian clients were more likely than other ethnic groups to cite casino tables as their primary mode of problem gambling.
• A substantial majority of Māori females (95.4%) cited electronic gaming machines as the primary mode of their problem gambling.
Face-to-face counselling trends in services
Number of clients A total of 40107 clients received face-to-face problem gambling counselling services in 2005 (Table 11). Just under 70% (2714) of these clients had not previously received any counselling for gambling problems. These ‘new’ clients were counted once they had their initial face-to-face appointment. Additional people contacted face-to-face problem gambling services on a one-off basis for information and advice, but did not continue to the stage of a face-to-face appointment and assessment. Data from these people are not included in this report. The total number of clients decreased by 15.8% from the 2004 levels, and the number of new clients decreased by 20.9%.
7 This figure excludes any clients who did not receive a face-to-face comprehensive assessment (eg,
clients regularly attending groups are excluded).

Problem Gambling Intervention Services in New Zealand 23
While much of the subsequent focus is on the ‘new’ clients for 2005, those that accessed face-to-face counselling services in 2005 included 812 ‘brought-forward’ clients (these clients commenced treatment in previous years), and 479 ‘repeat admission’ clients (clients that were previously discharged, but presented again for further treatment). In contrast to the number of new clients, the number of brought-forward clients increased slightly from the 2004 level (1.9%), and there was a smaller decrease in the repeat admission clients (-9.8%). This is the first time since 1997 there has been a drop in the total number of face-to-face clients. It is also the first time since 1997 there has been a drop in the number of new face-to-face clients. Table 11: Face-to-face intervention services: total clients, by type, 1997–2005
1997 1998 1999 2000 2001 2002 2003 2004 2005 Client type
N % N % N % N % N % N % N % N % N %
New clients 796 86.2 1347 74.3 1554 67.1 1937 78.8 2202 75.1 2478 72.0 3044 72.9 3431 72.1 2714 67.7 Brought-forward clients
126 13.7 448 24.7 684 29.5 400 16.3 566 19.3 634 18.4 685 16.4 797 16.7 812 20.2
Repeat admission clients
1 0.1 18 1 79 3.4 122 5 166 5.7 325 9.4 440 10.5 531 11.2 479 11.9
Episode started but face-to-face session later
5 0.1 5 0.1 2 0.0 5 0.1
Insufficient data 1
Total 923 1813 2317 2459 2934 3443 4174 4761 4010
Note: Percentages may not total to 100 due to rounding. Time spent in treatment The literature evaluating the effectiveness of problem-gambling interventions remains very limited. As a result, an optimal period of treatment for gambling problems against which the following data could be compared has not been established. It is also questionable whether an optimal period will be established given the diversity of both gambling problems and the people experiencing them. Duration of treatment episodes A treatment episode is the time span over which a client attends problem-gambling services, measured from the initial session to the last client contact. Previous reports have shown that the duration of these treatment episodes has been quite variable, although their distribution has been relatively invariant over time. Note that a client may return for another series of sessions at some later point and there may be multiple episodes over time. The 2005 data again followed this pattern. Their distribution was very similar to that evident in the 2004 data (Table 12), with most treatment episodes (85.4%) being less than six months in duration. Consistent with previous years, approximately one in five treatment episodes lasted just one day.

24 Problem Gambling Intervention Services in New Zealand
Table 12: Face-to-face intervention services: episode duration, all clients, 2002–2005
1 day 2 days – 1 week 1 week – 1 month 1 – 6 months 6 months – 1 year Over 1 year Year
N % N % N % N % N % N %
2002 525 18.3 131 4.6 732 25.5 1071 37.3 245 8.5 165 4.8 2003 751 21.5 104 3.0 878 25.1 1325 37.9 278 7.9 164 4.7 2004 920 22.2 115 2.8 999 24.1 1580 38.1 327 7.9 201 4.9 2005 673 19.2 118 3.4 832 23.7 1372 39.1 334 9.5 184 5.2
Note: Percentages may not total to 100 due to rounding. Hours of treatment received The data on treatment length, in terms of hours of treatment received, were similar to those seen in previous years. The substantial majority of clients (90.9%) received 1.25 hours or more in treatment (89.8% in 2004) (Figure 15). More than half of clients (58.8%) had between 1.25 and 9.75 hours of treatment in 2005 (62.3% in 2004). Figure 15: Face-to-face intervention services: total treatment duration, all clients and
discharged clients, 2005
0.2
8.9
26.9
31.9
17.1
15
0.3
10.7
30.631.7
15.7
11.1
0
5
10
15
20
25
30
35
Under 1 hour 1 hour 1.25–3 hours 3.25–9.75 hours 10–19.75 hours 20 hours and over
Total duration
All clientsDischarged clients
Percent
Notes: 1. ‘All clients’ refers to all clients in the system in 2005, which includes those discharged during 2005. Figure 15 presents the
proportions of this group as a whole and the subset of this (discharged clients) who received these levels of treatment duration. 2. Total duration includes both one-on-one face-to-face counselling as well as group counselling.

Problem Gambling Intervention Services in New Zealand 25
Client characteristics of face-to-face intervention services
Primary mode of problem gambling: new clients Every client accessing face-to-face problem gambling counselling services is asked to identify a mode of gambling that is causing them the most problems (the ‘primary’ mode of problem gambling). Almost all new gambler clients (96.1%) were able to identify a primary mode of problem gambling. As with previous years, one in five new gambler clients (21%) also identified an additional type of gambling that was harmful to them. The primary mode of harmful gambling cited by most new gambler clients remained non-casino gaming machines (72.4%) (Figure 16 and Table 13). The percentage fell slightly in 2005 (from 79.5% in 2004) for the first time since 1998. The second most frequently cited mode of harmful gambling remained casino gaming machines (8.9%), with a slight increase from 2004. Together, 81.3% of new gambler clients cited electronic gaming machines as their primary mode of harmful gambling, a slight decrease from the 2004 figure (88%). The next most frequently cited mode of harmful gambling was casino table games (7.3%). One in six new gambler clients (16.2%) cited
(13.5%). Figure 16: Face-to-face intervention services: primary mode of problem gambling for gamblers,
new clients, 2005 Lotto/Keno/scratchies
2.1%
Track betting5.1%
Casino tables7.3%
Sports betting1.2%
Non-casino gaming machines
72.4%Casino gaming machines
8.9%
Other gambling3.1%
casino-based gambling as their primary source of harm, an increase on the 2004 figures

26 Problem Gambling Intervention Services in New Zealand
Table 13: Face-to-face intervention services: primary mode of problem gambling for gamblers, new clients, 1997–2005
Gambling mode 1997 %
1998 %
1999 %
2000 %
2001 %
2002 %
2003 %
2004 %
2005 %
Non-casino gaming machines 56.9 56.1 60.9 68.7 71.7 75.1 76.8 79.5 72.4 Casino gaming machines 10.9 15.5 14.7 12.6 12.4 11.2 10.6 8.5 8.9 Casino tables 10.1 9.9 6.8 5.6 5.3 4.7 4.7 5.0 7.3 Track betting 18.4 15.3 14.7 10.3 8.1 6.7 4.3 4.2 5.1 Sports betting 0.8 0.8 0.9 0.4 0.5 0.6 0.9 0.9 1.2 Lotto/Keno/scratchies 0.2 0.4 0.2 0.8 0.4 0.6 0.7 0.6 2.1 Housie 0.2 0.1 0.4 0.2 0.5 0.3 0.3 0.1 0.5 Other 2.6 2.0 1.4 1.4 1.3 0.7 1.6 1.2 2.6
Number 625 1009 1119 1330 1497 1794 2048 2219 1798
Note: Percentages may not total to 100 due to rounding. Additional mode of problem gambling: new clients One in five clients that reported a primary mode of harmful gambling also identified an additional mode. The distribution of additional modes was more even than that for
problem gambling were casino gaming machines (31.8%) and Lotto/Keno/scratchies (21.4%) (Figure 17 and Table 14). These percentages showed decreases from 2004 (34.8% and 26.9% respectively). The percentage of clients who cited non-casino gaming machines as an additional mode was 13.7%. Track betting, which was at a low since 1997 in 2004, did not differ in 2005 (10.4%). Sports betting, while not a high percentage, is at its highest in 2005 (6.1%); and casino tables, which were over 12.7% in 1997, were at a low in 2005 of 4.8%. Figure 17: Face-to-face intervention services: additional mode of problem gambling for
gamblers, new clients, 2005
Sports betting6.1%
Other gambling9.2%
Lotto/Keno/scratchies21.4%
Housie2.5% Non-casino gaming
machines13.7%
Casino gaming machines31.8%
Casino tables4.8%
Track betting10.4%
primary modes, but as with previous years the most frequently cited additional modes of

Problem Gambling Intervention Services in New Zealand 27
Table 14: Face-to-face intervention services: additional mode of problem gambling for gamblers, new clients, 1997–2005
Gambling mode 1997 %
1998 %
1999 %
2000 %
2001 %
2002 %
2003 %
2004 %
2005 %
Non-casino gaming machines 24.0 25.8 22.4 19.0 17.6 18.8 11.9 10.9 13.7 Casino gaming machines 15.7 18.2 21.4 20.6 23.3 27.1 36.4 34.8 31.8 Casino tables 12.7 9.5 9.4 6.7 5.8 7.3 5.9 5.3 4.8 Track betting 20.5 29.5 23.9 24.4 16.6 17.1 12.8 10.1 10.4 Sports betting 3.5 5.5 5.1 4.4 4.5 4.1 4.1 4.6 6.1 Lotto/Keno/scratchies 10.0 5.8 7.7 12.9 23.1 18.8 20.6 26.9 21.4 Housie 3.9 2.1 1.1 3.8 2 3.8 1.8 2.8 2.5 Other or multiple 9.6 3.7 9 8.3 7 3.2 6.4 4.6 9.2
Number 229 380 468 505 601 468 437 457 393
Note: Percentages may not total to 100 due to rounding. Primary and additional mode combined: new clients Combining the primary and additional mode totals for each gambling type gives an indication of the number of clients experiencing problems with each mode of gambling. However, the fact that multiple modes can be cited means that the data cannot simply be summed across modes. In modes cited as harmful by more than 100 clients, the notable changes include a 25% drop in the number of clients citing non-casino gaming machines as a primary or secondary mode, an 18% drop in those citing casino gaming machines, and a 13% increase in the number of clients citing casino tables. The percentages of clients citing each mode increased, with the sole exception of non-casino gaming machines (Table 15). Table 15: Face-to-face intervention services: primary and additional modes of problem
gambling for gamblers combined, new clients, 2005
Primary mode N
Additional mode N
Either primary or additional mode,
total N
% of new gambler clients
Gambling mode
2004 2005 2004 2005 2004 2005 2004 2005
Non-casino gaming machines 1765 1301 50 54 1815 1355 81.8 75.2 Casino gaming machines 189 160 159 125 348 285 15.7 15.8 Casino tables 110 132 24 19 134 151 6.0 8.4 Track 93 91 46 41 139 132 6.3 7.3 Sports betting 20 22 21 24 41 46 1.8 2.6 Lotto/Keno/scratchies 13 37 123 84 136 121 6.1 6.7 Housie 3 9 13 10 16 19 0.7 1.1 Other gambling 26 46 21 36 47 82 2.1 4.5
Note: It is inappropriate to add the ‘total N’ or ‘% of new gambler clients’ columns due to multiple responses.

28 Problem Gambling Intervention Services in New Zealand
Primary mode of problem gambling: all clients The pattern of primary modes of harmful gambling for all gambler clients mirrored closely that for new gambler clients only (Figure 18 and Table 16). This is not surprising, as the majority of the clients (just under 70%) are classified as new gambler clients. Figure 18: Face-to-face intervention services: primary mode of problem gambling for gamblers,
all clients, 2005
Sports betting1.3%
Other gambling2.5%
Lotto/Keno/scratchies1.5%
Non-casino gaming machines
73.7%
Casino gaming machines9.2%
Casino tables6.4%
Track betting5.3%
Table 16: Face-to-face intervention services: primary mode of problem gambling for gamblers,
all clients, 2005
Gambling mode 1997 %
1998 %
1999 %
2000 %
2001 %
2002 %
2003 %
2004 %
2005 %
Non-casino gaming machines 56.8 56.4 59.7 66.2 70.2 73.5 76.4 78.2 73.7 Casino gaming machines 9.7 14.9 15.9 13.2 12.8 11.6 11.2 9.3 9.2 Casino tables 10.6 9.1 7 5.8 5.1 4.8 4.2 4.6 6.4 Track betting 19.5 16.1 14.5 11.8 9.4 7.6 5.1 5.0 5.3 Sports betting 0.7 0.8 0.9 0.5 0.3 0.8 0.9 1.0 1.3 Lotto/Keno/scratchies 0.1 0.4 0.2 0.7 0.3 0.6 0.7 0.6 1.5 Housie 0.1 0.1 0.3 0.2 0.3 0.3 0.3 0.2 0.4 Other 2.4 2.3 1.5 1.6 1.5 0.7 1.2 1.2 2.1
Number 699 1196 1272 1688 2045 2546 2989 3268 2818
Note: Percentages may not total to 100 due to rounding. Geographic spread of client access to services: new clients Auckland (28.7%) and Christchurch/Canterbury (18.1%) remained the areas with the largest numbers of new clients (Figure 19 and Table 17). However, these percentages dropped slightly below their 2004 levels (30.5% and 20.7%, respectively). The overall geographic distribution of clients remained quite similar to that seen in 2004, despite the overall decrease in the number of new clients. Several areas moved against that trend and recorded higher numbers of new clients in 2005, specifically, Dunedin / Otago, Wanganui, and Invercargill / Southland. Some other areas recorded minimal or

Problem Gambling Intervention Services in New Zealand 29
small changes in the numbers of new clients, including Hamilton / Waikato, Hawke’s Bay / East Coast, Whangarei / Northland, and Palmerston North / Manawatu. Figure 19: Face-to-face intervention services: new clients, by main geographic location (clinic
location), 2005
Invercargill/Southland1.7%
Wanganui1.9%
Taranaki0.8% Central North Island
1.5%
West Coast/Upper South Island
3.1%
Hawke's Bay/East Coast6.3%
Whangarei/Northland4.5%
Dunedin/Otago4.8%
Auckland28.7%
Christchurch/Canterbury18.1%
Wellington12.8%
Hamilton/Waikato9.5%
Bay of Plenty3.4%
Palmerson North/ Manawatu
2.7%
Table 17: Face-to-face intervention services: main geographic location (clinic location), new
clients, 1999–2005
1999 2000 2001 2002 2003 2004 2005 Region
N % N % N % N % N % N % N %
Whangarei / Northland 19 1.2 34 1.8 41 1.9 77 3.1 111 3.6 132 3.8 123 4.5 Auckland 614 40.2 592 30.9 737 33.8 841 33.9 1004 33.3 1045 30.5 780 28.7 Hamilton / Waikato 92 5.9 123 6.3 110 4.9 128 5.2 225 7.4 283 8.2 258 9.5 Bay of Plenty 62 3.9 73 3.7 91 4.1 87 3.5 154 5.1 151 4.4 93 3.4 Central North Island 0 0 41 2.1 48 2.1 23 0.9 17 0.6 66 1.9 42 1.5 Hawke’s Bay / East Coast 0 0 28 1.4 84 3.8 127 5.1 119 3.0 172 5.0 170 6.3 Taranaki 0 0 0 0 18 0.8 20 0.8 27 0.9 33 1.0 23 0.8 Wanganui 35 2.2 16 0.8 26 1.2 18 0.7 18 0.6 30 0.9 51 1.9 Palmerston North / Manawatu 36 2.3 87 4.5 71 3.2 64 2.6 56 1.8 81 2.4 73 2.7 Wellington 264 16.7 293 15.1 272 12.4 376 15.2 395 13.0 432 12.6 348 12.8 West Coast / Upper South Island 0 0 17 0.9 71 3.2 49 2.0 131 4.3 139 4.1 84 3.1 Christchurch / Canterbury 356 22.7 470 24.0 438 19.6 489 19.7 619 20.3 709 20.7 492 18.1 Dunedin / Otago 76 4.8 152 7.8 160 7.3 140 5.6 133 4.4 125 3.6 131 4.8 Invercargill / Southland 0 0 11 0.6 35 1.5 39 1.6 34 1.1 34 1.0 46 1.7
Total 1554 1937 2202 2478 3043 3452 2714

30 Problem Gambling Intervention Services in New Zealand
Client composition: new clients The composition of new clients was similar to that from previous years, with just under 70% being new gambler clients, and around one-quarter being significant other clients (Table 18). Table 18: Face-to-face intervention services: client composition, new clients, 2005
Type of new client N %
Gambler 1871 68.9 Significant other 706 26.0 Interested other 137 5.0
Total 2714
Gender
Gamblers and significant others: new clients In 2004, for the first time, the number of new female gambler clients slightly exceeded the number of male gambler clients (Figure 20). However, in 2005 new male clients (54.7%) outnumbered new female clients, and this was also the first time since reporting began that the percentage of new female gambler clients decreased. Figure 20: Face-to-face intervention services: gamblers, new clients, by gender, 1997–2005
70.968.4
64.4
59.2 59.256.9
54.7
49.6
54.7
29.131.6
35.6
40.8 40.843.1
45.3
50.4
45.3
0
10
20
30
40
50
60
70
80
1997 1998 1999 2000 2001 2002 2003 2004 2005
Year
MalesFemales
Percent

Problem Gambling Intervention Services in New Zealand 31
Figure 21: Face-to-face intervention services: significant others and interested others, new clients, by gender, 1997–2005
15.5
25.5
20.423.5
30.5 32.134.2
31.829.1
84.5
74.5
79.676.5
69.5 67.965.8
68.270.9
0
10
20
30
40
50
60
70
80
90
1997 1998 1999 2000 2001 2002 2003 2004 2005
Year
MalesFemales
Percent
As in previous years, the majority of new significant other and interested other clients receiving face-to-face counselling were female (70.9%) (Figure 21). The percentage of new significant other and interested other clients that were male rose until 2003, and has declined annually since then.
Primary mode of problem gambling: new clients The substantial majority (91.1%) of new female gambler clients reported their primary mode of gambling as electronic gaming machines (9.8% casino, 81.3% non-casino) (Figure 22 and Table 19). The corresponding percentage for new female gambler clients in 2004 was 94.8% (8.5% casino and 86.3% non-casino). By comparison, the percentage of new male gambler clients citing electronic gaming machines in 2005 is somewhat lower (72.9%: casino 8.1%, non-casino, 64.8%). The corresponding percentage for males in 2004 was 81.3% (casino 8.5%, non-casino 72.8%). The percentages of new male gambler clients that cited casino tables (10.6%), track betting (8.9%), sports betting (2.0%), and other gambling (3.4%) were higher than for females. With respect to the latter two, the small numbers involved make any interpretation difficult – although through repeated years males have had higher percentages citing sports betting as their primary mode of harmful gambling. With respect to casino tables and track betting, this has been the case historically, and in the context of an overall decrease in client numbers, the numbers of new male clients citing these two modes increased in 2005.

32 Problem Gambling Intervention Services in New Zealand
Figure 22: Face-to-face intervention services: primary mode of problem gambling for gamblers, new clients, by gender, 2005
64.8
8.110.6 8.9
2.0 2.0 3.7
81.3
9.8
3.50.5 0.4 2.2 2.3
0
10
20
30
40
50
60
70
80
90
Non-casinogaming machines
Casino gamingmachines
Casino tables Track betting Sports betting Lotto/Keno/scratchies
Other gambling
Gambling mode
MalesFemales
Percent
Table 19: Face-to-face intervention services: primary mode of problem gambling for gamblers,
new clients, by gender, 2005
Male Female Total Gambling mode
N % N % N %
Non-casino gaming machines 631 64.8 670 81.3 1301 72.4 Casino gaming machines 79 8.1 81 9.8 160 8.9 Casino tables 103 10.6 29 3.5 132 7.3 Track 87 8.9 4 0.5 91 5.1 Sports betting 19 2.0 3 0.4 22 1.2 Lotto/Keno/scratchies 19 2.0 18 2.2 37 2.1 Housie 3 0.3 6 0.7 9 0.5 Other gambling 33 3.4 13 1.6 46 2.6
Total 974 824 1798

Problem Gambling Intervention Services in New Zealand 33
Age distribution
Gamblers and significant others: new clients The age distributions of new gambler and significant other clients were consistent with those seen in previous years. Over half (57.2%) of new gambler clients were aged under 40 years, while four out of every five (83.6%) were aged under 50 years (Figure 23). Relative to the age distribution of new gambler clients, the age distribution of new significant other and interested other clients was older (Figure 24). Approximately half (51.8%) of new significant other and interested other clients were aged under 40, and three-quarters (74.2%) were aged under 50. These distributions are very similar to those for the Helpline reported earlier. Figure 23: Face-to-face intervention services: age distribution of gamblers, new clients, 2005
4.0
9.7
13.5
15.6
14.415.4
11.0
6.8
4.8
2.5 2.3
0
5
10
15
20
< 20 20–24 25–29 30–34 35–39 40–44 45–49 50–54 55–59 60–64 65+
Age group (years)
Percent
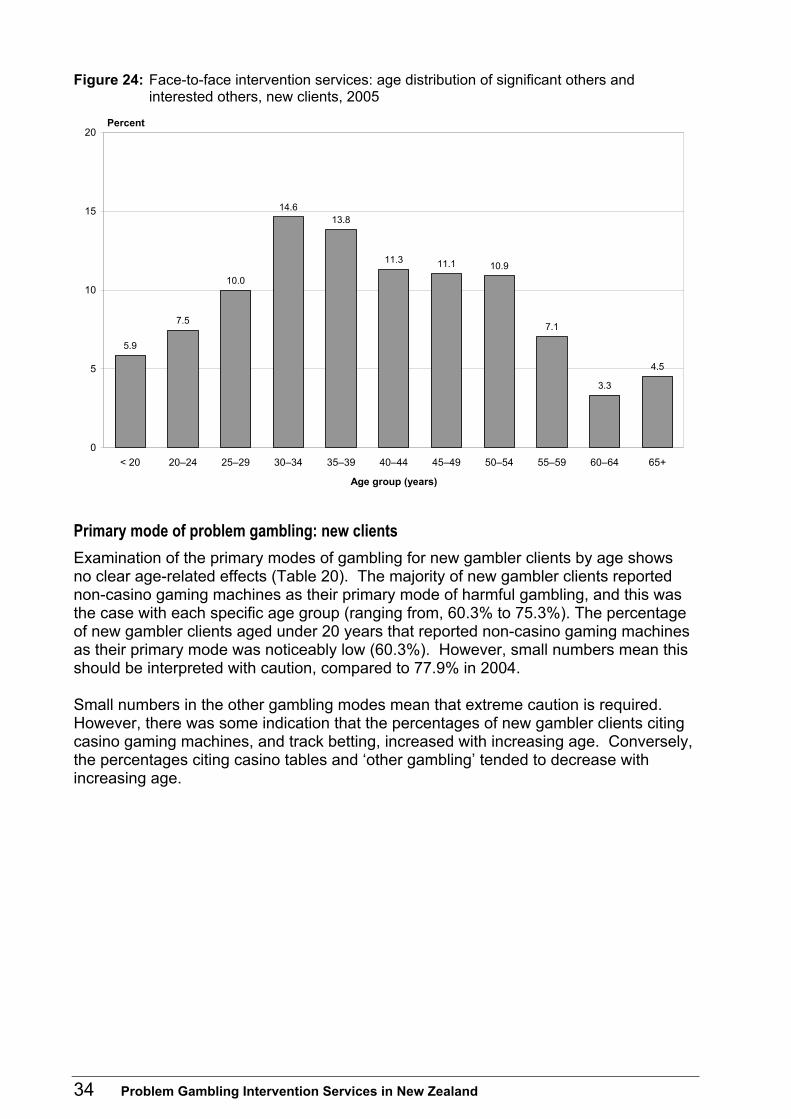
34 Problem Gambling Intervention Services in New Zealand
Figure 24: Face-to-face intervention services: age distribution of significant others and interested others, new clients, 2005
5.9
7.5
10.0
14.613.8
11.3 11.1 10.9
7.1
3.3
4.5
0
5
10
15
20
< 20 20–24 25–29 30–34 35–39 40–44 45–49 50–54 55–59 60–64 65+
Age group (years)
Percent
Primary mode of problem gambling: new clients Examination of the primary modes of gambling for new gambler clients by age shows no clear age-related effects (Table 20). The majority of new gambler clients reported non-casino gaming machines as their primary mode of harmful gambling, and this was the case with each specific age group (ranging from, 60.3% to 75.3%). The percentage of new gambler clients aged under 20 years that reported non-casino gaming machines as their primary mode was noticeably low (60.3%). However, small numbers mean this should be interpreted with caution, compared to 77.9% in 2004. Small numbers in the other gambling modes mean that extreme caution is required. However, there was some indication that the percentages of new gambler clients citing casino gaming machines, and track betting, increased with increasing age. Conversely, the percentages citing casino tables and ‘other gambling’ tended to decrease with increasing age.

Problem Gambling Intervention Services in New Zealand 35
Table 20: Face-to-face intervention services: primary mode of problem gambling for gamblers, new clients, by age, 2005
Age
Under 20 20–29 30–39 40–49 50–59 60 and over
Missing age data
Total Gambling mode
N % N % N % N % N % N % N % N %
Non-casino gaming machines
38 60.3 284 73.6 349 70.5 314 71.4 144 74.2 61 75.3 111 79.9 1301 72.4
Casino gaming machines
3 4.8 26 6.7 51 10.3 42 9.5 21 10.8 10 12.3 7 5.0 160 8.9
Casino tables 3 4.8 41 10.6 35 7.1 37 8.4 6 3.1 1 1.2 9 6.5 132 7.3Track 3 4.8 9 2.3 28 5.7 26 5.9 14 7.2 8 9.9 3 2.2 91 5.1Sports betting 2 3.2 6 1.6 5 1.0 5 1.1 1 0.5 0 0.0 3 2.2 22 1.2Lotto/Keno/ scratchies
1 1.6 10 2.6 12 2.4 8 1.8 4 2.1 1 1.2 1 0.7 37 2.1
Housie 1 1.6 1 0.3 4 0.8 1 0.2 2 1.0 0 0.0 0 0.0 9 0.5Other gambling 12 19.0 9 2.3 11 2.2 7 1.6 2 1.0 0 0.0 5 3.6 46 2.6
Total 63 386 495 440 194 81 139 1798
Ethnicity
Gamblers: new clients The ethnic profile of clients accessing face-to-face counselling services was consistent with the profile from 2004. There are two baselines against which this profile can be assessed: the ethnic profile of the general New Zealand population (Statistics New Zealand 2001), and the ethnic profile of problem gamblers identified in nationally representative studies of the prevalence of problem gambling (Abbott and Volberg 2000, Ministry of Health 2006). The latter comparison can be useful in assessing any relative successes or issues with help-seeking or treatment accessibility for particular ethnic groups. Using these comparisons, the following conclusions can be drawn. • With respect to the general population, there is an under-representation of New
European/Pākehā clients is consistent with the established prevalence of problem gambling in New Zealand.
• With respect to the general population, there is a substantial over-representation of Māori clients. However, the percentage of Māori clients is consistent with the established prevalence of problem gambling in New Zealand.
• With respect to the general population, there is an over-representation of Pacific clients. However, the percentage of Pacific people accessing services is lower than the established prevalence of problem gambling in New Zealand.
These comparisons should be interpreted with caution due to different ethnicity classifications being used (see Appendix 2 for further details).
Zealand European/Pākehā clients. However, the percentage of New Zealand
36 Problem Gambling Intervention Services in New Zealand
Since 1999 the percentage of new clients identifying as New Zealand European/ Pākehā has decreased annually (Figure 25 and Table 21). This pattern continued in 2005, with the percentage of new clients identifying as New Zealand European/Pākehā dropping below 50% for the first time. (This was also the case for the Helpline data reported earlier.) In a departure from recent trends, the percentage of new clients identifying as Māori also dropped in 2005, in contrast to the annual increases reported since 1999. The percentage of clients identifying as Pacific people remained similar to that for 2004. The percentage of clients that were Asian and other ethnicity both increased from 2004. Notably, these increases were due to increases in the absolute number of clients in these categories, in sharp contrast to the overall pattern and the pattern evident in other ethnic groups. Figure 25: Face-to-face intervention services: ethnicity of gamblers, new clients, 1999–2005
0
10
20
30
40
50
60
70
NZ European/Pākehā Māori Pacific peoples Asian peoples Other
Ethnicity
1999 2000 2001 2002 2003 2004 2005
Percent
Table 21: Face-to-face intervention services: ethnicity of gamblers, new clients, 1999–2005
1999 2000 2001 2002 2003 2004 2005 Ethnicity
N % N % N % N % N % N % N %
New Zealand European/Pākehā
745 68.1 901 64.3 976 57.9 1044 57.6 1164 54.2 1165 50.4 879 48.5
Māori 261 17.3 295 21.0 421 25.0 479 26.4 641 29.8 755 32.7 569 31.4 Pacific peoples 54 5.0 83 5.3 89 5.3 118 6.5 125 5.8 178 7.7 134 7.4 Asian peoples 41 3.7 44 3.1 51 3.0 63 3.5 84 3.9 102 4.4 109 6.0 Other 82 6.1 79 5.6 149 8.8 109 6.0 135 6.3 112 4.8 123 6.8
Total 1183 1402 1686 1813 2149 2312 1814
Note: Percentages may not total to 100 due to rounding.

Problem Gambling Intervention Services in New Zealand 37
Significant other: new clients As has historically been the case, the ethnic profile of new significant other and interested other clients differed substantially from that of new gambler clients. The percentage of these clients that identified as New Zealand European/Pākehā fell, as it has annually since 2000, to 54.7% (it was 59.0% in 2004) (Figure 26). The New Zealand European/Pākehā category was the only one in which the percentage of new significant other and interested other clients was higher than the corresponding percentage of new gambler clients. Both the percentage and the absolute number of significant other and interested other clients who identified as Māori increased from 2004 levels. In 2004, 15.9% of significant other and interested other clients identified as Māori, whereas in 2005 this rose to 22.9%. In contrast to the Asian new gambler clients, the number and percentage of significant other and interested other clients identifying as Asian people fell in 2005. The percentage of significant other and interested other clients identifying as Pacific people or ‘other’ remained similar to the 2004 levels. Figure 26: Face-to-face intervention services: ethnicity of significant others and interested
others, new clients, 1999–2005
0
10
20
30
40
50
60
70
80
NZ European/Pākehā Māori Pacific peoples Asian peoples Other
Ethnicity
1999 2000 2001 2002 2003 2004 2005
Percent

38 Problem Gambling Intervention Services in New Zealand
Primary mode of problem gambling: new clients When the primary modes of harmful gambling data are broken down by ethnicity, several differences are evident. The overall percentage of clients that cite non-casino gaming machines as their primary mode of harmful gambling was 72.4%. Māori clients are notable in that they are substantially more likely (84.4%) to have cited non-casino gaming machines as their primary mode of harmful gambling (Figure 27), while Asian clients, and those in the ‘other’ ethnicity category, were substantially less likely (13%, and 54.2%, respectively). As has been the case in previous years, and uniquely among the ethnic categories, most (63.9%) Asian clients cited casino table games as their primary mode of harmful gambling, and casino gaming machines were the second most frequently cited mode. Thus, 78.7% of Asian clients cited casino gambling as the source of their gambling harm. More new clients in the ‘other’ category cited casino gambling (total 33.3%) with a much higher frequency than Māori, Pacific people and New Zealand European/ Pākehā. The final notable difference across ethnicities was that the only ethnic group in which a substantial percentage of new clients cited track betting (7.5%) was the New Zealand European/Pākehā group, an increase since 2004 (5.9%). Figure 27: Face-to-face intervention services: primary mode of gambling for gamblers, new
clients, by ethnicity, 2005
0
10
20
30
40
50
60
70
80
90
Non-casinogaming machines
Casino gamingmachines
Casino tables Track betting Sports betting Lotto/Keno/scratchies
Housie Other gambling
Gambling mode
NZ European/PākehāMāoriPacific peoplesAsian peoplesOther
Percent

Problem Gambling Intervention Services in New Zealand 39
Primary mode of problem gambling, by gender and ethnicity: new clients As was shown earlier, new female gambling clients cited non-casino gaming machines as the primary mode of harmful gambling to a greater extent than did new male gambler clients (Figure 22). (Note that to a lesser extent the same was true of casino gaming machines.) In addition, Figure 25 shows that Māori clients cited non-casino gaming machines more often than other ethnicities, and casino-based gambling less often (while Asian people and ‘other ethnicity’ clients in general, and Pacific clients specifically with respect to casino gaming machines, seemed to cite casino-based gambling as their primary source of harm more frequently). Thus it is useful to examine these possible differences in more detail by examining the data in terms of both ethnicity and gender. When this is done, a number of interesting differences are evident. More than nine out of ten new female Māori gambler clients (90.8%) cited non-casino gaming machines as their primary mode of harmful gambling in 2005 (Table 22). A further 4.6% cite casino gaming machines, meaning that electronic gaming machines are almost solely responsible for the problem gambling of Māori females presenting for assistance. For the first time since 2002, the number of new Māori female gambling clients citing non-casino gaming machines decreased as a primary mode, although they remain the second largest gender/ethnic group accessing services, behind only New Zealand European/Pākehā males. Both New Zealand European/Pākehā and Māori males cited non-casino gaming machines more often than males generally. Table 22: Face-to-face intervention services: primary mode of problem gambling, new clients,
by gender and ethnicity, 2005
Non-casino gaming
machines
Casino gaming
machines
Casino tables
Track betting
Sports betting
Lotto/ Keno/
scratchies
Housie Other gambling
Total
N % N % N % N % N % N % N % N % N
Male New Zealand European/Pākehā
371 71.1 37 7.1 22 4.2 60 11.5 11 2.1 8 1.5 1 0.2 12 2.3 522
Māori 138 72.6 15 7.9 7 3.7 15 7.9 3 1.6 3 1.6 1 0.5 8 4.2 190 Pacific peoples 50 68.5 9 12.3 1 1.4 4 5.5 3 4.1 1 1.4 5 6.8 73 Asian peoples 13 14.8 11 12.5 57 64.8 1 1.1 1 1.1 5 5.7 88 Other 42 52.5 7 8.8 16 20.0 5 6.3 4 5.0 4 5.0 2 2.5 80
Total (all male) 614 64.4 79 8.3 103 10.8 85 8.9 19 2.0 18 1.9 3 0.3 32 3.4 953
Female New Zealand European/Pākehā
270 80.8 37 11.1 6 1.8 4 1.2 2 0.6 6 1.8 1 0.3 8 2.4 334
Māori 317 90.8 16 4.6 1 0.3 8 2.3 3 0.9 4 1.1 349 Pacific peoples 40 72.7 8 14.5 3 5.5 1 1.8 2 3.6 1 1.8 55 Asian peoples 1 5.0 5 25.0 12 60.0 2 10.0 20 Other 23 57.5 11 27.5 6 15.0 40
Total (all female) 651 81.6 77 9.6 27 3.4 4 0.5 3 0.4 17 2.1 6 0.8 13 1.6 798
Note: Differences in the total numbers of clients in the tables in this section occur due to missing data in some categories.
40 Problem Gambling Intervention Services in New Zealand
As has been the case historically, Asian men and women cited casino table games as their primary mode of harmful gambling (64.8% and 60.0% respectively). Again, the data were notable in that very few new Asian clients, male or female, cited non-casino gaming machines as their primary mode – among Asian clients presenting for help, the substantial majority of harmful gambling was associated with casinos. Consistent with the 2004 data, new male New Zealand European/Pākehā, Māori, and Pacific clients cited track betting more frequently than their female counterparts. Many of the ethnic-specific male–female differences in the numbers of clients presenting for help that were identified in 2004 continued. National prevalence surveys show no differences in the rates of problem gambling between males and females, although there is current evidence suggesting that there are ethnic-specific differences in prevalence (Ministry of Health 2006). Thus, if services were equally accessible, service presentations would be expected to be consistent with prevalence data (as has been seen above, prevalence data indicate that Pacific people are under-represented in help services). When gender and ethnicity are examined, several interesting differences are evident. With respect to New Zealand European/Pākehā and Asian clients, the majority of new gambler clients were male (61% and 81% respectively in 2005; 60% and 79% in 2004). In sharp contrast, the percentage of new Māori gambler clients that were male was just 35% (30% in 2004). In 2004, 38% of new Pacific gambler clients were male, but in 2005 this had risen to 57%. This highlights the need for caution when viewing these comparatively small numbers, as was highlighted in the 2004 report when the Asian and Pacific clients were discussed. The fact that the pattern in Asian clients has been repeated across successive observations to some extent alleviates this issue with that particular client group.
Measurement of client progress A range of measures of client progress have been collected since 1998. In this time the volume and quality of the data have been consolidated and improved via a national auditing system, an enhanced national provider database, and centralised follow-up for face-to-face counselling clients through the national Helpline. At present, three measures are recorded at new gambler clients’ initial assessments, and then repeated at follow-up. They are: • the South Oaks Gambling Screen (SOGS), adapted to collect measures related to
the client’s gambling behaviour in the three months preceding the assessment (SOGS-3M)8
• ‘total dollars lost’, which is a self-reported estimate of the amount of money the client has lost on all gambling in the four weeks preceding the assessment
• ‘control over gambling’, which measures each client’s own assessment of the degree of control they have over their gambling during the three months preceding the assessment.
8 A score of 3 or greater indicates a client might be a problem gambler (Abbott and Volberg 1991).

Problem Gambling Intervention Services in New Zealand 41
The gambler outcome measurement results discussed below are based on assessment and reassessment data collected in 2005. Just over 1300 clients are represented. Even though this is a substantial number, it is less than half the number of clients who have received treatment and should be interpreted with appropriate caution. Outcomes were measured by looking at the difference between the first and last assessments. Data were only retained when at least 150 days had elapsed between the two assessments. Demographics of outpatients As in previous years, the gambler clients for whom outcome data were available were, as a group, very similar to the general population of gambler clients. New Zealand European/Pākehā were again slightly over-represented, with the other ethnicities being slightly underrepresented (Table 23). Table 23: Face-to-face intervention services: gender and ethnicity of gambler outcome clients,
2005
General client population %
Outcome clients %
Gender Male 55.7 56.8 Female 44.3 43.2
Ethnicity New Zealand European/Pākehā 49.9 66.5 Māori 30.4 21.5 Pacific peoples 6.6 3.4 Asian peoples 6.2 4.5 Other 7.0 4.2
Although data from the first assessment represent the beginning of treatment, the last assessment cannot automatically be assumed to represent the end of treatment. Further treatment episodes are possible, and clients may interact with services in an episodic way. In this sense, the results presented below are progress measures rather than outcomes. Summary: problem gambling outcome and progress measures Over half (57.1%) of follow-up clients had substantial reductions in SOGS-3M scores (decreases of 6 or more), while a further 27.9% had smaller reductions. This was comparable with 87.3% of clients reporting that they had lost less money in the four weeks prior to follow-up than in the four weeks prior to initial assessment (67.9% of these reported losing 80–100% less) and 70.4% of clients reported an improvement in their sense of control.

42 Problem Gambling Intervention Services in New Zealand
Using these outcome measures, approximately one in five follow-up clients were unchanged or experiencing more severe problem gambling. In terms of changes in SOGS-3M scores, 15% either scored higher or were unchanged (11% and 4% respectively). The percentage of clients that reported higher or unchanged dollars lost was 12.7%, and a further 29.6% of clients reported less or an unchanged sense of control over their gambling. Problem gambling assessment measures
SOGS-3M scores
Distribution of SOGS-3M scores at first assessment SOGS-3M scores were collected for 1597 new clients in 2005 at first assessment. A score of 3 or greater was recorded for 95% of new clients (Figure 28). The average score (9.6) was lower than previous years (10.0 in 2004), and the distribution of scores was slightly skewed towards lower scores this year compared to a symmetrical distribution last year. Just over half (51.3%) of the new gambler clients scored 10 or greater. Figure 28: Face-to-face intervention services: distribution of SOGS-3M scores at first
assessment, outcome clients, 2005
0
2
4
6
8
10
12
1 2 3 4 5 6 7 8 9 10 11 12 13 14 15 16 17 18 19 20
SOGS-3M scores
Percent

Problem Gambling Intervention Services in New Zealand 43
Table 24: Face-to-face intervention services: SOGS-3M summary statistics for first assessments, outcome clients, 1999–2005
SOGS-3M score Mean Median Standard deviation N (first assessments)
1999 10.5 11.0 3.4 1085 2000 10.4 11.0 3.4 1257 2001 10.2 10.0 3.5 1422 2002 10.0 10.0 3.6 1642 2003 9.8 10.0 3.9 2072 2004 10.0 10.0 3.9 2175 2005 9.6 10.0 4.0 1597
SOGS-3M scores, by gender The SOGS-3M scores at first assessment for both male and female clients were very similar, though the measures for central tendency for males tended to be about one point lower than those for females (Table 25). Table 25: Face-to-face intervention services: SOGS-3M summary statistics for first
assessments, outcome clients, by gender, 2005
SOGS-3M score
Gender Mean Median Standard deviation N
Male 9.2 9.0 3.9 898 Female 10.1 10.0 4.0 699
SOGS-3M scores, by age The distributions of SOGS-3M scores were reasonably consistent across all age groups, with average scores generally between 9 and 10 (Table 26). Clients in the 50 and over or under 20 age groups had slightly lower scores than the intermediate age groups. These results are consistent with those for 2004. Clients in the 25–29 years age group had noticeably higher SOGS-3M scores than other age groups (mean 10.8, compared with an overall mean of 9.7). The next highest mean, 10.0 was for the 30–34 years age group.

44 Problem Gambling Intervention Services in New Zealand
Table 26: Face-to-face intervention services: SOGS-3M summary statistics for first assessments, outcome clients, by age group, 2005
SOGS-3M score
Age group Mean Median Standard deviation N
Under 20 8.0 9.0 4.8 50 20–24 9.7 10.0 4.2 40 25–29 10.8 11.0 4.1 194 30–34 10.0 10.0 4.1 237 35–39 9.9 10.0 3.9 215 40–44 9.8 10.0 3.8 222 45–49 9.4 9.0 3.8 173 50–54 9.1 9.0 3.7 110 55–59 8.6 9.0 3.1 74 60–64 9.0 9.0 3.4 41 65 and over 8.2 8.0 3.9 36
SOGS-3M scores, by ethnicity The means show a similar pattern to the 2004 figures in which Māori (10.4) had the highest mean, followed by Pacific peoples (9.6). All ethnic groups had means between 9 and 10 (Table 27). Table 27: Face-to-face intervention services: SOGS-3M summary statistics for first
assessments, outcome clients, by ethnicity, 2005
SOGS-3M score
Ethnicity Mean Median Standard deviation N
New Zealand European/ Pākehā 9.3 9.0 3.7 790 Māori 10.5 11.0 4.2 453 Pacific peoples 9.6 10.0 3.8 104 Asian peoples 8.5 9.0 4.7 92 Other 9.1 9.0 4.0 110
SOGS-3M scores, by primary mode The data for clients citing non-casino gaming machines as their primary mode of problem gambling were very similar to the overall data. This is to be expected given that most clients fell into that group. The data for casino-based gambling, track and sports betting have slightly lower distributions of SOGS-3M scores (Table 28). Housie, Lotto/Keno/scratchies and other gambling modes provide some evidence that clients citing these as their primary mode had lower SOGS-3M scores than those citing non-casino gaming machines. However, the sample for clients citing these other modes of problem gambling is small.

Problem Gambling Intervention Services in New Zealand 45
Table 28: Face-to-face intervention services: SOGS-3M summary statistics for first assessments, outcome clients, by primary gambling mode, 2005
SOGS-3M score
Gambling mode Mean Median Standard deviation N
Non-casino gaming machines 10.1 10.0 3.8 1152 Casino gaming machines 8.9 9.0 3.9 143 Casino tables 8.2 8.5 4.4 112 Track 8.7 9.0 3.6 84 Sports betting 8.6 9.5 4.7 20 Lotto/Keno/scratchies 5.7 4.5 4.6 20 Housie 7.0 7.5 3.9 4 Other gambling 7.6 8.0 4.8 27
Dollars lost
Total dollars lost The second progress measure for problem gamblers was total dollars lost. This measure establishes the amount of money the client had lost on all gambling in the four weeks prior to first assessment. The pattern of reported loss in the four weeks prior to entering treatment services has remained relatively constant since 1999. Figure 29 and Tables 29 and 30 show the data were skewed, so the mean was an inappropriate measure of average amount lost. The median provided a much better indication of average loss; this has remained at $800 for five of the last six years ($750 in 2001). However, in 2005 the median increased to $900. This may reflect a slight increase in both the $5,000–$9,999 and the $10,000 and over categories of both actual numbers and percentages of clients (9.9%), despite a reduction in the number of clients assessed. There was a slight drop on previous years of the majority (65.6%) of the clients who reported losing between $100 and $1,999 (between 70–77% in the years since 1999). The total reported losses dropped just below $4 million, but when compared with the 30% decrease in the number of people assessed the drop in total dollars lost has only decreased by 9%.

46 Problem Gambling Intervention Services in New Zealand
Figure 29: Face-to-face intervention services: distribution of dollars lost in four weeks before first assessment, outcome clients, 2005
0
5
10
15
20
25
30
< $100 $100–$499 $500–$999 $1,000–$1,999 $2,000–$4,999 $5,000–$9,999 $10,000+
Dollars lost
Percent
Table 29: Face-to-face intervention services: distribution of dollars lost in four weeks before
first assessment, outcome clients, 1999–2005
Dollars lost 1999 2000 2001 2002 2003 2004 2005
Under $100 55 5.3% 54 4.6% 83 6.0% 64 4.2% 129 6.8% 125 6.2% 115 7.9%$100–$499 275 26.6% 317 26.8% 399 28.7% 414 27.1% 505 26.7% 521 25.8% 353 24.2%$500–$999 261 25.3% 312 26.3% 353 25.4% 405 26.6% 470 24.9% 459 22.7% 287 19.7%$1,000–$1,999 228 22.1% 261 22.0% 302 21.7% 342 22.4% 416 22.0% 440 21.8% 317 21.7%$2,000–$4,999 163 15.8% 170 14.3% 181 13.0% 217 14.2% 251 13.3% 337 16.7% 243 16.7%$5,000–$9,999 29 2.8% 37 3.1% 40 2.9% 52 3.5% 65 3.4% 72 3.6% 79 5.4%$10,000 and over 21 2.0% 34 2.9% 33 2.4% 31 2.0% 54 2.9% 64 3.2% 65 4.5%
Total 1032 1185 1391 1525 1890 2018 1459
Table 30: Face-to-face intervention services: summary statistics of dollars lost in four weeks
before first assessments, outcome clients, 1999–2005
Dollars lost Mean Median Standard deviation Sum N
1999 $3,331 $800 $30,809 $3,437,831 1032 2000 $2,331 $800 $12,999 $2,763,074 1185 2001 $1,770 $750 $8,875 $2,462,639 1391 2002 $1,919 $800 $7,380 $2,926,723 1525 2003 $1,867 $800 $5,197 $3,529,542 1890 2004 $2,163 $800 $8,199 $4,364,703 2018 2005 $2,739 $900 $10,598 $3,996,888 1459

Problem Gambling Intervention Services in New Zealand 47
Dollars lost, by gender Although males make up 55.4% of new gambler outcome clients, males accounted for almost 70% of the spending (Table 31). The mean and median for the males’ expenditure are much higher than those for the females’. The standard deviation for the males is also much higher, indicating a number of male clients reported substantial losses. Nearly a third (29.2%) of males lost over $2,000 in the four weeks prior to treatment, while the figure for females was 23.2%, which show increases from the 2004 figures (27.8% and 18.9% respectively) (Figure 30). It has been noted previously that there were some slight differences in the primary mode of problem gambling reported by male and female clients, which may account for the differences in losses reported here. Figure 30: Face-to-face intervention services: dollars lost in four weeks before first
assessment, outcome clients, by gender, 2005
8.3
22.9
18.3
21.4
18.0
5.7 5.4
7.4
25.8
21.422.2
14.9
5.1
3.2
0
5
10
15
20
25
30
< $100 $100–$499 $500–$999 $1,000–$1,999 $2,000–$4,999 $5,000–$9,999 $10,000+
Dollars lost
MalesFemales
Percent
Table 31: Face-to-face intervention services: summary statistics of dollars lost in four weeks
before first assessment, outcome clients, by gender, 2005
Dollars lost Gender
Mean Median Standard deviation Sum N
Male $3,416 $1,000 $13,719 $2,763,331 809 Female $1,898 $814 $4,093 $1,233,557 650

48 Problem Gambling Intervention Services in New Zealand
Dollars lost, by age There is no apparent pattern to the reported losses across age groups (Table 32). The age groups with the smallest sample sizes (60 plus and under 20) had the lowest average amounts lost, with the medians also being low in the 60–64 and under 20 age groups). The 20–29 and 40–49 age groups all had high median amounts, with two of these groups (20–24 and 45–49) having high standard deviations, indicating that there were some individuals in these groups with very high losses; this is reflected in the means for these groups, which are substantially higher than those for the other age groups. Table 32: Face-to-face intervention services: summary statistics of dollars lost in four weeks
before first assessment, outcome clients, by age group, 2005
Age group Mean Median Standard deviation Sum N
< 20 $724 $400 $899 $31,151 43 20–24 $4,331 $1,000 $12,245 $563,070 130 25–29 $2,474 $1,160 $6,373 $437,871 177 30–34 $2,170 $880 $5,655 $479,598 221 35–39 $2,818 $800 $9,776 $552,251 196 40–44 $2,673 $1,000 $7,578 $545,202 204 45–49 $4,840 $1,000 $24,481 $750,144 155 50–54 $2,123 $870 $5,100 $205,965 97 55–59 $2,117 $800 $5,325 $148,187 70 60–64 $1,415 $425 $3,393 $53,773 38 65+ $1,394 $880 $1,451 $47,405 34
Dollars lost and ethnicity Asian clients reported much higher losses than other ethnicities ($4,050 compared to an overall median of $900) (Figure 31 and Tables 30 and 33), which is consistent with previous reports. Asian clients represented just 6% of clients contributing to these data, while accounting for 35.4% of reported losses. In absolute dollar terms, Asian clients were very close to New Zealand European/Pākehā clients (who accounted for 37.3% of the reported losses and made up 52.4% of the client numbers). The actual numbers of Asian clients was low, meaning some caution is necessary when interpreting these data. However, the same patterns have been repeated across successive years. Previous reports have suggested that this large discrepancy may be due to Asian clients preferring casino table games in which stakes can be very high, or that larger losses may be required before clients of Asian ethnicity will seek help. There was some evidence that Māori and Pacific clients lost less in the four weeks prior to treatment than other groups, with higher percentages of clients losing quantities less than $500. However, the significance of the dollars lost is uncertain in the absence of data about the clients’ financial status. Also, the Pacific clients’ data need to be interpreted with caution, as the numbers of Pacific clients contributing to these data are low.

Problem Gambling Intervention Services in New Zealand 49
Figure 31: Face-to-face intervention services: dollars lost in four weeks before first assessment, outcome clients, by ethnicity, 2005
0
5
10
15
20
25
30
35
< $100 $100–$499 $500–$999 $1,000–$1,999 $2,000–$4,999 $5,000–$9,999 $10,000+
Dollars lost
NZ European/PākehāMāoriPacific peoplesAsian peoplesOther
Percent
Table 33: Face-to-face intervention services: summary statistics of dollars lost in four weeks
before first assessment, outcome clients, by ethnicity, 2005
Ethnicity Mean Median Standard deviation Sum N
New Zealand European/Pākehā $1,949 $900 $4,416 $1,446,063 742 Māori $1,429 $700 $3,099 $573,125 401 Pacific peoples $1,358 $600 $2,044 $119,479 88 Asian peoples $15,930 $4,050 $37,828 $1,369,983 86 Other $3,654 $1,460 $7,095 $365,360 100
Dollars lost and primary mode of gambling Apart from non-casino gaming machines, the sample sizes were small for modes of gambling, making interpretation difficult. With the high numbers of clients reporting non-casino gaming machines as their primary mode of problem gambling, the data for this mode reflect the overall data, although with slightly lower than average dollars lost ($1,778, compared with $2,740 overall) (Table 34). Casino gaming machines have both a higher mean and median than most of the other modes of gambling, second only to casino tables, which have substantially higher figures. Casino gambling accounts for more dollars lost (48.4% of total dollars lost) than non-casino gaming machines, although the sample comprises only 16.6% of the contributing clients compared with 73.7% of the clients citing non-casino gaming machines. Track and sports bettors also report relatively high losses, although these results must be interpreted with caution due to the low sample sizes.

50 Problem Gambling Intervention Services in New Zealand
Table 34: Face-to-face intervention services: summary statistics of dollars lost in four weeks before first assessment, outcome clients, by primary mode of gambling, 2005
Dollars lost Gambling mode
Mean Median Standard deviation Sum N
Non-casino gaming machines $1,778 $868 $4,204 $1,874,139 1054 Casino gaming machines $4,684 $1,545 $11,518 $627,621 134 Casino tables $12,451 $3,300 $33,604 $1,282,450 103 Track $1,196 $560 $1,484 $94,451 79 Sports betting $1,953 $550 $3,621 $33,205 17 Lotto/Keno/scratchies $502 $70 $1,538 $9,543 19 Housie $191 $90 $181 $574 3 Other gambling $961 $400 $1,464 $21,145 22
Control over gambling The majority of clients (70.6%) rated their gambling as either mostly or completely out of control (Figure 32 and Table 35), consistent with the high scores in the initial SOGS-3M assessments. This is slightly down on previous years due to the proportion of clients feeling completely out of control being at a low of 32.9%. Furthermore, the percentage of clients who felt completely in control has increased to 11.5%. Feeling some loss of control of gambling was indicated by 88.5% of the clients; this is not as close as it has been previously to the SOGS-3M scores, in which 95% of clients scored 3 or more. This indicates that the majority of clients had a reasonably accurate perception of their problem gambling, although the proportion who may have felt more in control than they actually were was slightly higher than in 2004.

Problem Gambling Intervention Services in New Zealand 51
Figure 32: Face-to-face intervention services: distribution of gambling control ratings at first assessment, outcome clients, 1999–2005
0
5
10
15
20
25
30
35
40
45
50
Completely in control Mostly in control Mostly out of control Completely out of control
Gambling control rating
1999 2000 2001 2002 2003 2004 2005
Percent
Table 35: Face-to-face intervention services: distribution of gambling control ratings at first
assessment, outcome clients, 1999–2005
1999 2000 2001 2002 2003 2004 2005 Control rating
N % N % N % N % N % N % N %
Completely in control 40 3.7 42 3.3 63 4.4 73 4.7 185 8.9 173 8.0 188 11.5 Mostly in control 169 15.8 181 14.3 235 16.6 232 14.9 379 18.2 361 16.7 293 17.9 Mostly out of control 486 45.5 577 45.5 573 40.5 624 40.2 784 37.7 810 37.4 616 37.7 Completely out of control
372 34.9 467 36.9 545 38.5 625 40.2 734 35.3 822 38.0 539 32.9
Note: Percentages may not total to 100 due to rounding. Problem gambling outcome and progress measures
Change in SOGS-3M scores Over half (57.1%) of follow-up clients had substantial reductions in their SOGS-3M scores (decreases of 6 or more), and a further 27.9% had smaller reductions (decreases between 1 and 5) (Figures 33 and 34). These figures compare favourably with previous years (2004: 48.4% and 30.9%). However, a small number showed no change (4% compared to 6.3% in 2004) or a higher (worse) score (11% compared to 14.5% in 2004).

52 Problem Gambling Intervention Services in New Zealand
Figure 33: Face-to-face intervention services: change in SOGS-3M scores, outcome clients, 2005
11.0
4.0
27.9
37.7
16.9
2.5
0
5
10
15
20
25
30
35
40
Increased SOGS No change 1–5 down 6–10 down 11–15 down 16–20 down
Change in SOGS-3M score
Percent
Table 36: Face-to-face intervention services: change in SOGS-3M scores, outcome clients,
2005
Mean Median Standard deviation N
6.0 6.0 5.1 1080

Problem Gambling Intervention Services in New Zealand 53
Figure 34: Face-to-face intervention services, SOGS-3M scores at initial assessment and follow up, outcome clients
0
5
10
15
20
25
30
35
40
0 1 2 3 4 5 6 7 8 9 10 11 12 13 14 15 16 17 18 19 20
SOGS-3M scores
Initial assessmentFollow-up
Percent
Reduction in dollars lost The majority of clients (67.9%) reported an 80–100% reduction in dollars lost since their first assessment (Table 37 and Figure 35). The only other group that contained more than 10% of clients was the group that reported losing more at follow-up than at their first assessment (11.5%). These figures compare favourably with 2004: the percentage of clients that reported higher or unchanged dollars lost was 12.7% (17% in 2004) and the clients that reported they lost less money in the four weeks prior to follow-up than in the four weeks prior to initial assessment was 87.3% (83% in 2004). Table 37: Face-to-face intervention services: change in dollars lost as a percentage of amount
reported lost at initial assessment, outcome clients, 2005
Change in dollars lost N %
Increased 126 11.5% No change 13 1.2% Reduction 0–20% 29 2.7% Reduction 20–40% 34 3.1% Reduction 40–60% 56 5.1% Reduction 60–80% 93 8.5% Reduction 80–100% 742 67.9%
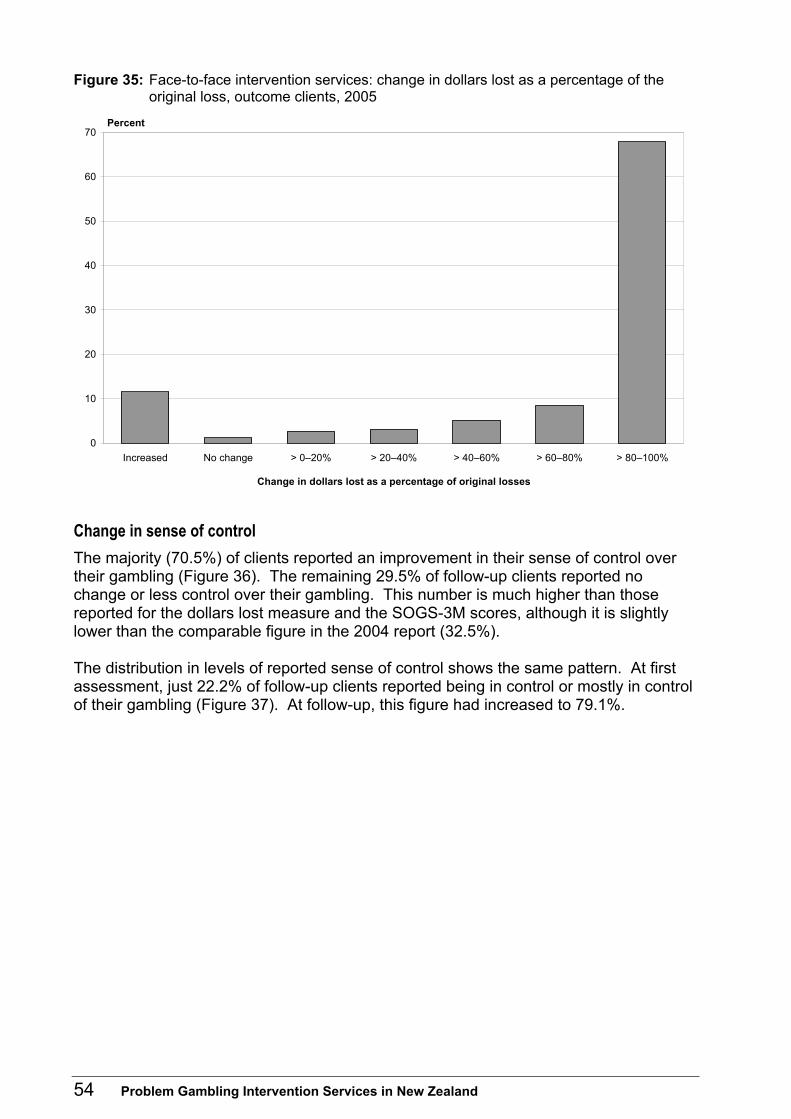
54 Problem Gambling Intervention Services in New Zealand
Figure 35: Face-to-face intervention services: change in dollars lost as a percentage of the original loss, outcome clients, 2005
0
10
20
30
40
50
60
70
Increased No change > 0–20% > 20–40% > 40–60% > 60–80% > 80–100%
Change in dollars lost as a percentage of original losses
Percent
Change in sense of control The majority (70.5%) of clients reported an improvement in their sense of control over their gambling (Figure 36). The remaining 29.5% of follow-up clients reported no change or less control over their gambling. This number is much higher than those reported for the dollars lost measure and the SOGS-3M scores, although it is slightly lower than the comparable figure in the 2004 report (32.5%). The distribution in levels of reported sense of control shows the same pattern. At first assessment, just 22.2% of follow-up clients reported being in control or mostly in control of their gambling (Figure 37). At follow-up, this figure had increased to 79.1%.

Problem Gambling Intervention Services in New Zealand 55
Figure 36: Face-to-face intervention services: change in control over gambling, by level of control, outcome clients, 2005
6.5
23.0
29.6 29.6
11.3
0
5
10
15
20
25
30
35
Reduced control No change 1 level better 2 levels better 3 levels better
Change in level of control
Percent
Figure 37: Face-to-face intervention services: change in control over gambling, by rating,
outcome clients, 2005
4.5
17.7
40.9
36.9
33.6
45.5
13.0
7.9
0
5
10
15
20
25
30
35
40
45
50
Completely in control Mostly in control Mostly out of control Completely out of control
Control over gambling
Initial assessmentFollow-up
Percent

56 Problem Gambling Intervention Services in New Zealand
Outcomes and treatment completion Service providers record a discharge reason when clients are discharged. The two main reasons for discharge are ‘treatment completed’ and ‘treatment partially completed’. The clients who were recorded as ‘treatment completed’ generally had better outcomes, or the more substantial improvements, at the last recorded assessment (Figures 38, 39 and 40). There were statistically significant differences in each outcome measure: change in SOGS-3M scores (p < 0.05), dollars saved as a proportion of original losses (p < 0.001); and improvement in control (p < 0.05). Care should be taken in interpreting these data, which indicate outcomes at the time of discharge only. Figure 38: Face-to-face intervention services: change in SOGS-3M score, outcome clients, by
degree of treatment completion, 2005
8.6
1.5
20.5
44.0
22.4
3.0
8.8
3.9
28.9
38.7
16.2
3.4
0
5
10
15
20
25
30
35
40
45
50
Increased SOGS No change 1–5 down 6–10 down 11–15 down 16–20 down
SOGS-3M change
Treatment completedTreatment partially completed
Percent

Problem Gambling Intervention Services in New Zealand 57
Figure 39: Face-to-face intervention services: change in dollars lost as proportion of original loss, outcome clients, by degree of treatment completion, 2005
5.51.6 2.4 2.0
4.06.3
78.3
14.1
0.5 1.9 2.34.7
9.4
67.1
0
10
20
30
40
50
60
70
80
90
Increased No change 0–20% less 20–40% less 40–60% less 60–80% less 80–100% less
Change in dollars lost as a percentage of initial loss
Treatment completedTreatment partially completed
Percent
Figure 40: Face-to-face intervention services: change in sense of control, outcome clients, by
degree of treatment completion, 2005
3.8
20.8
24.3
35.1
16.0
5.7
22.4
34.6
24.6
12.7
0
5
10
15
20
25
30
35
40
Reduced control No change 1 level better 2 levels better 3 levels better
Change in sense of control
Treatment completedTreatment partially completed
Percent

58 Problem Gambling Intervention Services in New Zealand
Outcomes compared by gender The distribution of SOGS-3M scores shows that 16.5% of female and 13.9% of male clients showed no change or higher (worse) SOGS-3M scores (Figure 41). These are much lower than the percentages in 2004 (22.1% and 19.7% for males and females respectively). These data show outcomes for males and females are very similar as measured by SOGS-3M scores. Males lost significantly more dollars than females (p < 0.05) in 2005 (Figure 42). Figure 41: Face-to-face intervention services: change in SOGS-3M scores, outcome clients, by
gender, 2005
11.5
2.4
28.2
38.2
17.0
2.8
10.4
6.1
27.5
37.0
16.9
2.2
0
5
10
15
20
25
30
35
40
Increased SOGS No change 1–5 down 6–10 down 11–15 down 16–20 down
Change in SOGS-3M score
MalesFemales
Percent

Problem Gambling Intervention Services in New Zealand 59
Figure 42: Face-to-face intervention services: change in dollars lost as proportion of original loss, outcome clients, by gender, 2005
11.4
1.1 2.7 2.95.2
7.0
69.6
11.6
1.3 2.6 3.4 5.0
10.6
65.5
0
10
20
30
40
50
60
70
80
Increased No change > 0–20% > 20–40% > 40–60% > 60–80% > 80–100%
Change in dollars lost as a percentage of initial loss
MalesFemales
Percent
Outcomes for Māori clients compared with non-Māori clients Both the changes in SOGS-3M scores and changes in the amount of dollars lost as a percentage of initially reported losses suggest outcomes for Māori are consistent with non-Māori outcomes (Figures 43 and 44). In 2005, 17% of Māori clients’ SOGS-3M scores were unchanged or worsened, compared with 14.2% for non-Māori clients. The distributions were very similar, and no statistical differences were evident (p = 0.911). Similarly, figures for dollars lost reported at discharge as a percentage of initial losses showed 63.7% of Māori clients reporting a reduction of 80–100% in dollars lost, compared with 69.1% of non-Māori clients.

60 Problem Gambling Intervention Services in New Zealand
Figure 43: Face-to-face intervention services: change in SOGS-3M scores, outcome clients, by ethnicity, 2005
12.4
4.6
24.8
35.3
20.6
2.3
10.5
3.7
28.3
38.8
16.0
2.7
0
5
10
15
20
25
30
35
40
45
Increased SOGS No change 1–5 down 6–10 down 11–15 down 16–20 down
Change in SOGS-3M score
MāoriNon-Māori
Percent
Figure 44: Face-to-face intervention services: change in dollars lost as proportion of original
loss, outcome clients, by ethnicity, 2005
12.1
0.94.5 3.6
7.6 7.6
63.7
10.9
1.3 2.1 3.1 4.5
8.9
69.1
0
10
20
30
40
50
60
70
80
Increased No change > 0–20% > 20–40% > 40–60% > 60–80% > 80–100%
Change in dollars lost as a percentage of initial loss
MāoriNon-Māori
Percent

Problem Gambling Intervention Services in New Zealand 61
References Abbott M, Volberg R. 1991. Gambling in New Zealand: Report to the Department of Internal Affairs. Wellington: Department of Internal Affairs.
Abbott M, Volberg R. 2000. Taking the Pulse on Gambling and Problem Gambling in New Zealand: A report on phase one of the 1999 National Prevalence Survey. Wellington: Department of Internal Affairs.
Ministry of Health. 2005. Preventing and Minimising Gambling Harm: Strategic plan 2004–2010. Wellington: Ministry of Health.
Ministry of Health. 2006. Problem Gambling in New Zealand: Analysis of the 2002/03 New Zealand Health Survey. Wellington: Ministry of Health.
Statistics New Zealand. 2001. 2001 Census. http://www.stats.govt.nz (accessed 5 July 2006).

62 Problem Gambling Intervention Services in New Zealand
Appendix 1: Gambling Helpline Ltd
Data
Corrections to Gambling Helpline Ltd data The Gambling Helpline data represent individuals who have had their details recorded in the Gambling Helpline database. They do not represent individuals recorded in the separate face-to-face counselling databases of other agencies. Information recorded in website tracking statistics software is also included. Data have been recorded on the Helpline database since the beginning of 1998. Prior to 2003, cities and other place names were manually typed, allowing spelling mistakes. There is no guarantee that all clients before this date from a particular city or region are captured in regional analysis statistics. To ensure future research is based on the most accurate available data, the annual national statistics reports have each year presented recalculated figures for previous years, to take account of new data (eg, data on a client’s first ever session) and to allow for corrections to any reporting errors. Recalculating results (or ‘data grooming’) also allows analyses to take advantage of improved and more sophisticated methods of data analysis and collection (eg, techniques for handling missing admission or discharge data and removing duplicate records). This approach maximises the integrity of any comparisons with the past. Consequently, some data presented in the 2005 report will differ slightly from the same data for previous years contained within the publications for those years. Gender vs client type In previous years some of the data (ie, client type – new clients) for numbers of gamblers, significant others and interested others were based on the gender tables that were collated. However, the 2005 process was much more accurate: instead of relying on the gender, the base data were used to recalculate everything. This allowed an audit of the calculation of the figures and a far better accuracy for the historical figures. Not every client is assigned a gender, but all clients are allocated to a call type (eg, gambler, significant other, interested other). Relying on gender resulted historically in missing data, not only for gender, but also for the numbers of gamblers, significant others and interested others. Gender is not always assigned to a client, because it can be difficult to establish it from the sound of their voice and is considered impolite to ask. As a result of this correction, some of the figures have increased.

Problem Gambling Intervention Services in New Zealand 63
Timing of contacts Historically, some of the contacts recorded in the evenings of the last day of a month were allocated to the following month. This may have resulted in calls occurring in December being allocated to the following year. Using the base data, contacts have been accurately allocated to the correct year. This may result in some differences of figures between the data presented in this report and those in previous reports. Errors in 2004 Some of the 2004 figures presented in this report are slightly higher than those reported in the previous publication. Some contacts were missed out due to error in the last report. However, the audit and use of base data picked this up and the figures provided are now accurate. Future reports The new processes (ie, the queries on base data) will be used to maintain accuracy in future reports.
Definitions Helpline contacts: the data from the Helpline include people who make contact via phone and via email. As a result, this year’s report refers to ‘clients’ rather than ‘callers’. It should be noted that for the Helpline some clients choose to remain anonymous or not to provide demographic information such as age and ethnicity. Therefore the data reported represent only those demographics where this information is provided by the client. Significant other: family/whānau, other relatives, friends or others affected by another with a gambling problem. Interested other: students, media, researchers. Anyone besides gamblers and significant others interested in information about gambling and gambling problems, including general public. New client: the first time an individual has called or emailed the Helpline based on a check against the Gambling Helpline database. Primary mode: the type of gambling causing the most problems for the gambler/ significant other. Note: for the Gambling Helpline prior to 10 March 2000 more than one primary mode could be allocated to a client, and after this date only one primary mode could be allocated. Additional mode(s): additional types of gambling causing problems for a gambler/ significant other. A client may cite more than one additional mode.

64 Problem Gambling Intervention Services in New Zealand
Ethnicity: ethnicity is self-defined by the contact. This is then entered as one of these options: • African • Asian – Chinese • Asian – Indian • Asian – Other • European or Pākehā • New Zealand Māori • Pacific peoples – Cook Island Māori • Pacific peoples – Fijian • Pacific peoples – Other Pacific Islands • Pacific peoples – Samoan • Pacific peoples – Tongan • Other or multiple ethnicity. These are condensed into the categories shown in this report in order to ensure the numbers of contacts in each ethnicity are sufficient.
Problem Gambling Intervention Services in New Zealand 65
Appendix 2: Face-to-face Intervention Services
Data
Corrections to face-to-face data To ensure that future research is based on the most accurate available data, the annual national statistics reports have each year presented recalculated figures for the previous year. Recalculating results or ‘data grooming’ is required to take account of new data (eg, data on a client’s first ever session), to allow for corrections to any reporting errors, and to take advantage of improved and more sophisticated methods of data analysis and collection. In 2004 the data collection was shifted from reliance on paper forms to an electronic process. Analysis is now based directly on the data entered into the CLIC database nationwide. Because all CLIC data are validated at data entry, this has increased the robustness of analysis. The earliest point at which CLIC data were considered sufficiently complete to replace the paper-derived data was 2002, so findings prior to this point are based on the existing published results. As a result, data for 2002 and 2003 in this latest report may differ slightly from those in previous reports. One goal of data grooming has been to maximise the integrity of comparisons with the past, but the 2002 discontinuity should be noted.
Definitions Clients: the data are based on outpatient clients who access face-to-face counselling services. Inpatient data are not included in this publication. Significant other: family/whānau, other relatives, friends or others affected by another with a gambling problem. Interested other: students, media, researchers. Anyone besides gamblers and significant others interested in information about gambling and gambling problems, including general public. Brought-forward clients: clients who began their face-to-face counselling treatment in previous years. Repeat admission clients: clients that were previously discharged but have subsequently presented for further face-to-face counselling treatment. Discharged clients: clients whose treatment has ceased during the year 2005. Primary mode: type of gambling causing the most problems for a gambler/significant other.

66 Problem Gambling Intervention Services in New Zealand
Additional mode(s): additional types of gambling causing problems for a gambler/significant other. A client may cite more than one additional mode. Ethnicity: up to three types of ethnicity may be selected from an extended version of the following list: • Chinese (not further defined – NFD) • Cook Island Māori (NFD) • Fijian (except Fiji Indian/Indo-Fijian) • Fijian Indian/Indo-Fijian • Indian (NFD) • Korean • New Zealand European/Pākehā • Māori • Niuean • Not specified • Other (not elsewhere classified) • Pacific Island (NFD) • Samoan • Tokelauan • Tongan. Only the first ethnicity recorded is used in the analysis. These categories are condensed into the categories shown in this report in order to ensure the numbers of contacts in each ethnicity are large enough to present reliable data. Outcome clients: the outcome measures are based on assessment and reassessment of gambler clients. It should be noted that they represent only a small proportion of the number of clients who have received treatment and so should be interpreted with caution. SOGS-3M: the South Oaks Gambling Screen (SOGS) was adapted to form the SOGS-3M, which measures the client’s gambling behaviour in the three months preceding the assessment (SOGS-3M). A score of 3 or greater indicates a client might be a problem gambler (Abbott and Volberg 1991). Dollars lost: total dollars lost measures the client’s estimate of the amount of money they have lost on all gambling in the four weeks preceding the assessment. Control over gambling: control over gambling measures each client’s own assessment of the degree of control they have over their gambling during the three months preceding the assessment. Treatment duration: the time a client attends services from first to last session.

Problem Gambling Intervention Services in New Zealand 67
Statistical significance tests: Grant Paton-Simpson has carried out significance tests for a small number of outcome measures. A p value of less than 0.05 (p < 0.05) is considered to be statistically significant in this report.
Mental Health Directorate (Ministry of Health) problem gambling intervention service contracts • Best Care Whakapai Hauora • Gambling Helpline Ltd • Hapai Te Hauora Tapui • Hauora Waikato • He Oranga Pounamu • Mental Health Services* (Waikato DHB) • Nga Manga Puriri • Ngati Porou Hauora • Oasis (Salvation Army) • Odyssey House • Pacificare Trust • Pacific Peoples Addiction Service Incorporated (PPASI) • Problem Gambling Foundation • Raukura Hauora o Tainui* • Te Kahui Hauora o Ngati Koata Trust* • Te Kahui Hauora Trust • Te Rangihaeata Oranga • Te Rapuora Health Services* • Te Runanga o Toa Rangatira • Te Whanau o Waipareira Trust • Tui Ora Limited • TUPU* (Waitemata DHB) • Wairarapa Addiction Services* • Woodlands Centre Charitable Trust Inc.
* These providers did not commence service delivery until the second half of 2005.