proc imeche part g: multi-sensor information fusion for...
TRANSCRIPT

Original Article
Multi-sensor information fusion for faultdetection in aircraft gas turbine engines
Soumik Sarkar1, Soumalya Sarkar2, Kushal Mukherjee3,Asok Ray4 and Abhishek Srivastav5
Abstract
The article addresses data-driven fault detection in commercial aircraft gas turbine engines in the framework of multi-
sensor information fusion and symbolic dynamic filtering. The hierarchical decision and control structure, adopted in this
article, involves construction of composite patterns, namely, atomic patterns extracted from single sensors, and relational
patterns representing cross-dependence between a pair of sensors. While the underlying theories are presented along
with necessary assumptions, the proposed method is validated on the NASA C-MAPSS simulation test bed of aircraft gas
turbine engines; both single-fault and multiple-fault scenarios have been investigated. Since aircraft engines undergo
natural degradation during the course of their normal operation, the issue of distinguishing between a fault and natural
degradation is also addressed.
Keywords
Gas turbine engines, fault detection, information fusion
Date received: 15 May 2012; accepted: 26 October 2012
Introduction
Since real-time physics-based models of human-engineered complex systems (e.g. aircraft gas turbineengines) are usually computation-intensive, data-driven fault diagnosis is desirable from the perspec-tives of real-time decision and control. In thisresearch, a dynamic gas-path model, namely theNASA C-MAPSS,1 has been used to serve as theplant on the simulation test bed that generates differ-ent sets of (simulated) sensor time series data. Data-driven techniques for health monitoring of gas turbineengines either use snapshot data at a time instant fromvarious sensors2 or a window of time series data fromselected sensor observations. The data volume is rela-tively small for the snapshot type of data; conse-quently, the computational expense is low. However,just by using snapshot data, statistical changes in theacquired information may not be adequately cap-tured, because of possible missed detection of faults.Although this problem could be alleviated by using awindow of time series data, it causes another problemof handling time series due to its data volume and theassociated computational complexity; therefore, theavailable data must be appropriately compressedfrom the high-dimensional information space onto alow-dimensional feature space with reduced loss ofclass separability. In the previous work,3,4 the authors
proposed a nonlinear feature extraction method,called symbolic dynamic filtering (SDF), for detectionof anomalies (i.e. deviations from the nominal condi-tion) in dynamical systems. This method is shown tobe particularly useful for feature extraction from timeseries and has been experimentally validated for real-time execution in different applications (e.g. electroniccircuits5 and fatigue damage monitoring in polycrys-talline alloys6). Algorithms, constructed in the SDFsetting, have been shown to yield superior perform-ance in terms of early detection of anomalies androbustness to measurement noise in comparisonwith other existing techniques such as principal
Proc IMechE Part G:
J Aerospace Engineering
227(12) 1988–2001
! IMechE 2012
Reprints and permissions:
sagepub.co.uk/journalsPermissions.nav
DOI: 10.1177/0954410012468391
uk.sagepub.com/jaero
1Systems Department, United Technologies Research Center,
The Pennsylvania State University, University Park, PA, USA2Department of Mechanical Engineering, The Pennsylvania State
University, University Park, PA, USA3Systems Department, United Technologies Research Center, Cork,
Ireland4Department of Mechanical and Nuclear Engineering, The Pennsylvania
State University, University Park, PA, USA5Systems Department, United Technology Research Centre,
East Hartford, CT, USA
Corresponding author:
Asok Ray, Pennsylvania State University, 329 Reber Building, University
Park, PA 16802, USA.
Email: [email protected]

component analysis (PCA), neural networks (NN)and Bayesian techniques.7 Recently, in a two-partpaper,8,9 an SDF-based algorithm for detection andisolation of engine subsystem faults (specifically,faults that cause efficiency degradation in engine com-ponents) has been reported and an extension of thatwork to estimate simultaneously occurring multiplecomponent-level faults has been presented in Sarkaret al.10 Furthermore, an optimized feature extractiontechnique has been developed in the semantic frame-work in Sarkar et al.11 However, the patterns gener-ated from the time series of a single sensor may notcarry sufficient information to correctly diagnose anevolving fault. Moreover, simultaneously occurringfaults in a single subsystem or in different subsystemsmay generate similar signatures as observed from asingle sensor. In this regard, a data-driven fault detec-tion tool for aircraft engine systems should have thecapability to characterize, quantify and interpret mul-tiple sensor outputs.
Sensor information fusion for an aircraft engine ischallenging. First of all, an aircraft engine system hassensors with different modalities (e.g. pressure, tem-perature, speed and acceleration), which renders data-level information fusion to be difficult due to theinherent scaling problem in sensors of differentmodality. On the other hand, decision level fusiongenerally requires an in-depth understanding of thephysical system and its failure signatures in differentsensor observations. In the literature, Dempster-Shafer evidence theory has been applied for enginefault diagnosis;12 similarly, the concept of Bayesianbelief networks has been used for fault diagnosis inturbofan engines.13 Both techniques belong to theclass of decision fusion at an upper level of hierarchy.Among other data-driven approaches, neural network(NN)-based techniques14 are very popular. In a lifeestimation technique for aircraft actuators,15 an NNhas been used for mapping different flight regimes forin-flight aircraft engine fault diagnosis. A hybrid data-driven method involving NN and genetic algorithm(GA) was proposed in Kobayashi and Simon.16 Aregression-based approach was used for detectinganomalies in aircraft performance during cruiseflight.17
One of the main aspects of the symbolic dynamicfiltering (SDF)-based method, adopted in this article,is semantic representation of sensor data, irrespectiveof modality and other sensor-specific characteristics,where the patterns are represented by probabilisticfinite state automata (PFSA). This approach facili-tates feature-level fusion of non-homogeneous sensorsand possibly other forms of information (e.g. pilot’sexperience and results of other case studies as seman-tic information); however, this article focuses onsensor fusion for fault detection in aircraft gas turbineengines. The fusion algorithms are derived based on asemantic framework for feature extraction and patternclassification. To handle a large volume of data in real
time, a hierarchical framework for information fusionis proposed that progressively leads from machinerepresentations of observed data to fault classifica-tion. Quantitative values of cross-dependence betweendifferent pairs of sensor observations are used in thefusion algorithm to reduce loss of information.
Deterioration in engine performance usually occursdue to two reasons: (i) natural deterioration, i.e. grad-ual degradation of engine components due to wearand usage, and (ii) relatively more rapid faults, i.e.abrupt deterioration of turbo machineries due toanticipated events. Therefore, an effective fault detec-tion scheme must be able to distinguish between thefaults and usual gradual degradation of a component;this is necessary to reduce the false alarm rate. Thisarticle attempts to address this issue by normaldegradation/fault class assignment within the generalframework of data-driven fault detection. In addition,the usage of semantic sensor fusion leads to: (i) devel-opment of a hierarchical decision engine, and (ii) for-mulation of an optimal sensing system strategy forfault detection in gas turbine engines.
The article is organized in five sections includingthe present one. Section ‘Description of theC-MAPSS simulation test bed and test scenarios’describes the C-MAPSS test bed.1 Section ‘Semanticframework for multi-sensor data interpretation andfusion’ explains the hierarchical framework of multi-sensor data interpretation and fusion. Section ‘Resultsand discussion’ presents the results of case studiesto validate the proposed method on the C-MAPSStest bed. Finally, the article is summarized and con-cluded in the final section with recommendations offuture work.
Description of the C-MAPSS simulationtest bed and test scenarios
This section presents the C-MAPSS test bed andsimulates two test scenarios. While Scenario Iaddresses the problem of distinguishing a fault fromnatural degradation in a single component, ScenarioII addresses the problem of simultaneous faults inmultiple-component faults. The C-MAPSS simulationtest bed1 was developed at NASA for a typicalcommercial-scale two-spool turbofan engine and itscontrol system. Figure 1 shows the schematic diagramof a commercial aircraft gas turbine engine used in theC-MAPSS simulation test bed.
The engine under consideration produces a thrustof approximately 400,000 N and is designed foroperation at altitude (A) from the sea level (i.e. 0 m)up to 12,200 m, Mach number (M) from 0 to 0.90,and temperatures from approximately �50 �C toþ50 �C. The throttle resolving angle (TRA) can beset to any value in the range between 0� at the min-imum power level and 100� at the maximum powerlevel. The gas turbine engine system consists of fivemajor rotating components, namely, fan (F), low
Sarkar et al. 1989

pressure compressor (LPC), high pressure compressor(HPC), high pressure turbine (HPT), and low pressureturbine (LPT), as seen in Figure 1. Apart from therotating components, three actuators are modeled inthe simulation test bed, namely, Variable Stator Vane(VSV), Variable Bleed Valve (VBV), and Fuel Pump(FP) that controls the fuel flow rate (Wf).
Given the inputs of TRA, A and M, the inter-actively controlled component models in the simula-tion test bed compute nonlinear dynamics of real-time
turbofan engine operation. A gain-scheduled controlsystem is incorporated in the engine system, whichconsists of speed controllers and limit regulators forengine components.
Out of the different types of sensors (e.g. pressure,temperature and shaft speed) used in the C-MAPSSsimulation test bed, Table 1 lists those sensors that arecommonly adopted in the Instrumentation andControl system of commercial aircraft engines, asseen in Figure 2.
In the current configuration of the C-MAPSSsimulation test bed, there are 13 component levelhealth parameter inputs, namely, efficiency param-eters ( ), flow parameters (�) and pressure ratio modi-fiers, that simulate the effects of faults and/ordegradation in the engine components. Ten, out ofthese 13 health parameters, are selected to modify effi-ciency (�) and flow (�) that are defined16 as:
. � X Ratio of actual enthalpy and ideal enthalpychanges.
. � X Ratio of rotor tip and axial fluid flowvelocities.
For the engine’s five rotating components F, LPC,HPC, LPT and HPT, the five pairs (i.e. ten) respectiveefficiency and flow health parameters are: ( F, �F),( LPC, �LPC), ( HPC, �HPC), ( HPT, �HPT) and( LPT, �LPT). An engine component C is consideredto be in the nominal condition if both C and �C areequal to 1 and fault can be injected in the componentC by reducing the values of C and/or �C. For exam-ple, HPC¼ 0.98 signifies a 2% relative loss in effi-ciency of HPC. Actuator faults can also be injectedthrough the scale shift parameters for the three actu-ators, VSV, VBV and Wf.
Scenario I: Case study of natural deteriorationversus faults in a single component
In the context of gas path health monitoring of air-craft engines, two types of changes in engine
Figure 2. Schematic diagram of the C-MAPSS engine model with sensors.
LPC: low pressure compressor; HPC: high pressure compressor; LPT: low pressure turbine; HPT: high pressure turbine.
Figure 1. Gas turbine engine schematic.1
LPC: low pressure compressor; HPC: high pressure compres-
sor; LPT: low pressure turbine; HPT: high pressure turbine.
Table 1. Sensor suite for the engine system.
Sensors Description
T24 LPC exit/ HPC inlet temperature
Ps30 HPC exit static pressure
T48 HPT exit temperature
P50 LPT exit pressure
Nf Fan spool speed
Nc Core spool speed
LPC: low pressure compressor; HPC: high pressure compressor; HPT:
high pressure turbine; LPT: low pressure turbine.
1990 Proc IMechE Part G: J Aerospace Engineering 227(12)

performance are considered: (i) natural deterioration,i.e. gradual degradation of engine components dueto wear and usage and (ii) rapid faults, i.e. relativelyabrupt degradation of turbo-machinery compo-nent(s). The fault detection method identifies thehealth status of an engine component at a particulartime epoch, where faults need to be distinguishedfrom the usual gradual degradation of a component.However, to achieve this goal, the health status mustbe monitored over several such epochs. Given a tem-poral profile of the health status identified by thecurrent method, the task is to distinguish faultsfrom the natural degradation. Typically, the healthof an engine deteriorates at a relatively slow rate fornatural degradation while a fault is the cause of arelatively more rapid change in the health statusor degradation at a comparatively faster rate.Therefore, the gas path health management systemneeds to be designed to perform both functions: (1)estimation and trend monitoring of all engine healthparameters over the lifetime of the engine; and (2)detection of rapid performance changes to isolate theroot cause. In this section, representative simulationstudies are performed to validate the capability ofthe proposed methodology of distinguishing thenormal deterioration from faults for a given usageinformation. Moreover, the performance of theentire (typical) sensor suite is examined over thespectrum of faults in the engine components andactuators. Such an investigation is expected to poten-tially lead to construction of an optimal sensor suiteand a hierarchical procedure of fault detection andisolation.
In the case study, the engines under considerationare assumed to have undergone 1000 flight cycles.Therefore, components of a nominal engine of thistype may degrade to some extent from the ideal con-dition. A stochastic damage model has been con-structed and incorporated in the C-MAPSSTransient Test-case Generator18 (developed byNASA), based on the experimental data for trendingthe natural deterioration of the engine components.The plots in Figure 3 are typical outcomes of themodel, which show the natural degradation profilesof efficiency health parameters for the five rotatingcomponents of the engine (similar profiles can be gen-erated for the flow health parameters). For example,the performance of an engine after K cycles of flightcould be considered as nominal if the changes inhealth parameters are within the maximum degrad-ation limits calculated by the model after K cycles.Hence, for the nominal data samples of engine oper-ation, health parameters of the rotating componentsare assumed to be within the prescribed ranges in auniformly random fashion. Three actuators, VariableStator Vane (VSV), Variable Bleed Valve (VBV) andFuel Flow Rate (Wf), are assumed to be in idealhealth conditions for a nominally operating engineafter 1000 cycles.
Although injection of rapid/abrupt faults isdescribed in the transient test-case generator code,18
it is explained in this article for completeness. For allfive rotating components, faults exhibit random mag-nitudes (Fm) and a random health parameter ratio(HPR). While Fm and HPR directly determines thechange in efficiency health parameter (C) of a com-ponent C, a change in the flow health parameter �C isdetermined by HPR for a given perturbation in C.Formally, the following two relations are used.
� C¼ �
Fmffiffiffiffiffiffiffiffiffiffiffiffiffiffiffiffiffiffiffiffiffi1þHPR2p and ��C ¼ � C
�HPR ð1Þ
where � Cand ��C denote the changes in C and �C,
respectively.In the case study, fault magnitude (Fm) follows a
random uniform distribution ranging from 1 to 7.Health parameter ratios (HPR) for Fan, LPC andHPC are uniformly distributed between 1.0 and 2.0,whereas HPRs for HPT and LPT are uniformly dis-tributed between 0.5 and 1.0. The changes in healthparameters occur from certain base values of C and�C. For the present example, base values are taken asthe health parameters due to maximum possible nat-ural degradation after 1000 flight cycles. So far theactuator faults are concerned, only those due toscale shift are considered in this example. Theranges for random uniformly distributed scale shiftmagnitudes (Sm(A) for actuator A) are: (i) 1% to7% for Sm(VSV), (ii) 1% to 19% for Sm(VBV) and(iii) 1% to 7% for Sm(Wf). Please see Armstrong18 fordetail reasons behind the above parameter choices.
There are 9 health condition classes considered forthis study. Apart from the nominal class, 8 faultclasses signify (single) faults in 5 rotating componentsand 3 actuators. One hundred samples are generated
Figure 3. Natural efficiency degradation profiles for rotating
components.
LPC: low pressure compressor; HPC: high pressure compres-
sor; LPT: low pressure turbine; HPT: high pressure turbine.
Sarkar et al. 1991
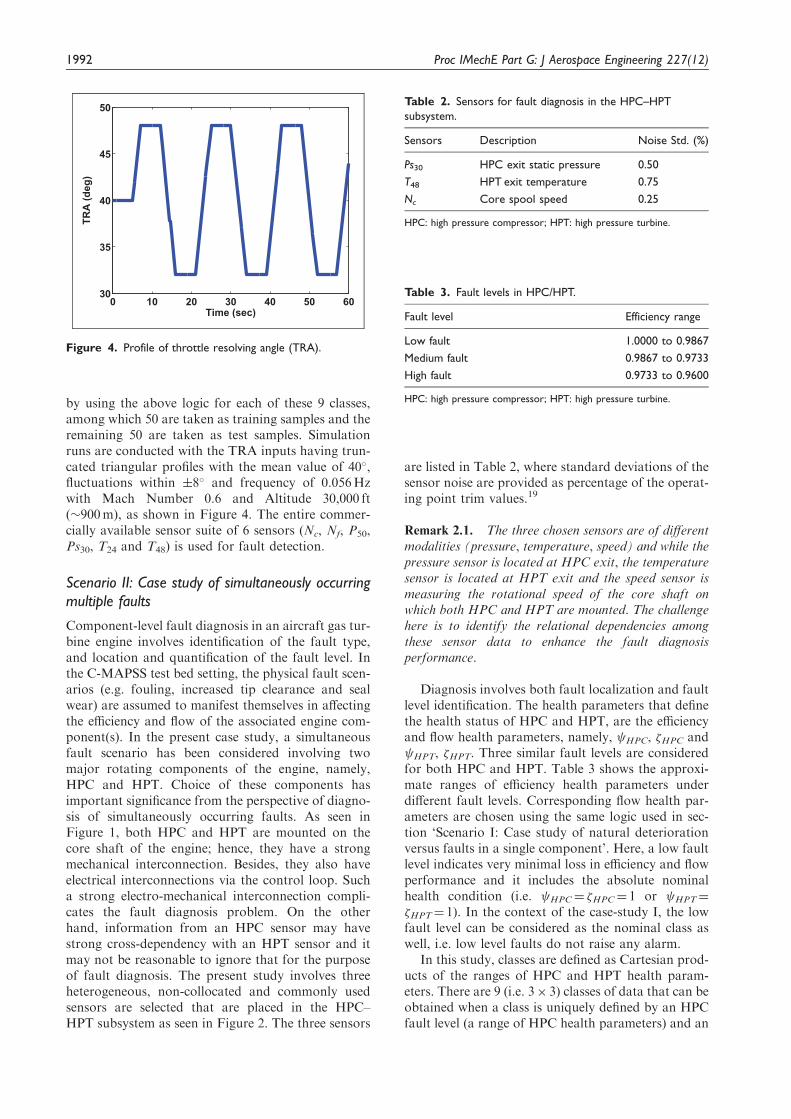
by using the above logic for each of these 9 classes,among which 50 are taken as training samples and theremaining 50 are taken as test samples. Simulationruns are conducted with the TRA inputs having trun-cated triangular profiles with the mean value of 40�,fluctuations within �8� and frequency of 0.056Hzwith Mach Number 0.6 and Altitude 30,000 ft(�900m), as shown in Figure 4. The entire commer-cially available sensor suite of 6 sensors (Nc, Nf, P50,Ps30, T24 and T48) is used for fault detection.
Scenario II: Case study of simultaneously occurringmultiple faults
Component-level fault diagnosis in an aircraft gas tur-bine engine involves identification of the fault type,and location and quantification of the fault level. Inthe C-MAPSS test bed setting, the physical fault scen-arios (e.g. fouling, increased tip clearance and sealwear) are assumed to manifest themselves in affectingthe efficiency and flow of the associated engine com-ponent(s). In the present case study, a simultaneousfault scenario has been considered involving twomajor rotating components of the engine, namely,HPC and HPT. Choice of these components hasimportant significance from the perspective of diagno-sis of simultaneously occurring faults. As seen inFigure 1, both HPC and HPT are mounted on thecore shaft of the engine; hence, they have a strongmechanical interconnection. Besides, they also haveelectrical interconnections via the control loop. Sucha strong electro-mechanical interconnection compli-cates the fault diagnosis problem. On the otherhand, information from an HPC sensor may havestrong cross-dependency with an HPT sensor and itmay not be reasonable to ignore that for the purposeof fault diagnosis. The present study involves threeheterogeneous, non-collocated and commonly usedsensors are selected that are placed in the HPC–HPT subsystem as seen in Figure 2. The three sensors
are listed in Table 2, where standard deviations of thesensor noise are provided as percentage of the operat-ing point trim values.19
Remark 2.1. The three chosen sensors are of differentmodalities (pressure, temperature, speed) and while thepressure sensor is located at HPC exit, the temperaturesensor is located at HPT exit and the speed sensor ismeasuring the rotational speed of the core shaft onwhich both HPC and HPT are mounted. The challengehere is to identify the relational dependencies amongthese sensor data to enhance the fault diagnosisperformance.
Diagnosis involves both fault localization and faultlevel identification. The health parameters that definethe health status of HPC and HPT, are the efficiencyand flow health parameters, namely, HPC, �HPC and HPT, �HPT. Three similar fault levels are consideredfor both HPC and HPT. Table 3 shows the approxi-mate ranges of efficiency health parameters underdifferent fault levels. Corresponding flow health par-ameters are chosen using the same logic used in sec-tion ‘Scenario I: Case study of natural deteriorationversus faults in a single component’. Here, a low faultlevel indicates very minimal loss in efficiency and flowperformance and it includes the absolute nominalhealth condition (i.e. HPC¼ �HPC¼ 1 or HPT¼
�HPT¼ 1). In the context of the case-study I, the lowfault level can be considered as the nominal class aswell, i.e. low level faults do not raise any alarm.
In this study, classes are defined as Cartesian prod-ucts of the ranges of HPC and HPT health param-eters. There are 9 (i.e. 3� 3) classes of data that can beobtained when a class is uniquely defined by an HPCfault level (a range of HPC health parameters) and an
Figure 4. Profile of throttle resolving angle (TRA).
Table 2. Sensors for fault diagnosis in the HPC–HPT
subsystem.
Sensors Description Noise Std. (%)
Ps30 HPC exit static pressure 0.50
T48 HPT exit temperature 0.75
Nc Core spool speed 0.25
HPC: high pressure compressor; HPT: high pressure turbine.
Table 3. Fault levels in HPC/HPT.
Fault level Efficiency range
Low fault 1.0000 to 0.9867
Medium fault 0.9867 to 0.9733
High fault 0.9733 to 0.9600
HPC: high pressure compressor; HPT: high pressure turbine.
1992 Proc IMechE Part G: J Aerospace Engineering 227(12)
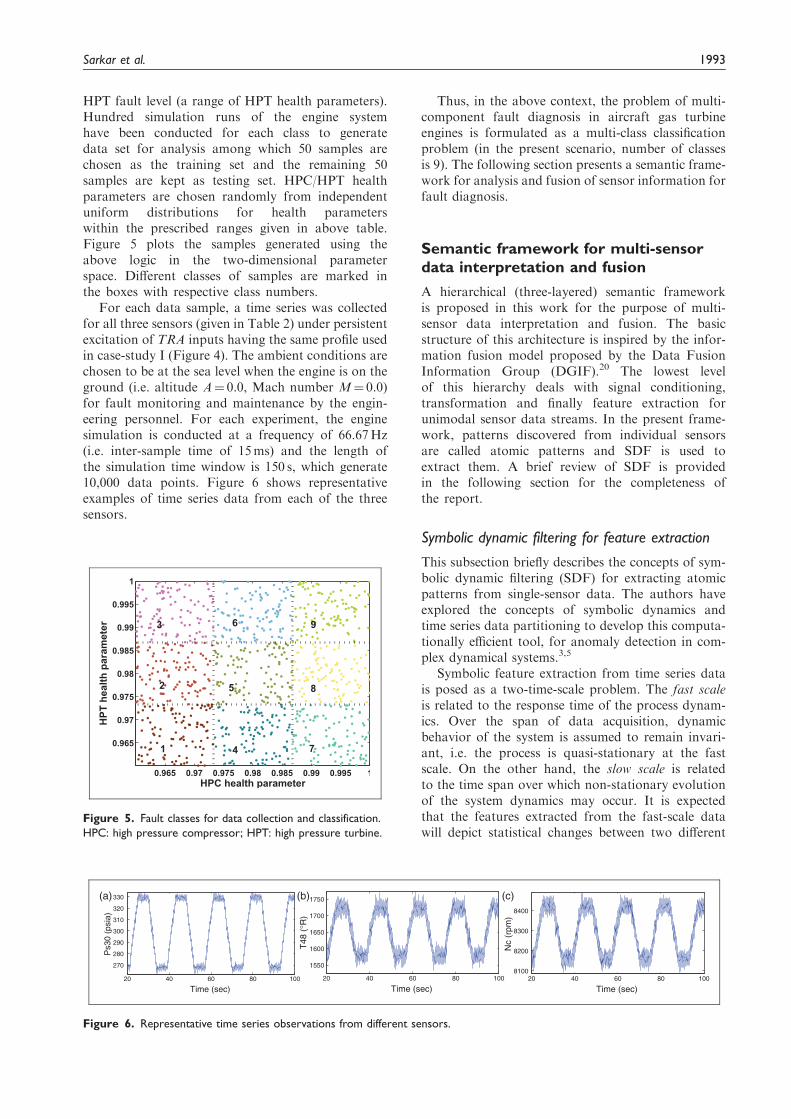
HPT fault level (a range of HPT health parameters).Hundred simulation runs of the engine systemhave been conducted for each class to generatedata set for analysis among which 50 samples arechosen as the training set and the remaining 50samples are kept as testing set. HPC/HPT healthparameters are chosen randomly from independentuniform distributions for health parameterswithin the prescribed ranges given in above table.Figure 5 plots the samples generated using theabove logic in the two-dimensional parameterspace. Different classes of samples are marked inthe boxes with respective class numbers.
For each data sample, a time series was collectedfor all three sensors (given in Table 2) under persistentexcitation of TRA inputs having the same profile usedin case-study I (Figure 4). The ambient conditions arechosen to be at the sea level when the engine is on theground (i.e. altitude A¼ 0.0, Mach number M¼ 0.0)for fault monitoring and maintenance by the engin-eering personnel. For each experiment, the enginesimulation is conducted at a frequency of 66.67Hz(i.e. inter-sample time of 15ms) and the length ofthe simulation time window is 150 s, which generate10,000 data points. Figure 6 shows representativeexamples of time series data from each of the threesensors.
Thus, in the above context, the problem of multi-component fault diagnosis in aircraft gas turbineengines is formulated as a multi-class classificationproblem (in the present scenario, number of classesis 9). The following section presents a semantic frame-work for analysis and fusion of sensor information forfault diagnosis.
Semantic framework for multi-sensordata interpretation and fusion
A hierarchical (three-layered) semantic frameworkis proposed in this work for the purpose of multi-sensor data interpretation and fusion. The basicstructure of this architecture is inspired by the infor-mation fusion model proposed by the Data FusionInformation Group (DGIF).20 The lowest levelof this hierarchy deals with signal conditioning,transformation and finally feature extraction forunimodal sensor data streams. In the present frame-work, patterns discovered from individual sensorsare called atomic patterns and SDF is used toextract them. A brief review of SDF is providedin the following section for the completeness ofthe report.
Symbolic dynamic filtering for feature extraction
This subsection briefly describes the concepts of sym-bolic dynamic filtering (SDF) for extracting atomicpatterns from single-sensor data. The authors haveexplored the concepts of symbolic dynamics andtime series data partitioning to develop this computa-tionally efficient tool, for anomaly detection in com-plex dynamical systems.3,5
Symbolic feature extraction from time series datais posed as a two-time-scale problem. The fast scaleis related to the response time of the process dynam-ics. Over the span of data acquisition, dynamicbehavior of the system is assumed to remain invari-ant, i.e. the process is quasi-stationary at the fastscale. On the other hand, the slow scale is relatedto the time span over which non-stationary evolutionof the system dynamics may occur. It is expectedthat the features extracted from the fast-scale datawill depict statistical changes between two different
20 40 60 80 100
270
280
290
300
310
320
330(a) (b) (c)
Time (sec)
Ps3
0 (p
sia)
20 40 60 80 100
1550
1600
1650
1700
1750
Time (sec)
T48
(°R
)
20 40 60 80 1008100
8200
8300
8400
Time (sec)
Nc
(rpm
)
Figure 6. Representative time series observations from different sensors.
Figure 5. Fault classes for data collection and classification.
HPC: high pressure compressor; HPT: high pressure turbine.
Sarkar et al. 1993
slow-scale epochs if the underlying system has under-gone a change. The method of extracting featuresfrom stationary time series data is comprised of thefollowing steps.
. Sensor time series data, generated from a physicalsystem or its dynamical model, are collected at aslow-scale epoch and let it be denoted as q. Acompact (i.e. closed and bounded) region �2R
n,where n2N, within which the stationary timeseries is circumscribed, is identified. Let thespace of time series data sets be represented asS �R
n�T, where T2N is sufficiently large for con-vergence of statistical properties within a specifiedthreshold. While n represents the dimensionalityof the time-series, T is the number of datapoints in the time series. Then, {s}2S denotes atime series at the slow-scale epoch of datacollection.
. Encoding of � is accomplished by introducing apartition B X {B0, . . . ,B(W�W�1)} consisting of W�Wmutually exclusive (i.e. Bj\Bk¼; 8j 6¼ k), andexhaustive (i.e. [j�j�1j¼0 Bj ¼ �) cells, where eachcell is labeled by symbols �j2� and�¼ {�0, . . . , � W�W�1} is called the alphabet. Thisprocess of coarse graining can be executed byuniform, maximum entropy, or any other schemeof partitioning. Then, the time series datapoints that visit the cell Bj are denoted as �j8j¼ 0, 1, . . . , W�W� 1. This step enables transform-ation of the time series data {s} to a symbolsequence {s}, consisting of the symbols �j in thealphabet �.
. A probabilistic finite state automata (PFSA),is then constructed. The PFSA consideredin this framework is known as D-Markovmachine.3 Formally, a state in a D-Markovmachine is a symbol sequence of length D.Q¼ {q1, q2, . . . , qW�WD} is the state set correspond-ing to symbol sequence {s}. States represent allpossible words of length D, using the symbolalphabet.
For a suite of N sensors collecting data, eachsensor time series is symbolized and the set ofstates is constructed as described above. Let thesets of symbols describing the N data setsbe denoted as �1, . . . ,�N respectively and thecorresponding D-Markov states are denoted asQ1, . . . ,QN.
Definition 3.1 (D-Markov) A D-Markov machine3
with depth D(5 1) is defined for the product space ofall sensor time-series as a 4-tuple M¼
4ðQ
p,�p, �, ~�Þsuch that:
. �P¼�1��2� ��� ��N. Where, �i ¼ f�
0i , . . . ,
�j�ij�1i g is the alphabet set of symbol sequence from
the ith sensor.
. QP¼Q1�Q2� ��� �QN. Where, Qi ¼ fq
1i , q
2i , . . . ,
qj�ijD
i g is the state set corresponding to symbolsequence from the ith sensor. States represent allpossible words of length D, using the symbol alpha-bet �P.
. � : QP��P
!QP is the state transition mapping
that maps the transition in a symbol sequence fromone state to another upon arrival of a symbol fromeach sensor.
. ~� is the symbol generation matrix of size WQPW� W�PW
and encodes the Markovian nature of the data bydescribing the probability of obtaining a symbol(for each sensor) � 2�P conditioned on currentstate of the system q2QP. In other words, elementsof ~� are the probabilities P(�12�1, �22�2, . . . ,�N2�NWq12Q1, q22Q2, . . . , qN2QN)
The D-markov PFSA described above is essentiallya joint representation of the symbols (�P) observedconditioned on the product space of states (QP).However, for most applications, this method suffersfrom curse of dimensionality. The size of the productspaces of states and symbols is prohibitively large forany meaningful estimation of ~�.
Let L¼ {L1, L2, . . . ,LN} be the universal set ofatomic patterns. The atomic pattern library L is setof modal footprints identified from individual sensingmodalities for various fault classes. Given the atomicpattern library, a popular framework for addressinginformation fusion is what is called the set-theoreticapproach. In this framework, higher level patterns orcontexts are modeled as subsets of L. Thus a compos-ite pattern, resulting from fusion of atomic patterns, isa collection of elements from L and the compositepattern library L* 2L. The disadvantage of thisapproach is that it considers only modal footprintsfor constructing composite patterns as a bag ofatomic patterns; relational dependencies, if any,between patterns are disregarded. However, the rela-tional dependencies should not be ignored for manyproblems in practice, e.g. in the present problem offault diagnosis of simultaneously degrading electro-mechanically connected aircraft engine components.Therefore, a hierarchical semantic framework formulti-sensor data interpretation and fusion is pro-posed that involves a common approach to informa-tion fusion going from one level to another and toinclude relational dependencies for composite patternrepresentation. Thus, the middle layer deals with therelational dependencies among atomic patterns, whererelationships are modeled as the cross-dependenciesamong data streams from different sensors. Thecross-dependencies are discovered via relationalPFSA that essentially capture the dynamics of statetransition in one symbol sequence (obtained from onesensor) corresponding to a symbol appearance in thesecond symbol sequence (obtained from anothersensor). The relational patterns provide symbol-level
1994 Proc IMechE Part G: J Aerospace Engineering 227(12)

cross-dependencies between modalities that areexploited to reduce information loss. While theatomic patterns and relational patterns are con-structed based on sensor data on the fast time scale,they are combined to form composite patterns thatare labeled at individual epochs on the slow timescale.
Finally, the top layer consists of higher level com-posite patterns (CP) that will be represented asdigraphs where the atomic patterns (AP) are modeledas nodes and dependencies between nodes are mod-eled as relational patterns (RP). A formal definition isas follows:
Definition 3.2 (Composite pattern representation) LetL¼ {L1, L2, . . . ,LN} be the atomic pattern library. LetL*� 2L be the set of allowable primitives for a class.Then a composite pattern library Hr ¼ fHr
1,Hr2, . . . ,
HrMg where a composite pattern Hr
i is digraphHr
i ¼ ðLVi, EViÞ; LVi
L with the index set Vi {1,2, . . . ,N} and Ei¼ {RjkWj, k2Vi�Vi} is a set of rela-tional PFSAs. The digraph representation is illustratedin Figure 7.
The relational probabilistic finite state automata(PFSA) are discovered using xD-Markov machineconstruction to determine cross-dependence; the algo-rithm is described in the following section.
Construction of relational PFSA: XD-Markovmachine
This subsection describes the construction ofxD-Markov machines from two symbol sequences{s1} and {s2} obtained from two different sensors (pos-sibly of different modalities) to capture the symbol levelcross-dependence. A formal definition is as follows:
Definition 3.3 (xD-Markov) Let M1 and M2 be thePFSAs corresponding to symbol streams {s1} and {s2},
respectively. Then a xD-Markov machine is defined as a5-tupleM1!2¼
4ðQ1,�1,�2, �1, ~�12Þ such that:
. �1¼ {�0, . . . , � W�1W�1} is the alphabet set of symbol
sequence {s1}. Q1 ¼ fq1, q2, . . . , q
j�jD11
g is the state set correspond-ing to symbol sequence {s1}, where D1 is the depthfor {s1}
. �2¼ {�0, . . . , � W�2W�1} is the alphabet set of symbol
sequence {s2}. �1 : Q1��1!Q1 is the state transition mapping
that maps the transition in symbol sequence {s1}from one state to another upon arrival of a symbolin {s1}
. ~�12 is the symbol generation matrix of sizeWQ1W� W�2W; the ijth element of ~�12 denotes the prob-ability of finding jth symbol in {s2} while making atransition from ith state in the symbol sequence {s1}
In practice, ~�12 is reshaped into a vector of lengthWQ1W� W�2W and is treated as the extracted featurevector that is a low-dimensional representation of therelational dependence between {s1} and {s2}. This fea-ture vector is called a relational pattern (RP). Figure 7schematically describes the basic concept of thexD-Markov machine. Note, a RP between twosymbol sequences is not necessarily symmetric; there-fore, RPs need to be identified for both directions.Also, when both symbol sequences are same, the rela-tional patterns are essentially the atomic pattern cor-responding to the symbol sequence; i.e. xD-Markovmachine reduces to a simple D-Markov machine.
The set-theoretic approach falls at one end of thespectrum of information fusion; here all relationshipsare excluded and any fusion is solely done in thedecision-theoretic sense, where the presence (orabsence) of one or more footprints can be used toestimate the probability of the fault class under con-sideration. The other end of the spectrum is to fusedata at the lowest level and construct machines(PFSAs) working in the product space of all sensors.This approach would be able extract modal dependen-cies before they are lost when constructing separatemachines for individual sensor or modalities. Butworking in the product space has the danger of statespace explosion especially if the sensors and sensingmodalities are numerous, as in the case of an aircraftengine equipped with a large number of sensors.
The proposed approach is a trade-off between thetwo ends of the spectrum and attempts to includerelational dependencies between sensing modalities,while keeping it tractable for a practical application.The hierarchical structure ensures that composite pat-terns are identified only when its constituting units atthe lower level have been observed. The currentframework constructs relations, taken only two at atime; identification of relations among higher ordercliques is a topic of future work.
AP1
AP3
AP2
a a b c c c b b a a a …..0 0 0 1 2 2 1 1 1 0 2 …..
RP12
RP21
RP23
RP32
RP13RP31
Figure 7. Composite pattern digraph.
Sarkar et al. 1995

Results and discussion
This section presents the results obtained from thetwo case studies by applying the semantic frameworkof sensor fusion. For pattern classification applica-tions, a time-series from the reference class is parti-tioned using a partitioning schemes (e.g. uniformpartitioning (UP) or maximum entropy partitioning(MEP)).3,5,21 Then, using the steps described before,a low-dimensional feature is constructed for the refer-ence class. Similar features can be extracted fromtime-series data of all classes using the same partition-ing. Finally a classifier is trained using features ofdifferent classes extracted from training data andcan be used to classify the features from test dataset. There are plenty of choices available for designof both parametric and non-parametric classifiers inBishop22 and Duda et al.23 Among the parametrictype of classifiers, one of the most common techniquesis to consider up to two orders of statistics in thefeature space. In other words, the mean feature iscalculated for every class along with the variance ofthe feature space distribution in the training set. Then,a test feature vector is classified by using theMahalanobis distance24 or the Bhattacharya dis-tance25 of the test vector from the mean featurevector of each class. However, these methods lack inefficiency if the feature space distribution cannot bedescribed by second order statistics (i.e. non-Gaussianin nature). In the present context, Gaussian featurespace distribution cannot be ensured due to the non-linear nature of the partitioning feature extractiontechnique. Therefore, a non-parametric classifier,such as the k-NN classifier may a better candidatefor this study22,23; however, in general, any other suit-able classifier, such as the support vector machines(SVM) or the Gaussian mixture models (GMM)may also be used.
Validation results for Scenario I
Pertinent fault detection results for the problemdescribed in Scenario I is presented in this subsection.For data partitioning, maximum entropy partitioningis used with alphabet size, W�W¼ 5 for all six sensors(although alphabet size does not need to be thesame for different sensors). The depth for constructingPFSA states3 is taken to be, D¼ 1 for both atomicand relational pattern construction and features areclassified by a k-NN classifier (with k¼ 5) using theEuclidean distance metric. Table 4 provides the clas-sification errors corresponding to all atomic and rela-tional patterns. The cross-dependence direction isfrom Sensor 1 to Sensor 2 in the table. Hence, thediagonal elements represent the classification errorpercentages corresponding to the atomic patterns,where as the off-diagonal elements represent the clas-sification error percentages corresponding to the rela-tional patterns.
It is observed from Table 5 that the relational pat-terns are able to extract useful information from theperspective of fault diagnosis, which is physicallymeaningful due to the strong electro-mechanical inter-connections among the rotating components and theactuators. Therefore, ignoring these cross-dependen-cies should affect the fault detection results. Finally allthe patterns are concatenated to construct the overallcomposite pattern. The classification error on the testdata set using the composite pattern is found to be 2%and the corresponding confusion matrix is givenbelow. In a confusion matrix C, element Cij denotesthe frequency of classifying test sample from class i asa sample from class j.
CAlltest ¼
1 2 3 4 5 6 7 8 9
1 50 0 0 0 0 0 0 0 0
2 0 48 0 0 0 0 0 2 0
3 0 0 50 0 0 0 0 0 0
4 0 0 0 50 0 0 0 0 0
5 0 0 0 0 50 0 0 0 0
6 0 0 0 0 0 50 0 0 0
7 0 0 0 0 0 0 50 0 0
8 0 0 0 0 0 0 6 44 0
9 0 0 0 0 0 0 0 1 49
0BBBBBBBBBBBBBBBBBBBBB@
1CCCCCCCCCCCCCCCCCCCCCA
The above exercise is adequate while treating theengine as a black-box and using all sensors blindly forfault detection. However, deeper questions regardingrelationships among fault locations and sensor loca-tions or the optimal sensor-suite still remain. Thesetwo issues are briefly discussed in the sequel.
Building a hierarchical decision engine. From the physicalunderstanding of the engine model, it is clear thatthere may be variation in sensitivity of different sen-sors to different fault conditions (locations). Forexample, detection accuracy (false alarm) for faults
Table 4. Comparison of classification error percentages using
atomic and relational patterns on test data set (50� 9 samples);
Cross-dependence direction: Sensor 1! Sensor 2.
Sensor 2
Nc Nf P50 Ps30 T24 T48
Sensor 1 Nc 26.22 17.78 16.89 7.11 2.89 5.78
Nf 19.33 43.56 49.78 12.44 21.11 14.44
P50 12.00 50.22 52.00 34.22 28.44 29.78
Ps30 7.56 10.89 32.22 23.78 16.00 15.33
T24 4.22 17.78 29.78 14.22 43.78 26.44
T48 8.00 15.78 33.78 5.11 18.67 34.44
1996 Proc IMechE Part G: J Aerospace Engineering 227(12)
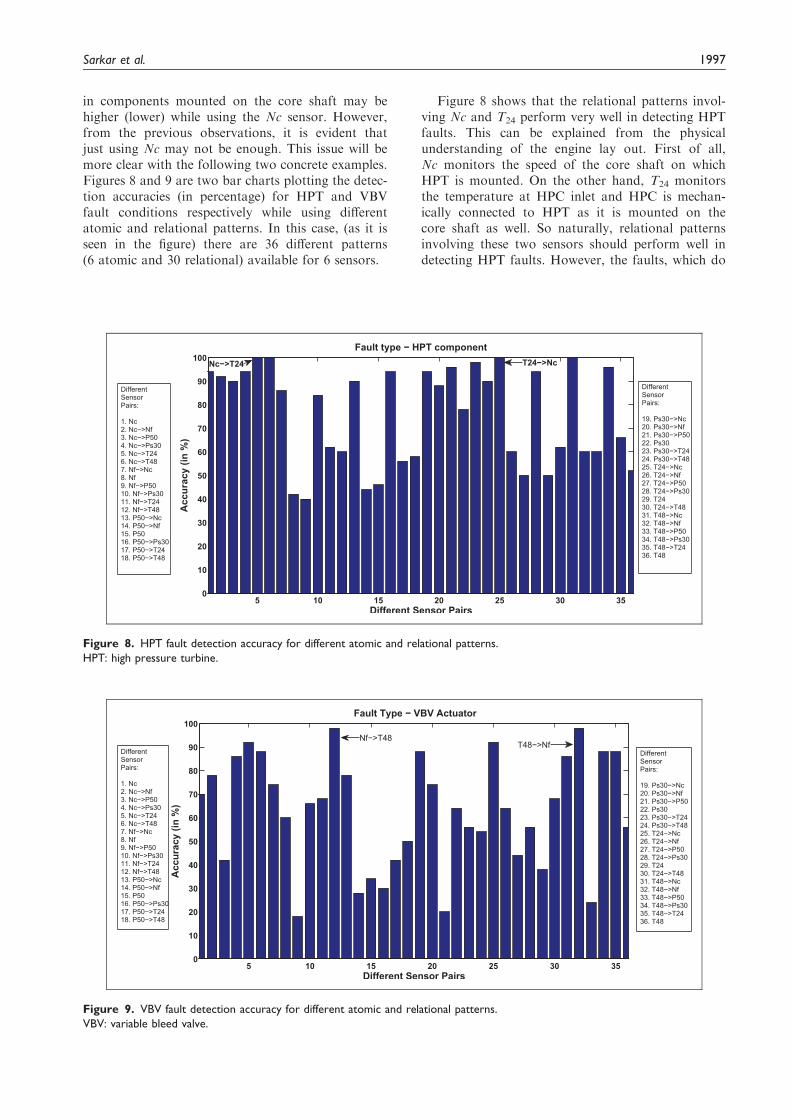
in components mounted on the core shaft may behigher (lower) while using the Nc sensor. However,from the previous observations, it is evident thatjust using Nc may not be enough. This issue will bemore clear with the following two concrete examples.Figures 8 and 9 are two bar charts plotting the detec-tion accuracies (in percentage) for HPT and VBVfault conditions respectively while using differentatomic and relational patterns. In this case, (as it isseen in the figure) there are 36 different patterns(6 atomic and 30 relational) available for 6 sensors.
Figure 8 shows that the relational patterns invol-ving Nc and T24 perform very well in detecting HPTfaults. This can be explained from the physicalunderstanding of the engine lay out. First of all,Nc monitors the speed of the core shaft on whichHPT is mounted. On the other hand, T24 monitorsthe temperature at HPC inlet and HPC is mechan-ically connected to HPT as it is mounted on thecore shaft as well. So naturally, relational patternsinvolving these two sensors should perform well indetecting HPT faults. However, the faults, which do
Figure 8. HPT fault detection accuracy for different atomic and relational patterns.
HPT: high pressure turbine.
Figure 9. VBV fault detection accuracy for different atomic and relational patterns.
VBV: variable bleed valve.
Sarkar et al. 1997

not affect the outputs of Nc and T24 sensors, arenot expected to be detected by the respective rela-tional patterns. Therefore, it is necessary to selectappropriate sensors for detection of faults of differ-ent types.
In the second example, as shown by Figure 9, rela-tional patterns involving Nf and T48 perform verywell in detecting variable bleed valve (VBV) faults.VBV is used to control the pressure of the gas flowingfrom LPC to HPC. It is a modulating valve andactuator assembly that bleeds off excess air to theatmosphere as necessary to prevent turbine surge.Therefore, it is natural that Nf, that monitors speedof fan shaft (LPC is mounted on the fan shaft) andT48, that monitors HPT exit temperature (VBV essen-tially prevents turbine surge) perform very well indetecting VBV faults.
The above discussion leads to the idea of building ahierarchical decision engine. In this framework, therewill be a hierarchical strategy of isolating the faultlocation by going through decisions made by sensorsets that are much smaller in size compared to the fullsensor suite. For example, (referring to the two exam-ples above) if patterns from Nc and T24 determine thata fault has occurred in VBV, decision confidence canbe enhanced based on the decision made by patternsfrom Nf and T48. And if the decision regarding thefault location is supported by the corresponding mostefficient sensor group, then the user does not need togo for investigating remaining patterns. Thus, thisprocedure can handle data from large sensor suites.However, another interesting question remains:Whether there exists an optimal sensor suite (smallerthan the full sensor suite) that performs well enoughin all fault conditions. This issue is discussed in thesequel.
Optimal sensor suite. Building a hierarchical decisionengine may be very useful when one has considerablephysical understanding of the system and the inter-connection characteristics among its sub-systems.This approach can also handle the issue of scalability.However, given a large volume of training data, it ispossible to identify an optimal sensor suite that per-forms well enough for all fault conditions. Although,this may require handling large dimensional compos-ite patterns all the time, it does not require muchinsight regarding the physics of the system. Here isan example optimization procedure for the currentproblem.
Let the detection accuracy (in fraction, i.e. variesfrom 0 to 1) of pattern P for a fault class i be denotedas Di(P) and the minimum allowable accuracy bedenoted as DT. With these notations, a pattern willbe called an optimal pattern P*, if it satisfies the fol-lowing condition
mini
DiðPÞ4DT ð2Þ
This is essentially placing a bound on the worst per-formance of a pattern. Therefore, the set of optimalpatterns {P*} will increase with decrease in the valueof DT. An alternate cost function may be the averageperformance of a pattern. In the present study, con-sidering DT¼ 0.85, one can obtain that three rela-tional patterns are optimal, namely Nc to T24, T24
to Nc and Nc to Ps30. The following confusionmatrix is obtained by using the three sensors involvedin these relational patterns. Note that to maintain thestructure of a composite pattern, all three atomic andsix relational patterns that are generated by thesethree sensors have been used.
COpttest ¼
1 2 3 4 5 6 7 8 9
1 50 0 0 0 0 0 0 0 0
2 0 48 0 0 0 0 0 2 0
3 0 0 50 0 0 0 0 0 0
4 0 0 0 50 0 0 0 0 0
5 0 0 0 0 50 0 0 0 0
6 0 0 0 0 0 50 0 0 0
7 0 0 0 0 0 0 49 1 0
8 0 0 0 0 0 0 2 48 0
9 0 0 0 0 0 0 0 1 49
0BBBBBBBBBBBBBBBBBBBBB@
1CCCCCCCCCCCCCCCCCCCCCA
The overall classification error is reduced from 2%to 1.33%, which is the consequence of leaving outquite a few non-optimal patterns that may be usefulfor detecting some other faults. This is somewhatcounterintuitive from an information theoretic pointof view as more patterns should provide more infor-mation. However, in the present classification setting,non-optimal patterns may incorporate more ambigu-ities in decision making.
Validation results for Scenario II
This subsection presents pertinent fault diagnosisresults for the Scenario II. The signal processing spe-cifications remains same as in Scenario I. For a par-ticular health parametric condition, three atomicpatterns are generated from three sensor observationsand six relational patterns are generated by extractingpairwise directed cross-dependencies. Finally all thepatterns are concatenated to construct the overallcomposite pattern. The classification error on thetest data set using the composite pattern is found tobe 11.56%. Similar to Table 4, Table 5 provides theclassification errors corresponding to all atomic andrelational patterns.
It is observed from the above table that the rela-tional patterns are able to extract useful informationfrom the perspective of fault diagnosis. The problemin the present study has been posed in such a way that
1998 Proc IMechE Part G: J Aerospace Engineering 227(12)
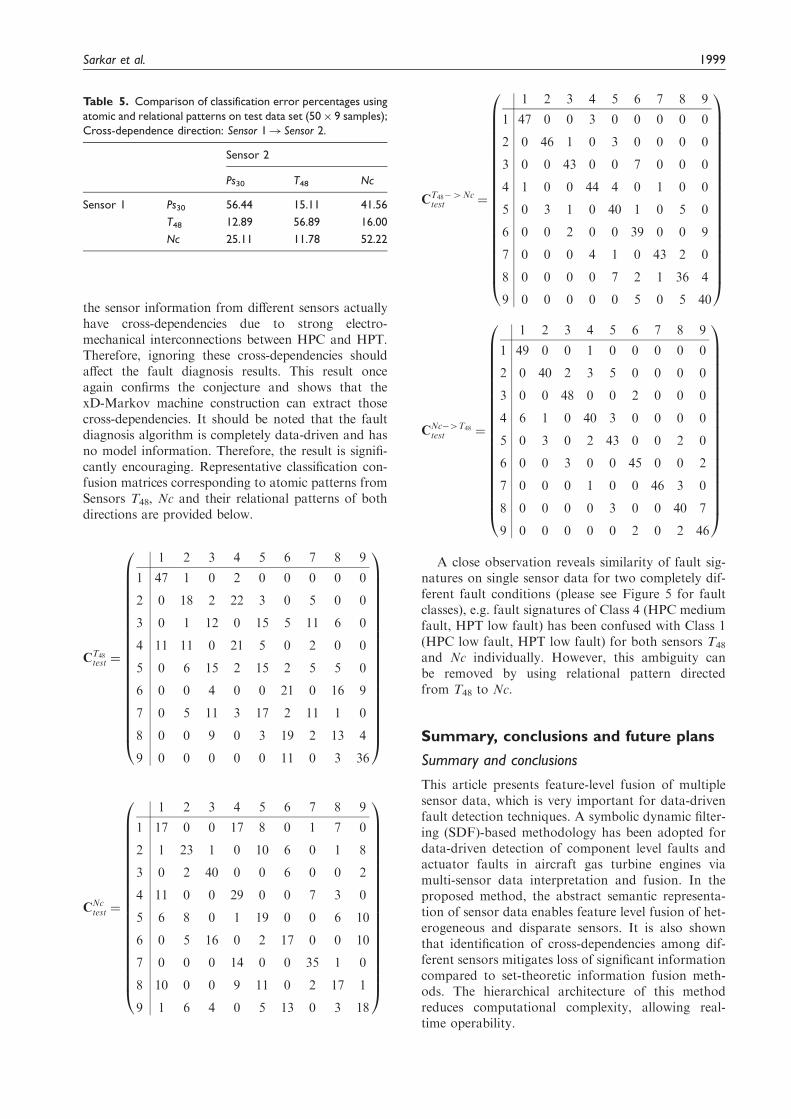
the sensor information from different sensors actuallyhave cross-dependencies due to strong electro-mechanical interconnections between HPC and HPT.Therefore, ignoring these cross-dependencies shouldaffect the fault diagnosis results. This result onceagain confirms the conjecture and shows that thexD-Markov machine construction can extract thosecross-dependencies. It should be noted that the faultdiagnosis algorithm is completely data-driven and hasno model information. Therefore, the result is signifi-cantly encouraging. Representative classification con-fusion matrices corresponding to atomic patterns fromSensors T48, Nc and their relational patterns of bothdirections are provided below.
CT48test ¼
1 2 3 4 5 6 7 8 9
1 47 1 0 2 0 0 0 0 0
2 0 18 2 22 3 0 5 0 0
3 0 1 12 0 15 5 11 6 0
4 11 11 0 21 5 0 2 0 0
5 0 6 15 2 15 2 5 5 0
6 0 0 4 0 0 21 0 16 9
7 0 5 11 3 17 2 11 1 0
8 0 0 9 0 3 19 2 13 4
9 0 0 0 0 0 11 0 3 36
0BBBBBBBBBBBBBBBBBBBBB@
1CCCCCCCCCCCCCCCCCCCCCA
CNctest ¼
1 2 3 4 5 6 7 8 9
1 17 0 0 17 8 0 1 7 0
2 1 23 1 0 10 6 0 1 8
3 0 2 40 0 0 6 0 0 2
4 11 0 0 29 0 0 7 3 0
5 6 8 0 1 19 0 0 6 10
6 0 5 16 0 2 17 0 0 10
7 0 0 0 14 0 0 35 1 0
8 10 0 0 9 11 0 2 17 1
9 1 6 4 0 5 13 0 3 18
0BBBBBBBBBBBBBBBBBBBBB@
1CCCCCCCCCCCCCCCCCCCCCA
CT48�4Nctest ¼
1 2 3 4 5 6 7 8 9
1 47 0 0 3 0 0 0 0 0
2 0 46 1 0 3 0 0 0 0
3 0 0 43 0 0 7 0 0 0
4 1 0 0 44 4 0 1 0 0
5 0 3 1 0 40 1 0 5 0
6 0 0 2 0 0 39 0 0 9
7 0 0 0 4 1 0 43 2 0
8 0 0 0 0 7 2 1 36 4
9 0 0 0 0 0 5 0 5 40
0BBBBBBBBBBBBBBBBBBBBB@
1CCCCCCCCCCCCCCCCCCCCCA
CNc�4T48test ¼
1 2 3 4 5 6 7 8 9
1 49 0 0 1 0 0 0 0 0
2 0 40 2 3 5 0 0 0 0
3 0 0 48 0 0 2 0 0 0
4 6 1 0 40 3 0 0 0 0
5 0 3 0 2 43 0 0 2 0
6 0 0 3 0 0 45 0 0 2
7 0 0 0 1 0 0 46 3 0
8 0 0 0 0 3 0 0 40 7
9 0 0 0 0 0 2 0 2 46
0BBBBBBBBBBBBBBBBBBBBB@
1CCCCCCCCCCCCCCCCCCCCCA
A close observation reveals similarity of fault sig-natures on single sensor data for two completely dif-ferent fault conditions (please see Figure 5 for faultclasses), e.g. fault signatures of Class 4 (HPC mediumfault, HPT low fault) has been confused with Class 1(HPC low fault, HPT low fault) for both sensors T48
and Nc individually. However, this ambiguity canbe removed by using relational pattern directedfrom T48 to Nc.
Summary, conclusions and future plans
Summary and conclusions
This article presents feature-level fusion of multiplesensor data, which is very important for data-drivenfault detection techniques. A symbolic dynamic filter-ing (SDF)-based methodology has been adopted fordata-driven detection of component level faults andactuator faults in aircraft gas turbine engines viamulti-sensor data interpretation and fusion. In theproposed method, the abstract semantic representa-tion of sensor data enables feature level fusion of het-erogeneous and disparate sensors. It is also shownthat identification of cross-dependencies among dif-ferent sensors mitigates loss of significant informationcompared to set-theoretic information fusion meth-ods. The hierarchical architecture of this methodreduces computational complexity, allowing real-time operability.
Table 5. Comparison of classification error percentages using
atomic and relational patterns on test data set (50� 9 samples);
Cross-dependence direction: Sensor 1! Sensor 2.
Sensor 2
Ps30 T48 Nc
Sensor 1 Ps30 56.44 15.11 41.56
T48 12.89 56.89 16.00
Nc 25.11 11.78 52.22
Sarkar et al. 1999

Scalability in terms of fault classes and number ofsensors is always a critical issue for data-driven meth-ods of fault diagnosis. The current algorithm is for-mulated generally enough to accommodate highnumber of fault classes possibly at the expense of alarger alphabet size and depth. On the other hand, thebasic hierarchical architecture of this frameworkallows a tractable solution to the problem of dealingwith a large number of sensors and mitigates theproblem of dimensionality explosion, becauseupward movements in the knowledge-base levelsmay occur only after the structure of the lowerlevels has been identified.
The fault detection method described in this arti-cle identifies the health status of an engine compo-nent at a given slow-scale epoch. In a real lifescenario, faults need to be distinguished from theusual gradual degradation of a component.Typically, the engine health deteriorates at a slowrate for usual degradation while a fault is character-ized by a relatively more rapid change in the healthstatus and/or degradation at a comparatively fasterrate. A method for distinguishing natural degrad-ation from faults has been developed on a data-driven framework.
Future research directions
Although the method presented in the report has beensuccessfully validated by execution on the C-MAPSStest bed, various operating conditions need to beinvestigated in real time for potential in-flight appli-cations. Apart from this important issue, the follow-ing research areas, specific to semantic sensor fusion,need to be validated on a real-life engine test bed.
. Development of algorithms to extract relationaldependencies among three or more symbolsequences.
. Exploration of other statistical analysis tools (e.g.Copula distribution26) as an alternative to extrac-tion of relational dependencies.
. Investigation of the effects of mis-synchronizationamong sensor observations on the proposedxD-Markov machine.
. Comparative evaluation of semantic informationfusion framework with other information fusiontechniques (e.g. Dempster-Shafer or Bayesian net-work) approaches.
. Construction of a Hierarchical Decision Engine toenhance successful detection and reduce false alarmrates while using a sensor suite.
. Identification of Optimal Sensor Suite (i.e. a smallnumber of strategically placed sensors) that canserve the purpose of system fault detection and iso-lation maximally.
. Fault Diagnosis during Take-off, Climb andLanding using C-MAPSS transient test case gener-ator model developed at NASA.18
Funding
This work has been supported in part by NASA under
Cooperative Agreement No. NNX07AK49A, by the U.S.Army Research Laboratory and the U.S. Army ResearchOffice under Grant No. W911NF-07-1-0376.
Acknowledgments
The authors acknowledge the benefits of discussion withDon Simon and Jeff Armstrong at NASA Glenn ResearchCenter. Any opinions, findings and conclusions or recom-
mendations expressed in this publication are those of theauthors and do not necessarily reflect the views of the spon-soring agencies.
References
1. Frederick DK, DeCastro JA and Litt JS. UserSsguide for the commercial modular aero-propulsionsystem simulation (C-MAPSS). NASA/TMU2007-
215026, October, 2007.2. Saxena A, Celaya J, Balaban E, et al. Metrics for eval-
uating performance of prognostic techniques. In:Proceedings of International Conference on Prognostics
and Health Management (PHM08). Denver, CO, USA,2008, pp.1–17.
3. Ray A. Symbolic dynamic analysis of complex systems
for anomaly detection. Signal Process 2004; 84(7):1115–1130.
4. Jin X, Gupta S, Mukherjee K, et al. Wavwlet-based
feature extraction using probabilistic finite state auto-mata for pattern classification. Pattern Recogn 2011;44(7): 1343–1356.
5. Rajagopalan V and Ray A. Symbolic time series ana-
lysis via wavelet-based partitioning. Signal Process2006; 86(11): 3309–3320.
6. Gupta S, Ray A and Keller E. Symbolic time ser-
ies analysis of ultrasonic data for early detection offatigue damage. Mech Syst Signal Process 2007; 21(2):866–884.
7. Rao C, Ray A, Sarkar S, et al. Review and comparativeevaluation of symbolic dynamic filtering for detectionof anomaly patterns. Signal, Image Video Process 2009;
3(2): 101–114.8. Gupta S, Ray A, Sarkar S, et al. Fault detection and iso-
lation in aircraft gas turbine engines: Part i - underlyingconcept. Proc IMechE, Part G: J Aerospace Engineering
2008; 222(3): 307–318.9. Sarkar S, Yasar M, Gupta S, et al. Fault detection and
isolation in aircraft gas turbine engines: Part II -
validation on a simulation test bed. Proc IMechE,Part G: J Aerospace Engineering 2008; 222(3): 319–330.
10. Sarkar S, Rao C and Ray A. Statistical estimation of
multiple faults in aircraft gas turbine engines. ProcIMechE, Part G: J Aerospace Engineering 2009;223(4): 415–424.
11. Sarkar S, Mukherjee K, Jin X, et al. Optimization of
symbolic feature extraction for pattern classification.Signal Process 2012; 92(3): 625–635.
12. Basir O and Yuan X. Engine fault diagnosis based on
multi-sensor information fusion using dempsterU00
shafer evidence theory. Inform Fusion 2007; 8: 379–386.13. Romessis C and Mathioudakis K. Bayesian network
approach for gas path fault diagnosis. J Eng Gas TurbPower 2006; 128: 64–72.
2000 Proc IMechE Part G: J Aerospace Engineering 227(12)

14. Volponi A, Brotherton T, Luppold R, et al.Development of an information fusion system forengine diagnostics and health management. In:
NASA/TMU2004-212924, 39th Combustion/21thAirbreathing Propulsion/21st Propulsion SystemsHazards/ 3rd Modeling and Simulation Joint
Subcommittee Meeting. Colorado Springs, CO, USA,1–5 December, 2003.
15. Byington C, Watson M and Edwards D. Data-driven
neural network methodology to remaining life predic-tions for aircraft actuator components. In: Proceedingsof IEEE Aerospace Conference. Big Sky, MT, USA,March, 2004.
16. Kobayashi T and Simon DL. A hybrid neural network-genetic algorithm technique for aircraft engine perform-ance diagnostics. In: 37th Joint Propulsion Conference
and Exhibit cosponsored by the AIAA, ASME, SAE andASEE. Salt Lake City, UT, USA, 2001.
17. Chu E, Gorinevsky D and Boyd S. Detecting aircraft
performance anomalies from cruise flight data. In:AIAA Infotech Aerospace Conference. Atlanta, GA,USA, April 2010.
18. Armstrong J. Users guide for the transient test case gen-erator. NASA GRC Internal Report, September 2009.
19. Simon D and Garg S. Optimal tuner selection forKalman filter-based aircraft engine performance esti-
mation. J Eng Gas Turb Power 2010; 132(3): 031601.
20. Blasch E, Kadar I, Hintz K, et al. Resource manage-manet coordination with level 2/3 fusion issuesand challenges. IEEE A&E Sytems Magazine, March
2008, pp. 32–46.21. Subbu A and Ray A. Space partitioning via hilbert
transform for symbolic time series analysis. Appl Phys
Lett 2008; 92(8): 084107–1–084107–3.22. Bishop CM. Pattern recognition and machine learning
(Information science and statistics). Secaucus, NJ:
Springer-Verlag, 2006.23. Duda R, Hart P and Stork D. Pattern classification.
New York, NY: John Wiley, 2001.24. McLachlan GJ. Discriminant analysis and statistical pat-
tern recognition. Wiley Series in Probability andStatistics. New York, NY: Wiley-Interscience, 2004.
25. Choi E and Lee C. Feature extraction based on the
Bhattacharyya distance. Pattern Recogn 2003; 36:1703–1709.
26. Trivedi P and Zimmer D. Copula modeling: An intro-
duction for practitioners. Foundations Trend Econom2005; 1(1): 1–111.
Sarkar et al. 2001