procee ding of the fifth international symposium …unhas.ac.id/fahutan/data/proceeding the 5th int...
TRANSCRIPT


PROCEEDING OF THE FIFTH INTERNATIONAL SYMPOSIUM OF INDONESIAN WOOD RESEARCH SOCIETY
i
UTILIZATION OF RENEWABLE NATURAL RESOURCES TOWARDS
WELFARE AND ENVIRONMENTAL SUSTAINABILITY
PROCEEDINGS OF THE FIFTH INTERNATIONAL SYMPOSIUM OF INDONESIAN WOOD RESEARCH SOCIETY (IWoRS)
November 7-9, 2013
Novotel Hotel, Balikpapan, East Kalimantan
INDONESIA
EDITED BY
Wiwin Suwinarti Nur Maulida Sari
Kiswanto Irawan Wijaya Kusuma
Erwin Ismail
INDONESIAN WOOD RESEARCH SOCIETY (MAPEKI) COORDINATION OF PRIVATE UNIVERSITY IN KALIMANTAN (KOPERTIS) REG. XI
ASSOCIATION OF INDONESIA PRIVATE UNIVERSITY (APTISI) REG. XI-B PROVINCIAL GOVERNMENT OF EAST KALIMANTAN
GOVERNMENT OF BALIKPAPAN MUNICIPALITY
BALIKPAPAN, EAST KALIMANTAN, INDONESIA MEI, 2015
PROCEEDING OF THE FIFTH INTERNATIONAL SYMPOSIUM OF INDONESIAN WOOD RESEARCH SOCIETY
ii
PROCEEDINGS
THE FIFTH INTERNATIONAL SYMPOSIUM OF
INDONESIAN WOOD RESEARCH SOCIETY
(IWoRS)
Organized by: INDONESIAN WOOD RESEARCH SOCIETY (IWoRS)
&
ASSOCIATION OF INDONESIA PRIVATE UNIVERSITY (APTISI) REG. XI-B
COORDINATION OF PRIVATE UNIVERSITY IN KALIMANTAN (KOPERTIS) REG. XI
PROVINCIAL GOVERNMENT OF EAST KALIMANTAN GOVERNMENT OF BALIKPAPAN MUNICIPALITY
Published by:
INDONESIAN WOOD RESEARCH SOCIETY (IWoRS) Secretariat: UPT. Balai Penelitian dan Pengembangan Biomaterial Lembaga Ilmu Pengetahuan Indonesia (LIPI) Jl. Raya Bogor KM.46 Cibinong Bogor 16911 Phone: 021-87914511 Fax:/ 021-87914510 E-Mail : [email protected] Website: http://www.mapeki.org Copyright@2015 INDONESIAN WOOD RESEARCH SOCIETY (IWoRS) ISSN 2459-9867
Cover Design: KISWANTO ([email protected])

PROCEEDING OF THE FIFTH INTERNATIONAL SYMPOSIUM OF INDONESIAN WOOD RESEARCH SOCIETY
iii
PREFACE
Firstly, we would like to express our highest gratitude to Allah SWT for everything given us by which the Proceeding of the Fifth International Symposium of Indonesian Wood Research Society (IWoRS) held in Novotel Hotel, Balikpapan, East Kalimantan INDONESIA on November 7-9, 2013 could be completed and published. Secondly, we would like to apologize deeply for delayed publishing these proceedings makes all of you waiting for it, to be uncomfortable.
The theme of the symposium is “Utilization of Renewable Natural Resources towards Welfare and Environmental Sustainability”. The theme is suitable and acceptable for research discussion on the symposium in view of the abundance of natural resources in Indonesia implies the needs for wise and sustainable utilization toward people welfare. On the other side, the utilization concepts have to consider the nature carrying capacity and environmental sustainability. Regarding the renewable resources in the forestry, agriculture, crop estate and other fields, their sustainable utilization may be established by ensuring the natural availability of the resources. Many efforts have been done including in technical and policy aspects. However, strong needs for better efforts are still remained. Therefore utilization of wood and non-wood forest products becomes in urgent. Therefore, the objective of the symposium is s a media and forum for sharing knowledge and experience for wood and forest-related researchers in Indonesia and also the researcher from any countries in the world.
In this opportunity, we would also like to extend our sincere gratitude and appreciation to everyone and all parties for their generous support, and for collaboration to the Board of IWoRS period 2013-2015 Coordination of Private University in Kalimantan (KOPERTIS) Region XI, Association of Indonesia Private University (APTISI) Region XI-B, the Provincial Government of East Kalimantan, and Government of Balikpapan Municipality, and also thanks to others sponsors like PT. Kaltim Prima Coal, KONI of East Kalimantan, BKSDA of East Kalimantan, and PT. Martha Tilaar Group.
In addition, we would like to have critical suggestions and to apologize for the delays and any wrong less related to the proceedings. We do hope it can give much usefulness for any readers. Balikpapan, Mei 2015 Editors

PROCEEDING OF THE FIFTH INTERNATIONAL SYMPOSIUM OF INDONESIAN WOOD RESEARCH SOCIETY
iv
TABLE of CONTENT
Title Page ............................................................................................................................................. i
Preface ................................................................................................................................................. iii
Table of Content .................................................................................................................................. iv
Keynote Speaker
Tohru Mitsunaga (Gifu University, Japan)
Introduction Of Natural Products Chemistry Obtaining From
Cooperative Researches Using Indonesian Plants ..................................................................... 1
Kuniyoshi Shimizu
Molecular Target Of Triterpenoid With Anticancer Activity Isolated
From Medicinal Mushroom, Ganoderma lingzhi .......................................................................... 2
PAPER
A. WOOD PROPERTIES AND BIODEGRADATION
Widi Sunaryo (Faculty of Agriculture, Mulawarman University) Co-expression Analysis of Genes Associated with Cambial Cell Differentation during Wood Formation .................................................................................................................................... 4 Harry Praptoyo (Faculty of Forestry, Gadjah Mada University) The effect of Methyl Jasmonate Hormone to Stimulate the Formation of Traumatic Resin Duct in Pines (Pinus merkusii Jungh et de Vriese) from KPH Lawu DS .................. 10 Tibertius Agus Prayitno (Faculty of Forestry,Gadjah Mada University) Properties of Heat Treated Teak Wood from Community Forest ............................................................ 17 B. BIOCOMPOSIT AND TIMBER ENGINEERING
Bakri (Faculty of Forestry, Hasanuddin University) Application of Carbon Dioxide Injection Technology in Bamboo Cement Board Production................... 25 James Rilatupa (Faculty of Engineering, Christian University of Indonesia) Gypsum Board and Cement Board As An Acoustic Material For Building ............................................. 32 Johannes Adhijoso Tjondro (Parahyangan Catholic University) The flexural strength and behavior of cross laminated timber floor......................................................... 40
C. BIOENERGY AND FOREST PRODUCT CHEMISTRY Ganis Lukmandaru (Faculty of Forestry, Gadjah Mada University) Quinones Distribution in Juvenile Teak Wood ....................................................................................... 47 Wahyu Dwiyanto (Indonesian Institute of Sciences) Enzymatic Saccharification and Ethanol Production of Xylems from Indonesian Botanical Garden Tress ....................................................................................................... 55

PROCEEDING OF THE FIFTH INTERNATIONAL SYMPOSIUM OF INDONESIAN WOOD RESEARCH SOCIETY
v
Ika Fikriah (Faculty of Medicine, Mulawarman University) A Review: Screening of Potency Akar Kuning Stem (Fibrauerea tinctoria Lour) as Antimalarial Combination Therapy .................................................................................................... 60 Rini Pujiarti (Faculty of Forestry, Gadjah Mada University) Insecticidal Activity of Melaleuca leucadendron Oil against Greenhouse Whitefly Trialeurodes vaporariorum ..................................................................................................................... 65 Gina Saptiani (Faculty of Fishery and Marine Sciences, Mulawarman University )
Potential of Acanthus ilicifolius Extract To Diseases ReducedOn Prawn .............................................. 71 D. GENERAL FORESTRY Avry Pribadi (Balai Penelitian Teknologi Serat Tanaman Hutan) Potency Usage of Plantation Forest of Acacia mangium and Acacia crassicarpaas Source of Honeybee Forage and Its Problem ........................................................................................ 76
Wahjuni Hartati (Faculty of Forestry, University of Mulawarman)
Study on Land Rehabilitation at Mined Lands of PT Trubaindo Coal Mining,West Kutai, East Kalimantan (2011 – 2012) ............................................................................................................. 80

PROCEEDING OF THE FIFTH INTERNATIONAL SYMPOSIUM OF INDONESIAN WOOD RESEARCH SOCIETY
vi
POSTER PRESENTATION
Rattana Choowang (Faculty of Science and Technology Prince of Songkla University, Thailand) Influence of vascular bundles population on basic density and mechanical properties of oil palm wood (Elaeis guineensis Jacq.) ............................................................................................ 99 WissaneeYingprasert (Faculty of Sciences and Industrial Technology, Prince of Songkla University, Thailand) The investigation of the bondability of the Ethylene Gaseous stimulated rubberwood .......................... 103 Akapong Petharwut (Faculty of Sciences and Industrial Technology, Prince of Songkla University, Thailand) Potential of boron rubberwood preservatives against Asian subterranean termite Coptotermes gestroi (Isoptera: Rhinotermitidae) ....................................................................... 109 Ganis Lukmandaru (Faculty of Forestry, Gadjah Mada University) Antitermitic Activites of Bark Extracts of Teak Wood ............................................................................. 112 Triyani Fajriutami (R&D Unit for Biomaterials, Indonesian Institute of Sciences (LIPI) Microwave-Assisted Acid Hydrolysis of Sugarcane Bagasse Pretreated with White-Rot Fungi ............ 118

KEYNOTE SPEAKER
PROCEEDING OF THE FIFTH INTERNATIONAL SYMPOSIUM OF INDONESIAN WOOD RESEARCH SOCIETY
1
INTRODUCTION OF NATURAL PRODUCTS CHEMISTRY OBTAINING
FROM COOPERATIVE RESEARCHES USING INDONESIAN PLANTS
TOHRU MITSUNAGA
United Graduate School of Agricultural Science
Faculty of Applied Biological Science
Gifu University
JAPAN
Substituted for fossil resources the inflection of the natural energies such as solar light and force velocity has been
developed for reducing carbon dioxide positively. Especially the beneficial use of plant resources biomass attracts attention.
Before many convenient materials have been synthesized from the fossil resources by the techniques of synthetic chemistry
with a rapid progress of technology we have obtained the thing which is necessary for life from the plant materials. Our life
becomes convenient for the sake of mass reproducible cheep fossil resources, on the other hand excess carbon dioxide
emission introduces the global heating and environmental pollution. To improve such situation an application of plant
resources are nowadays entering the stage of attention again.
Tropical woody species have long been viewed as important sources of natural remedies in traditional medicine.
They produce a diverse range of secondary metabolites such as flavonoids, terpenoids, and tannins in general are
considered to have a variety of biological roles including as plant chemical defenses against pathogens and herbivores (from
bacteria and fungi to insects and mammals). Secondary metabolites derived from plant are reported to demonstrate
potentially significant pharmaceutical activity such as antiviral, antimicrobial, antioxidant and enzyme inhibiting. Therefore,
investigating extractives isolated from tropical woody species offers a valuable opportunity for the utilization of forest
products.
We have searched several kinds of bioactivities relating to beauty and health science and identified the effective
compounds for a decade by using Indonesian woody plants and medicinal plants extractives. Recently we have obtained the
extremely interesting results of bioactivities such as anti-carries, anti-acne, anti-inflammation, inhibitory activities of melanin
biosynthesis so on through our cooperative research of Mulawarman university and Bogor Agricultural University with
United Graduate School of Agriculture of Gifu University (UGSAS-GU).
In order to discover novel compounds indicating bioactivity from the biodiversity with protecting the Convention on
Biological Diversity, we need to keep going the cooperative research ensuring a mutually beneficial result for both of
Indonesian research groups and UGSAS-GU.

KEYNOTE SPEAKER
PROCEEDING OF THE FIFTH INTERNATIONAL SYMPOSIUM OF INDONESIAN WOOD RESEARCH SOCIETY
2
MOLECULAR TARGET OF TRITERPENOID WITH ANTICANCER ACTIVITY ISOLATED FROM MEDICINAL MUSHROOM, Ganoderma lingzhi
KUNIYOSHI SHIMIZU Department of Agro-environmental Sciences, Faculty of Agriculture,
Kyushu University, 6-10-1 Hakozaki, Higashi-ku, Fukuoka 812-8581 Japan
Ganorderma lingzhi, known as “ling zhi” in China and “reishi” in Japan, is a wood-rotting fungus generally found
growing on tree stumps. The anticancer activities of G. lingzhi include inhibition of tumor growth, angiogenesis and
metastasis, and immune enhancement. Among these, the cytotoxic effects of Ganoderma triterpenoids and the
immunoregulatory activities of Ganoderma polysaccharides have been of particular interest. Over one hundred oxygenated
triterpenoids have been isolated from G. lingzhi. These compounds display a wide range of biological activities resulting in
cytotoxicity and antitumor activity and the inhibition of histamine release angiotensin converting enzyme release, and
cholesterol synthesis.
While screening mushrooms, we discovered that ethanol extracts of G. lingzhi showed the strongest 5α-reductase
inhibitory activity among 19 species of mushrooms. Furthermore, treatment with the fruit body of G. lingzhi itself, or its
ethanol extracts, significantly inhibited testosterone induced growth of the ventral prostate in rats. Our group previously
isolated a series of triterpenoids from G. lingzhi. These compounds suppressed the proliferation of androgen-dependent and
androgen-independent prostate cancer cell lines and estrogen-dependent MCF-7 cells, and inhibited osteoclastic
differentiation. Among these triterpenoids, we found that only ganoderic acid DM (1, Fig. 1) had multiple functions and
inhibited proliferation of prostate cancer cells and differentiation of osteoclasts. Although 1 affects different signaling
pathways in different cell lines and has multiple functions, we have identified its target proteins, which explain and clarify the
universal mechanism of its medicinal efficacy.
Here we show the important clues about the mechanisms of multi-medicinal action of Ganoderma triterpenoids,
particularly the anticancer activity of ganoderic acid DM. We examined structure–activity relationships between 1 and its
analogs to identify the functional groups required for inhibiting cell proliferation in a prostate cancer cell line, PC-3 cells. We
found that the carbonyl group at C-3 was essential for cytotoxic effects of 1 and its analogs.
O O
COOH
1
2
34
5
6
7
8
9
10
11
12
13
14
15
16
17
18
19
20
21 22
23
24
25
27
Figure 1. Structure of ganoderic acid DM (1)

KEYNOTE SPEAKER
PROCEEDING OF THE FIFTH INTERNATIONAL SYMPOSIUM OF INDONESIAN WOOD RESEARCH SOCIETY
3
Figure 2. Diagrams for ganoderic acid DM (1) fixation to the magnetic beads by reaction and amidation of the
carboxylic group in the side chain of 1.
Since 1 is effective for treatment of various cancer types, it must have a common molecular target and is involved
in different signal pathways in different cancer types. To identify the primary target protein of 1, we used a technique involving
ferrite glycidyl methacrylate (FG) beads to isolate the specific binding protein of 1. Keeping the essential C-3 carbonyl group
free, compound 1 was covalently conjugated to the beads at C-26 and incubated with protein fractions of PC-3 cells (Fig. 2).
After extensive washing, the bound proteins were eluted and subjected to SDS gel electrophoresis and silver staining. No
specific bands were detected from the membrane protein fraction (F2), nuclear protein fraction (F3), or cytoskeletal fraction
(F4; data not shown). Representative SDS gel images for control and 1-treated cytosol fractions (F1) showed a protein band
at approximately 50 kD. This band was dependent on the treatment concentration of 1, and contained α,β-tubulin, as
identified by LC-MS/MS. In these experiments, α-tubulin showed a total score of 1253, 61% sequence coverage and 45
matched peptides. Concomitantly, β-tubulin had a total score of 880, 45% sequence coverage and 27 matched peptides.
Tubulin is a member of a small family of globular proteins, and the most abundant of these are α-tubulin and β-tubulin. Both
of these proteins have a molecular weight of approximately 55 kD, and microtubules are assembled from dimers of α- and β-
tubulin. Our results show that 1 specifically interacts with both α- and β-tubulin subunits, thereby effecting microtubule
function.
Cancer is characterized by uncontrolled cell proliferation and inappropriate cell survival, as well as defects in
cellular morphogenesis that leads to tissue disruption, invasion, and migration. Microtubules play important roles in these
cellular processes and comprise one of the oldest, most clearly validated, and efficacious targets for tumor chemotherapy.
The formation of microtubules is a dynamic process that involves polymerization of heterodimers formed by α,β-tubulin, and
degradation of linear polymers. Drugs that bind to tubulin can block this dynamic equilibrium, either by inhibiting
polymerization or by stabilizing the microtubule structure. Both actions abolish microtubule function. To elucidate the
mechanism through which 1 acts on tubulin protein, we developed a tubulin polymerization experiment. We used paclitaxel
and vinblastine as positive controls, as these agents stabilize the microtubule polymer and protect it from disassembly and
suppress microtubule dynamics and reduce microtubule polymer mass, respectively. As we expected, paclitaxel or
vinblastine caused increased assembly, or inhibited tubulin polymerization, respectively, at 30 µM. The concentration
dependency of tubulin protein on 1 was reflected by increasing effects of 50–100 µM treatments of 1 on microtubule
assembly. Unlike other tubulin-targeting drugs (vinblastine) that inhibit microtubule assembly, paclitaxel stabilizes the
microtubule polymer and protects it from disassembly. This blocks progression of mitosis, prolongs activation of the mitotic
checkpoint, and triggers apoptosis or reversion to the G-phase of the cell cycle without cell division. In support of our results,
compound 1 have been reported to cause G1 cell cycle arrest and apoptosis in human breast cancer cells.
O O
Ganoderic acid DM (1)
OO
HN
OH
OHamidation
NH2 beads
NH
O

WOOD PROPERTIES AND BIODEGRADATION PROCEEDING OF THE FIFTH INTERNATIONAL SYMPOSIUM OF INDONESIAN WOOD RESEARCH SOCIETY
4
CO-EXPRESSION ANALYSIS OF GENES ASSOCIATED WITH CAMBIAL CELL DIFFERENTIATION DURING WOOD FORMATION
Widi Sunaryo1,3 , Andrea Polle2 and Urs Fischer2
1. Department of Agroecotechnology, Faculty of Agriculture, Mulawarman University, Samarinda 75123
2. Forest Botany and Tree Physiology, Büsgen-Institut, Georg-August Universität Göttingen, 37077 Göttingen, Germany.
3. Corresponding author ([email protected])
Abstract
Wood is common name of xylem of trees, an important source of fixed carbon used for woody materials and industrial purposes such as timber, pulp, furniture, fibers, and also as energy source or for other products (films, adhesives, etc). During wood formation cambial daughter cells develop and specialize to xylem cells. The mechanism of wood formation based on the observation of cell structures and cell wall components is well understood, but the genetic control of cambial activity and differentiation is still little known. A recent study in the model tree poplar showed evidences for an involvement of KNOX genes in controlling differentiation of cambial daughter cells. High resolution transcript analyses of the poplar cambium showed several KNOX genes with strong cambial expression (Hertzberg et al. 2001; Schrader et al. 2004). Furthermore, the current understanding of the regulation of differentiation in vascular development was greatly enhanced by the study of the poplar KNOX gene ARBORKNOX1 (ARK1) and ARBORKNOX2 (ARK2), which are close homologues of the Arabidopsis STM and BREVIPEDICELLUS(BP/KNAT1), respectively. ARK1 was shown to be expressed in the cambium and over-expression of ARK1 leads to inhibition of differentiation of vascular cells (Groover et al. 2006). A co-expression analysis of publicly available microarray data was performed in order to identify genes which act downstream of Arabidopsis KNAT1 and STM, using Arabidopsis Co-expression Tool (ACT; www.arabidopsis.leedsac.uk/ACT). Genes, which are positively regulated by KNAT1 or STM should be co-expressed with both of them. From 100 genes co-expressed with either STM or KNAT1, 69 genes (69%) were identical. In other words, those 69 genes are co-expressed with STM and also KNAT1. This astonishingly high overlap underlines the redundant function of STM and KNAT1. Of 69 overlapping genes seven genes were selected based on their association with cambial cell and secondary cell wall formation and their ranking of co-expression. Quantitative expression analysis in wild-type, stm-GK, knat1bp-9 and the double mutant was subsequently performed for the selected genes. Down-regulation of STM and KNAT1 was always followed by a not significant trend of down-regulation of cellulose synthases (IRX1, IRX3 and IRX5), cobra-like 4 (IXR6), pectin methylesterase61 (PME61), and fasciclin-like arabinogalactan 11(FLA11) in the single mutants. In the double mutant the down-regulation for all those genes was greater than 10 times and highly significant (Table 5). Only the lipid transfer protein 4 (LTP4) behaved in an opposite manner and was upregulated in the double mutant. Thus, STM and KNAT1 are upstream of IRX1, IRX3, IXR6, PME61 and FLA11. To address the potential involvement of STM and KNAT1 in lignin deposition during secondary cell wall formation, key-genes of lignin biosynthesis previously identified by Mele et al (2003) were tested for their expression in the mutants. Interestingly, the expression of At4CL1, PAL1, CAD1, and PRX in stm-GK, knat1bp-9, and stm-GK;knat1bp-
9 was not different from wild type (Col-0). In contrast to cellulose biosynthesis, this may indicate that STM and KNAT1 are not directly involved in lignin biosynthesis.
Key words: Co-expression analysis, KNOX genes, Cambial cell differentiation, Secondary cell wall formation.
Introduction
The cambial cells divide periclinally to produce xylem and phloem. Daughter cells of the cambium differentiate to the outer side into phloem and to the inner side into xylem to produce radial files of cells that meet at the cambial zone. Xylem of trees, commonly referred to as wood, is an important source of fixed carbon used for woody materials and industrial purposes such as timber, pulp, furniture, fibers, and also as energy source or for other products (films, adhesives, etc).
During secondary growth, cambial daughter cells develop and specialize to xylem cells. Xylem cells undergo progressive stages of differentiation; (1) elongation/ enlargement, (2) secondary cell wall deposition, and (3) programmed cell death before being mature xylem (Turner et al. 2008). The hallmark of mature xylem is secondary cell wall deposition. Secondary cell wall formation contributes to a large extent to the biomass of wooden tissues. The major compounds of secondary cell walls are cellulose, hemicelluloses and lignin. The wood of economically important poplar

WOOD PROPERTIES AND BIODEGRADATION PROCEEDING OF THE FIFTH INTERNATIONAL SYMPOSIUM OF INDONESIAN WOOD RESEARCH SOCIETY
5
trees typically consists of 45 % of cellulose, 25 % hemicelluloses and 20 % of lignin (Timell et al. 1969; McDougall et al. 1993).
The mechanism of wood formation based on the observation of cell structures and cell wall components is well understood, but the genetic control of cambial activity and differentiation is still little known. A recent study in the model tree poplar showed evidences for an involvement of KNOX genes in controlling differentiation of cambial daughter cells. High resolution transcript analyses of the poplar cambium showed several KNOX genes with strong cambial expression (Hertzberg et al. 2001; Schrader et al. 2004). Furthermore, the current understanding of the regulation of differentiation in vascular development was greatly enhanced by the study of the poplar KNOX gene ARBORKNOX1 (ARK1) and ARBORKNOX2 (ARK2), which are close homologues of the Arabidopsis STM and BREVIPEDICELLUS(BP/KNAT1), respectively. ARK1 was shown to be expressed in the cambium and over-expression of ARK1 leads to inhibition of differentiation of vascular cells (Groover et al. 2006).
Based on phylogenetic analyses of amino acid and nucleotide sequences, there are eight members of KNOX genes divided into two sub families in Arabidopsis (Scofield and Murray, 2006). The subfamily KNOX I comprises STM, KNAT1(BRIVIPEDICULOUS/BP), KNAT2 and KNAT6 and the subfamily KNOX II comprises KNAT3, KNAT4, KNAT5 and KNA7.
A well-characterized member of the class I KNOX genes is SHOOT MERISTEMLESS (STM), which is expressed in the centre of the shoot apical meristem (SAM) but not in the newly formed leaf primordia and in the incipient leaf (Long et al. 1996). Loss-of-function mutations in STM lead to premature differentiation of meristematic cells and eventually to cessation of the SAM (Long et al. 1996); but its simultaneous over-expression together with the homeodomain transcription factor WUSCHEL induces meristem formation at ectopic places (Lenhard et al. 2002). These findings indicate that STM is a critical regulator of differentiation, whose expression is required to keep cells in an undifferentiated state. The other characterized members of the class I KNOX genes fulfill partly redundant functions to STM and are generally suggested to be involved in preventing differentiation of the tissue where they are expressed (Scofield and Murray, 2006). In contrast to class I KNOX genes, the members of class II KNOX genes are only scarcely described and functional data is mostly lacking.
Materials and Methods
To identify genes co-expressed with STM and KNAT1 the Arabidopsis Co-expression Tool (ACT) was
employed, a internet based tool for microarray experiment analysis, that is freely available at www.Arabidopsis.leeds.ac.uk/ACT (Manfield et al. 2006). For STM and KNAT1, the 100 best matches of co-expressed genes were extracted from a database of more than 300 microarray chips. Subsequently, overlapping gene models between genes coexpressed with STM and KNAT1 were identified and selected according to their putative role in secondary growth. To verify co-expression experimentally qRT-PCR was performed. Primers were designed from selected genes by using The Universal ProbeLibrary Design Center (http://www.roche-applied-science.com/sis/rtpcr/upl/ezhome.html).
To study the relationship between Arabidopsis STM and KNAT1 genes and lignin biosynthesis, an expression study using genes associated with lignin biosynthesis was performed. Primers were designed against these genes according to Mele et al (2003). qRT-PCR was carried using the ROCHE qRTPCR SYBR green kit (Roche, Grenzach-Wyhlen, Germany) and reactions were run on a LightCycler®480 (Roche, Grenzach-Wyhlen, Germany) according to the protocol: preincubation (95ºC for 5 minutes) amplification (95ºC for 10 second, 61ºC for 10 second, 72ºC for 10 second), Melting curve (95ºC for 5 second, 65ºC for 60 second, 67ºC – Acqu. 5), and cooling (40ºC ).
Data were analyzed using LightCycler®480 Software Release1.5.0 (Roche Grenzach-Wyhlen, Germany). Values for crossing points (Cp) were obtained directly from the software and subsequently transformed to absolute concentration values using following formula:
Note: (Cp) Crossing point, (X) concentration of amplified cDNA at time point 0, (slope and Y intercept) slope and intercept obtained from running standard curves generated by template dilution.
The absolute concentration values then were normalized to the expression of ACTIN2 by dividing the absolute expression value of the gene of interest by the absolute expression value of ACTIN2 in the corresponding samples. All experiments were performed by using three biological and three technical replicates unless otherwise stated.

WOOD PROPERTIES AND BIODEGRADATION PROCEEDING OF THE FIFTH INTERNATIONAL SYMPOSIUM OF INDONESIAN WOOD RESEARCH SOCIETY
6
To determine slope (efficiency) and intercept, standard curves from dilution series were calculated. The initial first strand cDNA (1 µg of total RNA) was diluted 5x, corresponding to standard 1. Subsequently a series of 5x dilutions starting from standard 1 was made. For the standard curve dilutions from 50 to 5-7 were used. This procedure was performed for all primer pairs employed.
Results and Discussion
If KNAT1 and STM act as transcription factors, the target genes should be co-expressed with them. In order to identify genes which act downstream of KNAT1 and STM co-expression analysis of publicly available microarray data was performed, using Arabidopsis Co-expression Tool (ACT; www.arabidopsis.leedsac.uk/ACT). Genes, which are positively regulated by KNAT1 or STM should be co-expressed with both of them, since they have overlapping function in secondary growth. From 100 genes co-expressed with either STM or KNAT1, 69 genes (69%) were identical. In other words, those 69 genes are co-expressed with STM and also KNAT1. This astonishingly high overlap underlines the redundant function of STM and KNAT1. Of 69 overlapping genes seven genes (Table 1) were selected based on their association with secondary cell wall formation and their ranking of co-expression. Quantitative expression analysis in wild-type, stm-GK, knat1bp-9 and the double mutant was subsequently performed for the selected genes.
Table 1. STM and KNAT1 co-expressed genes selected based on their association with secondary cell wall formation.
No. Locus Name of Protein Function (Putative)
1. AT3G59010 Pectin methylesterase, PME61 Cell wall modification
2. AT5g59310 Lipid transfer protein 4, LTP4 Unknown
3. AT5G3170 Fasciclin-like arabinogalactan 11, FLA11 Unknown
4. AT4G18780 Cellulose synthase, CesA8 (IRX1) Cellulose biosynthesis
5. AT5G17420 Cellulose synthase, CesA7 (IRX3) Cellulose biosynthesis
6. AT5G44030 Cellulose synthase, CesA4 (IRX5) Cellulose biosynthesis
7. AT5G15630 Cobra like 4 (COBL4), IRX6 Arrangement of cellulose microfibrils
Down-regulation of STM and KNAT1 was always followed by a not significant trend of down-regulation of cellulose synthases (IRX1, IRX3 and IRX5), cobra-like 4 (IXR6), pectin methylesterase61 (PME61), and fasciclin-like arabinogalactan 11(FLA11) in the single mutants (Figure 1). In the double mutant the down-regulation for all those genes was greater than 10 times and highly significant (Table 3). Only the lipid transfer protein 4 (LTP4) behaved in an opposite manner and was upregulated in the double mutant. Thus, STM and KNAT1 are upstream of IRX1, IRX3, IXR6, PME61 and FLA11.
Figure 1. STM and KNAT1 are involved in cellulose biosynthesis. qRT-PCR analysis of co-expressed genes in stm-GK, knat1bp-9 and stm-GK;knat1bp-9. Data were analyzed from 3 biological and 3 technical replicates and normalized to the expression of ACTIN2. (**) Significant p≤ 0.01, t-test, compared to wild-type, (*) significant 0.01< p ≤ 0.05.
WOOD PROPERTIES AND BIODEGRADATION PROCEEDING OF THE FIFTH INTERNATIONAL SYMPOSIUM OF INDONESIAN WOOD RESEARCH SOCIETY
7
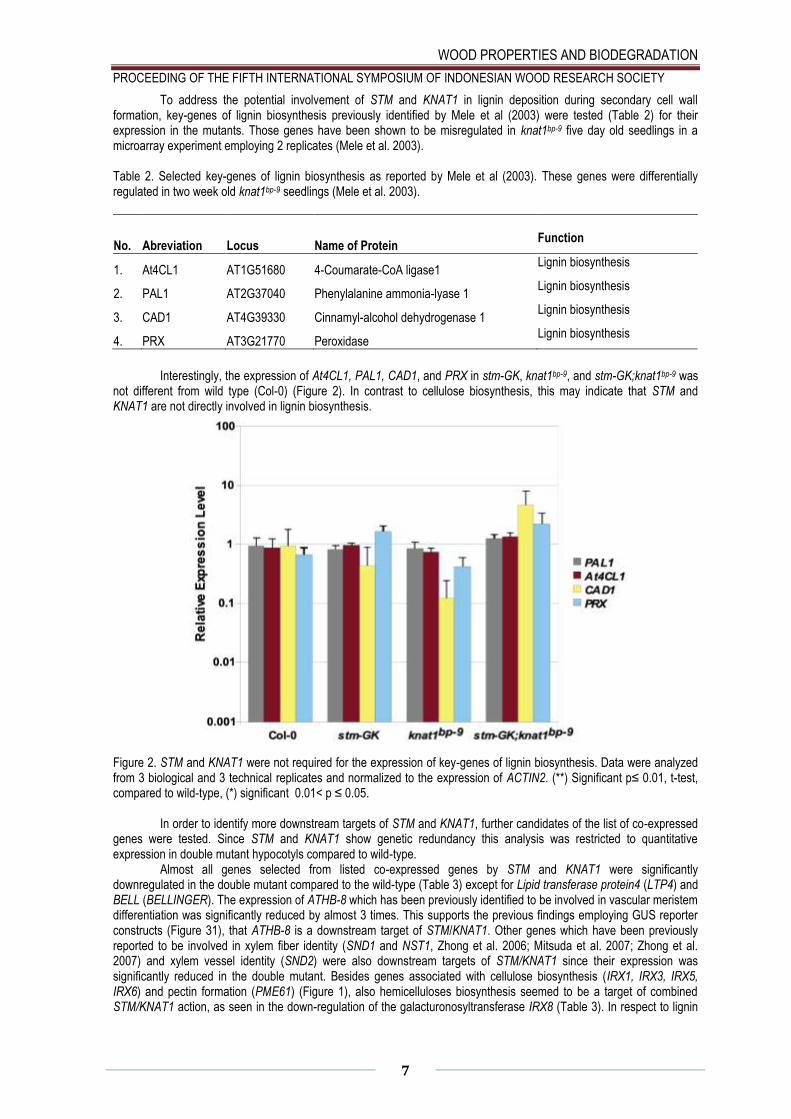
To address the potential involvement of STM and KNAT1 in lignin deposition during secondary cell wall formation, key-genes of lignin biosynthesis previously identified by Mele et al (2003) were tested (Table 2) for their expression in the mutants. Those genes have been shown to be misregulated in knat1bp-9 five day old seedlings in a microarray experiment employing 2 replicates (Mele et al. 2003).
Table 2. Selected key-genes of lignin biosynthesis as reported by Mele et al (2003). These genes were differentially regulated in two week old knat1bp-9 seedlings (Mele et al. 2003).
No. Abreviation Locus Name of Protein Function
1. At4CL1 AT1G51680 4-Coumarate-CoA ligase1 Lignin biosynthesis
2. PAL1 AT2G37040 Phenylalanine ammonia-lyase 1 Lignin biosynthesis
3. CAD1 AT4G39330 Cinnamyl-alcohol dehydrogenase 1 Lignin biosynthesis
4. PRX AT3G21770 Peroxidase Lignin biosynthesis
Interestingly, the expression of At4CL1, PAL1, CAD1, and PRX in stm-GK, knat1bp-9, and stm-GK;knat1bp-9 was not different from wild type (Col-0) (Figure 2). In contrast to cellulose biosynthesis, this may indicate that STM and KNAT1 are not directly involved in lignin biosynthesis.
Figure 2. STM and KNAT1 were not required for the expression of key-genes of lignin biosynthesis. Data were analyzed from 3 biological and 3 technical replicates and normalized to the expression of ACTIN2. (**) Significant p≤ 0.01, t-test, compared to wild-type, (*) significant 0.01< p ≤ 0.05.
In order to identify more downstream targets of STM and KNAT1, further candidates of the list of co-expressed genes were tested. Since STM and KNAT1 show genetic redundancy this analysis was restricted to quantitative expression in double mutant hypocotyls compared to wild-type.
Almost all genes selected from listed co-expressed genes by STM and KNAT1 were significantly downregulated in the double mutant compared to the wild-type (Table 3) except for Lipid transferase protein4 (LTP4) and BELL (BELLINGER). The expression of ATHB-8 which has been previously identified to be involved in vascular meristem differentiation was significantly reduced by almost 3 times. This supports the previous findings employing GUS reporter constructs (Figure 31), that ATHB-8 is a downstream target of STM/KNAT1. Other genes which have been previously reported to be involved in xylem fiber identity (SND1 and NST1, Zhong et al. 2006; Mitsuda et al. 2007; Zhong et al. 2007) and xylem vessel identity (SND2) were also downstream targets of STM/KNAT1 since their expression was significantly reduced in the double mutant. Besides genes associated with cellulose biosynthesis (IRX1, IRX3, IRX5, IRX6) and pectin formation (PME61) (Figure 1), also hemicelluloses biosynthesis seemed to be a target of combined STM/KNAT1 action, as seen in the down-regulation of the galacturonosyltransferase IRX8 (Table 3). In respect to lignin
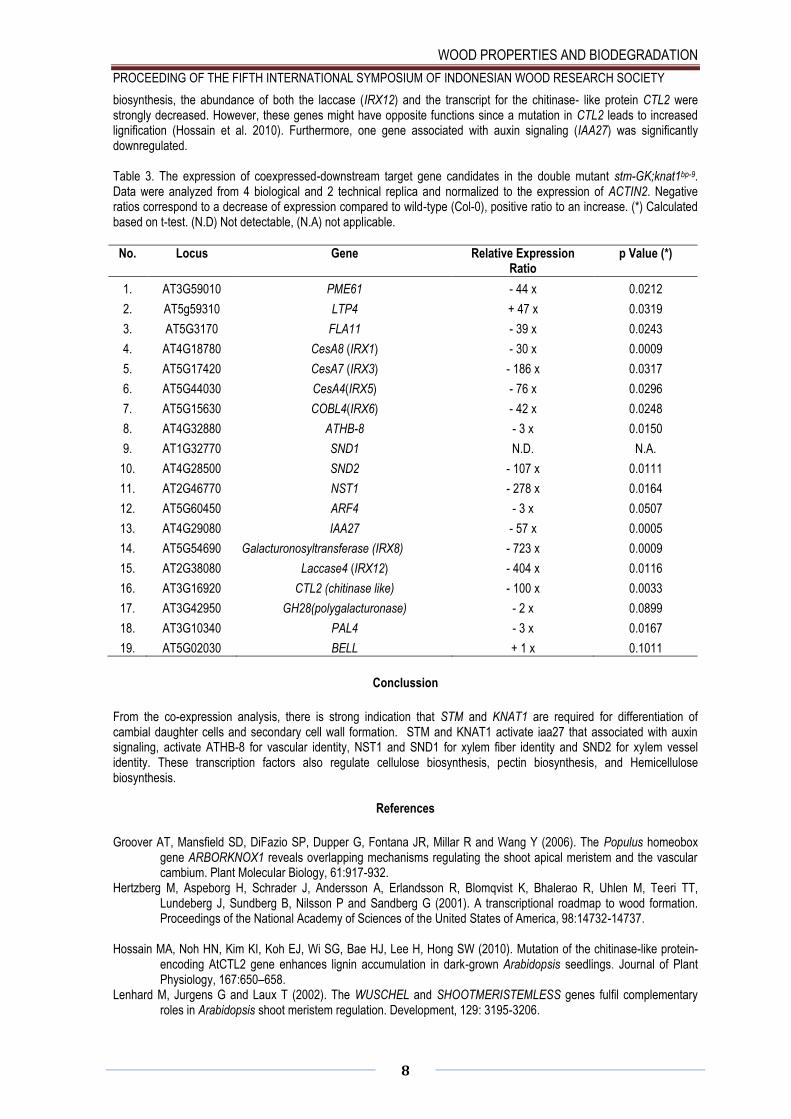
WOOD PROPERTIES AND BIODEGRADATION PROCEEDING OF THE FIFTH INTERNATIONAL SYMPOSIUM OF INDONESIAN WOOD RESEARCH SOCIETY
8
biosynthesis, the abundance of both the laccase (IRX12) and the transcript for the chitinase- like protein CTL2 were strongly decreased. However, these genes might have opposite functions since a mutation in CTL2 leads to increased lignification (Hossain et al. 2010). Furthermore, one gene associated with auxin signaling (IAA27) was significantly downregulated.
Table 3. The expression of coexpressed-downstream target gene candidates in the double mutant stm-GK;knat1bp-9. Data were analyzed from 4 biological and 2 technical replica and normalized to the expression of ACTIN2. Negative ratios correspond to a decrease of expression compared to wild-type (Col-0), positive ratio to an increase. (*) Calculated based on t-test. (N.D) Not detectable, (N.A) not applicable.
No.
Locus
Gene
Relative Expression Ratio
p Value (*)
1. AT3G59010 PME61 - 44 x 0.0212
2. AT5g59310 LTP4 + 47 x 0.0319
3. AT5G3170 FLA11 - 39 x 0.0243
4. AT4G18780 CesA8 (IRX1) - 30 x 0.0009
5. AT5G17420 CesA7 (IRX3) - 186 x 0.0317
6. AT5G44030 CesA4(IRX5) - 76 x 0.0296
7. AT5G15630 COBL4(IRX6) - 42 x 0.0248
8. AT4G32880 ATHB-8 - 3 x 0.0150
9. AT1G32770 SND1 N.D. N.A.
10. AT4G28500 SND2 - 107 x 0.0111
11. AT2G46770 NST1 - 278 x 0.0164
12. AT5G60450 ARF4 - 3 x 0.0507
13. AT4G29080 IAA27 - 57 x 0.0005
14. AT5G54690 Galacturonosyltransferase (IRX8) - 723 x 0.0009
15. AT2G38080 Laccase4 (IRX12) - 404 x 0.0116
16. AT3G16920 CTL2 (chitinase like) - 100 x 0.0033
17. AT3G42950 GH28(polygalacturonase) - 2 x 0.0899
18. AT3G10340 PAL4 - 3 x 0.0167
19. AT5G02030 BELL + 1 x 0.1011
Conclussion
From the co-expression analysis, there is strong indication that STM and KNAT1 are required for differentiation of cambial daughter cells and secondary cell wall formation. STM and KNAT1 activate iaa27 that associated with auxin signaling, activate ATHB-8 for vascular identity, NST1 and SND1 for xylem fiber identity and SND2 for xylem vessel identity. These transcription factors also regulate cellulose biosynthesis, pectin biosynthesis, and Hemicellulose biosynthesis.
References
Groover AT, Mansfield SD, DiFazio SP, Dupper G, Fontana JR, Millar R and Wang Y (2006). The Populus homeobox gene ARBORKNOX1 reveals overlapping mechanisms regulating the shoot apical meristem and the vascular cambium. Plant Molecular Biology, 61:917-932.
Hertzberg M, Aspeborg H, Schrader J, Andersson A, Erlandsson R, Blomqvist K, Bhalerao R, Uhlen M, Teeri TT, Lundeberg J, Sundberg B, Nilsson P and Sandberg G (2001). A transcriptional roadmap to wood formation. Proceedings of the National Academy of Sciences of the United States of America, 98:14732-14737.
Hossain MA, Noh HN, Kim KI, Koh EJ, Wi SG, Bae HJ, Lee H, Hong SW (2010). Mutation of the chitinase-like protein-
encoding AtCTL2 gene enhances lignin accumulation in dark-grown Arabidopsis seedlings. Journal of Plant Physiology, 167:650–658.
Lenhard M, Jurgens G and Laux T (2002). The WUSCHEL and SHOOTMERISTEMLESS genes fulfil complementary roles in Arabidopsis shoot meristem regulation. Development, 129: 3195-3206.

WOOD PROPERTIES AND BIODEGRADATION PROCEEDING OF THE FIFTH INTERNATIONAL SYMPOSIUM OF INDONESIAN WOOD RESEARCH SOCIETY
9
Long JA, Moan EI, Medford JI and Barton MK (1996). A member of the KNOTTED class of homeodomain proteins encoded by the STM gene of Arabidopsis. Nature, 379:66-69.
Manfield LW, Jen CH, Pinney JW, Michalopoulos L, Bradford JR, Gilmartin PM and Westhead DR (2006). Arabidopsis Co-expression Tool (ACT): web server tools for microarray-based gene expression analysis. Nucleic Acids Research, 34:504-509.
McDougall GJ, Morrison IM, Stewart D, Weyers JDB and Hillman JR (1993). Plant fibres: botany, chemistry and processing for industrial use. Journal of the Science of Food Agriculture, 62:1–20.
Mele G, Ori N, Sato Y and Hake S (2003). The knotted1-like homeobox gene BREVIPEDICELLUS regulates cell differentiation by modulating metabolic pathways. Genes & Development, 19:412-412.
Mitsuda N, Iwase A, Yamamoto H, Yoshida M, Seki M, Shinozaki K and Ohme-Takagi M (2007). NAC transcription factors, NST1 and NST3, are key regulators of the formation of secondary walls in woody tissues of Arabidopsis. The Plant Cell, 19:270-280.
Schrader J, Nilsson J, Mellerowicz E, Berglund A, Nilsson P, Hertzberg M and Sandberg G (2004). A high-resolution transcript profile across the wood-forming meristem of poplar identifies potential regulators of cambial stem cell identity. The Plant Cell, 16:2278-2292.
Scofield S and Murray JAH (2006). KNOX gene function in plant stem cell niches. Plant Molecular Biology, 60:929–946. Timell TE (1969). The chemical composition of tension wood. Svensk Papperstidning, 72: 173–181. Turner S, Gallois P and Brown D (2008). Tracheary element differentiation. Annual Review of Plant Biology, 58:407–33. Zhong R and Demura T, Ye Z-H (2006). SND1, a NAC domain transcription factor, is a key regulator of secondary cell
wall synthesis in fibers of Arabidopsis. The Plant Cell, 18:3158-3170. Zhong R, Richardson EA and Ye Z-H (2007). Two NAC domain transcription factors, SND1 and NST1, function
redundantly in regulation of secondary wall synthesis in fibers of Arabidopsis. Planta, 225:1603-1611.

WOOD PROPERTIES AND BIODEGRADATION PROCEEDING OF THE FIFTH INTERNATIONAL SYMPOSIUM OF INDONESIAN WOOD RESEARCH SOCIETY
10
THE EFFECT OF METHYL JASMONATE HORMONE TO STIMULATE THE
FORMATION OF TRAUMATIC RESIN DUCTS IN PINES (Pinus merkusii Jungh et
de Vriese) FROM KPH LAWU DS
Harry Praptoyo1, Alan Cabout2
1Lecturer of Forest Products Technology, Faculty of Forestry, Universitas Gadjah Mada 2Student of Forest Products Technology, Faculty of Forestry, Universitas Gadjah Mada
Abstract
Resin is a non timber forest products that can be harvested from pines periodically. Most used methods in harvesting
resin are mechanical wounding. Aplication of Methyl Jasmonate hormone to enlarge and increase traumatic resin ducts
has been developed in other types plants, such as in rubber wood. In this research, we tried to apply Methyl Jasmonate
in Pinus merkusii. The aim of this research is to know the effect of Methyl Jasmonate on the formation of traumatic resin
dust in pines.
This research used 2 factors are time duration and concentration of Methyl Jasmonate. This research applied a
completely randomized design (CRD) to analyze the effect of time duration factors (1 month and 2 month) and
concentration factors (0%; 0,1%; 0,3% and 0,5%) on the formation of traumatic resin ducts. Some parameters were
observed including 1) number of traumatic resic ducts, 2) Width (dimension) of traumatic resic ducts and 3) trakeid
proportion.
The result showed that concentration level of Methyl Jasmonate factors has affected the number of resin ducts (2,13
ductss/mm2). The average width of resin ducts after the treatment is 0,037 mm2. Trakeid proportion on pines had
decreased after applicated methy jasmonate. Decreasing trakeid proportion were caused by increasing the number and
width of traumatic resin ductss on pines. Concentration level 0,1-0,3% is relatively effetive to stimulate the resin ducts
formation because could obtain about 2 ducts/mm2. The time duration factors give no effect to the number of traumatic
resin ducts and trakeid proportion.
Introduction
Most conifers will exude resin if wounded. Others will exude resin spontaneously from branches and cones.
Several genera of conifers produce resin in copious quantities, which are then harvested and put to a wide variety of
uses. These have made resin one of the most important non-wood productss from conifers. The resin harvested from
various species of Pinus, the oldest and most important of the non-wood productss from conifers.
In Indonesia, resin is one of most important non timber forest products. Resin can be harvested from pines
periodically. Distillation of pine resin yields two productss: turpentine and gum rosin. Gum rosin is the major products
obtained from pine resin. It is the involatile residue that remains after the distillation of turpentine. Gum rosin is a brittle,
transparent, glassy solid insoluble in water but soluble in a number of organic solvents (Coppen and Hone 1995).
Formation of traumatic resin ducts in norway spruce is elicited by stem boring insects and microbial pathogens
as a defense response that can also be induced by mechanical wounding or by wounding and fungal inoculation of trees
(Alfaro, 1995; Tomlin et al., 1998, 2000; Franceschi et al., 2000 in Martin et al 2002). Because wounding of trees can
cause massive bleeding and volatilization of oleoresin and disruption of the tissues that are possibly involved in resin
formation, it was important to develop a noninvasive method for traumatic resin ducts inductsion to enable a detailed
chemical and biochemical analysis of the traumatic resin response (Martin et al, 2002)
Most used methods in harvesting resin from pinus merkusii in perum perhutani are mechanical wounding.
Mechanical wounding is done by tapping the tree stem and removal woody tissue (sap wood), then pine will exude resin.
Using this methods which involve removal woody tissue, causes damage to pines. The risk of damage to pines is
heightened if excessive wood tissue is removed (Coppen, 1995). So to reduce excessive removed wood tissue, we try to
applied Methyl Jasmonate hormone (MeJa) to increase formation traumatic resin ducts to obtain more pine resin.
Aplication of Methyl Jasmonate hormone to enlarge and increase traumatic resin ducts has been developed in
other types plants, such as in rubber wood, also in norway spruce. In this research, we tried to apply Methyl Jasmonate

WOOD PROPERTIES AND BIODEGRADATION PROCEEDING OF THE FIFTH INTERNATIONAL SYMPOSIUM OF INDONESIAN WOOD RESEARCH SOCIETY
11
in Pinus merkusii. The aim of this research is to know the effect of Methyl Jasmonate on the formation of traumatic resin
dust in pine (Pinus merkusii).
Material and Methods
Field sampling
Wood samples for this study were collected from 11years old pine tree plantation from Perum Perhutani Unit I, Central
Java. Indonesia. More spesific location was on petak 26F, BKPH Jogorogo, KPH Lawu DS. From petak 26F location,
forty five (40) pine tree were chosen as tree samples with classification as follow :
Twenty (20) pine tree used for 1 month duration
Twenty (20) pine tree for 2 month duration, and
Research Tools and Materials
a. 40 Pine wood block (Pinus merkusii) from pine tree plantation.
b. Lanoline, Methyl jasmonat 3 concentration : 0,1%; 0,3% and 0,5%
c. Silol (C5H10), Canada balsam, aquadest and glacial acetic acid
d. Cutter, loupe, sliding microtome, glass preparates, pipette, volumetric flash,.
e. Test tube, object glass, hot plate, preparates box
f. Microscope fluorescence BX 51 software Image Pro Plus V 4.5.
Figure 3. Applicated methyl jasmonate on pines
Samples preparation
Small pine wood blocks were cut from pine tree which had applied with methyl jasmonate hormone for 1 month
and 2 month. Then the pine wood blocks were cut to a rectangular prism (about 1 x 1 cm cross section, and 1 cm height)
with cutter. Transverse section of 20 µm thickness from each pine wood block were cut with a sliding microtome. The
transverse section were stained (with safranin), dehydrated and then observed under the microscope fluorescence
Olympus BX51 and photographed at 40x magnify. From the photograph, we mounted the number of traumatic resin
ducts, and measured width traumatic resin ducts also percentage of trakeid proportion using video image analyzer
(Image pro plus 4.5).

WOOD PROPERTIES AND BIODEGRADATION PROCEEDING OF THE FIFTH INTERNATIONAL SYMPOSIUM OF INDONESIAN WOOD RESEARCH SOCIETY
12
This study was conductsed using completely randomized design with two factors; time duration and concentration
of methyl jasmonate. Two classification of time duration are 1 month and 2 month. Three level concentration of MeJa are
0.1%; 0.3% and 0.5%. The results were anayized using SPSS statistical program.
Result and Discussion
1. Frequency of Traumatic Resin Ducts (TRD)
Result research about the number of traumatic resin ducts on pine which applied three level concentraton methyl
jasmonate hormone are shown on the table below :
Table 1. The number of traumatic resin ducts on pine (Pinus merkusii) (unit/2 mm2)
Time Duration
Concentration MeJa
Average K0 K1 K3 K5
1 0.4 3.2 2.4 1.4 1.85
2 1 3 3.2 2.4 2.4
Average 0.7 3.1 2.8 1.9
Explanation :
K0 : Control
K1 : Concentration methyl jasmonate level 0.1%
K3 : Concentration methyl jasmonate level 0.3%
K5 : Concentration methyl jasmonate level 0.5%
Table 1 showed that both pine tree with 1 month duration and 2 month duration only produced 0.7 traumatic resin
ducts on K-0, whereas pines which applied MeJa had produced 1.9-3.1 traumatic resin ducts. These data indicate that if
we did not give treatment with methyl jasmonate so the formation of traumatic resin ducts on pine tree were done slowly.
This data also indicate that applied methyl jasmonate hormone on pine had stimulated formation of traumatic resin ducts
significantly. Martin et al (2002) state that methyl jasmonate induces formation traumatic resin ductss and terpenoid
accumulation in developing xylem of norway spruce stems.
Figure 4. Number of traumatic resin ducts on Pine (Pinus merkusii) at transverse section
Graph 1. below showed that pine without MeJa treatment (K0) has lower traumatic resin ducts compared to all pine
with MeJa (K1,K3 and K5). Statistical analysis indicate that concentration of MeJa has very significant affected on the
number of traumatic resin ducts. Application methyl jasmonate on pine with K1 and K3 concentration showed increasing
the number of traumatic resin ducts. Tian (2003) state that aplication MeJa was proven to improve resin productsion on
rubber wood. Agree with Tian (2003), Hudgins and Franceschi (2004) reported that increasing MeJa concentration on

WOOD PROPERTIES AND BIODEGRADATION PROCEEDING OF THE FIFTH INTERNATIONAL SYMPOSIUM OF INDONESIAN WOOD RESEARCH SOCIETY
13
Pseudotsuga menziesii had produced traumatic resin ducts as 8 /mm2, moreover on Sequoiadendron giganteum could
produced traumatic resin ducts as 10 /mm2. Meanwhile, Hao and Wu (2000) also reported that application MeJa on
rubber wood (Hevea brasiiliensis ) could improved formation of traumatic resin ducts about 3-7 /mm2.
Graph 1. The number of traumatic resin ducts on pine at diiferent level concentration of MeJa
Application MeJa to stimulate traumatic resin ducts formation on pine were effective until K3 (concentration 0.3%),
because aplication MeJa at K5 concentration showed decreasing formation of traumatic resin ducts. Therefore
application MeJa with concentration more than 0.3% was not suggested based on this data, because the number of
traumatic resin ducts at K5 concentration has lower compared to K1 and K3 concentration. Hudgins and Franceschi
(2004) state that application MeJa to encourage traumatic resin ducts was proven for reprograming of stem cambial zone
for traumatic resin ducts formation on conifer. This data also agree with Hao and Wu (2000) who state that concentration
MeJa at level 0.1% has produced more number of traumatic resin ducts formation in Hevea brasiiliensis.
2. Width of traumatic resin ducts on Pine
Result research about width of traumatic resin ducts on pine which applied three level concentration of methyl jasmonate
(MeJa) hormone are shown on the table below :
Tabel 2. Width of traumatic resin ducts on pine
Time Duration
(month)
Concentration MeJa (%)
Average
K0 K1 K3 K5
1 0.005 0.047 0.037 0.023 0.028
2 0.025 0.04 0.075 0.043 0.046
Average 0.015 0.044 0.056 0.033
The width of traumatic resin ducts on pine are shown on table 2. On concentration K0, both pine 1 month duration
and 2 month duration showed the lowest width traumatic resin ducts. These case indicate that application of methyl
jasmonate on pine tree could push wider the dimension of traumatic resin ducts on pine. This data also indicate that
applied methyl jasmonate hormone on pine tree has encouraged the bigger traumatic resin ducts dimension. Hudgins
and Franceschi (2004) state that observations of stem surfaces indicated that resin exudation was considerably greater
with 100 mm Methyl Jasmonate than lower Methyl Jasmonate concentrations and ethylene, which although not
quantified correlates with the cross-sectional area of traumatic resin ductss formed.
0
1
2
3
4
5
K0 K1 K3 K5
Nu
mb
er o
f T
RD
Concentration of MeJa (%)
Frequency of Traumatic Resin Duct
1 month
2 month

WOOD PROPERTIES AND BIODEGRADATION PROCEEDING OF THE FIFTH INTERNATIONAL SYMPOSIUM OF INDONESIAN WOOD RESEARCH SOCIETY
14
Figure 5. Width of traumatic resin ducts on Pine (Pinus merkusii) at transverse section
Graph 2. showed that traumatic resin ducts on pine tree with no MeJa treatment (K0) has smaller size and
dimension compare to all the pine tree with MeJa (K1, K3 and K5). Statistical analysis indicate that concentration of
MeJa has significantly affected on the width of traumatic resin ducts. Application methyl jasmonate on pine with
concentration K1 and K3 showed increasing the width of traumatic resin ducts. Hudgins and Franceschi (2004) state that
increasing concentration MeJa could improve the width of traumatic resin ducts as 0.00586 mm2 on Pseudotsuga
menziesii, and 0,00612mm2 in Sequoiadendron giganteum. These datas also indicate that adding concentration of MeJa
could push the bigger dimension of traumatic resin ducts until K3, but adding concentration MeJa more than K3 were not
significant affected.
Graph 2. The width of traumatic resin ducts on pine at diiferent level concentration of MeJa
0
0.02
0.04
0.06
0.08
K0 K1 K3 K5
Wid
th o
f T
RD
(m
m2
)
Concentration of MeJa (%)
Width of Traumatic Resin Duct
1 month
2 month

WOOD PROPERTIES AND BIODEGRADATION PROCEEDING OF THE FIFTH INTERNATIONAL SYMPOSIUM OF INDONESIAN WOOD RESEARCH SOCIETY
15
3. Percentage of trakeid proportion
Result research about Percentage of trakeid proportion on pine tree which applied three level methyl jasmonate (MeJa)
hormone are shown on the table below :
Tabel 3. Percentage of trakeid proportion on pine tree
Time Duration
(month)
Concentration MeJa Average
K0 K1 K3 K5
1 97.27 93.21 95.40 98.14 96.0045
2 96.88 94.86 92.15 95.32 94.8045
Average 97.073 94.035 93.779 96.731
The percentage of trakeid proportion on pine are shown on table 3. On concentration level K0, both pine tree 1
month duration and 2 month duration showed the highest trakeid proportion compare to the pine tree which applied MeJa
(K1, K3 and K5). This case indicate that application of methyl jasmonate on pine tree could decreasing percentage of
trakeid proportion on pine. Actually, the decreasing trakeid proportion on pine were caused by increasing the number of
traumatic resin ducts. Graph 1 and 2, showed that applied methyl jasmonate hormone on pine, not only increasing the
number traumatic resin ducts but also the dimension of traumatic resin ductss have more wider than normal resin ducts.
Hudgins and Franceschi (2004) state that observations of stem surfaces indicated that resin exudation was considerably
greater with 100 mm Methyl Jasmonate than lower Methyl Jasmonate concentrations and ethylene, which although not
quantified correlates with the cross-sectional area of traumatic resin ducts formed.
Graph 3. Trakeid proportion on pine at diiferent level concentration of MeJa
Graph 3. showed that trakeid proportion on pine tree with no MeJa treatment (K0) has highest trakeid proportion
compare to the pine with MeJa (K1 and K3). Statistical analysis indicate that concentration level of MeJa has affected
significantly on the trakeid proportion. Application methyl jasmonate on pine with concentration K1 and K3 showed
decreasing on trakeid proportion, but at concentration level K5, showed increasing the trakeid proportion on pine tree.
Increasing trakeid proportion at concentration level K5 were caused by decreasing the number of traumatic resin ducts
and more smaller the dimension of traumatic resin ducts.
89.00
90.00
91.00
92.00
93.00
94.00
95.00
96.00
97.00
98.00
99.00
K0 K1 K3 K5
Pe
rce
nta
ge o
f T
rake
id (
%)
Concentration of MeJa (%)
Trakeid Proportion on Pine tree
1 month
2 month

WOOD PROPERTIES AND BIODEGRADATION PROCEEDING OF THE FIFTH INTERNATIONAL SYMPOSIUM OF INDONESIAN WOOD RESEARCH SOCIETY
16
Conclusion
Methyl jasmonate hormone could stimulate traumatic resin ducts formation on pine (Pinus merkusii Jungh et de
Vriese). Concentrations of methyl jasmonate were very significant affected on the number traumatic resin ducts and
significant affected on the width traumatic resin ducts. Trakeid proportion on pines had decreased after applicated methy
jasmonate. Decreasing trakeid proportion were caused by increasing the number and width of traumatic resin ducts on
pines. Application of MeJa on pine to stimulate traumatic resin ducts formation were effective only at K1 and K3
(concentration 0.1 and 0.3%). Otherwise, at K5 (concentration 0.5%), showed decreasing the number of traumatic resin
ducts. Concentration methyl jasmonate has also significant affected on trakeid proportion.
The duration treatment was not affected signicantly on traumatic resin ducts formation, neither the number nor the
width of traumatic resin ducts. The time duration was not affected signicantly on trakeid proportion.
References
Bing, Zhao Hao and Wu Ji Lin, 2000. Laticifer Differentiation in Hevea braziliensis: Inductsion by exogenous Jasmonic
acid and Linolenic acid. Annals of Botany Company.
Coppen and Hone, 1995. Non-Wood Forest Products Series nr. 2: Gum Naval Stores: turpentine and rosin from pine
resin. http://www.fao.org
Coppen, 1995. Non-Wood Forest Products Series nr. 6: Gums, resins and latexes of plant origin. http://www.fao.org
Hudgins, J.W. and Vincent R. Franceschi, 2004. Methyl Jasmonate-Induced Ethylene Productsion Is Responsible for
Conifer Phloem Defense Responses and Reprogramming of Stem Cambial Zone for Traumatic Resin Ducts
Formation: School of Biological Science, Washington state University, Pullman. Washington
Krokene, P., Nagy N.E. and Trygve K, 2010. Traumatic resin ductss and Polyphenolic parenchyma cells in conifers.
Tidak diterbitkan.
Martin, Diane, Dorothea Tholl, Jonathan Gershenzon, and Jorg Bohlmann, 2002. Methyl Jasmonate Induces Traumatic
Resin Ducts, Terpenoid Resin Biosynthesis, and Terpenoid Accumulation in Developing Xylem of Norway
Spruce Stem. Plant Physiol. Vol. 129.
Tian, Wei Min, 2003. Localized effect of mechanical wounding and exogenous jasmonic acid on the inductsion of
secondary laticifer differentiation in relation to the distribution of jasmonic acid in Hevea Brasiiliensis. Acta
Botanica Sinica Vol. 45 No.11

WOOD PROPERTIES AND BIODEGRADATION PROCEEDING OF THE FIFTH INTERNATIONAL SYMPOSIUM OF INDONESIAN WOOD RESEARCH SOCIETY
17
PROPERTIES OF HEAT TREATED TEAK WOOD FROM COMMUNITY FOREST
Tibertius Agus Prayitno, Ragil Widyorini, Irwanto dan Rysha Ayu Mayang Sari*)
Laboratory of Sawmilling and Wood Composite, Wood Science and Technology Dept.,
Faculty of Forestry UGM,
Email: [email protected]
ABSTRACT
Wood product demand in Indonesia has been increasing parallel to the population growth, while wood supply shows the
reverse trend. The Indonesian forests potency for log production has been decreasing in area and its productivity. For
that reason community forests have emerged as an alternatives log sources. Unfortunately the quality of logs harvested
from the community forests are lower quality than logs obtained from natural and plantation forests. For instance, a
comparison of teak log quality from plantation with teak log quality of community forests results that the last is inferior to
the first. Therefore the logs coming from community forests need to be improved. One of many wood technologies
available and suitable for log quality improvement is heat treatment. This research’s objective is to know the best quality
improvement in teak logs which is harvested from community forests.
In order to achieve the objective of the research, a CRD with factorial experiment was employed. The two factors
involved were heating method and heating time with three levels for each factor. The heating method factor consisted of
oven, steaming and boiling method, while the heating time factor consisted of 1, 2 and 3 hour heating time. The chosen
replication was three times. The log quality improvement was determined by physical parameters namely, color change,
surface roughness, wettability and equilibrium moisture content (EMC).
The research results showed that the interaction between heating method and heating time influenced very significantly
on wood color change, moisture content and surface roughness. Highest red and yellow color element was produced by
steam 2 hours. Lowest red color element was produced by oven 1 hour while lowest yellow color element was produced
by oven 3 hours. The highest surface roughness was observed in boiling 1 hour. The highest equilibrium moisture
content was produced by boiling 3 hours.
Keywords: heating treatment, color change, surface roughness, wettability, teak wood
INTRODUCTION
Indonesian community forests have emerged as alternatives of log sources recently. Inventory data in 2003
showed that the community forests potency was 1,560,299ha and capable to produce 39,564,003cum (Pandit, 2004). It
has been noted for several years that the rural people usually do not follow strictly the teak silviculture system. They cut
the teak trees when they need money and no longer pay attention to the silviculture consideration. For that reason the
teak log quality coming from this type of community forests are inferior compared to those obtained from Perhutani. In
this situation the buyers need some wood technologies for improving the teak log quality. Wood scientists have been
doing some intensive research on this low quality of wood. They have come with many technologies so-called wood
modification. One of those available technologies is heat treatment. Heat treatment is considered as a wide range
application technology and can be used in the community area by the rural people. For that reason, this heat treatment
was chosen for log quality improvement. Heat treatment is capable to improve wood properties such as wood defects
reduction (bowing, rupture, resin deposits) and strength gain, durability, wood working and machining properties. This
wood quality improvement might be caused by wood anatomy changes due to heat treatment. It was proven that heat
treament can reduce wood moisture equilibrium (EMC), reduction of volatile organic compound (VOC) emission, increase
wood stabilisation, fungi infection reduction and of course darkening wood colour (Esteves et al., 2007). Besides, the
heat treatment will increase wood weathering durability, wood color uniformity but reduction of wood wettability (Awoyani
and Jones, 2010).
Heat treatment is affected by the heating temperature and heating time significantly. Some degree of wood
degradation has been observed when wood heating temperature is increased. However the heating time exerts more
effect than the heating temperature (Esteves et al., 2007). Several technique of heat treatment has been developed such
as hydrothermal, steaming or steam injection, oven, radio frequency and others. Each heat treatment technique has
advantages and disadvantages. Each technique requires a certain and specific tools for its application and heating
process and the ultimate effect. Generally the heat treatment employs relative high heating temperature and high steam

WOOD PROPERTIES AND BIODEGRADATION PROCEEDING OF THE FIFTH INTERNATIONAL SYMPOSIUM OF INDONESIAN WOOD RESEARCH SOCIETY
18
pressure. Finnaly, heat treatment effect is influenced by the wood characteristic itself. For that reason each type of wood
will give a certain and specific response to the specific heat treatment applied. Spruce wood heat treatment by oven was
done by Pavlo dan Niemz (2003) dalam Kocaefe et al. (2008). The research result showed that wood properties
improvement were detected in terms increase wood stabilisation and uniform dark colour, but a decreased in mechanical
strength. The heat treatment caused some degree of hemicellulose degradation that promoted the increase of wood
stabilisation. Heat treatment at 2200C for 1 hour can reduce wood swelling thickness amoun to 16.5% and wood specific
gravity decrease at about 7.91% and MOR reduction of 2.3%. When the heating time is prolonged to 2 hours then the
reduction of MOR is more severe but the wood stabilisation becomes better. Heat treatment by steaming european wood
namely black locust (Robinia pseudoacacia), oak (Quercus robur) and tropical wood namely merbau (Intsia bijuga),
sapupuira (Hymenolobium petraeum) was conducted by Varga dan van de Zee (2008). The treatment used four levels of
heating temperature of 92°C, 108°C, 115°C, 122°C combined with three levels of heating time of 3; 7,5 and 20 hours.
The results showed that adhesion properties is increased parallel with increasing of heating temperature especially for
supupuira wood.
Wood adhesion quality is influenced by so many factors. Those factors are classified into three groups namely
wood factors, adhesive factors and processing factors. Wood wettability and surface smoothness are the significant
wood factors in adhesion. These two wood properties might be influenced by heat treatment (Awoyani dan Jones, 2010).
Heat treatment might alter wood wettability in such a way depneding the medium of heating such as steam or boilling
water. Heat treatment by oven (radiant heating) or radio frequency might affect differently to the wood wettability
(Prayitno, 1999). In mechanical adhesion theorem, adhesive liquid will penetrate to the wood and solidify in the wood in
such a way that interlocking of the adhesive with the wood occurred (Brown et al., 1952). For that reason the clean
pathway of adhesive flow into the wood is needed.
This research is aimed at determination of wood properties change caused by the heat treatment. The
treatment is formed by two factors namely heating medium and heating time. The heat treatment used three type of
heating medium namely oven, steaming and boilling. The heating time is 1,2 and 3 hours. For that reason the total
treatment is 9 and those treatment is employed in three replicates.
METODOLOGY
A. Materials
The research materials consisted of teak-wood lumber (Tectona sp.). The teak log was obtained from the
community forest in GunungKidul District, Yogyakarta Province. The log diameter ranged from 13-23cm. The research
tools consisted of circular saw, planner, grinder, electronic balances, oven, steam production, gas stove, dessicator, filter
paper, thermometer, surface roughness tester, spectrophotometer, moisture meter.
B.Methods
Quarter sawn teak wood lumber is obtained from teaklogs and then cut into 1 cm thick x 4 cm width x 20 cm
long. The samples were then subjected to heat treatment according to the combination of heating medium and heating
time. Three heating medium were oven, steaming and boiling in water, while the heating time is 1,2 and 3 hours. The
total treatment were 9 factor combination and conducted in three replication. After heat treatment the sampels were
subjected to conditioning process in the laboratory of wood composite for at least a week.
1. Color Test
Color test was conducted on the tangential surface of the wood samples by using Spectrophotometer NF 333
(Nippon Denshoku Ind. Co Ltd.). Three points of color measurements were conducted. Three color elements scale of
CIELAB were recorded, namely L* (lightness), a* (red-green scale), dan b* (yellow-blue scale). The wood color was
determined with the average values of three measurement points of each sample. The wood color change ΔE*ab was
calculated by (ΔL*² + Δa*² + Δb*²)1/2, where ΔL*, Δa*, and Δb* were the color element scale value difference before and
after heat treatment.
2. Moisture Content
The moisture content of the samples was determined after conditioning period. The moisture measurement was
conducted by moisture meter.
3. Wettability
Wood wettability determination was done by following the Corrected Water Absorption Height (CWAH) method.
The CWAH measurement used wood particles passed 40 mesh and retained at 60 mesh sieves. The wettability was
calculated by using formula:

WOOD PROPERTIES AND BIODEGRADATION PROCEEDING OF THE FIFTH INTERNATIONAL SYMPOSIUM OF INDONESIAN WOOD RESEARCH SOCIETY
19
d2 π h2
CWAH = h1x FK = h1 x ----------
4 w s
where :
CWAH : the corrected water absorbtion
FK : correction factor
h1 : water adsorption height (mm)
h2 : wood particle height (cm)
d : glass tube inner diameter (cm)
π : 22/7= 3,14
w : ovendried weight wood particle (gr)
s : water specific volume (cm3/gr)
4. Surface Roughness
Surface roughness was detected by using the surface roughness tester. The surface roughness variables
detected were average (Ra). The instrument was kalibrated every 100 measurement by standard roughness plate ( Ra
ranges from 3,02 µm - 0,48 µm) and cut-off length 2,54 mm. The surface roughness measurement was conducted after
the samples subjected to planner. The instrument for this surface roughness determintation was Surface Roughness
Tester SRG – 4000 Phase II.
RESULTS AND DISCUSSION
The data of wood sample color elements scale following CIELAB system are presented in the Table 1. They
consisted of lightness or brightness differences before and after heat treatment (ΔL*), the differences of red-green scale
or redness (Δa*), the differences of yellow-blue scale or yellowness (Δb*) and the wood color change (ΔE) that is the
resultant wood color change after heat treatment.
Tabel 1. Average of Brightness, Redness, Yellowness and Wood Color Change of Teak wood
Parameter Heating
Method
Heating Time Average
1 hour 2 hour 3 hour
Lightness ΔL* Oven 5.30 2.39 2.57 3.42
Steam 16.54 17.22 22.48 18.75
Boiling 2.36 0.75 1.65 1.59
Red-green Δa* Oven 0.73 1.01 1.17 0.97
Steam 0.91 4.95 1.22 2.36
Boiling 2.25 3.34 2.85 2.81
Yellow-blue Δb* Oven 1.37 1.62 0.58 1.19
Steam 1.62 9.94 8.15 6.57
Boiling 4.92 7.56 7.87 6.78
Wood Color Change ΔE*ab Oven 5.54 3.38 2.96 6.22
Steam 17.24 20.54 24.00 22.67
Boiling 6.05 9.28 8.64 15.55
Table 1 shows that steam treatment can increase significantly the lightness (brightness) of teak wood samples
(18.75), compared to the other color elements scale CIELAB system such as the red-green and yellow-blue scale. It is
observed also that wood color change is contributed significantly by steam treatment (22.67). Heating method by oven
produced the small lightness or more darker (3.42) than steam one. The darkest color was resulted by boiling method
(1.59). Steaming wood has been studied by some researchers by using varied steam temperature or steam pressure and
the steaming time from several hours up to several days. Steaming has been observed that affect the wood lightness
significantly when heating time is much longer such as daily period (Tolvaj et al. 2012). Research on wood steaming and
oven treatment comparison was conducted by Todaro et al. (2010) on Turkey oak. The results showed that the steaming

WOOD PROPERTIES AND BIODEGRADATION PROCEEDING OF THE FIFTH INTERNATIONAL SYMPOSIUM OF INDONESIAN WOOD RESEARCH SOCIETY
20
is more effective in lightness change compared to the oven method. This research result proves that the effect is parallel
with the data presented in Table 1.
In terms of redness scale values, the teak wood after treatment tended to show the red scale than the green
side. This was due to the initial color of teak wood itself. The wood color change appeared to be less contributed by this
red scale than the yellow coordinate. Table 1 showed that heating method of steaming and boiling is more effective than
oven. The average of redness produced by oven method was only 0.97, while the steaming and boiling method showed
higher values of 2.36 and 2.81 respectively.
In term of yellow color element scale, the same trend was observed that the highest yellowness was produced
by boiling method and then followed by the steam treatment and finally by oven method. The average of yellowness
scale of three heating methods were 1.19; 6.57 and 6.78 consecutively.
In terms of wood color change, three heating methods showed quite differerent values of color element
change. The highest effect was still produced by steaming method and then followed by boiling method and finally by
oven method. When heating wood by oven, the effect was observed to be slowing down from 1 hour to 3 hour heating
time. However, the other two heating methods namely steaming and boiling, a different effect was observed. The longer
heating time, the greater color change values. The variation color change by oven was 5.54; 3.38 and 2.96 for 1, 2 and 3
hour of heating time. Variation of color change caused by steam was 17.24; 20.54 and 24.00, while boiling method
produced 6.05; 9.28 and 8.64 respectively. Esteves et al., 2007) mentioned that heating wood causing darkening wood
materials and this effect observed the same in the color variation results. The darkening color of wood has been
observed in kiln dryer during wood drying before the wood adhesion processing (Prayitno, 1999). In this case of wood
drying, the extractives migration from the inner portion to the wood surface was observed and finally making a browning
effect on the wood surface. Some wood extractives observed in browning effect was carbohydrate, small weight of
nitrogen compound that capable of producing brown reaction products (Sundqvist, 2004). Amadori-Maillard reaction
between lignin and hydrolysis carbohydrate support the brown and darkening wood color (McDonald et. al, 1997 dan
2000 dalam Sundqvist, 2004). Figure 1 shows a visual variation of all color elements of the teak wood after heat
treatment from lightness (A), redness (B), yellowness (C) and wood color change (D).
Figure 1. Overall Comparison Color Elemenst of Teak Wood after Heat Treatment
0
5
10
15
20
25
1 hour 2 hour 3 hour
Lightness ΔL* Oven
Lightness ΔL* Steam
Lightness ΔL* Boiling 0
1
2
3
4
5
6
1 hour 2 hour 3 hour
Red-green Δa* Oven
Red-green Δa* Steam
Red-green Δa* Boiling
0
2
4
6
8
10
12
1 hour 2 hour 3 hour
Yellow-blue Δb* Oven
Yellow-blue Δb* Steam
Yellow-blue Δb* Boiling 0
5
10
15
20
25
30
1 hour 2 hour 3 hour
Wood Color Change ΔE*ab Oven
Wood Color Change ΔE*ab Steam
A B
C D

WOOD PROPERTIES AND BIODEGRADATION PROCEEDING OF THE FIFTH INTERNATIONAL SYMPOSIUM OF INDONESIAN WOOD RESEARCH SOCIETY
21
Analysis of varians of the color element data is presented in Table 2. It was shown that the interaction between
heating method and heating time was observed only in the color elements (hue), namely redness and yellowness. This
result proves that the color change is influenced by the combination of heating method and heating time and can not be
subjected to only single factor (Tolvaj et al, 2012). On the other hand the brightness and the wood color change were not
influenced by the the factors combination but affected significantly by heating method.
Table 2. ANOVA of Teak Wood Color Elements
Variable F calculated, Significance levels
Interaction Heating Method Heating Time
Brightness ΔL* 0.186ns 0.000** 0.347ns
Redness Δa* 0.000** 0.000** 0.000**
Yellowness Δb* 0.002** 0.000** 0.000**
Wood Color Change ΔE 0.156ns 0.000** 0.324ns
Remarks: **) highly significant; *) significant; ns) non significant.
The physical wood properties are affected by heating treatment. Esteves et al. (2007) mentioned that heat
treatment on wood can reduce equilibrium moisture content and increase the wood stability. Heat treatment could
increase the hydrophobicity or reduce the hygroscopicity of the wood due to alteration of wood chemistry. The heat
treatment therefore could reduce the wood wettability due to increased hydrophobicity. Korkut et al.(2008) mentioned in
their research that heat treatment reduced the wood surface roughness. As mentioned above in order to know the
variation effect of heat treatment on teak wood obtained from community forests the research was conducted. Table 3
summarize the physical properties of teak wood after heat treatment.
Table 3. Average of Equilibrium Moisture Content, Surface Roughness and Wettability of Teak
Wood after Heat Treatment
Parameter Heating
Method
Heating Time Average
1 hour 2 hour 3 hour
Equilibrium Moisture Content (EMC)
(%)
Oven 2.24 1.75 2.54 2.18
Steam 0.49 2.69 1.21 1.46
Boiling 1.48 3.72 3.78 2.99
Surface Roughness (Ra,um) Oven 0.94 2.23 1.24 1.47
Steam 1.32 1.06 1,14 1.17
Boiling 3.31 1.88 2.20 2.46
Wettability (CWAH,mm) Oven 215.20 233.61 235.35 228.05
Steam 188.92 196.63 199.87 195.14
Boiling 209.72 197.31 208.52 205.18
Kallander and Landel (2007) conducting research of heat treatment on equilibrium moisture content and
several physical characteristics of wood. The heat treatment was found to reduce EMC of wood. Table 3 shows that
lowest EMC of teak wood is produced by steam treatment followed by oven and boiling method. Variation of EMC due to
heating time factors does not consistently. Analysis of varians of EMC of teakwood presented in Table 4 shows that this
EMC is influenced significantly by the interaction effect. This means that the EMC is specific wood parameter that is not
affected by single factor of the research. For that reason EMS is dependent on the combination of heating method and
heating time. Sayar and Tarmian (2013) explained that this alteration of EMC might be due to reduction of vapor diffusion
coefficient in the wood or among wood cells. Heating treatment at 160-220 oC in douglas fir could reduce EMC in the
range of 5,34 – 42.63%.

WOOD PROPERTIES AND BIODEGRADATION PROCEEDING OF THE FIFTH INTERNATIONAL SYMPOSIUM OF INDONESIAN WOOD RESEARCH SOCIETY
22
Table 4. ANOVA of teak wood physical properties after heat treatment
Variable F calculated, Significance levels
Interaction Heating Method Heating Time
Moisture Content (%) 0,000** 0,000** 0,000**
Surface Roughness (Ra,um) 0,000** 0,000** 0,101ns
Wettability(CWAH,mm) 0,514ns 0,001** 0,393ns
In terms of surface roughness, Table 3 shows that the lowest roughness is produced by steam treatment
followed by oven and the last is boiling method. The three heat treatment effectively reduce the surface roughness of
teak wood. Korkut et al. (2008) concluded from their research that surface roughness decreased with increasing
temperature and treatment cycles. Heating time factor seems does not exert an effect on the surface roughness.
According to the analysis of variance of the surface roughness data, the intercation of the two factors involved in the
research, namley heating method and heating time influenced very significantly to the average of surface roughness.
This result is similar to the effect on the equilibrium moisture content. This means that this surface roughness is not
dependable only to one factor but also the other factor. Oven method produced roughness values of 0,94; 2.23 and
1.24 due to heating time. On the other hand the steam method produced roughness of 1.32; 1.06 and 1.14 respectively,
while the boiling method produced values of 3.31; 1.88 and 2.20 consecutively.
Wettability of the wood is a measure of the readiness of the wood to be wetted by a liquid. Generally water is
used to measure the wood wettability since the wood is hygroscopic materials. When wood is wettable than water
molecules are easily attaced to the wood molecules. On the contrary, the wood that is not wettable is detected by very
difficult water molecules to attach to the wood molecules (Prayitno, 1999). This condition of unwettable wood might be
caused by heating treatment which convert surface of the wood to the inactive condition Forbes (1998). Wood wettability
is determined by following the CWAH procedure. Table 3 shows that the oven heating method produced highest average
of CWAH followed by boiling and the least one is produced by steaming method. From the above data this steam method
has been showing a significant factor influencing the teakwood properties. Steaming method has shown to produce a
higher value of lightness, clear hue (red ness and yellowness), less EMC and less surface roughness, and finally low
wettability or high hydrophobicity. Figure 2 shows the variation of EMC, surface roughness and wettability of teak wood
after heat treatment.

WOOD PROPERTIES AND BIODEGRADATION PROCEEDING OF THE FIFTH INTERNATIONAL SYMPOSIUM OF INDONESIAN WOOD RESEARCH SOCIETY
23
Figure 2. The variation of EMC (A), Surface Roughness (B) and Wettability (C)
CONCLUSION
Based on the data analysis and its discussion, the some conclusion can be drawn as follow.
1. Interaction between heating method and heating time influenced very significantly to red and yellow scale of CIELAB color system. This wood color is dependable not only to heating method but to the heating time as well. The interaction of the two factors affect very significantly to EMC and surface roughness of the teak wood. For that reason these four teak wood properties vary according to the combination effect. Combination of red and yellow color that is matching to the natural teak wood color is produced by steaming and boiling at 2 hours heating time. (redness of 4.95 and 3.34 and yellowness of 9.94 and 7.56 for steaming and boiling respectively). The least EMC steaming and boiling are 0.49 and 1.48 for 1 hour heating time, while the smoothness of the surface produced by oven method 1 hour heating time (0.94) and 1.06 produced by steaming 2 hour.
2. Heating method factor affecting very significantly to the brightness, wood color change and the wood wettability. The steaming method has produced the highest values of lightness and wood color change (18.75 and 22.67 respectively), while the highest wettability is produced by oven method (228.05).
REFERENCES
Awoyani, L.and IP. Jones. 2010. Anatomical Explanation for Changes in Properties of Western Red Cedar (Thuja
plicata) Wood During Heat Treatment. Wood Sci Technol. DOI 10.1007/s0026-010-0315-9
Brown, HP., AJ.Panshin, and CC.Forsaith. 1952. Textbook of Wood Technology. Vol.II. McGraw-Hill Book.Co. New York.
Esteves, B., AV. Marquez, I. Domingos, and Pererira. 2007. Influence of Steam Heating on The Properties of Pine (Pinus
pinaster) and Eucalypt (Eucalyptus globulus). Wood Sci Technol 41 : 193-207.
Forbes, C, 1998. Wood surface inactivation and adhesive bonding. North Carolina State University. Raleigh
Kallandet B and P. Landel. 2007. Effect of heat Treatment of Small Clear Wood Samples on Equilibrium Moisture
Content and Deformation. COST E 53 Conference. Poland.
Kocaefe D., S.Poncsak, G.Dore, and R.Younsi. 2008. Effect of Heat Treatment on Wettability of White Ash and Soft
Maple by Water. Holz Roh Werkst 66 : 355-361.
0
0.5
1
1.5
2
2.5
3
3.5
4
1 hour 2 hour 3 hour
Equilibrium Moisture Content (EMC) (%) Oven
Equilibrium Moisture Content (EMC) (%) Steam
0
0.5
1
1.5
2
2.5
3
3.5
1 hour 2 hour 3 hour
Surface Roughness (Ra,um) Oven
Surface Roughness (Ra,um) Steam
0
50
100
150
200
250
1 hour 2 hour 3 hour
Wettability (CWAH,mm) Oven
Wettability (CWAH,mm) Steam
Wettability (CWAH,mm) Boiling
A
C
B

WOOD PROPERTIES AND BIODEGRADATION PROCEEDING OF THE FIFTH INTERNATIONAL SYMPOSIUM OF INDONESIAN WOOD RESEARCH SOCIETY
24
Korkut,DS, S.Korkut, I.Bekar, M.Budakci, T.Dilik and N.Cakicier. 2008. The Effect of Geat Treatment on the Physical
Properties and Surface Roughness of Turkish Hazel (Corylus colurna L) Wood. International Journal of
Molecular Sciences 9:1772-1783.
Pandit IKN. 2004. Hutan Tanaman Industri dan Kualitas Kayu yang Dihasilkan. Bahan Makalah,
http://hti_klyd/makalah_pandit.htm
Prayitno TA. 1999. Perekatan Kayu. Bagian Penerbitan Yayasan Pembina Fakultas Kehutanan UGM. Yogyakarta.
Sayar,M and A. Tarmian. 2013. Modification of water vapor diffusion in poplar Wood (Populus nigra L) by sSteaming at
High Temperatures. TUBITAK 37:511-515.
Sulistyawati,I. and S.Ruhendi. 2008. Hubungan Wetabilitas terhadap Keterekatan Tiga Jenis Kayu Struktural. Rimba
Kalimantan :54 – 60.
Sundqvist.B. 2004. Colour Changes and Acid Formation in Wood During Heating. Doctoral Thesis. Lulea Unibversity of
Technology.Sweden.
Todaro,L. R.Zanuttini, A.Scopa and N.Moretti. 2010. Influence of Combined Hydro-thermal Treatments on Selected
Properties of Turkey Oak (Quercus cerris L) Wood. Wood Sci and Tech 46:563-578.
Tolvaj,L., G.Papp, D.Varga and E.Lang. 2012. Effect of Steaming on the Color Change of Softwood. BioResource
7(3):2799-2808.
Varga D. and ME. van der Zee. 2008. Influence of Steaming on Selected Wood Properties of Four Hardwood spesies.
Holz Roh Werkst 66:11-18.

BIOCOMPOSITE AND TIMBER ENGINEERING
PROCEEDING OF THE FIFTH INTERNATIONAL SYMPOSIUM OF INDONESIAN WOOD RESEARCH SOCIETY
25
APPLICATION OF CARBON DIOXIDE INJECTION TECHNOLOGY IN BAMBOO
CEMENT BOARD PRODUCTION
Bakri, Djamal Sanusi, Musrizal Muin, Baharuddin
Laboratory of Forest Product Utilization and Processing,
Faculty of Forestry, Hasanuddin University, Makassar, Indonesia
Corresponding author, email : [email protected]
ABSTRACT
The objective of this study was to evaluate the effect of the incorporation of injection of CO2 in liquid phase at 30 minutes
of curing time period to the physical and mechanical properties of cement board made from bamboo culm particles of
Gigantochloa atter, Dendrocalamus asper and Schizostachyium brachycla. Mixtures of bamboo culm particles, cement,
and water on the ratio by weight of 1 : 2.5 : 1.25 were casted in iron plate mold of 25 x 25 x 1 cm3, pressed and then
hold for 24 hours to obtain the targeted density of cement board samples of 1 g/cm3. Samples were cut in accordance
with the size of physical and mechanical testing of and then injected by CO2 in liquid phase at 30 minutes of curing time
period. Samples of cement board were tested for physical and mechanical properties according to Japanese Industrial
Standard (JIS) A 5417-1992. Results showed that the physical properties consisted of moisture content of the boards
ranging from 3.15% to 3.62%, density from 0.68 g/cm3 to 0.80 g/cm3, water absorption for 24 hours from 45.11% to
57.60%, linear swelling for 24 hours from 0.13% to 0.27 and thickness swelling for 24 hours from 0.65% to 0.87%.
Mechanical properties consisted of internal bond ranging from 0.18 kg/cm2 to 0.74 kg/cm2, MOE from 1339.03 kg/cm2 to
5030.50 kg/cm2 and MOR from 40.12 kg/cm2 to 79.59 kg/cm2. Only cement board made from mixture of Gigantochloa
atter particles, Portland cement and water met physical properties requirement of JIS A 5417-1992 and no cement board
satisfied mechanical properties requirement of JIS A 5417-1992
Key words: bamboo, Carbon dioxide injection, Cement Board.
Introduction
The use of petroleum-based resins such as urea and phenol formaldehyde for conventional lignocellulosic-
based composite boards for years has shown the increase of cost due to the gradual increasing of petroleum cost. Also,
emission of formaldehyde-based resins in panels has been known to cause eye, nose, and throat irritation as well as
coughing and breathing difficulties. The alternative to replace the petroleum-based binders is quite possible since many
studies showed that the inorganic binders or ceramic materials such as Portland cement can be used as a potential
matrix for lignocellulosic-based composite boards manufacturing.
The ability of Portland cement to bind the lignocellulosic materials is caused by existence of certain chemical
elements in Portland cement that can harden at certain temperature. The Portland cement binder provides a durable
surface as well as one that can be easily embossed and colored with a range of processing methods to provide a variety
of products that are easily machined with conventional wood-working tools (Erakhrumen, A. A. et al., 2008).
The use of lignocellulosics materials as aggregate such as wood has been widely used to produce cement
boards for non-structural purposes such as walls and ceilings. However, since the growing concern of resource reduction
of wood, many researchers to seek and develop new materials relying on the other renewable sources. Bamboo is one
of the most important raw material to substitute wood due to its abundant availability, fast growing, and easy to be
planted(Muin, M., et al., 2006). As a cheap and fast-grown resource with superior physical and mechanical properties
compared to most wood species, bamboo offers great potential as an alternative to wood.
Use of bamboo as raw material of cement board by using conventional technology has been researched by
Suhasman and Bakri (2012). However, some characteristics of the cement board have not fulfilled the requirement.
Increased research during the recent years has considerably contributed to the understanding of bamboo as well as to
improved processing technologies for broader uses (Li. X., 2008). Taking advantage of the wide distribution, renewability,
and recyclability of bamboo, more markets will be developed for these low-cost renewable materials.
Manufacturing of cement board composite is principally similar to conventional board composite. The
variations only commonly take place on the pressing time and method to be applied because different type of the binder.

BIOCOMPOSITE AND TIMBER ENGINEERING
PROCEEDING OF THE FIFTH INTERNATIONAL SYMPOSIUM OF INDONESIAN WOOD RESEARCH SOCIETY
26
Manufacturing process of cement board composite is accomplished by mixing lignocellulosic material, Portland cement,
water and others supplementary materials and then pressed for consolidation. Pressing is hold until 24 hours to harden
and densificate the board. Although densification and hardening condition of the board has been developed for 24 hours,
fully strength of the board will be achieved at 28 days curing process.
Hardening process will be hampered and curing process will take longer time if the lignocellulosic materials contain
large amount of hydrolysable hemiselluloce and extractive substances. The alkali medium produced by cement
dissolves the extractives and hemiselluloce which, in turn, reacts as retardant to cement (Moslemi, A.A., 1989). The effort
to shorten the setting time was accomplished by the addition of the accelerators (Simatupang, M.H. et al., 1991).
Relatively new concept developed to speed up hardening process on cement board composite is to apply carbon
dioxide injection in to the cement board. This method was patented by British Patent in 1979 and Japanese Patent in
1986. Injection of CO2 gas in to the cement board results in calcium carbonate (CaCO3) to increase early strength of
cement board. This allows to remove the cement board from the mold just in several minutes.
Conblock heated by CO2 during pressing process increased the conblock strength (Berger, R.L. et al., 1972).
Injection of CO2 gas in to the cement board shortened the pressing time (Simatupang, M.H. and R.L. Geimer, 1990).
Hardening process reduced form 8 hours to 5 minutes by CO2 injection in to the board to speed up the production
(Lahtinen, P.K., 1991). CO2 injection in to the cement board reduced inhibitory effect of several wood species to the
cement hydration (Moslemi, A.A. et al., 1993). Use of CO2 injection in supercritical gas phase to reduce curing time
the cement board manufacturing increase some physical and mechanical properties of the board (Hermawan (2001a).
Material and Method
Material
All of bamboo species used in this research was taken from Regency of Maros, province of South Sulawesi. 1
to 2 years old of bambu parring (Gigantochloa atter), bambu betung (Dendrocalamus asper), and bambu tallang
(Schizostachyium brachycladum) culms were grinded in mill refiner to obtain particles which passed through a 10-mesh
screen and remained on a 40-mesh screen for measurement of hydration temperature. Particles used for core layer of
cement board manufacturing were particles which passed a 10-mesh screen and remained on 20-mesh screen and for
face and back layers were which passed a 20-mesh screen and remained on 40-mesh screen. Type I commercial
Portland cement ( available on the local market in Makassar) was used as matrix or binder.)
Measurement of Hydration Temperature
Bamboo particles mixed with Portland cement and water on the ratio of 1: 13,3:6,65 then stirred to get
homogenous paste (Hermawan 2001b). Paste poured in plastic glass and put into airtight styrene foam container. A
Thermometer in glass tube (contained barco oil) was put into styrene foam container through a hollow at container cap.
Hydration temperature recorded at each 1 hour interval period for 24 hours during the hydration process.
Board Manufacturing and CO2 Injection
Cement board manufactured by mixing bamboo particles, Portland cement and water on the ratio of 1 : 2.5 :
1,25. Targeted density of the cement board was 1 g/cm3 and targeted thickness was 1 cm. Smoother particles which
passed a 10-mesh screen and remained on 20-mesh screen were used for face and back layers, while coarser particles
which passed a 10-mesh screen and remained on 20-mesh screen were used for core layer for cement board
manufacturing. Particles size ratio of face : core : back was 15% :70 % : 15 %.
Bamboo particles were immersed in water for 48 hours to remove the extractives and dried in room
temperature until reached moisture content of 30%. Bamboo particles, Portland cement and water stirred until
homogenous mixture obtained. Mixture poured into iron plate of 25 cm x 25 cm x 1 cm that was covered by plastic sheet
and pressed for 24 hours during the setting time. Mixture was converted to solid cement board after setting time
completed.
Injection of CO2 in liquid phase into the cement board carried out for curing for 30 minutes. Sample of cement
board was put into injection tube and CO2 flowed into the injection tube. Liquid phase of CO2 reached by setting the tube
temperature at 15o and tube pressure at 50 kg/cm2 for 30 minutes. Cement board was removed from the tube and put

BIOCOMPOSITE AND TIMBER ENGINEERING
PROCEEDING OF THE FIFTH INTERNATIONAL SYMPOSIUM OF INDONESIAN WOOD RESEARCH SOCIETY
27
into desicator for 15 minutes. Cement board was weighed and put into oven for the next curing at 80o Celsius for 10
hours.
Testing
Samples of cement board were tested for physical and mechanical properties according to Japanese Industrial
Standard (JIS) A JIS A 5417:1992. Testing for physical properties included density, moisture content, water absorption,
thickness swelling and linear expansion. While testing for mechanical properties included modulus of rupture, modulus of
elasticity and internal bond.
Result and Discussion
Hydration Temperature
Result on the hydration temperature during the hydration process of mixture of bamboo particles, cement and
water can is shown in hydration curve on Figure 1. Figure 1 shows that maximum hydration temperature of mixture of
Schizostachyium brachycladum particles, Portland cement and water was 39o C, mixture of Dendrocalamus asper
particles, Portland cement and water was 38o C and mixture of Gigantochloa atter particles, Portland cement and water
was 34o C. Based on Kamil Classification (1970), maximum hydration temperature of all of the mixtures was categorized
as low. It can be observed from the curve of hydration in Figure 1. that each bamboo species reacted differently with
Portland cement. Although time required to reach maximum hydration temperature by mixture of Dendrocalamus asper
particles, Portland cement and water was shorter (3 hours) than mixture of Gigantochloa atter particles, Portland cement
and water (7 hours) and mixture of Schizostachyium brachycladum particles, Portland cement and water (9 hours), but
maximum hydration temperature of mixture of Schizostachyium brachycladum particles, Portland cement and water was
higher (39o C) than other mixtures.
Low level of maximum hydration temperature of the all of mixtures can be affected by the high content of
hemicelluloce and extractives presented in bamboo particles. The compatibility of cement and lignocellulosic materials on
the hydration process is influenced by hemicelluloce and extractive content of lignocellulocic materials. Hydration
process will be disturbed if cement is mixed with materials containing high content of hemiceluloce and extractives due to
the declining exothermic reaction when hydration temperature is released. Hemicelluloce content, calculated from the
difference between hollocelluloce and alpha celluloce content, of Gigantochloa atter was higher (29.37%) than those of
Dendrocalamus asper (28.65%) and Schizostachyium brachycladum (27.66%) and also extractive content (soluble in
alcohol benzene) of Gigantochloa atter was higher (4.93%) than those of Dendrocalamus asper (4.10%) and
Schizostachyium brachycladum (3.43%) (Loiwatu, M. dan Manuhuwa, E., 2008 dan Baharuddin, 2013)
Figure 1. Curve of Hydration Temperature
0
5
10
15
20
25
30
35
40
45
0 10 20 30
Bambu Tallang
Bambu Parring
Bambu Betung

BIOCOMPOSITE AND TIMBER ENGINEERING
PROCEEDING OF THE FIFTH INTERNATIONAL SYMPOSIUM OF INDONESIAN WOOD RESEARCH SOCIETY
28
Physical Properties
Study on the physical properties of the cement boards is shown on Table 1. It was observed from the Table 1.
that cement board made from mixture of Gigantochloa atter particles, Portland cement and water had most excellent
physical properties. Table 1 shows that moisture content of the cement boards for mixture A (Schizostachyium
brachycladum particles, Portland cement and water) , B (Gigantochloa atter particles, Portland cement and water) and C
(Dendrocalamus asper particles, Portland cement and water) were respectively 3.25%, 3.15%. and 3.62%, while the
density were respectively 0.74 g/cm3, 0.80 g/cm3 and 0.68 g/cm3. Difference of cement board density can be affected by
the density variation of culm of each bamboo species. In this study, higher density of bamboo species resulted in higher
density of the cement board. Culm density of Schizostachyium brachycladum was 0.69 g/cm3, Gigantochloa atter was
0.79 g/cm3 and Dendrocalamus asper was 0.62 g/cm3. Study on cement board density finds that all the cement boards
did not achieve the targeted density of 1 g/cm3. It was supposed to raise the weight of cement boards to complete the
targeted density of 1 g/cm3 by the presence of CaCO3 resulted from reaction of CO2 injection and Ca(OH)2, but it did not
arise while requirement of cement board density in JIS A 5417:1992 is greater than 0.8 g/cm3. Longer time of CO2
injection (longer than 30 minutes) might be needed to raise the amount of CaCO3 so that the weight of cement boards
become higher. By operating curing temperature at 80o for 10 hours in this study also lowered the production of calcium
silicate hydrate because remaining water was evaporated due to the high temperature. Maximum amount of calcium
silicate hydrate cannot be attained and this also did not bring about the desired weight of the cement boards. In
conventional process, although setting time of the hydration process of the mixture was completed for 24 hours,
remaining water held in the cement boards can be still used for hydration process to produce maximum amount of
calcium silicate hydrate during the next 28 days curing in room temperature. Small difference between density of bamboo
culm and density of cement board described that density of cement board was mostly influenced by density of bamboo
culm, density of cement board may not significantly be influenced by the presence of hydration products such as calcium
silicate hydrate and calcium carbonate.
Table 1. Physical Properties of the Bamboo Cement Boards
Notes :
Mixture A : Schizostachyium brachycladum particles, Portland cement and water
Mixtures B : Gigantochloa atter particles, Portland cement and water
Mixture C : Dendrocalamus asper particles, Portland cement and water
Table 1. Shows also that water absorption, linear expansion and thickness swelling varied between the cement
boards. Water absorption of the cement boards can be directly affected by the percentage of cavity volume in the
bamboo particles. The percentage of cavity volume in the bamboo particles can be estimated from the bamboo culm
density showing that the highest to the lowest percentage of cavity volume were respectively in Dendrocalamus asper,
Schizostachyium brachycladum and Gigantochloa atter particles and this study showed that the highest to the lowest
water absorption respectively occured in cement board of mixture of Dendrocalamus asper particles, Portland cement
and water (57.60%), Schizostachyium brachycladum particles, Portland cement and water (49.20%) and Gigantochloa
atter particles, Portland cement and water and (45.11%). This result noticed that particles of the 3 bamboo species were
very higroscopic material because of their high ability to absorp water. Matoke et al. (2012) confirmed that water
absortion of bamboo is a disadvantege for composite. This study also found that density of the cement boards was
inversely to the water absorption. Although JIS A 5417:1992 does not include water absorption for cement board
requirement, it can be used as good prediction to the linear expansion and thickness swelling behavior. As a hygroscopic
material, bamboo culm particles absorp water to fill the cell lumen and cell wall. When the cell wall absorb water, cell wall
expand depending on the amount of water absorbed. As shown in Table 1., linear expansion and thickness swelling of
the cement boards was likely to follow the water absorption trend. Although percentage of of water absorption of the
cement boards can be rated as high enough, percentage of linear expansion of cement boards were extremely low and
percentage of thickness swelling of the cement boards as well. While rrequirement of thickness swelling of cement board
Cement Board MC
(%)
D (g/cm3) WA (%)
24 hours
LE (%)
24 hours
TS (%)
24 hours
Mixture A 3.25 0.74 49.20 0.19 0.87
Mixture B 3.15 0.80 45.11 0.13 0.65
Mixture C 3.62 0.68 57.60 0.27 1.35

BIOCOMPOSITE AND TIMBER ENGINEERING
PROCEEDING OF THE FIFTH INTERNATIONAL SYMPOSIUM OF INDONESIAN WOOD RESEARCH SOCIETY
29
in JIS A 5417:1992 is lower than 8.3%, it can be observed that cement boards made from all of the 3 mixtures are
dimensionally stable. The presence of CaCO3, as a result of reaction CO2 and Ca(OH)2 filled the tiny cavity in the cell wall
or even covered the bamboo particles, together with other hydration products may have controlled the cement boards
from swelling.
Mechanical Properties
Study on mechanical properties of the cement boards is shown on Table 2. Contrarily to the physical
properties, it was observed from the Table 2. That the most excellent mechanical properties of cement board was found
in the mixture of Schizostachyium brachycladum particles, Portland cement and water.
Table 2. Mechanical Properties of the Bamboo Cement Boards
Cement Board IB (kg/cm2) MOE (kg/cm2) MOR (kg/cm2)
Mixture A 0.74 5030.50 79.59
Mixture B 0.41 2338.82 49.75
Mixture C 0.18 1339.03 40.12
Notes :
Mixture A : Schizostachyium brachycladum particles, Portland cement and water
Mixtures B : Gigantochloa atter particles, Portland cement and water
Mixture C : Dendrocalamus asper particles, Portland cement and water
Table 2 shows that internal bonding (IB), modulus of elasticity (MOE) and modulus of rupture (MOR) of cement
board made from mixture of Schizostachyium brachycladum particles, Portland cement and water was superior than
cement boards made from other mixtures. In many cement board products, density of cement board can be used as a
good indicator to the mechanical properties. The higher the density of the cement board, the better the mechanical
properties. As previously stated in this study, higher density of bamboo species resulted in higher density of the cement
board. It can be theoretically simply explained that higher density of bamboo particles contains smaller volume on the
equal weight of different bamboo particles , so if it is assumed that calcium silicate hydrate produced on the hydration
process is equal amount to the all cement boards of different mixture so that the amount of calcium silicate hydrate will
be much more to cover the particles or fill the cell cavity and cell wall on the higher density of the cement boards in order
to better improve the mechanical properties. However, it did not arise on the cement board of mixture of Gigantochloa
atter particles, Portland cement and water although this study showed the highest density of cement board was on
mixture Gigantochloa atter particles, Portland cement and water. Contrarily to the cement board of mixture Gigantochloa
atter particles, Portland cement and water, although cement board of mixture of Schizostachyium brachycladum
particles, Portland cement and water had lower density, it showed better mechanical properties than other mixtures. At
least, only one main reason to explain this. As shown on the hydration temperature curve in Figure 1., the highest
maximum hydration temperature was mixture of Schizostachyium brachycladum particles, Portland cement and water
specifying that bonding ability of this mixture was better than other mixtures. This better bonding ability was influenced
by the lower content of hemicellulce and extractives of Schizostachyium brachycladum particles. It might be predicted
that the amount of calcium silicate hydrate after hydration process and CaCO3 after injection of CO2 was higher in
cement board of mixture Schizostachyium brachycladum particles, Portland cement and water than other mixtures. The
higher the calcium silicate hydrate and the calcium carbonate in the cement board, the better the mechanical properties.
It was observed from the mechanical properties that application of CO2 injection to the cement board in this
study has not mostly satisfied the JIS A 5417:1992. As it was desired that higher amount of CaCO3 might be produced
after injection of CO2, in reality it was not. Production of CaCO3 from CO2 injection depends on the amount of Ca(OH)2
that is resulted from hydration process of water and cement. If the hydration process is hampered by many factors
including the presence of hemicelluloce and extractives, less Ca(OH)2 will be produced. Whereas JIS A 5417-1992
requires MOR of ≥ 63 kg/cm2 and MOE of ≥ 24.000, only cement board made from mixture of Schizostachyium
brachycladum particles, Portland cement and water satisfied MOE requirement.

BIOCOMPOSITE AND TIMBER ENGINEERING
PROCEEDING OF THE FIFTH INTERNATIONAL SYMPOSIUM OF INDONESIAN WOOD RESEARCH SOCIETY
30
Conclusion
Physical and mechanical properties of cement board made from different mixture of bamboo particles, cement
and water and application of CO2 injection were various depending on bamboo species. Only cement board made from
mixture of Gigantochloa atter particles, Portland cement and water satisfied physical properties requirement of JIS A
5417-1992 and no cement board satisfied mechanical properties requirement of JIS A 5417-1992. This indicates that
application of CO2 injection in liquid phase in this study has not effectively controlled desirable physical and mechanical
properties of the bamboo cement board.
Literature Cited
Berger, R.L., J.F. Young and K. Leung. 1972. . Acceleration of Hydration of Calcium Silicates by Carbon Dioxide
Treatment, Journal of Nature, 240, 16-18.
Erakhrumen, A. A., Areghan, S. E., Ogunleye, M. B., Larinde, S. L. and Odeyale, O. O., Selected Physico-Mechanical
Properties of Cement-Bonded Particleboard Made from Pine (Pinus caribaea M.) sawdust - coir (Cocos
nucifera L.) mixture, Scientific Research and Essay, 3 (5), 2008, pp. 197–203.
Hermawan. D, T. Hata, K. Umemura, S. Kuroki . 2001a. Rapid Production of High-Strength Cement- Kawai, W.
Nagadomi and Y. Bonded Particleboard Using Gaseous or Supercritical Carbon Dioxide J. Wood Sci. 47(4), 294-
300.
Hermawan, D. 2001b. Manufacture of Cement – Bonded particleboard using Carbon Dioxide curing Teknologi.
Departemen of Forest and Biomassa Sciense, Graduate School of The Faculty of Agriculture, Kyoto Universitas,
Kyoto.
JIS. 1992. JIS (Japanese Industrial Standard), A 5417:1992. Cement bonded Particle Boards. Japanese Standard
Association.
Kamil, 1970. Prospek Pendirian industri Papan wol Kayu di Indonesia. Pengumuman No. 95. Lembaga – Lembaga
Penelitian Kehutanan. Direktorat jenderal Kehutanan. Departemen Pertanian, Bogor.
Lahtinen, P.K. 1991. Experiences with Cement-Bonded Particleboard Manufacturing when Using a Short-Cycle Press
Line. Proceeding: lnorganic Bonded Wood and Fiber Composite Materials Conference, AA. Moslemi, ed.
Forest Prod. Res. Soc., Madison, WI., 32-35.
Li, X., 2004. Physical, Chemical and Mechanical Properties of Bamboo and Its Utilization for Fiberboard Manufacturing. A
Thesis Submitted to the Graduate Faulty of the Louisiana State University and Agriculture and Mechanical
College in Partial Fulfillment of the Requirements for the Degree of Master of Science in The School of
Renewable Natural Resources.
Loiwatu, M. dan Manuhuwa, E. 2008. Komponen Kimia dan Anatomi Tiga Jenis Bambu dari Seram Maluku. AGRITECH,
Vol. 28, No. 2.
Matoke , G.M., Owido, S. F. and Nyaanga, D.M. 2012. Effect of Production Methods and Material Ratios on Physical
Properties of the Composites. Am. Int. J. Contemp. Res. 2(2).
Moslemi, A. A. 1989. Wood-Cement Panel Products : Coming of Age. Poceeding: Fiber and Particleboard Bonded With
Inorganic Binders Conference, A.A. Moslemi, ed. Forest Prod. Res. Soc. Madison, WI, 12 -18.
Moslemi, A.A., R.L. Geimer, M.R. Souza and M.H. Simatupang. 1993. Carbon Dioxide Application for Rapid Production
of Cement Particleboard. Proceeding: lnorganic Bonded Wood and Fiber Composite Materials Conference, AA.
Moslemi, ed. Forest Prod. Res. Soc., Madison, WI.

BIOCOMPOSITE AND TIMBER ENGINEERING
PROCEEDING OF THE FIFTH INTERNATIONAL SYMPOSIUM OF INDONESIAN WOOD RESEARCH SOCIETY
31
Muin, M., Suhasman, N P Oka, B Putranto, Baharuddin, S Millang, 2006. Pengembangan Potensi dan Pemanfaatan
Bambu sebagai Bahan Baku Konstruksi dan Industri di Sulawesi Selatan. Badan Penelitian dan
Pengembangan Daerah. Makassar. 73p.
Simatupang, M. and R.L. Geimer. 1990. Inorganic Binder for Wood Composites: Feasibility And Limitations. Processding
: Wood Adhesive Symposium 1990, Forest Products Research Society, Madison, WI, 169-176.
Simatupang, M.H., N. Seddig, C. Habighorst and R.L. Geimer. 1991. Technologies for Rapid Production of Mineral-
Bonded Wood Composite Boards. Proceeding: lnorganic Bonded Wood and Fiber Composite Materials
Conference, AA. Moslemi, ed. Forest Prod. Res. Soc., Madison, WI., 18-27.
Suhasman dan Bakri. 2012. Karakteristik Papan Semen Berbahan Baku Kayu Kemiri (Aleurites Moluccana) yang dibuat
melalui Injeksi Karbon Dioksida (CO2) Untuk Percepatan Curing Semen. Univ. Tanjung Pura, Jurnal
Tengkawang. 6(1).

BIOCOMPOSITE AND TIMBER ENGINEERING
PROCEEDING OF THE FIFTH INTERNATIONAL SYMPOSIUM OF INDONESIAN WOOD RESEARCH SOCIETY
32
GYPSUM BOARD AND CEMENT BOARD
AS AN ACOUSTIC MATERIAL FOR BUILDING
James Rilatupa
1This paper is presented in The Fifth International Symposium of Indonesian Wood Research
Society (IWoRS); Balikpapan, November 7 – 8th 2013 2Department of Architecture, Faculty of Engineering, Christian University of Indonesia, Jakarta
Abstract
In the design of the building, the architect must think of acoustic requirements with the same serious attention and
concern poured in thinking about other requirements. Acoustics includes a very broad range, and touch nearly all facets
of human life. Thus it is obvious, the acoustics are architectural elements in control of the environment both inside and
outside spaces (Doelle and Prasetio, 1993). In the last half-century, architects and designers are all looking for a new
acoustic product which are versatility and economical.
The use of solid wood and composite wood materials as acoustics has long been known. Generally of wood used as
acoustic panels and placed as floor (including the floor floating), walls, and ceiling. Gypsum board which is a wood
processed has been used as an acoustic materials to made a space become soft and comfortable. Gypsum board is
very strategic for noise insulation in the room was dominant uses a glass and the concrete wall. Meanwhile, cement
board which is also a product of wood composite made from wood particles or other lignocelluloses materials with
cement as its glue adhesive; can provide solutions for architecture acoustics issue.
Wood as a material acoustic has long been used, for example, as wall panel, floor, ceiling, until a musical instrument
(traditional and modern). Thus, the gypsum board and cement board can be used as acoustic material. The aim of this
research to see the comparison of noise absorption between gypsum boards and cement board as acoustic materials.
Keywords: acoustics, gypsum board, cement board, noise absorption
INTRODUCTION
The word of sound has two definitions: (1) physical, sound are pressure deviation, shifting of particles in an
elastic medium such as air (referred as objective sound); (2) the physiologically, sound is a sensation of hearing caused
by deviation of physically (referred as subjective sound). More precisely, sound are the sensation of hearing passing ears
and arises because air pressure deviations. This distortion is usually caused by some object that vibrates, for example
string guitar picked or a tuning fork is struck
Meanwhile, there is no distinct definition about acoustics, but it can be said acoustic to be closely associated
with sounds and noise. The acoustic more emphasis on environment controlling of sound, and making it comfortable for
aural. More details, acoustics related to artificial environment which created for superior than natural conditions, such as
concerts or radio studio with sound control will generate an acoustic environment that is not available in natural (Baron,
1993). Controlling sound in architectural had two goals: (1) providing the state of being most favored production,
propagation, and acceptance of the sound of the desired in a room used for the various purposes of hearing, or in the
open air; (2) counteraction and reduction of noisy (unwanted sounds) and vibrations in sufficient amounts (Doelle and
Prasetio, 1993).
Wood (solid wood) and wood composite can be used as material absorbs acoustic because of its ability in a
number of sounds in a given space. Wood as an acoustic material very flexible usage in a given space, which can be
used as a component of ceiling, wall, floor, or any other components accordance with the needs of the building (Cremer
and Muller, 1982). Bucur (1995) explained that the efficiency of sound absorption and reflection from the wooden
material depends on structure, surface treatment, mounting, geometry, etc. For example, plywood or particle board can
absorb noise in the low frequency region (< 500 Hz), while the porous wood (fiber board) can absorb sound in the
frequency of medium to high (2000 - 8000 Hz).

BIOCOMPOSITE AND TIMBER ENGINEERING
PROCEEDING OF THE FIFTH INTERNATIONAL SYMPOSIUM OF INDONESIAN WOOD RESEARCH SOCIETY
33
MATERIAL AND METHOD
Material and Instrument
Material used is a gypsum board undersized 120 x 240 x 0.9 cm3 and cement board undersized 122x 244 x 1.5
cm3. An instrument used for sound absorption testing is the sound level meter, unit of sound sources,
computers/laptops, software tool for sound frequencies, and a stopwatch.
Research Method
1. Making of Objects Test
Gypsum boards and cement board made into a box with three sizes namely 36 x 12 x 12 cm3; 24 x 12 x 12
cm3; and 12 x 12 x 12 cm3; henceforward box of gypsum board and cement board are referred to as test objects.
2. Acoustics Testing
Acoustic testing on the object test is the sound absorption testing by using software of sound tool.
Software is connected to the sound source unit that has been programmed on a PC/laptop. Then the sound source
unit (speakers) connected with sound receiver (microphone in sound level meter) that is placed in the objects test;
and read on the magnitude of sound was accepted at the measurement frequency to get noise reduction index and
transmission loss (Figure 1).
Figure1. The testing scheme on object test
The measurement of frequency at this testing is 125 Hz, 250 Hz, 500 Hz, 1000 Hz, 2000 Hz, 4000 Hz
and 8000 Hz; as an important measure in acoustics. In addition, was also performed by measurements of
reverberation time on each measurement of frequency to obtain an absorption coefficient. Each frequency
measurements will be performed five times repeats on each object test. Before the measurement of sound
absorption of the object test, sound absorption measurements done without any objects test.
3. Calculation of Sound Absorption
- Noise reduction index
Noise reduction index is a reduction of sound strength on acoustic board obtained based on ratios among
the difference of the sound of (sound source is subtracted sound reflected) with the value of a sound from the
sound source, namely:
NRI = {(Ee – Er)/Ee} x 100 (1)
dimana: NRI = noise reduction index
Ee = source of sound energy (dB)
Er = reflected sounds energy (dB)
- Transmission loss
Transmission loss is the transmission medium to inhibit sounds and different on every frequency. This
research was lost in transmission obtained based on the results of observations, but can also be calculated by an
equation:
TLf = 18 log M + 12 log f – 25 dB (2)
dimana: M = wall mass (kg/m²)
f = frekuency, Hz
computer/laptop speaker mikophone
(sound souce)
Sound level
meter
object test

BIOCOMPOSITE AND TIMBER ENGINEERING
PROCEEDING OF THE FIFTH INTERNATIONAL SYMPOSIUM OF INDONESIAN WOOD RESEARCH SOCIETY
34
- Absorption coefficient
Absorption coefficient is a measure of the absorption of power per unit area of a surface. Absorption is
the comparison between the energy which is not reflected back and overall sound energy coming. Meanwhile, an
absorption coefficient is the ability of an ingredient to quell the coming sound, calculated in percent or fractions.
Calculation of absorption coefficients determined by the reverberation time from the ingredients being tested,
namely:
= (0,16 V)/(TR S) (3)
dimana: = absorption coefficient
V= volume of room, m³
TR = reverberation time
S = energy of sound absorption (dB)
RESULT AND DISCUSSION
Wood as acoustic material has long been used, such as panel of wall, floor, ceiling, until a musical instrument
(traditional and modern). On the acoustical research of gypsum board and cement board that was tested is noise
reduction index, transmission loss and coefficient of absorption sound.
1. Noise Reduction Index
The result showed that a reduction of sound strength on a cement board higher than gypsum board. Noise
reduction index on a gypsum board between 0.14 - 0.23; whereas on a cement board between at 0.24 - 0.30. The
research also shows that the bigger of wooden box; hence noise reduction index also higher. Meanwhile, when
viewed from the data obtained, there is no difference in noise reduction index on each tested frequency, it is
explained that the magnitude of the frequency does not affect the noise reduction index (Table 1 and Figure 2).
Table 1. Noise reduction index on gypsum board and cement board.
Board box Noise Reduction Index
(cm³) 125 250 500 1000 2000 4000 8000
Gypsum
12x12x12 0,18 0,18 0,15 0,14 0,14 0,14 0,14
21x12x12 0,18 0,19 0,18 0,19 0,19 0,19 0,18
36x12x12 0,22 0,22 0,23 0,21 0,22 0,22 0,22
Cement
12x12x12 0,24 0,24 0,24 0,24 0,24 0,24 0,24
24x12x12 0,24 0,25 0,25 0,27 0,27 0,25 0,25
36x12x12 0,28 0,28 0,29 0,30 0,30 0,30 0,30
Noise reduction index on gypsum board are lower than cement board; this happens because the
cement board is a clone board that uses cement as its adhesive, while gypsum board contains elements of
paper. In this case, the pores on the cement board more closer, which in effect results the noise reduction
index, is also steeper than gypsum board. In other words, the existence of elements of cement as adhesive on
cement board have resulted in better soundproofed properties, even though gypsum board had considered also
as material for acoustics.
No occurrence of a significant change in noise reduction index for different frequencies, showed that
noise reduction index fixed for all sound frequencies. Meanwhile when viewed the data, there is an increase of
noise reduction index seen reduction with the greater volume of the box either on gypsum board or cement
board (Table 1 and Figure 2); shows noise caused by the sound can be reduced. This has been explained by
Rochmah (1983), that the bigger faintly room is getting better; because the traveled distance of sound pressure

BIOCOMPOSITE AND TIMBER ENGINEERING
PROCEEDING OF THE FIFTH INTERNATIONAL SYMPOSIUM OF INDONESIAN WOOD RESEARCH SOCIETY
35
range is long enough, so that it will dampen the sound during the journey. In addition, when the faintly room is
getting bigger, resonance does not occur on the wall because it has been occur in the air.
Figure 2. Noise reduction index on gypsum board (G) and cement board (C).
2. Transmission Loss
The result showed that transmission loss on a box of gypsum boards sized 12x12x12 cm3 between
15.6 - 27,6 dB; box of 24x12x12 cm3 between 16,1 - 28,6 dB; and box of 36x12x12 cm3 between 16.7 - 29,4
dB. Meanwhile, transmission lose on a box of cement boards of sized 12x12x12 cm3 between 11,2 - 20,1 dB;
box of 24x12x12 cm3 between 12,6 - 21,6 dB; and box of 36x12x12 cm3 between 14.1 - 23,7 dB (Table 2).
From the obtained data showed that the lowest of transmission loss occurred at the frequency of 125 Hz and the
highest occurred at the frequency of 8,000 Hz. It showed that the higher of sound frequency, so it also greater
transmission loss happened.
Table 2. Transmission loss on gypsum board and cement board based on research.
Board box Transmission Loss (dB)
(cm³) 125 250 500 1000 2000 4000 8000
Gypsum
12x12x12 15,6 17,1 19,6 21,7 24,5 26,8 27,6
24x12x12 16,1 17,4 20,1 22,9 25,1 27,5 28,6
36x12x12 16,7 18,1 20,4 23,8 25,6 27,8 29,4
Cement
12x12x12 11,2 12,9 14,4 16,7 17,6 19,4 20,1
24x12x12 12,6 13,7 16,6 17,8 18,7 20,0 21,6
36x12x12 14,1 15,1 16,8 18,6 20,2 22,1 23,7
0.1
0.15
0.2
0.25
0.3
0.35
0 1000 2000 3000 4000 5000 6000 7000 8000
12x12 (G)
24x12 (G)
36x12 (G)
12x12 (C)
24x12 (C)
36x12 (C)
Frequency (Hz)
No
ise
Red
uct
ion
Ind
ex

BIOCOMPOSITE AND TIMBER ENGINEERING
PROCEEDING OF THE FIFTH INTERNATIONAL SYMPOSIUM OF INDONESIAN WOOD RESEARCH SOCIETY
36
Figure 3. Transmission loss on box of gypsum board (G) and box of cement board (C).
Figure 4. Graphic of relationship between frequency (Hz) and transmission loss on box of gypsum board and
box of cement board.
According to Mangunwijaya (1981) and Bucur (1995), the occurrence of a transmission loss of sound
by the air molecules in pores resulting in friction one with another, and sound energy is converted into heat
energy. A transmission loss on box of gypsum board and box of cement board were different, pointed out that
box of cement board has a little pores if compared with a box of gypsum boards (Figure 3). As has been
previously mentioned on the noise reduction index; hence this happened because the pores on the cement
board closer, which resulted that a transmission loss on these boxes becomes more diminished.
Sound transmission loss in the box of gypsum board and the box of cement board that shows
increasing with the increasing of sound frequency; it also shows that there is a positive linear relationship
between the sound frequencies and transmission loss (Figure 4). The linear equation had y = 0.46 + 3.19 ln x
10
12
14
16
18
20
22
24
26
28
30
0 1000 2000 3000 4000 5000 6000 7000 8000
Tran
smis
sio
n L
oss
(d
B)
Frequency (Hz)
12x12x12 (G)
24x12x12 (G)
36x12x12 (G)
12x12x12 (C)
24x12x12 (C)
36x12x12 (C)
10
15
20
25
30
0 1000 2000 3000 4000 5000 6000 7000 8000
Tran
smis
sio
n L
oss
(d
B)
Gypsum
Cement
Linear (Gypsum)Linear (Cement)
y = 0,46 + 3,19 ln x
y = 1,81 + 2,25 ln x
Frequency (Hz)

BIOCOMPOSITE AND TIMBER ENGINEERING
PROCEEDING OF THE FIFTH INTERNATIONAL SYMPOSIUM OF INDONESIAN WOOD RESEARCH SOCIETY
37
for box of a gypsum board and y = 1.81 + 2.25 ln x for box of a cement board; where y is transmission loss (dB)
and x is the frequency (Hz).
Table 3. Transmission loss on gypsum board and cement board based on equation (2) (in Material and Method)
Board box Transmission Loss (dB)
(cm³) 125 250 500 1000 2000 4000 8000
Gypsum
12x12x12 15,6 19,3 22,9 26,5 30,2 33,8 37,4
21x12x12 16,0 19,6 23,1 26,8 30,4 34,0 37,6
36x12x12 16,4 20,0 23,6 27,3 30,9 34,5 38,1
Cement
12x12x12 23,0 26,6 30,2 33,8 37,4 41,0 44,6
24x12x12 23,2 26,7 30,4 33,9 37,5 41,2 44,9
36x12x12 23,5 27,1 30,7 35,0 37,8 42,0 46,1
Meanwhile, the results of calculation using the equation (2) (see Material and Method), shows a
different result with the observations in this research. Based on equation (2) is obtained that the box of cement
board greater loss of sound transmission compared to the box of gypsum board (Table 3). This happens
because the wall mass in the equation is calculated. Masses of gypsum board wall box (7.30 - 8.02 kg/m2)
smaller than the box of cement board wall (18.45 – 18.70 kg/m2). As mentioned earlier, the thickness of the
gypsum boards box only 0.9 cm, and the thickness of the cement board box 1.5 cm. Thus it is clear that the
mass of the wall box from gypsum board is smaller than a box of cement board, so the equation cannot be used
to get the magnitude of sound transmission loss for the box of cement board.
3. Absorption Coefficient of Sound
The results showed that absorption coefficient of sound on the box of the gypsum board sized
12x12x12 cm3 between 0.23 - 0.39; box of 24x12x12 cm3 between 0.25 – 0.41; and box of 36x12x12 cm3
between 0.30 - 0.48. Meanwhile, absorption coefficient of sound on the box of cement board sized 12x12x12
cm3 between 0.17 - 0.31; box of 24x12x12 cm3 between 0.22 - 0.33; and box of 36x12x12 cm3 between 0.25 -
0.36 (Table 4). From obtained data, shows that the lowest absorption coefficient of sound occurs at a frequency
of 8000 Hz and the highest occurs at a frequency of 125 Hz; except for box of gypsum board sized 36x12x12
cm3 is the highest sound absorption coefficient occurs at a frequency of 250 Hz. Generally, this indicates that
the higher of sound frequency, so the sound absorption coefficient will lower.
Table 4. Absorption coefficient of sound on gypsum board and cement board.
Board box Frequency (Hz)
(cm³) 125 250 500 1000 2000 4000 8000
Gypsum
12x12x12 0,39 0,34 0,30 0,26 0,25 0,23 0,23
21x12x12 0,41 0,38 0,34 0,34 0,29 0,26 0,25
36x12x12 0,46 0,48 0,40 0,38 0,36 0,33 0,30
Cement
12x12x12 0,31 0,28 0,26 0,24 0,21 0,18 0,17
24x12x12 0,33 0,30 0,29 0,28 0,27 0,25 0,22
36x12x12 0,36 0,32 0,30 0,30 0,28 0,26 0,25

BIOCOMPOSITE AND TIMBER ENGINEERING
PROCEEDING OF THE FIFTH INTERNATIONAL SYMPOSIUM OF INDONESIAN WOOD RESEARCH SOCIETY
38
Figure 5. Absorption coefficient of sound on box of gypsum board (G) and box of cement board (C).
According to Satwiko (2003), sound absorption is the ability of a material to quell the sound which
comes. Absorption coefficient of sound calculated in percent, or a fractional value between 0 1. From
this research is it appears that box of gypsum board has a greater sound absorption coefficient compared with a
box of cement board, though no real difference. From this research, it turns out that the sound absorption
coefficient of gypsum board and cement board are good enough, so both these materials can be used as
acoustic material. The results also indicated that the size of a box less impact on absorptions coefficients of
sound, it is probably caused size of the box less/not too different (Figure 5). Nevertheless, the existence of a
raw standard not found for sound absorption coefficient for the particular material. Generally the required
standard in the sound absorption is designation for a room or building, for example, acoustics needed for a
classroom are different with studio room, or between the worship houses with the auditorium building.
The sound absorption coefficient on the box of gypsum board from and the box of cement board that
showed decreasing with increasing of sound frequency; it also shows that there is a negative linear relationship
between the sound frequency of the with the absorption coefficient of (Figure 6). The linear equation obtained
was y = 0.61 - 0.04 ln x for gypsum board and y = 0.46 - 0.03 ln x for the box of cement board; where y is the
sound absorption coefficient and x is frequency (Hz).
0.1
0.2
0.3
0.4
0.5
0 1000 2000 3000 4000 5000 6000 7000 8000
Ab
sorp
tion
Coef
fici
ent
of
Sou
nd
Frequency (Hz)
12x12x12(G)
24x12x12(G)
36x12x12(G)
12x12x12(C)
24x12x12(C)
36x12x12(C)

BIOCOMPOSITE AND TIMBER ENGINEERING
PROCEEDING OF THE FIFTH INTERNATIONAL SYMPOSIUM OF INDONESIAN WOOD RESEARCH SOCIETY
39
Figure 5. Graphic of relationship between frequency (Hz) and absorption coefficient of sound on box of gypsum
board and cement board.
CONCLUSION
No occurrence of a significant change in noise reduction index for different frequency showed that noise
reduction index fixed for all sound frequencies. Meanwhile, when viewed that there was increased of noise reduction with
the greater volume of box either on gypsum board and cement board; showing that the larger volumes of the box then
noise caused by sound can be reduced.
Transmission loss of sound in the box of gypsum board and the box of cement board that shows increasing
with the increasing of sound frequency; it also shows that there is a positive linear relationship between the sound
frequency with the transmission loss. Meanwhile, the opposite happened on a absorption coefficient of sound. The
sound absorption coefficient on the box of gypsum board and the box of cement board that showed decreasing with
increasing of sound frequency; and it also shows that there is a negative linear relationship between the sound frequency
of the with a absorption coefficient of sound.
REFERENCES
Baron, M. 1993. Auditorium Acoustics and Architectural Design. Routledge. New York.
Cremer, L. and. H.A. Muller. 1982. Principles and Applications of Room Acoustics. Applied Science. London.
Bucur, V. 1995. Acoustics of Wood. CRC Press. New York.
Doelle, L.L. dan L. Prasetio. 1993. Akustika Lingkungan. Erlangga. Jakarta.
Parkin, P.H. and H.R. Humpreys. 1958. Acoustics, Noise and Buildings. Frederick A. Praeger, Inc. New York.
Hayashi, H. 1984. Sound Absorption and Anatomical Structure`of Japanese Cedar, Saghalin Fir, Maple, and Willow.
Paper presented at Proc.Pac. Regional Wood Anatomy Conference. Tsukuba, Japan.
Rochmah. 1983. Teknik Akustika 2. Roda Pelita. Jakarta.
Satwiko, P. 2004. Fisika Bangunan 2. Andi. Yogyakarta.
Lord, P. Dan D. Templeton. 1996. Detail Akustik. Erlangga. Jakarta.
0.1
0.2
0.3
0.4
0.5
0 1000 2000 3000 4000 5000 6000 7000 8000
Ab
sorp
tion C
oef
fici
ent
of
Sound
Frequency (Hz)
Gypsum
Cement
Linear (Gypsum)
Linear (Cement)y = 0,61 – 0,04 ln x
y = 0,46 – 0,03 ln x

BIOCOMPOSITE AND TIMBER ENGINEERING
PROCEEDING OF THE FIFTH INTERNATIONAL SYMPOSIUM OF INDONESIAN WOOD RESEARCH SOCIETY
40
THE FLEXURAL STRENGTH AND BEHAVIOR OF CROSS
LAMINATED TIMBER FLOOR
Johannes Adhijoso Tjondro1 and Sandra Natalia2
1 Department of Civil Engineering, Parahyangan Catholic University, Bandung
[email protected], [email protected] 2 Alumni, Department of Civil Engineering, Parahyangan Catholic University, Bandung
Abstract
The six cross laminated timber floor specimens was made from hardwood fast growing species, Albizia falcata. The
cross laminated timber floor was made from three layers of wood plank with specimens variations full and discontinues in
middle layer. PvAc glue adhesive was used to laminate between layers. The overall floor dimension was 54 mm x 540
mm x 1260 mm. These fabricated cross laminated timber floor was tested under third point static loading to observe the
rigidity and flexural strength of the floor. The rigidity factor was analyzed and presented. The failure mode was flexural
and ductile failure. The ultimate load was higher than the proportional load, which is provided a sufficient safety factor.
Prediction and suggestion of maximum uniform service live load based on allowable displacement was presented.
Keywords: cross laminated timber, flexural strength, rigidity factor, ductility
1. Introduction
Cross laminated timber become a new element of new building system that was developed in the Europe and
North American construction. Some mid-rise building until ten stories can be built in UK, Sweden and Australia. The new
building system was made from CLT panels as load bearing wall, floor and roof panel. The panels was light, easy and
quick in construction and do not need large foundation. This will save cost of the building, Karacabeyli, 2013. CLT panels
commonly made from several odd wood layers stacked crosswise 90° and binding by adhesive. In this study Pv.Ac was
used to bind the layers. The floor specimen was made from hardwood fast growing species.
The specimen was made from 3 layers of wood plank with full and discontinuous mid-plank variation, stacked crosswise
90° and glued together as in Fig.1 and 2. The thickness of the wood plank was 18mm, and 180 mm in width, the overall
dimension of this CLT floor was 54 mm x 540 mm x 1260 mm. The six cross laminated timber (CLT) floor was tested and
analyzed under destructive static two line loading test. Each type of floor or variation has 3 specimens. The static test
result was load-displacement curve which is convert to moment-displacement curve. Observation for static loading test
was done at proportional and ultime load.
Figure 1. CLT floor specimen and longitudinal cross section with full mid-layer

BIOCOMPOSITE AND TIMBER ENGINEERING
PROCEEDING OF THE FIFTH INTERNATIONAL SYMPOSIUM OF INDONESIAN WOOD RESEARCH SOCIETY
41
Figure 2. CLT floor specimen and longitudinal cross section with discontinous mid-layer
2. Materials and method
The specimen was made from albasia (Albizia falcata sp.) wood plank with a cross section dimension of 18 mm
x 180 mm. The properties were tested through some small clear specimens based on the ASTM D143. The specific
gravity was 0.31 and the modulus elasticity was 5162 MPa. The MOR was 35 MPa. The CLT floor was fastened by PvAc
glue, the shear strength of the glue was tested with different two contact plane, one the two contact planes paralel to the
grain and secondly the grain of contact planes was perpendicular each other, the shear strength result was tabulated in
Table 1. The average moisture content was in between 14-16%.
Table 1. Shear strength of the PvAc glue, Natalia, 2012.
paralel perpendicular
No Fv (MPa) Fvavr (MPa) No Fv (MPa) Fvavr (MPa)
S1 3,56
3,84
T1 2,36
2,35 S2 4,50 T2 2,08
S3 5,24 T3 2,17
S4 2,04 T4 2,79
The construction of the CLT floor layer by layer was illustrated e.g. for discontinuous mid-layer as in Figure 3.
The weight of the CLT floor was only 20 kg/m2 for full mid-layer and 18 kg/m2 for discontinuous mid-layer.
Figure 3. The construction of CLT floor.
Testing Methods
This research based on the experimental study. The specimen was tested under third point loading test regarding to
ASTM D198-05a as illustrated in Figure 4 and Figure 5. The central span displacement was measured using LVDT. The
clear span for testing was 1050 mm.

BIOCOMPOSITE AND TIMBER ENGINEERING
PROCEEDING OF THE FIFTH INTERNATIONAL SYMPOSIUM OF INDONESIAN WOOD RESEARCH SOCIETY
42
Figure 4. The schematic of floor on the third point loading test, ASTM D198-05a
Figure 5. CLT floor under third point loading test
The calculation of central point displacement, ∆, due to the third point loading and by neglected the shear deformation,
Gere, 2001 was: 3
p
23
1296 ( )
p
xe
P L
EI
(1)
The effective rigidity (EIxe) of floor from static third point loading test can be calculated by equations (2).
3
p
23( )
1296
p
xe
P LEI
(2)
where (EIxe) = effective floor rigidity (N.mm2)
Pp = total load (N/mm2)
L = clear span (mm)
∆p = displacement at proportional load (mm)
½ P ½ P
⅓ L ⅓ L ⅓ L

BIOCOMPOSITE AND TIMBER ENGINEERING
PROCEEDING OF THE FIFTH INTERNATIONAL SYMPOSIUM OF INDONESIAN WOOD RESEARCH SOCIETY
43
3. Results
The result was plotted as load vs. displacement curves as in Figure 6 and Figure 7, and the load at allowable
displacement (Pa), proportional load (Pp) and ultimate load (Pu) was observed. The allowable displacement was taken as
1/300 L.
Figure 6. Load vs. displacement curve, Natalia, 2012.
Figure 7. Moment vs. displacement curve, Natalia, 2012.
Figure 6 is the curve for full mid-layer and Figure 7 is for discontinuous mid-layer, the load, moment,
displacement at each load condition and ductility was tabulated as in Table 2. The ductility value shows that the CLT floor
was not failed in brittle fashion.
01020304050
-20 30 80Lo
ad (
kN)
displacement (mm)
A-1
A-2
A-3
01020304050
0 50 100
Load
(kN
)
displacement (mm)
B-1
B-2
B-3
02468
0 20 40 60 80Mo
me
nt
(kN
.m)
displacement (mm)
A1
A2
A3
02468
0 20 40 60 80Mo
me
nt
(kN
.m)
displacement (mm)
B1
B2
B3

BIOCOMPOSITE AND TIMBER ENGINEERING
PROCEEDING OF THE FIFTH INTERNATIONAL SYMPOSIUM OF INDONESIAN WOOD RESEARCH SOCIETY
44
Table 2. Load, moment, displacement and ductility
No Pa
(kN)
Ma
(kN.m)
Δa
(mm)
Pp
(kN)
Mp
(kN.m)
Δp
(mm)
Pu
(kN)
Mu
(kN.m)
Δu
(mm)
μu
(mm)
A1 5.39 0.94 3.5 24.79 4.34 18.64 41.06 7.19 40.44 2.17
A2 4.91 0.86 3.5 16.77 2.94 12.81 38.20 6.68 51.16 3.99
A3 4.93 0.86 3.5 18.71 3.27 14.71 33.64 5.89 42.40 2.88
B1 3.61 0.63 3.5 12.55 2.20 12.88 20.63 3.61 33.72 2.62
B2 4.03 0.71 3.5 14.81 2.59 14.21 32.31 5.65 49.24 3.47
B3 3.77 0.66 3.5 12.55 2.20 14.94 20.94 3.66 32.08 2.15
Failure Modes
The failure mode of all the floor specimen occurred at ultimate load mainly in tension due to bending, as in Figure 8 and
9.
Figure 8. Tension failure at the bottom of CLT floor
Some part of the glue was separated, this is because when the test was done the age of gluing was less than
one week for specimen B2 and B3.
Figure 9. Tension failure on the middle span of CLT floor (left) and failed in the PvAc glue (right).
4. Analysis and Discussions
Based on the elastic condition, the rigidity of the floor was analyzed.
Figure 10. Cross section of slab
t = 18 mm
B = 540 mm
X axis
neutral axis
H = 54 mm
b = 180 mm

BIOCOMPOSITE AND TIMBER ENGINEERING
PROCEEDING OF THE FIFTH INTERNATIONAL SYMPOSIUM OF INDONESIAN WOOD RESEARCH SOCIETY
45
The second moment of area Ixe was calculated based on the first and third layer, the mid-layer was neglected.
Because the layers are not a solid section, the k factor as rigidity correction factor was introduced in the equation (3) and
(4).
3 216( ( ) )
12xeI b t k b t t (3)
Then,
31(1 12 )
2xeI b t k (4)
Table 3. Rigidity correction factor and actual ultimate bending stress
No b t
k Ix L Pp ∆p E Pu Mu S fbu
(mm) (mm) (mm4) (mm) (N) (mm) (MPa) (N) (N.mm) (mm3) (MPa)
A1 180 18 0.76 5311786 1050 24789 18.64 5162 41062 7185850 193156 36.5
A2 180 18 0.74 5185814 1050 16773 12.81 5162 38196 6684213 188575 34.8
A3 180 18 0.72 5059843 1050 18708 14.71 5162 33639 5886738 183994 31.4
B1 180 18 0.53 3863117 1050 12554 12.88 5162 20629 3610075 140477 25.2
B2 180 18 0.58 4178045 1050 14813 14.21 5162 32311 5654355 151929 36.5
B3 180 18 0.45 3359232 1050 12554 14.94 5162 20939 3664269 122154 29.5
The k factor was found by substitute equation (2) using experimental data and equation (4).
Equivalent uniform load (q) conversion was done base on the allowable displacement at serviceability with ∆ i =
1/300 L, this is because the deformation or stiffness of the floor was critical. Ixe was calculated from equation (4) using k
factor from table 3, and q can be found from the equation (5).
45
384 ( )i
xe
q L
EI
(5)
The result for both types of CLT floor was shown in the chart in Figure 11. The CNLT floor with full mid-layer
and 2.0 m in length can carry more than 2.0 kPa, but for CLT floor with discontinuous layer only can carry 1.0 kPa. The
uniform load that can carry for other length may be obtained using the chart in Figure 11.
Figure 11. Equivalent uniform load for CLT floor, Natalia, 2012.
5. Conclusions
The CLT floor using albasia wood plank was suitable for housing floor, the load and span can be determine
using the equivalent uniform load chart.
The k factor for CLT with discontinuous mid-layer was significantly lower than the full mid-layer.
The ductility factor of this CLT floor guarantee that the floor doesn’t failed in brittle fashion.
The weight or mass of the floor was very light and can be used to minimize the earthquake inertial load.
y = -2,512259x + 7.158,512067R² = 0,925936
0
1000
2000
3000
4000
1400 1600 1800 2000 2200 2400 2600Un
ifo
rm lo
ad p
er
m2
( N
/m2)
Span (mm)
y = -3,730738x + 8.466,514656R² = 0,909263
0
1000
2000
3000
4000
1400160018002000220024002600Un
ifo
rm lo
ad p
er
m2
( N
/m2 )
Span (mm)

BIOCOMPOSITE AND TIMBER ENGINEERING
PROCEEDING OF THE FIFTH INTERNATIONAL SYMPOSIUM OF INDONESIAN WOOD RESEARCH SOCIETY
46
6. References
1. American Society for Testing and Materials. (2010). ASTM D143-94: Standard Methods of Testing Small Clear
Specimens of Timber. Annual Book of ASTM Standards volume 04.10. Baltimore, U.S.A.
2. American Society for Testing and Materials. (2010). ASTM D198-05, Standard Methods of Static Tests of Lumber in
Structural Size. Annual Book of ASTM Standards volume 04.10. Baltimore, U.S.A.
3. Gere, J.M. (2001), ‘Mechanics of Materials’, Fifth Edition, Brooks/Cole, Thomson Learning
4. Karacabeyli, E. & Douglas, B. (2013), ‘CLT Handbook’, FPInnovations, Pointe-Claire, QC.
5. Natalia, S. (2012). Experimental Study on The Cross Laminated Timber Floor using PvAc Glue. Tesis, Civil
Engineering Department Parahyangan Catholic University, 2012.
6. Yeh, B. et al. (2012). The Cross Laminated Timber Standard in North America. World Conference on Timber
Engineering, Auckland, New Zealand, 15-19 July 2012.
7. Zumbrunnen, P. and Fovargue, J. (2012). Mid Rise CLT Buildings – The UK’s Experience and Potential for Australia
and New Zealand. World Conference on Timber Engineering, Auckland, New Zealand, 15-19 July 2012.

BIOENERGY AND FOREST PRODUCT CHEMISTRY PROCEEDING OF THE FIFTH INTERNATIONAL SYMPOSIUM OF INDONESIAN WOOD RESEARCH SOCIETY
47
QUINONES DISTRIBUTION in JUVENILE TEAK WOOD
Ganis Lukmandaru
Department of Forest Product Technology, Faculty of Forestry, Gadjah Mada University
Email : [email protected]
Abstract
Quinones and their derivatives are the main causes on the natural termite resistance in teak wood. By using different
termite test methods, the previous paper in this series reported on the termite resistance of teak trees of juvenile ages (8-
, and 22-year-old trees). In this study, the radial distribution of quinones (tectoquinone, lapachol, desoxylapachol and its
isomer) and other components in the different extracting solvents (n-hexane, ethyl acetate, and methanol) were analyzed
by means of gas chromatography. Appreciable tree to tree variations are observed in extractive component contents
even in the same stand. Each solvent gave different tendencies to analysis of variance of component contents.
Significant differences in desoxylapachol or its isomer, and squalene content were found among the outer heartwood of
8-, and 22-year old trees, as well as between the inner and outer parts of the heartwood. The highest correlation degree
between extractive content and its components was measured in the tectoquinone content (r=-0.68). By using paper disc
method, only modest correlations were observed between the mass loss and the content of isodesoxylapachol (r=-0.60)
in the sapwood region whereas no significant corellations were measured in the heartwood region.
Keywords : Tectona grandis, antitermitic activities, extractive, tectoquinone, Reticultermes speratus
Introduction
Teak (Tectona grandis L. f.) is a fancy hardwood prized for its workability and high natural durability. Teak
grows naturally throughout southeastern Asia and widely planted in all tropical regions. In Indonesia, large teak
community forests have been established and managed for fast growth with trees harvested in a rotation period of less
than 30 years. The wood from these trees is usually consists larger proportion of sapwood and juvenile wood. This
results in a reduced market value, although the technical data with regard to wood quality of young stage trees is still
limited. Unfortunately, most studies focused on heartwood with little consideration given to sapwood, although several
studies of fast-grown teak trees have shown that a high sapwood fraction is present. One report by Bhat and Florence
(2003) demonstrated the lower durability of juvenile teak wood against fungi.
In teak, natural durability is ascribed to the presence of toxic extractives mainly quinone (Sandermann and
Simatupang 1966; Rudman and Gay 1961). Difference in natural durability may be related to the concentrations of toxic
extractives. In a preliminary result (Lukmandaru 2013), samples of young teak wood trees (8- and 22-year-old trees)
were compared to mature wood (51-year-old trees) for antitermitic activities evaluation. That experiment exhibited the
wide variation in antitermitic properties on the basis of tree age and radial direction. Further, the results also
demonstrated the differences between wood block (natural condition) and wood extracts (paper disc/in vitro) method in
termite tests.
In this report, the radial distribution of quinones of teak was investigated on the corresponding samples of
those trees to estimate the effect of extractives on the relative antitermitic activities of the wood. This research used
three different solvents on the basis of polarity for extracting the wood by cold extraction. The other purposes of this
study were to relate the amount of the major compounds to the extractive content, as well as to relate the amount of the
active compounds to previous data on anttermitic properties (paper disc method).
Materials and Methods
Preparation of samples
Nine Javanese teak trees were collected previously (Lukmandaru 2013) for this study. The members of the 8-
year group (trees 1 to 5) and 22-year-old group (trees 6 to 9) were felled from farm forest (Jogja Province). A 5 cm thick
disc was removed at approximately breast height from the trees which were free of signs of incipient decay and colour
variations. Each disc was divided into five parts: outer sapwood (OS), inner sapwood (IS), outer heartwood (OH), and
inner heartwood (IH). With the limited amount of suitable material available, the IH zone in the 8-year-old discs was
excluded. Sections from two opposite radii were converted into wood meal by drilling and were then combined to form a

BIOENERGY AND FOREST PRODUCT CHEMISTRY PROCEEDING OF THE FIFTH INTERNATIONAL SYMPOSIUM OF INDONESIAN WOOD RESEARCH SOCIETY
48
single sample in order to minimize variation between radii, if any. The wood meal samples were then ground to 20-40
mesh size for chemical analyses and determination of the content of the extractives.
GC and GC-MS analysis
Wood meal samples (one gram oven dry weight) were extracted at room temperature with 10 ml n-hexane
(C6H6) and retained for one week. The extracts of n-hexane (C6H6), EtOAc, and MeOH (concentration of 100 mg/mL)
were analyzed using a Hitachi G-3500 GC equipped with FID and NB-1 capillary 30-m column. Operation temperature
was 120−300ºC with a heating rate of 4ºC /min and held at 300ºC for 15 min. Injector and detector temperatures were set
at 250ºC. Helium was used as the carrier gas, the split ratio was 80:1, and the injected volume was 1.0 μL. For
quantification of individual substances, calibrations were made using known amounts of standard tectoquinone (2-methyl
antahraquinone). The amounts of components are expressed as mg per 100 g of oven dry weight. Pure sample of
squalene and lapachol purchased from Kanto Chem were also was used for confirmation. Chemical analyses of ethyl
acetate (EtOAc) and methanol (MeOH) extracts were obtained separately in the same manner as described for the C6H6
extract.
The identification of constituent compounds was based on their mass spectra and gas chromatographic
retention behavior. GC-MS GC-MS analysis on a Shimadzu QP-5000 with operation conditions being similar to GC
analysis. The MS operating parameters were temperature ionization voltage of 70 eV, transfer line temperature at 250ºC,
and scan range of 50–500 atomic mass unit. Deoxylapachol or its isomer was identified by comparison of their mass
spectra with those from previous studies by Windeisen et al. (2003) and Perry et al. (1991). From the contents of
tectoquinone, lapachol, desoxylapachol and its isomer, the total quinone content (TQC) was calculated.
Extractives Content Determination
The remainder of the extract taken for extractive analyses was filtered and the residue was washed three times
with 10 ml of solvent. The extract was concentrated in a rotary film evaporator, dried and weighed to determine the
extractives content. The extractives content was calculated as a percentage (w/w) of moisture-free wood meal.
Termite resistance test
The natural termite resistance data were taken from the previous report (Lukmandaru 2013). A petri dish
containing 20 g moistened and sterilized sea sand was used as a container test. Paper were impregnated with
chloroform solution containing each extract of the test fractions. The treatment retention was 5 % (w/w) per disc. The
control discs were impregnated with chloroform only and dried with the same manner. Fifty worker Reticulitermes
speratus Kolbe termites were introduced into the petri dish. The petri dishes were placed in a dark chamber at 27 0C and
80 % relative humidity. After 10 days the disc were taken out, dried and the weight loss was determined. This procedure
was replicated three times for each sample for each sample for a total of 93 observations. Dead termites were counted in
the first day and at the end of observation. The mass loss since the start of the experiment was determined.
Statistical analysis
The variation in the extractive and extratcive component contents was analyzed using general linear models
procedure by two-way (tree age and radial direction factors) analysis of variance (ANOVA) followed by Duncan’s multiple
range test (p = 0.05). The relationships between the dependent variables or observed were studied with a Pearson’s
correlation analysis. All statistical calculations were conducted using SPSS-Win 10.0.
Results and discussion
Distribution of extractives as related to natural durability
The gas chromatogram of heartwood EtOAc extract is shown in Figure 2. The major compounds detected in
those chromatograms were lapachol, tectoquinone, desoxylapachol and its isomer (isodesoxylapachol), and squalene.
All these compounds have been reported as teak components (Sandermann and Simatupang 1966, Windeisen et al.
2003, Lukmandaru and Takahashi 2009).
The quantification of three extracts was presented in Table 1-3. As expected, the extractive content of all of the
tree age groups followed a general pattern of increasing from pith (IH) to the OH, then decreasing towards the OS. The
highest amount levels of squalene, deoxylapachol and its isomer were measured in C6H6 extracts whereas tectoquinone
content was determined in MeOH extracts. It was noted also that lapachol was not detected in C6H6 extracts but it was
detected in other extracts although in trace amounts. In the sapwood region, particularly, the comparatively higher total

BIOENERGY AND FOREST PRODUCT CHEMISTRY PROCEEDING OF THE FIFTH INTERNATIONAL SYMPOSIUM OF INDONESIAN WOOD RESEARCH SOCIETY
49
quinone content levels were found in MeOH extracts. The current results also showed wide variation by examining
standard deviations, even in trees from the same sites. This meant that teak may not always have a high amount of
certain compounds.
Factorial analysis of variance (Table 4) revealed different result among the extracts. For example in
dexylapachol content, significant interactions were calculated in both C6H6 and EtOAc extract but not in MeOH extracts.
Further, with regard to tectoquinone content, radial variation affected signicantly in EtOAc extract, a significant interaction
was found in MeOH content while no significant effects of tree age and radial direction in C6H6 extracts. Interactions was
found in in all extracts, however, in total quinone content. Those differences reflects the specific capacity in each extract
to dissolve the main components of teak. In this regard, the most effective solvent should be choosen by considering the
most extracting solvent.
Figure 1. Gas chromatogram of teak from ethyl acetate extract of heartwood. Five major compounds are indicated : peak
1 (Rt 10.1) & 3 (Rt 12.1) = deoxylapachol and its isomer; peak 2 (Rt 11.8) = lapachol; peak 4 (Rt 13.7) = tectoquinone;
and peak 5 (Rt 27.4) = squalene.
Table 1. Contents of major components (mg/100 g of oven-dry wood) in the n-hexane soluble extracts of teakwood trees
aged 8 and 22 (radial position).
Components Radial position
Outer sapwood Inner sapwood Outer heartwood Inner
heartwood
8 y 22 y 8 y 22 y 8 y 22 y 22 y
Desoxylapachol 0 (0)a 10.25
(10.55)b
5.65
(10.63)b
5.37 (6.18)b 9.46
(6.70)b
205.02
(144.70)c
65.85
(83.43)b
Lapachol 0 (0) 0 (0) 0 (0) 0 (0) 8.16
(20.00)
10.37
(12.95)
3.47 (4.14)
Isodesoxylapachol 3.50
(4.56)
0.35
(0.70)
3.66
(2.97)
2.90 (3.10) 11.05
(7.03)
331.15
(539.30)
18.95
(29.97)
Tectoquinone 0 (0) 3.90
(2.61)
2.78
(4.72)
4.15 (3.59) 42.06
(65.05)
19.37 (6.94) 26.87
(19.40)
Squalene 5.51 22.40 16.23 100.45 110.25 473.78 454.72

BIOENERGY AND FOREST PRODUCT CHEMISTRY PROCEEDING OF THE FIFTH INTERNATIONAL SYMPOSIUM OF INDONESIAN WOOD RESEARCH SOCIETY
50
(4.84)d (13.11)e (7.21)e (47.95)f (89.08)f (346.94)g (453.15)g
Total quinone content 3.50
(4.56)h
14.50
(12.24)h
12.10
(14.25)h
12.42
(5.16)h
70.75
(92.52)i
565.92
(649.97)j
115.15
(130.41)i
Table 2. Contents of major components (mg/100 g of oven-dry wood) in the ethyl acetate soluble extracts of teakwood
trees aged 8 and 22 (radial position)
Components Radial position
Outer sapwood Inner sapwood Outer heartwood Inner
heartwood
8 y 22 y 8 y 22 y 8 y 22 y 22 y
Desoxylapachol 0 (0)a 0.30
(0.21)b
0.02
(0.04)b
1.00
(0.91)c
1.10
(1.70)c
70.70
(55.70)d
11.10 (12.19)c
Lapachol 0.10
(0.13)
trace 0.70
(0.84)
0.60
(0.39)
3.80
(4.54)
29.60
(51.30)
8.00 (12.85)
Isodesoxylapachol 0.30
(0.28)e
0.40
(0.78)e
0.50
(0.75)e
1.30
(1.62)e
4.60
(3.41)f
77.8
(76.50)g
13.60 (10.82)f
Tectoquinone 0.10
(0.17)h
0.90
(1.16)h
1.20
(2.77)h
3.10
(5.14)h
20.20
(20.63)i
44.8
(43.75)i
20.70 (24.40)i
Squalene 0.60
(0.56)j
1.30
(1.15)j
2.00
(3.09)j
10.90
(8.80)j
14.90
(26.14)j
75.80
(29.12)k
36.20 (24.73)k
Total quinone content 0.50
(0.19)l
1.60
(2.07)l
1.70
(4.08)l
2.50
(5.00)l
30.00
(26.83)m
490.00
(646.89)n
50.00
(57.15)m
Table 3. Contents of major components (mg/100 g of oven-dry wood) in the methanol soluble extracts of teakwood trees
aged 8 and 22 (radial position)
Components Radial position
Outer sapwood Inner sapwood Outer heartwood Inner
heartwood
8 y 22 y 8 y 22 y 8 y 22 y 22 y
Desoxylapachol 18.5
(31.05)
7.00
(4.00)
39.20
(74.11)
21.60
(39.41)
2.00
(2.43)
49.90
(98.16)
38.60
(39.27)
Lapachol 0.69
(0. 96)
5.00
(4.81)
1.10
(1.44)
3.80
(6.42)
2.50
(3.64)
41.10
(75.63)
5.40 (7.08)
Isodesoxylapachol 2.80
(2.67)
1.90
(3.21)
3.90
(2.45)
2.80
(3.82)
4.30
(4.04)
25.10
(36.17)
18.60
(20.48)
Tectoquinone 13.10
(20.62)a
10.90
(17.97)a
7.70
(14.79)a
14.20
(15.10)a
17.80
(10.82)a
101.60
(60.69)b
53.80
(17.92)b
Squalene 2.10
(2.75)c
7.30
(3.64)c
5.60
(4.19)c
26.90
(20.65)dc
22.00
(21.95)dc
143.80
(45.23)d
97.20
(44.52)d
Total quinone content 33.30
(37.77)e
25.00
(23.80)e
50.00
(76.42)e
42.50
(59.09)e
25.00
(17.61)e
215.00
(165.43)f
112.50
(60.21)f
Note for Table 1-3 : Mean of 5 trees (8 years old) and 4 trees (22 years old), with the standard deviation in parentheses.
The same letters in the same row are not significantly different at p < 5% by Duncan’s test. tr = trace (detected, the value
< 0.01 %).

BIOENERGY AND FOREST PRODUCT CHEMISTRY PROCEEDING OF THE FIFTH INTERNATIONAL SYMPOSIUM OF INDONESIAN WOOD RESEARCH SOCIETY
51
Table 4. Factorial analysis of variance results (probability) for three different extracts (n-hexane, ethyl acetate, and
methanol).
Components Source of variation
Tree age Radial direction Tree age x radial direction
a) n-hexane extract
Desoxylapachol <0.01** <0.01** <0.01**
Lapachol 0.84 0.16 0.96
Isodesoxylapachol 0.12 0.12 0.09
Tectoquinone 0.59 0.09 0.54
Squalene 0.04* <0.01** 0.13
Total quinone content 0.05 <0.01** 0.02*
b) Ethyl acetate extract
Desoxylapachol <0.01** <0.01** <0.01**
Lapachol 0.13 0.15 0.11
Isodesoxylapachol 0.01* <0.01** <0.01**
Tectoquinone 0.21 <0.01** 0.31
Squalene <0.01** <0.01** <0.01**
Total quinone content 0.06 0.03* 0.04*
c) Methanol extract
Desoxylapachol 0.74 0.84 0.31
Lapachol 0.12 0.26 0.23
Isodesoxylapachol 0.24 0.15 0.16
Tectoquinone <0.01** <0.01** <0.01**
Squalene <0.01** <0.01** <0.01**
Total quinone content 0.04* 0.05 <0.01**
** Significant at 1 % level, * significant at 5 % level
By ANOVA, in the C6H6 soluble extracts, the significant differences between IS and OS were measured in
squalene contents while in the EtOAc and MeOH soluble extracts, no significant differences were found. In the C6H6 and
EtOAc soluble extracts between the OH and IH, significant differences were found in desoxylapachol and its isomer as
well as TQC contents whereas no significant differences were determined between IH and OH in any component
contents in the MeOH soluble extracts. The tree age factor affected signicantly in desoxylapachol, isodesoxylapachol,
squalene, and TQC contents in the heartwood region. Both in the C6H6 and EtOAc soluble extracts, the tree age factor
affected signicantly desoxylapachol, isodesoxylapachol, squalene, and TQC contents in the heartwood region. In the
sapwood region, the same tendency was found also in squalene content in the C6H6 extracts and desoxylapachol content
in the EtOAc and MeOH extracts. In the MeOH extracts, it is noted that tree age factor affected significantly tectoquinone
contents in the heartwood region.
As expected, the interaction in the C6H6 and EtOAc extract showed that the highest deoxylapachol and TQC
contents were found in the outer heartwood of 22-year-old trees while no significant differences were found between the
IH of 22- and OH of 8- year-old trees. Different tendencies between C6H6 and EtOAc extracts were seen in squalene
isodesoxylachol amounts. In the sapwood region, it is noted that IS of 22-year-old trees gave the highest amounts in
squalene content in C6H6 and MeOH extracts as well as desoxylapachol content in EtOAc extracts. In the MeOH
extracts, with regard to tectoquinone content, significant differences were counted merely between sapwood and
heartwood regions as the highest tectoquinone content were measured in the heartwood of 22-year-old trees. Further, on
the basis of interactions, it is also revealed that the highest TQC were found in the heartwood of 22-year-old trees.
The OH from 8-, and IH from IH from 30- trees were formed in approximately the same growing seasons
(juvenile region, 4–6th ring); this study revealed the significant differences in the squalene (C6H6 and EtOAc soluble
extracts), tectoquinone and TQC levels (MeOH soluble extracts). Sandermann and Dietrichs (1959) observed that the
concentration of tectoquinone is highest in the center of heartwood. Although the highest tectoquinone level was
measured in the OH region of both 22-old trees, the ANOVA revealed that there was not a statistically significant
difference with those in the OH and IH.

BIOENERGY AND FOREST PRODUCT CHEMISTRY PROCEEDING OF THE FIFTH INTERNATIONAL SYMPOSIUM OF INDONESIAN WOOD RESEARCH SOCIETY
52
Previous communication (Lukmandaru 2013) exhibited the less antitermitic activity in the hearwood parts
compared to sapwood in all extracts. Further, it was showed that the OH was more resistant compared to the IH in C6H6
and EtOAc soluble extracts. As would be expected, the sapwood values were significantly lower than heartwood for
desoxylapachol, isodesoxylapachol, tectoquinone, squalene, and TQC contents. Levels of deoxylapachol, and TQC in
the OH were significantly higher than in the IH of 22-year-old groups. On the basis of radial direction and tree age, no
statistical differences were observed with regard to termite mortality rates in the MeOH extracts. This was unexpected
results as there was a significantly higher tectoquinone content in the heartwood of 22-year-old tree samples. It is
thought that MeOH extracted more extractives than other solvents so that more compounds, especially non-quinones,
affected the behaviour of mortality rates in the previous experiment.
As lapachol, desoxylapachol, and tectoquinone have been reported to be active against termites (Lukmandaru
2012; Sandermann and Simatupang 1966; Rudman and Gay 1961), this finding confirms that teak from community forest
trees begin producing toxic constituents at the young tree stage. The low amounts of toxic compounds in the sapwood
and inner heartwood corresponds reasonably well with Da Costa et al. (1959), Lukmandaru and Takahashi (2008), and
Rudman et al. (1967), who reported that the wood regions near pith and sapwood were much less resistant to termite
attack than the outer heartwood by using wood blocks method. Rudman et al. (1958) concluded that, although
tectoquinone exhibited strong antitermitic properties, this compound is not the sole cause of termite resistance. The
considerable amounts of desoxylapachol and its isomer identified in this study suggests that these compounds, along
with tectoquinone, play an important role in generating resistance to termites. Da Costa et al. (1958) reported that termite
antifeedancy of the outer heartwood increases significantly with the age of the tree. That phenomenon may be related to
differences in the amount of desoxylapachol and its isomers between the younger trees (8 and 22 years).
Relationship between extractive compounds and total extractive contents
The Pearson correlations between the extractive content and various extractive compounds are presented in
Table 5. Correlations of a comparatively high degree were observed between the EtOAc extrative content and squalene
(r=0.79) whereas the highest degree of quinone compounds were observed between EtOAc extractive content and
tectoquinone content levels (r=0.68). This results suggest squalene and some quinones were more dissolved in EtOAc
so that it could describe its extractive content. The preliminary work (Lukmandaru 2013) revealed that extractive content
moderately correlated with antitermitic properties. Thulasidas et al. (2007) demonstrated that the quinones present in
teak wood even in minor amount is more significant than its extractive content level against some fungi. As this present
results confirmed that no strong correlation was found between quinones and antitermite propertes, it might partially
explain the weak relation between extractive content and antifungal or antitermite properties.
Table 5. Pearson’s correlation coefficients between extractive content and extractive component contents.
Compound Extractive content
n-hexane Ethyl acetate Methanol
Desoxylapachol 0.52** 0.67** 0.37*
Lapachol 0.48** 0.44 ** 0.07
Isodesoxylapachol 0.41* 0.55** 0.41*
Tectoquinone 0.55** 0.68** 0.44**
Squalene 0.68** 0.79** 0.48**
Total quinone content 0.49** 0.54** 0.49**
** Significant at 1 % level, * significant at 5 % level
Relationship between extractive compounds and antitermitic properties
Correlation analysis between natural termite resistance parameters and main compounds is shown in Table 6.
The highest degree of correlations were determined between mass loss and squalene content in C6H6 extract (r=-0.62) or
MeOH extract (r=-0.57) in the sapwood region whereas in the EtOAc extracts were measured between mass loss and
deoxylapachol content (r=-0.60) as well as between mortality rates and isodesoxylapachol content (r=-0.58) in the
sapwood region. Those correlations meant the wood is more resistant against the termites when the content of squalene
or desoxylapachol was higher in the sapwood areas. A negative correlation between mortality rates and
isodesoxylapachol seemed to be odd as it is interpreted the more isodesoxylapachol content, the less mortality rates of
termites will be. The explanation might be the low quantity of isodesoxylapachol in the sapwood did not directly affect its

BIOENERGY AND FOREST PRODUCT CHEMISTRY PROCEEDING OF THE FIFTH INTERNATIONAL SYMPOSIUM OF INDONESIAN WOOD RESEARCH SOCIETY
53
toxicity but along with the non-structural carbohydrates, it affected the formation other toxic quinones in the sapwood, as
suggested by Haupt et al (2003) and Niamke et al. (2011).
As the corellations were observed merely in the sapwood region, it is assumed that the less complexity of
extractive composition in that area make it easier to predict its natural termite resistance properties than in the
heartwood. Although squalene, a triterpene, was never mentioned to an active compound against termites, this finding
suggested this compound could be a hydrophobic barrier, particularly in the sapwood parts. It is generally known that
subterranean termites requires more humidity to survive compared to dry-wood termites. Thus, it is necessary to explore
the role of squalene in the future work. On the other hand, tectoquinone, as the principal component against termites
(Sandermann and Simatupang 1966), did not show any significant correlations with antitermitic properties.
Previous investigation (Lukmandaru and Takahashi 2009) in the form of wood blocks resulted negatively
moderate correlation between mass loss and tectoquinone (r=-0.49) or isodesoxylapachol (r=-0.47). Thus, it is concluded
that both in the natural condition form (wood blocks) and extracts form (in vitro) is still difficult to predict natural termite
resistance by choosing one parameter, particularly in the juvenile stages. Multivariate regressions would be helpful to
describe any possibilities of sinergistic or antagonistic relationship among the extractive components of teak wood. In
other species, Taylor et al. (2006) found that variations in extractive components could not sufficientlt explain the
variation in fungal and termite resistance of Thuja plicata and Chamaecyparis nootkanensis wood.
Table 6. Pearson’s correlation coefficients between natural termite resistance parameters in wood blocks and extractive
component contents.
Components Antitermitic properties
Mass loss Mortality rate
Total Sapwood Heartwood Total Sapwood Heartwood
a) n-hexane extract
Desoxylapachol -0,37* -0.39 -0.19 -0.37* -0.46 -0.18
Lapachol -0.34 - -0.32 -0.30 - -0.16
Isodesoxylapachol -0.21 0.31 -0.13 -0.20 0.20 -0.09
Tectoquinone -0.41* -0.45 -0.31 -0.40* -0.34 -0.24
Squalene -0.51* -0.62** -0.39 -0.43* -0.33 -0.18
Total quinone content -0.32 -0.36 -0.20 -0.31 -0.41 -0.15
b) Ethyl acetate extract
Desoxylapachol -0.33 -0.60** -0.18 -0.28 -0.52* -0.08
Lapachol -0.19 -0.12 -0.13 -0.18 0.16 -0.07
Isodesoxylapachol -0.34 -0.48* -0.23 -0.35 -0.58** -0.23
Tectoquinone -0.49** -0.38 -0.44 -0.57** -0.36 -0.52
Squalene -0.56** -0.58* -0.40 -0.47** -0.45 -0.15
Total quinone content -0.27 -0.22 -0.18 -0.26 -0.23 -0.14
c) Methanol extract
Desoxylapachol -0.08 -0.05 -0.13 -0.26 -0.10 -0.27
Lapachol -0.13 -0.27 0.12 0.00 0.08 0.26
Isodesoxylapachol -0.28 -0.07 -0.06 -0.32 -0. 03 -0.15
Tectoquinone -0.37* -0.14 0.04 -0.35 -0.26 0.04
Squalene -0.55** -0.57* -0.20 -0.46* -0.33 -0.09
Total quinone content -0.30 -0.13 -0.02 -0.33 -0.01 -0.05
** Significant at 1 % level, * significant at 5 % level
.

BIOENERGY AND FOREST PRODUCT CHEMISTRY PROCEEDING OF THE FIFTH INTERNATIONAL SYMPOSIUM OF INDONESIAN WOOD RESEARCH SOCIETY
54
Conclusions
Tree age and radial position affected the presence and amount of quinone components detected in teak
extracts. In addition, the extracting solvents also influenced the results of which n-hexane gave the highest amount of
some quinones. This study demonstrated that teak at the young tree stage begin producing toxic constituents such as
tectoquinone, deoxylapachol and isodesoxylapachol even in the sapwood. Considerable variation was observed in the
extractive component contents of wood samples taken from the same site. On the basis of significant interactions, the
highest deoxylapachol and total quinone contents were found in the outer heartwood of 22-year-old trees. In the
sapwood region, the highest amounts in squalene and desoxylapachol were observed in the inner sapwood of 22-year-
old trees. The toxic quinone component contents were positively correlated with total extractive content, with the highest
correlation degree being observed in the tectoquinone content. The amount desoxylapachol was moderately correlated
with antifeedant properties in the sapwood. Variation in the individual active quinone contents as well as total quinone
components, however, could not explain satisfactorily the variation in termite resistance.
References
Bhat KM, Florence EJM. 2003. Natural decay resistance of juvenile teak wood grown in high input plantations.
Holzforschung 57:453–455.
Da Costa EWB, Rudman P, Gay FJ. 1958. Investigations on the durability of Tectona grandis. Empirical Forestry Review
37:291–298.
Haupt M, Leithoff H, Meier D, Puls J, Richter HG, Faix O. 2003. Heartwood extractives and natural durability of
plantation-grown teakwood (Tectona grandis L.)—a case study. Holz Roh-Werkst 61:473-474.
Lukmandaru G. 2012. Bioactive extracts from neutrals of teakwood (Tectona grandis L.f.). Proceedings of the 3rd
International Symposium of Indonesian Wood Research Society. Yogyakarta, p. 328-332.
Lukmandaru G. 2013. Antitermitic activites of juvenile teak wood grown in community forest. Jurnal Ilmu dan Teknologi
Kayu Tropis (in press).
Lukmandaru G dan Takahashi K. 2008. Variation in the natural termite resistance of teak (Tectona grandis L.f.) as a
function of tree age. Annals of Forest Science 65: 708 p1 - p8
Lukmandaru G dan Takahashi K. 2009. Radial distribution of quinones in plantation teak (Tectona grandis L.f.). Annals of
Forest Science 66: 605 p1 – p9
Niamké FB, Amusant N, Charpentier JP, Chaix G, Baissac Y, Boutahar N, Adima AA, Coulibaly SK, Allemand CJ. 2011.
Relationships between biochemical attributes (non-structural carbohydrates and phenolics) and natural durability
against fungi in dry teak wood (Tectona grandis L. f.). Annals of Forest Science 68:201–211.
Rudman P, Da Costa EWB, Gay FJ. 1967. Wood quality in plus trees of teak (Tectona grandis L. f.) : an assessment of
decay and termite resistance. Sylvae Genet 16:102 -105.
Rudman P, Da Costa EWB, Gay FJ, Wetherly AH. 1958. Relationship of tectoquinone to durability in Tectona grandis.
Nature 181:721 – 722.
Rudman P, Gay FJ. 1961. The causes natural durability in timber part VI. Measurement of anti-termite properties of
anthraquinones from Tectona grandis L.f. by rapid semi-micro method. Holzforschung 15:117-120.
Sandermann W, Dietrichs HH. 1959. Chemische untersuchungen an Teakholz. Holzforschung 13:137-148.
Sandermann W, Simatupang MH. 1966. On the chemistry and biochemistry of teakwood (Tectona grandis L. fil). Holz
Roh-Werkst 24:190-204.
Taylor AM, Gartner BL, Morrell JJ, Tsunoda K. 2006. Effects of heartwood extractive fractions of Thuja plicata and
Chamaecyparis nootkanensis on wood degradation by termites or fungi. J Wood Sci 52: 147-153.
Thulasidas PK, Bhat KM. 2007. Chemical extractive compounds determining the brown-rot decay resistance of teak
wood. Holz Roh-Werkst 65:121-124.
Windeisen E, Klassen A, Wegener G. 2003. On the chemical characterization of plantation teakwood (Tectona grandis
L.) from Panama. Holz Roh-Werkst 61:416-418.

BIOENERGY AND FOREST PRODUCT CHEMISTRY PROCEEDING OF THE FIFTH INTERNATIONAL SYMPOSIUM OF INDONESIAN WOOD RESEARCH SOCIETY
55
ENZYMATIC SACCHARIFICATION AND ETHANOL PRODUCTION OF XYLEMS
FROM INDONESIAN BOTANICAL GARDEN TREES
Wahyu Dwianto1*, Danang Sudarwoko Adi1, Ika Wahyuni1, Fitria1,
Rumi Kaida2, Takahisa Hayashi2 1 Research and Development Unit for Biomaterials, Indonesian Institute of Sciences,
Cibinong Science Center, Jl. Raya Bogor Km.46, Cibinong, Bogor 16911, Indonesia
2 Plant Genetics, Department of Bioscience, Tokyo University of Agriculture,
1-1-1 Sakuragaoka, Setagaya-ku, Tokyo 156-8502, Japan
*E-mail: [email protected]
Abstract
Saccharification and fermentation processes were applied for xylems derived from 49 trees of Cibodas, 32 trees of
Purwodadi, and 19 trees of Bali Botanical Gardens in Indonesia. These xylems were subjected to two different
treatments of ethanol production, i.e. saccharification followed by fermentation, and simultaneous saccharification and
fermentation (SSF). The sugar released was determined using Nelson-Somogyi method. The results showed that the
trees whose yields of enzymatic hydrolysis of cellulose were higher than that of the reference sengon (Paraserianthes
falcataria) were Gymnostoma sumatranum, Adenanthera microsperma and Casuarina junghuhhniana from Cibodas
Botanical Garden; Firmiana malayana and Pterocarpus indicus from Purwodadi Botanical Garden; and Alstonia
scholaris, Flacourtia rukam, Sapindus rarak and Ficus padana from Bali Botanical Garden. Sugar released after 48 h
enzymatic saccharification for G. sumatranum, A. microsperma, C. junghuhhniana, F. Malayana, P. indicus, A. scholaris,
F. rukam, S. rarak and F. padana were 42.5, 37.1, 28.6, 36.9, 34.0, 38.0, 36.9, 34.9, and 30.3 mg/100 mg xylem,
respectively, and for ethanol production were 12.1, 14.1, 13.8, 14.7, 15.3, 11.2, 12.1, 11.1, and 10.0 mg per 100 mg
xylem in the same order.
Keywords: saccharification, fermentation, enzymatic hydrolysis, sugar released, ethanol production
Introduction
Tropical countries are the most productive places in producing tree biomass, producing an enormous amount
of plants. These places experience abundant rain and no winter climate at any time during the year, generating various
kinds of trees as natural resources. Many valuable tree plants have been found in Indonesian forests. In addition to
native trees, many tropical trees were also collected from all over the world and planted in Indonesian Botanical Gardens,
i.e. Cibodas, Purwodadi and Bali.
Recently, raw materials for bioethanol production are still dominated by food plants (generation I), such as
corn, sugar-cane, cassava, etc. This condition will cause conflict of interest as it competes with food supply, causing
increasing price of foods. This situation becomes worse as environmental issue such as global warming has been
predicted to threaten world food supply. Furthermore, the availability of these raw materials is not guaranteed. Generally,
even the total amount of starch and sucrose production of the world (1.5 x 10⁹ tonnes/year) that can be converted into
bioethanol can only fulfil at the most of 8 x 10¹¹ L/year while the demand for world fuel is 1.2 x 10¹² L/year (Hayashi,
2009). Therefore, alternative sources of raw materials other than food crops are needed, which is the non-food
lignocellulosic materials (generation II).
Wood-derived lignocellulosic biomass is a good solution as an alternative raw material for bioethanol that
should be developed. Wood has several advantages such as having high cellulosic content (≥80% holocellulose). In
spite of that, wood can be planted in marginal land, unlike agriculture crops (Kaida et al., 2009a). Mixing of 85% wood-
based bioethanol (E85) with fossil fuel can reduce 65% carbon emission while mixing of starch-based bioethanol with
fossil fuel can only reduce it for 17~23% (Watanabe, 2008). Bioethanol raw material from wood does not need spacious
storage unlike other lignocellulosic materials. Wood can also be cultivated as Industrial Timber Plantation to more ensure
material supply. Cellulose produced from this industrial forest can reach up to 5.0 x 10⁹ tonnes/year that can be
converted into 2.6 x 10¹² L of bioethanol (Hayashi, 2009). Wood plantation on Industrial Timber Plantation area suits
Kyoto Protocol since these planted trees can increase carbon stock on earth which eventually will reduce green-house
gasses in the atmosphere.

BIOENERGY AND FOREST PRODUCT CHEMISTRY PROCEEDING OF THE FIFTH INTERNATIONAL SYMPOSIUM OF INDONESIAN WOOD RESEARCH SOCIETY
56
Plant-derived fuel will be one potential solution as an alternative energy source because abundant production
of biomass in Indonesia. Therefore, continuity of plant-derived fuel is more guaranteed than that of fossil fuel. Indonesia
has various wood species that strengthen its position as world producer for bioethanol in the future by exploring potential
wood species.
The main problem on bioethanol production from lignocellulosic biomass, especially wood is the characteristic
of plant cell wall which make it difficult for enzymatic hydrolysis. This drawback limits its utilization and cause
uneconomical ethanol production from cellulose. Hayashi (2009) mentioned that wood is highly resistant to enzymatic
degradation which inhibits its degradation into fermented sugar. Therefore, easy accessibility for both saccharification
and fermentation is also included as the most important factors in the conversion of wood into bioethanol.
Research on uncomplicated hydrolysis process and conversion of a wood species to become bioethanol is still
uncommon so that big opportunity is widely opened to seek and explore these wood species. Recent studies revealed
that sengon xylem consists of soft walls which are easily hydrolysable with commercial cellulase preparations. On the
other hand, mangium xylem consists of hard walls which are less hydrolysable than those of sengon, although lignin
content is lower for mangium than sengon (Kaida et al., 2009a). Genetically loosened walls increased the level of
saccharification from 30% to 60% in the case of sengon and from 10% to 15% in the case of mangium (Kaida et al.,
2009a). It is required to know the variety of saccharification level in the fast-growing tropical trees, in which sengon is the
fastest growing tree species in Indonesia. Enzymatic saccharification was employed in this study because the hydrolysis
is much more environmentally friendly than other processes such as acid hydrolysis. Therefore, the aim of this study is to
screen and to assess the xylems of Indonesian Botanical Garden trees for saccharification in order to be used in
bioethanol production.
Materials and Methods
Xylem preparation
Branch of trees from mentioned Botanical Gardens were cut out at the height of 2 to 3 m above the ground.
Their barks were peeled and their xylems were dried in an oven at 70°C. The xylem was then milled to a powder using a
ball mill at a speed of 15 rps for 30 min. The powder was used as a xylem preparation for saccharification alone or in
combination with fermentation.
Wall analysis
Xylem preparation was ground in liquid nitrogen and the resulting fine powder was successively extracted 4
times with water and 24% KOH containing 0.1% NaBH4. The insoluble wall residue (cellulose fraction) was washed twice
with water. The amount of cellulose was determined by measuring the acid-insoluble residue: the samples were
extracted with acetic/nitric reagent (80% acetic acid/concentrated nitric acid, 10:1) in a boiling water bath for 30 min
(Updegraff, 1969) and the resulting insoluble material was washed in water and freeze-dried. Total sugar in each fraction
was determined by phenol-sulfuric acid method (Dubois et al., 1956). Lignin content was determined by the Klason
method (Chiang and Funaoka, 1990).
Enzymatic hydrolysis
Fifty mg of each xylem preparation was impregnated with water, autoclaved at 120°C for 3 min, and washed
once with water by centrifugation. A commercial cellulase preparation (Accelerase, Palo Alto, USA) derived from
Trichoderma viride was used to digest the xylem. The enzyme preparation contained endocellulases, exocellulases
(CBHI and CBHII), xyloglucanase, xylanase, galactanase and polygalacturonase. Enzymatic hydrolysis of the xylem
preparation was performed in 1 ml of 50 mM sodium acetate buffer, pH 4.8, containing 0.02% Tween 20 and 0.4 fpu
(filter paper units) of a cellulase preparation (2.0 mg). The mixture was incubated at 45°C in a rotary shaker set at 75
rpm. About 100 μl of the supernatant was collected at 48 h of hydrolysis and used for sugar analysis. The sugar released
was estimated as reducing sugar by the Nelson-Somogyi method (Somogyi, 1952). Furthermore, free sugars released
were directly analyzed according to their alditol acetates using gas chromatography (Hayashi, 1989).
Ethanol production
The mixtures from previous enzymatic hydrolysis were inoculated with a seed culture of Saccharomyces
cerevisiae (SH1089) and yeast nutrients (4 mg (NH4)2HPO4, 0.2 mg MgSO4/7H2O and 8 mg yeast extract). The mixtures
were incubated at 37°C in a rotary shaker set at 100 rpm. About 100 μl of the supernatant was collected after 48 h
fermentation and used for ethanol analysis. The ethanol formed was measured by gas chromatography on a

BIOENERGY AND FOREST PRODUCT CHEMISTRY PROCEEDING OF THE FIFTH INTERNATIONAL SYMPOSIUM OF INDONESIAN WOOD RESEARCH SOCIETY
57
Supelcowax-10 column (0.53 mm i.d. × 15 m; Supelco, Bellefonte, PA, USA) at 50°C using an Agilent gas
chromatograph. Butanol was used as an internal standard.
Simultaneous saccharification and fermentation
Mixtures containing each type of xylem preparation with 1 ml of 50 mM sodium acetate buffer, pH 4.8, 0.02%
Tween, 0.4 fpu of a cellulase preparation and a seed culture of Saccharomyces cerevisiae (SH1089) with yeast nutrients
(4 mg (NH4)2HPO4, 0.2 mg MgSO4/7H2O, and 8 mg yeast extract) were prepared. The mixtures were incubated at 37°C
in a rotary shaker set at 100 rpm. About 100 μl of the supernatant was collected after 48 h of hydrolysis and used for
ethanol analysis. The ethanol formed was measured by gas chromatography on a Supelcowax-10 column (0.53 mm i.d.
× 15 m; Supelco, Bellefonte, PA, USA) at 50°C using an Agilent gas chromatograph. Butanol was used as an internal
standard.
Results and Discussion
Cibodas Botanical Garden trees
The results showed that the amounts of celluloses varied between 24.3% (Pterospermum javanicum) and
60.0% (Araucaria glauca). Hemicelluloses varied between 3.3% (Agathis borneensis) and 18.5% (Firmiana malayana).
Lignin contents varied between 22.2% (Casuarina junghuhniana) and 39.6% (Michelia montana).
The levels of enzymatic saccharification varied among xylems from the 49 wood species. At 48 h, the xylem of
G. sumatranum released 42.5 mg of sugars while poplar xylem released only 30.3 mg (Kaida et al., 2009b). The higher
incidence of cellulose hydrolysis was also observed in A. microsperma (37.1 mg) which was higher than in poplar.
Araucaria glauca has the highest cellulose content (60%) while its sugar released was only 17.1 mg. Therefore, the
levels of enzymatic saccharification were regardless of the cellulose content. The ethanol production was higher in the
xylem of G. sumatranum (12.1 mg), A. microsperma (14.1 mg), and C. junghuhhniana (13.8 mg) compared to other wood
species in Cibodas Botanical Garden.
Purwodadi Botanical Garden trees
The results showed that the amounts of celluloses varied between 8.0% (Alstonia scholaris) and 54.8% (Acacia
catechu). Hemicelluloses varied between 5.6% (Lagerstroemia speciosa) and 26.9% (Pterocymbium javanicum). Lignin
contents varied between 23.3% (A. catechu) and 36.9% (Syzygium polyanthum).
The levels of enzymatic saccarification varied among xylems from the 32 trees. At 48 h, the highest level of
saccharification was obtained from the xylem of F. malayana, which had released 36.9 mg of sugars/100 mg xylem, while
sengon only released 29 mg of sugars/100 mg xylem (Kaida et al., 2009a). The higher incidence of cellulose hydrolysis
was also observed in P. indicus (34.0 mg) which was higher than in sengon. Ethanol production in the xylem of F.
malayana and P. indicus were 14.7 mg and 15.3 mg/100 mg xylem, respectively, while sengon was 12 mg/100 mg
xylem.
A. catechu has the highest cellulose content while its sugars released was only 28.4 mg/100 mg xylem.
Therefore, the levels of enzymatic saccharification was regardless of the cellulose content. The amount of hemicellulose
in xylems varied between 5.6 to 26.9%, in which xyloglucan content varied between 0 to 0.1425%. L. speciosa has the
lowest hemicellulose content while its sugar released was only 12.0 mg/100 mg xylem. Therefore, the levels of enzymatic
saccharification was regardless of the hemicellulose content. Although xyloglucanase activity improved the total
hydrolysis of lignocelluloses (Benko, 2008), there was no correlation between ethanol production and xyloglucan content.
Lignin is known to be a recalcitrant compound in cellusose hydrolysis (Chen and Dixon, 2007). The data shows the
correlation between the high level of enzymatic saccharification and the low lignin content, but it does not happen all the
time. A. catechu also has the lowest lignin content but its sugar released was only 28.4 mg/100 mg xylem. Therefore, the
levels of enzymatic saccharification were regardless of the lignin content.

BIOENERGY AND FOREST PRODUCT CHEMISTRY PROCEEDING OF THE FIFTH INTERNATIONAL SYMPOSIUM OF INDONESIAN WOOD RESEARCH SOCIETY
58
Bali Botanical Garden trees
The results showed that the amounts of cellulose varied between 35.9% (Mimusops elengi) and 51.2%
(Tabernaemontana macrocarpa). Hemicelluloses varied between 5.7% (Podocarpus neriifolius) and 22.4% (Flacourtia
rukam). Lignin contents varied between 23.2% (Toona sureni) and 39.1% (Calophyllum soulattri).
The levels of enzymatic saccharification varied among xylems from the 19 wood species. At 48 h, the highest
level of saccharification was obtained from the xylem of A. scholaris which released 38.0 mg sugars per 100 mg xylem
while sengon only released 29.0 mg sugars per 100 mg xylem (Kaida et al., 2009a). Higher levels of cellulose hydrolysis
when compared to that of sengon were also observed in F. rukam (36.9 mg), S. rarak (34.9 mg) and F. padana (30.3
mg). The ethanol production in the xylems of A. scholaris, F. rukam, S. rarak and F. padana were 11.2 mg, 12.1 mg,
11.1, and 10.0 mg per 100 mg xylem, respectively.
T. macrocarpa has the highest cellulose content while its sugar-released was only 24.8 mg per 100 mg xylem.
From this condition, it can be said that the level of sugar released was not directly related to cellulose content. The
amount of hemicellulose in xylems varied between 5.7 to 22.4%, in which xyloglucan contents varied between 0 to
0.0877%. P. neriifolius has the lowest hemicellulose content yet its sugar-released was only 26.6 mg per 100 mg xylem.
This result showed that lower level of hemicellulose can not ensure that higher sugar released could be obtained.
Although xyloglucanase activity improved the total hydrolysis of lignocelluloses (Benko, 2008), there was no correlation
between ethanol production and xyloglucan content. Lignin is known to be a recalcitrant compound in celullose hydrolysis
(Chen and Dixon, 2007). The data shown the correlation between the high yield of enzymatic saccharification and the low
lignin content, but this condition was not a must. T. sureni has the lowest lignin content (23.2%) but its sugar-released
was only 23.0 mg per 100 mg xylem. Therefore, the yield of enzymatic saccharification was also not directly related to
lignin content.
A study on the relationship between chemical components of wood and their sugar released for ethanol
production has been reported by Dwianto et al. (2011). The content of cellulose in wood was not exactly related to its
sugar released. This trend was also occurred for the relationship between hemicellulose and sugar released. However,
lignin content in woods gave an expected trend where the less lignin content, the higher the sugar released. The
complexity of wood structure and high lignin content were estimated to be the major cause that inhibits contact between
cellulose and the enzyme in sacharification process. It might occur that even though the wood has high level of cellulose,
the composition of its other chemical components such as hemicellulose and lignin may act as inhibitors in the
conversion of its cellulose into reducing sugar that will be further converted into ethanol.
Conclusion
Both saccharification and fermentation occurred at the greatest rate in G. sumatranum xylem. The authors
have concluded that G. Sumatranum, A. microsperma, and C. junghuhhniana were suitable tree species for bioethanol
production in Cibodas Botanical Garden. G. Sumatranum, A. microsperma, and C. junghuhhniana xylem’s levels of
saccharification and ethanol production were higher than those of poplar xylem.
The tree species for bioethanol production from Purwodadi Botanical Garden are F. malayana and P. indicus
as their yields from saccharification and ethanol production were higher than those from sengon xylem.
Saccharification of xylem occurred at the greatest rate in A. scholaris while the highest fermentation yield was
obtained from the xylem of F. rukam. The best tree species for bioethanol production from Bali Botanical Garden were A.
scholaris, F. rukam, S. rarak and F. padana as their yields from saccharification and ethanol production were close to
those from sengon xylem. Genetic improvements would be expected to transform these species into more hydrolysable
wood for cellulase preparation.
References
Benko Z, Siika-Aho M, Viisa V, Reczey K. 2008. Evaluation of the Role of Xyloglucanase in the Enzymatic Hydrolysis of
Lignocellulosic Substrates. Enzeme. Microb Technol. 43: 109-114.
Chiang VL, Funaoka M. 1990. The Dissolution and Condensation Reactions of Guaiacyl and Syringyl Units in Residual
Lignin during Kraft Delignification of Sweetgum. Holzforschung 44(2): 147-155.
Chen F, Dixon RA. 2007. Lignin Modification Improves Fermentable Sugar Yield for Biofuel Production. Nature
Biotechnology 25(7): 759-761.

BIOENERGY AND FOREST PRODUCT CHEMISTRY PROCEEDING OF THE FIFTH INTERNATIONAL SYMPOSIUM OF INDONESIAN WOOD RESEARCH SOCIETY
59
Dwianto W, Fitria, Wahyuni I, Adi DS, Hartati S, Kaida R, Hayashi T. Relationships between Chemical Components of
Wood and Its Sugar Released. Proceeding of the International Conference on Sustainable Future for Human
Security (SUSTAIN 2011), Kyoto University, Kyoto, Japan, October 8-10, 2011, 449-452.
Dubois M, Gilles KA, Hamilton JK, Rebers PA, Smith. F. 1956. Colorimetric Method for Determination of Sugars and
Related Substances. Anal. Chem. 28: 350-356.
Hayashi T. Case Study on Bioethanol Production in Riau. Presented at the Third Humanosphere Science School,
Pekanbaru, Indonesia, 2009.
Hayashi T. 1989. Measuring β-glucan Deposition in Plant Cell Walls. In: Linskens HF, Jackson JF, editors. Modern
Methods of Plant Analysis: Plant Fibers. Berlin: Springer-Verlag Berlin, pp. 138-160.
Kaida R, Kaku T, Baba K, Oyadomari M, Watanabe T, Hartati S, Sudarmonowati E, Hayashi T. 2009a. Enzymatic
Saccharification and Ethanol Production of Acacia mangium and Paraserianthes falcataria Wood, and Elaesis
guineensis Trunk. J. Wood Sci. 55: 381-386.
Kaida R, Kaku T, Baba K, Oyadomari M, Watanabe T, Nishida K, Kanaya T, Shani Z, Shoseyov O, Hayashi T. 2009b.
Loosening Xyloglucan Accelerates the Enzymatic Degradation of Cellulose in Wood. Molecular Plant 2(5): 904-
909.
Somogyi M. 1952. Notes on Sugar Determination. J. Biol. Chem. 195: 19-23.
Updegraff DM. 1969. Semimicro Determination of Cellulose in Biological Materials. Anal. Chem. 32: 420-424
Watanabe T. Biomass Conversion. Presented at the First Humanosphere Science School, Cibinong, Indonesia, 2008.

BIOENERGY AND FOREST PRODUCT CHEMISTRY PROCEEDING OF THE FIFTH INTERNATIONAL SYMPOSIUM OF INDONESIAN WOOD RESEARCH SOCIETY
60
A REVIEW: SCREENING OF POTENCY AKAR KUNING STEM (FIBRAUREA TINCTORIA LOUR) AS ANTIMALARIAL COMBINATION THERAPY
Ika Fikriah, Puspa Lestari
Faculty of Medicine Mulawarman University, Samarinda – East Kalimantan Email: [email protected]
ABSTRACT
Malaria is one of the indicators development target of Millenium Development Goals (MDGs), and still a health problem in many countries around the world. Data 2010 showed 80% malaria mortality occur in 14 countries. In Indonesia, 80% are endemic malaria and 45% of the population living in endemic areas. Many factors to cause malaria eradication failure, such as discovered a new species of malaria parasites, that is P. knowlesi and development of Plasmodium resistant to antimalarial drugs. In order to prevent resistance, the rational antimalarial combination therapy is highly recommended and a discovery of a new antimalarial drug is strongly needed. Now, antimalarial combinations are Artemeter-Lumefantrin, Artesunate+Amodiaquine, Artesunate+Mefloquine, Artesunate+ Sulfadoxine-Pyrimethamine. Studies of new combination of antimalarial from traditional plant become a challange for researcher. On several studies reported that Pasak Bumi root (Eurycoma longifolia Jack) contain quassinoid that responsible for antimalarial activity. Quassinoid active substance in Pasak Bumi root are eurycomanine, eurycomanone, dan eurycomalactone. Eurycomalactone inhibit protein synthesize, that avoid the development stage of Plasmodium in merozoites to tropozoit thereby inhibiting parasitemia. Pasak bumi root extract 60mg/kg combine with artemisin 1,7 mg/kg decrease parasitemia 80%. Furthermore, studies of Akar Kuning stem (Fibrauerea tinctoria Lour) reported that it has secondary metabolites; alkaloid and terpenoid/steroid. Alkaloid known to inhibit parasite growth through intraseluler colin transport, whereas terpenoid inhibit protein synthesize. This review article aims to determine Akar Kuning stem potency as antimalarial combination therapy. The combination artemisinin and alkaloid and terpenoid/steroid in Akar Kuning Stem will be a potent antimalarial combination therapy that expected decrease parasitemia > 80%. Keywords: Antimalarial, Akar Kuning Stem (Fibrauerea tinctoria Lour), Alkaloid, Terpenoid, Screening.
INTRODUCTION
Malaria is a major global public health problem and is responsible for death of over 1 million people annually,
with more than 90% of cases found in sub-Saharan Africa (Poupli et al, 2007). Four species of malaria parasite cause
disease in humans (Plasmodium falciparum, P. vivax, P. malariae and P. ovale) but P. falciparum causes most problems
as a result of its prevalence, virulence and drug resistance. The pathogenicity of this parasite is thought to result from its
rapid rate of asexual reproduction in the host and its ability to sequester in small blood vessels (Winstanley, 2000;
Sharma, 2012). Most cases of endemic P. falciparum malaria remain uncomplicated, however some develop a number of
severe complications including cerebral malaria, severe anemia and plancental malaria (Rasti et al, 2004). The
increasing resistance of malaria parasites to available antimalarial drugs represents a major impediment for disease
treatment and control (Bedolla et al, 2013).
The current WHO drug policy allows change of antimalarial drug if 15% of the population shows in vivo
resistance to it. Resistance to antimalarial drugs has beeen a particular problem with P. falciparum in which widespread
resistance to chloroquine, sulphadoxine-pyrimethamine and mefloquine has been observed (Srikanth et al, 2012).
History shows that plants have been an important source of medicines againts malaria with two of the major
drugs used in malaria treatment, quinine and more recently artemisinin both having derived from traditional medicine and
from plants. These two drugs are now the mainstay of the treatment of severe malaria worldwide and the artemisinin
derivatives in combination with a second antimalarial drug now at the heart of the World Health Organization strategy to
control malaria globally. Traditional medicines are a potential rich source of new drugs againts malaria and other
infectious disease and given the remarkable contribution this has made to the development of potent antimalarial drugs
over the last five hundred years it is clearly an approach that must be continued (Pouplin et al, 2007).Akar Kuning stem
(Fibrauerea tinctoria Lour) reported that it has secondary metabolites; alkaloid and terpenoid/steroid. Alkaloid known to
inhibit parasite growth through intraseluler colin transport, whereas terpenoid inhibit protein synthesize.

BIOENERGY AND FOREST PRODUCT CHEMISTRY PROCEEDING OF THE FIFTH INTERNATIONAL SYMPOSIUM OF INDONESIAN WOOD RESEARCH SOCIETY
61
Antimalarial Resistance
The development of resistance by the parasite againts first line and second line antimalarial drugs has under scored the
importance to develop new drug targets and pharmacophores to treat the disease. With the availability of increased
support for malaria research, a variety of drug targets and candidate moleculs are now available for further development
(Padmanaban et al, 2007).
Approach to Antimalarial Chemotherapy
Approaches to antimalarial drug discovery and development such as optimization of therapy with existing agents,
develop analogs of existing agents, natural products, compounds active againts other diseases, drug resistance
reversers, and compound active againts new targets (Rosenthal, 2003).
Optimization of therapy with existing agents
A first approach is to optimize therapy with existing agents. New dosing regimens or formulations may optimize activity.
Combination therapies, including newer agents (e.g. artemisinin derivatives, atovaquone) and new combinations of old
agents (e.g. amodiaquine/sulfadoxine/pyrimethamine, chlorproguanil/dapsone), are under study as first-linne therapies
for Africa and other areas with widespread drug resistance. The use of combination antimalarial therapy offers two
important potential advantages. First, the combination should improve antimalarial efficacy, providing additive or
synergistic antiparasitic activity. Second, and most important , the use of combination therapy should slow the
progression of parasite resistance to the new agents.
Development of analogs of existing agents
Another approach to antimalarial chemotherapy is to improve upon existing antimalarials by chemical modification of
these compounds. This approach does not require knowledge of the mechanism of action or the biological target of the
parent compound.
Natural products
Plant-derived compounds offer a third approach to chemotherapy. Importantly, this approach can benefit from knowledge
of medicinal plants among natives of malarious regions, where the appreciation of the use of plant products to treat
febrile illnesses has grown over many generations. Natural products are the sources of the two most important drugs
currently available to treat severe falciparum malaria, quinine and derivatives of artemisinin. Extensive evaluations of
natural products as potential new therapies for many human diseases are underway. It is important that such trials
include the evaluation of the antimalarial activity of plant extracts and potential drugs purified from these extracts. As with
both the quinolines and artemisinins, it is likely that antimalarial naturalnatural products will be the parent compounds for
the semi-synthetic or fully synthetic production of new drug.
Compounds active againts other diseases
A fourth approach to antimalarial chemotherapy is to identify agents that are developed as treatments for other diseases.
These compounds might act againts orthologs of their targets in other systems or by different mechanism againts malaria
parasites.
Drug resistance reversers
Many drugs have been shown to reverse the resistance of P. falciparum to chloroquine in vitro, most notably the
antihypertensive verapamil and the antidepressant desipramine.
Compounds active againts new target
The most innovative approach to chemotherapy is the identification of new targets and subsequent discovery of
compounds that act on these targets. New targets for antimalarial therapy will be considered based on their lovations
within the malaria parasites. The target location such as cytosol, parasite membrane, food vacuole, mitochondrion, and
apicoplast.

BIOENERGY AND FOREST PRODUCT CHEMISTRY PROCEEDING OF THE FIFTH INTERNATIONAL SYMPOSIUM OF INDONESIAN WOOD RESEARCH SOCIETY
62
Akar Kuning Stem (Fibraurea tinctoria Lour)
Taxonomy
Picture 1. Fibraurea tinctoriaStem
Phytochemical Screening
FibraureatinctoriaLourstem numerous inEast Kalimantan, local people call itas―Akar Kuning‖.
Researchinethnobotany, thestem of the plantis usedtocurejaundice(Ilona, 2003;Kulip, 1997).Phytochemicalscreening
studiesonethanolextract ofFibraureatinctoriastem secondarymetabolitesareof alkaloids, flavonoids,
polyphenolsandterpenoids/steroidcapabledampenincreasedin
vitrolipidperoxidationstrongerthantocopherolacetatethroughthe ironthiocyanatetestandtiobarbiturat. Acuteoraltoxicity
testwith asingledose ofup to2g/ kginmale and femalemicewithlongobservationfor oneweekdid not showthe
deathandcytotoxictestsonArtemia salinalarvaehaveLD50values>1000 ppm(Fikriah, 2006).
Four of the secondary metabolites is only terpenoids / steroid that can not reduce DPPH radicals were sprayed
on the TLC. This means that secondary metabolite alkaloids, flavonoids and polyphenols have antioxidant activity. Rf
value secondary metabolites that have antioxidant activity can be seen in Table 1. Research on plant extracts or
secondary metabolites with antioxidant activity in vitro by DPPH radical reduction test, if known to have activity DPPH
radical reduction can also hepatoprotective effects in vivo.
Table 1. Identification ofSecondaryMetabolitesandRfvalueonTLC (Fikriah, 2006)
No. Secondary Metabolite Rf Value DPPH Positive
1 Alkaloid 0.08; 0.30 0.08; 0.30
2 Flavonoid 0.17; 0.20; 0.23; 0.39; 0.48; 0.51;
0.59; 0.70; 0.74; 0.88
0.39; 0.51
3 Polyphenol 0.04 0.04
4 Triterpenoid/Steroid 0.31;0.77 -
DISCUSSION
Fibraureatinctoriastem secondarymetabolitesareof alkaloids, flavonoids, polyphenolsandterpenoids/steroid.
Alkaloid known to inhibit parasite growth through intracelular choline transport, whereas terpenoid inhibit protein
synthesis.Alkaloids, flavonoids and polyphenols have antioxidant activity (Hayati, 2012).
In the search for new antimalarial agents, parasite transporters are of great interest as drug targets and as
potential selective drug delivery routes in blood-stage parasite. Parasite is known to take up choline from external
medium for the novo synthesis of phosphatidylcholine (PC). Cholinephosphate cytidylyltransferase is a regulatory step in
this pathway, and choline transport (which regulate the supply of precursor) is a rate-limiting step. Phospholipid
metabolism is an ideal target for new chemotherapy because of its vital importance to the parasite. Phospholipid
metabolism is absent from normal mature human erythrocytes, but after malarial infection, the erythrocyte phospholipid
content increases by as much as 500%. PC and phosphatidylethanolamine (PE) are the major phospolipids of of the
Kingdom Plantae
Subkingdom Tracheobionta
Superdivision Spermatophyta
Division Magnoliophyta
Class Magnoliopsida
Subclass Magnoliidae
Order Ranunculales
Family Menispermaceae
Genus Fibraurea Lour
Species Fibraurea tinctoria

BIOENERGY AND FOREST PRODUCT CHEMISTRY PROCEEDING OF THE FIFTH INTERNATIONAL SYMPOSIUM OF INDONESIAN WOOD RESEARCH SOCIETY
63
infected erythrocyte. Alkaloid activity to inhibit parasite growth through intracelular choline transport shows great promise
for the selective targeting of new agents for chemotherapy of malaria (Biagini et al, 2004; Mamoun et al, 2009).
Malarial parasites obtain the amino acids necessary for protein biosynthesis in three ways such as biosynthesis
of amino acids from carbon sources, uptake of preformed free amino acids present in the plasma or host cells, and
proteolysis of hemoglobin with the release of amino acids. Nucleic metabolism involving the three major targets: purine
metabolism, pyrimidine metabolism and folat metabolism. Protein that mediate the uptake, intracellular trafficking and
metabolism of essential nutrient in the Plamosium infected erythrocyte have been reported as potential antimalarial drug
targets (Na-Bangchang, 2009).Terpenoid inhibition activity to protein synthesis might be a viable compound for the
development of vovel antimalarial drugs.
An alternative drug design strategy could be based on the sensitivity of Plasmodium sp to oxidative stress.
Malaria parasites (Plasmodium sp) are exposed to oxidative stress as a result of their metabolic processes and their
hosts responses to infection, both in vertebrate hosts and vector mosquitoes. Host erythrocyte hemoglobin digestion and
heme production within food vacuoles and the synthesis and folding of proteins within the endoplasmic reticulum, as well
as the produstion of the needed energy in the mitochondria are the main sources of oxidative stress. Reactive oxygen
species (ROS) and reactive nitrogen species (RNS) are produced in all cells and play important roles in cell physiology,
such as life cycle regulation, development, migration, induction of signalling pathways, activation of second messangers,
and triggering of antioxidant responses. Reactive species are common products of metabolic enzymatic reactions of
cells. Their accumulation is prevented by the production of antioxidant molecules, which maintain the inner cellular
environment in a homeostatic (redox balance). The loss of the redox balance, either by an increase of oxidant molecules
(ROS and RNS) or by decreased antioxidant system activities, causes a state of oxidative stress.The search for new
molecules of the parasite, but that do not affect the host, offers opportunities for a renovated antimalarial (Bedolla et al,
2013).
Antimalarial drug discovery approaches currently being deployed largely include optimization of therapy with
available drugs including combination therapy.On several studies reported that Pasak Bumi root (Eurycoma longifolia
Jack) contain quassinoid that responsible for antimalarial activity. Quassinoid active substance in Pasak Bumi root are
eurycomanine, eurycomanone, dan eurycomalactone. Eurycomalactone inhibit protein synthesize, that avoid the
development stage of Plasmodium in merozoites to tropozoit thereby inhibiting parasitemia. Pasak bumi root extract
60mg/kg combine with artemisin 1,7 mg/kg decrease parasitemia 80%. Furthermore, studies of Akar Kuning stem
(Fibraurea tinctoria Lour) reported that it has secondary metabolites; alkaloid and terpenoid/steroid. Alkaloid known to
inhibit parasite growth through intraseluler colin transport, whereas terpenoid inhibit protein synthesis.Alkaloids,
flavonoids and polyphenols have antioxidant activity. This review article aims to determine Akar Kuning stem potency as
antimalarial combination therapy. The combination artemisinin and alkaloid, terpenoid/steroid, flavonoid, and polyphenols
in Akar Kuning Stem will be a potent antimalarial combination therapy that expected decrease parasitemia > 80%.
CONCLUSION
Fibraureatinctoriastem secondarymetabolitesareof alkaloids, flavonoids, polyphenolsandterpenoids/steroid. Alkaloid
known to inhibit parasite growth through intracelular choline transport, whereas terpenoid inhibit protein synthesis.
Alkaloids, flavonoids and polyphenols have antioxidant activity. These are shows great promise for the selective targeting
of new agents for chemotherapy of malaria Antimalarial drug discovery approaches currently being deployed largely
include optimization of therapy with available drugs including combination therapy.The combination artemisinin and
alkaloid, terpenoid/steroid, flavonoid, and polyphenols in Akar Kuning Stem will be a potent antimalarial combination
therapy that expected decrease parasitemia > 80%.
REFERENCES
Bedolla JD, Mario HR, Vianey SN, Selva RA, Marco C, Maria CR. 2013. Oxidative Stress: Production in Several
Processes and Organelles during Plasmodium sp Development. Oxid Antioxid Med Sci 2 (2): 93 – 100.
Biagini GA, Erica MP, Ruth H, Harry PDK, Henri JV, Paul MO, Stephen AW, Patrick GB. 2004. Characterization of the
Choline Carrier of Plasmodium falciparum: A Route for the Selective Delivery of Novel Antimalarial Drugs. Blood
journal 104: 3372 – 3377.
Fikriah I. 2006. Prospek pengembangan tumbuhan asli Kaltim (akar kuning) sebagai antioksidan. Majalah Kedokteran
Universitas Mulawarman. 1(2):50-6.
BIOENERGY AND FOREST PRODUCT CHEMISTRY PROCEEDING OF THE FIFTH INTERNATIONAL SYMPOSIUM OF INDONESIAN WOOD RESEARCH SOCIETY
64
Hayati EK, Akyunul J, Rachmawati N. 2012. Identifikasi Senyawa dan Aktivitas Antimalaria in Vivo Ekstrak Etil Asetat
Tanaman Anting-anting (Acalypha indica L.). Molekul 7 (1): 20 – 32.
Ilona M. 2003. Analisis, identifikasi dan karakteristik tumbuhan obat di hutan pendidikan Hampangen Universitas
Palangkaraya Kalimantan Tengah. Tesis. Program Pascasarjana Universitas Mulawarman.
Kulip J. 1997. A preliminary survey of traditional medicinal plants in the west coast and interior of Sabah. Tropic Forest
Sci. 10(2):271 – 274.
Mamoun CB, Prigge ST, Henri V. 2010. Targetting the Lipid Metabolic Pathways for the Treatment of Malaria. Drug
Development Research 71: 44 – 55.
Na-Bangchang K, Juntra K. 2009. Current Status of Malaria Chemotherapy and the Role of Pharmacology in Antimalarial
Drug Reasearch and Development. Fundamental & Clinical Pharmacology (23): 387 – 409.
Padmanaban G, V. Arun N, Pundi NR. 2007. Drugs and Drug Targets Againts Malaria. Current Science Vol. 92 (11):
1545 – 1555.
Pouplin JN, Hop T, Hung T, Tuyet AP, Christiane D, Jeremy F, Tinh HT, Philippe C, Bernard B, Philippe G. 2007.
Antimalarial and Cytotoxic Activities of Ethnopharmacologically Selected Medicinal Plants from South Vietnam.
Journal of Ethnopharmacology (109): 417 – 427.
Rasti N, Mats W, Qijun C. 2004. Molecular aspects of Malaria Pathogenesis. FEMS Immunology and Medical
Microbiology (41): 9 – 26.
Rosenthal PJ. 2003. Antimalarial Drug Discovery: Old and New Approaches. The Journal of Experimental Biology 206:
3735 – 3744.
Sharma S dan Jarori GK. 2012. Translation and Post-translational Modification in Plasmodium. Current Science 102 (5):
741 – 748. FEMS Microbiol Rev 30: 596 – 630.
Srikanth BA, Ali NMAA, Babu SC. 2012. Chloroquine – Resistance Malaria. Journal of Advanced Scientific Research 3
(3): 11 – 14.
Winstanley PA. 2000. Chemotherapy for FalciparumMalaria: The Armoury, the Problems and the Prospects. Parasitology
Today 16 (4): 146 – 153.

BIOENERGY AND FOREST PRODUCT CHEMISTRY PROCEEDING OF THE FIFTH INTERNATIONAL SYMPOSIUM OF INDONESIAN WOOD RESEARCH SOCIETY
65
INSECTICIDAL ACTIVITY OF Melaleuca leucadendron OIL AGAINST
GREENHOUSE WHITEFLY Trialeurodes vaporariorum
RINI Pujiarti *1, Yoshito OHTANI*2, Hideaki ICHIURA*2, Yasuyo NISHIMURA*3
*1Department of Forest Product Technology, Faculty of Forestry, Gadjah Mada University, Jl. Agro
No.1, Bulaksumur, Yogyakarta, 5528,1 Indonesia. Email: [email protected]
*2Department of Forest Science, Faculty of Agriculture, Kochi University,B-200 Monobe, Nankoku,
Kochi, 783-8502, Japan. Email: [email protected]
*3Department of Subtropical Agriculture, Faculty of Agriculture, Kochi University,B-200 Monobe,
Nankoku, Kochi, 783-8502, Japan. Email: [email protected]
Abstract
The greenhouse whitefly, Trialeurodes vaporariorum, is increasing pest problem on horticultural crops such as
tomato, melon, strawberry, raspberry, pepper, cucumber, lettuce, citrus, bean and cotton. During the last decades, a
worldwide spread of the pest insects T. vaporariorum has led to local devastation of vegetable and ornamental crops,
resulting in large economic losses. T. vaporariorum dwells on the undersurface of plant foliage, not easily reached by
conventional spraying equipment. These problems have highlighted the need for the development of selective T.
vaporariorum control alternatives with fumigant action in greenhouses. Plant essential oil can be used as an alternative
source for T. vaporariorum control. M. leucadendron is one of the essential oil suppliers including in Myrtaceae family,
this oil has chemical and biological properties due to its components. In this study, insecticidal activity of M.
leucadendron and their main components has been elucidated. Samples of M. leucadendron leaf were collected from
Gundih, Central Java, Indonesia. Oil samples were obtained by water-steam distillation from fresh leaves of M.
leucadendron. This essential oil and it major compounds were used in this study. Fumigant assay was used in this study
to against whitefly of T. vaporariorum. The result showed that M. leucadendron oil has potency to be used as pesticide
against greenhouse whitefly T. vaporariorum. LC50 of treated whitefly was evaluated after 30 min. exposure time
indicated that M. leucadendron oil (15.28 µl/l), 1,8-cineole (11.52 µl/l), α-terpineol (0.56 µl/l), d-limonene (48.48 µl/l) and
β-caryophyllene (123.36 µl/l) exhibited fumigant toxicity against T. vaporariorum. In this study, the effectiveness of M.
leucadendron oil as insect control fumigant is likely influenced by main compounds of this oil such as 1,8-cineole and α-
terpineol.
Keywords: Melaleuca leucadendron, essential oil, insecticidal, Trialeurodes vaporariorum
Introduction
Trialeurodes vaporariorum westwood, knowns as greenhouse whitefly, is a cosmopolitan pest originating from
China. This insect is an extremely polyphagous pest. It is a primary insect pest of many fruit, vegetable and ornamental
crops, frequently being found in greenhouse and other protected horticultural environments. It was registered for the first
time as a pest in 1870, in greenhouse in the USA. Later it became the main pest of greenhouse in the world. In Japan
whitefly was registered for the first time in 1977 (Choi et al., 2003; Zabel et al., 2001). This insect is now well established
in the greenhouse ecosystem and is an economically important pest of various greenhouse vegetables. It is a major pest
of tomato pepper, cucumber, bean, string beans, lettuce, tobacco, watermelon, melon, begonia, and many other
ornamental crops.
This pest is commonly controlled by synthetic insecticides. Insect pest management is nowadays a worldwide
ecological challenge mainly due to environmental pollution caused by extensive use of synthetic chemical pesticides. The
use of pesticides has some detrimental consequences on environment, such as groundwater pollution, soil erosion,
excessive water use, and the development of weeds and diseases resistant to chemical control (Boulogne et al., 2012;
Lichtfouse et al., 2009). It also has negative impact on health with human poisonings and their related illnesses. The
increase of the risk of developing insect resistance and the high cost–benefit ratio of synthetic pesticides pushed
research towards investigating alternative insecticides. Thus, there is a need to develop less hazardous alternatives to
synthetic pesticides. Plant extracts have long been a subject of research in an effort to develop alternatives to
conventional insecticides causing minimal effects on the environment and non-target organisms. Plant essential oils have

BIOENERGY AND FOREST PRODUCT CHEMISTRY PROCEEDING OF THE FIFTH INTERNATIONAL SYMPOSIUM OF INDONESIAN WOOD RESEARCH SOCIETY
66
been suggested as alternative sources for insect control products because some are selective, biodegrade to nontoxic
products, and have few effects on non target organisms and the environment (Isman, 2000; Mohamed et al., 2010).
However, there have been no attempts to study the toxicity of M. leucadendron oil on economically important
greenhouses pests. Greenhouses, like storehouses and beehives, are closed spaces where essential oil flavors can be
applied as fumigants. The aim of this study was to evaluate the fumigant potential of M. leucadendron oil and its major
compounds to control greenhouse pest of whitefly T. vaporariorum.
Materials and Methods
Essential oil and Chemicals
M. leucadendron leaf oil from Gundih, Central Java, Indonesia and its major compounds (commercial compounds)
were used in this study. Major compounds used in this study are commercial chemicals of 1,8-cineole purchased from
Wako Pure Chemical Industries Ltd (Osaka, Japan), β-caryophyllene was purchased from Tokyo Kasei (Tokyo, Japan),
α-terpineol and d-limonene purchased from Nacalai Tesque, Inc (Kyoto, Japan).
Biological Material
The adults of whitefly T. vaporariorum were collected from tomato greenhouse in Vegetable Crops Science
Laboratory, Faculty of Agriculture, Kochi University, Japan. Whiteflies were collected from tomato greenhouse under
temperature condition 38 ± 1ºC.
Fumigant Assay
The square (2 cm x 2 cm) of filter paper (Whatman No. 1) was attached to a 125 ml glass bottle. Filter papers were
impregnated with M. leucadendron oil and 4 major compounds of its oil (1,8-cineole, α-terpineol, d-limonene, and β-
caryophyllene) in different oil concentrations. Concentrations were converted to give equivalent fumigant concentrations
µl/125 ml air (concentration x 8 µl/l air). Ten adults of whiteflies from fresh tomato leaves were placed in glass bottle by
taking from tomato leaves using vacuum suction and were sealed with Parafilm. Three replicates of each concentration
and control (without oil) were carried out. Mortality was recorded every 30 minutes for 6 hour. The whiteflies were
considered dead if they were not fly and move.
Statistical Analysis
Percentages of mortality were calculated using Abbott’s correction formula (Abbott, 1925). Lethal concentrations of
50% (LC50) of treated whitefly in 30 minute (0.5 hour) exposure time were estimated using Probit analysis (Finney, 1971)
by SPSS statistical program.
Results and Discussion
The insecticidal activity of M. leucadendron oil, 1,8-cineole, α-terpineol, d-limonene, and β-caryophyllene against
whitefly T. vaporariorum were summarized in Table 1 and Figure 1. The results showed that all samples have toxic effect
on T. vaporariorum. In general, higher mortality was observed as the concentrations of essential oils and exposure time
increased.
The mortality rates of T. vaporariorum adult with treatment of M. leucadendron oil in 6 hour in many concentrations
obtained 100%. In concentration 3.2 µl/l , 4.8 µl/l , 6.4 µl/l , 8.0 µl/l , and 16.0 µl/l all the adults (100%) died at exposure
time 6h, 4h, 3h, 2h, 1,5 h and 1,5 h, respectively. For α-terpineol, in the lowest concentration of 1.2 µl/l, all whiteflies
adult (100%) were dead at exposure time less than 0.5 h (< 30 min.). The 100% adult whiteflies mortality in exposure
time 1 h for 1,8 cineole and d-limonene were obtained at concentration 16 µl/l and 48 µl/l, respectively. The β-
caryophyllene showed the lowest effect as fumigant with 100 % adult whiteflies mortality in exposure time 2,5 h at
concentration 128 µl/l. Compared with α-terpineol this essential oil has less toxin, compared with 1,8-cineole has similar
fumigant activity, and compared with d-limonene and β-caryophyllene, M. leucadendron oil has higher fumigant activity.
The results show, the highest effect was obtained from α-terpineol, followed by 1,8-cineole, M. leucadendron oil, d-
limonene, and β-caryophyllene, respectively.

BIOENERGY AND FOREST PRODUCT CHEMISTRY PROCEEDING OF THE FIFTH INTERNATIONAL SYMPOSIUM OF INDONESIAN WOOD RESEARCH SOCIETY
67
M. leucadendron leaf oil
1,8- cineole
α- terpineol
d-limonene
β-caryophyllene
Figure 1. Percent mortality of whitefly T. vaporariorum (concentration in µl/l air).
Two major compounds of α-terpineol and 1,8-cineole in this study were very effective as fumigant, The effect of M.
leucadendron oil as fumiagant is probably due to the synergic effect of these two major compounds. Previous study also
showed that 1,8-cineole and α-terpineol have insecticidal activities (Enan et al., 2001; Prates, 1998; Sfara, 2009).
Lethal concentrations of 50% (LC50) of treated whitefly were evaluated after 0.5h (30 min.) exposure time. The LC50
values are shown in Table 2 and Figure 2. Results indicated that M. leucadendron oil and its major compounds exhibited
fumigant toxicity against T. vaporariorum. Comparison of LC50 shows that α-terpineol (0.56 µl/l) and 1,8-cineole (11.52
µl/l) are relatively more toxic against T. vaporariorum than M. leucadendron oil. However, LC50 of M. leucadendron oil
(15.28 µl/l) is more toxic than d-limonene (48.48 µl/l) and β-caryophyllene (123.36 µl/l).
0
10
20
30
40
50
60
70
80
90
100
0.5 1 1.5 2 2.5 3 3.5 4 4.5 5 5.5 6
Time (h)
Mo
rta
lity
(%
)
Contro l
3.2
4.8
6.4
8.0
16.0
17.6
010
2030
405060
7080
90100
0.5 1 1.5 2 2.5 3 3.5 4 4.5 5 5.5 6
Time (h)
Mo
rta
lity
(%
)
Cont rol
8.0
9.6
12.8
16.0
0
10
20
30
40
50
60
70
80
90
100
0.5 1 1.5 2 2.5 3 3.5 4 4.5 5 5.5 6
Time (h)
Mo
rta
lity
(%
)Cont rol
16.00
32.00
48.00
80.00
0
10
20
30
40
50
60
70
80
90
100
0.5 1 1.5 2 2.5 3 3.5 4 4.5 5 5.5 6
Time (h)
Mo
rta
lity
(%
)
Cont rol
32.0
64.0
80.0
128.0
0
10
20
30
40
50
60
70
80
90
100
0.5 1 1.5 2 2.5 3 3.5 4 4.5 5 5.5 6
Time (h)
Mo
rta
lity
(%
)
Control
0.16
0.40
0.80
1.20

BIOENERGY AND FOREST PRODUCT CHEMISTRY PROCEEDING OF THE FIFTH INTERNATIONAL SYMPOSIUM OF INDONESIAN WOOD RESEARCH SOCIETY
68
Table 1. Percent mortality of whitefly T. vaporariorum in 6 h exposure time
Sample Conc.
(µl/l
air)
Mean value of mortality (%)
0.5 h (30 min) 1 h 1.5 h 2 h 2.5 h 3 h 3.5 h 4 h 4.5 h 5 h 5.5 h 6 h
Control - 0.00 ± 0.00 0.00 ± 0.00 0.00 ± 0.00 0.00 ± 0.00 0.00 ± 0.00 0.00 ± 0.00 0.00 ± 0.00 0.00 ± 0.00 0.00 ± 0.00 0.00 ± 0.00 0.00 ± 0.00 0.00 ± 0.00
M. leucadendron oil 3.2 0.00 ± 0.00 0.00 ± 0.00 13.33 ± 11.55 20.00 ± 10.00 33.33 ± 15.28 50.00 ± 17.35 60.00 ± 17.32 76.67 ± 15.28 86.67 ± 15.28 86.67 ± 15.28 96.67 ± 5.77 100.00 ± 0.00
4.8 6.67 ± 5.77 16.67 ± 5.77 30.00 ± 10.00 36.67 ± 5.77 70.00 ± 10.00 76.67 ± 5.77 90.00 ± 0.00 100.00 ± 0.00
6.4 13.33 ± 5.77 30.00 ± 17.32 43.33 ± 15.28 73.33 ± 11.55 80.00 ± 10.00 100.00 ± 0.00
8.0 33.33 ± 5.77 66.67 ± 11.55 86.67 ± 11.55 100.00 ± 0.00
16.0 50.00 ± 8.16 80.00 ± 8.16 100.00 ± 0.00
17.6 76.67 ± 5.77 96.67 ± 5.77 100.00 ± 0.00
1,8-cineole 8.0 0.00 ± 0.00 3.33 ± 5.77 3.33 ± 5.77 3.33 ± 5.77 6.67 ± 11.55 13.33 ± 15.28 16.67 ± 11.55 26.67 ± 20.82 50.00 ± 17.32 60.00 ± 20.00 76.67 ± 5.77 90.00 ± 10.00
9.6 13.33 ± 11.55 33.33 ± 23.09 56.67 ± 11.55 70.00 ± 10.00 73.33 ± 5.77 80.00 ± 10.00 90.00 ± 10.00 93.33 ±11.55 100.00 ± 0.00
12.8 73.33 ± 5.77 80.00 ± 0.00 100.00 ± 0.00
16.0 90.00 ± 10.00 100.00 ± 0.00
α-terpineol 0.16 16.67 ± 5.77 76.67 ± 5.77 100.00 ± 0.00
0.40 20.00 ± 0.00 86.67 ± 5.77 100.00 ± 0.00
0.80 73.33 ± 11.56 100.00 ± 0.00
1.20 100.00 ± 0.00
d-limonene 16 0.00 ± 0.00 0.00 ± 0.00 6.67 ± 5.77 6.67 ± 5.77 6.67 ± 5.77 13.33 ± 5.77 23.33 ± 5.77 43.33 ± 5.77 56.67 ± 11.55 70.00 ± 10.00 83.33 ± 5.77 83.33 ± 5.77
32 13.33 ± 5.77 40.00 ± 10.00 40.00 ± 10.00 43.33 ± 5.77 46.67 ± 5.77 53.33 ± 5.77 53.33 ± 5.77 53.33 ± 5.77 66.67 ± 11.55 83.33 ± 5.77 86.67 ± 5.77 96.67 ± 5.77
48 50.00 ± 10.00 100.00 ± 0.00
80 93.33 ± 5.77 100.00 ± 0.00
β-caryophyllene 32 0.00 ± 0.00 16.67 ± 5.77 20.00 ± 10.00 20.00 ± 10.00 23.33 ± 11.55 26.67 ± 15.28 30.00 ± 10.00 43.33 ± 5.77 50.00 ± 0.00 63.33 ± 5.77 73.33 ± 15.28 80.00 ± 20.00
64 13.33 ± 5.77 23.33 ± 5.77 30.00 ± 10.00 40.00 ± 10.00 43.33 ± 11.55 50.00 ± 10.00 56.67 ± 15.28 56.67 ± 15.28 60.00 ± 17.32 66.67 ± 5.77 80.00 ± 10.00 90.00 ± 17.32
80 40.00 ± 10.00 53.33 ± 11.55 66.67 ± 15.28 73.33 ± 11.55 76.67 ± 15.28 83.33 ± 11.55 93.33 ± 11.55 96.67 ± 5.77 100.00 ± 0.00
128 56.67 ± 5.77 70.00 ± 10.00 80.00 ± 10.00 86.67 ± 5.77 100.00 ± 0.00

BIOENERGY AND FOREST PRODUCT CHEMISTRY PROCEEDING OF THE FIFTH INTERNATIONAL SYMPOSIUM OF INDONESIAN WOOD RESEARCH SOCIETY
69
Table 2. LC50 of whitefly T. vaporariorum in 30 minutes (0.5 h) exposure time.
Sample LC50
(µl/l)
M. leucadendron oil 15.28 a
1,8-cineole 11.52 a
α-terpineol 0.56 b
d-limonene 48.48 c
β-caryophyllene 123.36 d
Number wit different letters indicate significant difference among
samples (P<0.05)
Concentration (µl/l)
Figure 2. LC50 of whitefly T. vaporariorum in 0.5h exposure time
Insecticidal activity of M. leucadendron oil in this study probably stems from high amounts of 1,8 cineole and α-
terpineol in this essential oil, although others constituents of this essential oil also have activity (e.g.: d-limonene and β-
caryophyllene).
Previous studies showed strong positive correlation between the fumigant activity of essential oils and their
corresponding 1,8-cineole concentration that essential oils which contain 1,8 cineole has insecticidal activity (Alzogaray
et al., 2011; Ukeh et al., 2011). The previous study also reported that α-terpineol has insecticidal activity against several
insects and mites (Chu and Jiang, 2011). This study showed that M. leucadendron oil had potent fumigant activity
against greenhouse whitefly T. vaporariorum.
Conclusion
M. leucadendron leaf oil may have potential to be used as an ecologically safe pesticide against greenhouse
whitefly T. vaporariorum. Effectiveness of M. leucadendron oil as insect control fumigant is likely influenced by major
compounds of this oils such 1,8-cineole and α-terpineol. However, for practical use of this oil as novel fumigants, further
studies need to be conducted to evaluate the cost, efficacy, and effect in crops of this essential oil on wide range of pests
in commercial greenhouses.
Acknowledgments
We would like to thank Perum Perhutani Unit I, Central Java, Indonesia for providing the leaf samples for our research.
15.28
11.52
0.56
48.48
123.36
0 10 20 30 40 50 60 70 80 90 100 110 120 130
M. leucadendron oil
1,8-cineole
α-terpineol
d-limonene
β-caryophyllene

BIOENERGY AND FOREST PRODUCT CHEMISTRY PROCEEDING OF THE FIFTH INTERNATIONAL SYMPOSIUM OF INDONESIAN WOOD RESEARCH SOCIETY
70
References
Abbot WS. 1925. A Method of Comparing The Effectiveness of An Insecticide. J Econ Entomol 18:265–267.
Alzogaray RA, Lucia A, Zerba EN, Masuh HM. 2011. Insecticidal Activity of Essential Oils from Eleven Eucalyptus spp.
and Two Hybrids: Lethal and Sublethal Effects of Their Major Components on Blattella germanica. J Econ Entomol
104(2): 595-600.
Boulogne I, Petit P, Ozier-Lafontaine H, Desfontaines H, Loranger-Merciris G. 2012. Insecticidal and Antifungal
Chemicals Produced By Plants: A Review. Environ Chem Lett DOI 10.1007/s10311-012-0359-1. In Press.
Choi WI, Lee EH, Choi BR, Park HM, Ahn YJ. 2003. Toxicity of Plant Essential Oils to Trialeurodes vaporariorum
(Homoptera: Aleyrodidae). J Econ Entomol 96(5): 1479-1484.
Chu SS, Jiang GH. 2011. Insecticidal Activity and Composition of Essential Oil of Ostericum sieboldii (Apiaceae) Against
Sitophilus zeamais and Tribolium castaneum. Rec Nat Prod 5(2): 74-81.
Enan E (2001) Insecticidal activity of essential oils: octopaminergic sites of action. Comp Biochem Physiol C Toxicol
Pharmacol (3):325-337.
Finney DJ. 1971. Probit Analysis, 3rd edn. Cambridge University Press, Cambridge.
Isman MB. 2000. Plant Essential Oils for Pest and Disease Management. Crop Prot 19:603–608.
Lichtfouse E, Navarrete M, Debaeke P, Souche`re V, Alberola C, Me´nassieu J. 2009. Agronomy for Sustainable
Agriculture: A Review. Agron Sustain Dev 29:1–6.
Mohamed EIB, Sailan AA, El-Arami, Samir AM, Abdelgaleil. 2010. Acaricidal and Quantitative Structure Activity
Relationship of Monoterpenes Against The Two-spotted Spider Mite, Tetranychus urticae. Exp Appl Acarol 52:261–
274.
Prates HT, Santos JP, Waquil JM, Fabris JD, Oliveira AB, Foster JE. 1998. Insecticidal Activity of Monoterpenes Against
Rhyzopertha dominica (F.) and Tribolium castaneum (Herbst). J of Stored Products Research 34 (4): 243-249.
Sfara V, Zerba EN, Alzogaray RA. 2009. Fumigant Insecticidal Activity and Repellent Effect of Five Essential Oils and
Seven Monoterpenes on First-instar Nymphs of Rhodnius prolixus. J Med Entomol 46(3): 511-515.
Ukeh DA, Sylvia BA, Umoetok. 2011. Repellent Effects of Five Monoterpenoid Odours Against Tribolium castaneum
(Herbst) and Rhyzopertha dominica (F.) in Calabar, Nigeria. Crop Protection 30: 1351-1355.
Zabel A, Monojlivic B, Stankovic S, Rajkovic S, Kostic M. 2001. Control of The Whitefly Trialeurodes vaporariorum
Westw. (Homoptera, Aleyrodidae) on Tomato By The New Insecticide Acetamiprid. J Pest Science 74: 52-56.

BIOENERGY AND FOREST PRODUCT CHEMISTRY PROCEEDING OF THE FIFTH INTERNATIONAL SYMPOSIUM OF INDONESIAN WOOD RESEARCH SOCIETY
71
POTENTIAL OF Acanthus ilicifolius EXTRACT TO REDUCE DISEASES
ON PRAWN
Gina Saptiani and Esti Handayani Hardi
Laboratorium Mikrobiologi Perairan Fakultas Perikanan dan Ilmu Kelautan
Universitas Mulawarman, Samarinda
E-mail: [email protected]
ABSTRACT
Achantus ilicifolius is a mangrove plant that is often used by coastal society as a traditional medicine. In the future, this
plant may be useful as a source of pharmaceutical products. The research was done to investigate the leaf extract to
reduce vibriosis diseases and to inhibit the growth of Vibrio harveyi on prawn. The dried leaf was macerated using
methanol, and then was evaporated to make crude extract. A part of the crude extract was fractionated by using column
method with silica gel and with some solvents which were n-hexane, ethyl acetate, n-buthanol, ethanol and methanol.
Prawn was infected with Vibrio harveyi until clinical symptoms arised, and was given the extract of immersion. Leaf
extract could reduce mortality and symptoms of disease on prawn. N-butanol fraction was more effective to reduce the
disease on prawn, but n-hexane was fastest to heal wounds and ulcers.
Keywords: Acanthus ilicifolius; Leaf extract; Penaeus monodon; vibriosis
INTRODUCTION
Conversion of mangrove forests into farm land, agriculture, plantation, oil and gas mine, and settlement would
have a negative impact on regeneration of stock of fish and shrimp. It could lead to ecological functions obliteration of
mangrove forests as the area is where fish and other organisms search for foods, protection, and spawning. Exploration
of bioactive components from natural resources is an alternative in tackling diseases on prawn. To be able to control and
to prevent disease is one success in prawn cultivation. Aquatic environment is a complex ecosystem that makes
distinction between health, performance and disease. Until recently, the disease outbreak is still major problem on tiger
shrimp culture in East Kalimantan by causing failure of production and financial losses.
Jeruju (Acanthus ilicifolius) is a mangrove plant often found in aquaculture coastal area of East Kalimantan,
Delta of Mahakam in particular. The plant, normally, lives in the area, which is rather low in its salinity (± 15-20 ‰),
forming bush around mangrove palms (Saptiani et al., 2012a). A. ilicifolius is a valuable medicinal plant that is
widespread in tropical Asia and Africa, through Malaya to Polynesia (Khajure and Rathod, 2010). The leaves of A.
ilicifolius are used to treat rheumatism, neuralgia and poison arrow wounds (Malaysia). It is widely believed among
mangrove dwellers that chewing the leaves will protect against snakebite (Singh et al., 2009). In Bontang, tea brewed
from the leaves relieves pain and purifies blood.
The mangrove plant A. ilicifolius plays mayor role in the defense and potential source of metabolites against
the skin infection diseases (Govindasamy and Arulpriya, 2013). A. ilicifolius extract decreases protein exudation and
leukocyte migration in the peritoneal fluid, thereby indicating its effectiveness toward inhibiting peritoneal inflammation
(Kumar et al., 2008). The extract A. ilicifolius plant is potential to inhibit the growth of V. harveyi in vitro (Saptiani et al.,
2012b). The plant is reported to contain phytochemicals including alkaloid and wide range of glucosides (Singh et al.,
2009).
The purpose of this study is to assess the potential of A. ilicifolius extract to reduce diseases on prawn as an
antibacterial agent and as an agent that could enhance the durability of shrimp against V. harveyi. The result of this
study is expected could be used as a basis for further research; moreover, it is also an alternative as an effort to prevent
and to control Vibriosis disease naturally by utilizing the vegetation around the grow-out pond.

BIOENERGY AND FOREST PRODUCT CHEMISTRY PROCEEDING OF THE FIFTH INTERNATIONAL SYMPOSIUM OF INDONESIAN WOOD RESEARCH SOCIETY
72
MATERIALS AND METHODS
The leaves of A. ilicifolius were collected from the shrimp culture area on Muara Badak District, Kutai
Kartanegara Regency of East Kalimantan. Collected leaves were cut into small pieces and shade dried at room
temperature for 15 days. The extraction and fraction of the leaves were carried out by using different solvents in soxhlet
apparatus. The dried leaves were macerated by using methanol, and then evaporated to make crude extract. A part of
crude extract was fractionated by using column method with silica gel and with some solvents which were n-hexane,
ethyl acetate, n-buthanol. The extraction and fraction were concentrated using vacuum distillation.
The prawns used in the study were 3-4 gram in weight and 1,5 months old and came from Basuki Hatchery in
Muara Badak District, Kutai Kartanegara Regency of East Kalimantan. Before bred, the healthy prawn was not given
antibiotics, chemical substances and other medicine. Next, the healthiest and motile larvae in PL 8 stadia from the
breeding were chosen and cultivated in grow-out pond until they grew around 3-4 gram in weight. The healthy prawns
were selected, put in a plastic bag, given oxygen and brought to laboratory. In the laboratory, the prawns were put in
aquarium to be adapted for 24 hours, and next, screening test was performed by immersing the prawns by using 200
ppm formalin for 15 minutes, and then used as animal research.
The treatment contained 4 active materials with 2 different type doses. They were crude extract (300 and 500
ppm doses), n-hexane (200 and 400 ppm doses) ethyl acetat (200 and 500 ppm doses), n-butanol (100 and 300 ppm
doses), and control (PBS 0,85 %), with 3 replications of each. The prawns were put in 30 different aquariums (15 prawns
in each), and acclimated for 3 days. The prawns challenged with 105 cfu/ml dose of Vibrio harveyi as much as 0,1 ml
and were conducted intra-muscularly on dorsal part, and then on the 4th day were treated with the extract. The extract of
A. ilicifolius leaves treatment was performed by dipping method for 20 minutes.
The inhabitation observation or bactericide was performed with bacterial content test (Total Plate Count/TPC)
by taking hepatopancreas sample to be isolated, cultivated on TSA and TCBSA media, and incubated at 33 0C for 24
hours. Then, the amount of colony growth was counted. The inhabitation observation and inspection covered clinical
symptom, phonological anatomy, prevalence of attacks and viability.
RESULT AND DISCUSSION
The observation of clinical symptom after the challenged of Vibrio harveyi showed that the prawns were
decrease in feed consumption, became lethargic and the body color changed more black. On the 3th day after the
challenged of Vibrio harveyi, the prawns were lethargic. The symptoms included some appearance changes of reddish
black, red patches on the legs and tail, haemorhagi on the body, deformity and molting death. The prawn showed that
the challenged of V. harveyi caused specific clinical symptoms and death. In the beginning of extract treatment showed
that the body color changed more blue. The prawns color changing indicated the occurrence of body reaction toward the
extract of A.ilicifolius leaves treatment, and it was caused by the enlargement of prawns’ cuticle. The color changing was
also a sign that the immunity process occurred in order to fight foreign object entering the body since chromatophore is
one of the body's defense system in prawn (Saptiani and Hartini, 2008 and Saptiani et al., 2012a). On the 7th day, the
prawns were looked getting better, active and getting increase in feed consumption. After the 14th day, the prawns were
healthy and the body color became normal.
Similarly with the clinical symptom, the extract treatment showed that the pathology anatomy changing caused
by V. harveyi infection could be reduced. Pathology anatomy performed on the 14th day showed that the prawns’
hepatopancreas on control seemed brownish and mushy, some declined, and its bowel became reddish and hardened.
The bacteria in prawns’ digestion and organs functioning as digestive system would disrupt the work of the digestive
system because the bacteria were able to parse the various polysaccharides and carbohydrates and took nutrients
needed, and finally became the cause of prawns’ death (Saptiani et al., 2012a). In the treatment of leaf extracts and
fractions of A.ilicifolius, it changed the pathological anatomy getting better, though initially there were some prawns’
hepatopankreas brownish change. This indicated that bioactive of A.ilicifolius leaves could reduce diseases of prawn, so
as to inhibit infection and to protect prawns from V. harveyi attack.

BIOENERGY AND FOREST PRODUCT CHEMISTRY PROCEEDING OF THE FIFTH INTERNATIONAL SYMPOSIUM OF INDONESIAN WOOD RESEARCH SOCIETY
73
Fig. 1. Bacterial content (TPC) in tiger prawn hepatopancreas given the leaves extract and fractions of A..ilicifolius.
Description: C= crude, H= n-heksane, .E= Ethyl acetate, B= n-butanol, K-= control
The observation and calculation of V. harveyi content (TPC= Total Plate Count) in prawns’ hepatopankreas
organs, on the 7th day after the challenged of the V. harveyi, showed that the treatment of n-butanol of 300 ppm and 100
ppm were the lowest in its TPC (7,6-7,87 x 1.000 cfu/ml). In the meantime, TPC in the other treatment was ethyl acetate
fraction of 500 ppm and 200 ppm (8,6-8,8 x 1.000 cfu/ml), 300 and 500 ppm crude (9,1-9,13 x 1.000 cfu/ml), fraction of
n-heksane 200 and 400 ppm (9,17-9,30x 1.000 cfu/ml), and its TPC on the control was 10,40 cfu/ml. After the 14th day,
its TPC slowed down except for negative control, as showed on Fig. 1. According to Saptiani et al. (2013), the extract
and the fraction of A. ilicifolius leaves are potential to inhibit the growth of V. harveyi in vitro. A. ilicifolius has bioactive
compounds that are potential as an anti-bacterial ingredient (Manilal et al., 2009).
The prawns survival rate on the 7th day that were given the extract and fraction of A.ilicifolius was around
91,10- 100,00 %, while the survival rate that was resulted from the control was 75,60%. The complete results could be
seen in Fig. 2. The administration of A. ilicifolius leaves extract and fraction could enhance the survival of tiger prawn
better than the control treatment toward V. harveyi attack. It showed that the bioactive of A. ilicifolius leaves extract and
fraction could inhibit V. harveyi growth. The extract of A.ilicifolius leaves and root can inhibit bacteria growth, but the
leaves extract inhabitation is better than the root (Khajure and Rathod, 2010; Saptiani et al., 2012b).
Fig. 2. The survival of tiger prawn given the leaves extract and fractions of A. ilicifolius
Description: C= crude, H= n-heksane, .E= Ethyl acetate, B= n-butanol, K-= control
The observation of the prevalence of the V. harveyi infection in prawns, administrated with the extract and
fraction of A.ilicifolius leaves, showed that bioactive in the leaves could decrease the prevalence of infection or V. harveyi
attack. The average prevalence of V. harveyi attack on the A. ilicifolius leaves extract and fraction treatment on the 7th
day was 60,00-68,90 %, and after the 14th day decreased to 25,60-59,90 %, meanwhile the negative control was 82,1-
84,5 %. The prevalence on the 14th day showed that all the treatments decreased. It occurred because challenge test or
V. harveyi injection could increase the prawns immunity. As reported by Saptiani (2001), test challenge can increase
antibody where the antibody is built after the infection, and it will increase more if there is secondary infection. This event
will be beneficial to the organism itself, for it will increase resistance to the pathogenic organisms.
0.00
2.00
4.00
6.00
8.00
10.00
12.00
C 300 C 500 H 200 H 400 E 200 E 500 B 100 B 300 K-
TP
C (
x 1.
000
Cfu
/ ml)
Day-7
Day-14
-
20.0
40.0
60.0
80.0
100.0
120.0
C 300 C 500 H 200 H 400 E 200 E 500 B 100 B 300 K-
Sur
viva
l Rat
e (%
)
Day-7
Day-14

BIOENERGY AND FOREST PRODUCT CHEMISTRY PROCEEDING OF THE FIFTH INTERNATIONAL SYMPOSIUM OF INDONESIAN WOOD RESEARCH SOCIETY
74
Fig. 3. The prevalence and mortality of tiger prawn given the leaves extract and fractions of A. ilicifolius
Description: C= crude, H= n-heksane, .E= Ethyl acetate, B= n-butanol, K-= control
The leaves of A.ilicifolius extract and fraction could inhibit V. harveyi on prawns, primarily on the treatment of n-
butanol fraction in all concentrations which could inhibit and reduce V. harveyi. This result showed that the bioactive
content on A. ilicifolius extract and fraction was bactericidal toward V. harveyi and reduced diseases on prawns.
Therefore it can be used in aquaculture. Sivaram et al., (2008), stated that the methanol extracts of herbal pathogenic
Vibrio can control and improve the immunity system of the Grouper larvae (Epinephelus tauvina). Some researchers
stated that A. ilicifolius mangrove contains bioactive compound that is potential to be used as antibacterial agent (Manilal
et al., 2009; Khajure and Rathod 2010; Thirunavukkarasu et al., 2011). The plant contains chemical compound of
glucose, alkaloid, flavonoid, fatty acids, steroids, lignans, and component of phenol and terpenoid (Kanchanapoom et al.
2001: Wostmann and Liebezeid 2008).
CONCLUSION
Acanthus ilicifolius leaf extract could reduce prawns diseases caused by V. harveyi attack and does not cause any
vibrosis symptom. It could reduce mortality and the prevalence of prawns against V. harveyi compared to the control
treatment. A. ilicifolius leaf extract could inhibit the growth of V. harveyi and protect prawns from V. harveyi attacks.
Anatomic pathology of hepatopancreas and any other organs are normal.
.
ACKNOELEDGEMENTS
I sincerely thank to The Dean of Pharmacy and his staffs in the Laboratory of Pharmaceutical Chemistry, and colleagues
in the Laboratory's Aquatic Microbiology Faculty of Fisheries and Marine Sciences Mulawarman University, Samarinda.
REFERENCES
Govindasamy C, Arulpriya M. 2013. Antimicrobial activity of Acanthus ilicifolius: Skin infection pathogens. Asian Pasific
Journal of Tropical Disease. 3 (3): 180-183
Kanchanapoom T, Kamel M.S, Kasai R, Yamasaki K, Picheansoonthon C, Hiraga Y. 2001. Lignan Glucosides from
Acanthus ilicifolius. Phytochemistry. 56: 369-372.
Khajure PV, Rathod J.L. 2010. Antimicrobial Activity of Extracts of Acanthus ilicifolius Extracted from the Mangroves of
Karwar Coast Karnataka. Recent Research in Science and Technology. 2 (6): 98-99.
Kumar KTMS, Gorain B, Roy DK, Zothanpuia, Samanta SK, Pal M, Biswas P, Roy A, Adhikari D, Karmakar S, Sen T.
2008. Anti-inflammatory Activity of Acanthus ilicifolius. Journal of Ethnopharmacology. 120 (Issue 1) : 7-12.
-
10.0
20.0
30.0
40.0
50.0
60.0
70.0
80.0
90.0
C 300 C 500 H 200 H 400 E 200 E 500 B 100 B 300 K
Pre
vale
ncy
and
mor
talit
y (%
)
Day-7 Prevalency
Day-7 Mortality
Day-14 Prevalency
Day-14 Mortality

BIOENERGY AND FOREST PRODUCT CHEMISTRY PROCEEDING OF THE FIFTH INTERNATIONAL SYMPOSIUM OF INDONESIAN WOOD RESEARCH SOCIETY
75
Manilal A, Sujith S, Kiran GS, Selvin J, Shakir C. 2009. Biopotentials of Mangroves Collected from the Southwest Coast
of India. Global Journal of Biotechnology & Biochemistry. 4 (1): 59-65.
Saptiani G. 2001. Clinical Symptom of white Spot Diseases on Tiger Prawn (Penaeus monodon. F). Jurnal Ilmu
Perikanan Tropis. 1 (1): 17-25.
Saptiani G, Hartini. 2008. The Inhibition of Bettle Leaf Extracts on the in vitro Growth of the Vibrio Harveyi Bacteria
and the Protective to Tiger Prawn Larva. Paper. Konferensi Indonesian Aquaculture. Indoaqua. Yogyakarta 17-
20 Nopember.
Saptiani G, Prayitno SB, Anggoro S. 2012a. The effectiveness of Acanthus ilicifolius in protecting tiger prawn (Penaeus
monodon F.) from Vibrio harveyi infection. J. of Coast. Dev. 15(2):217-224.
Saptiani G, Prayitno SB, Anggoro S. 2012b. Antibacterial Activity of Jeruju (Acanthus ilicifolius) Extracts on the In Vitro
Growth of the Vibrio harveyi. J. Veteriner 13(3):257-262
Saptiani G, Prayitno SB, Anggoro S. 2013. Antibacteria Potential of Jeruju (Acanthus ilicifolius) Leaf Extracts on the in
Vitro Growth of the Vibrio harveyi. Jurnal Kedokteran Hewan. 7 (1): 17-20
Singh A, Duggal S, Suttee A. 2009. Acanthus ilicifolius Linn. –lesser known medicinal plant with significant
pharmacological activities. International Journal of Phytomedicine (1):1-3.
Sivaram V, Babu MM, Citarasu T, Immanuel G, Murugadass S, Marian MP. 2008. Growth and Immune Response of
Juvenile Greasy Grouper (Epinephelus tauvina) fed with Herbal Antibacterial Active Principle Supplemented
Diets Against Vibrio harveyi Infec. Aquaculture. 237: 9-20.
Thirunavukkarasu P, Ramanathan T, Ramkumar L. 2011. Hemolytic and Anti Microbial Effect in the Leaves of
Acanthus ilicifolius. J. Pharmacol. Toxicol. 6(2): 196-200.
Wostmann R, Liebezeid G. 2008. Chemical Composition of the Mangrove Holly Acanthus ilicifolius (Acanthaceae).
Review and Additional Data. Senckenbergiana Maritima, 38 (1) : 31-37.

GENERAL FORESTRY PROCEEDING OF THE FIFTH INTERNATIONAL SYMPOSIUM OF INDONESIAN WOOD RESEARCH SOCIETY
76
POTENCY USAGE OF PLANTATION FOREST OF Acacia mangium and Acacia
crassicarpa AS SOURCE OF HONEYBEE FORAGE AND ITS PROBLEM
Avry Pribadi, Purnomo
Researcher staff Balai Penelitian Teknologi Serat Tanaman Hutan
Jl. Raya Bangkinang-Kuok km. 9 BKN 28401 Riau
ABSTRACT
The chosen of Acacia crassicarpa and Acacia mangium as raw material for pulp and paper industry in Riau was based
on various factors. At the plantation area, these two species have higher growth than other species and easier to adapt
to marginal soils. Problems. However, the existences of this species do not bring the positive benefits to local
communities in the concession area. Purpose. The purpose of this study was to determine the potency of A. crassicarpa
and A. mangium as a source of bee forage for honeybee farm in Riau province and the problem that can make the
possibilities for cultivation efforts. Results. Measurement of extra floral nectar secretion of A. mangium age of 1 year
showed that the volume of nectar secreted is 83250 cc / ha / day with an average water content 33%. Whereas, the age
of 2 years reach 112387 cc / ha / day with an average water content 33%. On A. crasicarpa age of 1 year showed nectar
secretion 42774 cc / ha / day with an average water content 33%. Whereas, the age of 2 years reach 53288 cc / ha / day
with an average water content 33%. Placement of honeybee colonies of A. cerana in 1 year A. mangium showed the
honey productivity of 1.8 lt /month, 1.19 lt /months at 2 years, and 1.172 liters/month at 3 years. Whereas, in 1 year A.
crassicarpa plantations would produce honey 1.6 liters /month, 1.51 lt /month in 2 years, and 1.2 lt/month in 3 years. The
problems when placed the honeybee colonies under stands of A. mangium and A. crassicarpa is scarcity of pollen source
so it will impact to the honey productivity.
Key word: Acacia mangium, Acacia crassicarpa, Apis cerana, nectar, honey
I. INTRODUCTION
There are two big pulp and paper industries that had concession area in Riau nearly 800,000 ha by the realization of
nearly 600,000 ha (Riau Forestry Service, 2006). Clearing of land for concessions plantation forest cannot be inevitable,
because this industry has given a great contribution to the national economy. Contribution of prominent industry and its
derivatives, the other contribution is in the form of employment and foreign exchange contribution of exports. Absorption
of labor by the pulp industry is estimated around 110,000 people in 2006 (APKI, 2006). On the production side, of the
total 6.5 million tones of pulp and its derivates had resulted and nearly 2.6 million tons of which are exported to Japan
with estimated foreign exchange value of 3.3 to 3.5 billion dollars (Arisman, 2006).
In the Riau province there are at least 3 species that used as raw material for pulp and paper industry, namely
Acacia mangium and Eucalyptus sp. in the mineral/dry land and Acacia crassicarpa in the peat land (Mindawati, 2010).
Some reasons for selecting A. crassicarpa in peat/wet land and A. mangium in mineral/dry land is this species can grow
well, have high increment, easy maintenance, high yield production, relatively content of low lignin, and have the high
strength (Pasaribu and Tampubolon, 2007).
One of the social problems that arise as the negative effects of forest management by the plantation forest is conflict
between the industry and the local community. One study noted between 1997 to 2004 there has been 359 conflicts in
the forestry sector. While 34% occurred in the area of conflict conservation (including protected forests and national
parks) and 27 % occurred in the area of forest concessions (Wulan et.al., 2004). This conflict can be developed more
widely, since there are currently approximately 10 million people who live in poor communities around the forest area
(Directorate General of Forestry Production, 2006). Environmental problems are also rising from plantation forest, such
as increasing of sedimentation in rivers around the area (especially at the opening area, prone to forest fires, and the
spread of pests and diseases, and potentially reducing the water table ) .
The solution is to utilize the non wood potency that abundant on plantation forest. The potency is extra floral nectar
that can be used as local honey bee (Apis cerana) forage. Honey that produced by A. cerana that comes from Acacia
nectar can be used to increase the economy of local community that live around the concession area. Vegetation of A.
crassicarpa and A. mangium as a honey bee farm is suspected to be a source of feed honey bees because there are
abundant, sustainable, and never stop to secreted the nectar in every day so it is possible to develop beekeeping

GENERAL FORESTRY PROCEEDING OF THE FIFTH INTERNATIONAL SYMPOSIUM OF INDONESIAN WOOD RESEARCH SOCIETY
77
business (Purnomo, 2010). The purpose of this study were (1) to determine the potency of A. crassicarpa and A.
mangium as a source of bee forage for honeybee farm in Riau province and (2) the problem that can make the
possibilities for cultivation efforts.
II. Potency nectar of A. crassicarpa and A. mangium
Observation of the nectar secretion in age 1 of A. crassicarpa showed that the nectar is secreted in the base of the
leaves (Figure 1) produces secretions of 42.774 liters per day / ha, while at the age of 2 years reach 53.288 liters per day
/ ha. This trend will continue to increase until the end of the harvest (5 years), total to 84.590 liters per day / ha (Table 1).
In observation of nectar water content showed a similar trend for each age standing in the amount of 33%.
Table 1. Secretion volume of A. crassicarpa plantation in each planted age
A. crassicarpa age Secretion volume per day/ha (lt)
1 42.774
2 53.288
3 63.682
4 74.136
5 84.590
Figure 1. Acacia extra floral secreted on the base of leaf
Mean wahile, measurement of extra floral nectar secretion of A. mangium age of 1 year showed that the volume
of nectar secreted is 83.250 lt / ha / day with an average water content 33%. Whereas, the age of 2 years reach 112.387
lt / ha / day with an average water content 33%. This trend will show the increasing proportional to the end of the stand
(199.8 lt /ha/day)(Table 2).
Table 2. Secretion volume of A. mangium plantation in each planted age
A. mangium age Secretion volume per day/ha (lt)
1 83.25
2 112.38
3 141.52
4 170.66
5 199.8
Calculation of extra floral nectar potency of A. crassicarpa and A. mangium as honeybee forage is influenced by
many factors, such as :
(1) total amount of leaf in each stand in every age
(2) competitor; organisms such as insects other than honey bees that also utilize the extra flora nectar. Results showed
that only red ants eat this nectar (spend about 10 % of the total nectar)

GENERAL FORESTRY PROCEEDING OF THE FIFTH INTERNATIONAL SYMPOSIUM OF INDONESIAN WOOD RESEARCH SOCIETY
78
(3) decreasing of water content of the nectar secretion . The analysis showed that the water content of extra floral
nectar is about 33 % . While on placement of A. cerana in A. mangium and A. crassicarpa plantation showed the
honey that extracted from the colony only reach 22 % of water content.
(4) the daily consumption of honey bees to be taken into account as much as 10 % of the amount of honey stored in the
colony .
III. Productivity of honey bee that placed on Acacia plantation
Placement of local honeybee colonies (A. cerana) in 1 year A. mangium Showed the honey productivity of 1.8 lt /
month, 1.19 lt / months at 2 years, and 1,172 liters / month at 3 years. Contrast to the tendency of nectar secretion in A.
mangium that showed increase in every year to the end of the rotation, the pattern of the honey productivity showed
decresing trends (reached only 0.45 lt / colony / month in the end of A. mangium) (Table 3).
Table 3. Honey productivity of A. cerana that placed on A. mangium plantation
A. mangium age Honey productivity per colony (lt)
1 1.80
2 1.19
3 1.17
4 0.76
5 0.45
Whereas, in 1 year A. crassicarpa honey plantations would produce 1.6 liters / month, 1.51 lt / month in 2 years,
and 1.2 lt / month in 3 years. The same trend occurred in the honey productivity by A. cerana that placed on stands of A.
crassicarpa which showed the declining up to 0.84 liters / colony on A. crassicarpa age of 5 years (end of the rotation)
(Table 4).
Table 4. Honey productivity of A. cerana that placed on A. crassicarpa plantation
A.crassicarpa age Honey productivity per colony (lt)
1 1.60
2 1.50
3 1.20
4 1.03
5 0.84
Declining trend in the honey productivity is indirectly proportional to the stand age of A. mangium. It might be
caused by a variety of factors, such as pollen lack. Based on the analysis of vegetation indicates that the older the age of
the stand, there is low population of vegetation in under the A. mangium. But in the 1 year of A. mangium, in which the
sun light can penetrate forest floor, vegetation such as Mimosa pudica, Ageratum conyzoides, and Assystasia sp. that
produce pollen are still grow well so the A. cerana can sufficient the protein needs from the pollen source. Whereas at
the stands age above 3 years which the sun light cannot penetrated to the forest floor vegetation. So the vegetation
under the stands will die and effect to loss of pollen source for honey bee. The other cause is the alelopati effect of A.
mangium will also repressed the vegetation below the A. mangium stands.
Whereas, the honey productivity of local honeybee that placed on A. crassicarpa showed similar tendency to the
honey productivity of A. cerana that placed on A. mangium (decline opposite to the stand age). The difference is the type
of vegetation that available on the under of A. crassicarpa stands that dominated by fern (Neprolephis sp. and
Stenochlaena palustris) which are not produced pollen. Kleinschmidt (1982) stated that the healthy honeybee must
contain between 40% to 67% of Crude Protein (CP). Honeybee must consumed much pollen that contain at least 18% of
protein to get the 40% CP. A. cerana that under pollen lack conditions will effected to their activities to get nectar and
also to the fecundity of honeybee queen.
According Mourizio (1975), pollen is a protein source for honeybee larvae and development of adult honeybee. In
addition, pollen also contain fat, vitamins and minerals. Dietz (1975), larvae of honeybee required a total of 120 up to 150
mg of pollen to reach the adult phase. The proteins that available on the pollen serves as the important matter for the
GENERAL FORESTRY PROCEEDING OF THE FIFTH INTERNATIONAL SYMPOSIUM OF INDONESIAN WOOD RESEARCH SOCIETY
79
formation of hypopherengeal glands located on caput of worker honeybee to produce royal jelly (special food only for
queen honeybee).
IV. Conclusion
1. Observation of the extra floral nectar secretion at A. crassicarpa age of 1 year reached 42.774 liters per day / ha,
while at the age of 2 years to reach 53.288 liters per day / ha. This trend will increase until the end of the harvest
cycle (5 years), amounting to 84.590 liters per day / ha.
2. Observation of the extra floral nectar secretion at A. mangium age of 1 year reached 83.250 liters / ha / day, while at
the age of 2 years reach 112.387 liters / ha / day. This trend will continue to increase proportional to the age of the
stand (5 years), amounting to 199.8 l liters per day / ha.
3. The problems of beekeeping when placed under the stands of A. mangium and A. crassicarpa plantation are
scarcity of pollen source so it will impact to the honey productivity.
Reference
Arisman. H. 2006. Industrial Plantation Forest (HTI) For Sustainable Supplies for sustainable wood pulp industry:
Experience and Development. Papers Presented in the Seminar on Development of Timber and Pulp Industry
in Indonesia, Jakarta.
Dietz, A. 1975. Nutrition of the Adult Honey Bee. Dadant and Sons Hamilton, Illonois
Directorate General of Forest Production. 2006. Acceleration of industrial plantation forest. Paper presented at the
Seminar on Development Policy Timber and Pulp Industry in Indonesia, Jakarta.Indonesian
Kleinschmidt, G.J. and Kondos, A.C. 1976. The influence of crude protein levels on colony production. Australian
Beekeeping 80. pp: 251-257
Mindawati, N. 2010. Management of Pulp Plantation Forest . Forestry Research and Development, Bogor
Mourizio, A. 1975. Bienenbotanik. Dadant and Sons Hamilton, Illonois
Pasaribu, R.A and A.P.Tampubolon. 2007. Status Utilization Technology for Wood Pulp Materials. Dissemination
Workshop Program and Activity Research to Support BPHPS Plantation Wood Pulp and Its Network.
(Unpublished)
Pulp and Paper Association (APKI). 2006. Prospects of pulp and paper industry in Indonesia. Paper presented at the
Seminar on Development Policy of Plantation Forest Industry and Pulp Industry in Indonesia, Jakarta.
Purnomo. 2010. Nectar potency of Acacia crassicarpa to support beekeeping. Research report of Balai Penelitian Hutan
Penghasil Serat, Kuok. (unpublished)
Riau Forestry Service. 2006. Forestry Statistic Data of Riau Province. www.dephut.go.id/files/statistik_dishutriau06_0.pdf
Wulan. Y.C, Purba, Yasmi, and Wollenberg. 2004. Anatomy of forestry sector conflict. CIFOR, Bogor.
GENERAL FORESTRY PROCEEDING OF THE FIFTH INTERNATIONAL SYMPOSIUM OF INDONESIAN WOOD RESEARCH SOCIETY
80
Study on Land Rehabilitation at Mined Lands of PT Trubaindo Coal Mining,
West Kutai, East Kalimantan (2011 - 2012)
Wahjuni Hartati1) and Triyono Sudarmadji2)
Laboratory of Soil Sciences1) and Laboratory of Soil and Water Conservation2),
Faculty of Forestry, University of Mulawarman
Jalan Ki Hajar Dewantara Kampus Gunung Kelua PO. BOX 1013 Samarinda 75123,
East Kalimantan, Indonesia
Phone: +62-541-735089 / 748068, Fax. +62-541-735379
email: [email protected]) and [email protected])
Abstract In many cases, mined lands is not immediately ready to support plant growths due to bad drainages, soil structure
disturbances, high temperature, uncontrollable overland flow, high erosion rate, lack understanding of suitable plant
species, planting techniques and its maintenance. The study objective is to find out applicable design - procedure -
techniques of mined-out lands revegetation to support and accelerate the ecological recovery of mined-out lands. Land
revegetation is conducted by planting 10 trees species (3.000 seedlings) at mined-out lands after reclamation works.
Plants species are selected based on previous studies and expected ecological function. Plant height, diameter, and
growth performance are used as parameters associated with physical and chemical soil characteristics. The plant growth
percentage is 93% with the lowest of Artocarpus champedens (84%) and the highest of Peronema canescens (86%)
consecutively. Moreover, Terminalia catappa, Annona muricata, and Muntingia calabura show the strongest growth
performance, while Shorea balangeran, Artocarpus champedens, Pterocarpus indicus are found weak. Soil is found
being high compacted but no significant difference of fertility status between upper and lower layers, and also recognized
being acid with moderate CEC and very high base saturation. Organic fertilizing reduces soil compactness, increasing
soil porosity, CEC and its water content. Fertilizing of 100g NPK (16-16-16) stimulates biggest diameter and height
increments of Shorea balangeran, Terminalia catappa, Annona muricata, Ficus variegata, Schima walichii. Moreover,
Shorea balangeran, Entrolobium cyclocarpum, Terminalia catappa, Annona muricata, Ficus variegata, Schima walichii,
Peronema canescens, and Muntingia calabura are still responsive to fertilizer application. Considering low nutrients
contents, chemical fertilization are still needed to immediately increase macro nutrients content. Suggested dosage of
NPK (16-16-16) fertilizer is 100 gr for Entrolobium cyclocarpum, Peronema canescens, Muntingia calabura, Terminalia
cattapa, and Schima walichii; 150 gr for Annona muricata, Ficus variegata, Shorea balangeran; and 50 gr for Pterocarpus
indicus and Artocarpus champedens. Simultaneously with revegetation works, the phenomenon of soil erosion potential
dynamic is depend on influencing factors upon soil erosion occurences that are rainfall erosivity, soil erodibility, landform
slope-lengths, vegetation cover, practical soil and water conservation. Vegetation growth cover is the most significant
factor related with soil erosion dynamic at revegetated mined-out lands.
Keywords: mined-out lands, lands rehabilitation, physical-chemical soil characteristics, growth percentage, tree species,
soil erosion potential
IInnttrroodduuccttiioonn Background
The utilization of natural resources and environmental management have to be conducted properly to minimize
its negative impacts into environments, in order being possible to retain quality and sustainability of natural resources for
pepoples welfare. PT Trubaindo Coal Mining (TCM) as one of leading coal mining company strongly efforts to monitor
and manage all potential - on going - predictable arising negative impacts due to coal mining activities. Coal mining
activities causes a significant environmental impacts related over lands slope stability, hydrology, environmental pollution,
natural resources decreasing, infiltration rate and capacity, vegetation covers dissapear, topsoils removal, wildlife and its
habitat, peoples health, social economic disparities ect. Therefore coal mining activities have to be followed by maximum
efforts in line with its standar operating procedures of lands clearing, topsoils management, mining waste treatments,
water resources monitoring, mined-out lands restoration - reclamation - revegetation and other important efforts related
with coal mining operation.

GENERAL FORESTRY PROCEEDING OF THE FIFTH INTERNATIONAL SYMPOSIUM OF INDONESIAN WOOD RESEARCH SOCIETY
81
A part of working area of PT TCM is located at production forest area based on borrow-use pattern permit
earned from Ministry of Forestry, and therefore PT TCM has a mandatory obligation to rehabilitate its mined-out lands to
be rocovered into productive lands of production forest area in the future. The achievement of mined-out lands
rehabilitation needs a proper knowledge and field experiences especially focused in soils and lands dynamic,
reclamation-rehabilitation techniques, species site matching based on specific government rules, and also lands
preparation, planting techniques and its vegetation maintenances.
PT TCM applies open pit/cast method of mining operation started with general preparation followed by land
clearing - topsoils striping and removal - blasting - over burden opening and coal mining. However, considering that coal
mining is a kind of non-renewable resources utilization, it must be fully considered to the principles of rational - efficient,
and as far as possible to minimize the environmental impacts and disturbances in the spirit of keep an enough stock for
next generation. Moreover, it is also well known that application of open pit mining system causes landscape changes
and at the same time influencing bio - geo - physics - chemical characteristics changing, social-economic-culture and
health of peoples. For this reason, it is needed to prepare and anticipate of all countermeasure efforts in relation with
sustainable capacity of environmental for supporting peoples life and welfares.
Rehabilitation of Mined-out Lands
As a part of environmental setting and management planning which is effective and efficient, mined-out lands
rehabilitation have to be done following the technical method and procedures explained at documents of Environmental
Impact Assesment, Monitoring, and Environmental Management Plans. Land clearing have to be followed by field
practical works relating to lands rehabilitation efforts. Removed topsoils as about 30cm should be temporarily placed at
designed site surrounding mining operation area and later on to be replaced at the top of reclamied sites to support plant
growth of lands revegetation.
Topsoils stockpile is protected with dykes in order for not being eroded by surface runoff during rainy days. To
make sure that lands rehabilitation after open mining system could be performed, mined-out lands have to followed by
backfilling whether in our out pit dump immediately. Moreover, concerning to the coal seam position and its slope,
specific method of contour mining, area mining and panel mining are applied by PT TCM. Mined-out lands reclamation -
reshaping and recontouring are conducted at each block consecutively and at the end all of block are completed. Both of
mining water and rainfall which are flowing as surface runoff and potentially transporting mass mud are controlled and
directed into catchpond/settling pond for mud sedimentation.
Open pit system causes decreasing lands surface and new disposal of over-burden and inter-burden. To
reduce such mass dumping disposals, these materials are then used to fill former pit. As backfilling is completed
generally is directly followed by slope and drainage works to avoid increasing and uncontrollable surface runoff. Finally,
this reclamation works is continued by spreading of topsoils and therefore ready for revegetation works. Revegetation
works is initiated by land cover crops to minimize potential soil erosion. Legume plants is used to accelerate soil
fertilization and followed by tree planting with selected plants of fast growing species. After cover crops and fast growing
species plants are growing well, it is possible to conduct enrichment planting by using selected tree species based on
some considerations such as lands status, economically productive trees, and also ecpected ecological role for
supporting life system.
General Characteristics of Mined-out Lands
As mentioned before, open pit system produces a mass disposal of over-burden and inter-burden which is
then used to fill mined-out pits. After backfilling process, most of dumping materials is in condition of wreak or disturbed
structure and pores and could be a mass of unstable dumping materials. Moreover, some time also unavoidably mixed
with dirty coal and off course almost without any organic material. This condition lead to a bad drainage and low water
holding capacity, highly compacted and difficult to be penetrated by plant roots, opening space and high temperature.
Problem Formulation
Regarding to lands rehabilitation through reclamation and revegetation activites, the main problem is that
backfilled mined-out lands not fully ready to support plants growth due to bad drainage, disturbed soil structure and also
relatively high land temperature. Subsequently, uncontrollable high overland flow followed by high soil erosion rate,
fragmented soil materials, soil mixed with fine coals and lack of organic materials are also have to be properly treated
before planting. In relation with planting, species site matching (trees, land cover crops), planting techniques and its
procedures for maintenance are also still needed to be solved. So far, the results of mined-out lands revegetation has not
been satisfy as expected especially in species diversity due to plants species still limited to monoculture species.

GENERAL FORESTRY PROCEEDING OF THE FIFTH INTERNATIONAL SYMPOSIUM OF INDONESIAN WOOD RESEARCH SOCIETY
82
Study Objective and Expected Results The main objective of this research is focused to develop design, procedurs, techniques, and the
successfulness of mined-out lands revegetation. Therefore, the results of this reseach is expected to be one of important
consideration to implement many efforts in ecological function recovery, economics and social aspects of forest areas
post coal mining actvities.
SSttuuddyy MMeetthhooddoollooggyy Study Site and Research Period
The study of mined-out lands reabilitation is conducted at the coal concession of PT TCM Site Adong, West
Kutai, East Kalimantan. Panoramic view of the rest forested area is shown at Photo-01 as representative of surrounding
mined-out lands. The green spots of forested area shows a good forest with natural regeneration with high density
ranging 3.000 - 5.000 seedlings per hectare with identified species of Shorea parvifolia, Dipterocarpus cornutus, Shorea
ovalis, Shorea ochracea, and Shorea superba.
Photo-01.View of Original Forest Vegetation Surrounding Mined-out Lands of PT TCM, West Kutai, East Kalimantan
Regarding to government acts in forestry, the status of study site area is a non forest area (KBNK) with a
massive destruction post mining operation. Administratively, the site is located at West Kutai regency as a part of East
Kalimantan Province. Geographically, all of coal consession area of PT TCM is lying at the coordinate of 0°27’44’’ -
0°51’41’’ South and 115°30’00’’ - 115°51’30’’ East.
Research Procedures
The research is performed during arround two years (June 2011 - December 2012) covering of documentation
and refferences study, field data collections, data organization, analysis and reporting. Field observation and
measurement are performed into diameter, height, and physical field performance of plant growth. The soil chracteristics
and soil erosion potential are also studied simultaneously with the efforst of reclamation and revegetation of mined-out
lands.
Photo-02. View of Study Area - Reclamation of Mined-out Lands of PT TCM, West Kutai, East Kalimantan
Study Site
The study of mined-out lands rehabilitation is conducted at Block-2 Ex-Pt with + 6 hectares large in area.
Before this study, earthworks was done in this location such as ex-pit back filling, re-contouring, re-shaping and topsoils
spreading. The final result of these earthworks is a landscape with 8-15% slope as viewed at Photo-02.
Backfilling-Recontouring-Reshaping
Topsoil Stockpile
Final step of Land
Reclamation

GENERAL FORESTRY PROCEEDING OF THE FIFTH INTERNATIONAL SYMPOSIUM OF INDONESIAN WOOD RESEARCH SOCIETY
83
Plants Species
The plants used for field planting trial in this study are consisting of ten species that are S01-Shorea
balangeran (Kahoi), S02-Artocarpus champedens (Cempedak), S03-Entrolobium cyclocarpum (Sengon Butho), S04-
Terminalia catappa (Ketapang), S05-Pterocarpus indicus (Angsana), S06-Annona muricata (Sirsak), S07-Ficus variegata
(Kondang), S08-Schima walichii (Puspa), S09-Peronema canescens (Sungkai), serta S10-Muntingia calabura
(Kersen/Cherry). Plants materials of several species are shown at Phto-03 of which each species as much as 25
individual plants.
Photo-03. Several Plant Species for Mined-out Lands Revegetation Work
Repetition of Plants Species
The experimental design for data collection and analysis of field observation and measurement results is done
by using completely randomized design. This experimental design is used by considering available location for study,
accessibilty and supporting facilities. Moreover, the sum of repetition for each species is 3 (three) following randomization
and requirement for statistical analysis reason.
Soil Treatment on Planting Holes
This research is also perform 4 (four) soil treatments of T1, T2, T3 and T4. T1 is regular treatment done by PT
TCM in their mined-out lands rehabilitation and therefore is used as benchmark for other treatments of this research
(Table-01). Planting pattern is 3 m x 3 m and as much as 25 invidual plants are planted at each compartment (PUC) for
each species.
Table-01. Soil Treatment Applied at Mined-out Lands Rehabilitation of PT TCM
Treatment Organic Fertilizer (kg) Dolomite (kg) NPK Fertilizer (g)
Per-plant Total Per-plant Total Per-plant Total Year 2011 First Year
T2 20 15.000 0,5 375 50 37.500 T3 20 15.000 0,5 375 100 75.000 T4 20 15.000 0,5 375 150 112.500
Total 45.000 1.125 225.000
Year 2012 Second Year
T2 10 7.500 0,5 375 50 37.500 T3 10 7.500 0,5 375 100 75.000 T4 10 7.500 0,5 375 150 112.500
Total 1.125 225.000
Note: Number of Plant/Treatment = Ʃ Species (10) x Ʃ Plant/PUC (25) x Repetition (3) = 750

GENERAL FORESTRY PROCEEDING OF THE FIFTH INTERNATIONAL SYMPOSIUM OF INDONESIAN WOOD RESEARCH SOCIETY
84
Design of PUC
The layout of PUC is made as long as following the availability of mined-out lands in the field (Figure-01). For
statistical reason, the placement of PUC completely is randomized which based on repetition (U), soil treatments (T) and
its plant species (S) as shown at Table-02. Each PUC is quadrangle of 15 m x 15 m in shape or 225 m2 in area and
therefore the study area of mined-out land is 120 x 225 m2 = 29.700 m2 or 2,97 hectares large in area.
Table-02. Randomization of PUC at Mined-out Lands Revegetation
No. PUC No. PUC No. PUC No. PUC No. PUC
001 U2T2S06 025 U2T3S01 049 U2T1S06 073 U2T2S09 097 U3T4S09
002 U2T4S01 026 U2T1S04 050 U1T3S09 074 U1T2S05 098 U1T2S04
003 U3T1S03 027 U2T3S04 051 U2T4S02 075 U3T1S10 099 U1T4S06
004 U2T2S04 028 U3T3S05 052 U1T2S09 076 U2T4S10 100 U2T2S07
005 U1T3S02 029 U1T4S08 053 U1T4S07 077 U2T2S03 101 U1T2S06
006 U1T1S10 030 U1T4S05 054 U3T4S01 078 U3T1S05 102 U2T4S04
007 U1T4S04 031 U1T3S03 055 U2T3S10 079 U2T4S09 103 U3T4S07
008 U3T4S02 032 U1T1S01 056 U3T4S03 080 U3T3S10 104 U2T4S08
009 U2T1S01 033 U3T3S02 057 U2T1S03 081 U1T3S10 105 U1T2S07
010 U1T1S02 034 U3T3S06 058 U2T3S05 082 U3T2S03 106 U2T3S09
011 U3T2S09 035 U2T2S02 059 U1T4S09 083 U1T1S08 107 U1T1S06
012 U2T1S07 036 U1T3S05 060 U3T3S09 084 U3T2S04 108 U3T1S08
013 U1T1S03 037 U3T1S09 061 U1T2S01 085 U3T4S04 109 U1T2S08
014 U3T1S02 038 U2T2S01 062 U3T4S06 086 U2T4S05 110 U3T4S08
015 U2T1S10 039 U2T2S05 063 U2T3S08 087 U3T3S08 111 U1T3S04
016 U1T3S08 040 U3T1S01 064 U3T3S04 088 U2T2S10 112 U3T2S06
017 U2T1S05 041 U1T2S02 065 U1T4S03 089 U2T4S06 113 U2T4S07
018 U3T3S01 042 U3T1S07 066 U2T1S08 090 U3T4S10 114 U3T2S08
019 U1T3S01 043 U3T2S01 067 U3T4S05 091 U3T2S07 115 U2T3S03
020 U2T1S02 044 U1T2S03 068 U3T1S06 092 U1T4S02 116 U1T1S07
021 U1T1S05 045 U1T4S10 069 U2T3S06 093 U1T1S09 117 U1T3S07
022 U3T3S03 046 U2T3S02 070 U3T1S04 094 U2T3S07 118 U1T1S09
023 U1T4S01 047 U3T2S02 071 U2T4S03 095 U2T2S08 119 U3T2S05
024 U1T1S04 048 U3T2S10 072 U1T3S06 096 U3T3S07 120 U1T2S10
Measurement of Plant Height and Diameter
The plant diameter and height are used as qunatitative parameter for plant growth percentage. Plant height is
measured by scaled wooden stick while diameter measurement is done by using micro-caliper and plastic metline scale.
Both of measurement are using centimeter scale.

GENERAL FORESTRY PROCEEDING OF THE FIFTH INTERNATIONAL SYMPOSIUM OF INDONESIAN WOOD RESEARCH SOCIETY
85
Area-01
001 002 003 004 005
006 007 008 009 010 011 012 013
014 015 016 017 018 019 020
021 022 023 024 025 026 027
028 029 030 031 032 033 034
035 036 037 038 039 040
041 042 043 044 045
046 047 048 049 050
Area-03 051 052 053 054 055
087 088 056 057 058 059
089 090 060 061 062
091 092 093 063 064 065
094 095 096 097 066 067
098 099 100 101 Area-02
102 103 104 105 068 069
106 107 108 109 070 071 072 073 074
110 111 112 113 075 076 077 078 079
114 115 116 117 080 081 082 083
Area-04 084 085 086
118
119 120
= Shorea balangeran - Kahoi = Annona muricata - Sirsak
= Arthocarpus champedens - Cempedak = Ficus variegata - Kondang
= Entrolobium cyclocarpum - Sengon Butho = Schima walichii - Puspa
= Terminalia catappa - Ketapang = Peronema canescens - Sungkai
= Pterocarpus indicus - Angsana = Muntingia calabura - Karsen
Figure-01. Layout Distribution of Plant Species at Mined-out Lands
RReessuulltt aanndd DDiissccuussssiioonnss Description of Study Site Geographycal Position
The coal mining concession of PT TCM is 23.650 hectares and located at West Kutai, East Kalimantan.
Travelling throughout provincial way connecting Samarinda City to study site needs about 7 (seven) hours. Meanwhile,
using river transportation in about 16 (sixteen) hours travelling along Mahakam River. Geographically, all of coal
consession area of PT TCM is lying at the coordinate of 0°27’44’’ - 0°51’41’’ South Latitude and 115°30’00’’ -
115°51’30’’ East Longitude.
Geology
Geological condition covering study site shows two existing major synclines of North and South areas. Northern
area consist of North and East blocks, while in Southern area are Dayak Besar, Nage, Biangan, Perak, and Lati blocks in
which prospective mined coal seam is in layer group between 1.700 - 9.300. The slope of coal seam is in 20° - 50°
ranging and distributed in several geological formation. Variation of lithology covere coal seam consist of sandstone and
silstone, and the rock structure has been indicated as Miocene to Holocene. The rock structure is a repetition of
sandstone-siltstone-coal with formation depth more than 4.000 m in form of syncline in the direction to West-South and
East-North. Average coal quality indicates a gross calorific value of 6.400-6.600 Kcal/kg in North Block, 6.100-7.600
Kcal/kg in South Block and more than 7.000 Kcal/kg for East Block. In general, the ash content is low with high variation
of sulphure. The coal potential is about 33,7 MT (North), 28,t MT (Dayak Besar), and 34,5 MT (Biangan).

GENERAL FORESTRY PROCEEDING OF THE FIFTH INTERNATIONAL SYMPOSIUM OF INDONESIAN WOOD RESEARCH SOCIETY
86
Climate
According to Climate Classification System of Schmidt and Ferguson (1951), the study site is under influence
of A type (very wet) indicated by Q = 0. Annual rainfall is 3.832 mm with monthly average of 319 mm, highest in April
(463 mm) and the lowest in August (171 mm) followed by mean evapotranspiration 1.795 mm/year or about 150
mm/month. The monthly maximum air temperature 34,6°C and minimum 21,8°C with average of 27,8°C. Subsequently,
monthly average of relative humidity is ranging 83,0-87.0% with average 85,9%. Monthly wind velocity is 7,2 m/sec.
highest in May (12,9 m/sec.) and lowest in July (3,6m/sec.). Using rainfall - evapotranspiration approach, water deficit is
in September as much as 89,3 mm but in overall is still surplus of water as much as 1.579 mm/year or in about 131,7
mm/month.
Vegetation
Based on the results of environmental impact assesment document of PT TCM, it is known that the diversity of
plant stage, seedling - sapling - pole - tree is relatively high. For seedlings, the dominant species are Mellastoma sp
(Karamunting), Macaranga triloba (Mahang), Piper aduncum (Siri-siri), Macaranga retiniodes, and Eurycoma longifolia
(Pasak Bumi). Moreover for sapling stage are Mellastoma sp (Karamunting), Macaranga triloba (Mahang), Macaranga
gigantea (Bingkungan), Ptelocolobium dulce (Petai hutan), and Octomeles sumatrana (Binuang bini). For pole stage are
Macaranga triloba (Mahang), Vitex pubescens (Laban), Arenga pinata (Aren), and Eugenia sp (Jambu-jambuan). For
tree stage is dominated by species of Peronema cenescens (Sungkai), Vitex pubescens (Laban), Arthocarpus elasticus
(Terap), Gluta renghas (Rengas), and Trigonopleura malayana.
Mined-out Lands Rehabilitation
Mined-out lands rehabilitation has to be conducted in relation with environmental management efforts to
recover ecological soil function. PT TCM has been keeping the mission to create an added value of rehabilitated mined-
out lands by planting several multipurpose trees species which is not only for ecological function but also trying hard to
increase economic value by planting local tree species. Land reclamation itself is performed in several steps as topsoils
removal-ex-pit backfilling-recontouring-reshaping-topsoils spreading. Subsequently, lands revegatation is performed
through lands preparation-planting-maintenance to support plants growth. Since 2006, PT TCM has been a lot of lands
rehabilitation works pattern by planting cover crops and primary species such as Gmelina, Rubber, Bananas.
Plants Species - Planting Tecchnique - Maintenance
The plants used for field planting trial in this study are consisting of ten species that are Shorea balangeran),
Artocarpus champedens, Entrolobium cyclocarpum, Terminalia catappa, Pterocarpus indicus, Annona muricata, Ficus
variegata, Schima walichii, Peronema canescens, Muntingia calabura. All of plant materials are prepared by Researcher
and also PT TCM. Planting holes, organic fertilizer and dolomite application were done by personels of Rehabilitation
Section (RS) of PT TCM. Subsequently, measurement and plant maintenance are also performed by RS.
Plants Growth Percentages
In overall, ten plant species with 300 plant individu for each and therefore as much as 3.000 plant individu were
planted in third week of October 2011. Based on field observation, it is obtained that growth percentage of plant is
ranging at 66% (Cempedak) to 98% (Kondang). In overall 3.000 plant 84% is survived. From 3.000 planted plants, the
survive plants including replantted plants is 2.525 individu (84%) with lowest survival Cempedak (66%) and Sirsak (70%),
while Sengon butho, Ketapang, Angsana and Kondang are higher than 90%.
Plant Growth
This study uses ununiform plants material of 1-2 years age with relative tall height and young age of 3 months
with small size plants due to limited availability of expected species. Aged plants material are Cempedak, Sengon,
Kondang, dan Sungkai; and the small plants material are Ketapang, Angsana, Sirsak, Puspa, and Kersen. Considering
the ununiformity assessment of plants increament (height and diameter) is expressed in relative value. Plants species
classified fast in growth are Sengon butho, Angsana, Sirsak, Kondang and Kersen wich recorded 1.000% diameter
increament compared to initial diameter. Moreover, plants species is fast in height increament are Ketapang, Sirsak and
Kersen which is recorded 7-9 times increament higher compared with initial height.

GENERAL FORESTRY PROCEEDING OF THE FIFTH INTERNATIONAL SYMPOSIUM OF INDONESIAN WOOD RESEARCH SOCIETY
87
Table-03. Plant Species and Performance at Mined-out Lands Rehabilization in 19 December 2012
No Species Survive Dead
Diameter (cm) Height (cm) Rd
(%)
Rh
(%)
Perfor
manc
e
(%)
Survive (10/2011) (12/2012) (10/2011) (12/2012)
01. Kahoi 239 61 0,53 1,92 134,12 119,20 262 -11 62 80
02. Cempedak 199 101 0,40 1,81 86,76 112,00 353 29 62 66
03. S-butho 290 10 0,44 12,88 90,73 490,42 2.827 441 38 97
04. Ketapang 272 28 0,47 4,72 16,87 182,28 904 980 39 91
05. Angsana 274 26 0,28 6,14 65,78 295,67 2.093 349 48 91
06. Sirsak 209 91 0,14 2,79 14,25 130,55 1.893 816 47 70
07. Kondang 294 6 0,45 7,28 82,96 288,01 1.518 247 40 98
08. Puspa 239 61 0,21 1,99 21,70 98,07 848 352 49 80
09. Sungkai 227 73 0,46 4,04 56,96 168,80 778 196 42 76
10. Kersen 282 18 0,29 7,36 37,85 333,13 2.438 780 45 80
Total 2.525 475
Total 3.000
Using physical strong performance expressed in height-diameter ratio limit = 80, all of species can be
categorized to be strong. However after 14 months planting, the ratio decrease under 50% except Kahoi and Cempedak.
Both of these species is found to grow well. The value of height-diameter ratio limit in 2011 is 212% and 177%
consecutively and in 2012 decrease to be 62%. The main cause of this condition is to much longer in nursery with
uncomfort situation and hard competition of light for growing. At the end of 2012, all of plants spcies show a prospective
growth. The biggest growth diameter and height is owned by Sengon butho.
Initial Soil Condition
Bulk density is ratio of dry soil mass weight to soils volume including soil pores that indicates the soils
compaction and therefore more bigger means more compact soils. In general the value of bulk density is ranging
between 1,1 - 1,6 g/cc (Hardjowigeno, 2003). Soils is quiet compact indicated by average of bulk density 1,69 g/cc in the
range of 1,51 - 1,80 g/cc. The total pores shows that most of soils volume is mineral and organic materials (+ 64%) and
only 36% can be filled with air and/or water. Normally, about 50% of mineral soils volume is filled with air and/or water
and other 50% are mineral and organic materials, and therefore soils compaction must be reduced and increasing soils
pores for supporting plants growth. The common way to increase the proportion of mineral and organic materials is by
adding soils organic materials due to an enough organic materials in the soils could make a better condition and plants
roots can penetrate the soils even in a low available soils water as generally found at mined-out lands. The initial view of
mined-out lands before planting works is shown at Photo-05 and the detail of physical and chemical soils characteristics
is figurized in Table-04.
Photo-05. View of Mined-out Lands After Lands Reclamations Works and Lands Preparation for Revegetation Works

GENERAL FORESTRY PROCEEDING OF THE FIFTH INTERNATIONAL SYMPOSIUM OF INDONESIAN WOOD RESEARCH SOCIETY
88
The laboratory analysis on chemical soils characteristics show that no significant difference of soil fertility status
between upper and lower soils layers. Both of these layers are found being acid with N, P, K very low, moderate CEC
while base saturation is very high. This condition indicates that a high cations absorbtion lead to fertilizers being not
leached easily following water percolation. High base saturation denotes that soils is dominated by base cations (Ca, Mg,
K, NH4, Na), which is good for plants growth due to these cations are needed in a large amount to support plants growth.
Conversely, an acid soils and a very low N, P, K contents should be improved by adding dolomite and NPK fertilizer
application.
Table-04. Physical-Chemical Soisl Characteristics at PUC of Mined-out Lnds Rehabilitation
Description BD
(g/cc)
Total
Pores
(%)
pH
H2O
Nitroge
n
(%)
Carbo
n (%) P2O5 K2O CEC BS
Al
Availa
ble
Soil Layer 00 - 30 cm
Mean 1,69 36,36 4,92 0,05 0,69 7,57 6,66 16,78 74,5 25,5 Maximum 1,80 43,19 6,60 0,13 4,39 15,30 17,14 31,40 100,0 60,5 Minimum 1,51 32,06 4,30 0,02 0,21 4,96 2,85 9,32 39,4 0,0 Deviation 0,07 2,74 0,54 0,02 0,68 2,34 3,51 5,74 13,8 13,8 Criteria - - A VL VL VL VL M VH M
Soil Layer >31 - 60 cm
Mean - - 5,24 0,06 0,82 8,59 7,93 15,93 74,2 25,8 Maximum - - 7,40 0,11 3,30 23,98 20,74 27,47 100,0 73,2 Minimum - - 4,20 0,02 0,15 3,93 3,11 5,40 26,8 0,0 Deviation - - 0,88 0,02 0,77 4,24 4,99 4,73 20,8 20,7 Criteria - - A VL VL VL VL M VH M
Note: A = Acid, VL = Very Low, M = Moderate, VH = Very High
Soil Charateristics Improvement
In many crops culture, soils characteristics improvement is performed as soils show a decline function being
media for plants growth. In this case, soils fertility based chemical characteristics is used as a refference to improve it’s
soils characteritics as nutrients source for plants. Similar to chemical characteristics, if it was found an unfavourable
physical soils characteristics, it is also need to be improved in order root systems able to absorb nutrients for plants
growth. Table-04 shows that both of chemical and physical soils charateristis status are in bad condition and therefore
considered to be improved whether before and after plantings.
Soil Acidity (pH)
There are a lot of soils characteristics being worse due to low soil acidity compared with the favourable range
for plants growth as neutral acidity. In neutral range acidity, most of nutrients are easily soluted into water and also easily
absorbed by plants. A lot of Aluminium ion is found at acid soils due to Phospor ion fixation and being toxic to plants. And
also, micro nutrients are easily soluted at acid soils reaction and will be accumulated. In the condition of soil acidity close
to neutral, the maximum avaliable phospor and micro nutrients solubility will decline. The bactery is well developed at pH
5.5 or more and will restricted at lower pH 5.5. The nitrogen fixation bactery and nutrification bactery are only develop at
pH 5.5 or more, and therefore addition of dolomite should be applied at acid soils.
Reffering to Table-04, both of average pH at upper (4.92) and lower (5.24) soils layer are found to be acid. To increase
pH is done by adding dolomite two weeks before planting with the amount based on exchangable Aluminium (e-Al).
Dolomite addition as much as 1.5 e-Al is able to nuetralize 85-90% e-Al containing 2-7% organic materials. If soils
contain a higher organic materials, dolomite should more be added due to ion H+ released by organic materials or Fe and
Al hydroxide. Table-04 also shows that organic materials is categorized to be low (0.69%) and therefore added dolomite
is 1.5 e-Al or equal to 0.5 kg/plant. In relation with base saturation which is categorized to be high, dolomite application
might be not a proper aplication, however it is rather than soils nutrients defficiency but due to high soils acidity. Soil
acidity improvement is indicated by increasing pH in both upper (0-30 cm) and lower (>30-60 cm) soil layers whereas the
initial acidity status is acid (A) and changed into neutral (N) (Figure-02).

GENERAL FORESTRY PROCEEDING OF THE FIFTH INTERNATIONAL SYMPOSIUM OF INDONESIAN WOOD RESEARCH SOCIETY
89
Figure-02.The Increase of Soil pH 14 Months After Dolomite Application
Macro Nutrients Content (N, P, and K)
The content of N, P, and K nutrients are very low and therefore applied with complex fertilizer of NPK
(16:16:16) in a dosage of 50 g, 100 g, 150 g per plant. NPK (16:16:16) is applied after plants reach 3 months in age,
which is aimed to make a nutrients balance of plant requirements and the need of immediate additional nutrients to
support vegetative growth at the initial plant growth. The form of N of which imediately able to be used by plants is
anorganic N supplied by chemical fertilizer. Organic decomposition produces humus will increase cation and anion
absorption capacity. Moreover, absorbed cations and anions are not easily lost by leaching process and easy to be
relased when they are needed by plants. The more available humus leads to a more efficient of soils fertilization.
Table-05. Macro Nutrients Content (N, P, and K) Post Fertilizer Application
No. Nutrients Initial Post Fertilizer Application
(T1) (T2) (T3) (T4)
Upper Soil Layer (00-30 cm)
01. Nitrogen (%) 0,05 0,04 0,03 0,05 0,04
02. Phospor (ppm P2O5) 7,60 21,70 27,40 30,60 27,60
03. Kalium (ppm K2O) 6,70 60,90 49,70 63,70 64,30
Lower Soil Layer (>30-60 cm)
04. Nitrogen (%) 0,06 0,05 0,04 0,05 0,06
05. Phospor (ppm P2O5) 8,60 29,80 23,40 30,00 32,50
06. Kalium (ppm K2O) 7,90 59,90 45,80 61,30 74,50
In case of N, there is no increase of it’s content in one year after soils fertilization of all treatments, even for T1,
T2, and T4 the content of N is lower than before soils fertlization. In most of all treatments except T1, the content of P
and K increase in line with soils fertilization in a dosage of 50 g, 100 g, 150 g per plants. The P and K contents at T1 are
obtained similr with T3. In spite of the fetrilization is done at the soils upper layer of + 10 cm depth but the influence reach
until lower soils layer (Table-05).
Soil Bulk Density
Soils compaction is indicated by bulk density (BD) value, the more bigger BD means more compact soils and
therefore roots is likely difficult to penetrate into soils of which also difficult to make a better water drainage. Lands
preparation using heavy equipments tends to disturb soils structures and reduce soil pores. Soil pores itself is influenced
by organic materials content, soil structres and textures. Soil structures formation is significantly influenced by the
existing organic materials bounding soil particles. To reduce the soil compaction, soil improvement is performed by
adding organic compos as much as 20 kg at the initial satage before planting and 10 kg at one year after. Soil
compaction monitoring shows a decreasing compaction of which indicated by it’s bulk density.
Soils Improvement and Plants Growth
4,9
6,4 6,4 6,4 6,7
5,2
6,5 6,4 6,5 6,9
Initial T1 T2 T3 T4
Treatment
Increasing pH After Dolomite Application
00 - 30 cm 30 - 60 cm

GENERAL FORESTRY PROCEEDING OF THE FIFTH INTERNATIONAL SYMPOSIUM OF INDONESIAN WOOD RESEARCH SOCIETY
90
Diameter Increament
The influence of treatments on to biggest diameter increament of each species can be described that Sengon
butho, Ketapang, Puspa, Sungkai, and Kersen are at T3, while Kahoi and Kondang at T4. Other species of Cempedak
and Angsana at T1 and T2 (Figure-03) and the field performance can be seen at Photo-05.
S-01 - Shorea balangeran (Kahoi)
September 2011 December 2011 September 2012 December 2012
S-02 - Artocarpus champedens (Cempedak)
September 2011 December 2011 September 2012 December 2012
S-03 - Enterolobium cyclocarpum (Sengon Butho)
September 2011 December 2011 September 2012 December 2012
S-04 - Terminalia catappa (Ketapang)
September 2011 December 2011 September 2012 December 2012
S-05 - Pterocarpus indicus (Angsana)
September 2011 December 2011 September 2012 December 2012

GENERAL FORESTRY PROCEEDING OF THE FIFTH INTERNATIONAL SYMPOSIUM OF INDONESIAN WOOD RESEARCH SOCIETY
91
S-06 - Annona muricata (Sirsak)
September 2011 December 2011 September 2012 December 2012
S-07 - Ficus variegata (Nyawai)
September 2011 December 2011 September 2012 December 2012
S-08 - Schima walichii (Puspa)
September 2011 December 2011 September 2012 December 2012
S-09 - Peronema canescens (Sungkai)
September 2011 December 2011 September 2012 December 2012
S-10 - Muntingia calabura (Kersen)
September 2011 December 2011 September 2012 December 2012
Photo-05. View of Plant Height Increament at Study Site of PT TCM, West Kutai, East Kalimantan

GENERAL FORESTRY PROCEEDING OF THE FIFTH INTERNATIONAL SYMPOSIUM OF INDONESIAN WOOD RESEARCH SOCIETY
92
Figure-03. Relative Height (rh) and Diameter (rd) Increament of Plants 14 Months After Soil Fertiliztion
Concerning to the influence of treatments on to height increament, the biggest increament of Sengon butho,
Sungkai and Kersen are at T3, Ketapang, Sirsak, Kondang and Puspa at T4, while Cempedak and Angsana at T1.
Descriptive analysis of both diameter and height increaments show that most of all species - except Cempedak and
Angsana, still responsive to soils fertilization. This might be due to these species needs a large amount of nutrients to
grow as also they are classified as fast growing species. Bad quality of plant materials of Kahoi and Cempedak because
of too long kept at nursery and being stressed growth before planting in the field. However, at the last monitoring in
December 2012, there is a recovery performance on their growth indicated by several new leafs growing at the tops of
their branches.
Soil Erosion Potential
Process and Mechanism
In general, soil erosion can be defined as a movement of soil mass from a site to other lower sites transported
by flowing water or winds due natural process or human activities. Concerning to this process, they can be classified into
geological or accelerated erosion. Normal erosion is a soil mass movement occurred at the natural condition such as
eroded soil mass at slopes and/or hills. Rainfall, wind, slopes and undisturbed land surfaces are factors influencing
erosion proccesses. In this stage, erosion makes a dynamic equilibrium in which the solum depth being relalively stable.
This disturbed equilibrium is mostly caused by human activities tending to accelerate erosion rates. Soil erosion caused
by main agent of water covers several procceses of soil detachment - dissaggregtion - dispersion - particles
transportation, and eroded soils mass deposition. In the soil erosion occurrences, whether natural or accelerated, there
are at least five factors causing the magnitude of soil erosion rate, that are climate, soils, topography, vegetation, and
human being.
The climate element has significant influence to soil erosion is rainfall (precipitation), while physical soils characteristics
closely related with soil erosion are texture, structure, infiltration - rate and capacity, and organic material contents. Soil
texture controls water flow in the soils in form of infiltration rate, plants root penetration and water holding capacity. The
occurrence of overland flow is highly depends on infiltrtation capacity and soil permeability. Landform topography has a
significant role in relation with the velocity and volume of overland flow or surface runnof.
-11
29
441
980
349
816
247 35
2
196
780
262 353
2827
904
2093
1893
1518
848
778
2438
rhi-% rdi-%

GENERAL FORESTRY PROCEEDING OF THE FIFTH INTERNATIONAL SYMPOSIUM OF INDONESIAN WOOD RESEARCH SOCIETY
93
Photo-06. Condition of Mined-out Lands After Rehabilitation Works (Reclamation and Revegetation
Photo-07. Initial Growth of Land Cover and Soil Erosion 3 Months After Revegetation Works
Regarding to topography, the length and slope have an important role to soil erosion. The more steep and
more length of slope, the velocity and volume of overland flow will be more bigger and finally increasing the soil erosion
hazard. On the other hand, vegetation is opposite to erosive influence forces such as intercepting raindrops energy,
reducing velocity and volume of overland flow and also increasing soil stability. In general, it is well known that human
activities are most important factors causing a huge mass of soil erosion related with land clearing for settlements,
agricultural lands, ect. Landform changes and tillage followed by soil fertilization influence the soil structures. Land
clearing creates an initial condition to the occurrence of a large scale soil erosion causing the balance of soil formation
and soil erosion. However, human being also plays an important role to conserve soils from erosion disturbance through
various soil conservation activities such as revegetation including mined-out lands rehabilitation.
Muntingia calabura Schima walichii Ficus variegata
Annona muricata Pterocarpus indicus E.cyclocarpum

GENERAL FORESTRY PROCEEDING OF THE FIFTH INTERNATIONAL SYMPOSIUM OF INDONESIAN WOOD RESEARCH SOCIETY
94
20
10
2
01
1
Site LT <2T 2-4T 4-6T >6T LO
SMO (VH) (L) (M) (M) (VL) (VL)
BMO (VH) (L) (L) (VL) (VL) (VL)
LMO (VH) (VH) (M) (L) (VL) (VL)
Site LT <2T 2-4T 4-6T 6-8T 8-10T LO
SMO (VH) (L) (M) (M) (VL) (VL) (VL)
BMO (VH) (L) (L) (VL) (VL) (VL) (VL)
LMO (VH) (VH) (M) (L) (VL) (VL) (VL)
Site Terbuka <2T 2-4T 4-6T 6-8T 8-10T >10T LO
SMO (VH) (H) (L) (L) (VL) (VL) (VL) (VL)
BMO (VH) (M) (L) (L) (VL) (VL) (VL) (VL)
LMO (VH) (H) (H) (VL) (VL) (VL) (VL) (VL)
S, B, L - MO: Sambarata, Binungan, Lati Mining Operation, VL = Very Low <15 Ton/ha/Year, L = Low (15-60
Ton/Ha/Year), M = Modeate (60-180 Ton/Ha/Year), T = High (180-480 Ton/Ha/Year), VH = Very High (>480
Ton/Ha/Year).
Figure-04. Schematic Indication of Dynamic Soil Erosion Potential and Erosion Hazardous Index Based on Vegetation
Cover Development at Mined-out Lands
Reffering to the physical soil erosion form in the field, soil erosion occurrences are generally classified as
splash rosion, overland flow erosion, riil erosion, channel erosion, gully erosion, streambank erosion, and internal or sub-
surface erosion. Field observation on mined-out lands revegetation is shown at Photo-06 and Photo-07, as a field
recording after mined-out lands reclamation (backfilling - recontouring - reshaping - topsoils spreading), land revegetation
(land preparation - planting and 3 months development). From the field observation, it is learned that expected soil
erosion reduction is land coverage at the initial stage of revegetated lands by growing various land cover crops.
As a specific refference, the research at PT Berau Coal (2010-2012) indicates that soil erosion potential related
with vegetation cover development (Figure-04) showing that the status of Erosion Hazardous Index (EHI) at the open
lands is very high (VH) during 2010-2011 years. In line with vegetation cover until 4-6 years age, the EHI declines to be
very low (VL) - low (L) - moderate (M). Reaching the age of > 6 years the EHI is very low (VL). Indeed this estimation is
being an indicative parameter and will vary under local specific condition such as rainfall - land slopes - rate of land
coverage - vegetation maintenance - practical soil conservation. Several factors supporting the successfulness of
revegetation works in line with soil erosion potential reduction, the most possible factor to be managed are slope, land
prepartion and the intensity of vegetation maintenance. It also has to be well understood that lands is an synergitical
aggregate factors of landform, geology, soil, hydrology, climate, flora-fauna, and its allocation usage. Therefore, land
recovery is not only related with soils recovery but also the recovery of other components (micro-climate, hydrology, flora-
fauna ect.).
Dynamic of Soil Erosion Potential
The phenomenon of soil erosion dynamic might be analyzed based on principles of phylosopy and functional
relationship between soil erosion magnitude and important influencing factors. The development of vegetation cover is
considered to be one of the most significant and important factor related with soil erosion at mined-out revegetated lands
(Photo-08). Basically, lands disturbance e.g. mined-out lands is initially started with soils disturbances such as disrturbed
soils structure and pores followed by other soils characteristics and even components forming lands. It is therefore the
assessment of soil recovery should be based on pedogenesis - natural procces of soil forming and edaphologic - growth
media function of biomass production points of view.
20
12

GENERAL FORESTRY PROCEEDING OF THE FIFTH INTERNATIONAL SYMPOSIUM OF INDONESIAN WOOD RESEARCH SOCIETY
95
Photo-08. Growth of Plants, Land Cover and Soil Erosion 14 Months After Revegetation and Maintenance Works
Land reclamation followed by revegetation works is an effort to accelerate lands recovery and have to be
supported all of needed works. Basic requirement for soils function as plants growth media are being roots system
development site for supplying soils nutrition to plants. Lands reclamation works are performed by providing soil materials
depth, recontouring proper landslope to guarantee proper overland flow drainage, whereas soils aeration and available
soils nutrients are done in line with revegetation works. Soil erodibility is very high at open lands and decline following
vegetation growth. To enhance a very low soil erosion potential depends on factors influencing it’s successfulness. The
most possible factors to be fully managed are slopes forming, land preparation and the intensity of vegetation
maintenance works.
Topography has an important role in determining velocity and volume of overland flow. Comparing those
factors, landform slope is more important than it’s slope length due to flowing water velocity and it’s energy to transport
materials will increase following a more steep landforms. Threfore, the more slope steep and longer slope length will
increase accumulated volume and the velocity of overland flow. It is found that soil erosion potential at revegetated
mined-out lands decreasing from open lands - VH following the vegetation growth - H - M - L - VL consecutively. High soil
erosion potential at open lands is due to lack of vegetation cover and low infiltration capacity. Direct raindrops on land
surfaces causes soil particles dissaggregation - dispersion and possibly transported by overland flow along landslope into
lower sites. Basically, soil erosion potential reduction might be done by intercepting direct raindrops and controlling
overland flow. In the vegetative approach, planting of land cover crops might be performed while for physical -
mechanical approach by constructing drainage networks. The EHI status at revegetated mined-out lands tends to
decrease of which susceptibilitically indicating raindrops interception and increasing lands surfaces infiltrating exessive
rainfall.
To retain and increase vegetation cover, the most possible way is by managing revegetated mined-out lands
intensively. Practically, it might be performed by vegetation maintenances (replanting dead trees, fertilization, weeds and
phatogen controls, enrichment planting) to guarantee the existence of revegetated mined-out lands. Subsequently, this
also considers some facts that the status of EHI (Very Low) due to interception of direct raindrops and overland flow
control by developed vegetation growth favouring a faster infiltration rate and higher infiltration capacity. Indicatively,
enhancing EHI status of VL - L - M needs time at least 5 - 6 years after proper revegetation works.
Mined-out Lands Recovery

GENERAL FORESTRY PROCEEDING OF THE FIFTH INTERNATIONAL SYMPOSIUM OF INDONESIAN WOOD RESEARCH SOCIETY
96
Direction of Expected Development
Perkembangan
Lands Reclamation and Revegetation
Land rehabilitation (reclamation, revegetation) have to be conducted at mined-out lands to recover being a
productive lands based on it’s status and allocation usage. Performing such lands rehabilitation needs specific knowleges
and experiences related with soil development, rehabilitation techniques, species site matching, and vegetation
maintenance. Open pit system produces a mass disposal of over-burden and inter-burden which is then used to fill
mined-out pits. After backfilling process, most of dumping materials is in condition of wreak or disturbed structure and
pores and could be a mass of wreaks in these dumping materials. However, some time also unavoidably mixed with dirty
coal and almost any organic material. This condition leads to bad drainage system and low water holding capacity, highly
compacted soils followed by a high temperature. The main problem is that backfilled mined-out lands not fully ready to
support plants growth and uncontrollable high overland flow followed by high soil erosion rate. In relation with planting,
species site matching, planting techniques and its procedures for maintenance are also still needed to be achieved.
Land Recovery
Naturally, lands is an elements aggregate of land form, geology, soils, hydrology, climate, flora-fauna and its
specific usage alocation. For this reason, lands recovery is not only concerned with soils recovery itself but also recovery
of other elements. Mined-out lands disturbance is generally initiated by soils disturbance as of soil structures, pores and
followed by other soil characteristics and also other elements disturbance. For this reson, lands recovery assessment
have to be initiated with soils recovery viewed from pedogenesis and edaphological aspects. This means that lands
recovery is not only asessed from natural forming process but also the main function as plants growth media and it’s
productivity.
Reclamation works followed by revegetation is an effort to accelerate land recovery process. As far as soils
function works as plant growth media, it will guarantee to the availability of aeration and drainage for roots system to
penetrate and providing nutrients needed by plants. In reclamation works, it is done by constructing the depth or
thickness of soils materials overlay overburden layers. Increasing soil aeration can be instantly done by applying organic
fertilizer, lands cover crops or other soil conditoners. Moreover, soils nutrients need for supporting plant growth can be
provided by organic fertilizer application.
Lands recovery acceleration might be achieved if the minimum requirements is fulfilled. As a plant growth
media, the thickness of soil materials have to be depth enough to support root system function activities and creating a
proper soil drainage condition. Mined-out lands revegetation with annual plants generaly needs 50 cm thikness of
materials soils and free mixed other materials. However, it is well known to be quiet difficult due to in the field has been
unavoidable mixing with overburden and/or fine coals. Also, bad soil drainage is found indicated by trapped surface water
at severals spots of land surfaces.
The existing degraded lands in the field can be observed from it’s physical characteristics such as lack of
vegetation cover, moslty eroded topsoils layer due erosion caused by surface runoff or overland flows. Facing such
existing degraded lands, single or combination betwwen phyisical-mechanical and vegetative approaches migh be
applied in rehabilitation works. One of selected refference, the field experience study of observation - monitoring -
analysis on the dynamic of soil erosion potential at PT Berau Coal - one of a leading coal mining company (2010-2011)
might be refferred in mined-out lands rehabilitation to achieve lands recovery as is shown at Figure-05.
Site Erosion Hazardous Index (EHI)
OL <2Y 2-4Y 4-6Y 6-8Y 8-10Y >10Y OrLand
SMO (VH) (H) (L) (L) (VL) (VL) (VL) (VL)
BMO (VH) (M) (L) (L) (VL) (VL) (VL) (VL)
LMO (VH) (H) (H) (VL) (VL) (VL) (VL) (VL)
Note:
S, B, L - MO: Sambarata, Binungan, Lati Mining Operation, VL = Very Low <15 Ton/ha/Year, L = Low (15-60
Ton/Ha/Year), M = Modetate (60-180 Ton/Ha/Year), H = High (180-480 Ton/Ha/Year), VH = Very High (>480
Ton/Ha/Year).
Figure-05. Scheme of Soil Erosion Potential Dynamic Based on Development on Lands Vegetation Cover

GENERAL FORESTRY PROCEEDING OF THE FIFTH INTERNATIONAL SYMPOSIUM OF INDONESIAN WOOD RESEARCH SOCIETY
97
As mentioned before, magnitude of soil erosion potential is influenced by main factors of rainfall erosivity, soil
erodibility, length and slope, vegetation cover, and the application of soil and water conservation practices. The dynamics
of lands vegetation cover is a significant factor in relation with the soil erosion dynamic at mined-out lands. In line with it’s
vegetation cover development in 4-6 years, KBE status decreases from VH to VL - L - M. When the vegetation reaches >
6 years in age, KBE decreases into VL. These KBE decrease indicate that management of mined-out lands related with
it’s expected recovery have to be intensively performed at least at the first 5 years after revegetation works. Specifically,
lands recovery efforts have to pay much attention on slope construction and lands preparation at reclamation step, and
the intensity of plants management covering species selection, planting techniques and plants maintenance.
The initial works of lands rehabilitation based on physical-mechanical approahes combined with vegetative
approach are to control surface runoff/overland flows, especially at lands with hard topography. It is aimed in order the
force of surface runoff can be properly controlled and the transportability of eroded soil particles being significantly
decrease. This can be done by cutting the slope length to reduce surface runoff velocity and as far as possible directing
into designed places to undisturb mined-out lands. The surface runoff control actualy depends on it’s physical-
mechanical function. If surface runoff can be successfully controlled, it will make possible condcuting lands preparation
followed by planting at available planting areas of mined-out lands.
Vegetation plants is expected to grow and developing crown trees to intercep direct rainfall force and therefore
reducing it’s rainfall drops energy, covering lands surfaces and increasing the possibility of rainfall water reached lands
surface to infiltrate into the soils, anf finally surface runoff savely flowing over the lands. One of the important thing is that
nutrients lost can be avoided and the soils nutrients being retained. If vegetation plants grow well will promote nutrients
cycle and leading to recovery at mined-out lands by accumulating organic materials forming topsoils. For the next step if
the developed plants still not fully match with in function as expected before, it is possible to change or enrich with other
expected plants species. The principles of mined-out lands mentioned above should be performed step by step
consecutivelly and needs enough time to succeed. Each step of mined-out lands rehabilitation will be important and
being foundation for the next effort step of it’s land rehabilitation.
CCoonncclluussiioonnss 01. As much as 3000 individual plants studied, the survived plants including replanting is 2.788 individu (93%) with the
lowest Cempedak (84%) and Sungkai (86%). Best physical performance in the field are Kersen, Ketapang and Sirsak while the worse are Kahoi, Cempedak and Angsana;
02. Soils is found to be very compact with average BD 1,68 g/cc (1,51-1,80 g/cc). Most of soils volume (64%) is mineral and only 36,36% filled with air and water. There is no difference in chemical soils fertility status between upper and lower soil layers and both layers are acid with very low N, P, K contents, moderate CEC and very high base saturation. Soils acidity increases by adding dolomite 0,5 kg/plant and changing status from acid into close to neutral;
03. The application of NPK (16:16:16) with 150 g/plant dosage does not change N status in the soils while 50 g/plant dosage changing P and K status from very low to very high;
04. Increasing nutrients lost at open mined-out lands is due to high volatyle N and it’s mobility while for P and K changing can be compensated by organic fertilizer application;
05. Organic fertilizer application 20 kg/plant is due to reduce soils compaction and at the same time increasing soils pores and CEC and water contents. Field observation indicates that organic fertilizer causing a large influence upon plants growth due to a better physical soils characteristics and therefore root system functioning properly;
06. All of soil fertilization treatments by applying NPK (16:16:16) increase P and contetns but not for N in soils. The dosage of 100 g NPK (16:16:16) per plant (T3) increases a maximum plant height and diameter of Sengon butho, Sungkai and Kersen, and for Ketapang and Puspa diameter only. Dosage of 150 g NPK (16:16:16) per plant (T4) similarly increases a maximum plant height and diameter of Sirsak and Kondang, while for Kahoi (diameter) and for Ketapang and Puspa (height). Until 14 months plant age, all plants are still responsive to fertilization application except Cempedak and Angsana;
07. Soil erosion potential at open mined-out lands is very high due to lack of vegetation cover, low infiltration capacity and a high overland flow/surface runoff. Subsequently, at revegetated mined-out lands tends to decline into very low - moderate range, indicating there is an interception raindrops energy and increasing infiltration capacity;
08. To achieve a very low soil erosion potential at revegetated mined-out lands needs an effective time at least in about 5-6 years. The most important factors highly possible to be consistently managed are reclamation works (recountouring, reshaping) and revegetation works (plants maintenance);
09. The phenomenon of soil erosion potential dynamic is depend on influencing factors upon soil erosion occurences that are rainfall erosivity, soil erodibility, landform slope and lenths, vegetation cover, practical soil and water conservation. Development of vegetation growth cover is the most significant factor related with the soil erosion dynamic at revegetated mined-out lands.

GENERAL FORESTRY PROCEEDING OF THE FIFTH INTERNATIONAL SYMPOSIUM OF INDONESIAN WOOD RESEARCH SOCIETY
98
RReeccoommmmeennddaattiioonn 01. Additional organic materials application should be continued in the proper amount to reduce soils compactness,
increasing soils pores and water contents; 02. Considering a very low contents of N, P, K nutrients and it’s increasing need, the dosage of N fertilizer should be
added in amount to increase N contents as fast as possible. Meanwhile, the recommended dosage of NPK (16:16:16) for Sengon butho Sungkai, Kersen, Ketapang, and Puspa is 100 g/plant, whereas for Sirsak, Kondang and Kahoi 150 g/plant, and for Angsana and Cempedak is 50 g/plant;
03. Considering that reducing soils erosion rate is performed by intercepting raindrops and controlling overland flow, the practical alternatives based on vegetative approch is by planting land cover crops - fast growing trees - annual plants, while for physical and mechanical based approach is by preparing drainage networks with proper capacities;
04. To realize and retain the intensity of land covers for reducing soils erodibilty requiers an intensive maintenance of revegetated mined-out lands by performing vegetation growth and development management. It will be more effective in line with prior to proper slope and length preparation in mined-out lands reclamation works.
RReeffeerrrreenncceess Arsyad, S., 2006. Konservasi Tanah dan Air. IPB Press. Bogor
Bradshaw, A.D. 2002. Introduction and Philosophy. Perrow and A.J. Davy (eds). Handbook of Ecological Restoration. Vol
1: Principles of Restoration. Cambridge University Press, The Edinburgh Building, Cambridge CB2 2RU, UK.
Buckman, H.O. dan N.C. Brady. 1982. Ilmu Tanah. Alih Bahasa: Soegiman. Bharata Karya Aksara, Jakarta. 788 h.
Foth. H.D. 1998. Dasar-dasar Ilmu Tanah. Alih Bahasa: Purbayanti E.D; D.W. Lukitawati dan R. Trimulatsih. Edisi
Ketujuh. Gajah Mada University Press, Yogyakarta. 295 h.
Hardjowigeno, S.1987. Ilmu Tanah. Edisi Revisi. PT. Mediyatama Sarana Perkasa, Jakarta. 233 h.
Hartati, W., Sudarmadji, T., Syafrudin, M., 2010. Pemantauan Dinamika Mikroklimat dan Tingkat Kesuburan Tanah serta
Potensi Erosi pada Lahan Revegetasi Pasca Tambang PT Berau Coal.
Hartati, W., Sudarmadji, T., Syafrudin, M., 2011. Pemantauan Dinamika Mikroklimat dan Tingkat Kesuburan Tanah serta
Potensi Erosi pada Lahan Revegetasi Pasca Tambang PT Berau Coal.
Hartati, W., Sudarmadji, T., Syafrudin, M., 2012. Pemantauan Dinamika Mikroklimat dan Tingkat Kesuburan Tanah serta
Potensi Erosi pada Lahan Revegetasi Pasca Tambang PT Berau Coal.
Peraturan Menteri Kehutanan Nomor P.70/Menhut-II/2008 tanggal 11 Desember 2008 tentang Pedoman Teknis
Rehabilitasi Hutan dan Lahan, disempurnakan dengan Permenhut No.26/Menhut-II/2010 Tanggal 1 Juni 2010.
Peraturan Menteri Kehutanan Republik Indonesia Nomor: P.12/Menhut-II/ 2011 tentang Pedoman Penyelenggaraan
Rehabilitasi Hutan dan Lahan Tahun 2011.
Peraturan Pemerintah Nomor 76 Tahun 2008 tentang Rehabilitasi dan Reklamasi Hutan.
PT Berau Coal, 2009. Rencana Penutupan Tambang tahun 2025 PT Berau Coal.
Rahmawaty, 2002. Restorasi Lahan Bekas Tambang berdasarkan Kaidah Ekologi, Fakultas Pertanian, Universitas
Sumatera Utara, Medan.
Ruhiyat, D. 1999. Potensi Tanah di Kalimantan Timur, Karakteristik dan Strategi Pendaya-gunaannya. Fakultas
Kehutanan Universitas Mulawarman, Samarinda. 46 h.
Tan, K.H. 1998. Dasar-dasar Kimia Tanah. Alih Bahasa: Goenadi, D.H. Gajah Mada Univ. Press, Yogyakarta. 295 h.

POSTER PRESENTATION PROCEEDING OF THE FIFTH INTERNATIONAL SYMPOSIUM OF INDONESIAN WOOD RESEARCH SOCIETY
99
The Areal Number Density Of Vascular Bundles Strongly Correlates With The
Mechanical Properties Of Oil Palm Wood (Elaeis guineensis Jacq.)
Rattana Choowang1*
1*Faculty of Science and Technology Prince of Songkla University, Surat Thani Campus
Mueang, Surat Thani 84000, Thailand E-mail: [email protected]
Abstract
Currently most oil palm trunks in Thailand are left on the field to rot or are burnt in the field, not utilized as lumber. To
promote such value-added uses, the objective of this study was to characterize the levels and variation within oil palm
trunks of their key mechanical properties. In addition, the vascular bundle population was assessed, because this
structural characteristic affects density and mechanical properties, the key ones being here modulus of rupture (MOR),
modulus of elasticity (MOE) and hardness. The 25 years old oil palm trunks were selected from a palm plantation in
Surat Thani province, in southern Thailand. The trees were cut down at 500 mm above ground, cut into dices, then sawn
into small pieces in radial direction. Vascular bundle populations and basic densities were determined. Oil palm lumber
was sawn from the logs between wood dices and their mechanical properties determined. The results indicate the
vascular bundle population density gradually decreased towards the central axis of trunks, and the population density
positively correlates with basic density and mechanical properties. This is because the main component of a vascular
bundle has fibers with thick cell walls. The data obtained may help select or create products that match the properties of
oil palm wood (Elaeis guineensis Jacq.), or contribute to the sorting of wood raw material based on for example machine
vision.
Keyword: oil palm wood, vascular bundle, basic density, mechanical property
Introduction
Oil palm trees (Elaeis guineensis Jacq.) are important non-forest agricultural plants that may provide alternative
raw material for the wood industries. In Thailand, oil palm plantation areas have expanded from 329,120 hectares in
2003 to 690,560 hectares in 2012, providing palm oil for food and renewable energy. More than 90% of total plantation
area in Thailand is in its southern peninsular part, especially in Surat Thani, Krabi and Chumphon provinces (Office of
agricultural economics 2012). When the oil palm trees are past their economic life at 25 to 30 years old, the trunks range
from 15 to 18 meters in height and 45 to 60 centimeters in diameter. They are felled to make room for replanting, and
normally left to rot or burnt down in the field (Katemanee 2006). Presently oil palm trunks are not a raw material for wood
industries, due to low density and poor mechanical properties compared to other commercial wood species from agro-
forestry, such as rubberwood (Ratnasing and Ioras 2010). An oil palm trunk contains 31.70% to 47.30 % cellulose,
21.20% to 34.40 % hemicelluloses, and 18.40% to 29.60% lignin (Kaida et al. 2009; Yuliansyah et al. 2010; Chin et al.
2010; Verman and Saka 2011). The middle and core parts of trunk are 12.19% to 17.17% starch and have high free
sugar in sap (Yamada et al. 2010; Hashim et al. 2011). Especially in Thailand these glucose based reserves in oil palm
trunks have been studied for fermentation to produce bio-ethanol and hydrogen renewable energy (Punsuvon et al. 2005;
Hniman et al 2011). However, the oil palm wood taken from the bottom peripheral zone of stem can be used in furniture
and in non-structural construction components (Ratnasingam and Ioras 2010). Previous studies report that the utilization
of oil palm wood as lumber or laminated wood is difficult, because the product quality is affected by variation of physical
and mechanical properties within trunk (Ratnasingam et al. 2008; Feng el at. 2011). The oil palm tree is a
monocotyledon, and its main structure consists of vascular bundles embedded in parenchyma cells. The vascular
bundles are the mechanical support and serve as a conduits for the transportation of water and nutrients in the trunk.
Their number density per volume decreases towards the axial center, and increases in the trunk from the ground towards
top of the tree (Erwinsyah 2008).Therefore, the objective of this study was to clarify the relation of vascular bundle
population density with basic density and some mechanical properties of oil palm wood. The results may help rapidly
estimate the mechanical properties of oil palm wood samples, and help with such selective use of oil palm wood that the
quality control problems mentioned above are ameliorated.

POSTER PRESENTATION PROCEEDING OF THE FIFTH INTERNATIONAL SYMPOSIUM OF INDONESIAN WOOD RESEARCH SOCIETY
100
Materials and methods
Oil palm trees 25 years of age were harvested from a local plantation in Surat Thani province, in southern
Thailand. The trees were cut down at 500 mm above ground, and cut into 60 mm thickness dices alternating with 1 m
logs, as shown in Fig. 1. The oil palm dices were sawn into long pieces in the radial direction from pith to bark of trunk,
60 mm wide in tangential, and stored in plastic bags to avoid loss of moisture. The vascular bundle population density
and the basic density were determined from these pieces. The logs between wood dices were sawn to lumber for
mechanical property testing.
Fig.1 A schematic illustration of conversion of an oil palm trunk to the samples studied for vascular bundle population
density, basic density, and mechanical properties.
The green oil palm woods which cut from dices were photographed from trunk axis to bark, using a stereo
microscope, and the vascular bundles were counted from the images. Then, the same wood samples were cut to small
20 mm (tangential) x 20 mm (radial) x 25 mm (longitudinal) pieces to determine basic density profile, similarly from axis to
bark. These green samples were measured in radial, tangential and longitudinal directions with a digital caliper to the
nearest 0.01 mm, weighed to nearest 0.01 g, and oven-dried at 103+ 2 ๐C to constant weight. Finally, the oven-dry
weights to nearest 0.01 g were determined after cooling in desiccator. The basic density was calculated from the ratio of
the oven-dry weight (g) and volume in green condition (cm3).
Oil palm logs were sawn into 50 mm thick lumber using a polygon sawing pattern (Baker et al. 2006), to
separate the wood to inner, middle, and outer zones, that match the distribution of vascular bundles. The green lumber
was air dried to a moisture content of 8-12%, and then planed and cut to 20 mm (tangential) x 20 mm (radial) x 300 mm
(longitudinal) samples for static bending (modulus of rupture, MOR and modulus of elasticity, MOE), and to 20 mm
(tangential) x 20 (radial) x 60 mm (longitudinal) samples for Janka type hardness test. All samples were conditioned in
ambient 20๐C temperature and 65% relative humidity until equilibrium moisture content, before the mechanical properties
were determined using a universal testing machine. The testing of mechanical properties followed BS 373 standard (BS
373 1957) with slight modifications.
Results and discussion
Microphotography of wood anatomy, using a stereo microscope, showed that the vascular bundles were
unevenly distributed across the trunk, and surrounded by parenchyma cells. The population density incresed radially
from 23 Vp/cm2 at the axial center to 115 Vp/cm2 near bark, and varied by height along the trunk. The graph in Fig. 2
indicates a close relationship between this number density and basic density that increased from 0.11 g/cm3 at the center
to 0.40 g/cm3 near bark. The vascular bundles are mostly fibers with thick cell walls, and this thickness was 8.08 µm at 2
m height. In addition, the thin walled parenchyma cells have a higher moisture content (Erwinsyah 2008; Sitti Fatimah et

POSTER PRESENTATION PROCEEDING OF THE FIFTH INTERNATIONAL SYMPOSIUM OF INDONESIAN WOOD RESEARCH SOCIETY
101
al. 2012). Therefore, the oven-dry weight of oil palm wood at high the percentage of vascular bundles is high after their
loosed the water in cell. This is the reason for the strong correlation with basic density.
Fig. 2 Microphotographs of inner, middle, and outer zones (a), and the relationship of radial profiles of vascular bundle
density and basic density of oil palm wood, at various heights along the trunk (b).
Fig. 3 Modulus of rupture, Modulus of elasticity (a), and Hardness (b) of oil palm wood in inner, middle and outer zones of
the trunk.
The results in Fig. 3 showe that the overall mechanical properties of oil palm wood improve outwards from the
axis. The average modulus of rupture, modulus of elasticity and hardness of outer zone had the highest values at 26.20
MPa, 4861.49 MPa and 1342.10 kg, respectively. Those properties were, in the same order, decreased to 8.76 MPa,
1711.39 MPa and 486.10 kg for the middle zone, and further to 5.73 MPa, 516.53 MPa and 223.60 kg for the inner zone.
The areal number density of vascular bundles in the outer zone ranged from 68 Vp/cm2 to 115 Vp/cm2, and in the middle
and inner zones from 44 Vp/cm2 to 58 Vp/cm2 and from 23 Vp/cm2 to 40 Vp/cm2, respectively .
0
1000
2000
3000
4000
5000
6000
0
5
10
15
20
25
30
35
Inner Middle Outer
Modulus of E
lasticity -M
OE
(MP
a)
Mod
ulus
of R
uptu
re -
MO
R (
MP
a)
MOR
MOE
0
200
400
600
800
1000
1200
1400
1600
1800
Inner Middle Outer
Har
dnes
s (M
Pa)
a) b)

POSTER PRESENTATION PROCEEDING OF THE FIFTH INTERNATIONAL SYMPOSIUM OF INDONESIAN WOOD RESEARCH SOCIETY
102
Conclusions
The basic density and mechanical properties (static bending and hardness) of oil palm wood strongly
correlated positively with the areal number density of vascular bundles. The data suggest that quick estimation of oil palm
wood mechanical characteristics could be partly based on this areal number density. Such characterization could assist
in rapid selection, avoiding destructive testing, of the best parts of oil palm trunks for specific applications, for example by
sorting based on machine vision.
Acknowledgments
The author is grateful for the support of Prince of Songkla University, Surat Thani Campus Research Fund. Assoc. Prof.
Seppo Karrila, Ph.D. provided helpful comments on this manuscript.
References
Baker ES, Febrianto F, Wahyudi I, Ashari Z. 2006. Polygon sawing: an optimum sawing pattern for oil palm stems.
Journal of Biological Science 6(4): 744-749.
British Standard. 1957. Methods of Testing Small Clear Specimens of Timber, BS 373, British Standards House, 2 Park
ST., London, W.1
Chin KL, H’ng PS, Wong LJ, Tey BT, Paridah MT. 2010. Optimization study of ethanolic fermentation from oil
palm trunk, rubberwood and mixed hardwood hydrolysates using Saccharomyces cervisian.
BioresourceTechnology 101: 3287-3291.
Erwinsyah V. 2008. Improvement of oil palm wood properties using bioresin [PhD thesis]. Institit fur Forstntzung und
Forsttechnik Fakultat fur Foest-,Geo- und Hydrowissenschaften: Technische Universitat Dresden.
Feng LY, Tahir PMd, Hoong YB. 2011. Density distribution of oil palm stem veneer and its influence on plywood
mechanical properties. Journal of Applied Sciences 11(5): 824-831.
Hashim R, Said N, Lamaming J, Baskaran M, Sulaiman O, Sato M, Hiziroglu S. Sugimoto T. 2011. Influence of press
temperature on the properties of binderless particleboard made from oil palm trunk. Materials & Design 32: 2520-
2525.
Hniman A, O-Thong S, Prasertsan P. 2011. Developing a thermophilic hydrogen producing microconsortia from
geothermal spring for efficient utilization of xylose and glucose mixed substrates and oil palm trunk hydrolysate.
International Journal of Hydrogen Energy 36: 8785-8793.
Katemanee A. 2006. Appropriate technology evaluation for oil palm by products utilization in Krabi province [M.S. thesis].
Faculty of graduate studies, Mahidol University 89 p.
Kaida R, Kaku T, Baba K, Oyadomari M, Watanabe T, Hartati S, Sudarm onowati, Hayashi Y. 2009. Emzymatic
saccharification and ethanol production of Acacia mangium and Paraserianthes falcataria wood and
Elacis guineensis trunk. Journal of Wood Science 55: 381-386.
Office of Agricultural Economic. 2012. Agricultural statistics of Thailand. Bangkok, Thailand 136 p.
Punsuvon V, Anpanurak W, Vaithanomsat P, Tungkananurak N. 2005. Fractionation of chemical components of
oil palm trunk by steam explosion. Proceeding of 31st Congress on Science and Technology of Thailand;
2005 October 18-20; Suranaree University of Technology.
Rarnasingam J, Ma TP, Manikam M, Farrokhpayam SR. 2008. Evaluating the machining characteristics of oil
palm lumber. Asian Journal of applied Science 1(4): 334-340.
Ratnasingam J, Ioras F. 2010. Static and fatigue strength of oil palm wood used in furniture. Journal of Applied Science
10(11): 986-990.
Sitti Fatimah MR, Sulaiman O, Hashim R, Arai T, Kosugi A, Abe H, Murata Y, Mori Y. 2012. Characterization of
parenchyma and vascular bundle of oil palm trunk as function of storage time. Lignocellulose 1(1): 33-44.
Verman M, Saka AA. 2011. Comparative study of oil palm and Japanese beech on their fractionation and
characterization as treated by supercritical water. Waste Biomass Valor 2: 309-315.
Yamada H, Tanaka R, Sulaiman O, Hashim R, Hamid ZAA, Yahya MKA, Kosugi A, Arai T, Murata Y, Nirasawa
S, Yamamoto K, Ohara S, Yusuf MNM, Ibrahim WA, Mori Y. 2010. Oil palm trunk: A promising source of
sugar for bioethanol production. Biomass and Bioenergy 34: 1608-1613.
Yuliansyah AT, Hirajima T, kumagai S, Sasaki K. 2010. Production of solid biofuel from agricultural wastes of the
palm oil industry by hydrothermal treatment. Waste Biomass Valor 1: 395-405.

POSTER PRESENTATION PROCEEDING OF THE FIFTH INTERNATIONAL SYMPOSIUM OF INDONESIAN WOOD RESEARCH SOCIETY
103
THE ADHESIVE BONDABILITY OF ETHYLENE GAS STIMULATED
RUBBERWOOD, AN EXPERIMENTAL STUDY
Wissanee Yingpraserta & Sudarut Yaowalerd
Faculty of Sciences and Industrial Technology, Prince of Songkla University, Surat Thani Campus,
Muang district, Surat Thani, 84000, Thailand,
Email address:[email protected]
Abstract
This experimental investigation of bondability of rubberwood used 20-25 years old rubber trees (strain RRIM 600)
stimulated with ethylene gas for 6 years, and compared these with untreated control samples of similar age. Both types
of rubberwood were collected from Chaibury district in Surat Thani province. The penetration of urea formaldehyde resin
into wood, shear strength and area fraction of wood failure at sheared bond interface, along both tangential and radial cut
planes of wood, were examined. Shearing was in the axial direction, parallel to wood fibers. There was no significant
difference between the two directions in the depth of urea formaldehyde resin penetration, but ethylene gas stimulated
rubberwood had significantly (P<0.01) deeper resin penetration than untreated rubberwood. The shear strengths of
tangential surfaces were significantly higher than of radial surfaces, and the treatment significantly increased the shear
strengths relative to control. Wood failure area fractions from tangential shear were significantly higher than from radial
shear, and the treatment significantly increased these fractions about three fold relative to control. The results suggest
that ethylene gas treatment, beneficial for latex production, also improves the adhesive bonding properties of rubberwood
lumber.
Keyword: bondability, urea formaldehyde resin, rubberwood, ethylene gas
1 Introduction
In Thailand, farmers have conventionally harvested latex using a multi-annual tapping system with a half-spiral
(S/2) or a one third-spiral (S/3) cut downward tapped at a frequency of two days (d2). In the last decade, however, the
continuous decrease in the size of Thai rubber plantations has led to general adoption of more intensive frequencies than
d2, namely daily tapping (d1), two days out of three (2d/3), or three days out of four (3d/4), with only one day of tapping
rest (Chantuma et al., 2011).
Further, rubber smallholders in southern Thailand have introduced ethylene gas stimulation to increase latex
production, land productivity and tapping labor efficiency (Sainoi and Sdoodee, 2012). Normally, ethylene gas stimulation
is recommended for over 15-year-old rubber trees. Stimulation delays latex vessel plugging, prolongs duration of latex
flow and results in a 20 to 100 percent increase in latex yield. However, the yield stimulation will lead to 2–7 percent
reduction in the dry rubber content, even though it has no effect on rubber properties (Nair, 2010). The rubber plantations
have become a major source of industrial timber in the rubber-growing countries of South and Southeast Asia. Since the
1980s, rubberwood is internationally accepted as an eco-friendly source of timber for manufacture of household furniture.
Rubberwood has excellent physical properties and has become an important raw material also for the manufacture of
panel products, such as particle board, block board, and medium-density fiber board, among others (Nair, 2010; Teoh et
al., 2011). However, the effects of ethylene gas stimulation on the properties of rubberwood have not been studied. The
properties that are important to applications include chemical composition, permeability, glue bonding characteristics,
and mechanical properties.
The objective of this study was to investigate the glue bondability of ethylene gas stimulated rubberwood. The
characteristics that were determined and compared between treated and untreated wood samples were adhesive
penetration, shear strength, and wood failure in two cutting directions, namely radial and tangential directions.
2 Materials and methods
2.1 Rubberwood raw material
Rubberwood RRIM 600 clone is the most widely planted clone in Thailand, and was used for the experiment.
Four 20-25 years rubber trees were collected from Chaibury, Surat Thani province, in southern Thailand. Two of the

POSTER PRESENTATION PROCEEDING OF THE FIFTH INTERNATIONAL SYMPOSIUM OF INDONESIAN WOOD RESEARCH SOCIETY
104
trees had been ethylene gas stimulated for 6 years, and two were conventionally tapped untreated rubber trees, acting
as untreated controls in comparisons.
Rubberwood logs of 1100 mm length were cut from the trees at a height of 0.5 m from the ground, and cut with
a circular saw into boards of 40 mm thickness in different cutting directions. After initial air-drying the boards were further
dried in a laboratory kiln drier, and planed to the final dimensions of 1000 mm×150 mm×30 mm. Then, these boards
were cut into radial and tangential blocks of 100×30×5 mm3 in order to investigate the penetration of adhesives into
tangential and radial surfaces, and potential effects on the shear strength of adhesive joints. Before each experiment the
blocks were conditioned at 20±2°C at 65±5% relative humidity until they were at equilibrium or they gave a constant
weight.
2.2 Urea formaldehyde adhesive
Urea formaldehyde (UF) adhesive with a solids content of 50 percent, pH 8.64 at 30°C, and 375 cps viscosity
at 30°C, was supplied by Dynea Krabi Co, Ltd., Songkhla, Thailand. The adhesive mixes used in the penetration
experiments were prepared by addition of 0.05% (by mass) of Safranin as a marker based on solid resin, to enable
fluorescence imaging. The glue was applied on wood surfaces at ambient temperature of about 27°C with a brush.
2.3 Bonded samples and determination of the adhesive penetration, shear strength and the area fraction of wood
failure
The adhesive was applied at 200 g/m2 onto one of the two wood specimen surfaces to be bonded. Assembly
was always performed with parallel grain directions, and the ply without direct application of adhesive was at the bottom
position to improve adhesive penetration into its structure by gravity. Special care was taken in order to have the taper of
the cut surface relative to grain as low as possible, in order to have comparable penetration conditions across tested
samples. The jointed samples were pressed in a hydraulic press at 130°C and 1.0 MPa for 5 minutes.
For adhesive penetration determination, the jointed samples were cut across the bond line and then the depth
of adhesive penetration measured under a fluorescence microscope. The depth of adhesive penetration was determined
at 45 positions along the bond line, and was defined as the width of detectable resin normal to the bond line. There was
no separate individual characterization for the two plies, only a characterization of their common bonded interface. The
average penetration depth (AP) was determined as the mean value of penetration depths from five jointed sample
replicates for each treatment. The adhesive penetration area was also observed with a scanning electron microscope
(SEM-Quanta).
Prior to the single lap shear tests, specimens were conditioned at 20 ± 2 C and 65 ± 5% relative humidity for
one week. The tensile shear tests were conducted on a hydraulic test machine with a measuring scale of 50 kN at a
testing speed of 6 mm/min in tensile mode, and the load direction was always parallel to the grain in all tested
specimens. The shear area (20 mm × 10 mm) was assessed for the area fraction of wood failure and its thickness, after
failure of the joint. Ten replications were performed for each set of parameters.

POSTER PRESENTATION PROCEEDING OF THE FIFTH INTERNATIONAL SYMPOSIUM OF INDONESIAN WOOD RESEARCH SOCIETY
105
3 Results and discussion
3.1 The average adhesive penetration depth
Figure 1. Average penetration depth of urea formaldehyde adhesive in radial and tangential directions of ethylene gas
stimulated rubberwood and untreated rubberwood.
Penetration is the ability of an adhesive to enter into the lumen and into cell walls as a flowing fluid. It depends
on the characteristics of wood, such as the lumen diameter and the grain slope on wood surface, on properties of the
resin or adhesive mix (such as molecular weight distribution, adhesive mix composition, viscosity, amount of adhesive
spread, and its rate of curing), and the physical conditions during bonding (such as assembly time, press temperature
and pressure, and moisture content of wood) (Gavrilović-Grmuša et al., 2012). The current study was aimed to determine
the effects of rubber tree tapping system on adhesive penetration, so the other factors affecting were held constant to the
extent possible. The 3.4±1.2 mm depth of UF adhesive penetration in ethylene gas stimulated rubberwood was
significantly higher than the 2.7±0.5 mm in untreated rubberwood control samples. The adhesive penetrations in radial
and tangential directions were not significantly different at P<0.01 level, in agreement with a prior study where the cutting
plane had no influence on the adhesive penetration (Gavrilović-Grmuša et al., 2012).
Figure 2. The distribution of UF adhesive penetrating into radial cut surface of ethylene gas stimulated
Rubberwood, observed under a fluorescence microscope (left, 30x) and a scanning electron microscope
(right).
0.0
0.5
1.0
1.5
2.0
2.5
3.0
3.5
4.0
4.5
5.0
Ethylene gas stimulated rubberwood Untreated rubberwood
Ave
rage
pen
etra
tion
dept
h (m
m)
Radial direction Tangential direction

POSTER PRESENTATION PROCEEDING OF THE FIFTH INTERNATIONAL SYMPOSIUM OF INDONESIAN WOOD RESEARCH SOCIETY
106
Figure 3. The distribution of UF adhesive penetrating into tangential cut surface of untreated rubberwood (above) and
ethylene gas stimulated rubberwood (below), imaged with a scanning electron microscope.
The extent of adhesive penetration into rubberwood was determined by examining the cross section of a bond
line with a fluorescence microscope and with a scanning electron microscope (Figures 2 and 3). The penetration of UF
adhesive into radial direction was of small extent, so that adhesive was only found immediately by the bond line. The
adhesive did partly fill rays and vessels in contact with the bond line. Figure 3 illustrates the somewhat larger penetration
in ethylene gas stimulated rubberwood relative to untreated control. However, local variations in the anatomy of wood at
the bond line, such as the presence of vessel elements, has a large influence on adhesive penetration and area filled
with adhesive (Gavrilović-Grmuša et al., 2012), and this makes small observed differences inconclusive.
However, the porosity and permeability of wood contribute to adhesive penetration, and a previous study
reports that ethylene gas stimulated rubberwood has a higher permeability than untreated rubberwood (Cherdchim and
Sudchada, 2013), corroborating the slightly increased adhesive penetration observed in the current study.

POSTER PRESENTATION PROCEEDING OF THE FIFTH INTERNATIONAL SYMPOSIUM OF INDONESIAN WOOD RESEARCH SOCIETY
107
3.2 Shear strength and wood failure
(a)
(b)
.
Figure 4. Shear strength (a) and average area fraction of wood failure (b), of the tested adhesive joints.
The shear strength and the average area fraction of wood failure are shown in Figure 4, for the tested adhesive
joints. The shear strengths of were significantly higher for ethylene gas stimulated wood than for untreated control
samples. Shear failure generally occurred near the bond line and the average thickness of wood failure was close to 0
mm. The fractional area of wood failure was almost three fold for ethylene gas stimulated wood relative to control
samples. This also corroborates the observed wider bonding interphase of stimulated wood. In prior research a dominant
portion of the wood failure occurred in the fortified interphase and a smaller portion in the “pure” wood without adhesive
(Gavrilović-Grmuša et al., 2012). The shear strength appears to depend on penetration depth of adhesive and it was
directly proportional to the area fraction of wood failure.
4 Conclusions
Ethylene gas stimulated rubberwood had better bondability than untreated rubberwood, apparently due to
higher porosity and permeability that improved adhesive penetration deeper into the wood structure. The observed bond
0
500
1000
1500
2000
2500
3000
3500
4000
Ethylene gas stimulated rubberwood Untreated rubberwood
Sh
ea
r str
en
gth
(kg
/cm
2 )
Tangential cut plane Radial cut plane
0
5
10
15
20
25
30
Ethylene gas stimulated rubberwood Untreated rubberwood
Are
a fr
actio
n of
woo
d fa
ilure
(%
)
Tangential cut plane Radial cut plane

POSTER PRESENTATION PROCEEDING OF THE FIFTH INTERNATIONAL SYMPOSIUM OF INDONESIAN WOOD RESEARCH SOCIETY
108
interphase of stimulated rubberwood was wider than for control samples, and the bond shear strengths and the area
fractions of wood failure after shear tests were also higher than for untreated rubberwood. These results suggest that the
ethylene gas treatments that are beneficial for latex production are also beneficial for adhesive bonding of rubberwood
lumber.
5 Acknowledgements
Funding from the Faculty of Sciences and Industrial Technology, Prince of Songkla University, Thailand, is
gratefully acknowledged. We thank Dr.Seppo Karrila for helpful comments and suggestions on this manuscript.
6 References
Chantuma P, Lacote R, Leconte A, Gohet E. 2011. An innovative tapping system, the double cut alternative, to improve
the yield of Hevea brasiliensis in Thai rubber plantations. Field Crops Research 121(3):416-22.
Cherdchim B, Sudchada R. 2013. The effects of ethylene stimulated rubberwood on micro-structure, permeability,
diffusion, and water absorbance. [Student Project]. Thailand: Prince of Songkla University.
Gavrilović-Grmuša I, Dunky M, Miljković J, Djiporović-Momčilović M. 2012. Influence of the degree of condensation of
urea-formaldehyde adhesives on the tangential penetration into beech and fir and on the shear strength of the
adhesive joints. European Journal of Wood and Wood Products 70(5):655-65.
Nair KPP. 2010. 8 - Rubber (Hevea brasiliensis). The Agronomy and Economy of Important Tree Crops of the
Developing World. London: Elsevier. p. 237-73.
Sainoi T, Sdoodee S. 2012. The impact of ethylene gas application on young-tapping rubber trees. Journal of Agricultural
Technology 8(4):11.
Teoh YP, Don MM, Ujang S. 2011. Assessment of the properties, utilization, and preservation of rubberwood (Hevea
brasiliensis): A case study in Malaysia. Journal of Wood Science 57(4):255-66.

POSTER PRESENTATION PROCEEDING OF THE FIFTH INTERNATIONAL SYMPOSIUM OF INDONESIAN WOOD RESEARCH SOCIETY
109
Potential Of Boron Rubberwood Preservatives Against
Asian Subterranean Termite Coptotermes gestroi
(ISOPTERA: RHINOTERMITIDAE)
Manop Tarasin1,* Akapong Petharwut1 & Wigunda Rattanapun2 1Department of Rubber Industry Technology, Rubberwood and Products Testing Center, Faculty of
Sciences and Industrial Technology, Prince of Songkla University,
Surat Thani Campus, Surat Thani, Thailand, 84000 2Department of Plant Sciences, Tropical Plant Research Unit, Faculty of Technology and Community
Development, Thaksin University, Phatthalung Campus, Phatthalung, Thailand, 93110
*Corresponding author: [email protected]
Abstract
This work evaluated the efficacy of rubberwood preservative using boron for decrease Asian subterranean termite
Coptotermes gestroi (Isoptera: Rhinotermitidae) attack. Fresh-cut rubberwood samples were divided into two groups, first
group treated by 2% boric acid and second group treated by 2% borax under 100 mmHg vacuum for 20 minutes. Five
treatments were carried out in the experiment, samples treated with 2% borax and leaching, samples treated with 2%
borax and not leaching, samples treated with 2% boric acid and leaching and samples treated with 2% boric acid and not
leaching and control. For leaching tests, all samples were stirred in distilled water for 20 minutes and dried at 103 °C for
48 h. Rubberwood samples were then subjected to laboratory termite resistance test using C. gestroi. Result present that
the relative mass loss of control treatment was highest. Rubberwood samples treated with preservative chemicals and
not leaching had lowest mass loss caused by C. gestroi infestation. There was not significant different in the percent of
mass loss among leaching rubberwood samples treated with 2% boric acid and 2% borax. Borax and Boric acid affected
on C. gestroi infestation in equally. Properties improvement of rubberwood using borax and boric acid can decrease
insect infection.
Key words: leach, moisture content, wood borer, vacuum
Introduction
The Asian subterranean termite, Coptotermes gestroi (Wasmann) (Isoptera: Rhinotermitidae) is known to
cause tremendous losses to finished and unfinished wooden structures in buildings, and losses in agriculture and forestry
crops (Sen-Sarma et al., 1975). Coptotermes gestroi is a small sized species of termites, living underground and has
spread to many parts of the world. Preservative treatment is required to protect timber in regions with high C. gestroi
pressure. To avoid environmental pollution and health problems caused by traditional wood preservatives or synthetic
pesticides, there is increasing interest in alternative chemical compounds. Boron wood preservatives have been used for
many years and there is growing interest in their low mammalian toxicity and environmental acceptability (Laks and
Manning, 1994). Wood specimens were treated with boron containing quaternary ammonia compound (DBF) and the
same emulsion in surface treatments resistance to termite and fungi (Kartal et al., 2004). Boric acid and borax are most
common boron compounds which have found many application areas in the wood preservation industry in order to get
the benefit of their biological effectiveness and fire retardancy (Le Van and Tran, 1990). Mai and Militz (2004) stated that
decay resistance against Tyromyces palustris and Trametes versicolor revealed the highest protection by combined
treatment of water glass and boron salts (Furuno et al., 1992, 1993; Furuno and Imamura, 1998). The termite resistance
of leached specimens was particularly enhanced in the samples treated with boric acid, borax, and potassium borate
combined with water glass (Furuno and Imamura, 1998). The objective of this study was to investigate the resistance to
C. gestroi infestation, of rubberwood treated with borax and boric acid.

POSTER PRESENTATION PROCEEDING OF THE FIFTH INTERNATIONAL SYMPOSIUM OF INDONESIAN WOOD RESEARCH SOCIETY
110
Materials and Methods
Non-choice tests followed, with slight modifications, the standard D3345-74 of International standards 2001 by
the American Society for Testing and Materials (ASTM). All experiments were done in a laboratory.
Wood preparing
All rubberwood samples were cut to 2.5 × 2.5 × 0.64 cm along trunk axis direction. Five treatments were
carried out in the experiment, samples treated with 2% borax and leaching with water, samples treated with 2% borax
and not leaching, samples treated with 2% boric acid and leaching and samples treated with 2% boric acid and not
leaching and control. All samples were pre-dried in oven and immersed in 2% borax and second group treated by 2%
boric acid under 100 mmHg vacuum for 20 minutes. After that, all samples were dried in an oven at 103 ± 5 °C and
weighed. For leaching tests, all samples were stirred in distilled water for 20 minutes and dried at 103 °C for 48 h.
Non-choice experimental procedure
The non-choice experiment relates to termiticidal toxicity, when no alternative food source is provided and the
diet consists only of treated or only of untreated control wood.
A single treated sample was put on sterilized sand in a 5 × 8 × 5 cm clear plastic box with aeration holes covered with
net. Coptotermes gestroi workers were collected from rubberwood logs in the field. One gram of C. gestroi was released
to the plastic box and left for 30 days. Ten replicates were done for each treatment. The samples were weighed before
treatment, after treatment and drying, and after 30 days of infestation. The determined masses were used to calculate
dry mass absorbed from wood vinegar and relative mass loss due to infestation.
Statistical analysis
One-way ANOVA was used to analyze the loss of mass due to termite infestation, to determine differences
between treatment groups. The response variable analyzed was percent loss of mass, and these data were log (x + 1)
transformed when necessary to meet the assumptions of statistical analysis, and then back-transformed for presentation
in tables and graph.
Results and Discussion
In the non-choice experiments the relative loss of mass decreased with leaching and non- leaching treatment,
indicating high termiticidal activities for samples treated with 2% boric acid and borax (ANOVA: F4,20 = 75.871, P ≤
0.001). Results presented that the relative loss of mass of control treatment was higher significantly from other treatment
groups (Figure 1). There was no significant difference in the relative loss of mass between treatments with 2% boric acid
and borax. Both leaching treatments of boric acid and borax did not differ significantly in the percentage of mass loss
(Figure 1).
Figure 1. Relative loss of mass (mean ± SD) for each treatment in non-choice experiments. BA is boric acid and BO is
borax. Different letters indicate statistically significant differences (Tukey test: P < 0.05; n = 5). Significance is
based on log (x + 1)-transformed data, non-transformed data are plotted.

POSTER PRESENTATION PROCEEDING OF THE FIFTH INTERNATIONAL SYMPOSIUM OF INDONESIAN WOOD RESEARCH SOCIETY
111
In our study, with the exception of control treatment, the rubberwood treated with either 2% boric acid and
borax showed resistance against the subterranean termite C. gestroi even if after the leaching process. This result is
consistent with the previous researchs indicated treated boron wood was effective against termite and fungi (Mai and
Militz, 2004; Yamaguchi, 2005; Kartal et al., 2007). Hence, results of this experiment indicate that borax and boric acid
affected on C. gestroi infestation in equally. Properties improvement of rubberwood using borax and boric acid can
decrease insect infection.
Continuous leaching tests and field trials are needed to determine the amount of depletion of boron as well as
the decay and termite resistance of wood treated with boron. The results overall suggest that treatments with 2% boric
acid and borax give rubberwood resistance against C. gestroi infestation.
Conclusion
The rubberwood treated with either 2% boric acid and borax showed resistance against the subterranean
termite C. gestroi even if after the leaching process. Properties improvement of rubberwood using 2% borax and 2%
boric acid can decrease insect infection.
References
Furuno T, Shimada K, Uehara T, Jodai S. 1992. Combinations of wood and silicate. 2. Wood–mineral composites using
water glass and reactance of barium chloride, boric acid, and borax and their properties. Mokuzai Gakkaishi
38: 448–457.
Furuno T, Uehara T, Jodai S. 1993. Combinations of wood and silicate. 3. Some properties of wood–mineral composites
using the water glass–boron compound system. Mokuzai Gakkaishi 39: 561–570.
Furuno T, Imamura Y. 1998. Combinations of wood and silicate. 6. Biological resistance of wood-mineral composites
using water glass–boron compound system. Wood Science and Technology 32: 161–170.
Kartal SN, Yoshimura T, Imamura Y. 2004. Improvement of boron leachability from disodium octoborate tetrahydrate
(DOT)-treated wood by in situ copolymerization of allyl glycidyl ether (AGE) with methyl methacrylate (MMA).
International Biodeterioration & Biodegradation 53: 111–117.
Kartal SN, Hwang WJ, Yamamoto A, Tanaka M, Matsumura K, Imamura Y. 2007. Wood modification with a commercial
silicon emulsion: Effects on boron release and decay and termite resistance. International Biodeteriodation &
Biodegredation 60: 189-196.
Laks PE, Manning MJ. 1994. Inorganic borates as preservative systems for wood composites. In: Proceedings of second
pacific rim bio-based symposium, Vancouver, Canada, p. 236–44.
Le Van SL, Tran HC. 1990. The role of boron in flame retardant treatment. In: Proceedings of first international
conference on wood protection with diffusible preservatives, 28–30 Nov. Tennessee, USA, p. 39–41.
Mai C, Militz H. 2004. Modification of wood with silicon compounds in organic silicon compounds and sol–gel systems: A
review. Wood Science and Technology 37: 339–348.
Sen-Sarma PK, Thakur ML, Mishra SC, Gupta BK. 1975. Wood Destroying Termites in India. Forest Research Institute,
Dehradun, p. 187.

POSTER PRESENTATION PROCEEDING OF THE FIFTH INTERNATIONAL SYMPOSIUM OF INDONESIAN WOOD RESEARCH SOCIETY
112
ANTITERMITIC ACTIVITY OF THE BARK EXTRACTS OF TEAK
Ganis Lukmandaru
Department of Forest Product Technology, Faculty of Forestry, Gadjah Mada University
Email : [email protected]
Abstract
Teak (Tectona grandis) wood is recognized to exhibit antitermitic activities. The antitermitic activities of its bark, however,
is still unexplored. This research is aimed to evaluate teak bark extracts and their components against Reticultermes
speratus Kolbe termites species. Materials used in this study were wood powder from teak trees aged 8 years (6 trees)
and 22 years (4 trees). The extraction were performed separately by cold extraction (one week) by three solvents: n-
hexane, ethyl acetate and methanol. No choice antifeedant bioassay test by paper discs was carried out in this research.
By analysis of variance, the results showed that methanol soluble extracts (1.04 %) is significantly higher than those
other solvents. The extracts of n-hexane exhibited the antifeedant activity (4-5 mg) which is measured by the mass loss
due to termites. The similar tendency was also found in the mortality rate of termites (20-38 %) although the magnitude
was not so high compared to the controls (17 %). Tree age factor did not affect significantly to both extractive contents
and antitermitic properties of the bark. By means of gas chromatography, deoxylapachol detected in the teak wood
extracts was also found in the bark extracts. This compound, however, did not significantly correlate to the antitermitic
properties.
Keyword : Tectona grandis, antitermitic activities, bark extractive, Reticultermes speratus, cold extraction
Introduction
The bark is a major by-product of wood processing. It has a formidable barrier providing both constitutive and
induced defence mechanisms. Therefore, bark is believed to contain chemical components, which enable the tree to
resist those hazards. It is expected that more effective uses of bark will develop from the viewpoint of green
environments. Unlike antifungal activities, only few studies have been published on the antitermitic effect of bark extracts
of the natural inhabiting wood species. Those species were Picea glehnii (Shibutani et al. 2004), Adina recemosa (Yaga
1977) and some temperate species (Harun and Labosky 1985).
Tectona grandis is a widely distributed hardwood in Indonesia. The wood is used as raw material for the
production of furniture and other wooden structures. Previous works have already reported that extractives from the
wood of teak inhibited the wood-destroying temites. Of these extractives, quinones that were present in appreciable
levels in the wood of teak showed strong inhibition against the attack of termites (Rudman and Gay, 1961; Sandermann
and Simatupang, 1966; Lukmandaru and Ogiyama 2005, Lukmandaru 2012). However, studies about as antitermitic
effects as well as chemical constituents of teak bark are still limited.
The aim of this study was to find out the antitermitic effect of bark extracts from teak as well as to detect some
quinones and related components in the bark. It is assumed that similar quinones in the wood to also play an important
role in the antitermitic activity of the bark. The results are discussed with focus on the bark extracts effect by means of
the paper disc tests.and to relate it with the present of quinones. The comparison with the results of our parallel study
(Lukmandaru 2013) was also discussed.
Material and methods
Bark extracts
All the plant materials were collected at community forests in Gunungkidul Regency, Jogja. The ages of the
test trees were 8 (comprised of 6 samples) and 22 (comprised of 4 samples) years. All the bark samples were collected
from the stems of the trees. After drying, these dried bark samples were ground to pass through 40 mesh size. The
bark meal (1 g) of each sample was subjected to extraction in n-hexane (10 ml) at room temperature for one week. The
bark was also separately extracted with ethyl acetate (EtOAc) and methanol (MeOH) in the same manner. The resulting
solutions were filtered and the filtrate was evaporated to dryness. The yields of the extractives were calculated on the
basis of the weights of the dried extracts to the oven-dried weights of the bark samples.

POSTER PRESENTATION PROCEEDING OF THE FIFTH INTERNATIONAL SYMPOSIUM OF INDONESIAN WOOD RESEARCH SOCIETY
113
No-choice feeding test
Subterranean termites were collected from an active wild colony of Reticulitermes speratus. The colony was
maintained in a dark room at 28°C and 80% relative humidity (RH) until use. A petri dish (diameter 9 cm, height 2 cm)
containing 20 g moistened and sterilized sea sand was used as a container test. Paper disc (diameter 8 mm; Whatmann
International) were impregnated with chloroform solution containing each of the test fractions. The treatment retention
was 5 % (w/w) per disc and 3 duplicates were applied for each sample. After drying at 60 0C for 2 hours, followed by
drying in a vacuum dessicator for 24 hours, they were put on a petri dish. The control discs were impregnated with
chloroform only and dried with the same manner. Fifty worker Reticulitermes speratus Kolbe termites were introduced
into the petri dish. The petri dishes were placed in a dark chamber at 27 0C and 80 % relative humidity. After 10 days the
disc were taken out, dried in the same manner and the weight loss was determined. Mortality was calculated based on
the surviving number of termites.
Extractive analyses
Bark meal samples were separately extracted by n-hexane (C6H6), EtOAc, and MeOH as mentioned above.
Aliquots of each solution (200 μl) were removed, placed in glass tubes and dried. A 20 μl aliquot of C6H6 was added to
dilute each extract. One μl of this solution was then injected with a micro syringe into a GLC (Hitachi Model G-3000)
under following conditions, detector: FID, column: NB-5 bonded capillary 30 m, column temperature: 180 - 280 0C
(programming 4 0C/min), carrier gas: Helium. For quantification of individual substances, a commercial tectoquinone (2-
methyl anthraquinone) was employed as a standard. The amounts of components were expressed as mg per 100 g of
oven dry weight. Pure sample of squalene and lapachol purchased from Kanto Chem were also was used for
confirmation. The identification of constituent compounds was based on their mass spectra and gas chromatographic
retention behavior. GC-MS (JEOL XS mass spectrometry at 70eV) was used for gas chromatographic separations.
Deoxylapachol or its isomer was identified by comparison of their mass spectra with those from previous studies by
Windeisen et al. (2003) and Perry et al. (1991).
Statistical Analysis
The results were expressed as mean ± standard deviation (S.D.). Statistically significant differences between
groups were measured using two-way analysis of variance (ANOVA) with post hoc comparison by Tukey, *p < 0.05 was
considered statistically significant. The relationships between the independent variables were studied with a Pearson’s
correlation analysis. All statistical calculations were conducted using SPSS-Win 10.0.
Results and Discussion
Extractive content
The ANOVA of mean extractive content showed that there was no significant tree age factor (p= 0.72), while
the effects of extract (p <0.01) are significant. Comparisons among the extracts revealed that the MeOH soluble
extractive content (3.44+0.70 %) significantly gave the highest values while C6H6 soluble extractive content (0.27+0.07
%) gave the lowest (Fig.1). This result could be explained as methanol dissolves both polar and to some extent non-polar
compounds. Theoretically, the polar compounds such as tannins and other polyphenols were abundant in the bark. It
was also showed that teak bark contains only small amounts of non-polar compounds. The extractive content levels in
this experiment could be higher if the hot-extraction or soxhlett extraction was performed.

POSTER PRESENTATION PROCEEDING OF THE FIFTH INTERNATIONAL SYMPOSIUM OF INDONESIAN WOOD RESEARCH SOCIETY
114
Figure 1. Extractive content (% oven dried mass m/m) of teak bark by tree age and extract. Mean of 6 trees (8- year-old)
and 4 trees (22-year-old), with the standard deviation error bar. The same letters on the same graphic are
notstatistically different at P < 0.05 by Duncan’s test.
Antitermitic test
The mass loss due to termites was displayed in Figure 2. By ANOVA, it was calculated that tree age factor
was not significant (p= 0.88) but the extract factor was significant (p= 0.01). The mass loss of C6H6 extracts levels were
significantly lower (5.01+3.34 mg) compared to those of methanol (8.59+4.63 mg) or EtOAc extracts (10.35+2.63 mg).
Compared to the control samples (11.35+3.60 mg), the C6H6 extracts exhibit a higher antifeedant activity although it was
not a huge difference. This finding also indicated the existence of some active components in that extract. The similar
tendency was also found with regard to mortality rate of termites. The results showed that tree age (p= 0.28) did not
show significant effects, on the other hand, the extract factor (p= 0.04) had significant effects. As shown in Fig. 3, the
highest mortality rate levels were obtained in the C6H6 and MeOH soluble extracts (24-29 %). The ANOVA of mortality
rate between the C6H6 and MeOH soluble extracts did not vary significantly. The mortality rate value of the control was
about 17 %. Based on these results, the toxicity of teak bark is thought to be weak. In general, by the same samples and
method (Lukmandaru 2013), compared to the outer heartwood extracts (mortality rate of 27-65 %, mass loss of 1-3 mg),
those of teak barks exhibit lower degree of antitermitic activity. No significant effect of tree age factor to the termite
resistance properties is likely due to the low variation in chemical properties between the 8- and 22-year-old barks.
Figure 2. Mass loss due to Reticulitermes speratus on 10-day observation of teak bark by tree age and extracts. Mean of
6 trees (8- year-old) and 4 trees (22-year-old), with the standard deviation error bar. The same letters are not
statistically different at P < 0.05 by Duncan’s test.
0
1
2
3
4
5
6
7
8 year-old 22-year-old
Extr
acti
ve c
on
ten
t (%
)
n-hexane
EtOAc
MeOH
a
b
c
a
b
c
0
2
4
6
8
10
12
14
16
8 year-old 22-year-old
Mas
s lo
ss (
mg)
n-hexane
Control
a
b bb b
a

POSTER PRESENTATION PROCEEDING OF THE FIFTH INTERNATIONAL SYMPOSIUM OF INDONESIAN WOOD RESEARCH SOCIETY
115
Figure 3. Mortality rate against Reticulitermes speratus on 10-day observation of teak bark by tree age and extracts.
Mean of 6 trees (8- year-old) and 4 trees (22-year-old), with the standard deviation error bar. The same letters
are not statistically different at P < 0.05 by Duncan’s test.
Table 1. Pearson correlation coefficients (r) for the termite resistance parameters and extractive contents.
Extractive content Mass loss Mortality rate
n-hexane -0.76** -0.24
EtOAc -0.31 0.05
MeOH 0.02 -0.02
Note : ** Significant at the 1% level; * significant at the 5% level.
Correlation analysis (Tab.1) confirmed a highly significantly negative correlation between the mass loss and
C6H6 soluble extracts content (r = −0.76). This meant that teak bark was more resistant when it contained higher amounts
of these extracts.This indicated that non-polar extractives in the bark contained compounds that were distasteful or
repellent to termites. However, the relationship between mortality rate and any extractive content levels was not clear in
this study. This outcome was reasonable since the bark extracts do not exhibit a strong toxicity. It was observed in our
previous findings (Lukmandaru 2013) that lower degree correlations were measured between mortality rate or mass loss
levels and extractive content levels in the teak wood extracts.
Analysis of n-hexane extract
As C6H6 soluble extracts levels were related to the termite antifeedancy property (Table 1), GC and GC-MS
investigation was further performed. This analysis refered to previous work in the teak wood extract (Lukmandaru and
Takahashi 2009) which some bioactive quinones (tectoquinone, lapachol, deoxylapachol or its isomer) as well as non-
quinone constituents (squalene) were detected. The quantification of those compounds in the C6H6 soluble extracts was
presented in Table 2.
0
10
20
30
40
50
60
8 year-old 22-year-old
Mo
rtal
iy r
ate
(%
)
n-hexane
EtOAc
MeOH
b
a
a
a
b
a
Control

POSTER PRESENTATION PROCEEDING OF THE FIFTH INTERNATIONAL SYMPOSIUM OF INDONESIAN WOOD RESEARCH SOCIETY
116
Table 2. Contents of some components (mg/100 g of oven-dry wood) in the n-hexane soluble extract of teak bark aged 8
and 22.
Teak samples Compounds of n-hexane extracts
8-year-old trees Deoxylapachol Lapachol Tectoquinone Squalene
1 10.17 0 0 14.37
2 9.95 0 0 74.04
3 168.11 0 0 37.43
4 13.18 0 0 15.43
5 15.25 0 0 17.72
6 49.22 0 0 30.40
Average 44.31 0 0 31.55
22-year old -trees
1 8.54 0 0 14.14
2 0 0 0 4.53
3 0 0 0 16.27
4 0 0 0 16.52
Average 2.13 0 0 12.86
In a literature review, Sandermann and Simatupang (1966) mentioned that tectoquinone is the principal
component responsible for natural durability against termites in the wood. Furthermore, desoxylapachol has been found
to exhibit strong antitermitic activity, but lapachol has only weak antitermitic activity. Squalene have never been
mentioned as factors in natural durability. The presence of deoxylapachol and squalene in the bark was confirmed,
although at very low levels compared to that in the heartwood (Lukmandaru and Takahashi 2009). Both lapachol and
tectoquinone were not detected. Therefore, the lower activity against termites in the bark compared to its wood was
probably due to the absence of tectoquinone or comparatively low amounts of quinones.
Previous work reported that some of the polyphenols in the bark were tested to have antitermitic properties
(Harun and Labosky 1985). Stilbenes from bark of Picea glehnii acted as toxicants against termites rather than as mere
feeding deterrents (Shibutani et al. 2004). Yaga (1977), found that scopoletin and oily scopolin were the main termicidal
substances from the Adina recemosa bark. The Pearson’s correlation coefficients between total deoxylapachol content
and mass loss levels was only 0.32. This weak link means that this compound is not the sole cause of termite resistance
in the bark. Thus, further investigation with regard to non-polar compounds (fats, resin, oils, terpenes etc.) in the teak
bark would be useful in determining the relationships between termite resistance and extractives of the bark.
Conclusions
Methanol soluble extractive content significantly gave the highest values in the teak bark extracts. No
significant tree age factor affected the variation in the extractive content as well as termite resistance properties. As n-
hexane soluble extracts exhibited the largest antifeedant activity (low mass loss values), it seemed that the repellent or
distasteful substances existed extensively in non-polar constituents of bark materials. Further, correlation analysis
showed significantly negative correlation (r=-0.76) between the mass loss due to termite attacks and n-hexane soluble
extract contents. There was no strong antitermicidal activity was observed in all extracts. Deoxlylapachol was detected in
the n-hexane soluble extracts, however, it explained relatively little the variation in termite antifeedancy of teak bark.
References
Harun J, Labosky JP. 1985. Antitermitic antifungal properties of selected bark extractives. Wood and Fiber 17(3): 327-
335.
Lukmandaru G. 2012. Bioactive extracts from neutrals of teakwood (Tectona grandis L.f.). Proceedings of the 3rd
International Symposium of Indonesian Wood Research Society. Yogyakarta, p. 328-332.
Lukmandaru G. 2013. Antitermitic activites of juvenile teak wood grown in community forest. Jurnal Ilmu dan Teknologi
Kayu Tropis (in press).
Lukmandaru G, Ogiyama K. 2005. Bioactive compounds from ethyl acetate extract of teakwood (Tectona grandis L.f.),
Proceedings of the 6th International Wood Science Symposium LIPI-JSPS Core, Bali, Indonesia, August 29–31,

POSTER PRESENTATION PROCEEDING OF THE FIFTH INTERNATIONAL SYMPOSIUM OF INDONESIAN WOOD RESEARCH SOCIETY
117
2005, pp. 346–350.
Lukmandaru G, Takahashi K. 2009. Radial distribution of quinones in plantation teak (Tectona grandis L.f.). Annals of
Forest Science 66(605): 1-9.
Perry NB, Blunt JW, Munro MHG.1991. A cytotoxic and antifungal 1,4 naphtaquinone and related compounds from a
New Zealand brown alga, Landsburgia quercifolia. J of Nat Prod 54:978-985
Rudman P, Gay FJ. 1961. The causes natural durability in timber part VI. Measurement of anti-termite properties of
anthraquinones from Tectona grandis L.f. by rapid semi-micro method. Holzforschung 15:117–120.
Sandermann W, Simatupang MH. 1966. On the chemistry and biochemistry of teakwood (Tectona grandis L. fil). Holz
Roh- Werkst.24: 190–204.
Shibutani S, Samejima M, Doi S. 2004. Effects of stilbenes from bark of Picea glehnii (Sieb. et Zucc) and their related
compounds against feeding behaviour of Reticulitermes speratus (Kolbe). J Wood Sci 50:439–444.
Windeisen E, Klassen A, Wegener G. 2003. On the chemical characterization of plantation teakwood (Tectona grandis
L.) from Panama. Holz Roh-Werkst 61:416-418.
Yaga S. 1977. On the termite-resistance of Okinawan timbers IV.Termiticidal substance from the wood and bark of Adina
recemosa Miq. (in Japanese). Mokuzai Gakkaishi 23:594–600.

POSTER PRESENTATION PROCEEDING OF THE FIFTH INTERNATIONAL SYMPOSIUM OF INDONESIAN WOOD RESEARCH SOCIETY
118
MICROWAVE-ASSISTED ACID HYDROLYSIS OF
SUGARCANE BAGASSE PRETREATED WITH WHITE-ROT FUNGI
Triyani Fajriutami, Sita Heris Anita, Euis Hermiati
R&D Unit for Biomaterials, Indonesian Institute of Sciences (LIPI)
Jl. Raya Bogor Km 46, Cibinong, Bogor, Indonesia
Email: [email protected]
Abstract
Sugarcane bagasse is one of the largest lignocellulosic residue in tropical countries that can be used as an alternative
raw material for bioethanol production. Sugarcane bagasse is pretreated and hydrolyzed for reducing sugar production,
then the sugars are fermented to obtain bioethanol. The aim of this research was to study the effects of substrate
concentrations (1%, 2%, 3%, 4%, 5%), duration of microwave-irradiation (0, 2.5, 5, 7.5, 10, 12.5, 15 minutes), and
concentrations of dilute acid solutions (1%, 2%, 3%, 4%, 5%) on the reducing sugar yield and the formation of 5-
hydroxymethyl furfural (HMF) during the hydrolysis of sugarcane bagasse pretreated with mixed culture of white rot fungi
under microwave irradiation. The sugarcane bagasse was pretreated with 10% (w/v) mixed culture of two white-rot fungi
(Trametes versicolor and Phanerochaete chrysosporium).They together degraded 16.78% of lignin in the sugarcane
bagasse after 2 weeks of incubation. Then, the pretreated sugarcane bagasse was hydrolyzed by two kinds of acids,
sulfuric and oxalic acids, under 550 watt of microwave power. The results showed that the hydrolysis using sulfuric acid
produced more sugars than didoxalic acid, and reducing sugar production was affected significantly by substrate
concentrations, duration of microwave-irradiation, and acid concentration. In order to suppress the formation of HMF as
byproduct, the hydrolysis of fungi pretreated sugarcane bagasse should be carried out in less than 10 minutes.
Keyword : dilute acid hydrolysis, microwave heating, reducing sugar yield, sugarcane bagasse, white-rot fungi
1. Introduction
Bioethanol production from lignocellulosic biomass has attracted much interest all over the world in recent
years because of limited of fossil oil and environmental pollutions. It is desirable to use cheaper and more abundant
substrates for large-scale production of bioethanol for its economic feasibility. One of the largest lignocellulosic biomass
produced in tropical countries is sugarcane bagasse, the dried residue left after extracting the juice from sugarcane in the
sugar production process. Sugarcane bagasse is produced in large quantities by the sugar and alcohol industries in
Indonesia, Brazil, India, Cuba, China, México, and Colombia. In general, 1 ton of sugarcane generates 280 kg of
bagasse, and 5.4 x 10⁸ dry tons of sugarcane are processed annually throughout the world (Cardona et al, 2010). In
Indonesia, there are 58 sugar industries which have capacity to grind around 195.662 tons of cane per day (Hermiati et
al, 2010).
Sugarcane bagasse contains approximately 50% cellulose and 25% each of hemicellulose and lignin (Pandey
et al, 2000). Pretreatment is crucial for lignin removal and make the cellulose available for enzymatic hydrolysis and
fermentation. Several methods of lignocellulosic biomass pretreatment have been developed, including physical,
chemical, physico-chemical and biological pretreatment. The biological pretreatment is environmental friendly and can be
carried out under mild conditions, consumes low energy, and requires simple procedures and equipments (Sun et al,
2011). For biological pretreatment of lignocellulosic, white-rot fungi are the most effective basidiomycetes (Sun and
Cheng, 2002). Recent studies have shown that Aspergillus terreus, Trichoderma spp, Cyathus stercoreus, Lentinus
squarrosulus, Lentinus edodes, Trametes pubescens, Pleurotus spp, Penicillium camemberti, Phanerochaete
chrysosporium grown at 25-35°C for 3-22 days on lignocellulosic materials and resulted in 45-75% and 65-80%
holocellulose and lignin degradation, respectively (Mtui, 2009).
The pretreatment process is followed by hydrolizing the cellulosic biomass to obtain reducing sugar and
fermentating the sugars into bioethanol. Hydrolysis of pretreated lignocellulosic materials can be carried out with acid
hydrolysis or enzymatic hydrolysis. Acids can be used as catalysts for the hydrolysis as they breakdown heterocyclic
ether bonds between sugar monomers in the polymeric chain (Velmurugan and Muthukumar, 2011). Commonly, dilute

POSTER PRESENTATION PROCEEDING OF THE FIFTH INTERNATIONAL SYMPOSIUM OF INDONESIAN WOOD RESEARCH SOCIETY
119
acids which can be used as catalyst of hydrolysis are H2SO4, HCl, HF, or CH3COOH (Aguilar et al, 2002). Oxalic acid,
which is one of organic acid, also plays an important role in the degradation of wood and other lignocellulosic materials.
Besides that, oxalic acid can catalyze the hydrolysis of hemicellulose and cellulose directly (Lee et al, 2009).
The conventional heating process in hydrolysis can be replaced by using gamma-ray or electron-beam
irradiation, or microwave irradiation (Demirbas, 2005). Microwave irradiation is one of the methods that has been studied
because of its high and selective energy transfer efficiency (Sasaki et al, 2011). The objective of this research was to
study the effects of substrate concentrations, dilute sulfuric and oxalic acid concentrations, and irradiation time on
hydrolysis of sugarcane bagasse pretreated with mixed culture of white-rot fungi (Trametes versicolor and
Phanerochaete chrysosporium) under microwave irradiation for reducing sugar and 5-hydroxymethylfurfural (HMF)
production.
2. Materials and Methods
Sugarcane bagasse used in this research was obtained from sugar plant in Magetan, East Java-Indonesia. The
bagasse was milled and sieved to get particles of 40-60 mesh. Two species of white-rot fungi, which were Trametes
versicolor and Phanerochaete chrysosporium, were used in this study for biological pretreatment of sugarcane bagasse.
For preparation of inoculum of fungi, both white-rot species were cultured on Potato Dextrose Agar (PDA) slant
and incubated for 7 days. JIS-medium broth was prepared by mixing 3 g KH2PO4, 2 mg MgSO4.7H2O, 25 g glucose, 5 g
peptone and 10 g malt extract in 1 liter of distilled water. After incubated for 7 days, the mycelium from each slant was
molted and diluted with 5 ml of JIS-medium broth. The suspension was then poured into 95 ml JIS broth media and
incubated stationery at 27°C for 10 days. After the 10-days incubation, each inoculum was homogenized using warring
blender with high speed (2 x 20 sec). The Trametesversicolor and Phanerochaete chrysosporium inocula were mixed
with 1:1 ratio, then they were used for biological pretreatment.
About 200 g (dry weight) of sugarcane bagasse was put in a heat resistant plastic bag. Nutrient media (JIS
broth) was added to the bagasse (3:1 w/w), then this medium was sterilized in an autoclve for 20 minutes. After that, 10%
(v/w) of working inoculum was added, and the medium was incubated at ± 27°C for 2 weeks. Pretreated sugarcane
bagasse was weighed to determine weight loss.Lignin, α-cellulose, and hemicellulose content after biological
pretreatment were also determined [9]. The pretreated bagasse was then hydrolized under microwave irradiation with
dilute acid catalyst.
A commercial microwave oven (2450 MHz, 1100 W) was used forthe hydrolysis. The output power of the
microwave oven is 1100 W. The oven's power could be set to 50% which was assumed equal to 550 W. This single
factor experiment involved five levels of substrate concentrations (1%, 2%, 3%, 4%, and 5% w/v), five levels of dilute acid
concentrations (0, 0.5%, 1%, 2%, and 3%) and seven levels of duration of microwave-irradiation (0, 2.5, 5, 7.5, 10, 12.5
and 15 minutes). All solutions and the sugarcane bagasse were assumed to have a specific gravity of 1 g/ml. Firstly,
certain amount of the wet pretreated sugarcane bagasse was immersed in certain concentration of sulfuric or oxalic acid
solution and made up 20 g of total mixture. They were mixed at 200 rpm for 20 minutes, then the mixture was heated
under microwave irradiation. After that, it was cooled as soon as possible. The soluble fraction from the hydrolysis
process was filtered to determine its reducing sugar (Nelson-Somogyi method) and HMF (SNI 01-3545-2004 based on
AOAC Official Method 980.23-1999) contents.
3. Results and Discussion
3.1. Pretreatment of sugarcane bagasse with mixed culture of white rot fungi
The major components of sugarcane bagasse (before biological pretreatment) used in this research were
carbohydrate fraction and lignin. The carbohydrate fraction of the raw sugarcane bagasse was 69.65% of the total
biomass, consisted of 40.98% α-cellulose and 28.67% hemicellulose. The α-cellulose is a polymer of glucose which can
be used as a sugar source for ethanol production. The lignin content of the raw bagasse in this research was 29.27%
which is in range of lignin content in sugarcane bagasse previously reported (Cardona et al, 2010).
The biological pretreatment was carried out by mixing two species of white-rot fungi, P. chrysosporium and T.
versicolor, for delignification of sugarcane bagasse. These fungi were selected because of their effective degradation of
lignin (Shi et al, 2008; Anita et al, 2011; Taniguchi et al, 2005). The percentage loss of sugarcane bagasse's component
was calculated after the mixed culture of white-rot fungi’s pretreatment (Figure 1).

POSTER PRESENTATION PROCEEDING OF THE FIFTH INTERNATIONAL SYMPOSIUM OF INDONESIAN WOOD RESEARCH SOCIETY
120
The growth of mixed culture fungi resulted in weight loss of sugarcane bagasse. The weight loss of sugarcane
bagasse after two weeks of incubation was 12.94%. Taniguchi et al. (2005) reported thatP.chrysosporium and T.
versicolor pretreatment decomposed nearly 30% of rice straw after24 days of incubation. In this research the mixed
culture of P. chrysosporium and T. versicolor decomposed less than 30% of the sugarcane bagasse, because of shorter
time of incubation and different chemical compositions of the substrate. Shorter incubation time of fungal pretreatment
could reduce the weight loss of biomass (Orozco et al, 2007).
Figure 1.Loss of sugarcane bagasse components after pretreatment with mixed culture ofP. chrysosporium and T.
versicolor for 2 weeks
Single culture of P. chrysosporium or T. versicolor was not able to remove the lignin component in the
lignocellulosic biomass selectively (Taniguchi et al, 2005). However, this study reveals that mixed culture of P.
chrysosporium and T. versicolor in showed a promising combination, because they could remove or degrade more lignin
than α-cellulose in the biomass. They together degraded 16.78% of lignin, 11.88% of α-cellulose and 19.92% of
hemicellulose in sugarcane bagasse after 2 weeks of incubation. Anita et al. (2011) reported that another mixed cultureof
fungi, Trametes versicolor and Pleurotus ostreatus, degraded 17.21% of lignin, 26.94% of α-cellulose, and 48.45% of
hemicellulose in sugarcane bagasse after 4 weeks of incubation.
3.2. Hydrolysis under microwave irradiation
Previous research reported that power level of microwave had significant effectson the hydrolysis of
lignocellulose. Fajriutami et al.(2012b) reported that the higher the power, the more reducing sugar produced in the
hydrolysis of sengon pulp. The reducing sugar production from dilute acid hydrolysis of sengon pulp was started after 10
minutes of microwave irradiation at 30% of microwave power and after 5 minutes of microwave irradiation at 50% of
microwave power. Therefore, in this research we used 50% of microwave power which was equal to 550 W.
3.2.1. Effects of Pretreated Sugarcane Bagasse (PSB) Concentrations
Study on the effect of PSB concentrationson reducing sugar and HMFproductions were conducted by mixing
1%, 2%, 3%, 4% and 5% PSB in acid solution at 1% (v/v) and irradiated for 5 minutes. Figure 2a shows the effect of PSB
concentration on reducing sugar production after hydrolysis under microwave irradiation with sulfuric acid and oxalic acid
catalysts. The PSB concentration had significant effect based on analysis of variance (p<0.05). However, the increase of
PSB concentrations up to more than 2% was not efficient, because multiple comparisons analysis showed thatthe
significant reducing sugar yield were obtained after increasing PSB concentration from 1% to 2%. The average reducing
sugar yield was increased from 3.86 g/100 g pulp to 54.81 g/100 g pulp.
The PSB concentrations also had significant effect on the production of HMF (p<0.05). HMF is a by-product
formed in acid hydrolysis of lignocellulosic materials that contained polymers of C6 sugars, such as cellulose . It is the
most important inhibitor during fermentation of dilute-acid hydrolyzates.Therefore, lower amount of HMF in the
hydrolysatesis desirable [15]. Figure 2b shows that the highest HMF concentration was 0.91 mg/100 g when 5% of PSB
was hydrolyzed. At 2% of PSB concentration, the average HMF concentration was 0.30 mg/100 g. Thus, it is
recommended to use 2% of PSB concentration, because at higher PSB concentration there was more HMF produced
and no significant increase of reducing sugar yield detected.

POSTER PRESENTATION PROCEEDING OF THE FIFTH INTERNATIONAL SYMPOSIUM OF INDONESIAN WOOD RESEARCH SOCIETY
121
3.2.2. Effect of Duration of Microwave-Irradiation
The duration of microwave-irradiation had significant effect on reducing sugar production (p<0.05). The
reducing sugar production was started after 2.5 minutes irradiation of acid hydrolysis (Figure 3a). The highest reducing
sugar production was obtained when PSB was hydrolyzed by dilute sulfuric and oxalic acid for 15 minutes, which were
21.15 g/100 g pulp and 21.91 g/100 g pulp, respectively. These results were in agreement with our previous research
(Fajriutami et al, 2012a,b) which reported that 15 minutes duration of microwave irradiation resulted in the highest
reducing sugar production from dilute acid hydrolysis of oil palm empty fruit bunch pulp and sengon pulp.
Unfortunately, the 15 minutes irradiation resulted in the highest HMF production as well. Figure 3b shows that
the HMF production was significantly affected by duration of microwave-irradiation (p<0.05). The highest HMF
concentration after 15 minutes of irradiation was 62.31-62.66 mg/100 g, either with dilute sulfuric acid or oxalic acid
catalyst. Based on multiple comparisons analysis, during the first 7.5 minutes of microwave irradiation the HMF
concentration did not increase significantly. The HMF concentration was increased from 5.42 to 64.91 mg/100 g and from
8.99 to 67.43 mg/100 g when PSB was microwave heated for 10 minutes with dilute sulfuric acid and oxalic acid,
respectively. Therefore, in order to prevent the production of HMF, the duration of irradiation should not be more than 10
minutes.
Figure 2. Effects of pretreated sugarcane bagasse (PSB) concentrationson reducing sugar yield (a) and HMF
concentration (b) when hydrolysis reaction was catalyzed by 1% dilute acid solution under microwave
irradiation (550 W) for 5 minutes.
Figure 3. Effects of duration of microwave-irradiation on reducing sugar yield (a) and HMFconcentration (b) when 3%
(w/v) of PSB was hydrolyzed under microwave irradiation (550 W) with 1% acid solution
(a) (b)
(a) (b)

POSTER PRESENTATION PROCEEDING OF THE FIFTH INTERNATIONAL SYMPOSIUM OF INDONESIAN WOOD RESEARCH SOCIETY
122
3.2.3. Effect of Dilute Acid Concentration
The dilute sulfuric and oxalic acid concentrations had significant effect on reducing sugar yield (p<0.05). However,
the increasing of sulfuric acid concentration to more than 1% did not have any significant effect on the sugar yield. The
increasing of oxalic acid concentration to more than 2% also did not have significant effect on the sugar yield. Figure 4a
showsthat the reducing sugar yield were 4.70 g/100 g pulp and 1.66 g/100 g pulp when hydrolyzed uder microwave
irradiation of 550 W power for 5 minutes with 1% sulfuric acid and 1% oxalic acid, respectively. The reducing sugar yield
from dilute sulfuric acid hydrolysis was higher than that from oxalic acid, because at the same acid concentration there
was lower concentration of H+ ion formed in oxalic acid solution than that in sulfuric acid solution. Qin et al. (2012)
reported that organic acid pretreatment resulted in lower glucan content than sulfuric acid at the same condition. On the
other hand, the HMF production during 5 minutes of irradiation was not affected by concentration of dilute acid solution
(p<0.05). Figure 4b showsthat the average concentration of HMF after microwave irradiation for 5 minutes with dilute
sulfuric acid and oxalic acid catalysts were 0.00–0.52 mg/100 g and 0.00–1.04 mg/100 g, respectively.
Figure 4. Effects of dilute acid concentrations in the microwave- assisted hydrolysis (550 W, 5 minutes) of PSB (3%
w/v)on reducing sugar yield (a) and HMF concentration (b)
4. Conclusions
The mixed culture ofP. chrysosporium and T. versicolor could selectively remove or degradelignin during the
pretreatment of sugarcane bagasse. This research also showed that the pretreated sugarcane bagasse concentrations
and duration of microwave-irradiaton had significant effect on reducing sugar yield and the HMF formation.The dilute acid
solution concentrations had significant effect only on reducing sugar yield. It was recommended that the hydrolysis was
conducted using 2% (w/v)substrateconcentration and,1% dilute sulfuric acid. To prevent the production of HMF, the
duration of irradiation should not be more than 10 minutes at 550 W microwave power.
5. References
Aguilar R, Ramirez JA, Garrote G, Vazquez M. 2002. Kinetic study of the acid hydrolysis of sugar cane bagasse. Journal
of Food Engineering 55: 309–318.
Anita SH, Fajriutami T, Fitria, Ermawar RA, Yanto DHY, Hermiati E. 2011. Pretreatment Trametes versicolor dan
Pleurotus Ostreatus pada bagas untuk produksi bioetanol. Jurnal Teknologi Indonesia 34: 33-39. (in Bahasa
Indonesia)
Cardona CA, Quintero JA, Paz IC. 2010. Production of bioethanol from sugarcane bagasse: Status and perspectives.
Bioresource Technology 101: 4754-4766.
Demirbas A. 2005. Bioethanol from cellulosic materials: A renewable motor fuel from biomass. Energy Sources 27: 327-
337.
Fajriutami T, Sudiyani Y, Hermiati E. 2012a. Dilute acid hydrolysis of oil palm empty fruit bunch pulp under microwave
irradiation. Proceedings of The 3Rd International Symposium of Indonesian Wood Research Society (IWoRS)
Jogjakarta, Indonesia 3-4 November 2011. Page 200-204.
(a) (b)
POSTER PRESENTATION PROCEEDING OF THE FIFTH INTERNATIONAL SYMPOSIUM OF INDONESIAN WOOD RESEARCH SOCIETY
123
Fajriutami T, Fatriasari W, Hermiati E. 2012b. Sengon pulp hydrolysis by dilute acid under microwave irradiation.
Proceedings of The 2nd Korea-Indonesia Workshop and International Symposium on Bioenergy From Biomass,
Serpong, Indonesia 13-15 June 2012. Online Edition. Page 83-86.
Mtui GYS. 2009. Recent advances in pretreatment of lignocellulosic wastes and production of value added products.
African Journal of Biotechnology 8: 1398-1415.
Hermiati E, Mangunwidjaja D, Sunarti TC, Suparno O, Prasetya B. 2010. Pemanfaatan biomassa lignoselulosa ampas
tebu untuk produksi bioetanol. Jurnal Litbang Pertanian 29(4): 121-130. (in Bahasa Indonesia)
Lee J, Rodrigues RCLB, Jeffries TW. 2009. Simultaneous saccharification and ethanol fermentation of oxalic acid
pretreated corncob assessed with response surface methodology. Bioresource Technology 100: 6307–6311.
Orozco A, Ahmad M, Rooney D, Walker G. 2007. Dilute acid hydrolysis of cellulose and cellulosic bio-waste using a
microwave reactor system. Trans IChemE, Part B, Process Safety and Environmental Protection 85(B5): 446-
449.
Pandey A, Soccol CR, Nigam P, Soccol VT. 2000. Biotechnological potential of agro-industrial residues I: sugarcane
bagasse. Bioresource Technology 74: 69-80.
Qin L, Liu Z, Li B, Dale BE, Yuan Y. 2012. Mass balance and transformation of corn stover by pretreatment with different
dilute organic acids. Bioresource Technology 112: 319–326.
Shi J, Chinn MS, Sharma-Shivappa RR. 2008. Microbial pretreatment of cotton stalks by solid state cultivation of
Phanerochaete chrysosporium. Bioresource Technology 99: 6556-6564.
Sun F, Li J, Yuan Y, Yan Z, Liu X. 2011. Effect of biological pretreatment with Trametes hirsuta yj9 on enzymatic
hydrolysis of corn stover. International Biodeterioration & Biodegradation 65: 931 - 938.
Sun Y, Cheng J. 2002. Hydrolysis of lignocellulosic materials for ethanol production: a review. Bioresource Technology
83: 1-11.
Taniguchi M, Suzuki H, Watanabe D, Sakai K, Hoshino K, Tanaka T. 2005. Evaluation of pretreatment with Pleurotus
ostreatus for enzymatic hydrolysis of rice straw. Journal of Bioscience and Bioengineering 100(6): 637-643.
Velmurugan R, Muthukumar K. 2011. Utilization of sugarcane bagasse for bioethanol production: Sono-assisted acid
hydrolysis approach. Bioresource Technology 102: 7119–7123.
Sasaki C, Takada R, Watanabe T, Honda Y, Karita S, Nakamura Y, Watanabe T. 2011. Surface carbohydrate analysis
and bioethanol production of sugarcane bagasse pretreated with the white rot fungus, Ceriporiopsis
subvermispora and microwave hydrothermolysis. Bioresource Technology 102: 9942–9946.
