proceedings of a workshop on sulphur gas research in...
TRANSCRIPT

PROCEEDINGS OF A WORKSHOP ON SULPHUR GAS RESEARCH
IN ALBERTA
Edited by
Drake Hocking
David Reiter
Nor thern Fores t Res earch Cent re
Informat i on Report NOR-X-72
December 1973
Canad i an Fores try Servi ce
Env i ronment Canada
5320 - 122 S tree t
Edmonton, A l berta, Canada
T6H 3S5
ThM WoJtkAhop Wah jo.i.nfty .6pon6oJte.d by :the. Re..6e.aJtch Se.CJtdaJUa.t,
A1.beJt:ta. Env-<.Mnme..u: a.nd the. NoJt:the.Jtn FOJte..6,i Re..6e.aJtch Ce.n-tJte.,
En v,{.Jto nm e.n-t Ca.nada..

i
Foreword
SuZphur dioxide is an ail' poZZutant of worU-1iJide inaidenae .
It is a aomponent of urban ail' poZZution and of emissions from mineral.
sme Zters. GeneraZZy, other ail' poZZutants aaaompany suZphur dioxide
exaept where high-suZphur fue Zs are burned for power generation in remote
areas .
In AZberta, urban ail' poUution is not dominated by suZphur
dioxide, nor are 'large areas affected by mineral. sme Zting operations .
The primary souraes of suZphur dioxide are sour natural. gas proaessing
pZants, whose emissions are reZative Zy free from poZZutants other than
suZphur dioxide. AZberta offers an opportunity to study a'll. aspeats of
a major ail' poZ Zutant in iso Zation from aonfounding aompZex mixtures .
AZso the magnitude of suZphur dioxide emissions poses a partiauZar probZem
for AZberta. Proaessing the vast tal' sands of northeastern AZberta may
introduae emissions on an even 'larger saaZe .
This workshop shouZd benefit reseal·ah programs in industry,
aonsuZting firms, and government. AZthough muah researah has been and
is being aonduated, researchers from various disaipZines have at times
worked in re Zative isoZation. The workshop provided a needed forum for
the exahange of data and opinions, and it is hoped that this 1iJiZZ be
aontinued in future workshops .
We thank Dr. E.E. BaZZantyne, Deputy Minister, AZberta Depart
ment of the Environment, Dr. G . T. SiZver, Director of the Northern Forest
Research Centre; and a'll. participants .
Drake Hocking
S . B . Smith

ii
CONTENTS
Foreward"
CONTRIBUTED PAPERS
An Overview
1 . Hocking, D. Paretian Environmental Analysis as applied
to sulphur dioxide emission in Alberta .
Technological Transformation of Sulphur Gases
2 . Rankine , R. P . , Kerr , R.K. and Paskall , H .G . Potential
efficiencies of the conventional Claus sulphur
recovery process .
3 . Mohtadi , M. F. and Dingle , H .B . Removal of S02 from wet
stack gases of sour gas plants . (Abstract . )
Atmospheric Dispersion of Sulphur Gases
4 . Rowe , R. D . Short and medium range atmospheric diffusion
in the Alberta environment . (Extended Abstract . )
5 . Lee , G. K. , Whaley , H . , Gainer , J . G . Plume dispersion
research at natural gas sulphur extraction plants .
(Abstract . )
6 . Wallis , J . , Aziz , K. , and Donnelly , J . K . Computer
simulation of pollutant dispersion: Single stack
and air shed models .
Other Atmospheric Influences
7 . Mohtadi , M. F . The fate of S02
in the atmOSiJl1�re . (Abstract . )
8 . Sandhu , H. S . The atmospheric photochemistry of S02'
9 . Krouse, H.R. Sulphur isotope abundan�e and environmental
assessment : applications to sulphur gas research in
Alberta.

iii
10. Nyborg , M. and McKinnon , Allen and Associates Limited .
Atmospheric su lphur dioxide: effect on the p H and
sulphur content of rain and snow; and addition of
sulphur to surface waters , soi l, and crop s .
1 1 . Baker , J . , Hocking D. , and Nyborg, M. Effects of
atmospheric sulphur dioxide on rain intercepted by
forest vegetation.
Biolo gical Impacts of Sulphur Gases
Hocking, D. Introductory Editorial: Some terms for symptoms on
p lants exposed to sulphur gases .
12 . Loman , A .A. Sulphur dioxide and forest vegetation in the
vicinity of sour gas p lants . (Abstract . ) 13 . Blauel, R.A. and Hocking , D. Sulphur gas impact surveys and
research at the Northern Forest Research Centre .
14 . Legge , A. Design of a gas-exchange system for the study of
the effects of sulphur dioxide upon vegetation .
15 . Case, J .W. Lichens as bioindicators of S02 '
16. Lee , T . and Vitt , D. H. A preliminary study of the effects
of air po llution on lichen and bryophyte vegetation
near Edmonton, Alberta .
Monitoring and Regulation
17 . Description of Mobile Monitoring Unit of Gulf Oil Canada
Limited .
18 . Lack, J . Review of monitoring data availab le from Alberta
DOE . , with specific tabulations for sour gas processing
p lants .

iv
19. Gainer , J . G. The Industry/Government Sour Gas
Environmental Committee . (Abstract . )
20. Baraniuk, E. Brief out line of the Whitecourt area
Environmental Study Group . (Abstrac t . )
21 . Smith, S . B . Future financing of sulphur gas research.
(Abstract . )
C losing discussion summary.
Participants ' names and addresses .

An OVerview

PARETIAN ENVIRONMENTAL ANALYSIS
AS APPLIED TO
SULFUR DIOXIDE EMISSIONS IN ALBERTA.*
by
Drake Hocking
Northern Forest Research Centre , Edmonton
*A fuller version of this paper was published as Information Report NOR-X-69 , available from the Northern Forest Research Centre , Edmonton .

- 1 -
1 . Introduction
Effective decisions on environmental policy are best reached
through systematic mathematical and economical analysis . A non-judge
mental criterion for evaluating alternative policies was formulated in
the late 19th century by Vilfredo Pareto (1848-1923) , an Italian political
economist born in Paris . He postulated that any change which harms no one
and which makes some people think they are better off is an improvement .
This postulate, known in economic theory as the "Pareto criterion" and
valuable for its social neutrality , was rarely applied , even in the other
theoretical constructs of Pareto and his contemporaries . The idea
survived , however , and was taken up in a formal decision analysis system.
Paretian Environmental Analysis , developed by the Harvard
Environmental Systems Program, incorporates the interests of the people
affected by a decision together with technological and economic data
into a set of net benefit functions. Judgements of the analyst are
incorporated into the functions by explicitly weighting the net benefits
by the estimaterl political influence of each interest group . Sensitivity
of the decision to political influence may readily be tested by solving
for different weights .
The analysis admits only those potential decisions that cannot
be improved in terms of overall net benefits without making at least one
participant worse off . Such decisions are defined as Pareto admissible .
The model is logical:
"If an environmental control agency can adjust its policy to the
benefit of some interested party , and if no one else is disadvantaged by
the change, then the adjustment is likely to be made. Put another way,

- 2 -
no agency is likely to take a measure that purposefully harms one of its
constituents if no others stand to gain by it , and a truly interested
party is not likely to let itself be disadvantaged by accident or
inadvertence . " (Schaumburg , unpub . )
In short , you do have to use your j udgement . When this is
necessary , it is bes t to make it explicit . The many and diverse elements
of complex decisions can be stated concisely in mathematical notation .
Sys tematic analysis reveals informational gaps and provides a way of
tes ting the sensitivity of decisions to error in estimates used to fill
these gaps . By programming the functions on a computer , revisions of
the decision in the light of new data , can readily be made .
2 . Summary of Paretian Environmental Analysis
The basic s teps are :
1. Definition of the decision .
a . the physical system
b . indices of environmental quality
c. pol icy instruments and control measures
d . cons traints
2 . Identification of the interes ted parties .
3 . Determination of the technological relations between a
potential decision and resulting environmental quality .
a . relations between the decision and probable emissions
b . relations between emissions and ambient concentrations
c . relations between ambient concentrations and environ
mental quality .
4 . Formulation of net benefit functions .
- 3 -
5 . Solution for Pareto-admissible decision alternatives .
6 . Prediction and prescription.
3 . The basic steps applied to S02 emissions in Alberta
3 . 1 Definition of the decision
There are alternative types of control , dispersal , definition ,
measurement and specification of emissions . It is uncertain in many
areas the extent to which emissions influence environmental quality . Any
rational decision must first be defined .
This paper analyses the revision of ambient air quality standards
for sulfur dioxide proposed by the Alberta Department of the Environment .
3 . 1 . 1 The physical system
Much data defining the present decision are common knowledge in
Alberta so the treatment here will be very brief . Owing to the political
history of Canada , the province of Alberta is the geographical limit of
the decision . Subsidiary decisions will be necessary for each S02 emitter
currently in operation and for proposed new ones .
Topography and climate , the existing and intended land uses ,
individual and classes of emitters , and the time horizon (how long the
decision will have to be in force) also must be defined . Details of
these apply to different successive stages of the analysis . Much of the
province is comparatively flat prairie with gentle hills and valleys .
Some emitters , however , are situated in severely undulating foothills with
complex intersecting valley and ridge systems . The province has short
hot summers and long very cold winters . Many areas have extended periods
with very light or no wind .
MOst emitters are situated in agricultural land with scattered

- 4 -
human residences . Those in the foothills are generally located in
forested areas supporting both timber production and recreational uses .
Some affect areas of diversified land uses ; areas affected by effluents
tend to overlap in some cases .
The time horizon for the decision is influenced by any sulfur
dioxide emitting process . Although tar sands processing may be likely
to dominate total sulfur emissions in the future , for the present these
are due almost entirely to sour natural gas processing . The allowable
daily production of a gas field is based on a 20-year life . Therefore ,
20 years is the effective time horizon for any given area of influence of
any one gas plant . Complications may arise from a variety of sources .
Most , however , can be handled through modifications to specific requirements :
checking how much exposure the area has already had .
3 . 1 . 2 . Indices o f environmental quality
The primary index of environmental quality that is directly
relevant to the present decision , is the ambient concentration of sulfur
dioxide . A fluctuating standard has merit for serious consideration .
The major source of S02 is incinerated tail gas from sulfur
recovery . Other sources of S02 exist , notably flare stacks . There is
very poor knowledge of the details o f either combustion or dispersion
from flare stacks . This is doubly a problem , as flare stacks are in
continuous use at sour gas processing plants where the sulfur content
or the volume throughput is small enough to deem a sulfur recovery pro cess
unwarranted .
Gas plants have other environmental impacts . Some are covered
in other regulatory decisions ; some are left to individual complaint and

- 5 -
bargaining ; some have been left to legal process . Here , only atmospheric
sulfur dioxide will be considered .
3 . 1 . 3 Policy instruments and control measures
The Alberta Department of Environment sets standards for ambient
air quality , and is the decision body in this analysis . The Energy
Resources Conservation Board (ERCB) enforces these standards in the gas
processing industry through instruments such as approvals and informational
letters . A set of new ambient standards for sulfur dioxide has been
proposed by the Department of Environment , specifically for gas plants ,
and the ERCB has issued "guidelines" for improved sulfur recovery efficiency
relating to plant size .
Essentially , ambient air quality standards are the legal basis for
regulation of emissions . But the proposed new standards contain , in
addition , an effluent or stack concentration standard , to be derived for
each plant from dispersion models rel ating to new ambient standards .
This would be a more effective regulatory instrument , being much simpler
and cheaper to measure than ambient sulfur dioxide levels . However, it
lacks the allowance for adverse weather and temperature inversion effects ,
so more stringent ambient standards also are proposed .
A novel policy instrument not mentioned in the proposed new standards
is a provision for modulating the ambient standard according to probable
effects upon receptors . A fuller discussion follows in Section 3 , but in
short , a higher ambient concentration could be tolerated during winter
months when vegetation is less sensi tive and gas demand is higher . Short
term modulation of the effluent standard may also he possible with
sophisticated monitoring of dispersal conditions and effective predictive
models .

- 6 -
Control measures available include reduced quantities and improved
dispersion of effluents . Quantities may be reduced by improving efficiency
of sulfur recovery or by lowering production rates . Better dispersion may
be achieved by increasing the effective stack height .
3 . 1 . 4 Constraints
A decision may be limited by legal , technological , economic , or
political constraints .
For the current decision , the legislative framework does not limit
the regulatory powers of the Department of the Environment and the ERCB.
Technological constraints exist at a level of 99 . 9% recovery of sulfur;
combined with a consideration of economics , probably the practical tech
nological constraint is 99 . 4% recovery. But local economic constraints are
minimal because cost increases might be spread over the large volumes
exported . Political constraints are very low due primarily to increased
public support for measures to improve environmental quality .
In short , the present decision has remarkably broad latitude in
all of the legal , technological , economic and political contexts .
3 . 2 Identification of the interested parties
There are several levels of influence on a decision regarding
ambient standards for sulfur dioxide, and there are several ways of
-classifying interested parties with direct influence . All participants
(actors) probably have some interests that are more or less conflicting
and that are affected negatively and positively by all degrees or
alternatives to a decision. To identify the principle discrete interests ,
several levels of disaggregation may be attempted . Re-aggregation of
interests ansnmed to be represented in the actions of the principle
actors simplifies the model .

- 7 -
In the Alberta sulfur dioxide decision, the interested parties
are represented by "lumps" of distinct groups whose real interests are
not necessarily congruent . But the interests of groups lumped together
do at least converge and are affected in similar ways by the decision • .
The maj or participants , with their interests , are:
a . The Canadian Department of the Environment , through national
air quality ambient standards established under the Clean Air Act of 1971 .
b . The provincial Alberta Department of Environment , through
its Air Pollution Control Branch which sets standards and the ERCB which
enforces them.
c . The Alberta government biological management agencies , to
establish the best possible standards for their constituents .
d . The general populace , mostly through conservation-minded
organizations .
e . Sour gas processing plants , through incurring the maj or costs
of more stringent standards . Although only 4 2 actually extract elemental
sulfur , the other plants have at stake their rates of production .
f . Gas consumers , in the price they pay for their commodity.
g . Provincial government resource development agencies , in
exploitation of resources .
3 . 3 Determination of the technological relations between the decision
�ched and resulting environmental quality
This phase has three parts : the relations between the decision
and the probable actual emissions , the relations between those emissions
and ambient concentrations , and the impact of those concentrations upon
environmental quality (their effects upon receptors) . Any new set of

- 8 -
ambient air quality standards that is more stringent than the previous
standards will probably initiate a round o f technological improvements
and/or reduced plant through flows in efforts to meet those standards . It
is crucial to the decision on standards to consider to what extent the
industry can and will abide by them .
3.3.1 Relations between the decision and probable emissions
Regular violations of ambient air quality standards o ccur . Many
are caused by probabilistic malfunctions of equipment and stochastic
weather influences . Such violations have been detected by continuous
monitoring stations located some distance from emission sources . Adoption
o f emission standards and in-stack monitoring will mean quicker and more
certain detection of violations , permitting more rapid corrective action
by the plant . This aspect of the new proposals will likely lead to fewer
violations o f shorter duration ; hence closer adherence to the ambient
standards.
3 . 3 . 2 Relations between emissions and ground level concentrations
Local topography and weather may lead to ground level concentrations
exceeding ambient standards as frequently as before , despite in-stack
monitoring of emission rates . And flare stacks can lead to very high
concentrations; current regulations permit up to 1.0 ppm for periods up
to 1 hour .
3 . 3 . 3 Relations between ambient concentrations and quality
Definition of the quality index , Q , is best done through examination
of the effects of the probable ambient concentrations upon receptors . The
linkage in the case of sulfur dioxide is extremely complex , owing to a wide
range of prediEpositional and environmental variables .
- 9 -
Levels of S02 resulting in measurable adverse effects on human
beings are in the order of 0.1 ppm. In Alberta, the areas likely to be
subject to the highest concentrations of emissions are mostly uninhabited .
Hence the effects are more likely to be noticed first on vegetation . But
these effects are impossible to predict because they depend on at least
8 environmental variables (Loman , Blauel and Hocking , 1972, for review) .
Most plant species become le�s susceptible to acute injury during
dormancy , which occurs in the winter (op . cit . 1972). Thus it might be
possible to build into the standards a provision for modulation according
to the current sensitivity of surrounding receptor vegetation . This would
be particularly valuable for an industry wi<:h seasonally fluctuating
volumes like the gas processing plants , since the season of probable lowest
receptor sensitivity coincides with tQe season of highest demand and there-
fore greatest throughf:i.ow and emission T.'ates.
4 . Determination o f the net benefit functions - -
The types o! b�11efits that w:i.ll accrue in many areas are heavily
weighted towards those which are difficult tJ measure�
Benefits; ----_.
1. improved human , animal and plant health;
2. r �d'lced material damage ( corrosion , etc . ) ;
3. consequent more valuable agricultural and forest harvests;
4 . consequent improved recreational opportunities and
utilization;
5 . vicarious satisfaction o f city dwellers knowing that
healthy forests are available;
6 . reduced risk o f long-term land-use degradation; and
7. sale value o f sulfur recovered.

- 10 -
Cost data for improved sulfur recovery pro ces�es is reasonably
accurate , related to percentage recovery and to plant design capacity .
Although direct costs of controls increase sharply with efficiency o f
recovery , the total costs are small and decreasing compared t o the overall
value of product .
In the Alberta decision , the costs lie in the following :
Costs : 1. purchase , installation and operation of additional Claus units .
2. purchase , installation and operation of tail-gas clean-up
units .
3. additional monitoring instruments , if necessary , for ambient
quality enforcement .
4 . in-stack monitoring instruments (these are already being
required by the ERCB) .
5 . reduced production of sales gas in plants whose allowable
throughput is curtailed to meet standards .
6 . higher prices of p roduct gas to consumers .
Development of functions :
For each of the gas plants (i) there is associated a particular
control method (x.) with its capital costs (¢. (x.» . Through the federal 1 1 1
government , the capital costs may be discounted by an interest rate (in
this example , 7 . 5%) and the amortization period (20 years ) .
Using these assumptions , the following federal government (f)
cost function ( Cf.) applies :
1
(1)

- 11 -
The first term would be zero for those plants whose control method
is reduction of the throughput without installation of recovery equipment
In these cases , the second term would represent the annual costs of lost
production (G.). �
The annual costs perceived by the gas plant owner (k) would re-
quire different factors a and b allowing for taxation credits on the
control equipment , including rapid depreciation allowances . These may
be represented as follows , for each gas plant i .
Ck (x. ) = a <I>. (x. ) + bG. (x. ) . � � � � � � "
Summing the cos ts perceived by the federal government :
and by the industry:
67 CI (x) = � Sk. (xi
) i=l 1.
(2)
(3)
(4)
The provincial government probably does not perceive the direct
control costs as its own , because much of the total would remain in the
province through local supplies of equipment and expertise .
For the Alberta s ituation , the generalized form o f the benefit
(B) function for health of living organisms at the resulting environmental
quality ( Q') is
B( Q' ) 3
= t j =l
b o. qJ. R
J o. J
(5)

- 12 -
where (qj
) is the improvement in quality in sector (j) (human habitation,
agricultural, or forested zones), (b ) is a function of the concentration o.
J level prevailing and the particular organism concerned (human, plant, or
animal and (R ) is the population of organism (0) in sector (j) (for o. J
plants, expressed perhaps in acreages). In areas where the soil is sulfur
deficient (as in Alberta), some level of emissions (b ) above zero will o.
J provide positive benefits to plant growth.
The sizes of the benefits perceived by each party are represented
by a set of weights (A). Sensitivity of the decision to differing weights
will indicate the importance of the accuracies of these benefit measures.
Together, these generalized cost and benefit functions contain
sufficient data to form net benefit (NB) functions for each interested
party,o as follows:
a. For the Canada Department of Environment, the function is
derived from (3) and (5) :
(6)
b. The Alberta Department of Environment (p), together with the
Energy Resources Conservation Board, would perceive only
benefits: 3
NB (x) = A B (Q') = A E b q. R P P P j=l
OJ J OJ c. The biological management agencies of the provincial
government would also perceive only benefits: 2
NB , (x) = A , B(Q') = A, � b qj
R P P P j=l 0q OJ
where (0) is only plant and animal organisms (excluding
( 7)
(8)
direct human health benefits) and (j) is restricted to the
agricultural and forested zones.

- 13 -
d. The general populace (g) also perceives only benefits:
3 NB (x) = A B (Q') = A E b q R
g g g j=l OJ j OJ (9 )
where the constraints o n (0) and (j) i n (8) above are
removed.
e. The industry (I) perceives net benefits only as costs; less
the sale value ($) of recovered sulfur:
67 NBr (x) = $ - C (x) = $ - E Ck.
(xi) s I s i=l � (10)
where ($ ) is the overall sale value of recovered sulfur. s
For 19 73 , the value to industry as a whole has been estimated
at thirty million dollars (Oilweek).
f. Gas consumers, when distinguished from their other roles in
the general populace, likewise perceive only costs of in-
creased gas prices.
NB (x) = dV c ' (11)
where (d) is the price increment and (V) is the total volume
purchased. Because (d) is a direct function of the net costs
of the gas industry (owing to the pricing methods of the
Public Utilities Board), equation (11) becomes
NB (x) c = - (12)
g. Similarly, the provincial government agencies responsible
for development and resource exploitation (pI!) would perceive
costs to industry in terms of discouragement of new investment
and loss of royalties.

NB ,,(x) = - A "CI(x) p . p
- 14 -
where a part of <Ap'.') could be computed from royalty
structures .
5 . Determination of the Pareto-admissible frontier
(13)
This stage involves solution of the maximization problem set by
Summing the set of net benefit functions weighted by a vector
w = (W1' • • • • • ,w7) that indicates the political influence o f each
identified party (k):
7 Maximize � wk NBk(x)
k=1
subject to
Q .s. Q' for each (w) .
( 14)
Completion of the study will involve the fitting of "best-estimate"
data to the functions and solving the maximization problem for differing
political weights (w) and benefit weights (A) .
6 . Prediction and Pres cription
Properly , this s tep should await comr>letion of steps 4 and 5 . But
some j udgements may be made without the quantitative data , aided by the
systematic examination of the elements of the decision . The p roposed set
of new s tandards is likely to be adopted with little modification . This
j udgement is based on the array of weights applicable to the participants
whose interests lie in more s tringent s tandards .
An ambient standard is desirable for uniformity , but i t is hard to
enforce. It is logical , therefore , for the ERCB ( the enforcement body) to
want to apply emission s tandards to individual gas plants . Emissions are

- 15 -
much easier to measure (and therefore apply standards to) than is en
vironmental quality , the implied aim of ambient air quali ty s tandards .
But this proposed control route is not necessarily the most cost-efficient .
Because of weather , a given emission rate leads to a highly variable S02
concentration or exposure at the point of a receptor . Furthermore , the
effects of any given exposure upon environmental quality is also dependent
on the fluctuating sensitivity or tolerance of the recepto rs . Emission
standards , i f cons tant , mus t be s tringent enough to satisfy the mos t
probable poor�di6persal conditions and the mos t probable high sensitivity
of receptors . Sulfur �ecovery equipment to meet such standards would be
very expensive .
If gas plants w·ere able and willing to modulate S02 emissions in
immediate response to ambient air monitors , then continuously stringent
emission standards might no t be necessary . In weather conditions giving
good dispersal , higher emission rates might be acceptable . This would be
true even if varying receptor sensitivity were not considered .
If sufficient data were available to describe and monitor the
factors affecting recep tor sensitivity , greater emissions might be
acceptable during periods of predictable relatively high tolerance .
Intensive b iological monitoring (observation of effects on living organisms)
might be a method of feedback to plant operators fo r both variables des
cribed above .
Adequate research to satisfy the uL�ertainties in the fore-going
alternatives to emission standards will undoub tedly be very expensive . But
i t might be more cos t-effective in the long rUll.
..

- 16 -
Summary and conclusions
In air quality management for natural gas production in Albert a ,
s carcity and generality of data make many of the factors in net benefit
functions impossible to quantify at this time . Specifically, many of the
benefits of more string�nt S02 cont rols are in areas of diffuse information .
Data are weak, for example , on recreational benefits , on health benefits
of plants and animals , and on valuations of these .
Furthermore , there is some question as to the cost-effectiveness
of the control instruments under development or consideration . In particu
lar , the proposed emission standards ( as opposed to ambient s tandards) seem
rather rigid in view of the unpredictable variations in dispersal conditions
and the predictable (but as yet unknown) fluctuations in sensitivity of
receptors . But allowance for these var:.ables requires the gas processing
plants to be able and willing to rapidly modulate emissions in response to
physico-chemical and biological monitors .
Solution of net-benefit functions developed for Alberta must follow
further research to develop es timates of values presently unknown .
References
Loman , A.A. , R.A . Blauel , and D. Hocking . 1972 . Sulfur dioxide·
and ·forest vegetation . Inf . Rept . NOR-X-49 . Northern
Forest Research Centre , Edmonton .

TeahnoZogiaaZ Transformation of
SuZphur Gases

- 17 -
POTENTIAL EFFICIENCIES OF THE CONVENTIONAL
CLAUS SULPHUR RECOVERY PROCESS
by
Robin P . Rankine , Rich K. Kerr , Harold G. Paskall
WESTERN RESEARCH & DEVELOPMENT LTD . Calgary, Alberta
ABSTRACT
The latest advances in Claus process technology are discussed in
the light of recent theoretical prediction , together with supporting
evidence obtained in the field . Unprecedented efficiency levels can
be achieved by conventional Claus sulphur recovery plants employing
as few as ttlQ catalytic stages . However , to sustain high level
efficiencies for extended periods of time , persistent catalyst
deactivation problems must be solved .
A paper pres�nted to the Alberta Sulphur Gas Research Workshop , Edmonton , Alherta , November 1 , 1973.
•

- 18 -
INTRODUCTION
During the past decade, pollution control agencies in Alberta
have imposed increasingly more stringent regulations on the operation
of sour gas processing plants in an effort to substantially reduce
sulphur dioxide emissions resulting from inefficiency in the sulphur
recovery aspect of these operations . In response , a considerable
research effort has been devoted , particularly during the past five
years , towards a sol�tion of the sulphur dioxide emission problem.
Until recently, the modified Claus process has been universally
employed in sour gas processing operations . It would seem natural then
that the first research priority would be exploiting this process to its
fullest potential . However , by far the greater proportion of the total
research effort has been directed towards the development of new
processes which are intended to augment the efficiency of the Claus .
This emphasis on new processes reflects the widely-held opinion that the
potential of the Claus process has been exhausted by existing efficiencies
which are generally in the 90-97 percent range. The purpose of this paper
is to present , in an informal way , the results of recent theoretical
calculations and field scale experiments which together clearly demonstrate
the potential of the Claus process to achieve efficiencies well in excess
of the above range. It is hoped that these results will encourage
interested parties to devote a greatEr proportion of their research
effort towards the solution of certain catalyst problems which continue
to �ef1ect on the long-term viability of the Claus process .

- � -
THEORETICAL PREDICTIONS
The technique used for thermodynamic equilibrium calculations
is that of free energy minimization . It has the distinct computational
advantage over equilibrium constant calculations in that no knowledge of
reaction mechanisms is required . Several authors (Lees & Ryan 1971 , Barry
1972 , Boas & Andrae 1971) have used this technique to predict optimum
efficiencies for three s tage Claus plants in the range 96 to 97 percent .
Unfortunately most calculations have been based upon thermodynamic data
for sulpur vapour which are dated and in need of revis ion . Molecular
sulphur vapour exists in all forms from Sl to Sa (Berkowitz 1965) . Based
partly upon data from the literature (McBride et al . 1963) and partly
upon unpublished data developed by the authors , a multi-phase , mult i
component free energy minimization computer program has been developed
to predict field and laboratory performance of the Claus process (Rankine
1973) .
Since corepletion of the model las t spring , it has been used
extensively for theoretical studies of the Claus process . These studies
have led to the definition of several criteria for optimum Claus plant
performance :
1 . Each sulphur condenser should operate a t about 260°F . , which
provides a margin of about 20Fo above the freezing point of sulphur .
2 . Mist elimination equipment should be utilized in interstage sulphur
condensers as well as in the final condenser .

- 20 -
3 . Methods of reheat which introduce sulphur compounds into the main
gas stream should be avoided . Optimization implies that all sulphur
compounds should be introduced as far upstream in the process as
possible .
4 . The operation o f each converter should b e adj usted s o tha� the
actual and dew p0int temperatures converge at the converter outlet .
These criteria have not been applied to the design and operation of
existing Claus plants .
Practical limitations to these theoretical optimization criteria
are :
i ) Furnace conversion cannot b e predicted thermodynamically. In
this example a value of 60 percent was chosen . This is lower
than that which is generally observed ;
ii) The gas off the first sulphur condenser was assumed to be 330°F ;
iii) In considering certain side reactions , which must proceed in the
first converter , an outlet temperature of 62SoF was chosen . This
temperature is well above the sulphur dew point .
Thermodynamic recoveries from a four stage Claus plant process ing
a rich feed containing 67 percent hydrogen sulphide are :
2 Catalytic Stage Recovery 97 . 9 percent
3 Catalytic Stage Recovery 99 . 1 percent
4 Catalytic S tage Recovery 99 . 4 percent
The optimum yields for lean feed gas are not s ignif icantly different .

- 21 -
FIELD EXPERIMENTS
The thermodynamic predictions were tested during July 1973
in a maj or Claus plant operating in Alb erta . This plant employs front
end combustion and four stages of catalytic convers ion to process acid
gas containing approximately 82 percent hydrogen sulphide . The design
capacity of the plant corresponds to an inlet feed rate of equivalent
sulphur of approximat�ly 1600 long tons per day. Design features
include interstage mist elimination devices and indirect reheat to
the final catalytic s tage . These features help t o suppress the sulphur
dew point , thereby enhancing the potential for low temperature converter
operation. In addition, the catalytic charge in this plant was completely
replaced last May. TI1is provided a test s ituation in which there should
be no kinet ic limitations on plant efficiencies and therefore a s ituation
in which thermodynamic predictions should be applicable .
The most pertinent results of field tests are summarized in
Table 1 . This table includes the distribution o f total plant feed to
the front-end furnace and to the auxiliary burners , and the actual and
theoretical conversion and recovery efficiencies on a cumulative stage
by stage basis . Blanks in the table pertain to cases in which either
the theoretical calculations do not apply or appropriate measurements
could not be taken. The theoretical conversions were based on the actual
plant operating conditions , as opposed to the optimum conditions discussed
in the preceding section. The theoretical recoveries were based on the
actual conversion data together with condenser operating conditions .

- 22 -
The mos t relevant plant operating conditions are summarized
in Table II . These include condenser and converter outlet t emperatures
and the maximum sulphur dew point in each convert er . The latter
demonstrates how closely each converter was operating to the optimum
dew point condition.
DISCUSSION
The field data indicate that theoret ical thermodynamic
calculation for molecular sulphur vapour and the free energy minimization
program accurately predict the behavior of Claus units . Accurate pre
dictions have also been demonstrated in bench scale laboratory s tudies
(unpublished) •
Claus sulphur plants can attain recovery efficiencies in the
99+ percent region . These recoveries are sufficiently high to satisfy
all present day governmental requirements . However , persistent catalyst
problems remain which must be solved to sustain these efficiencies for
an extended period of time.
REFERENCES
Barry, C . B . 1972 . Reduce Claus Sulphur F�ission. Hydrocarbon Processing -
April (1972) : 102-106.
Berkowitz , J . 1965 . Elemental Sulphur. (ed . by B . Meyer) pp 125-159 .
In�e.rscience.
Boas, A.II. & R .C. Andrae . 1971 . S imulate SulpilUr Recovery Plants .
Hydrocarbon Process ing - March (1971) : 81-84 .

- 23 -
Lees , R. S . & J.J. Ryan. 1971 . Computer Design and Simulation of
Sulphur Plants . Gas Processing/Can . - July-August ( 1971) :
16-18 .
McBride , B . J . et al . 1963 . Thermodynamic Properties to 60000K for
210 Subsca2�es Involving the first 18 Elements . NASA
Publication SP-300l .
Rankine, R. P . 1973. Temperature Important to Optimized Claus Plant .
Gas Processing/Can. March-April (1973 ) : 16-17 .

TABLE I
CUMULATIVE PLANT PERFORMANCE*
- CONVERSION- - RECOVERY -
STAGE FEED ACTUAL THEOR. ACTUAL THEOR.
Therma 1 Stage 98.31 66.6 #1 Catalytic Stage 0.48 91.3 90.9 89.1 #2 Catalytic Stage 0.43 97.5 97.3 95.9 #3 Cata lyti c Stage· 0.78 98.9 98.8 98.6 98.6 #4 Catalytic Stage 99.3 99.3 99.1 99.1
100.00 99.3 99.3 99.1 99.1
*All parameters expressed as percentage of total plant feed.
Thermal Stage #1 Catalytic Stage #2 Catalytic Stage #3 Catalytic Stage #4 Catalytic Stage
TABLE II
OPERATING TEMPERATURES*
CONDENSER OUTLET
375 350 330 280 255
CONVERTER OUTLET
590 420 375 340
MAX. CONVERTER DEW POINT
480 405 355 300

- 25 -
REMOVAL OF SULFUR DIOXIDE FROM WET STACK GASES
OF SOUR GAS PLANTS 1
by
M .F . Mohtadi and H . B . Dingle
Department of Chemical Engineering The University of Calgary
Calgary, Alberta
ABSTRACT
Catalytic conversion to elemental sulfur of sulfur dioxide in
wet stack gases , using carbon monoxide as the reducing agent , was studied
theoretically a�d experimentally.
Computer models were developed to calculate equilibrium
compositions for the reaction system under various conditions using free
energy minimization (FEM) and simultaneous chemical equilibrium (SCE) .
Experiments were carried out in a reactor designed to simulate
the equipment and operating conditions used in industry. Alumina , silica-
alumina, copper on alumina , and copper on silica-alumina were used as
catalysts . The reaction time was varied from 0 . 10 to 3 . 35 seconds . The
S02 content of the feed gas was kept at 1 . 0 percent by volume . Water
vapor was introduced into the reaction system at concentrations up to
30. 0 percent by volume .
The method studied removed up to 90 percent of the S02 in the
wet stack gas . Side reactions producing carbonyl sulfide and hydrogen
sulfide hamper complete conversion of S02 in the presence of water vapor .
IThe full text of this paper has been submitted for publication in the Canadian Journal of Chemical EngJn�ering .

Atmospheric Dispersion of
Sulphur Gases

- 2 6 -
"Short and Medium Range Atmospheric
Diffusion in the Alberta Environment"
by
Richard D. Rowe
Department of Chemical Engineering , University of Calgary
EXTENDED ABSTRACT
Designing industrial stacks in the Foothills region of Alberta
is difficult since little is known about the effects of varied topography
on the dispersion of plumes . Most sour gas processing plants in the
Province are located alongside of the Rocky Mountains , in a so-called
"sour gas corridor" . In this corridor the ground level concentration of
S02 emitted from the sulphur recovery plants is strongly influenced by
the complicated terrain and by the peculiar meteorological conditions of
this region, e . g . frequent temperature inversions and stable Chinook
winds .
A number o f proj ects concerned with the short-range behavior
of plumes from gas plants are reviewed .
Previous investigations include:
(i) Photographic observations of plume rise from gas plant stacks .
Sulphur plant plumes have stack exit temperatures in excess of
10000F and are only visible at low ambient temperatures , below about 7°F ,
due to a change in phase of the water vapor (1) . The effluent from the
Ram River sulphur plant stack was successfully marked during field trials

- 27 -
this summer (1973) by two techniques : incomplete combustion of hydraulic
fluid and Army smoke pots yielding respect ively dense black and white
plumes . ( ii) Case studies of incidences of high ground level S02
concentration , as recorded by continuous monitors , in the vicinity of
a gas plant .
This investigation ( 2) tested the applicability of existing
correlations for estimating tIle ground level concentration of S02
discharged from sulphur recovery plant stacks and ascertained the
meteorological conditions which cause pollution episodes . High ground
level concentrations are usually attrib�table to a non-uniform atmospheric
s tate , such as inv2�sion break-up or plume trapping . Inversion break-ups ,
which are associated ;'7ith hieh pressure sYbtems , clear skies and low winds ,
are not unusual in Alberta and may be re3�rded as part of the normal
variation in the meteoroloE,ical conditions of the province . ( iii) The
passage of a plume across a complicated terrain .
A helicopter-borne fast response SO� monitor was used to L.
investigate the diffusion of a sulphux plant plume across a long ridge
close to the plant (3) . The plume path was approximately normal to the
spine of the ridge and the topogra,hy was a:most ideally two-dimensional .
The potential f1.::;:·; streamline across the terrain was shO'tm to be a
conservative appr("ximation to the lowest p�.':r:ne centreline data with r ise
removed . The following simple stack desien method was recommended : the
effective stack he!�ht is the sum of the height of the potential flow
streamline above t.hE:: terrain (rather tl'.an the physical stack height) plus
plume rise; the ground level S02 conceTltrnt.i.on should then be calculated ,
in tne usual :n�£').I:,.c;.", using Pasquill ' s standard deviations .

- � -
Leahey (4) has recently studied the diffusion characteristics
of air flow over a river bank with a bivane . He recommends the alternative
simple stack design method in which air flows parallel to the terrain.
Pasquill's standard deviations are changed to agree with the bivane
measurements .
Future investigations include:
(i) Atmospheric turbulent dispersion of stack plumes in complicated
terrain.
Investigate the behavior of sulphur plant plumes flowing across
distinct topographical features . Effluent marking techniques have been
developed and time-lapse photogrammetry will be used to record the visible
plume pa�sage. Atmospheri� boundary layer velocity profiles will be
simultaneously determined using a novel smoke-line technique ; a smoke
rocket is proj ected vertically leaving an initially straight smoke-line ,
the deformation of the smoke-line as a function of time yields the
velocity profile and the locations of regions with recirculating flow.
The velocity profile will also be determined with the conventional optical
balloon-sonde technique . A radio transmitting temperature probe attached
to the balloon will be used to measure the lapse rate.
(ii) Flare stack design.
To improve our understanding of the behavior of flames in cross
winds for the safe and economic design of flare s tacks . The velocity
field of model flares in a wind-tunnel with a laser anemometer will be
investigated . The flame temperature will not present a problem since

- 29 -
this form of anemometry has alteady been used (5) at higher temperatures
(about 10 , 0000C) . Using laser anemometry for remote measurement of wind
velocities has been discussed ; it may be possible to probe real flares .
The requirement to study medium range diffusion (10 - 100 km
range) to determine, for example, the summation effe�ts of the group of
gas plants located in the sour gas corridor , is outlined .
Finally , a rational strategy for the control of S02 emission
from sulphur recovery plants in Alberta is proposed (6) . This strategy
takes into ac'count the divergent views of industry , government and
environmental groups . It advocates a comprehensive study of the fate
of S02 in the atmosphere and a flexible attitude towards regulations
whi�h control S02 emission.
Acknowledgements
Financial support from the Canadian Natural Gas Processing
Association, the Northern Forest Research Centre and the National Research
Council (NRC) is gratefully acknowledged . The author spent the academic
year 1972-73 with Western Research and Development Limited , Calgary, as a
NRC Senior Industrial Fellow.
References
(1) Hav1ena, J . , Kumar , V . and Rowe , R. D . , "The Visibility and Rise of
Sulphur Recovery Plant Plumes" , Air Pollution Control Association
Meeting, Seattle, November (1973) .
(2) Mohtadi, M .F . and Rowe , R . D . , "Sulphur Recovery Plant Plumes" , Gas
Processing/Canada, May�June , 1 6-20 (1973) .

- 30 -
(3) Rowe, R.D . , "The Dispersion of Plumes from the Jumping Pound Gas
Pl�nt" , Western Research and Development Consultant Repot't to
Shell Canada Limited , February (1973) .
(4) Leahey , D . , "A Study of Air Flow Over a River Bank" , submitted to
Atmospher�c Environmen�.
(5) Rowe , R.D. and Sambrook, R.M. , "Laser Doppler Anemometry of Electric
Arcs" Opto-Electronics, 1. 217-219 , January (1973) .
(6) Mohtadi , M .F . and Rowe , R. D . , "A Rational Strategy for Control of
802 Emission in P�berta", 4th Joint Chemical Engineering Conference ,
Vancouver, Sept�mber (1973) .

- 31 -
P�UME DISPERSION RESEARCH AT N�TURAL GAS
SULPHUR EXTRACTION P�T�l
by
G. K. Lee2 , H. Whaley2 and J. G. Gainer3
ABSTRACT I
'The rise and dispersion have been determined for four plumes
�mit�eQ by three natvral-gas sulphur-extraction plants in Alberta. This
report describes the data acquisition techniques employed and gives a
preliminary evaluation of the results. At one plant, two plumes were , ,
studied, one under inversion conditions and the other under limited mix-
ing con�itiops. Oq� plume fram each of the other two p19nts was st�died
under neutral conditions. The results indicate that tqe standard devia-
tions of plume spread carinot be reliably estimated for limited mixing
conditions and that plume behaviour is strongly influenced by local topography.
1 Prepared fo� presentation to the Canadian Natural Gas Producers Association, Calgary, Alberta, 2 March 1973; published as Fuel Report R-265; Department
2 of Energy, Mines and Resources, Mines Branch, Ottawa. Research SCientists, CanaQian Combustion Research Laboratory, Fuels Researcp Centre, Mines Branch, Department of Energy, Mines and Resources, Ottawa, Canada.
3 Senior Engineer, Exploration and Production Department, Gulf Oil Canada Ltd., Calgary, Alberta.

Compu�er S imulation of Pollutant Dispersion :
Single S tack and Air Shed Models
By
�. Aziz , J .K. Donnelly , J .P . A. Wallis
Department of Chemical Engineering The University of Calga��
Calgary , Alberta
- 32 -
ABSTRACT
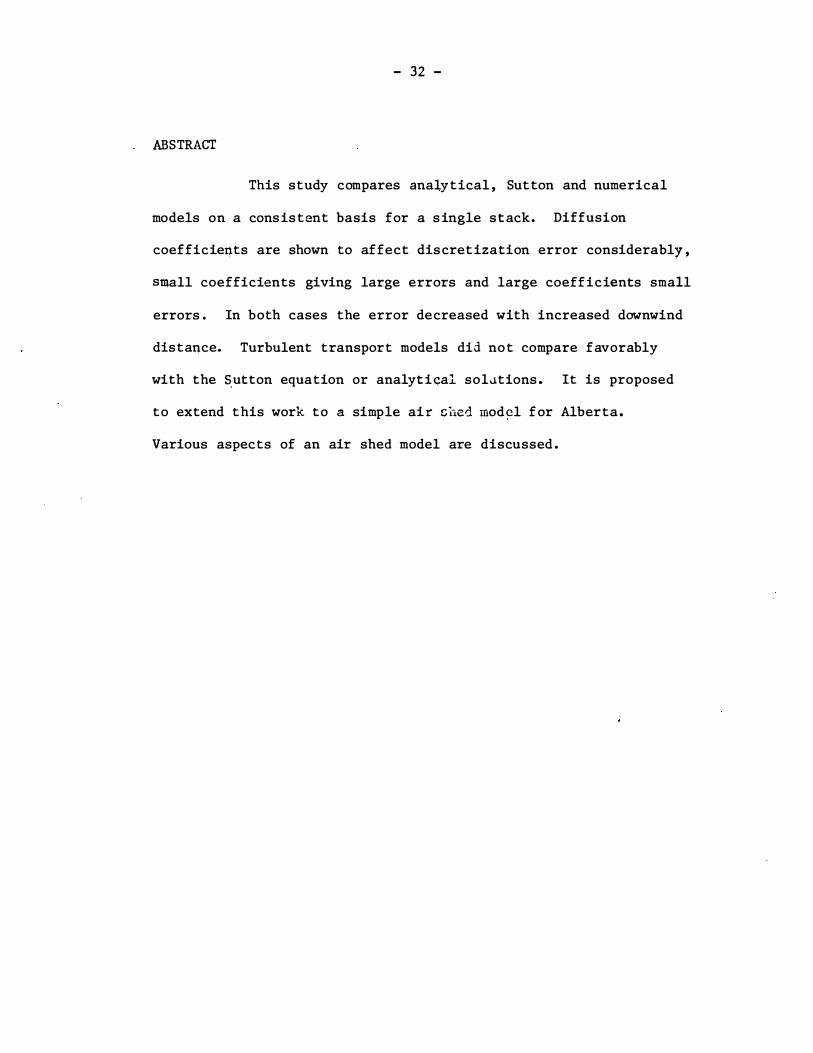
This study compares analytical , Sutton and numerical
models on a consistent basis for a s ingle stack. Diffusion
coefficie�ts are shown to affect discretization error considerably ,
small coefficients giving large errors and large coefficients small
errors . In both cases the error decreased with increased downwind
distance. Turbulent transport models did not compare favorably
with the �utton equation or analytiGal sol�tions. It is proposed
to extend this work to a simple air caed model f or Alberta.
Various aspects of an air shed model are discussed .

- 33 -
INTRODUCTION
The increas ing demands of the p opulace for a cleaner
environment , in particular air and water , have caused governments
to e�act anti-pollution legislation. Consequently there has been
an increased need for pollution models , not only to predict the
behaviour of present day facilities , but to determine the pollution
effects of fu�ure const ructions. In Alberta an example would be
thr proppsed Athabas ca Tar Sands proj ects . Another important aspec�
is that a comprehensive air pollution model could be incor�orated
into an overall pollution strategy . This ,is shown in Figure 1 and
is a modification of the method proBosed by Pl�tkin and Lewis ( 1972).
At present most pollution models are the classical t
Gaussian type . The well known Sutton, Pasquil and Brookhaven models
(see Aziz et al. ( 1973» are all Gaussian , but,use different values
fpr the standard deviations . Unfortunately these are only valid
for a single pollutant source over flat terrain under steady-state
conditions where reaction and decay effects are negligible. The
more complicated models are really simplifications of the momentum ,
mass and energy equations , e . g . Hino ( 1968) , Randerson (19 70) ,
Shir (1970) . In general the complex models can include terrain ,
multiple source , reaction , decay and transient effects . The price
paid is the loss of the sim�licity of the Gaussian exp ressions , the
replacement being a large numerical model . Despite the number of
model studies none have assessed the accuracy 9f computer s imulations .

- 34 -
The purpose of this paper is to show that computer
models do compare well with Gaussian models . Consequently the more
general and complicated air shed models are worthy of further study .
Stateillent of the Problem
In general the pollution dispersion process may be taken
as a material balance equation which �rd& is :
Accumulation of PQllutant +
in a Given Volume
Pollutant Transported
by Convection (Wind)
./i > " :
= Pollutant
Transporteq + b y Diffusion
Pollutan t from
Sources
Pollut ant used up by
Reaction and Decay
In mathematical terms , with simplifications and as sump-
t ions , the pollutant concentr&tion is governed by (see AZlz and
Wallis (1973» .
d e at + d C + u dX
a c v dy d C + W az =
dD d C y dy dy +
d C aDz az d Z - R +
(accumulat ion ) + (wind transport) = (Diffusion transport)
(reaction) + (sources)
Single S tack Study
For very simple cases, Equation (1) can be solved directly
for C. For example, the Sutton model (Monin ane1, Yag10m ( 1965» can be
* Symbols are defined in nomenclatu�e .

'- 35 -
d C shown t o b e a s olution of ' Equation ( 1) when v , w , Dx ' R and at are
zero ; there is a single source , u is cons tant , the terrain is fla t ,
and D and D are power functions of x . An analytical s olution may y z
also be ob tained for Equation (1) for the same conditions as the
Sutton equation and for constant D and D (Monin and Yaglom ( 1965» . y z
Sutton (neut�al atmosphere) , Analytical and Turbulent
Transport Theory (u , D and D are functions of z) were compared y z
on a consist�nt: bas �R by having the same average values for u , D y
and D . The computational method and appl ication to Turbulent z
Transport Theory is nescribed in p apers by Aziz et al. ( 19 73) and
Aziz and Wallis (1973) . It can b e shown that this method of
comparison gives a cons�rvati:ve es timate for the analytical , diffusion
coefficients . A point source of 1000 g/s ( 9 5 ton/day) at an effec-
tive stack height of 100 m. ( 340 ft) in a velocity field of u = 4 . 35
and 8 . 7 m/s (10 and 20 mph respectively) were the numerical constants
used . They correspond approximately to conditions for a large
sulfur plant in Alberta.
Some trans ient results (�� � 0) were also determined
for constant D ann D , all physical p ara�eters having the s ame y z
values as steady-s tate case . All computations were done on a
CDC 6400. Discreti7.ation error refers to the difference between the
analytical solution and the numerical estimate of the analytical
s olution. Grid spacing refers to the increments in the variables x ,
y , z and t in the solution of equation 1 . C�nverged s olution means
the most accurate Ll.:.l:'1.t:'r.ical es timate o� the analyt ical solution that
can be obtained at a particular grid spacir.g.

. . ,
- 36 -
Results
Figure 2 compares analytical , Sut ton and numerical results
(modified Euler) for short downwind distances (D , D small) . The y z .
discreti�ation error is considerable initially , but decr eases for
increa�ing �ownwind dista�ces . Ideally the analytical and modified
Euler lines should be the same . Not ice the discretization error is ;
much s�ller for concentrations at the stack height . The S4tton
equation gives a sharper concentration gradient than the cons tant
qiffusion co�fficicnt simulations (analy tical and ;modified Ellle;r) ,
The numerical results cart be considered as converged results for the
grid s ize given. S imilar results were obt ained for a wind ·speed of
8. 7 m/s .
Figure 3 compares Turbulent Transp ort � analytical and
Sutton theories for short downwind ·dis tances . The dis cretization
error is . much larger for the Turbulent ' Transport simulations
(converged solution lines �nd Euler simulation line) and the
correspondence 1i7ith Sutton or Analytical simulations is poor. This
is caused by the relatively small djfft:s ion coefficients at ground
level ; remember th,..t diffusion coefHdents are increasing functions
of z (see Aziz et al. ( 19 73» . S imilar results were obtained for a
wind speed of 8. 7 m/s .
Figure 4 compares Turbulent Tran6port , analytical and
Sutton theories for larger downwind dis tances . The discret ization
error has decreas .:1 considerably (D and D are much larger) even y z
though the distance between grid p�ints has been consideraply
increas ed. Turbulent Transport Theory still deviates considerably

- 37 -
from the other methods . Numerical convergence would require even
a smaller grid s i ze ; notice the curves cross and then d iverge
for the two different grid spacings . This was not experienced in
the numerical s imulation of the analytical s olution. It should
also be noted that the Sutton equation and the analytical solution
correspond very well for distances g reater than the point of
maximum ground level concentration .
Figure 5 shows essentially the s ame things as Figure 4 .
However , the wind velocity i s now 8. 7 mls compared with 4 . 35 mls
for Figure 4 . Noti ce the increased wind causes a decrease in
ground level concentrations . Converged numerical simulation results
are the same for 6x = 80 in Figures 4 and 5 .
Figure 6 shows the numerical transient solution for .
the constant diffusion coefficient case (transient solution of the
results shown in Figure 4 , comp ared with the converged numerical
solution curve) . Notice that steady-state values are achieved very
quickly.
All figures show curves for the transverse distance
y = O . The source i s located at x = 0, y = 0 , z = 100 and the
solution is symmetrical about y = O. The results for Figures 2-5
are b ased on the results reported by Aziz et al . ( 19 73) and Aziz
and Wallis (1973) . These references should be consulted for more
detailed information. Euler and modified Euler are numerical
methods for integrating Equation (1) . Turbulent Transport Theory
answers may only be obtained by numerical integration.

- 38 -
Conclusions for the S ingle Stack Study
1. The correspondence between the analyt ical model
and Sut ton ' s equation is good f or dis tances greater
than the point of maximum ground level concentration .
2 . Numerical s imulations are shown to have an acceptab ly
low discretization error excepting those s imulations
where Turbulent Transport Theory was used.
3 . Turbulent Transport Theory does not compare well
with Sutton or Analytical models .
4 . Grid s ize can have a significant effect on
dis cretization error.
5 . Simulations with large diffusion coefficients have
small discretization errors .
6 . Trans ient simulations are relatively uninteresting
as steady-state is reached very quickly once the
pollutant reaches a given pos ition.
Air Shed Model
S ince it has j us t been demons trated that a s ingle s t ack
can be acceptably modelled numerically, there are firm grounds to
extend the model to large areas with mUltiple sources , This is an

- � -
air shed model and means the integration of Equat ion (1) to find
ground level concentrations .
Limitations of the Proposed Air Shed Model
A map of Alberta is shown in Figure 7 and the model
would cover all of Alberta excepting the Rocky Mountains which are
to be treated as a b arrier . Ideally topographical features should
be included in the model , but large grid s izes preclude accurate
topographical des cription ; therefore for the first attempt Alberta
is to be assumed flat . Should contour description be nteJed , it
could be added at a later date. Because of the large area covered
by the model it should not be used to predict local concentrations .
Rather it should be used to determine pollution trends for the
province.
Accurate data are needed to make a model useful. Such
things as pollutant decay and ground level absorption rates must be
provided by the chemis t and b iologist . Diffusion coefficients can
be provided by the estab lished literature , but even this gives
different values (e . g . P asquiU (1961) , Sutton (1947) and Brookhaven
data (see Smith and Singer , 1966) do not agree) . The meteorological
department will provide the wind conditions and other pertinent
atmospheric data. Source rates of pollutant will be est imated for
proposed plants and determined from operating data for existing
plants . This requires the cooperation of the industrial sector .

- 40 ..
The actual computer model . in b lock mopules �hould be similar to the
flow diagram in Figure 8 .
General Conclusions ;
1 . I t has heen demonstrated that numerical means
can accurately determine ground level concen-
trations for single stacks .
2 . Dis cretization error is small for large
(meaningful ) values of the diffusion coefficient.
3 . An air shed model has been proposed for Alberta.
4 . Extensive interdepartmental cooperation is
required to make the air sh�d model a success .
ACKNOWLEDGEMENTS ,
The authors would like to express their appreciation to
the Alberta Environm�ntal Research Trust fqr their enc�uragemept anq
financial support. The help of Dr . A. Thltsoo in the development of
the npmerical results is noted with thanks .
- 41 -
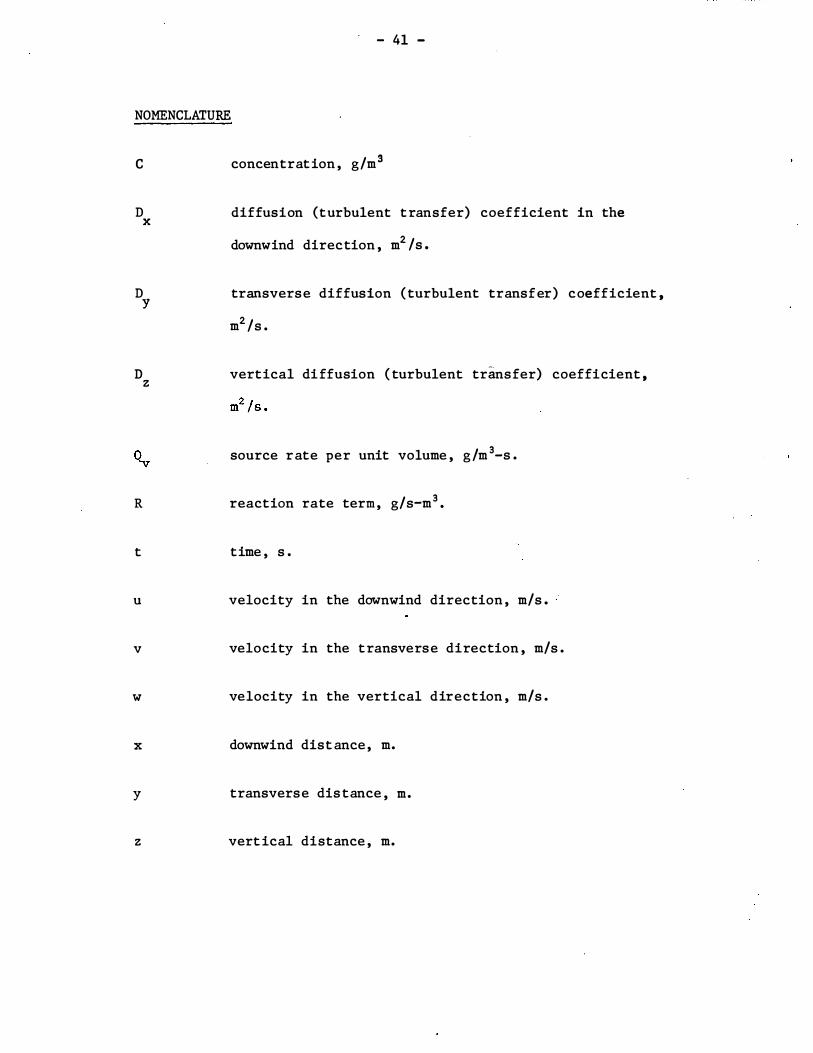
NOMENCLATURE
C
D x
D Y
D z
R
t
u
v
w
x
y
z
concentration , g/m3
diffusion (turbulent transfer) coefficient in the
downwind direction , m2 /s .
transverse diffusion ( turbulent transfer) coefficient ,
m2 /s .
vertical diffusion ( turbulent transfer) coefficient ,
source rate per unit volume , g /m 3-s .
reaction rate term , g/s-m3 •
time , s .
velocity in the downwind direction , m/s .
velocity in the transverse direction , m/s .
velocity in the vertical direction , m/s .
downwind dist ance , m.
transverse dis tance , m.
vert ical distance , m.

- 42 -
REFERENCES
Aziz , K . , Carr , � . A� , Rowe , R. D. , Wallis , J . P . A. , Computer Modelling
of Pollution From Atmospheric Sources , The 4th Joint Chemical
Engipeering Conference , Vancouver , British , Co1wnbia , Septemb er
9 - 12 , 1973.
Aziz , K. , Wa11lS , J . P . A. , Some Aspects of the Computer Modelling of
Pollution From Atmospher:f,.c Sources , In Proces s of Pub lication ,
197 3 .
Hino , M. , Computer Experiment on Smoke Diffusion Over a Complicated
Topography , Atmnspheric Environment , ,1, 541-558 , 196 8 .
Monin , A. S . , Yaglom , A. M . , "Statistical Fluid Mechanics : Mechanics
of TU,i::bult:mce" , 1965 , vol . 1 , The M. 1 . T. Press , Cambridge , �ass . ,
1971 (English Translation) .
Pasquill, F . , The. Es �imation of the Dispersion of Windborne Material ,
Meteor. Mag . , 90 , 33-49 , 1961. �
Plotkin , S . E . , Lewis , D . H . , Control S Lrategy Evaluation Using Models ,
A. l . Ch . E . , 72nd National Meeting , S t . Louis , Missouri , May ' Z1-24 ,
197 2 .
Racdurscn , D . , J Numerical Experiment in S imulating the Transport o f
Sulb,;.: Dinx; de Through the Atmosphere , At=nospheric Environro.ent ,
i, 615-532 , 19 70 .
� 43 -
Shir , Chipg�C�e�ng , A Pilot S tudy in Numerical Techniques for Predicting
Air Pollutant Distribution Downwind From a L in e Stack , Atmospheric
Environment , �t 387-40 7 , 1970 • .
Smith , M . E . , S inger , J . A. , An Improved Method of Estimating Concentrations
and Related Phenomena from a Point Source Emission , J . App1 . Meteor. ,
5 , 631-639 , 1966 . -r
Su�ton , O . G " The Prop1em of Diffusion in the Lower Atmosphere,
Quart . J . Roy . Soc. , 11, 257 , 1947 .

I METEOROLOGY 11-----------; O,.'\TA
C .ALCU LATED EM I S S I O N
SO U RCE I N VE N TORY
ATMOSPH ER I C TRANSPORT I - I Ai\t1 8 I EN T AI R AN D DJ FFU SION M O D E L . Q U A LITY
CONTROL H REQU� R ED '---------11 STRATEG I ES ' EM ISSION
MODEL ' . REDUCTfO�JS
1 Air Quality Analysis Model
COrv'lPARISONS
AM BI E NT AI R QUALITY
STAN DARDS
A I R QUALITY CRITE R I A
.po .po
...1.
Ol SPLAY PRED!CTED
A I R QUALITY

-I'f)
E ...... O't
10-3
10- 4
z 0 10- 5
� a:: I-Z W � 1 0- 6 o u ..J W > W 10-- 1 ..J a z :::> o a: (!) 10'" 8
----- ANALYTICAL - - S UTTO N - - - MODI FIED EULER
/' � : 20 " h = I O
I
-... � -
400 600
DOWNWI N D DISTA NCE ( M ETR ES) Figure 2 Effect of Grid S ize on Concentration
u = 4 . 35 m /s fly = fl z = h
u . D y , D z , C o n stant
....
800
-I'f) E
...... C\
-
I-:I: (!) W J: � U � CJ)
10- '1-<r
100 0
z o � � a:: � w u z o o

10-7,
lOJ �/f:> j �;;:----- '
' CONVERGED SOLUTION� . �
/ \��
---- Al\JALYTICAL - - - SUTTON - - CON.VE
'RGED SOLUTION h = IO �
- - - - EU L E R 6 x = IO, h = I O �.Y �-. � ,
to') E
....... O'l
10-9 Z o 1--<l: � I-Z W 1 0-10 U Z o U ...J W GJ 1 0-1 1 ...J o Z ::J () 0::
' (!) 1 0-12
1- -
\ " , ""
1 0- 13 , II o J r III l 200
I
':::.--!- ---.... ......... r .............. '"
� . � �/ ALL SIMULATIONS �= 20 .
--. � - --=:.. -...:.: - - - - --
-- -- � -- -- --
u = 4.35 m /� 6 y = 6z = h
u , Dy ' D z ' Variable
400 600
DOWNWIND DISTANCE (METRES) 800
Figure 3 Effect of Variable u , D • D on Concentration y z
...
::-,.
-to')
E ....... Ot
lI <.!) W ::r: � u P
10-1 (f)
� Z S-,
1000
,

4.�--------------------------------------�--------------�-----------' -
to E 3 ........ 0'1 -
z o 2 � f= 1 .5 z w o 0-3 z l o o -1 W > w 5 -' (') 4 --. L ,::) �) 0:: '�
I
o
I
/
I
--- -- --...--
".- -
/ � -tJ. z :: I 0 / . --- --- ------l::. x = 1 5 l::. Y = 20
\ /' / �!:J.X = 40 -
. v/ b. y :: 40
�;:� !:J. z � 20
IJ // II
1 / 1 /
U = 4. 3 5 m/s ----- ANA LYT I CA L S OLUT I O N --- ,- ' -- - - ---. S UTTO N E Q U ATION
T U R B U L E NT TR A N S P O RT T H EO RY
CO�VERGED NUMERICAL SOLUTION
1 00 0 2 0 0 0 3 00 0 4 0 000 5 0 0 0 DOWNWI N D D I S TA N C E ( M E TR ES )
4 Ground Level Concent rations by Dif ferent S chemes
.:S

4
-t() 3
E "-Ol 2 .........
z o I- 1 .5 <t 0:: I-z 1 0- 3 w u z o U -1 � 5 w -1 4 ..:J "--� o n:: o
3
2
6 x = 4 0 6 y = 4 0 l::::. z = 20
I
1 .5 1 , I , ! I
/ /
/
-
� x = 40 --:::-�
� y = 4 0 � ---- --- �
� z = 20 ./'" -
)' / / . u = 8. 7 m /s
-..,---- A N A Ly T I C A L SO LUT I O N - - - S U TTON EQUAT1 0 N - ---- � - TU RBUL E N T TRANS P O RT THEORY -- --- C O N V-E R G EO N U M E.RJCAL SOLUTiON
J
+:-(Xl
o 1 0 00 2 0 0 0 3000 4 0 0 0 5 00 0 DOWNWI N D DISTA NCE ( MET R ES)
Figure 5 Ground Leve l Concentrations by Dif ferent Hethods

......... r<)
E "-CJl
---r<)
0 X z 0 I-<! 0:: l-z w <-) Z 0 <-) ..J w > 1.JJ _ J 0 Z :J
3.0 1- DOW N W I N D .
D I STA N C E 1 5 0 0 M
I 2.5
2 .0
1 . 5 I 1 .0 1
I . 'sec r,1
0 n:.:: 0.5 <.9
a I I 200 400
;
II 600 8 0 0 1 00 0 1 20 0
TI M E ( sec . )
U = 4 . 3 5 M I S
� x = 5 0 M
�y = 4 0 M
� z = 20 M
�t = 50 s e c
M O D I F I E O EU L E R
S I M U L ATI O N
1 4 0 0 1 60 0
Figure 6 A Transient Simulation o f Pollutant Dispersion
-l:'-\0
1 80 0 200(

- - -----
Grande Prairie •
Figure 7
, - 50 '-
A J V
Map of A' �erta [J Sul fu r p rodu ci ng p l ants
Medij;ine Hat
� S�ur gas p lants that do not recover s ulfur
58"
55"

Weather data
_ . . .. _-- ----
- 51 -
Start
Define concentrations
at t ::;: 0
Define wind velo�it ies and
diffus ion coe fficients
Find new concentrations
at new time level
is s imulation finished?
Yes
Stop ·
Nq
Figure 8 Air Shed Model Flow D:':' ugram

-----_ . _--_ .. _-_. _-- ---
Other Atmospheria Inf7uenaes

- 5 2 -
THE FATE OF SULFUR DIOXIDE IN THE ATMOSPHERE
by
M. F. Mohtadi
Department of Chemical E�gineering The University of Calgary
Calgary , Alberta
ABSTRACT
Nearly 1 , 500 tons per day of sulfur dioxide is discharged
into the atmosphere in Alberta , as a result of the operation of sour
gas plants . This is equivalent to approximately 1 0 pounds sulfur per
acre in the Province south of the 55th parallel . Only a few percent
of the total S02 emitted falls directly to the ground in the 1 , 000
square miles surrounding the plants . The rest is either deposited on
the ground by natural precipitation or dispeL sed in the atmosphere .
S ince S02 is a natuL' '.l component of the atmosr"here and its global
recycling follows an lntl'icate pattern through soil , water and vege-
tation , a careful study of its fate in the atmosphere is highly
recommended .

--- -_ .. . . - - - - -- -. . -
- 53 -
THE ATMOSPHERIC PHOTOCHEMISTRY OF S02
by
H. S . Sandhu Department of Chemistry
University of Alberta Edmonton , Alberta
ABSTRACT
Recent ideas on the mechanisms of homogeneous oxidation of
S02 are reviewed and methods are suggested for estimating the relevant
rate data.
Pre�bnted aL tho::! Alberta Sulfur Gas Research Workshop , Edmonton , Albert a , November 1 , 1� 7j ; also associated with Division of Meteorology , Department of GeC:- l;.c,lphy , University of Alberta , Edmonton , Alberta.

- 5 4 -
Introduction
Sulfur compounds are an important class of air pollutants .
Much research has been published recently on how to minimize emissions
and how to remove them from the atmosphere l •
Sulfur dioxide is removed from the atmosphere by both physical
and chemical processes , and the latter may occur heterogeneously or in
the gas phase . The gas phase mechanis� are not well established and
may be entirely thermal in origin or photochemically induced . A
quantitative evaluation of the significance of these homogeneous
processes has not been possible due to the lac!. of rate data particularly
for the extremes of meLeorological conditions prevalent in Alberta.
This report outlines recent ideas2 , 3 on the photo-induced
oxidation mechanisms of S02 and evaluates semi-empirical methods for
calculating the necessary Arrhenius parameters where they are not
available from experiment .
Excited States of S02 and its Quenc�in:t11.ech.?Eism
The absorption of solar radiation occurs either in the allowed
band which extends from 3400-2900 AO or in tbe forbidden band from
4000-3400 AO . The former transition gives rise to a S inglet molecule
S02 ( ! E l ) ( 1 S02 ) whil� the latter give� ris� to a triplet species , S02
( 3B l ) ( 3 S02 ) . Calvert and co-workers3 have interpreted their results as
a reaction sch,=,:ne �
+ M
2S02
3 S02 + S02
S02 + M
3 S0� + M

- 55 -
S02 +
hVf
S02
3S02
S02 + hv p
S02
S0 3 + SO
2S02
Products
S02 + M
where M is a third body and vf
and Vp
qre the fluorescence and
phosphorescence frequencies . The reported rate constants for the
q�enching of 3 S02 molecules by NO and olefini� hydrocarbons , which are
fpund in polluted atmospheres, are close to the collision number
(� 2 x lOl l
liters mole- 1
sec- I
) , whereas values for H20 and 0 3 are
smaller by a factor of _ 100 .
Computation of Ra�e Constants
A reaction mechanism can be evaluated only if the concentration
of the species in'Tolved and the values of t1:: e 1.ate constants are known .
In spite of the increased research activity in reaction kinetics over
the pas t two decades , experimental kinetic (lata on certain reactions ,
relevant to air pollution , are inadequate or nun-existent . OnE:: is
forc.ed to employ semi-empirical JIlf.>thods ;':0 ,,(" f :':'mate rate coefficients
to make semi-quantitative predictions . The c:llculations of the
preexponential factors of the rate constants for a variety of unimolecular
and bimol��ular reactions can be carried out successfully and the

- 56 -
computed values agree reasonably well with the available experimental
results4 , s . In addition , Bond-Energy-Bond-Order (BEBO) method has
been widely used to calculate the potential energies of activation for
atom transfer reactions6 , 7 , a and is expected to yield reasonable
estimates of activation energy in the sulfur systems .
Acknowledgement
I thank Dr . A . T . Blades and R. F . Klemm of the Research
Council of �lber�a for helpful discussions .
References
1 . R. F . Klemm. Environmental Effects of the Operation of Sulfur
Extraction Gas Plants , Consultant Report Submitted to Alberta
Environment Conservation Authority , 19 72 .
2 . M. Bufalini . Environ . Sci . Technol. , 5 , 685 (1971 ) .
3 . H . W. Sidebottom, C . C . Babcock , G . E . Jackson , J . G. Calvert ,
G . W. Reinhardt and E . K. Damon . Environ . Sci . Techno1 . , i,
72 ( 1972) and references therein .
4 . S . W. Benson . Thermochemical Kinetics , Wiley , New York , N .Y . ,
19 68 , p . 9 7 .
5 . A . T . BladeD and H . S . Sandhu. Int . J . Chem. Kin . , 1, 187 ( 19 71) .
6 . H . S . Johnston . Gas Phase Reaction Rate Theory , Ronald Press ,
New York , N . Y . , 1966 , p . 339 .
7 . s . W. Mayer . J . Phys . Chem. , 74 , 3941 ( 19 09 ) .
8 . E . Jakubowski , M. G. Ahmed , E . M. Lown , H . S . Sandhu , R. K. Gosavi ,
and O . P . Strausz . J . Amer. Chem. Soc . , 94 , 4094 ( 19 72) .

- � -
SULPHUR ISOTOPE ABUNDANCES AND ENVIRONMENTAL ASSESSMENT -Appl icat ions to Sulphur Gas Research in Alberta
by
H . Roy Krouse Department of Physics The University of Cal gary Calgary , Alberta T2N lN4
Since S 32 and S 3 4 di ffer in their masses , their rel at ive
nqrnbers are al tered by mas s -dependent proce s ses . In Albert a , H2S from
di fferent pool s varies considerably in its S � 4/S3 2 abundanc e rat ios .
Thi s provides a means of monitoring gas industry emi ssions of sulphur
compounds and their e ffects on the environment . Data from Alberta
ident ify industrial contribut ions of S02 to the air and show that these
are not readily mixed on a local meteorological scal e . I s otopic studies
al so show that l ichens derive sulphur from the atmosphere in a more direct
manner than higher plants . Sources of sulphur compounds in streams can
also be ident ified .
Submitted to ALBERTA SULPHUR GAS RESEARCH WORKSHOP , Edmonton November 1 and 2 , 1973

INTRODUCTION
- 58 -
I s otopes of an element d iffer in their mas ses . Sinc e many
physical , chemical , bio l ogical , and geological processes are mass dependent ,
the re lat ive abundances o f i sotopes are altered in terrestrial processes .
Thus � measurements of i sotopic abundance s provide informat i on about the
origin es) of a given spec imen and the conversions that it has undergone .
I sotopic compos itions are usua l l y measured with a mass
spectrometer . Absolute abundances are d ifficult to determine to an
accuracy of better than 0 . 1% whereas the rel at ive isotopic abundances in
two samples can be compared with prec isions of better than ± . 01% . For
this �eason , the i sotopic composition of a �amp1e is re lated to that of
a re ference using a a - scale (del -sca l e ) . Of the four stab l e isotopes o f
sulphur , S 3 2 a!'l.d S 3 4 are usual ly studied and the 0 scale is defined as :
= - 1 ] x 1 000
The standard to which other samples are referred in laboratories the
world over is tro i l ite in meteorites , usually the Canyon D iabl o meteorit e .
Thi s cho ice wi l l be discussed later .
SULPHUR ISOTOPE ABUNDANCES IN NATURE
Since sulphur exi sts natural l y in many forms and val ence
states , there are numerous processes by which the 53 4/53 2 abundance ratio
is altered . Since tl1e initial report of THODE et � ( 1 949) ,

- 59 -
Thode ' s group and many other researchers have uti l i zed sulphur isotope
data to elucidate problems in various research areas .
Figure 1 shows some of the terrestrial OS3 4 variations
encountered . One sees the reason for selecting meteoritic tro i l ite as
a stan�ard . Its i sotopic composition varies l ittle from meteorite to
meteorite and fal l s n ear the terrestrial average . Deep seated primary
sources such as bas ic sil l s tend to have narrow OS3 4 distribut ions near
the meteoritic referc�ce . In contrast , sulphur compounds in sedimentary
rocks , coal , oil , etc . have l arge variat ions in i sotope composit ion
because of part icipat ion in the biological sulphur cyc l e . General l y,
the more oxidized sulphur species tend to !:; e more enriched in S3 4
compared to the reduced species . Thi s i s consistent with stat i st ical
thermodynamics (TUDGE and THODE , 1 950) . Except ions are cow�on because
the world ' s sulphur i sotope distribut ion is f�r from condit ions of
thermodynamic equil ibrium .
Wherc1.s present day OCN'.n sulph "..te is remarkab l y uni form
isotopical ly (except near freshwa cer contribut aries) , evaporite data
attest to signi fican+ temporal isotopic variat ions in sulphate in the
anc ient oceans . Pb-Z:l deposits of Western Ca.,lada (EVANS et �, 1 968 ;
SASAKI and KROUSE , 1 969) and petro l eum (THODE et �, 1 958 ; THODE and
MONSTER , 1 965) as wel l as H2S in sour gas we : l s are enriched in S 3 4 to
roughl y the same ext:��t as evaporites . THODE and MONSTER ( 1 965) found
petrol eum and associated H 2S to be on the average some 1 5 % 0 depl eted
in S34 cuIilpared to rel ated evaporites . H')wcvrI , more recent studies

- 60 -
(BROWN et aI , 1 973) on gas wel l s reservoired in the Devonian revealed
many instances where the OS3 4 of the H2S d iffered from S04= in the
water by onl y 1 to 2%0 .
Figure 1 contrasts with data compiled by previous authors
which show narrower OS 3 4 di stributions part icularly in air and water .
This simply refl ects the paucity of pub l i shed data . For example , the
ful l range of freshwater variation in Figure 1 is encountered in the
Mackenzie - River System (HITCHON and KROUSE , 1 972) . ,Similarly the range
of OS 3 4 values in the air of Alberta is considerably larger than that
spanned by al l previously reported data .
S 34 /S3 2 ABUNDANCE VARIATIONS IN THE ATMOSPHERE OF ALBERTA
For some three years now, our laboratory has been measuring
the sulphur isotope composit ion of sulphur oxides in the air of Alberta .
Sampl es have been obtained from the Department of the Environment ,
Government of Alberta and more recent l y , samples from the Ram River
area have been provided by Core L�boratories Ltd . under contract from
Aquitaine Co . Ltd . In a ll cases , solutions from l ead peroxide exposure
cyl inders were oxidized , and precipitated as BaS04 . The BaS04 was
converted to Ag2 S , which was then combusted to S02 for mass spectrometric
analys i s . Mas s spectrometry involved s imultaneous col l ection and
digital recording of S02+ ion currents at mass 64 and 66 (McCULLOUGH
and KROUSE , 1 965) .
Figure 2 and Table 1 show data obtained in init ial stages

- 61 -
of the study . The OS 3 4 values ranged from +7% 0 to +28%0 ' In Figure
2 , the value at any location represent s the average of several stat i ons .
These variat ions appeare� as loca l i zed phenomena . Thi s means that
sulphur oxides near ground l evel in Alberta have not been mixed on a
broad meteorological scal e . Further , these isotopic compositions
fal l in the ranges associated with petrol eum and sour gas . These findings
are not surpri s ing and can be conc luded by convent ional chemical analyses .
Indeed , th.e data are b iased since the Alberta Department of the Environ
ment air monitoring sites are presumably chosen on t'he basis of known
sources of atmospheric emi ssions .
Table I shows that in many cases , the isotopic composition
did not change during consecut ive sampl ings one month apart at the same
stat ion ; e . g . Red Deer 4 , Windfal l 5 , Okotoks 2 , Col eman 8 . On a given
date , di fferent stat ions in the same aTea sometimes gave consistent
oS3 4 values , e . g . Re� Deer 4 , 5 and Okotoks 2 ,4 . On the other hand ,
there were cases where consecut ive samples at the same stat ion were
noticeably different (e . g . Carstairs 4 ) and where a given stat ion was
not consi stent with neighbouring stat ions , e . g . Red Deer 6 .
Data obtained since these init ial studies show that the
OS3 4 value depends on the season at a given stat ion . Further , this
dependence is not uniform for stat ions throughout the province although
adj acent stat ions tend to behave similarl y .
We have plotted oS 3 4 vs . sul pl,'_�r oxide concentrations

- 62 -
to ascertain the i sotopic composition of the "natural background"
in Alberta . At higher concentrat ions , the isotopic variat i ons should
be greater because of varied industrial contribut ions whereas lower
concentrat ions should be more indicat ive of the background . From
these data , we conclude that the i sotopic compositi on of the background
in Alberta varies significangly from place to pl ace and with season .
I f industrial contributions are not mixed on a broad meteoro l ogical
scale , natural contributions should not behave otherwise .
For a given locat ion , 083 4 value s usual ly converge with
higher sulphur oxide concentrations . This i s exemp l i fied by data from
Bal zac (Figure 3 ) .
To interpret Figure 3 , cons ider a number of s impl i fied
s ituations i l lustrated in Figure 4 . Sources A and B have di fferent
i sotopic compositions which remain constant . In case 1 , source A
i s constant in its emission rat e and since it also has a fixed 0 8 3 4
value , i t pl ots as a point on a 083 4 vs . sulphur oxide concentrat ion
graph . In case 2 , source A varies in its emission rate and therefore
plots as a horizontal l ine . In case 3 , the emi ssion rate for source A
is constant whi l e that of B varies . When the rate for B approaches
zero , the isotopic compos it ion of the emission approaches that of source
A . As the emission rate increases , its isotopic composition approaches
that of source B . In case 4 , where both A and B can vary in their
emission rates for a given concentrat ion , the 0 83 4 value can fal l any
where between that of A and B dependent upon the relat ive contribut ions

- 63 -
from each source . In case 5 , A i s a smal l source whi l e the surroundings
(natural background plus other man-made sources) are inhomogeneous
i sotopical ly and variable in emi s sion rate . As the surroundings
approach zero emi ssion rate , the isotopic compos it ion approaches that
of source A . With increasing emission , the oS 3 4 spread increases
as the d ifferent surrounding sources contribute to the total emission .
In case 6 , source A general ly dominates so the i sotopic spread associ ated
with the inhomogeneous surroundings appears at lower 'concentrat ions .
At higher concentrat ions the OS 34 values cC:!1verge to that of source A .
Other situations and combinations o f these six cases can b e envisaged .
Further , the OS3 4 variations may be a function of location and/or t ime .
The data of Figure 3 can be identi fied with case 6 of
Figure 4 . We conc lude that at Bal zac , there is a dominant source which
i s uni form in its isotopic composit ion but varies in its emitted contri
butions to a given locat ion . The surroundings cons ist of sources whose
isotopic ccmposit ions and emi ssions vary cons iderably in t ime and space .
The histogram of Figure 3 gives the frequency of encountering OS 3 4
values . Thi s distribution peaks whi l e being independent of concentrat ion .
This provides further evidence for a dominant source of constant oS 3 4
value which varies in it s contribut ions t o a given locat ion .
TIle int erpretat ion of sUlphur isotopic abundance data
and the ident ification of sources must be executed with care . Effluent
sulphur gases from a stack may d iffer isotopical ly from the raw material
bt;;ing i):'oc?'ssed . If i sotope exchange occ; ,-r;:; , the order of S 3 4 enrichment

- 64 -
- would be S04- > S03 > S02 > H2 S (TUDGE and THODE , 1 9 5 1 ) .
Enrichment s of S 3 4 in S03 compared to S02 have been
observed in flue gases and interpreted as exchange processes at e l evated
temperatures (BALDWIN et �, 1 969) . General l y , the process of adding
oxygen atoms is not expected to alter the sulphur i sotope composition
s igni ficant ly (LEWIS and KROUSE , 1969) . In the atmosphere , sulphur
isotope exchange among sulphur compounds should proceed rather s l owly
because of - di lute concentrat ions and low temperatures . Therefore , i f
the isotopic compos it ion o f stack emiss ions are known , their fate should
be traceable .
Temporal variat i ons at a given sampl ing stat ion can arise
in many ways . We have already seen that a background which i s i sotopical ly
inhomogeneous and varying in emission is one pos s ib i l ity. If an industrial
operat ion is domin �nt , isotopic variations can result if it processes
di fferent raw material s . I sotopic analyses of stack gases for the in
dividual raw materia l s combined with production l og data would ass ist
in interpret ing the net effects . A given sampl ing station may experience
contribut ions from more than one industrial operat ion . In that case ,
the isotopic composition in a given t ime interval i s highly dependent
upon the wind d irection . In such a s ituat ion , a pol ar diagram with oS 3 4
as the radial co-ordinate and wind diT�ction as the angular co-ordinate
might dist ir�guish the sources .
Our studies to date have dealt with s a�r 1 c s rcpyesent ing

- 65 -
one month exposure . In many cases , there was an insuffic i ent samp l e
for a rel iab l e sulphur i sotope anal ys i s . We have every hope of devel oping
an apparatus in the near future wh ich can col l ect enough samp l e within a
t ime span of minutes . In thi s way , a given l ocat i on could be effective ly
monitored and the isotopic data correlated to other parameters such as
wind d irection .
SULPHUR ISOTOPE ABUNDANCES IN VEGETATION
In our study in the Ram River area , we measured sulphur
isotope abundances in l ichen and pine need l es . These data are compared
to atmospheric data in Figure 5 . The l ichens have the same isotopic
range as the atmospheric samples . Thi s suggests that l i chens obtain
their sulphur directly from the atmosphere and/or as scavenged sul phate
in precipitat ion . The mean isotopic composit ion of the l ichens i s
higher than the assoc iated atmospheric s2.TI.pl es but we d o not bel i eve
that this negates the interpretat ion . R�ther, there i s the question
of how quick ly l ichens respond to an isotopic change in the atmosphere .
The atmospheric samples present a monthly mean isotopic compos it i on
but the l ichens may represent longer or shorter integrat ion t imes .
In contrast , the definite shi rt to a l i ghter isotopic
composition for the pine need les must reflec� the complex mechanisms
by which sulphur finds its way to the needles . Figure 6 i l lustrates
some of the possib il ities . There i s the quest ion as to how the rate
of uptake from the air compares to transport ltion within the tree

- 6 6 -
system . In other words , is the net sulphur movement upwards or down
wards ? To what extent do a l l the needles of the tree i sotopica l l y
equil ibrate with each other? I s it a dynamic system or do o lder need l es
reflect the i �otopic situat ion at some t ime in the past ? In the soi l ,
there are al so a number of variables . Some of the sulphur i s introduced
to the soil from the atmosphere . There may also be other sources such
as subsurface gypsum . Microbio l ogical act ivity in the soi l wi l l
redistribute sulphur i sotopes . Experiment s to e ludidate some of these
probl ems have been started .
Since �he 05 3 4 compos ition of the atmosphere of Alberta
is quite positive as compared to the t errestrial average , we are al so
examining soi l , l ichens , and needles in the l ocat ion where the atmo spheric
05 3 4 composition is nearer to zero (Wawa , �ltario) . Thi s study should
test the val idity of the interpretations made for the Ram River area .
SULPHUR ISOTOPES IN HYDROLOGY
Our studies of sulphur isotope abundances in streams have
not been d irectly rel ated to the sour gas proce s s ing industry . However ,
a brief summary of our findings i l lustrates the potential of thi s
technique .
In studies of thermal s?rings of western Canada , the 053 4
values for 504- fel l in l ine with evapoTlte dat a . We were abl e to
conc lude that the sulphate did not ari se by the chemical oxidat ion of
sulphides at depth but rather ancient marine sulphate depos its were

- 67 -
disso lved by these waters . The H2S in these springs was much l i ghter
i sotopical ly than the assoc iated sulphates ; this could be attributed
to the preferential reduction of S 3 204= by sulphate-reducing bacteria
(KROUSE et aI , 1970) . In a study of the Mackenz i e River System , HITCHON
and KROUSE ( 1 972) were abl e to relate the 853 4 values encount ered to
di fferent geological sources with the help of chemical data and factor
analyses despite the fact that biological act ivity had undoubtedly
altered the, i sotopic abundances . KROUSE and MACKAY ( 1 97 1 ) used H201 8 /H201 6
abundances to verify that thoTough lateral mixing of the �1ackenz ie and
Liard r ivers required a d istance of the order of 200 miles .
More recent ly, HI SLOP and KROUSE ( 1 973) carried out a
p i l ot study on the Cal gary river system . General ly, we found that
relat ively smooth concentrat ion profi les could be contrasted by l arge
variat ions in the 8S 3 4 values . Figure 7 shows one interes t ing cro s s
sect ion from our study . Note the 8S3 4 fluctuations i n the mainstream .
Al so note that the east branch (sample 7) has a much h i gher concentra
t ion and much lower 8S 34 value than samples in the main stream . These
data point to a source on the east branch since contribut ions from Nose
Creek or further upstream should have also affected sample 6 . However ,
sample 6 is s imi l ar in concentration and 8S 34 value to other samples
in the mainstream .
Contributions from the Sulphur Gas Industry and their
fates in streams could be effectively monitored by S 3 4/S 3 2 abundance
measuremeuts .

- 68 -
. CONCLUDING REMARKS
Our studies of sulphur i sotope variations have emphasized
that ident i ficat ion of sources , di spersi on , mixing phenomena and en
vironmental impact are very comp l ex prob l ems . Our studies also give
ins ight into the d i fficulties somet imes encountered with convent ional
techniques . The fact that we have measured different 8S3 4 values for
the same concentration at a given samp l ing site in both atmospheric and
water studies means that concentrat ion measurements alone are insufficient
to provide unambi guous interpretations . The understanding of comp l ex
phenomena requires many measurement s of a number of parameters . For
example , cl ose meteorol ogical monitoring coupl ed with concentration
measurements reduces the chances of mis interpretation (in comparison
to using concentrat ion data alone) . Stable isotope abundances have the
desirable property of providing a natural label . Like any other parameter
it is most effect ive when other techniques are a l so done wel l .
ACKNOWLEDGMENTS
Financ i 3 1 support for the se studies has been provided by
the National Research Counc i l of Canada , Atmospheri c Environment Ser
vice and Aquitaine Co . Ltd . The Alberta Department of the Environment
and Core Laboratories Ltd . assisted in sample col l ect ion .

- 6 9 -
REFERENCES
Baldwin , Robert D . et aI , "The Atmospheric D iagnostics Program at Brookhaven National Laboratory : Second Status Report . " U . S . Department of Commerce , November 1 969 .
Brown , H .M . , Hitchon , Brian and Krouse , H . R . , Unpubl i shed i sotope data on Alberta gas wel l s ( 1 97 3 ) .
Evans , T . L . , Campbel l , F . A . and Krouse , H . R . , "A reconnai ssance study of some western Canadian Lead -Z inc deposits . " Econ . Geol . 6 3 , 349 -5 9 ( 1 968) .
Hisl op , R . and Krouse , H . R . , Unpubl ished Sulphur Isotope Data on the Cal gary River System (1 973) .
Hitchon , B . and Krouse , H . R . , "Hydrogeochemistry of the surface waters of the Mackenzie River drainage basin , Canada - I I I . Stable i sotopes of oxygen , carbon and sulphur . " Geochim . Cosmochim . Acta . 36 , 1 3 3 7 -5 7 ( 1 972) .
Krouse , H . R . , Cook , F . D . , Sasaki , A . a::.lJ Smej kal , V . , "Microbiological fractionation in springs of western Canada . " Rec . Dev . Mass Spec . , University Park Press , 629 -39 (1 970) .
Krouse , H . R . and MacKay , J . R . , "Appl icat ion of H20 1 8 /H201 6 abundances to the probl em of l ateral mixing in the Liard -Mackenzie River system . " Can . J . Earth Sci . �, 1 1 07 -09 ( 1 97 1 ) .
Lewi s , J . S . and Krouse , H . R . , " I sotop ic composition of sul fur and sul fate produced by oxidat ion of FeS . " Earth and Plan . Sc i . Lett . �, 425 -428 (1 969) .
McCul lough , H . and Krouse , H . R . , "Appl icat ion of digital recording to s imul taneous col lection in mas s spectrometry. " Rev . Sci . Instru . 36 , 1 13 2 -34 (1 965) .
Thode , H . G . , MacNamara, J . and Col l ins , C . B . , "Natural variat ions in the i sotopic composition of sulphur and their significance . " Can . J . Res . B27 , 361 -73 ( 1 949) .
Thode , H . G . and Monster , J . , "Sul fur-i sotope geochemistry of petrol eum , evaporites and ancient seas . " funer . Assoc . Petrol . Geol . Mem . !, 3�7 -377 ( 1 9ES) .
Tudge , A . P . cmd Thode , H . G . , "Thermodynamic properties of isotopic cotlpounds of sul fur . " Can . J . Res . B28 , 567 -578 0 . 95 0) .

- 7 0 -
T a b l e 1
I s o t o p i c co m p o s i t i o n o f o xi di z a b l e s u l f u r
c o mp o u n ds i n s a m p l es o f a i r f r o m A l b e r t a
L o c a ti o n S t a t i o n D a te ( 1 9 7 1 )
R e d D e e r 4 A ug . 1 3 4 S e p t . 1 5 5 S e p t . 1 5 6 S e p t . 1 5
L o ne P i n e C r ee k 2 A ug . 1 2 2 S e p t . 1 6
W i n df a l l 5 A ug . 6 5 S e p t . 9
O k o t o k s 2 A ug . 4 2 S e p t . 1 4 S e p t . 1 3 S e p t . 1
B i gs t o n e 1 J li l y 8 2 J u l y 8
C o l e n: a n 8 J u l y 2 7 8 Se p t . 2
C a r s t a i rs 4 A ug . 1 1 4 S e p t . 1 6
8 S 3 ft
+ 2 0 . 9 + 2 0 . 3 + 20 . 7 + 1 4 . 0 + 2 7 . 1 + 2 8 . 1 + 1 5 . 6 + 1 5 . 4 + 2 1 . 3 + 2 1 . 5 + 2 1 . 6 + 1 8 . 2 + 1 8 . 3 + 1 8 . 4 + 1 2 . 7 + 1 2 . 8 + 1 6 . 7 + 1 9 . 0

Figure 1 :
Figure 2 :
F i gure 3 :
Figure 4 :
Figure 5 :
Figure 6 :
Figure 7 :
- 71 -
Terrestrial oS 3 4 Variations .
oS 3 4 Variat i ons in Oxidizab l e Sulphur Compounds in Alberta Air : July-August , 1 9 7 1 .
oS 3 4 vs Sulphur Oxide Concentrat i on for Stat ions near Bal zac , 1 972 .
oS 3 4 vs Sulphur Oxide Concentrat ion for a number of hypothet ical situat ions .
Comparison of OS 3 4 Values for Atmosphere , Lichen and P ine Needles : Ram River Area , 1 972 -73 .
Unknowns in Sulphur Transport in a Pine Tree .
oS 3 4 and S04= Concentrat ions in a Cro s s -Secti on of the
Cal gary River System , Apri l 1 97 3 .

M ETEOR I TE S
BASIC S I L L S
VOLCA N IC
S E D I MENTARY
OCEAN TODAY
EVAPOR I T E S
P b - Zn D E POS ITS
H2S ( DEVON IAN )
P E T R O L E U M
A I R ( AL BE RTA )
F R E S H WATE R
COAL
I
- 7 2 -
• -
I
'f%%W4t.... ·· · ····· · 1
SOl L (A LBE RTA) r» .· \ .·.· ··. » > •. ·... < . )} i i >.) . . . / ·> .i . ... . ..... < > .• >< ..••• .... ··· ? · · .· · .·?r.? ....... • I I I
- 40 - 20 0 +20 + 40
8 534 (%0) • H2S SULPH I D ES [] SUL P H AT ES , S02 � ORGANIC , S
O
Figure 1 : Terrestrial OS 3 � Variations .

- 7 3 -
• G RANDE PRAIRIE ( + 18.6 ) 0",< + 18.6 )
.-< + 15.5 )
• EDMONTON ( + 10.6 )
( + 12.9)-. .-< + 12 . 0 ) o RED DEER ( + 20. 6 )
( 1 \ - ·-( + 14.0) + 9.4rw o:{ + 14 1 ) (+ 16 7 ro .
(+ 16. 6"'�O-< + 17. 2 ) • CALGARY 0.(+18.2) ( + 10. 9 )
) + 12.7 ) o 0 PINCHER CREEK ( + 16. 1 )
Figure 2 : O S 3 4 Variations in Oxidizable Sulphur Compounds in Alberta Air : JulY-August , 1971 .

- 74 -
+ 24 "
0 o ........ ........ 0 o ........ .......
"" ."" ""
0 0 ........ ...... 0 0 • • •
• ..",, --0 ", / � •
en > flO • '"
+12 /' /' BALZAC
/ 1972 ,/ +8 • ,/ • FEB.
,/ o MAY • / o JUN .
• NOV. +40 0.2 0.4 0.6
503 EQU IV. MG. l DAY/ '100 CM.2
Figure 3 : OS 3 4 vs Sulphur Oxide Concentration for Stations near Balzac , 1972 .

- 75 -
A •
[soxJ -SOURCE A CONSTANT
A
@ [SOx]
SOURCE A CONSTANT SOURCE B VARIABLE
Ox SOURCE A FIXED, SMALL: SURROUNDINGS INHOMOGENEOUS, VAR IABLE
[soxJ -SOURCE A VAR IABLE
A
-B
@ [SOx]-SOURCE A VARIABLE
SOURCE B VAR IABLE
SOURCE A VARI ABLE, DOMINANT : SURROUNDINGS INHOMOGENEOUS, VARIABLE
Figure 4 : o S 3 4 vs Sulphur Oxide Concentration for a number o f hypothetical situations .

o + J10
- 76 -
+ 20
8 S34 (%0)
A I R
L IC H E N S
NEE DL ES
+ 30
Figure 5 : Comparison of OS 3 � Values for Atmosphere, Lichen and Pine Needles : Ram River Area , 1972-73 .

S U L P H U R /
OX I DE.S
............
? •
BACT E R I AL CONVERSIONS
� NUTRIE N T
?I
- 7 7 -
DEE P SOU RCES
Figure 6 : Unknowns in Sulphur Transport in a Pine Tree .
" I' I
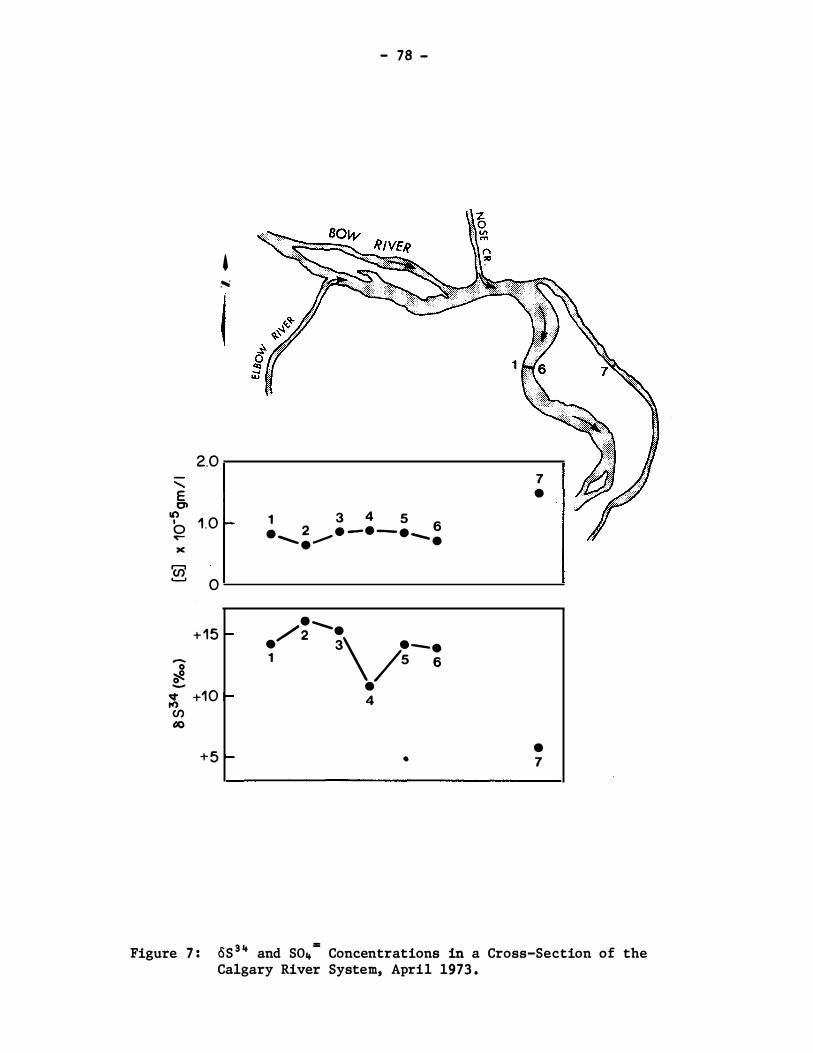
2.0 "-E CJ) 10
1 .0 I 0 � x
7B ........ 0
+ 1 5 -J 0 -
'It +1 0 It) en �
+ 5
• ....
-
....
to-
- 78 -
4 1 3 5 • 2 . _. _ . 6
........ . ,."... ........ .
/ ......... 2 • . 3\ . -. 1 /5 6
• 4
•
7 •
• 7
Figure 7 : OS 3 4 and S04=
Concentrations in a Cross-Section of the Calgary River System, April 1973 .

- 79 -
ATMOSHPERIC SULPHUR DIOXIDE : EFFECTS ON THE pH AND SULPHUR CONTENT OF RAIN AND SNOW; ADDITION OF SULPHUR TO SURFACE WATERS , SOIL , AND CROPS ;
AND ACIDIFICATION OF SOILS
by
M. Nyborg Soil S cience Department
University of Alberta , Edmonton
and
McKinnon , Allen & Ass o ciates Ltd .
INTRODUCTION
Direc.t toxicity of S 02
to humans , lives tock , and vegetation has
received much attention . Quite apar t f rom direct toxicity , S 02
may have
important indirect effects on the environment . The sulphur content and acidity
of rain , snow , s oils and waters may b e increased by S 02 emissions with conse
quent effects on vegetation and aquatic life .
Sulphur gases that do not settle out are slowly oxidized to sulphate
in the atmosphere . Neutral sulphate s al ts form to the extent that cations are
available in the atmosphere (e . g . + ++ ++ + + NH4 , Ca , Mg , K , Na ) but any excess
sulphate forms sulphuric acid . Rain and snow in N ew England and northwestern
Europe frequently contain small amounts of sulphuric acid (Johnson et a l . 197 2 ,
Anon 19 71) . Average pH of precipi tation was found to vary f rom 3 . 9 to 4 . 3 at
several s tations in New York S tate , New Hampshire , Massachusetts and Connecticut
(Likens 1972) . By comparison , rains in areas dis tant from indus try usually have
pH values in the range of 5 . 5 to 7 . 0 . In Sweden fores t growth has been slightly
reduced and s ome bodies of water have become too acid for certain types of fish
(Anon 1971) ; and the cause is apparently the deposi tion of sulphuric acid in
rain and snow (Anon 19 71) . Deposition in rain and snow is generally considered
the main way that S02 emissions are b rought to earth (Alway 193 7 , Hoeft 19 72) .

- 80 -
However , S 02 can be adsorbed directly from the air by both plants (Coleman
1966) and soils (Johansson 1959 ) .
In Alberta the processing of s our natural gas and the extraction
of oil from the tar sands together result in emission of about 550 , 000 long
tons of S 02 annually (Tollefsen 19 72) . The long- term effects of those
emissions on soils and waters depends entirely on the concentration and
form in whi ch the S comes to earth . Evenly dis tributed over the p rovince
annual emissions would result in a deposi tion rate of about 3 lbs . per acre .
But emission squrces are not evenly distributed and deposi tion is prob ab ly
concentrated around the s ources . If deposi tions were concentrated on only
5% of the p rovince (about 10 million acres ) the rate of deposition would
then be about 60 lbs . per acre per year . Assuming the S were deposi ted mos t
ly as sulphuric acid , the pH of mos t soi ls would drop by 0 . 5 to 1 . 5 uni ts
after 10 years . In many farm soils such a decrease would mean that soil
acidity sensitive crops (e . g . alfalfa and b arley) would no longer grow well .
Acidity in farm soils could be corre cted by liming , but this would be diffi
cult if not impractical in fores ts .
Sulphur deposi tions may be a benefit in s ome areas , especially if .
they are not acid-forming . Many soils in Alberta are defi cient in S for farm
and fores t crops , and on those soils use of S fertili zers increas es yield of
cereal grains , rapeseed , and legumes (Nyborg 1968) . Consis tent deposition of
about 10 lb . S p�r acre annually would eliminate much o f the need for S fert
i li zers .
Relatively small amounts of S are b rought down by p recipitation in
Alberta. Walker (1969) estimated that 2 to 4 lb . S per acre come down annu
ally in rain and snow in Central Alberta. Summers and Hi tchon (19 73) es timated

- 81 -
that an average of 2 . 3 lb . S per acre was deposi ted by rain in 3 months
w� thin a 25 miles radius of a gas plant emi tting 30 long tons of S daily .
There is no information on the amounts of S being deposited by other means
in the p rovince .
Our obj ectives were to find how and where S 02
comes to earth and
in what concentrations . Specific obj ectives were to find if S 02
emissions
acidify precipi tation , soils and waters under Alb erta condi tions ; and to
determine the amounts of S02
adsorbed directly by vegetation , soils , and
waters at different dis tances from gas plants .
This paper b rings together results to date from two separate p roj ects .
One proj ect , supported by Shell Canada Limited , was begun in 19 72 wi th work
concentrated in the Pincher Creek-Waterton area . The other , sponsored by
the Alberta Environmental Res earch Trust , was s tarted in 19 73 at various
locations .
�mTHODS AND MATERIALS
In 19 72 , 12 s tations were es tab lished near the Shell Waterton gas
plant , whi ch has a maximum emission of 124 long tons of sulphur per day . Eleven
of the s tations were located clos e to the plant ( 1 . 5 to 10 miles ) while 1 control
station was 25 miles away . In 19 73 , the number of s tations was increased f rom
12 to 19 . In 1973 , 59 additional s tations were estab lished in other areas of
Alberta and 4 control stations were placed in Saskatchewan . Thirteen were
located near the Aqui taine Ram River gas processing plant , whi ch has a maximum
emission of 84 long tons of S per day .
Rainfall samples were ob tained at each station , using p las tic funnels
mounted on plas tic receiving bottles . Funnels �vere fitted with fine s creens to
exclude insects and debris . In 19 72 samples were taken from each rainfall , but

- 82 -
in 19 73 samples were taken of accumulated rainfall during each week.
New and old snow were sampled during January-March , 19 73 near the
Waterton plant , near the Ram River plant , throughout north-central and north-
ern Alberta, and in northern Saskatchewan .
Rain and snow water were analyzed for pH , and for S04 by a modifi
cation of Dean ' s method (1966 ) . Some s amples were also analy zed for content
of C a , Mg , Na , K (by atomic absorp tion) , and NH4 and N03 (by s team distil
lation) •
Experiments to de termine the amount of S added to soils by emissions ,
and the effect of emissions on soil pH , were conducted at all s tations in 19 72
and 19 73. However , only three experiments set out in 19 72 near the Water ton
plant have been completely analyzed.
The amount of S added to soi ls was es timated by 'exposing a Gray Wooded
topsoil of loam texture (Bre ton series ) in I-gallon plas ti c pots at 6 s tations
near the Waterton plant. The pots were kep t free of plant growth and period-
i cally brought to field capaci ty wa ter content by adding distilled water . The
pots were exposed during June , July and Augus t of 19 72 . The soil was then
analyzed for soluble S04-S ,
The effect on soi l pH was estimated in two experiments . In one
experiment , the Gray Wooded soil was p laced in 2-gallon p las tic pots , sown to
creeping red fes cue and exposed at 10 stations wi thout watering from late June ,
19 72 , to early May , 19 73 . Soil pH was determined on samples from the 1- to 3-cm .
depth . (The top 1 cm. �'7as dis carded because of wind-b lown soil and debris at
some s tations . ) In the other experiment , b arley was grown on a slightly cal-
careous Dark Brown soil of loam texture in four 5-gallon plas tic pots at each
of 12 stations . The pots were exposed from June 1 to September 1 , 19 72
and were periodically b rought to field capacity wi th distilled water. S oil
I ' I I

- 83 -
pH was determined on the top 5 cm. and on the top 15 cm. of all pots . Barley
grown in similar pots in 19 73 was s ampled at weekly intervals for determination
of water-solub le S04-S .
Abs orption of sulphur emissions by water was estimated in experiments
near the Waterton and Ram River plants in 19 73 . Dis tilled water was exposed in
p las tic beakers ( connected to a reservoir whi ch maintained the water level) ,
protected by a fine s creen to exclude insects and deb ris and a roof to exclude
rainfall . Exposure was during Augus t near the Ram River plant , and f rom mid-
Augus t to late September near the Waterton plant . The water samples were then ..
analyzed for S04-S content and pH .
The pH of s oils was determined in a mixture of 1 part soil and 2 . 5
parts water . The so�uble S04-S in soils was extrac ted wi th 0 . 1M CaC12 solution ,
and solub le S04-S in plant samples was extracted with water . The S04-S content
of water , and soil and plant extracts was determined by a modification of Dean ' s
( 1966) method .
RESULTS
The pH and sulphur content of rain
F rom June 22 to Augus t 1 , 19 72 , the average pH of rain from four
s tations 1 . 5 to 10 miles downwind from the Waterton plant was 1 . 3 to 0 . 6 uni ts
lower than at the cuntrol s tation 25 miles away , or at two stations not down-
wind (Table 1) . The SO 4-S content of rain do�·mwind was moderate (1 . 5 to 2 . 8
ppm) and higher than at the control s tation (0 .9 ppm) .
Results \",et e quite different in 19 73 . The SO 4-S content at the control
s tation was similar to that in 19 72 . But downwind f rom the gas plant S04-S
content was consis tently higher than in 19 72 ; while pH was not depressed signif-
i cantly (Tab le 1) . Analyses of selected rains for Ca , Mg , K , Na , and NH4 in-
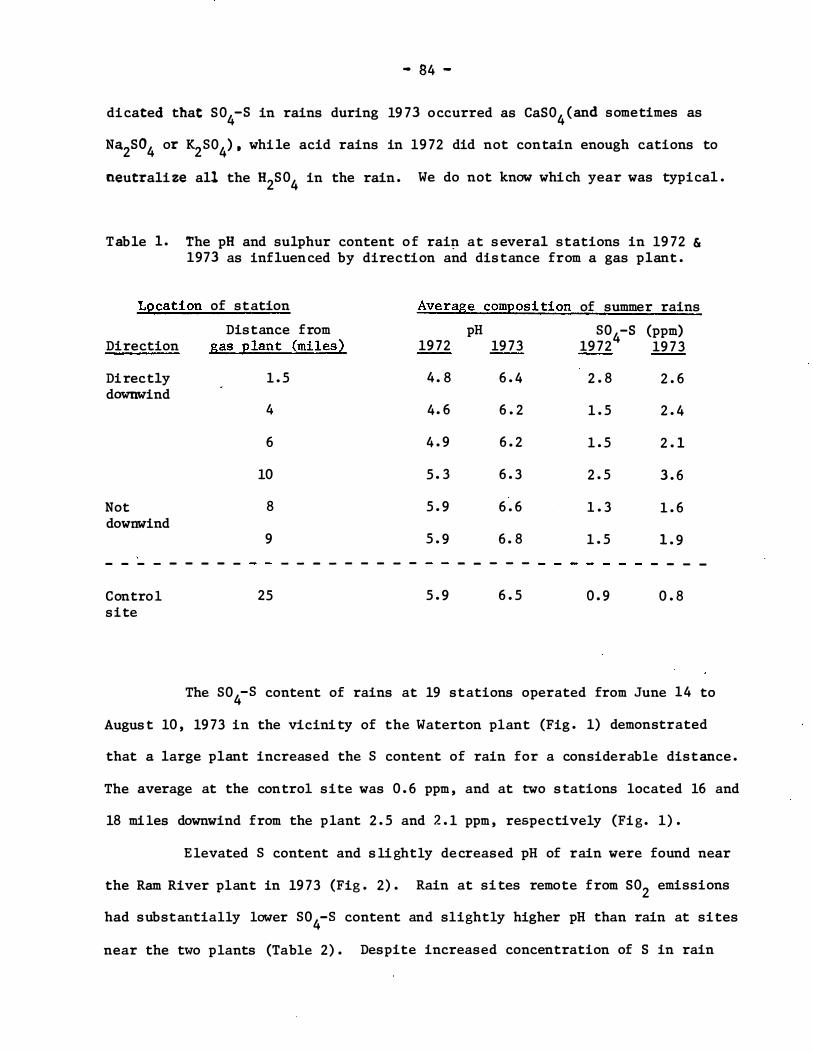
.. 84 ..
dicated that S04-S in rains during 19 73 occurred as CaS04 (and sometimes as
Na2S04 or K2804) . while acid rains in 1972 did not contain enough cations to
neutrali ze all the H2S04 in the rain . We do not know which year was typical .
Table 1 . The pH and sulphur content of rai� at s everal stations in 19 72 & 1973 as influenced by direction and dis tance from a gas plant .
LQcation of station Average comEosi tion of summer rains
Direction
Directly downwind
Not downwind
- - - - -
Control site
Distance from gas
- - - -
Elant (miles)
1 . 5
4
6
10
8
9
- - - - - - - - -
25
19 72
4 . 8
4 . 6
4 . 9
5 . 3
5 . 9
5 . 9
5 . 9
pH 80 -S 19 73 19 72
4
6 . 4 2 . 8
6 . 2 1 . 5
6 . 2 1 . 5
6 . 3 2 . 5
6 . 6 1 . 3
6 . 8 1 . 5
- - - - -
6 . 5 0 . 9
(ppm) 19 73
2 . 6
2 . 4
2 . 1
3 . 6
1 . 6
1 . 9
- - - -
0 . 8
The 804-8 content of rains at 19 stations operated from June 14 to
Augus t 10 , 19 73 in the vicinity of the Waterton plant (Fig . 1) demonstrated
that a large plant increased the 8 content of rain for a considerable distance .
The average at the control site was 0 . 6 ppm , and at two s tations located 16 and
18 miles downwind from the plant 2 . 5 and 2 . 1 ppm , respectively (Fig . 1) .
Elevated 8 content and s lightly decreased pH of rain were found near
the Ram River plant in 19 73 (Fig . 2) . Rain at sites remote from S02 emissions
had subst<ially lower 804-8 content and slightly higher pH than rain at sites
near the two plants (Table 2) . Despite increased concentration of S in rain

'" • 1 .7
0.6 ppm at control s ite 25 m i l e s from go s p lant
/ /
/ I ,� 2. 1
" . \ 1 .3 \
\
. 2.5
2.0 TO 2.9 PPM-
� -' MORE THAN 3.0 PPM
1 .6 J 2.5 e/ /--e/i3.0 I . 2.5 •
� 2.2 2. 1 1 8 / '......
• .
- - - - - -- - - - - - -
GAS PLANT . • • 1 .5 1 .8 1 .2 LESS THAN 2.0 PPM + I
Scal e: 1 inch = 5 m i l e s
. 1. 1 F i gure 1 Average content of S04 - S (ppm) i n rainfa l l from June 14 to Augu st 10, 1973, at 18
stati on s in the vi cin ity of a gas processing p lant. ( Location station s shown by dark c i rcles)
- "
CIO VI I

pH 5.9 • 0.8 ppm S
• pH 5.7 0.8 ppm S
• pH 5.2 2.2 ppm S
• pH 5.5 1.5 ppm S
GAS PLANT
pH 5.8 • 0.9 ppm S
• pH 5.5 1 .9 ppm S
+ I
Scale: 1 i nch = 2 m i l e s
pH 5.6 1 .7 ppm S
•
pH 6. 1 1 .3 ppm S •
-� � Fi gure 2: Average pH and S04 - S content of rainfa l l from J u ly 5 to August 30, 1973, at 10 stati on s i n the vi cin ity of a gas processi,ng plant.
00 0\

- 87 -
near the two plants , the amounts b rought down were quite small : less than 2
lb� S per acre (Table 2) .
Tab le 2 . 1 Characteristics of rain during 1973 at s tations remo te f rom and near to s ources of SO emissions .
2
Average SO --S Amount of sulphur Average 2 b rought down by
Location pH content (ppm) rain (lb . S/acre)
Lundbreck , Alta. 6 . 5 0 . 8 0 . 6
Thickwood Hills , Alta. 6 . 0 0 . 7 0 . 5
Canwood, Sask . 6 . 3 0 . 6 0 . 7
Fiske , Sask . 6 . 4 0 . 7 0 . 3
Waterton plant 2 5 . 6 2 . 4 1 . 3
Ram River plant 3 5 . 5 5 . 5 1 . 6
�or the periods May 1 to Sep tember 7 at Lundb reck , July 10 to Sep tember 1 3 at
Thickwood Hills , June 27 to Sep tember 5 at Canwood , and June 28 to Sep tember 5
at Fiske .
2 Average for 4 dmnlwind s tations , June 1 to Augus t 30 , 19 72 and May 1 to
Sep tember 7 , 19 73 .
3Average for 6 downwind stations , July 5 to Augus t 30 , 19 73 .
The pH and sulphur conte�� of snow
Samples of newly-fallen and old snow were taken at some 100 si tes
in Alb erta and Saskatchewan . Typical results showing pH and S content of
the winter ' s accumulated snow are given in Tab le 3. At two sites remote
f rom S02 s ources (Beaverlodge , Alta . ; and Canwood , Sask . ) the winter ' s snow
(as samp led in March , 19 73) contained less than 0 . 2 lb . S per acre, and pH of
the snow water averaged 5 . 5 . At sites in central Alberta , which are close to

- 88 -
several plants , S content increas ed to only 0 . 6 lb . S per acre and pH was
approximately 6 . 0 . Likewise , in the vicinity of the Ram River plant the
winter' s snow had only about 0 . 6 lb . S per acre , and pH was about 6 . 0 . The
results in Table 3 show that gas p lants added less than l Ib . S per acre to
snow, and did not make the snow acid (instead there was a tendency for the
pH of snow to inarease wi th increasing S content) .
Newly-fallen snow typically had S contents o f 0 . 1 to 0 . 4 ppm whether
taken near plants or in remote areas . Older snow had slightly higher contents ,
especially near plants , indicating that atmospheric S was either absorbed by
the snow or deposi ted on i t . Experiments near one gas plant demons trated snow
surfaces absorb ed small amounts of S directly from the air over a period of
several weeks .
T ab le 3 . The pH and sulphur content o f the winter ' s accumulated snow , at various locations s ampled in March , 1973 .
Location
Dis tan t Si tes Beaverlodge , Alberta
Canwood , S askatchewan
Sites in the Region of Gas Plants Lacombe , Alberta
Stettler , Alb erta
Ram River Plan t control*
downwind**
*Average of 2 remote sites .
pH of snow
5 . 4
5 . 6
6 . 2
5 . 9
5 . 6
5 . 8
Sulphur in the winter ' s snow (lb . S /acre)
0 . 14
0 . 16
0 . 42
0 . 40
0 . 22
0 . 63
**Average of 6 sites at 1 to 12 miles from the gqS plant .

- 8 9 -
Amounts of sUlphur gained by soils
Sulphur gained by bare s oil, and deposited by rain during 3 months ,
is given in Table 4 . Total S gained b y the soil was 8 t o 1 0 times greater
than the amount in rain at 3 s tations directly downwind from the Waterton gas
p lan t , and it was 3 to 5 times greater at 3 other s tations not directly down-
wind. The amounts o f sulphur gained by the soil were substantial , varying
from 9 to 18 lb . S per acre at three s tations located from 6 to 1 . 5 miles
downwind from the plan t .
Tab le 4 . Sulphur brought down in rain and gained by s oil from June 1 to Augus t 30 , 19 72 , at s tations near the Waterton plan t .
Location of s tation Sulphur �lb . Slacrel Distance from Brought down Gained by
Direction gas plant (miles) in rain soil
Directly 1 . 5 1 . 8 1 8 . 3 downwind
4 1 . 4 1 1 . 0
6 1 . 2 9 . 4
Not directly 3 1 . 6 7 . 3 downwind
7 0 . 9 4 .9
7 1 . 3 3 . 5
Depression in soil pH
After exposure of the Gray Wooded soil for 10 months , pH of the 1-
to 3-em. depth was an average of 0 . 10 units lower at 5 s tations directly down-
wind from a plant than at 5 s tations no t directly downwind (Table 5) . Like-
wise , after exposure of the Dark Brown for 3 months near the plant , pH of the
top 5 em. of soil was an average of 0 . 06 uni ts lower at 6 sites with high

- 90 -
su1phation cylinder readings , than at 6 sites with lower readings (Table 6) .
A difference of 0 . 08 units was found for the top 15 � of the Dark Brown soil .
While differences were very small for the Dark Brown s oil , they were s tatis-
tica11y significant .
Two exploratory experiments , one with a poor1y�buffered subsoil
and another with a Black topsoil , also showed slight but consis tent lowering
of soil pH on e�osure for 6 weeks dire ctly downwind from the plant .
Table 5 . The pH of the 1- to 3-cm. depth of a Gray Wooded s oil exposed for 10 months at stations near a gas processing plant .
Location of s tation
Direction
Directly downwind
Not directly downwind
Dis tance from gas plant (miles)
1 . 5
4
6
7
10
Average
3
7
7
9
9
Average
pH of the 1- to depth of soil
6 . 05
6 . 12
6 . 16
6 . 05
6 . 10
6 . 10
6 . 22
6 . 12
6 . 2 7
6 . 16
6 . 23
6 . 20
3-cm.

- 91 -
Tab le 6 . The pH of the top 5 em . of a slightly calcareous Dark Brown soil 1 af ter exposure for 3 months a t stations near a gas p rocessing plant .
pH at sites wi th high pH at sites with lower Pai r No . sulphation readings sulphation readings
1 8 . 02 8 . 10
2 7 . 9 1 7 . 9 7
3 7 . 75 7 . 89
4 7 . 80 7 . 92
5 8 . 00 7 . 92
6 7 . 82 7 . 9 7
Average 7 . 88 7 . 94
18tations were located in pairs , wi th the s tations of each pai r at sites of
similar land elevation but different su1phation cylinder readings .
Absorption of s ulphur gas emissions by crops
The S04-S content of b arley samples fluctuated markedly with time and
sampling s tation (Table 7) . Mapping of values showed that areas o f concentration
shifted from one week to the next , suggesting shifts in the emission pat tern .
The rapid fluctuations of 804-8 in barley indicated subs tantial absorp tion of
802 by plants .
Abs orption of atmospheri c sulphur gases by surface water
Dis ti lled water protected from rain , but exposed to the air , absorbed
substantial amounts of 8 near the Waterton plant (Figure 3) . Directly downwind
(northeas t) , water gained 10 to 16 lb . 8 per acre expressed on a basis of 6
months ' exposure . The gain was 6 to 9 lb . at the sites not downwind . Near the

0 7
o 7
/ -- --.// : 8 7
LESS THAN 10 LB. ./ 10 LB. OR MORE
9 /./ ....-_1'/. 10 �
/.16 15 4-- -- - - - - --
".13 /' GAS PLANT J" ,- -",, '"
9
CD 6
• 6
8
•
• 9
"'
+ I
Scale: 1 i nch = 5 m i les
Fi gure 3 Amounts of sulphur gai ned by water exposed to the ai r but protected from rai n . Resul ts are expres sed a s l b. S per
acre for a 6-month period.
\0 N

- 93 -
Ram River plant 1 to 6 lb . S per acre was absorbed , expressed on a basis of
6 months . The highest values were obtained at s t ations in open areas ,
sugges ting that forest cover reduced absorp tion by water . The pH o f water
after exposure showed no consis tent pattern , apparently because other sub-
stances were absorbed besides S .
Tab le 7 . Water solub le S04-S in sampling dates .
Location of s tation
Direction Distance
North 9
Northeas t 1 . 5
Northeast 4
Northeas t 5
Eas t 6
S outheast 7
South 3
barley near a gas processing plant at four
May 31
1 , 540
1 , 050
1 , 240
1 , 320
1 , 680
900
650
Water so luble
June 19
9 70
1 , 2 10
620
950
1 , 140
650
1 , 150
S 04-S (ppm)
June 2 8
600
1 , 100
710
440
580
620
680
July 18
1 , 2 10
1 , 200
880
1 , 020
740
650
590
DISCUSSION
Some rainfalls near gas processing p lants were as acid as pH 4 . 0 ,
but acid rain here is much less frequent and severe than in parts of the world
which are heavily industrialized . For example , Johnson , et a Z . (19 72) report
ave�ge pH values of 4 . 0 and some rainfalls of pH 3 . 0 . Rainfall near p lants
often contained as much as 2 to 5 ppm S04-S , which produces very acid rain if
S occurs as H2S04 rather than sulphate salts . Analysis of rain s amples for C a ,
Mg , K , and N a showed that most rains had a high enough cation content to prevent

- 94 -
extreme acidi ty •
Snow acquired very small but significant amounts of S from gas plant
emissions . However , we did not encounter snow that had been acid .
Rain and snow in areas of Alb erta and Saskatchewan dis tant from S02
s ources had very low S contents , close to the world-wide background o f 0 . 5 ppm
(Junge 1963) . Consequently , thos e remote si tes received li ttle or no S in
p recipitation from gas p lants or other indus tries .
The amounts of S deposi ted by rain and snow immediately downwind f rom
two plants with heavy S02 emissions were surp risingly small -- only 2 to 4 lb .
S per acre annually . Walker (1969 ) found annual S deposi tion of 2 to 4 lb .
per acre in rain and snow throughout a large area in Central Alb erta , but his
sampling sites , unlike ours , were no t concentrated near gas p lants . Summers and
Hitchon ( 19 73) es timated deposition of 2 . 3 lb . S per acre in rain during 3 months
near a p lant with annual S emissions of ab out 30 long tons . Our measurements
indicated s lightly lower amounts near two plants with much heavier S02 emiss i ons .
In some parts of the world S is b rought to earth mos tly by snow and
rain (Alway 1937 , Hoeft 19 72) . Amounts can be large , and Hoeft ( 19 72) found
annual depositions by rain and snow in Wis cons in were 16 , 42 , and 168 kg S per
ha for rural , urban and indus trial locations , respectively . Obvious ly , the
situation is quite different in Alberta.
In Alberta mos t S reaches the soil by means other than deposition in
rain and snow . At three s tations located from 1 . 5 to 6 mi les directly downwind
from a p lant� bare soi l gained from 9 . 4 to 1 8. 3 lb . S pel' acre in 3 months� of
which only 1 . 3 to 1 . 8 lb . S pel' acre were deposi ted by rain. Thus S content
of rain is a very poor indicator of the amount of S coming to earth in Alberta .
Our results are similar to those o f Johanss on (1959) who found that in Sweden ,
at dis tances of 1 to 8 km from an oi l-burning power plant , much more S was

- 95 -
absorbed directly from the air by soils than was b rought down in precipitation .
Several experiments indicated a s ligh t but consistent lowering o f soil pH
downwind from S gas emissions . Our results are preliminary , but by extrapola-
tion , the pH of the plowlayer of farm s oils could b e lowered by about one pH
unit after a period of 15 to 30 years . This would not be especially serious
for farm land becaus e applying lime at about 1 ton per acre would correct the
acid condition which had developed. Soil acidity in farm land is not unusual .
Approximately 20 per cent of the farm land in Alberta is naturally too acid
for the bes t growth of alfalfa (Nyborg 1972) , and liming is b ecoming an
agricultural practice . The consequences of soil acidi fi cation by S emissions
would be more serious in fores ts , becaus e soils are poorly-buffered and difficult
to treat with lime .
Plants can absorb S 02 directly from the air through their leaves , but
not usually enough for their total S requirements (Coleman 1966) . Our preliminary
results indicate significant absorption of S gas emissions by b arley at dis tances
of up to 10 miles or more from a gas plant with heavy S02 emissions .
Sulphur gases may be di rectly absorbed by water . Our results gave
absorp tion rates of 1 to 16 lb . S per acre of water surface in 6 months at
dis tances of up to 15 miles downwind of two gas plants .
There is still another mechanism by which S gases may come to earth .
Baker et aZ . ( 19 73) sugges t that S02 is adsorbed on vegetation and then washed
off by rain .
In summary , we have found that in Alber ta S gas emissions are b rought
to earth through direct abs orption by soils , vegetation and water , as well as
by deposition in rain and snow . The amounts of S deposi ted in rain are very
small , and the prob lem of acid rain is much less severe than in heavily indus t-
riali zed parts of the world . Our preliminary results indicate that soils down-

- 9 6 -
wind from emission s ources receive enough S (primarily through abs orption) to
cause gradual lowering of soil pH.
ACKNOWLEDGEMENTS
Mos t res ults for the Pincher Creek-Waterton area are taken from a
proj ect funded by Shell Canada Limited and conducted by McKinnon , Allen &
Associ ates Ltd. ; and the permission of Shell Canada Limi ted to pub lish those
results is acknowledged . The other work is supported by the Alberta Envi ron
mental Research Trus t , in a proj ect involving C . F . Bentley and C .A . Dick , Soil
S cience Department , University of Alberta ; R . F . Klemm, Alberta Research Council ;
and D . R. Walker , Research S tation , Canada Department of Agriculture , Lacomb e .
The work near the Ram River plant was in cooperation with Joe Baker and Drake
Hocking of the Northern Fores t Research Centre , Edmonton . O thers who have
contributed generously in time and effort are Neil Barnes , Oliver Glanfield,
Jorn Thomsen and Don Lalonde of the Alberta Fores t Service ; Trevor Landalls
and Eri c Dyck of the Division of Hydrology , Universi ty of S askatchewan ; Elling
Nyborg , of Canwood , Saskatchewan ; and John Fahls , Experimental Farm , S co tt ,
Saskatchewan.
REFERENCES
Alway , F . J . et aZ. 193 7 . Sufficiency of atmospheric sulphur for maximum crop
yields . Soi l S ci . Soc. Amer. Pro c . 2 : 229-238 .
Anon 1971 . Royal Minis try of Foreign Affairs (Sweden) . 19 71 . Air pollution
across national boundaries . Kung1 . Boktrycheriet , P .A . Nors tedt o ch
S oner , S tockholm.
Baker , J . e t a Z . 19 73 . E ffect of atmospheric sulfur dioxide on the p H o f rain
intercepted by forest trees . Proceedings of the Workshop on Sulphur
Gas Research in Alberta , Nov . , 19 73 .

..
- 97 -
Coleman , R. 1966 . The importance of sulphur as a plant nutrient in world
crop production. Soil S ci . 101 : 230-239 .
Dean , G .A . 1966 . A simple colorimetric finish for the Johnson-Nishi ta
microdis tillation of sulphur . Analys t . 9 1 : 530-532 .
Hoeft , R. G . e t at. 19 72 . Nitrogen and sulphur in precipitation and sulphur
dioxide in the atmosphere in Wis consin . J . Environ . Quali ty .
1: 203-208 .
Johansson , o . 1959 . On sulphur problems in Swedish agriculture . Ann . Agr .
ColI . , Sweden . Vol . 25 : 5 7-169 .
Johnson , N . W. et at. 1972 . Atmoshperic Sulphur : Its effect on the chemical
weathering of New England. S cience . 1 7 7 : 514-516 .
Junge , C . E . 1963. Air chemis try and radioactivity . Academic Press ,
New York.
Likens , G . E . 1972 . Acid rain . Environment . 14 : 33-40 .
Nyborg , M. 19 72. Soil acidity and liming in Alberta. Agriculture Bulletin ,
Universi ty of Alberta. Number 1 7 , page 8-11 .
Summers , P .W. , and Hitchon , B . 19 73. Source and budget o f sulphate in
precipi tation fro� Central Alberta. Can . Journal of the Air Pollution
Control Association . 2 3 : 194- 199 .
Tollefsen , E .L . 1972 . Sources of air pollutants and future trends in air
quali ty s tandards . Second Annual Quarterly meeting , Canadian Natural
Gas Processors Association , Edmonton , June 9 , 19 72 .
Walker , D . G . 1969 . Sulphur in precipitation in Central Alberta. Can. J . Soil
Sci . 49 : 409- 410 .

- 98 -
EFFECT OF ATMOSPHERIC SULFUR DIOXIDE ON THE pH OF RAIN INTERCEPTED
BY FOREST TREES
by
J . Baker and D . Hocking Canadian Forestry Service
Northern Forest Research Centre , Edmonton
and
M. Nyborg Soil Science Department
University of Alberta , Edmonton
INTRODUCTION
Sulphur gas emissions may depress the pH of rain (Likens 1972)
but little is known of their effects on intercepted rain (throughfall and
stemflow) in forests . The Aquitaine Ram River gas processing plant , located
in a lodgepole pine-dominated forest , emits up to 84 long tons of S02 per
day. The plant ·and surrounding environment provide a satisfactory location
for investigating the influence of the forest on acidification of rain by
METHODS
Eight collection sites were established up to 8 miles from the
gas plant . Three control sites were later established 10 to 12 miles
upwind from the plant and separated from it by a long , high ridge of land .
Rainfall was collected in clea.rings and intercepted rain in immedia.tely
adjacent stands of lodgepole pine . Samples of open rain and intercepted
rain were collected in plastic bottles fitted with funnels having screens
to exclude insects and debris . At each site , stemflow was gathered from

- 99 -
one tree with a trunk diameter of approximately 18 inches . Collection
devices were left in place and the ent ire sample was removed at weekly
intervals . Analyses performed on samples included pH and sulfate , the .
latter by a modification of Dean ' s method (Dean 1966) .
RESULTS
During the period July 5 to August 16 , the average pH value of
rain at the eight test sites was 5 . 6 . The average pH values of throughfa11
and stemf10w were 5 . 0 and 4 . 1 respectively (Table 1) . Samples of rain
and intercepted rain were obtained at all sites on August 23 and August 30 .
The average pH value of rain over the sampling period (August 17-30) at or
near the gas plant was 0 . 6 pH units lower than that of the control sites .
However , pH values of both throughfa1l and stemflow were an average of 1 . 8
units lower at the sites near the plant than those at the control sites
(Table 1) .
Table 1 . Average pH values of rain and intercepted rain .
Ir tereeI1ted Location Period of time Rain 7hroughfall
8 sites near July 5 to Aug . 1 6 5 . 6 5 . 0 the gas plant Aug . 17 to Aug . 30 5 . 7 4 . 6
Aug . 31 to Oct . 15 5 . 9 5 . 7
3 control sites Aug . 17 to Aug . 30 6 . 3 6 . 4 Aug . 31 to Oct . 15 6 . 6 6 . 7
Fain Stemf1o�'r
4 . 1 4 . 0 3 . 9
5 . 8 5 . 4
Results for the samples collected on August 30 are shown in
Figure 1 . The pH values o f throughfa1l from cont=ol sites r8�ged from 7 . 1
to 6 . 6 , while those from exposed sites ranged from 5 . 2 to 4 . � . At the
control sites pH of stemf10w varied from 5 . 0 to 7 . 0 ; at test site� , from
4 . 6 to 3 . 4 .

- 100 -
During the period August 31 to October 1 5 , rains were lighter and
less frequent than earlier in the season . Rain and intercepted rain could
not be sampled consistently at all sites , so detailed comparisons between
control and test sites were impossible . However , pH was still depressed
at test sites (Table 1) .
Intercepted rain was consistently higher than open rain in total
sulphate-S content . Actual data are not given here because our method did
not distinguish between inorganic and labile organic sulphate and figures
may be misleading .
DISCUSSION
The increased acidity of intercepted rain could possibly be due
to the adsorption of emitted S02 on the surface of needles and/or bark of
trees , which subsequently dissolves in water forming sulfurous acid (H2S03) .
Data on sulphate content are consistent with this hypothesis , but not yet
supportive of it owing to the deficiency in analytical method . Other
analytical methods will have to be used to determine the precise source of
increased acidity of intercepted rain .
Although results are preliminary , they suggest two important
possibilities : (1) Sulphur dioxide emissions did acidify intercepted rain
more than open rainfall . Stemflow was the most acid . The impact of the
very acid stemflow on soil acidity , however , would likely be limited to an
extremely small area at the base of the tree (Bollen et al . 1968) . (2)
This increased acidity of intercepted rain may help to explain the fate of
some of the sulphur dioxide . Emissions in forests may be adsorbed and
later washed off in intercepted rain .

- 101 -
REFERENCES
Bollen, W. B . , C . S . Chen, K . C . Lu, and R . F . Tarrant . 1968 . Effect of
stemflow precipitation on chemical and microbiological soil
properties beneath a single alder tree . In : Biology of Alder .
Proceedings of Northwest Scientific Association Annual Meeting ,
April 14-15 , 1967 . Pp . 149-156 .
Dean, G .A . 1966 . A simple colorimetric finish for the Johnson-Nishita
microdistillation of sulphur . Analyst . 91 : 530-532 .
Likens , G .E . 197 2 . Acid rain . Environment 14 : 33-40 .
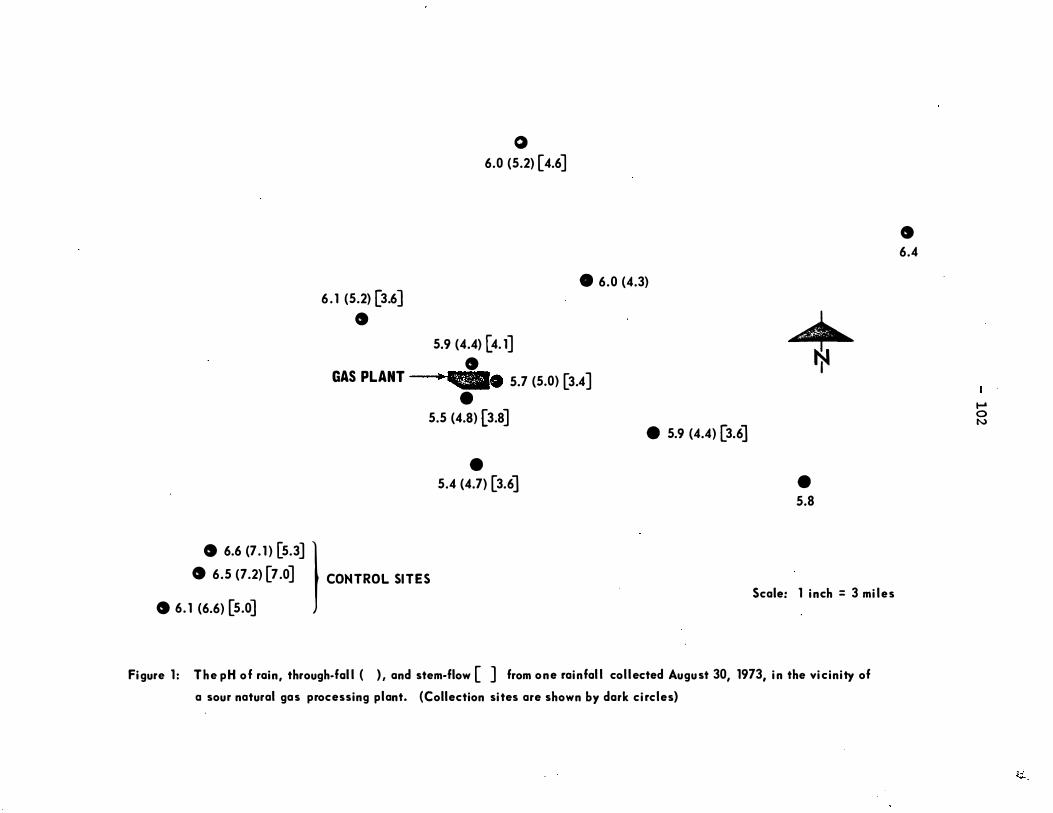
o 6.0 (5.2) [4.6]
. 6.0 (4.3) 6 . 1 (5.2) [3.6]
• 5.9 (4.4) [4. 1]
• GAS PLANT • QA. 5.7 (5.0) [3.4] •
5.5 (4.8) [3.8]
• 5.4 (4.7) [3.6]
• 5.9 (4.4) [3.6]
• 6.5 (7.2) [7.0] CONTROL SI T E S
• 6.6 (7. 1 ) [5.3]
J • 6. 1 (6.6) [5.0]
+-I
• 5.8
Scale: 1 i nch = 3 mi l e s
Fi gure 1 : T h e p H o f rain, through-fal l ( ) , and stem-flow [ ] from o n e rai nfal l col l ected Augu st 30, 1973, i n the vi cin ity of
a sour natural ga s processing plant. (Collection si tes are shown by dark ci rcles)
• 6.4
.... o N
�"

Bio logical Impacts of
Sulphur Gases

- 103 -Introductory Editorial :
SOME TERMS FOR SYMPTOMS ON PLANTS EXPOSED TO SULPHUR GASES
D. Hocking
The biological impacts of sulfur gases are very diverse . Thi s
workshop deals only with impacts on vegetation.
In the biological literature , exposure to an air pollutant is
universally referred to as a fumigation. This is often qualified by a
descriptive adj ective : experimental, acute, injurious, intermittent,
ahronia, mild. Fumigation is also sometimes used as an adj ective with
episode, incident or aaaident.
The Glossary of Meteorology (Huschke 1959) does not define the
term fumigation . In 1968 , however , a specialized listing of terms used
in air pollution meteorology ( Schafer et al . 1968) defined fumigation as
an inversion breakup that returns trapped pollutants to ground level .
But the same listing also recognized a general meaning as any experi
mental exposure to an air pollutant , so the meteorological sense is not
exclusive . Therefore , based on thirty years prior use in the biological
literature , fumigation can continue as the generic term for any exposure
to an air pollutant , recognizing that in certain contexts it defines a
particular type of exposure.
Impacts of air pollution on vegetation cover a wide range for
which the terminology is much less clear .
Symptoms on foliage might be described in qualitat ive (e . g .
colour , shape) and quantitative (e . g . duration , severity) terms . Adequate
description depends on both but it is hard to generalize about the quali-
tati ve aspects , which depend so much upon species . The two key quanti- /
tative dimensions are duration and severity .

- 104 -
Almost all authors use ahronia and aaute to describe markings�
injuries� damage� or symptoms . Both terms connote rate o f onset, ' dura-
tion and severity in their standard definitions and in the implied mean-
ings o f most authors ( for a sampling, see Katz 1949 , Brandt & Heck 1968 ,
Barrett & Benedict 1970, Tamm & Aronsson 1972) .
Because of the many connotations of the terms , authors seldom
define them adequately and never without some ambiguity , overlap or con-
flict . A compilation of the uses will illustrate this .
aaute symptoms : necrosis ; leaf cells are ki ZZed� generally in distinctive patterns with sharp edges . Usually characteristic of a sudden exposure 'to a high concentration for a short period : an aaute fUmigation . Standard dictionaries define aaute : coming sharply to a climax, serious , urgent , characterized by sharpness or severity .
ahronia symptoms : chlorosis , sometimes called chlorotic symptoms ; leaf cells are not killed , only the chlorophyll is affected--a gradual bleaching of the leaves , often resembling normal aging. Usually characteristic of prolonged or intermittent exposure to low concentrations : ahronia fumigation . S tandard dictionaries define ahronia : marked by frequent recurrence and/or long duration and often by slowly progressing seriousness .
S o the difficulty with these terms i s that they overlap and
conflict . Acute symptoms are also chronic : they persist unless enough
of the leaf is killed to cause it to fall off . And chronic symptoms may
be transient : chlorophyll aan be regenerated . Furthermore chronic and
acute symptoms may be found on the same plant , even on the same leaf ;
leaves of different ages respond differently to the same fumigation condi-
tions .
Al though the generaZ sense of acute and chronic , is reasonably
common , obj ective use of them mus t include rigorous qualification .
In summary , foliage responses to sulfur gas fumigations are
much too complex to be adequately described with two rather vague and
general terms . Use of specific terms with well-defined meanings such as

- 105 -
nearosis and ahZorosis� with suitable modifiers such as mi �� sevePe�
- transient and per.manent� is much to be preferred.
References
Barrett , T .W. and H. M. Benedict . 1970. Sulfur dioxide . In : Jacobson and
Hill (Eds . ) . Recognition of air pollution inj ury to vegetation :
A pictorial atlas .
pp . Cl-17 .
Brandt , C . S . and W.W. Heck.
In : Stern (Ed . ) .
& London .
Air Pollution Control Assoc . , Pittsburgh.
1968 . Effects o f air pollution on vegetation.
Air Pollution Vol . 1 : 401-443. Academic , N .Y.
Huschke, R. E . (Ed. ) 1959 . Glossary of }�teorology . Amer . Met . Soc . ,
Boston.
Katz , M. 1949 . Sulfur dioxide in the atmosphere and its relation to
plants and soils . Ind . Eng . Chem. 4 1 : 2450-2465 .
Schafer , V. et al . 1968 . Glossary of frequently used terms in air
pollution . Amer . Met . Soc . , Boston.
Tamm, c . o. and A . Aronsson. 1972 . Plant growth as affected by sulphur
compounds in polluted atmosphere . A literature survey. Res .
Note No . 12 ; Royal College of Forestry , Stockholm.

. '
- 106 -
* S ULPHUR D I OX I DE AND FOREST VEGETAT I ON
by
A . A . Loman
ERA Sciences Limited , Calgary
I n A l be rta , s u l ph u r d i ox i de symptoms have been obse rved to appea r and
d i sappea r on fore s t vegetat i on i n the v i c i n i ty of sou r gas p l ants . The
range of symptoms obse rved on con i fe rous and dec i duous fo l i age cannot be
adequate l y des c r i bed i n te rms of the two ex i s t i ng catego r i es , "ch ron i c"
and "acute" symptoms , wh i ch a re p resen ted i n the ed i tor i a l of these P ro
ceed i ngs . A. th i rd category of symptoms , wh i ch i s mos t f requen t l y obse rved
i n A l be rta , i s there fo re used by s c i en t i s ts of ERA Sc i ences ltd .
Fo l i a r s u l ph u r d i ox i de symptoms a re tempora ry symptoms on the g reen
p l an t : the fo l i age i tse l f abs c i s ses at the end of the g row i n g season i n
dec i d uous spec i es , and a t the end of th ree to seven yea rs i n con i fe rous
s pec i es . Howeve r , one f requen t l y obse rved g roup of symptoms i n A l be rta
i s t rans i en t on the f0 1 i age i tse 1 f . Fo l i a r symptoms of th i s category
w i l l appea r and d i sappea r wi th i n weeks fo l l ow i n g s u l ph u r d i ox i de ep i
sodes d u r i ng the g rowi n g season . These symptoms may be def i ned as fo l
l ows :
1 . T rans i en t symptoms a re t rans i tory on the fo l i age du r i ng t he g row i n g
season . O n dec i duous spec i es t rans i en t symp toms a re cha racte r i ze d
b y a l i gh t i nte rcos ta l ch l oros i s o f the l eaves . On con i fe rs , t ran
s i ent symptoms a re cha racte r i zed by a l i gh t ch l oros i s on the d i s ta l
port i ons of one -yea r-o l d and o l de r need l es . No l eaf ce l l s a re
permanen t l y des t royed i n th i s ca tego ry . C u r rent yea r ' s need l es a re
hea l thy .
*Submi tted to ALBERTA SULPHUR GAS RESEARCH WORKSHOP , Edmonton , Nov . 2 , 1973 . Not to be quoted without wri t ten permi ssion of the, au thor .

, - 107 -
T rans i en t s u l ph u r d i oxi de symptoms a re common i n A l be rta , They
cann ot be found f rom one obse rvat i on pe r i od to the next on the
same t rees . No reduct i on s i n g rowth ra te have been detected i n
t rees w i th t rans ient symptoms .
I n con t ra s t to t rans i en t fo l i a r symptoms wh i ch d i sappe a r w i th i n
weeks d u r i n g the g rowi n g season , ch ron i c symp toms a re s l i gh t l y
more severe , and pe rs i s t un t i l the fo l i a ge absc i sses . C h ron i c
symptoms may be de f i ned as fo l l ows :
2 . Ch ron i c symptoms rema i n on the fo l i age for the d u ra t i on of i ts
func t i ona 1 l i fe . On dec i duous s pe c i es , ch ron i c symptoms a re
cha racte r i zed by seve re i n te rcos t a l ch l oros i s , and f requen t l y by
nec rot i c l eaf ma rg i ns . On con i fe rs , ch ron i c symptoms a re charac
te r i zed by seve re ch l oros i s on the d i s ta l port i ons of one-yea r-o l d
and o l de r need les , f requen t l y w i th nec rot i c t i s s ues a t the t i ps .
Cu r rent yea r ' s need l es a re hea l thy i n th i s ca tegory .
The most seve re category of symptoms fou n d i n A l be rta i s exc l u
s i ve l y as soc i ated w i t h i ndus t r i a l acc i dents , and i s the refo re
foun d i n t he i mmed i a te v i c i n i ty of a s u l ph u r d i ox i de sou rce . The
fol i a r symptoms i n t h i s category a re ca l l ed "acu te" symp toms .
3 . Acu te symptoms a re cha racte r i zed by seve re nec ros i s or k i l l i ng
of fol i a r t i ss ues of con i fe rs and dec i duous t rees . L i t t l e o r no
ch l o rot i c symp toms deve l op . On mos t dec i duous s pec i es encounte red
i n A l be rta , acu te symptoms a re q u i ck l y fo l l owed by absc i s s i on of
the k i l l ed l eaves , and by f l ush i ng of a second c rop of fo l i age .
On con i fe rs , acute symptoms a re found on a l l need l es , i nc l ud i ng
cu r rent yea r ' s need l es . Th i s i s i mpo rtan t , as i t d i s t i n g u i shes
t he acute category f rom the two l i gh t e r ca tegor i es of symptoms ,
i n wh i ch c u r rent yea r ' s need l es rema i n hea l thy .

- 108 -
To d a te , no s u l ph u r d i ox i de ep i sodes have been seve re enough to k i l l
the b ud s of fore s t t rees i n A l be r ta .
Cont i nuous mon i t o r i n g of amb i ent a i r i n the v i c i n i ty of gas p l ants h a s
shown t h a t s u l ph u r d i ox i de "ep i sode s " f req uent l y cons i s t o f "pu l ses"
of h i gh s u l ph u r d i ox i de concent rat i ons l.as t i ng a few second s , i nte r"
s pe rsed w i th short s u l p h u r d i ox i de free pe r i ods . Pe r i ods of s teady
l e ve l s of e l evated concen t ra t i ons of th i s gas i n the a t mos phe re appea r
to be l e s s common t han p rev i ous l y be l i eved . G reenhouse and g rowt h
ch ambe r s t ud i es , howeve r , emp l oy s teady l eve l s of fum i ga t i on on l y . I t
i s not known how soon s ymp toms appea r on fore s t vege ta t i on a f t e r a s u l -
ph u r d i ox i de ep i sode . I t has t h e re fore not been poss i b l e to re l a te
s u l ph u r d i ox i de concent rat i ons and d u ra t i on of e p i sode to the t h ree
obse rved catego r i es of symptoms .
Me rchantab l e fo res t s pec i e s i n A l be rt a may be ranked i n o rde r of de
c reas i ng s u s cept i b i l i t y to s u l ph u r d i ox i de (Tab l e 1 ) . S i nce to l e rance
l eve l s of vege ta t i on to s u l ph u r d i ox i de a re known to f l uct uate wi t h
d i f fe r i ng env i ronment a l cond i t i ons , except i ons t o th i s rank i ng w i l l
occu r .
The deve l opment of v i s i b l e s ymptoms on the fo l i age of fo res t s pec i es
i s a s h o r t te rm e ffec t of s u l ph u r d i ox i de ep i s odes , a t concent rat i ons
i n exce s s of the capac i ty of the g reen p l ant to a s s i m i l a te t h i s gas .
The i mpact of short te rm e ffect s on fores t assoc i a t i ons i s a funct i on
of the f req uency of occur rence of s u l ph u r d i ox i de ep i sodes on the same
p l ants du r i ng one g row i ng season .
long te rm , cumu l at i ve effects o f s u l ph u r d u s t fa l l o r s u l phu r d i ox i de
was hout on vege t a t i on mus t be assessed by regu l a r l y mon i to r i ng the
buf fe r i ng capac i ty of fo re s t s o i l s . Fore s t s o i l s have cons i de rab l e
a b i l i ty to absorb and t rans form i ndus t r i a l eff l uents i nto ha rm l e s s

- 109 -
compounds p rov i d i ng t hey a re not ove rtaxed . A regu l a r so i l mon i to r i n g
sys tem wh i ch i ncorpora tes mea s u rements o f pH , � cond uc t i v i ty a n d t ot a l
s u l ph u r con tent i s req u i red i n conj unct i on w i th g rowth rate ana l yses ,
assessmen ts of v i gor of i nd i v i dua l s pec i es , �nd changes i n fores t
assoc i a t i ons , i n orde r to assess · l on g term s u l ph u r and s u l ph u r d i ox i de
effects on the fores ts of A l be rta .

- 110 -
TABLE I
FOREST VEGETAT I ON I N ALBERTA I N ORDER OF DECREAS I NG SUSCEPT I B I L I TY ·
TO SULPHUR D I OX I DE E P I SODES
MERCHANTABL E SPEC I ES
CON I FERS DEC I DUOUS
1 . Ab i es l as i oca rpa
2 . Ab i es ba l samea
3 . P i n us banks i ana
4 . P i nus con torta
1 . Bet u l a papy r i fe ra
2 . Popu l us ba l sam i fe ra
3. Popu l us t remu l o i des
5. P i cea ma r i ana
6. P i cea g l auca
7. Lar i x l a r i c i na
DEC I DUOUS
1 . A l nus s pp . 2 • S a 1 i x s pp •

- 111 -
SULFUR GAS IMPACT SURVEYS AND RESEARCH AT THE NORTHERN FOREST RESEARCH CENTRE
R. A . Blauel and D . Hocking
The Canadian Forestry Service has an active program of surveys
and research on the effects of sulfur gases (and other pollutants) on
the forest . The obj ectives are to gather basic and applied data on
forest responses to pollutants , to evaluate these responses in terms of
environmental quality , and to provide consulting and other services to
resource management agencies .
These obj ectives are pursued by several means . Discussions
and. meetings such as this workshop stimulate general interest . In
response to specific �equests from various agencies , the impact of
pollution incidents can be assessed through preliminary surveys and
field examination.
Governmental management agencies and lndustry contribute
technical and logistical support to surveys .
Field examinations may follow surveys that are interesting
or that reveal problems of diagnosis or impact assessment . These are
usually cooperative and sometimes involve universities and consulting
firms as well as the agencies initially concerned .
General examples of pollution incidents involving sulfur
gases whic� require surveys are: sulfur fires , oil and gas well blowouts ,
battery site releases , valve and line leak6 � £�r�icing releases and
sulfur stock�iling incidents . Data collected include site details ,

- 112 -
meteorology, photographic documentation, and vegetative and soil
samples . Analysis involves describing symptoms , rating species
sensitivity, evaluating injury and damage , and estimating predis-
positions , morbidity and mortality.
Also , the Canadian Forestry Service awards Research and
Development Contracts to further the program obj ectives . These may
specify problems in applied knowledge or may require the generation
of new knowledge.
The impact of sour gas emissions on forest vegetation is
studied in an area S .W. of Rocky Mountain House around the Gulf
Strachan and Aquitaine Ram River gas processing plants . Cooperators
include :
1 . Federal government agencies :
2 .
3 .
4 .
Canadian Forestry Service Atmospheric Environm�nt Service Environment Protection Service
Provincial government agencies :
Department of the Environment Department of Lands and Forests
Industrial consulting firms :
Gulf Aquitaine Core Laboratories
Uni .... ersities (also contractors) :
Calgary (departments of chemical engineering , physics , and environmental sciences) .
Al-;;'erta (d�par'::ments of botany and soil science) .

- 113 -
Elements of the study include :
1 . studying plume delineation and dispersal ;
2 . location of impingement areas ;
3 . observation of visual symptoms on trees , shrubs and lower vegetation;
4 . measurements of chemical changes in precipitation, throughfa11 and
stemf10w;
5 . studying alterations to soil chemistry;
6 . conducting a preliminary sulfur budget study; .
7 . development and testing o f a bio-monitoring system using lichens
and bryophytes .
Vegetative response is also being studied in the Athabasca
Tar Sands , at the request of the Alberta Department of Environment , the
Alberta Forest Service and Great Canadian Oil Sands . This study includes
aerial surveys with ground truthin& and perm�nent observation plots near
continuous S02 monitors .
Remote sensing techniques have been used more extensively in
surveys of impacts on forests by emissions from the smelters at Thompson
and F1in F10n in Manitoba. Mis s ions were flown by the Canadian Centre
for Remote Sensing , using high and low level , multi-spectral imagery.
Ground truthing was conducted in smoke impingement areas . Particularly
useful for delineating severe damage was false color infra-red film with
the Wratten 12 filter package . Oblique angle photography was important
in detection of partial defoliation since tree top foliage tends to
remain longest , concealing bare branches below.

- 114 -
The situation around the smelters is complicated owing to
the mixture of toxic agents in emissions . As well as S02 ' several
heavy metals (especially nickel) also affect vegetation.
Our program of research includes �ontrolled experimentation
in the laboratory and greenhouse. Symptoms are to be diagnosed under
a variety of environmental and pollutant exposure conditions . Threshold
injury levels (under different conditions and for different receptors)
and the mechanisms of injury will be examined . Cooperative work will
continue to play an important part .

- 115 -
DESIGN OF A GAS-EXCHANGE SYSTEM FOR THE STUDY OF THE EFFECTS
OF SULPHUR DIOXIDE ON VEGETATION.
by
Allan H. Legge
Environmental Sciences Centre , The University of Calgary
A gas-exchange system has been developed for the intimate
analysis of the effects of sulphur dioxide on vegetation in the White-
court area of the sour-g�s corridor in the province of Alberta. This
work is sponsored by the Whitecourt Environmental Study Group , the
Provincial Department of the Environment and ERA Sciences Ltd . of
Calgary. Research is undenqay on one-year-old seedlings of white
spruce , Piaea g�uaa (Moench) , Voss , and lodgepole pine, Pinus aontorta
Louden . The main obj ective is to determine quantitatively the effects
of varying concentrations of S02
under differing environmental conditions .
We are attempting to correlate basic plant physiology and the onset of
visible plant symptom development with air quality .
Primary production in green plants is determined by the
photosynthetic assimilation of CO2 • The rate at which CO2 is taken
up by the plant is determined by physiological factors which are closely
bound to environmental conditions . The gas-exchange system was designed
to continuously record processes of photosynthesis , respiration and

- 116 -
transpiration of intact plants within a wide range of controlled
environmental conditions . The purpose was to provide experimental
conditions similar to those found in the field . A Beckman IR315A
non-dispersive infrared gas analyzer is utilized for the measurement
of CO2 • Lithium chloride hygrometers are used to measure water vapor
concentration.
The heart of the system is double-linked growth chambers
(Fig . 1 ) . Environment 1 is the Sirigor Gas-Exchange Chamber developed
as the result of collaboration between the Botanical Institute of the
Forestry Research Institute , Munich, and the Siemens Research Center
in Er1angen, West Germany. This internal chamber controls such factors
in the above-found or "stem environment" as air temperature , relative
humidity (dewpoint) and wind velocity. The plant root environment is
controlled in the outer chamber . Controlling root temperature avoids
the production of isothermal conditions common to most growth chamber
experiments and introduces a thermal gradient between the root system
and shoot apex similar to that in the field . This growth chamber is a
modified M-13 manufactured by Environmental Growth Chambers , Chagrin
Falls , Ohio . Its high intensity light package produces near daylight
conditions of 1250 microeinsteins/m2/sec. for the internal Sirigor
chamber (10 , 000 ft . candles) .
External air is drawn in through a series of mixing vessels
to dampen out local ambient fluctuations of CO2 concentrations which
may vary from 315-340 vpm (volume per million) . An electromagnetic pump
(PI) (Reciprotor, Edward , Copenhagen) is used to maintain a constant
flow rate of air entering the system. Continuous air flow adjustment is

- 117 -
possible by changing the voltage with a rheostat . Fine adjustment in
the flow rate is made with a precision needle valve . After P1 the air
stream is split with part of the stream passing through a two-stage
humidifier with the flow rate adjustable by a needle valve . The by-passed
air recombines with the humidified air in a mixing vessel (MV2) at which
point the relative humidity is determined (HS1
) . By carefully adjusting
flow rates at this initial split in the air stream, relative humidities
between 10% and 100% are readily obtainable . Since the air source is
external , the humidification loop is primarily used under winter condi
tions of very low outside relative humidity . Just after MV2 the input
air stream is split again to allow for the introduction of specific
concentrations of S02 into the system: S02 is generated by means of a
Dynaca1 gas permeation tube (�etronics Associates Inc . , Palo Alto ,
California) . The permeation characteristics are such that by varying
the temperature of the permeation tube and the flow rate of air past it ,
S02 concentrations may be varied and accurately controlled . By adjusting
the input valve in front of the flow meter (FM2) and the temperature of
the water bath surrounding the permeation tube the desired concentration
of S02 is achieved when the non-S02 stream recombines in mixing vessel
3 in a predetermined dilution ratio . At this point the air stream is
equally split into a sample stream (solid line) and a reference stream
(dotted line) . The sample stream, after passing through the input
humidity sensor (HS2) , goes directly into the Sirigor Gas-Exchange Chamber .
The air temperature inside the measuring chamber can be adjusted
by means of a temperature controller in three different ways :
1 . Set-valve control. The temperature is kept constant

- 118 -
irrespective of the external chamber temperature .
2 . Follow up control . The internal chamber is kept the
same as external temperature.
3. Program control . Chamber temperature varies according
to a preset program.
In the double chamber configuration , set-valve control of
temperature is utilized . The other methods are noted only to illus
trate the flexibility of the system.
Since a plant gives off water-vapor via the process of trans
piration, the by-pass loop through the water vapor trap is utilized to
prevent condensation in the chamber . (Condensation is a sink for both
CO2 and S02 and must be avoided . ) The internal chamber humidity is deter
mined by the output humidity sensor (HS4) . Humidity control is achieved
by the adjustment of the dew point of the water vapor trap via a differen
tial electrical signal from the output humidity sensor as it is increased
by transpiration relative to the input humidity sensor . The transpired
water in the circulating by-pass is condensed out , thus equalizing the
humidity difference .
A quantum sensor (Lambda Instruments Co . Inc . , Lincoln , Nebraska)
is utilized to measure the photosynthetically active radiation (PAR)
incident upon the plant in the gas-exchange chamber . This sensor measures
the light spectrum for photosynthesis in the 400-700 nm waveband .
Air � s pulled from the gas-exchange chamber at a constant flow
rate by a rheostat controlled pump (P3) . The mass flow of gas from the
chamber to the infrared gas analyzer (IRGA) is measured by a Matheson
Linear Mass Flowmeter Model 8116-0214 (Matheson Gas Products , East

- 119 -
Rutherford , New Jersey) . This measures the true mass flow without
necessity of corrections or compensations for the temperature and
pressure of the gas . After both the reference and sample streams are
dried by passing through CaS04 (anhydrous) to prevent the interference
of water vapor , they pass through the IRGA. This differential measure
ment between the CO2 content of the two streams is referred to as open
system analysis . Net-photosynthetic CO2 assimilation can now be directly
ca1cua1ted from the mass flow record .
The S02 sampling points are indicated as Sl
through S6 .
Sl
- background ambient air
S2
- mixed input before entry into gas-exchange chamber
S3
- concentration in gas-exchange chamber
S4
- loss in water vapor trap
S5 - output from gas-exchange chamber
S6 - loss to CaS04 (anhydrous) after air is dried and
input to IRGA
All these points are ut ilized to determine the fate of and
concentration of S02 in the overall gas-exchange system.
NOTE : Tef10n* , rather Tygon, tubing must be used to prevent loss of
S02 by diffusion and absorption.
Continued testing with this gas-exchange system will help
provide the data needed by the Government of Alberta in the establish
ment of more meaningful ambient air quality standards .
*Trade marks reg .

- 120 -
THE USE OF LICHENS AS BIO-INDICATORS OF SULPHUR DIOXIDE
by James W. Case Department of Biology University of Calgary
Calgary , Alberta

EXTERNAL AMBIENT AIR INTAKE
(HEIGHT = 6 METERS)
MV1 _ 3 =
S.,
Mixing Vessel
S02 ANALYZER
S2 S3 S4 S5 S6
� GENERATOR
X = Valve
P1-3 Pump HS., _3 = Humidity Sensor
R.,_ 3 = Rheostat S.,_6
• S02 Sompllng PoInt
FM.,_6 = F low Meter
-- -- = Reference Gas Stream
----. = Sample Gas Stream
I I I I I I I
52 I L.-..;.;=..J t !
WATER VAPOUR
TRAP
Figure 1 : Block diagram o f gas-exchange
system for monitoring and/or
controlling the following
parameters : sulfur dioxide
and carbon dioxide concentra-
tions , leaf temperature , air
and soil temperature, light
quality, relative humidity,
wind velocity and plant trans-
piration. All parameters are
recorded , but for the iDke of
clarity only three are indi-
cated : carbon dioxide and
sulfur dioxide concentration
and mass flow of air through
the sample gas stream.

- 121 -
Lichens are unique in being composed of an algae and a fungus
living in a symbiotic relationship . They are very slow-growing, primi
tive plants but despite this are found in all countries and habitats of
the world. Alberta alone has over 500 species occurring in habitats
ranging from badlands and short grass prairie to the boreal forest and
the bare rock of the Canadian Shield . They are found on a variety of
substrates including treas , rotting wood , soil , and rock. Many organ
isms depend on lichens for food and protective micro-habitats . Recent
work reveals the importance of some lichens as nitrogen f ixers in forest
communities (Denison, 1973) .
It was early recognized that lichens were damaged or destroyed
by air pollution and could be used as a reliable indicator of the degree
of air pollution (Grindon, 1859 ; Nylander, 1866) . At that time , smoke
and particulate matter were considered to be the damaging agents of air
pollution, but that has not been confirmed . Temperature and humidity
changes have been considered important in cities but cannot be used to
explain field observations where no such discrepancies exist (LeBlanc
and Rao , 1973) . Now, all available evidence from laboratory and field
studies demonstrates that sulphur dioxide is the principal factor af
fecting lichens over large areas .
Lichens are , in general , more sensitive to sulphur dioxide than
are higher plants (Hawksworth, 1971) . They absorb air very efficiently
over their entire surface (Gilbert , 1969 ; Smith, 1962) . Also , since li
chens are perennial and evergreen plants they continue to absorb sulphur
dioxide whenever they are metabolically active , even in the winter .

- 122 -
Vascular plants , on the other hand, have protective cuticles and closable
stomatal pores which restrict absorption of sulphur dioxide from the air,
especially during the night . Further , the higher plants obtain their
water mostly from the soil , whereas bark-dwelling lichens absorb water
from the surface of the substrate before the pollutant can be removed .
If a vascular plant is fumigated with a high level of sulphur dioxide, it
suffers acute damage, but can replace the damaged leaves as early as the
next spring . Because of the lichen' s slow rate of growth , damage to the
photosynthetic apparatus is chronic and may take up to two years to re
pair , and then only if no further fumigations occur .
Sulphur dioxide present on a long term basis gradually reduces
the pH of soils and other substrata on which lichens grow. Reduced pH
and high concentration of sulphur dioxide , built up by the lichen , will
lead to the oxidation of the chlorophyll of the algal component , espec
ially chlorophyll ' a ' (Puckett , et al . , 1973) .
Depending on humidity and temperature, lichens generally suffer
more damage as the long term average sulphur dioxide concentration in
creases above 0 . 01 ppm, and they almost never grow in an area where aver
age concentration is greater than 0 . 2 1 ppm.
In recent years , the correlation between air pollution and
lichen distribution has been substantiated . Over two hundred and twenty
five papers dealing with lichen vegetation of areas affected by air pol
lution have been published . Some of the better known studies have been
produced in continental Europe by Skye (1965 , 1968) , De Sloover (1969) ,
De Sloover and LeBlanc (1968 , 1970) ; in Britain by Coker (1967) , Gilbert

- 123 -
(1969 , 1970) , Hawksworth and Rose (1970) ; and in North America by Brodo
(1961 . 1966) , Dreisinger and McGovern (1970) , LeBlanc (1971 ) , LeBlanc
and De Sloover (1970) , LeBlanc, Rao and Comeau (1972) and Rao and LeBlanc
(1967 , 1973) . Many techniques have been employed to correlate the dis
tribution of lichens around air pollution sources with mean levels of air
pollutants and , in some cases , to utilize th�ir. behaviour as a means of
monitoring the distribution and severity of �t� pollutant emissions (James ,
1973) . Three of the most popular techniques used in mapping are Zone map
ping , lAP (Index of Atmospheric Purity) mapping and Transplants .
Zone maps are constructed on the basis o f the distribution and
frequency of individual indicator species . The four zones most frequently
distinguished are : (1) an inner ' lichen desert ' with few or no lichens
present ; (2) an ' inner struggle zone ' ; (3) an ' outer struggle zone ' that
is approaching normality ; and (4) a ' normal unaffected zone ' . Satisfactory
Zone maps depend on the presence of recognized species which are sensitive
to different levels of air pollution, and require a good knowledge of their
ecology.
The lAP Mapping techniques (De Sloover , 1964) lead to numerical
assessments of the degree of air pollution at sample sites and can pro
vide a quick, efficient , and economical method for preparing a pollution
map of the area . This map , with some consideretion of meteorology and
topography , would present a relative picture of the pollution concentra
tion, of the intensity of damage caused , and of the total area affected
by the pollutant (LeBlanc , Rao and Comeau, 1972) .
The IAP is defined by the recently modified formula (LeBlanc and
De Sloover , 1970) :

n lAP = L (Qxf) /10
i
- 124 -
where
n is the number of species at each site
f is the frequency-coverage index of each species at each site
Q is the average number of epiphytic lichens concurrently present
with that species at all sites .
The numerical lAP values produced for each s ite are plotted on a
base map , and zones based on ranges of lAP values are constructed. The lAP
method is as , or in some case more , reliable than other methods .
Transplant studies are a recent development . Generally , lichen-
bearing discs of bark are cut from one tree or a group of trees and are
then secured in holes of the s�e diameter cut in the bark of similar trees
in an affected area and of control trees in an unaffected site . If there
are no trees , the lichen-bearing discs can be attached to posts instead
(Schoenbeck, 1969) . This technique has clearly demonstrated that individ-
ual species differ in their tolerance to sulphur dioxide (LeBlanc and Rao ,
1966) as predicted by Q factors of the lAP technique.
Although transplant experiments can be used in making practical
assessments of air pollution levels over large areas , they are usually too
time-consuming since visible damage or death of the lichen in less polluted
areas may take one to two years (Brodo , 1966 ; LeBlanc and Rao , 1966 ; Ha�ks-
worth, 1969) .
During the public hearings on the environmental impact of sulphur
extraction gas plants in Alberta , representatives of industry pointed out
that ground monitoring is sometimes unsatisfactory because of factors such
as unusual meteorological conditions . An lAP map would show the total area

- 125 -
affected , would present a relative picture of the pollution concentrations ,
and would show the long term effect of the sulphur dioxide emissions on the
epiphytic lichens . This map could then be used in settling disputes as to
the effects that sulphur dioxide from the sulphur extraction gas plant has
on various cQmponents o� the surrounding countryside . Zone mapping , however ,
has limited application in Alberta because the ecology of most lichen com
munities has not been adequately studied . Transplant studies are more time
consuming than the IAP mapping method , although they are useful as a back-up
to IAP mapping .

- 126 -
BIBLIOGRAPHY
Air pollution. 1961 . World Health Organization , Monograph series no . 4 6 .
Brandt , C . S . and W .W. Heck. 1968 . Effect of air pollutants on vegetation.
IN. Air Pollution. 2d ed . Edited by A.C . Stern. Acad . Press ,
New York.
Brodo , Irwin Murray. 1961. A study of lichen ecology in Central Long
Island , New York. American Midland Naturalist 65 (2 ) : 290-310.
Brodo , Irwin M. 1966 . Lichen growth and cities : a study on Long Island,
New 1ork. Bryologist 49 : 427-449 .
Coker , P . D . 1967 . The effects of sulphur dioxide pollution on bark epiphytes .
Trans . Brit . Bryol . Soc . 5 : 341-347 .
Denison, W . C . 1973 . Life in t�ll trees . Sci. Amer . 228 (6) : 74-80 .
De Sloover, J . 1969 . Pollutions atmospheriques e t tolerance specifique chez
les lichens . Bull . Soc . Bot . Fr . Mem. 1968 : 205-21 7 .
De Sloover , J . and LeBlanc , F . 1968 . Mapping o f atmospheric pollution on
the basis of lichen sensitivity , IN, Misra, R. and Gopal , B. (eds . )
Proc . Symp . Recent Adv. Trop . Ecology , 42-56 . Varanasi : The
International Society for Tropical Ecology.
De Sloover , J . and LeBlanc , F . 1970. Pollutions atmospheriques et fertilite
chez les mausses et chez les lichens epiphytiques . Bull . Acad.
Soc . lorr. Sci. 9 : 82-90.
European Congress on the Influence of Air Pollution on Plants and Animals ,
1st , Wageningen , 1968 . Air pollution , proceedings . I
Gilbert , O .L . 1969 . The effect of S02 on lichens a�d bryophytes around
Newcastle upon Tyne . IN, Air Pollution, Proceedings of the First

- 127 -
European Congress on the influence of air pollution on plants
and animals , Wageningen 1968 : 223-35 . Wageningen : Centre for
Agricultural Publishing and Documentation .
Gilbert , O . L. 1970. Further studies on the effect of sulphur dioxide on
lichens and bryophytes . New Phytol. 69 : 605-27 .
Grindon, L . H. 1859 . The Manchester Flora . London: White.
Hawksworth , D . L . B .W . Fe�ry , and M. S . Baddeley. 1973 . Air Pollution and
Lichens . University of Toronto Pres s .
Hawksworth, D . L . 1969 . The lichen flora o f Derbyshire . Lichenologist 4 :
105-93 .
Hawksworth, D . L . 1971 . Lichens a s litmus for air pollution : A historical
review. Int . J . Environ. S tudies 1 : 281-96 .
Hawksworth , D .L . and Rose, F . 1970. Qualitative scale for estimating
sulphur dioxide air pollution in England and Wales using epi
phytic lichens . Nature , Lond . 227 : 145-8 .
James , P .W. 1973 . Introduction. IN, Air Pollution and Lichens . Edited
by B .W. Ferry , M. S . Baddeley, and D .L . Hawksworth. University
of Toronto Press .
LeBlanc , Fabius . 1971 . Possibilities and methods for mapping air pollution
on the basis of lichen sensitivity. Mitteilungen der Forstlichen
Bundesversuchsanstalt Wien 92 : 103-126 .
LeBlanc , Fabius and Jacques De Sloover . 1970. Relation between industrial
ization and the distribution and growth of epiphytic lichens and
mosses in Montreal . Can. J . Bot . 48 : 1485-1496.
LeBlanc , Fabius acd D .N . Rao . 1966 . Reaction de quelques lichens et mousses

- 128 -
epiphytiques a l 'Anhydride sulfureux dans la region de Sudbury,
Ontario . Bryologist 69 : 338-347 .
LeBlanc , F. & D.N. Rao . 1973 . Evaluation o f the pollution and drought
hypotheses in relation to lichens and bryophytes in urban environ-
ments . Bryologist 76 : 1-19 .
LeBlanc, Fabius , D .N . Rao , & Gilberte Comeau. 1972 . The epiphytic vegeta-/
tion of Populus balsamifera and its significance as an air pollu-
tion indicator in Sudbury, Ontario. Can . J . Bot . 50 : 519-528 .
Linzon, S . N . 1971. Economic effects of sulphur dioxide on forest growth.
J . Air . Poll . Cont . Assoc . 21 (2) : 81-8 6 .
Nylander , W . 1866 . Les lichens du Jardin du Luxembourg. Bull . Soc . bot . Fr .
13 : 364-72 .
Puckett , K .J . , E . Nieboer , W .P . Flora , & D .H. S . Richardson. 1973 . Sulphur
dioxide : its effect on photosynthetic fixation in lichens & sug-
gested mechanisms of phototoxicity. New Phytol . 72 , no . 1 , 141-154 .
Rao , D .N . , & Fabius LeBlanc . 1967 . Influence of an iron-sintering plant on
corticolous epiphytes in Wawa , Ontario . Bryologist 70 (2) , Summer.
Schonbeck, H. 1969 . Eine methode zur Erfassung der biologischen Wirkung von
Luftverunreinigungen durch transplantierte Flechten. S taub 2 9 :
14-18 .
Skye, E . 1965 . Botanical indicators of air pollution . Acta phytogeogr . suec.
50 : 285-7 .
Skye , E . 1968 . Lichens and air pollution. Acta phytogeogr. suec . 52 : 1-123 .
Smith, D . C . 1962 . The biology of lichen thalli . BioI. Rev. 37: 537.
Thomas , M.D. 1961 . Effect of air pollution on plants . IN , Air Pollution .
World Health Organization, Geneva.

- 129 -
A PRELIMINARY STUDY OF THE EFFECTS OF AIR POLLUTION ON LICHEN
AND BRYOPHYTE VEGETATION NEAR EDMONTON, ALBERTA
Thomas Lee and Dale H. Vitt
Department of Botany, The University of Alberta, Edmonton, Alberta.
INTRODUCTION
Epiphytes are self-sufficient plants that live on the bark of
trees , manufacturing their ot� food through photosynthesis . In temperate
regions , lichens and bryophytes (particularly mosses) are the dominant
epiphytes.
In 1866 , the Finnish botanist Nylander noted that lichens were
responsive to air quality. Since then , the abundance and distribution
of epiphytic mosses and lichens has been studied in 96 cities around the
world . Only six such studies have been completed in North America, five
of these in Canada. In each case the center of the urban area lacks
epiphytic lichens and bryophytes ; it is a "lichen desert" . From this
zone outwards , epiphytes tend to increase until the normal distribution
of the region is reached .
Rydzak and Stasiak, (1971) suggest that such paucity of epi-
phytic lichens and mosses is due to city-induced microclimatic drought .
Microclimate does have some effect on epiphytes (Brodo , 1966) . But air qual
ity is a limiting factor as well . Studies of an iron-sintering plant at
Wawa , Ontario (Rao and LeBlanc , 1967) , a steel producing plant in South

- 130 -
Wales (Pyatt , 1970) , and a shale-oil works in Sweden ( Skye , 1958) have
all demonstrated a correlation between the frequency of epiphytes and
air pollution levels .
Though many pollutants affect lichen and moss plants , sulfur
dioxide (SQ2) is the most ubiquitous and abundant . It bleaches chloro
phyll , causes permanent plasmolysis and sporadic brown spots on the
chloroplasts of the algal cells , with chlorophylls degraded to phaeo
phytins (Rao and LeBlanc , 1966 ) . Hill (1971) observed that sulfur
dioxide may act on chlorophyll indirectly through the formation of sul
fite .
Lichens are also sensitive t o hydrogen flouride (Nash , 1971 ,
LeBlanc et . al . 1971) . Whenever flour ide concentrations exceed 80 ppm ,
chlorosis o f the lichen thallus occurs (Nash , 1971) . Subsequently,
all the pigments are degraded and the thallus disintegrates .
Lichens have been fumigated with 5 ppm (Rao and LeBlanc , 1966)
and with 100-10 , 000 ppm S02 (Pearson and Skye , 1965) each for 24 hrs.
Lichen response was evident in both treatments , but the concentrations
were higher than are found in nature . The highest 24 hour concentrations
observed in cities are in the order of 1 ppm, (Blade and Ferrand , 196 9 ;
Wilkins , 1954) .
Nash (1973) fumigated a variety of lichens at 0 , 0 . 5 , 1 . 0 , 2 . 0
and 4 . 0 ppm S02 for 24 hours. Responses ranged from significant chloro
phyll reduction at 0. 5 ppm in Parmelia caperata , to no significant re
duction of chlorophyll until 2 . 0 ppm or higher in Physcia millegrana and
Cladonia furcata . Such different responses of lichens permits individual
species to be used as indicators of pollution intensity.

'.
- 131 -
Field studies indicate that lichens are more sensitive to S02
than laboratory studies have shown. In the Tyne Valley (Gilbert , 1965)
lichens were absent from areas where mean S02 concentration exceeded 0 . 10-
0 . 15 ppm.
S�veral approaches have been employed in analyzing epiphyte dis
tribution around cities and pollution centers . Maps have been produced by
LeBlanc (1961) for Montreal and Rao and LeBlanc (1967 ) for Wawa, Ontario .
Distribution maps reveal the response of individual species to air quality
(LeBlanc and De Sloover , 1970) and provide indicator species . As another
approach , The Index of Atmospheric Purity (I .A.P . ) is a mathematical re
presentation of the relationship between epiphytes and pollution (LeBlanc
and De Sloover , 1970) . Transplanting lichens from unpolluted areas to
contaminated zones has also been a successful approach. Brodo (1966) found
that Parmelia caperata could not be transplanted to within 20 miles of New
York City without damage to the thallus .
POLLUTION IN EDMONTON
Edmonton is the capital and largest city of Alberta , having a
population of about 500 , 000. There are gas and oil refineries and chemical
plants , as well as a pipeline terminal , east of the city in an area known
as Refinery Row. Fort Saskatchewan , 13 miles to the northeast , also has
several chemical plants .
Alberta Environment (1973) Air Pollution Control maintains a
continuous monitoring system in the central city and at Refinery Row Data are
reported as hourly peak and as monthly means which integrate the continuous
data to 2 decimal places for S02 and 3 places for H2S . Sulfur dioxide levels

- 132 -
in both areas have monthly means of 0 . 00 ppm, although in the Refinery
Row area hourly peaks of 0 . 04 ppm for July and 0 . 03 ppm for August are
reported . Hourly peaks within the city were 0 . 00 ppm for July and 0 . 02
.for August . Hydrogen sulfide levels at Refinery Row have monthly means
of 0 . 003 ppm and 0 . 004 ppm for July and August 1973 , and hourly peaks of
0 . 23 ppm for both months.
Sulfur dioxide is not continuously monitored at Fort Saskatchewan.
Exposure cylinders indicate that total sulfation there (0 . 0489 mg/day/lOO
cm2) is one quarter of that at Refinery Row (0. 1633 mg/day/lOO cm2) . But
the Fort Saskatchewan area has higher concentrations of flourides and am
monia than either central Edmonton or Refinery Row (Alberta Environment ,
Air Pollution Control) .
METHODS
Sampling was confined to aspen and balsam poplars . In the
Edmonton area , (Populus tremuloides Michx. and Populus balsamifers t. ) are
the most common trees in the area . They develop a furrowed bark at matur
ity which is suited to colonization by epiphytic lichens and mosses . Sam
ple sites consisted of species undisturbed , mature groves containing less
than 5% coniferous trees and unshaded by buildings or other structures .
Thirteen sites were selected . Within each grove , ten trees were sampled ,
selected by the following criteria : diameter at breast height of at least
15 cm, furrowing of the bark to a height of two meters from ground level
and at least two meters from the edge of the grove (to minimize edge ef
fects) . Each tree was examined from its base to a height of two meters
from ground level with a 10 X hand lens to determine the abundance of

- 133 -
epiphytes . Species growing on humus or soil over roots were not
included . Species were counted and assigned an estimated coverage
value (F) from 1 to 5 depending on the amount of bark surface
covered : 1) present at one location, 2) present at two or three
locations with little area covered , 3 ) found in one or two large
patches or at more than three locations about the trunk, 4 )
abundant , but scattered about the bark surface and in no one
place being continuous , and 5) abundant , covering large continuous
sections of bark. Frequency of occurrence (F) was determined for
each species in each stand by the following :
No . of trees on which each species of F (Absolute) = epiphyte occurred
Total No . of trees sampled
Stands were grouped according to their locations (see figure 1) :
1 , 4 as Refinery Row sites ; 5 , 6 as Near Refinery Row sites (these
are then considered together as Total Refinery Row sites) ; 2 , 3 ,
7 , 8 , 9 , 13 as Rural sites ; and 10 , 11 , 1 2 as Fort Saskatchewan
sites .
For each stand , an Index of Atmospheric Purity ( I .A. P . )
was computed : I .A.P . = rA (Q x f) /lO (LeBlanc and De Sloover ,
1970) where n is the number of species , Q is the Ecological Index
of each species and f is the coverage value assigned to it by the
5 point scale described above. The Ecological Index , Q , for each
species is the average of the total numbers of epiphyte species
occurring at the sites in which the species is present . The mean
I .A .P . values for each locality was calculated . Specimens of
each taxon are deposited in the University of Alberta herbarium.
(ALTA) .

- 134 -
RESULTS
In the Fort Saskatchewan area , there were eight species of
epiphytes while near Refinery Row, there were 17 species . In rural areas
there were 24 species (Table 1) .
Most lichens had low mean frequencies in the Fort Saskatchewan
area that increased in the Refinery Row area and were highest in rural
sites (Table 1) . For example , Parmelia sulcata had a mean frequency of
0 . 0 in the Fort Saskatchewan area , 2 . 0 around Chemical Row and 3 . 8 in
the rural area. Only 1 species , Pyrenula leucoplaca , tended to decrease
in frequency outside of the Fort Saskatchewan area.
Mosses , while almost absent from the Fort Saskatchewan area ,
did not increase significantly on rural sites over their frequencies
near Refinery Row.
The Index of Atmospheric Purity (Table 2) is lowest for the
Fort Saskatchewan area (11 . 0) , highest for the rural areas (38 . 6) and
close to the rural area values in the vicinity of Refinery Row (35 . 7) .
The two sites at Refinery Row are 12% lower than the rural area (a
difference of 4 . 8 IAP points) , while the two sites near Refinery Row
are 3% lower (1 . 1 points) .
Mean total cover values (Table 2 ) closely parallel the IAP
values : lowest for Fort Saskatchewan (8 . 9) and highest for rural areas
(29 . 1) , although Refinery Row values are close (28 . 7 , 25 . 9) .
DISCUSSION AND CONCLUSIONS
LeBlanc and Rao (1973) summarized the research of the last
100 years on responses of lichens and mosses to pollution. They

•
- 135 -
concluded that "the distribution pattern of lichens and bryophytes in
a city can be related to the degree and extent of pollution . " In the
Edmonton area, lichens and mosses are distributed rather evenly except
in Fort Saskatchewan . Our measures also indicate a low degree of air
contaminatipn around Refinery Row.
The epiphytic flora of Fort Saskatchewan is under severe
stress . Only eight species are found there , as compared with 18 in
Refinery Row and 24 in rural sites . Cover is about 33% of that in
Refinery Row and rural localities , while I .A.P . values are also only
about 1/3 of those computed for the other two areas.
LeBlanc and Rao (op . cit . ) also concluded that "in cities
and industrial areas , the absence or decline of epiphytic flora ,
especially of lichens , appears to be due to the pollution of air by
S02 ' HF or another pollutant produced during fuel combustion or
industrial operations . " In any survey of epiphytes and pollution
an immediate inclination might be to correlate levels of S02 with
epiphyte abundance . However , in Edmonton, total sulfation as
determined by exposure cylinders are higher in the Refinery Row
area than at Fort Saskatchewan. In fac t , in August , 1973 , Fort
Saskatchewan had a total sulfation 1/4 that of the Refinery Row.
Since continuous monthly monitoring of S02 in the Refinery Row
area indicates mean S02 levels to be below that required to
affect lichens (see Gilbert , 1965) , it would not be unreasonable
to assume that S02 values at Fort Saskatchewan are also below
that needed to have an adverse effect on epiphytes . Fluorides
and ammonia have been reported in higher concentrations at Fort

- 136 -
Saskatchewan than at Refinery Row and the absence of epiphytes at
Fort Saskatchewan may be due to these compounds (Nash 1971) .
One species , Pyrenu1a 1eucop1aca , i s unusual in that it
shows higher frequency in the Fort Saskatchewan area . This peculiar
crustose lichen is usually found on the smooth bark of young poplar
trees . Thus , its presence is probably influenced more by the amount
of smooth bark available .
That "the absence of certain common , but sensitive , lichen
species in an area can serve as in indicator of the pollution of it ' s
air , " was a third conclusion of LeBlanc and Rao . Three species show
fairly high frequencies in the Fort Saskatchewan vicinity , although
each of them has higher frequencies in all other areas . These three
species , Physcia orbicularis , Xanthoria fallax and Lecanora sp . might
be regarded as ' tolerants ' , since many species common to Refinery Row
or rural areas are not present in Fort Saskatchewan. This correlates
with the data of LeBlanc and De Sloover (1970) , who reported Xanthoria
fallax , Physcia orbicularis and several species of Lecanora as being
present in the most polluted zone of Montreal . Species such as Parmelia
flaventior and sulcata are not found in Fort Saskatchewan but are common
elsewhere and may be used as rough indicators of pollution.
ACKNOWLEDGEMENTS
We wish to thank the National Research Council of Canada for
grant A-6390, Mr . Michael Ostafichuk for identifying critical specimens ,
and Mrs . Catherine Busby for drawing the map .

- l37 -
LITEP�TURE CITED
Alberta Environment . 1973 . Air monitoring report , Edmonton, July
and August , 1973 . Air Pollution Control .
Blade, E . and E . F . Ferrand . 1969 . Sulfur dioxide air pollution in
New York City : statistical analysis of twelve years . Jour .
Air Po�lut . Control Assoc . 19 : 873-878 .
Brodo , J .M . 1966 . Lichen growth and cities : A study on Long Island ,
New York . The Bryologist 69 : 427-449 .
Gilbert , O . L . 1965 . Lichens as indicators of air pollution in the
Tyne Valley . pp 35-47 , In. Ecology and the Industrial
Society . Blackwell Sci . Publ . , Oxford .
Hill , D . J . 1971 . Experimental study of the effect of sulphite on
lichens with reference to atmospheric pollution. New
Phytol . 70 : 831-836 .
LeBlanc , F . 1961 . Influence de 1 I atmosphere polluee des grandes
agglomerations urbaines sur les epiphytes corticoles .
Rev . Canad . BioI . 20 : 823-827 .
LeBlanc , F . and J . De Sloover . 1970 . Relation between industrializa
tion and the distribution and growth of epiphytic lichens
and mosses in Montreal . Canad . Jour . Bot . 48 : 1485-1496 .
LeBlanc , F . , Gilbert Comeau , and D . N . Rao . 1971 . Fluoride injury
symptoms in epiphytic lichens and mosses . Can . Jour . Bot .
49 : 1 691-1698 .
"',',;

- 138 -
LeBlanc , F . and D .N . Rao . 197 3 . Evaluation of pollution and drought
hypotheses in relation to lichens and bryophytes in urban
environments . The Bryologist 7 6 : 1-19 .
Nash, T .R . III . 1971. Lichen sensitivity to hydrogen fluoride. Bull
Torrey Bot . Club 98 : 103-106 .
Nash, T .R . III . 1973 . Sensitivity of lichens �o S02 ' The Bryologist
7 6 : 333-339 .
Pearson, L . and E . Skye . 1965 . Air pollution affects pattern of
photosynthesis in Parmelia sulcata , a corticolous lichen.
Science 148 : 1600-1602 .
Pyatt , F . B . 1970. Lichens as indicators of air pollution in a steel
producing town in South Wales . Environ. Pollut e 1 : 45-56 .
Rao , D .N . and F. LeBlanc , 1966 . Effects of sulfur dioxide on the
lichen algae , with special reference to chlorophyll . The
Bryologist 69 : 69-75 .
Rao , D .N . and F. LeBlanc . 1967 . Influence of an iron sintering plant
on corticolous epiphytes in Wawa , Ontario . The Bryologist
70 : 141-157 .
Rydzak, T . and R. Stasiak. 1971 . Badania nad stanem flory porostow
w rejonie przemyslue azotewego w Pulawach. Ann . Univ . Mariae
Curie-Sklodowslw 26C : 329-342.
Skye , E . 1958 . Luftfororeningars inverkan pa bush-och bladlavfloran
kring skifferolj everket i Narkes Kvarntorp . Svensk. Bot .
Tidskr . 52 : 133-190.
Wilkins , E . T . 1954 . Air pollution in London smog . Mech. Eng . 7 6 :
426-428 .

- 139 -
Table 1 . Mean Frequency o f occurrence (F) for five localities in the Edmonton Area. Numbers in parentheses indicate number of stands . Total Refinery Row category equals sum of Refinery Row plus near Refinery Row group .
Species
Lichens
Caloplaca cerina (Ehrh. ) T . Fries Caloplaca holocarpa (Hoffm. ) Wade Lecanora sp . Parmelia albertana Ahti . Parmelia flaventior Stirt . Parmelia subrudecta Nyl . Parmelia sulcata Tayl . Physcognia grisca (Lam. ) Poelt Physcia adcendens Bitt . Physcia aipolia (Ehrh. ) Hampe Physcia orbicularis (Neck. ) Poetsch . Pyrenula leucoplaca (Wallr . ) Korb . Ramalina crinalis (Ach . ) Gyeln . Ramalina fastigiata (Pers . ) Ach. Ramalina pollinaria (Westr . ) Ach. Usnea hirta (L) Wigg . Xanthoria fallax (Hepp . ) Arn. Xanthoria polycarpa (Ehrh. ) Oliv o
Mosses
Brachythecium salebrosum (Web . & Mohr) B . S . G.
Eurhynchium pulchellum (Hedw. ) Jenn . Orthotrichum obtusifolium Brid . Orthotrichum speciosum var . elegans
(Hook. & Grev . ) Warnst . Plagiomnium cuspidatum (Hedw. ) Koponen Pylaisiella polyantha (Hedw. ) Grout
Total Number of Species
Fort Sask. (3)
o o 7 . 0 o o o o o 3 . 0 1 . 7 5 . 8 1 . 0 o o o o 6 . 7 0 . 3
o o o
o o 6 . 0
8
Refinery Row (2)
2 . 5 o
10 . 0 7 . 5 0 . 8 o 2 . 0 1 . 5 8 . 5 8 . 0
10 . 0 o o o o o
10. 0 2 . 5
4 . 0 3 . 0 1 . 5
3 . 5 3 . 5
10 . 0
1 7
Near Ref . Row (2)
1 . 5 0 . 5
10 . 0 8 . 0 1 . 0 o 2 . 0 o 9 . 0 9 . 0
10. 0 o o o o o
10. 0 3 . 0
6 . 7 5 . 0 o
7 . 0 4 . 5
10 . 0
1 6
Total Ref . Row (4)
2 . 0 0 . 2
10 . 0 7 . 8 0 . 9 o 2 . 0 0 . 8 8 . 8 8 . 5
10. 0 o o o o o
10 . 0 2 . 8
5 . 2 4 . 0 0 . 8
5 . 2 4 . 0
10 . 0
1 8
Rural (6)
8 . 3 0 . 8 9 . 0 5 . 3 2 . 8 0 . 7 3 . 8 0 . 7 9 . 8 7 . 7
10 . 0 0 . 3 0 . 2 0 . 3 0 . 2 0 . 2
10. 0 4 . 7
4 . 2 1 . 3 0 . 8
3 . 2 2 . 0 9 . 8
24

Table 2 . Index of atmospheric purity of stands and localities in the Edmonton Area . Numbers in parentheses relate to s tand numbers given in Figure 1 .
L A. F .
For Individual Sites (stands )
Hcan LA . F . Fo!: Loea J iti.es
(+ standard deviation)
UL[,l� Te t 81 COv er (melti cf r.r (t )
fel a11 d.H:L )
Fort Ref inery Saskatchewan Row
2 . 2 (4) 34 . 8 (1 )
10 . 6 (10) 32 . 8 (4)
20 . 1 ( 1 2)
11 . 0 (8 . 9) 33 . 8 (1 . q )
8 . 9 25 . �
Near Total Refinery Refinery
Row Row Rural
37 . 2 (5) 34 . 8 (1) 25 . 6 ( 13)
38 . 1 ( 6) 32 . 8 (4 ) 29 . 3 ( 7 )
37 . 2 (5) 42 . 8 (2)
38 . 1 (6) 4 6 . 7 (3) 0 . 2 (£ ) 42 . 2 (9)
37 . 6 (0 . 6) 35 . 7 ( 2 . 4) 313 . 6 (8 . 9)
2e . 7 2i . ?- 2� . 1
I-' .r-.. 0 I

Monitoring and ReguZation

- 141 -
8
C A L A H O O
• A C H E S O N
Figure 1 : Map o f the Edmonton Area showing the localities o f the 13 study sites (triangles) . Specific industrial areas noted in the text are a.own as black areas .

- 142 -
ENVIRONMENTAL STUDIES
G U L F O I L C A N A D A L I M I T E D
G U L F O I L C A H A D A L I M I T E D
R E S E A R C H A N D D E V E L O P M E N T D E P A R T M E N T
E N V I R O N M E N T A L S T U D I E S M O B I L E L A B O R A T O R Y
T h i s v e r s a t i l e u n i t i s c a p a b l e o f m o n i t o r i n g
a m b i e n t a i r q u a l i t y a n d s o u r c e e m i s s i o n s f o r a l l o f
t h e m a j a r a i r p o I I u t il n t s .
T h e m o n i t o r s a r e mo u n t e d i n i n s t r u m e n t r a c k s
a n d o n b e n c h e s i n a s p e c i a l l y d e s i g n e d 3 0 ' B l u e b i r d b u s
p ow e r e d b y a n 8 c y l i n d e r g a s o l i n e e n g i n e .
T h e M o b i l e L a b o r a t o r y i s c o m p l e t e l y s e l f
c o n t a i n e d a n d c a n o p e r a t e e i t h e r f r om s h o r e - l i n e
p o w e r o r f ro m i t s o w n s t a b i l i s e d 2 2 k i l ow a t t d i e s e l
p ow e r e d g e n e r a t o r . A i r c o n d i t i o n i n g a n d h e a t e r s
a l l ow y e a r r o u n d o p e r a t i o n o f t h e L a b o r a t o r y . T h e
b e n c h mo u n t e d a n a l y z e r s a n d i n s t r u m e n t r a c k s a r c
s h o c k - mo u n t e d t o m i n i m i z e t h e e f f e c t o f r o a d v i b r a t i o n s .
I n s t r u me n t a i r i s p r o v i d e d b y a n o i l - f r e e c o m
p r e s s o r m o u n t e d i n t h e r e a r c om p a r t me n t . M o s t g a s
s e r v i c e s a r e p r o v i d e d f r o m c y l i n d e r s t o r a g e c o n t a i n e d
i n a s e a l e d c o m p a r t m e n t w h i l e h y d r o g e n i s o b t a i n e d
f r o m a n e l e c t r o l y t i c g e n e r a t o r .
T h e L a b o r a t o r y i s e q u i p p e d w i t h a n e x p l o s i m e t c r
w h i c h i s o l a t e s t h e e l e c t r i c a l p o w e r i n t h e e v e n t t h a t
e x p l o s i v e v a p o r l e v e l s r e a c h 6 0 % o f t h e l ow e r e x p l o s i v e
I i m i t i n c r i t i c a l a r e a s o f t h e L a b o r a t o r y .

- 143 -
S a m p l e s o f t h e o u t s i d e a m b i e n t a i r a r e d r a w n
i n t h ro u g h a s a m p l e p o r t o n a ma s t 2 5 1 a b o v e t h e
g r o u n d . T h e s a m p l e i s p u m p e d v i a a t e f l o n s a m p l e
l i n e t o a m a n i f o l d a n d f l ow p a n e l w h e r e i t i s d i s
t r i b u t e d t o t h e v a r i o u s mo n i t o r s .
S o u r c e s a m p l e s a r e p u l l e d f r o m t h e s a m p l e po i n t
t h r o u g h a n e l e c t r i c a l l y h e a t e d t e f l o n s a m p l e l i n e t o
a s a mp l e c o n d i t i o n i n g b o x a n d t h e n p u m p e d t o t h e
mo n i t o r s .
Po l l u t i o n l e v e l s w i l l b e c o r r e l a t e d w i t h w e a t h e r
p a r a me t e r s . W i n d s p e e d a n d d i r e c t i o n a r e m e a s u r e d b y
a r o t a t i n g c u p a n e mo me t e r a n d w e a t h e r v a n e mo u n t e d o n
t o p o f t h e s a m p l e i n l e t m a s t . A c e n t r a l l y l o c a t e d
w e a t h e r s t a t i o n w i l l me a s u r e t h e p a r a m e t e r s l i s t e d i n
T a b l e I b e l ow .
TA B L E 1
W e a t h e r S t a t i o n P a r a m e t e r s
P a r a m e t e r
R a i n f a l l
H u m i d i t y / T e m p e r a t u r e
S o l a r r a d i a t i o n
B a r ome t r i c P r e s s u r e
P r i n c i p l e o f M ea s u r e m e n t
V o l u m e t r i c
H y g r o t h e r mo g r a p h
P y r o h e l i o me t e r
A n e r o i d

- 144 -
T h e a i r q u a l i t y m o n i t o r s a v a i l a b l e i n t h e
L a b o r a t o r y a r e s h ow n i n T a b l e 2 .
P o l l u t a n t
I . S u l f u r d i o x i d e
2 . S u l f u r c m p d s .
3 . H y d r o g e n s u l f i d e
4 . H y d r o g e n s u l f i d e
s . P a r t i c u l a t e s
6 . P a r t i c u l a t e s
7 . O x i d e s o f n i t r o g e n
8 . O z o n e
9 . T o t a l h y d r o c a r b o n s
1 0 . H y d r o c a r b o n s
1 1 . C a r b o n m o n o x i d e
T A B L E 2
A m b i e n t M o n i t o r s
R a n g e
. 0 0 5 - 1 . 1 5 p . p . m .
> 3 p . p . b .
2 - 1 0 0 p . p . b .
0 . 2 - 5 0 0 p . p . b .
0 - 2 , 0 0 0 + m g / M3
> 0 . 2 C . O . H . u n i t s
. 0 0 1 - 1 0 p . p . m
0 . 2 - 2 0 0 p . p . b .
0 . 2 p . p . m . - 2 %
> 0 . 5 p . p . m .
0 . 5 - 5 0 p . p . m .
P r i n c i p l e o f M e a s u r e me n t
C o u l o m e t r y
G . C . / F . P . D .
P h o t o me t r y
C o l o r i m e t r y
G r a v i m e t r Y '
P h o t o m e t r y
C h e m i l u m i n e s c e n c e
C h e m i l u m i n e s c e n c e
F l a m e I o n i s a t i o n D e t .
G . C . / F . I . D .
N o n d i s p e r s i v e I . R .
S t r i p c h a r t r e c o r d e r 5 a n d a d a t a a c q u i s i t i o n
s y s t e m a r e u s e d t o r e c o r d a n d p r o c e s s t h e s i g n a l s
f r o m t h e s e m o n i t o r s .
T h e s o u r c e mo n l t 0 r i n g f a c i 1 i t i e s h a v e b e e n
i n t e g r a t e d i n t o t h e L a b o r a t o r y b y t h e u s e o f d u a l
p u r p o s e a n a l y z e r s . T h e s e i n s t r u m en t s t o g e t h e r w i t h
t h e o t h e r mo n i t o r s u s e d i n s o u r c e me a s u r e m e n t a r e
s h ow n i n T a b l e 3 .

- 145 -
T A B L E 3
S o u r c e M o n i t o r s
C o m po n e n t P r i n c i p l e o f M e a s u r e m e n t
1 . S u l f u r d i o x i d e
S u l f u r c m p d s .
2 . H y d r o c a r b o n s
3 . O x i d e s o f n i t r o g e n
4 . F l u e g a s
5 . F I ow
6 . D i f f e r e n t i a l P r e s s
7 . T e m p e r a t u r e
G . C . / F . P . D .
G . C . / F . P . D .
G . C . / F . I . D .
C h e m i l u m i n e s c e n c e
G . C . / T . C .
P i t o t t u b e
V a r i a b l e i n d u c t a n c e
T y p e K t h e r mo c o u p l e
N O T E : n - Dua L p urp o s e
V e h i c l e S p e c i f i c a t i o n
B l u e b i r d b u s
H e i g h t w i t h m a s t d ow n
A i r c o n d i t i c n i n g
H e a t i n g
P ow e r g e n e r a t o r
G r o s s v e h i c l e w e i g h t
3 0 ' l o n g b y 8 ' w i d e
I I ' 6 " 2 0 , 0 0 0 B . T . U .
2 0 , 0 0 0 B . T . U .
2 2 k i l (; w a t t s
2 4 , 0 0 0 l b s .
- - 0 0 0 - -
D
D
D

- 146 -
REVIEW OF MONITORING DATA AVAILABLE FROM THE
ALBERTA DEPARTMENT OF THE ENVIRONMENT : WITH
SPECIFIC TABULATIONS FOR SOUR GAS PROCESSING
PLANTS .
by
J . C . Lack and W. J . Schnitzler
Air Quality Control Branch , Alberta Environment , Edmonton .
ABSTRACT
This paper summarizes the current air quality monitoring being
conducted by the Department of the Environment and by the Sour Gas Industry.
Included is a summary of the minimum requirement guidelines which
have been established for all Air Licences issued to sour gas plants . These
requirements apply to all new plants and also existing plants when the
existing approval is ammended .
Also included is a consolidation of the Air Monitoring Directives
(AMD) which have been issued during 1972 and 1973 . This AMD summarizes the
reporting requirements for sour gas plants .
All data are public information and can b e viewed or copied upon
reasonable written request .

- 147 -
I . CURRENT AIR QUALITY MONITORING
Re spons ibility for monitoring o f air quality has been placed
jointly onto government and industry . The paragraphs below de scribe
government operations and industry requirements . The Directive in
part II , with attachments , details the methods used .
( a ) Government of Alberta .
( i ) Continuous Ambient Monitoring :
The Alberta Department of the Environment i s responsible for
conducting continuous monitoring surveys for sulphur dioxide and hydro-
gen sulphide near sour gas plants . There are four mobile laboratories ,
one each in the regions o f Whitecourt , Edmonton , Red Deer and Calgary .
The four laboratories are able to cover all the major four gas plants
once each year and the small plants on a less frequent ba sis . The
surveys which the Department conducts usually last 3 - 4 weeks .
Each mobile laboratory is equipped to monitor continuous ly ,
the S02 and H
2S concentrations in the ambient air , wind velocity and
direction , ambient temperatur e f pres sure and humidity . The mobile
laboratory is maintained by the Department technologists from the
appropriate regional office .
( i i ) Static Ambient Monitoring :
The Department of the Environment has e stabli shed a network
o f 180 exposure cylinders for measurement of total sulphation and hydro-
gen sulphide near most of the sour gas plants in Alberta .

- 148 -
(b) Minimum Industry Requirements
Specific requirements for individual gas plants are detailed
in Table 2 , determined according to the principle s below .
( i ) Continuous Ambient Monitoring :
The Department o f the Environment has e stablished a set o f
guideline � dependent o n the maximum allowable sulphur emission rate ,
for continuous monitoring of the ambient air for S02
and H2
S ( Table 1) .
The locations of the continuous monitors are chosen by the plant .
However , the Department may specify in the Air License a particular
location or locations at which continuous monitoring must be conducted .
( i i ) Static Ambient Monitoring :
The industry is also responsible for condu cting exposure
cylinder monitoring for total sulphation , hydrogen sulphide and sulphur
dustfall (Table 1 ) . Those plants shipping their total sulphur produca
tion in liquid form are exempted from sulphur dustfal l monitor ing . Tho se
plants stockpiling but not shipping solid sulphur are permitted to re
duce the number of sulphur dustfaH stations to one half of that shown
in the schedule provided that the minimum i s not less than four . Those
plants exempted in part 2 above must e xpand their network to the full
compliment at least three months prior to break up of the sulphur
stockpile .
( iii) , Stack Emission Monitoring :
The incinerator stack ( s ) at each sulphur plant must also be
surveyed each year according to the schedule 'establi shed by the Standards
and Approvals Division (Table 1) .

TABLE 1
Maximum Al lowable Sulphur Emission Rate
LTS/D
120-149
90-119
60-89
30-59
15-29
10- 14 . 9
5-9 . 9
3-4 . 9
1-2 . 9
Less than 1
MINIMUM GUIDELINES
for
MONITORING REQUIRED OF INDUSTRY
Continuous Monitorinq No . of Stations Mo . /yr.
5 12
4 1 2
3 12
2 12
1 12
1 9
1 6
1 3
1 2
No . of Total Sulphation and H
2S Exposure Cylinders
40
35
30
2 5
2 0
16
12
8
4
As required As required 2
Sulphur Production LTS/D
Greater than 1000
100 - 1000
Less than 100
No . of Sulphur Distfa11 Exposure Cylinders
12
8
4
No . of Stack Surveys Per · Year
8
7
6
5
4 I-' � 3 \0
2
1
As required
As required

. .
TABLE 2 CUtmEN1' AMBIENT AIR 1«)� D n�nrn OF SOUR CAS PLA:NTS
" PLANT 002 MSSlON (OP3rator) IDeATION Lll4IT (L'tID)
0: ;
Acheson (cdn . Nat . Gas LIqui ds) 2-53-26wlt .79
8a l zac 1 ,2-26-29'14 1 36 � 1971> (Pet rogas) t02 197 )
Ili goray 22-51 -SW4 5 . 82 (Amoco
b t gs to,,- -10-61 -22WS 31 .6 at tOOO!' (Amoco) . 38. 2 at 1 200·'
80nn l e Glen (Texaco hp. ) 1 7-"7-27'1" 2.58
B razeau R iver 12-lt6-1 ltV5 18. 12 (H . B . O . O . ) 8urn t t l hlber 13-30-7\15 ", .6 (She 1 1 )
Carol i ne 36-3 .. -6"5 1 .6 (A 1 tana) Ca ro l i ne (H. I. O . G . ) 2O-3'-W5 7. 1 2
Cars ta l rs (Home)
3-30-2\15 '.52
Crossflelcf 1'-28-,WS 15 1 .5 at 1000·' (Amoco) 1,6., at 1 200-'
Days l anel l1t-41t-l "/W4 1 �1O (Franca"a)
Edson 1 1-S3- 1 8WS 39 .0 (H . 8 . 0 . G . )
AMBIENT Hltll'l'OlD'C tlElWOn • Exposure Cylinders I.S.&H2S SUlphur
1 0
ItO 1 2
" · 0
25 8
" It
12 It
20 8
" 0
10 It
5 •
30 1 2
8 0
10 8
Continuous Mon�to� No. ).'"40 • • r.
0
7 12
1 2
2 12
1 2
t ,
1 12
0
0
0
J 12
1 1 0'7'-75)
1 2
* ltefers to the current networt except for a few plants which have new appl'OT&ls 1n the past two months an4 .y not Mve yet instituted the ..., network. " "
.... \.II 0

TABLE 2 (cont. )
t:1.AN'r (Opjt'at.or)
E 1 kt�t1 (Home )
Fort McMu .... ay ( G . C . O . S . )
G i l by (At 1 an t i c)
G i l by (Pact f t c)
G i l by (Texaco)
Gol d C .. eek (At l an t i c)
Go l den Sp i ke ( I mpe r i a 1 )
G reencou .. t (Petro f i na)
Harmat ten (Canad i an Supe ri or)
Harte 1 1 ( Sun)
Hope C reek (She 1 1 )
I nn t s fa i 1 (She 1 1 )
Joff .. e ( I mpe .. l a t )
· .
tutttU!:m MmlM A!1t lJ.O�ttTOtttOO. IN I V!OlNlTt 011' SCUtt OAS mms
tocATtON -�.-' -- �-. ---.-.--� -�-
3-3 t-�wS
1 7-92- 10W4
5-40-3W'5
2 7-40-3W5
22-40-3W5
26-67-5\16
22-5 l-2]W4
26-59-9W5
27" 3 1 -4W5
1 2- 19-2W5
1 7-64- 1 3W5
3- 35 .. 1W5
1 7- 39-26W4
so� l!:1.ttSSloN tIl-u'r (vr/o) ---------
0 . 96
44 . (Su l phur p lant) 350 . (Powe .. plant)
0 . 42
0 . 56
1 , 28
4 . 36
. 2 1
1 0 .0
50 . 6
1 .9 1
1 4. 7
1 8. "
6.06
AMDIENT MONITORING Nml0RK �sure Cylinders �. S.&H<S Su1ph�r
0
1 9 1 2
5 0
2 0
2 0
7 4
9 0
6 0
20 10
6 2
5 0
1 3 8
8 ,.
Continuous }!onit01ng 1!0. 140 . Yr.
0
2 1 2
0
0
0
2
1
0
2 1 2
1 2
0 0
1 12 1 6
1 2
..... VI ..... I

TABLE 2 (cont. )
. PLANT (Operator) .
Judy C reek ( I mpe rl a 1 )
Jump I n g Pound (She 1 1 )
Kaybob South # 1&2 (H . B . O . G . )
Kaybob South 113 (Chevron)
Leduc ( I mpe r f a 1 )
Lone P I ne C reek (Canad I an S uperI or)
lone P I ne C reek ( H . B . O . G . )
Hl nneh l k - Buck lake (CanOe 1 )
tlev l s (Chevron)
NevI s (Gu I f) Newe l l ( Loydean)
Uordegg (Tenneco) Okotoks (Texasgul f)
CURRENT AMBlmfr AIR MONITORING IN VICINITY OF SOUR GAS PLANTS
502 El{ISSION LOCATION Ln-crT (LT/D)
25-6lt- 1 1W5 . 36
1 3-25-5W5 53 . 7
1 2-62:-20W5 1 72
1 5-59- 1 8w5 2 1 5
20-49-25W4 4 .0
27-29-28w4 1 5 .92
23- 30-28W4 23 .2
5-46-6W5 5 .64
22-39-22\014 . 1 2 . 5
33-38-22\014 27. 4
1 5- 1 8- 1 4W4 . 1 8
, 1 0-44- t 2\.1; 9.96
. 27-20-29W4 52 . 4
AMBIENT lI.Dl\llTORIOO NET\>lORK Exposure Cylinders �. S.&H2S Sulph\tr
0
9 10
30 1 2
35 1 2
1 1 4
1 2 S
1 6 4
4 4
2 1 8
25 8
" 0
" "
8 to
Continuous }':onito1ing No. Ho. Yr.
0
3 1 2
3 1 2
It 1 2
0
6
2
2
1 6
1 1 2
0
0
1 2
...... \J1 N . I

- ,,-"" ... _- .. . .
TABLE 2 (cont. ) CURRENT Al-IDIENT AIR MONITORING IN VICINITY OF SOUR GAS PLANTS
PLANT (Op-'ra.tor)
O l ds (Ame rada)
Padd l e R I ve r ( Canada C I t I es )
P i ncher C reek ( G u l f)
Qui rk C reek ( I mpe r ! a 1 )
Ra l nbCM (Aqu i ta l ne)
Ral nbCM (Mob 1 1 ) Ra l nbCM ( I mpe r l a t )
Ram R i ve r (Aqu l ta l ne)
Redwate r ( I mpe r l a t )
Ri mbey (Gu l f )
S a ra toga (Sara toga)
S I monet te (She 1 1 )
S t rachan ( Gu l f)
- ��----.. --
roCATION "---- -------
1 8-32- IWS
6-S7- 8W5
2 3- 4-29W4
4-2 1-4WS
10- 1 09-8W6
' 10- 1 1 0-6W6
23- 1 1 0-]W6
2- 37- 1 0W5
29-S7-2 1W4
S-44- 1 W5
1 1-8-SW5
6-63-25\15
3S-37-9WS
502 EHISSION AMBIENT MONITORIm NETHORK LHUT (L'l'/D) Exposure Cylinders
- ,. -�-�' � -� -� �!. S.&H2S Sulphur 40 . 6 20 8
2 . 84 7 4
23.6 34 8
30 . 2 1 0 5
20 . 0 3 it
. 50 3 0
0 2 0
336 40 1 2
" . 46 1 0 0
54.4 30 5
60 1 0 4
26. 7 1 6 "
76. 4 38 1 2
Continuous l-!onit07ing l�o. }tQ. Yr.
1 2
2
1 2
1 2
2
0
0
4 1 2
1 2
1 2
1 1
1 9
2 1 2 .
..... \J1 w
- -.....

TABLE 2 (cont. ) PLANT
(0p.31·o.tor)
S t urgeon Lake (H . B . O . G . )
Syl van Lake (H . B . O . G . )
Turne r Va l l ey (Wes te rn Oeca l ta)
Vu lcan (Oome )
Wate rton (She 1 J ) Wes t Wh t tecourt (Amoco) Wh t tecourt (Paci nc)
Wi 1 dcat H I 1 1 5 (Pe t rof i na)
Wi l son C reek (Ame rada)
W i mborne (Mob 1 1 )
. lama (tI . B . O . G . )
. .
CURRENT AMBIENT AIR YDNITORING IN VICINITY OF SOUR GAS PLANTS
S02 El-lISSION AMBIENT YDNITORUU NETt�ORK LOCATION LIMIT (LT/D) Exposure Cylinders !. S.&H2S SulplroJr
2-69-22W5 1 2 . 28 1 2 ,.
32-37-3W5 5 . 1 0 1 0 1,
6-20-2W5 6 . 3 1 3 it
24- 1 5-22W4 3 .0 6 0
20-4-30w4 248 42 1 2
1 7-60-1 5W5 2 10 20 6
26-59- 1 1W5 1 4 .7 1 2 0
1 6-26-5W5 30 . 2 24 8
29-43-4W5 3 . 4 It 0
1 2-31t-26W4 1t3 . ' 20 4
1 2- 1 1 6-6W6 9 .S . 8 ,.
Continuous Monitojine No. 1':0. Yl·.
6
0
1 3
0
5 1 2
1 2
1 6
1 1 2
2
1 1 2
1 3
.... VI +:--

- 15 5 -
I I . AIR QUALITY REPORTING RRQUIREMENTS
Consolidated Air Monitoring Directive :
The items contained in the following directive constitute
a consolidation of all previous air monitoring directives issued in
1972 and 1 97 3 . This directive applies specifically to air monitoring
requirements in the vicinity of sour gas processing and sulphur recovery
plants throughout Alberta .
I . GENERAL
1 . All air monitoring reports are to be addressed as fol lows :
Mr . R . N . Briggs , M . Sc . , P . Eng . Director , Division of Pollution Control Department of the Environment 6th Floor , Milner Building 1004 0 - 104 Street Edmonton , Alberta
T5J OZ6
On receipt , the reports are forwarded to the Head of the Air Qual ity
Control Branch for inspection and approval .
2 . To facilitate review , the heading of the covering letter of each
monthly submission should make reference to the plant name , applicable month
and year , as well as plant Air Approval and License number .
3 . All air pollution monitoring data must be compiled and forwarded
to this office before the end of the month following that for which the
observations were made . If a delay is necessary , a letter outlining the
reason must be received in this office before the data reporting deadline .
Continued negligence in this regard may necessitate prosecution .
4 . One single report should be forwarded each month , rather than
several partial reports . The single report should contain the following .

- 156 -
a . EA�sure cylinder data .
b . Sulphur dustfal1 cylinder data (where applicable ) .
c . Continuous H2
S , 502 and wind monitoring date (where applicable ) .
d . Map o f the plant area . Attachment A li sts the detail to be
included on the map .
e . Plant operating data . (Energy Resources Conservation Board
forms S-30 and S-30A plus any additional info��tion required
by Air Licence . )
f . An explanation for all monitoring results in excess of the
Clean Air (Maximum Levels ) Regulations and the Department
guideline s for total sulphation and hydrogen sulphide .
5 . . The air monitoring data rece ived must be clearly legible and
contain the necessary detail as outl ined in these directives . Where the
data i s the result of irresponsible monitoring methods or inadequate monitoring
equipment , the data received will not be accepted as ful fi ll ing the monitoring
r.equir.e�9nts specified in the Energy Resources Conservation Board Approval
and the Department of the Environment Air. Li cence .
II TOTAL SULPHATION A�L> HYDROGEN SULPHIDE EXPOSURE STATIONS
1 . The function of H2S and total sulphation and hydrogen sulphide
exposure cylinders is to provide qual itative and relative data rather than
�,antitative pollutant measurements . The importance o f careful handling ,
preparation and analysis and the continuous operation of the exposure
cylinder stations is apparent in that only exposure cylinder data that i s
valid can he e ffectively compared to previous data . Attachment. B contains
additional detail in this regard .

- 157 -
2 . A sugges �ed layout for reporting the exposure cylinder
results is included . (Attachment C)
3 . The monthly submi s sion o f exposure cylinder data shall not
be considered complete and acceptable unless i t includes an explanation
for possible sources of high exposure cyl inder level s . The guidelines
to be utilized are included in Attachment A . An explanation should
also be included for pos s ible sources where any one exposure cylinder
records a substantial increase over the usual leve l , even though the
reading is below the guidel ine specif ied .
4 . We wish to emphasize that exposure cylinders should be
exposed as close as possible to the calendar month period . The individ
ual exposures shall not extend for more than one month .
s . To assure uniform laboratory procedure s and comparable re-
suIts a cornmon reference station has been set up in Edmonton . Each
laboratory which prepares and analyze s total sulphation or hydrogen sul
phide exposure cyl inders must send one exposure cyl inder of each kind to
our Edmonton office each month . Our staff then changes the individual
stations and returns the exposed cylinders to your laboratory for analy
sis . In the case where on laboratory prepares and analyse s the exposure
cylinders for a number of plants , only one set of exposure cylinders i s
required . Data from laboratories analyzing total sulphation and .H2S
exposure cylinders or total sulphation plates will not be accepted un
less the laboratory i s submitting one set of exposure cylinders to thi s
office on a monthly bas is for exposure at the Edmonton reference station .

- 158 -
6 . Change over to total sulphation plates from the glass j ar
cylinders is acceptable provided that both systems are maintained for a
minimum of three months at each station , and the results are comparable .
7 . The use of tiles o r any method other than the glass jar exposure
cylinder. for the detection of H2
S is unacceptable at this time .
8 . All exposure cylinder data sheets shall include a reference
to the laboratory responsible for the specific analyse s , as well as the
signature of the laboratory personnel certifying the results .
III . SULPHUR DUSTFALL MONITORING
1 . All plants producing elemental sulphur are required to conduct
sulphur dustfall monitoring (with the exception mentioned below) . A
suggested layout for reporting the results is included (Attachment D ) .
2 . Exposure cylinders for sulphur dustfall are to be established
at a distance of 1/8 to 1 mile ( or starting at the property line ) from
the sulphur stock pile in locations approved Py this office accordin� to
the followin9 schedule :
*
Maximum S02
Emission* No . of Sulphur Dustfall Cylinders Required
> 100 LT/D
100 »
50 »
20 »
10 »
802
»
»
»
»
12
10 8 6 4
Plant maximum as per Energy Resources Conservation Board approval .
The sulphur dustfall analysis procedure which i s to be
followed is included . (Attachment E) . The exposure period is 30 days
and should be concurrent with the total sulphation and H2
8 exposure

- 159 -
cylinders.. The format for the reporting of sulphur dustfall levels i s
attached . Where a company i s reporting relatively few total sulphation
and H2S exposure cylinders , one page can be util ized to report all o f
the exposure cylinders ( total sulphation , H2S , sulphur distfal l ) .
3 . Those plants flaring rather than recovering the acid gas
and producing no elemental sulphur and those plants shipping their total
sulphur production in l iquid form and having no sol id sulphur storage
facilities are exempted from the sulphur dustfall monitoring requirement .
4 . Tho se plants stockpil ing solid sulphur but not shipping
elemental solid sulphur are permitted to reduce the number o f sulphur
dustfall exposure cylinders to be implemented to one-half of the schedule
set out in paragraph 1 . , above , provided the minimum number of exposure
cylinders set out under this condition is not le s s than four .
5 . Those plants which have been utiliz ing the reduction in
paragraph 3 . , above , must expand the sulphur dustfall monitoring net
work to the full schedule three months prior to break up of the sulphur
stockpil e .
6 . Those plants shipping and stockpiling solid elemental sul-
phur must implement the full schedule of sulphur dustfall exposure
cyl inder requirements outlined in paragraph 1 above .
7 . The sulphur dustfall levels throughout the Province of
Alberta will be summarized by this office and mailed out to all plant
operators on an annual bas is .
8 . A description i s included of the dustfall cylinders that
are utilized for the monitoring o f sulphur dustfal l . (Attachment F) .

- 160 -
9 . Locations o f the sulphur du stfa1l stations shall be pro-
posed and forwarded to this o ffice for approval prior to installation .
The locations should be representative , mainly in the primary downwind
direction and within a reasonable distance o f the sulphur stockpile o r
shipping area (within approximately one mile ) .
1 0 . The plastic polyethylene j uice containers uti lized by this
Department are available from :
We stern Varieties and Dry Goods Ltd . , 10187 - 103 Stree t , Edmonton , Alberta
The containers are li sted as No . 88LT Plastic Juice Containers . Similar
containers may be fI.'o·ailable from other source s , however , this has been
our most dependable source .
1 1 . The location of all sulph1 . r dustfall exposure cylinders
should be clearly ind�o cated either on c sl;.parate map or on the general
pl ant area map , sho''li!:g the H2S and t01:al sulphation exposure cylinder
locations . Th'" fo:o::<nnt of this map Sh:.L.lJ.C' be restricted to 8 1/2 X 1 1 It •
12 . In expre s sing the concentration of sulphur dustfall , the
units of short tons snl!''hur per. square mile per 30 days , (tons S/sq .mi . /
3 0 days ) should be utilized in order to pr<:i1'ide a uniform basis for
compari son . ( One sho�t ton being 2 , 000 p)� . ) .
IV . CONTINUOUS A' :BIENT MONITORING .;....;...;........;.....;�---.;......- - -
1 . To constitute valid anc reprro ;.:><...ntative data , each S02 and
H2
S instrumen'.:. must be operational a rniniIr-..uu o f 90% o f the total com
mitment . The percentage of time that each instrument was operating
each month must be s tated in the instrumentation data form . Note that
the time periods utilized for calib::' a tion are not cons idered downtime .

- 161 -
A . Monitoring 12 months/year
I f the above criterion i s not met , back up equipment may
be required .
B . Monitoring les s than 12 months/year
I f the above criterion i s not met , the survey shall be
extended until the number of days in exces s of the 10%
downtime have been made up ; e . g . , if a monitor i s inoperable
for 5 days during a 30 day survey , the survey shall be
extended by 2 days .
2 . The S02
instruments must be calibrated at three or more
concentrations and a legible photocopy of the recorder chart during
calibration shall be submitted as part of the monthly report . So that .
the equipment sensitivity devi ations :m(iy be analyzed , the photocopy o f
the recorder cha:-'!::>=3 should inc lude i:::e initial calibration check , the
final calibration verification when adj us i.:.'1\ents are neces sary , and the
baselines befo�� and a�ter calibration . Notes to assi st in interpretation
shou:d be incluo�d .
3 . As an H..,S Res·uJ.ation h2s been e stablished for 1/2 hour .:.
periods , the spot tape type monitoring instrumentation must be adj usted
accordir.31y . Arrangements therefore must be made to change the spot
cycle on the :';-:)nventional H2S tape samplers to 30 minute s from 1 hour .
This new requi rem::nt will be given a trLll period of one year following
which the re sults wi ll be reviewed by the j oi nt industry - government
commit. t.ee •

- 162 -
4 . �1here the regulations are exceeded , the fol lowing proce-
dure shall be followed :
( i ) Immediate Notification
During office hours , immediately upon detection and confirmation
of exce ssive readings , this office shall be notified by T . W . X . or
telephone . This notification is to include the following infor
mation :
( a ) identi fication o f plant and monitor site and date o f e xces sive
level monitored .
(b) indication of the specific regulation exceeded , as we ll as
frequency o f same , e . g . : 3 hours exceeded the S02 hourly
regulation of 0 . 17 ppm , indication of the actual readings
observed , wind speed and direction , and general atmospheric
conditions .
( c ) source of high readings and remedial action taken . During
non-off ice. hours , the procedure to be followed i s outlined
in section V of this directive .
(i i ) Confirmation Letter
The informa tion required in item ( i ) must be confirmed in writing
and forwarded to thi s office within 72 hours of the occurrence .
A detailed analysis of the v iolation (as per item ( i ) abo\,,· � , as
wel l as a description of the e f fectiveness of the remedial action
taken , the preventative measures taken to prevent recurrence s ,
and the readings tltlO hours be fore and t.t.'lO hours after the .ex-

- 163 -
cessive levels } i s to be inc luded and a c arbon copy forwarded
to the Assistant Manager , Environment Protection , Energy Resources
Conservation Board , Calgary .
5 . The reporting format for continuous monitoring i s :
( i ) All S02 average concentrations o f 0 . 05 ppm or greater for 15
minutes shal l be l isted in addition to the peak value o f 0 . 10
ppm previously utilized by some companies . All H2S average
concentrations of 0 . 003 ppm or greater for 30 minutes shall
be listed .
( i i ) The average S02 concentration during each period shal l be
l isted on the same page as the peaks ; however , in no case
shall the averaging period exceed 30 minutes . In the case
where the observed peak exceeds 0 . 5 ppm , the averaging period
must not exceed 15 minute s .
( i i i ) In view o f the new Regulations , the hourly average H2S and
S02 tabl�s must be replaced by half-hourly average table s .
( iv) A separate page shoul d be utilized to list any occurrences
of H2S or 502 concentrations which exceeded any of the Clean
Air (Maximum Level s ) Regulations . The s e tables are to present
any running average conc entration which exceeded the Regulations .
(v) A 24 hour running average tabulation must be included for S02
o n every occasion of the hourly average exceeding 0 . 10 ppm .
i . e . : The running 24 hour average is to be calculated such
that in the f irst calculation the hourly average exceeding
0 . 10 ppm is the 24th hour , and in the f inal calculation the
hourly average exceed ing 0 . 10 ppm is the initial hour .

- 164 -
6 . . Where plants are conducting air monitoring surveys for less
than 12 month. per year , this office should be notified by mail of the
intent to set up the monitoring trailer , before the survey commences.
If the survey report period differs substantially from the proposed
monitorinq period , an explanation should be forwarded with the survey
report .
7 . Telemetry of the continuous S02 and H2S monitor levels
to the plant co��rol room allows a continuous check of the atmospheric
pollution levels in the specific area of the monitor location . In this
manner the necessary remedial action can be implemented immediately when
high atmospheric 802 and H28 levels are detected .
8 . One continuous monitoring survey i s to be conducted
during each annua1 plant turnaround . The �urvey shall cover the turn
around period and one week prior to one week after turnaround . For
plants operating a continuous monitoring system for 1 2 months per year
this item doe3 no� ap?ly . Those plants required to operate a continuous
monitoring syst�m for less than 12 months per year may apply this item
requirement as one month of the annual continuous monitoring requirement
(as per Energy Resource s Conservation Board approva l ) •
.9 . Attachment G i l lustra tes the format o f part o f the Department
of the Envir�nment air monitoring surveys . We recommend that a similar
format be established for the Industry submissions in order to facilitate
rapid l:eview.

- 165 -
V STACK EMISSIO� MONITORING
(a) Stack Surveys
The Air Approvals and Licences to Operate , which have
been issued since 1972 , require that a copy of each stack survey report
be forwarded to the Director of the Pollution Control Division .
VI ANNUAL REPORT
Following is an outline of minimum information requested
in the Annual Reports , as required by Air Approvals and Licences .
1 . General commentary as to the operation of the plant as
it pertains to atmospheric emissions and general
environmental considerations . A tabulation of significant
studies conducted by industry may be included at their
option .
2 . A statistical summary of S02
and H2
S monitored read�ngs in
excess of the Clean Air Maximum Levels Regulations .
Information should be in Table Form.

. , ,
Examp l e : - 166 -
TABLE
NUMBER OF OCCURRENCES
1 s t Qua r t e r 2nd Qua r t e r l 3 rd Qua rter
1 /2 h r . S02 1 1 7
1 h r . S02 1 3
24 h r . SOZ
l IZ h r . H2S
1 h r . HZS
24 h r . HZS
-
TABLE I I
CAU S E OF OCCU RRENCES
SOURCE CAUSE 1 st Qua r t e r 2nd Qua rte r 3 rd Qua r t e r
STAC K Lm'l Top 2 SOZ Stack Temp erature
FLARE Powe r Fa i l u re
1 5°2 1 0 SOZ
, ,
I ETC .
TOTAL 1 2 1 0
I 4th Qua r t e r To ta l
9
,.
4 t h Qua r t e r Comme n t s
-
J n s t a 1 1 ed New S tand-by Gene ra -tor

..
- 167 -
3 . The weighted annual average (January 1 to December 31)
S02
concentration is to be included in all cases where
an instrument is maintained year round at one location .
4 . Time and duration of annual plant turnaround .
5 . Basic Monitoring Equipment
Information should include explanation of any significant
changes made with respect to the monitoring hardware and
an indication of the effective on stream time for the
equipment .
6 . Brief exposure cylinder review - e specially o f those
individual stations exhibiting the highest levels . Data
to include :
1 . Station No . , suspected source o f the respective
pollutant .
2 . Unusual occurrences that relate to these high levels
in plant or field operations .
3 . General trend of the overall network .
4 . Lines of equal value (seasonal as minimum) if more
than 16 stations are maintained .
s . Annual average of � ndividual s tations and annual
averages of network .
7 . Brief review o f the con��nuous stack emissions monitor
data and the stack saropling surveys as the emission data
relates to the approval . Data to include :
i ) No . of total days stack monitor was in operation

- 168 -
ii) No . of days 1/2 hr . limit was exceeded
iii) No . of stack surveys conducted - including the
actual dates and emission rates .
8 . Brief commentary as to frequency and amount o f flaring .
Data to include :
i ) Total volume flared (H2
S )
i i ) Commentary only a s to frequency
9 . Basic overall annual sulphur balance :
i) Total Gas Inlet (Annual )
ii) Total Gas Flared (Annual)
iii) Total Sulphur Produced (Annual)
iv) Total Emissions·
(Annual)
VII NOTIFICATION OF THE DEPARTMENT DURING NON-OFFICE HOURS
The following guidelines are to be followed :
The plant will provide the following details to TAS :
1 . Plant name and operator
2 . Telephone number .
3 . Nature of the occurrence , ie , "Ambient" or " Stack" .
Note that T . A . S . will not be responsible for receiving any
details of the occurrence other than one of the two key words "Ambient" or
" Stack" "
"Ambient" Occu�rC'nces
T .A . S . has been instructed that calls regarding "Ambient"
occurrences are considered urgent , and that the Department staff member
on call is to be notified immediately . The staff member will then call
the plant for the details of the violation .

- 169 -
Note that "Ambient" occurrences include any violation of
the Clean Air Act (Maximum Level ) Regulations and any uncontrolled release
of air contaminants from the plant .
"Stack" OCcurrences
T .A . S . has been instructed that calls regarding "Stack"
emission violations are less urgent , and that the staff member on call
is to be notified when he makes his routine checks with T . A . S . The staff
member on call will then contact the plant at the earliest convenient time
(usually the next morning ) .
If any difficulties should arise in interpretation of this
Directive , please contact the Air Quality Control Branch .
(T .A . S . - Telephone Answering Service - 425-1130)

. i
- 170 -
ATTACHMENT A
MAP OF THE PLANT AREA
The map i s to include the following details :
- Plant Location
- Location of adj acent towns or other major landmarks ( such as rivers , etc . ) •
- Continuous Monitoring locations ( if applicable }
- Exposure cylinder locations .
- Sulphur dustfall cylinder locations (if applicable )
- well and battery site locations (using convential designations) .
- Groundlevel elevation contours .
- The map coverage should extend slightly beyond the area covered by the exposure cylinders .
- Size : 8 1/2 " x l I " .

- 1 7 1 -
ATTACHMENT B
EXPOSURE CYLINDERS
This type of survey is conducted by the Department o f the
Environment, Pollution Control Division and the gas plant or field
operators in the vicinity of all sour gas plants or oil fields . It is a continuous type of survey in that the hydrogen sulfide and total
sulfation cylinders report would be considered a monthly average
pollution figure as they are exposed for approximately a one month
period (weather permitting ) before they are replaced . This type of
survey provides the Department with an invaluable source of information
as it is a rough indication of the trends in any given area .
In the case of sour gas plants the Department attempts to
set up the exposure stations before the plant goes on stream . I n
this way the inc��ase in pol lution over the previous ambient level can
be determined . It i s important to note that whe n the exposu�e cylinder
values are studied to determine the pollution trends , only two types
of valid comparisons can be made . Either each s tation i s considered
on its own or the yearly averages of all stations in the area are com
pared . As ea�h area has its own unique meteorological conditions and .
sources and each cylinder is located in its own unique topography , the
reported values are also unique . It must also be remembered that there
is a general seasonal variance with the values being highest i n the
winter and lowest during the summer .
There i s no maximum allowable concentration as such for the
total sulfation or hydrogen sulfide cylinders , however , most of the
reported values from the total sulfation cylinders are less than 0 . 3 S03

- 172 -
equivalent mg . /day/100 sq. em . and for the hydrogen sulfide cylinders
are less than 0 . 05 S03
equivalent mg . /day/100 sq. em . The readings
in any given month are considered to be significant when they deviate
from what is considered to be norm o f the station for the time considere d .
A s the total sulfation cylinders also react with H2S , i t is
advisable , for the sake of comparing the total sulfation and hydrogen
sulfide cylinder results , to report both results in the same units .
The most common units are S03
equivalent mg ./day/lOO sq . em .
There is no relationship between units of S03
equivalent and
parts per million (ppm) . Although various studies have been made it
is impossible to relate these two unles s the concentration of sulphur
compounds is constant throughout the exposure period . This can be
accompl ished in the laboratory but it never occurs as an actual situation •
As an example , a cylinder exposed to a low S02
concentration for one month
can have the same final reading as a cylinder which i s exposed to a
relatively high concentration for five days .
The exposure cylinder survey was developed in 1932 at the
Building Research Station in England . Details of the original instru
ment and developmental investigations are described in a booklet entitled
' The Investigation of Atmospheric Pollution ' , Fuel Research S tation, 1 948 .
This type of survey is carried out by exposing strips of lead
dioxide and zinc acetate to the atmosphere for a known period of time ,
generally one month . Sulphur dioxide and other sulphur compounds react
with Pb02
to form PbS04
while hydrogen sulfide reacts with Zn (C2
H3
02
)2
to form ZnS .

- 173 -
The following facts have been established concerning the reaction
between lead peroxide and sulphur dioxide .l
1 . Both the reagent (lead peroxide ) and the products ( lead sul fate )
are insoluble in water .
2 . The yield of lead sulfate is proportional to the concentration of
sulphur dioxide for all concentrations up to one part per thousand .
3 . When air containing a constant proportion o f sulphur dioxide is
blown slowly past a test surface o f lead peroxide , the reaction
goes at a constant rate until more than 15% of the lead peroxide
has been converted . In this case the resulting reading i s approxi-
2 mately 1 3 mg . 5°
3/100 em . /day .
4 . The reactivity is not significantly dependent on wind speed under
the following test conditions :
Conc . of 502
{ppm}
30 - 700
1 - 6
1
Wind Speed (mph)
. 067 - . 67
3 . 3 -20 . 1
. 33 -17 . 9
•
5 . The reactivity increases 1 % for a temperature increase o f 1 2 . 5 °F .
6 . There i s no �ignificant.correlation with relative humidity .
7 . The reactivity increases when the lead peroxide surface is wet.
8 . Different batches of lead peroxide can have different reactivity .
Although no article discussing the reaction of hydrogen sulfide
and zinc acetate could be located , the following facts were found con
cerning the reaction of lead acetate and hydrogen sulfide .2
As both

- 174 -
chemicals are used for H2
S detections it is felt that the following
general statements may be true for each reaction :
1 . The reaction rate increases significantly with increased air turbulence .
2 . Variations in relative humidity between 57% and 97% have no affect
on the rate of reaction .
3 . Methyl mercaptan, dimethyl sulfide and dimethyl disulfide in
concentrations much higher than normally present in the outdoor atmos
phere , had no significant effect on the rate of reaction.
References :
1 . 'Measurement of Sulphur Dioxide with Lead Peroxide Instrument ' ,
Department of Scientific and Industrial Research, 1948 .
2 . E . F . Galardi and R .M . Manganell i , Laboratory Study of Lead Acetate
Tile Method for the Quantitative Measurement at Low Concentrations
of Hydrogen Sulfide - Journal of Air Pollution Control Assoc .
13 : 305-309 (1963 ) .
3 . S . F . Liang, . C .V . Sternling and T .R . Galloway , Evaluation of the
Effectiveness of the Lead Peroxide Me thod for Atmospheric
Monitoring of Sulphur Dioxide - Journal of Air Pollution Control
Association. Vol . 23 , No . 7 : 605 - 607 ( 1973 ) .

ATTACHMENT C
- 175
MONTHLY REPORT OF PLANT AND AIR MONITORING DATA
PLANT LOCATION: _________________________ OPERATOR;
MONTH OF : _______ 19. __ _
1 . EXPOSURE CYLINDER RESULTS
Station No .
Station No .
Station No.
Station No .
Station No .
Station No .
Station No .
Station No .
Station No .
Station No .
Station No .
Station No .
Station No .
Station No.
Station No .
Station No .
station No .
Station No .
Station No .
Station No .
TOtal Hydrogen Sulphation Sulphide
S03
equiv . mg ./day/100 sq.
1
2
l
4
S
6
7
S
9
1 0
11
12
13
14
15
16
17
18
19
20
em .
Station No .
Station No .
Station No .
Station No .
Station No.
Station No .
Station No .
Station No .
Station No .
Station No .
Station No .
Station No .
Station No.
station No .
station No .
Station No .
station No .
Station No .
Station No .
Station No .
Total Hydrogen Sulphation Sulphide
S03
equiv. mg./day/100 sq . em.
21
22
23
24
25
26
27
28
29
30
31
32
33
34
35
36
37
38
39
4 0
An explanation o f high exposure cyl inder results (such a s abnormal plant or field operations , their persistence and rectification) shall be attached . For the purpose of this comparison , a high exposure cylinder reading shall he deemed a hydrogen sulphide level greater than 0 . 10 503 equiv . mg . /day/100 sq . cm . and a total sUlphation level in excess of 0 . 5 0 S03 equiv . mg . /day/100 sq . cm. (NOTE : These values are guidel ines for comparison only and are not intended
to serve as ambient air quality standard s ) .

- 176 -
2. SULPHUR DUSTFALL CYLINDERS :
Short tons s/sg. mi ./30 days
Station No . 1
Station No. 2
Station No. 3
Station No . 4
Station No . S
Station No . 6
A'l'TACBMEN'l' D
Short tons S/sg. md. .f30 days
Station No . 7
Station No . S
Station No . g
Station No . 10
Station No . 11
Station No . 12
The location of the sulphur dustfall cylinders as numbered here shall
be indicated on the attached map of the plant area .

- 177 -
ATTACHMENT E
DEPARTMENT OF THE ENVIRONMENT POLLUTION CONTROL DIVISION
LABORATORY
January 14 , 1972
DETERMINATION OF TOTAL SULPHUR IN DUSTFALL SAMPLES
USING LECO INDUCTION FURNACE AND SULPHUR TITRATOR
1 . Principle
The analysis proceeds according to the foll.owing equation :
KI03
+ 5 KI + 6 HCl = 6 KCl + 3 I,.
S02
+ 12
+ 2 H2
0 = H2
S04
+ 2 HI
Thus , a weak HCl solution is put into a titration vessel : KI and
starch solutions are added . Then , when a very small amount of the
standard K103
solution is added , free 12 is released indicated by
the starch turning blue . An automatic buret containing the KI03
i s
then refilled to the zero o r starting point . The sample under test
is next combusted in oxygen where the sulphur in the sample goes to
S02
and/or S03
depending on the combustion conditions , though only
S02
is titrated with the iodometric method . S02
from the burning
sample is conducted to the titration vessel where it reacts with the
free iodine and ties it up as a compound , HI . Since starch turns
blue only in the presence o f free iodine , and not when the iodine i s
i n compound form , the starch turns colorless . More KI03
i s added to
form more free iodine and to bring the solution back to its original
color . This. is repeated in a continuous manner until all the S02
is out of the sample and has been titrated • .

I
- 178 -
2 . Apparatus and Equipment
Leco Induction Furnace (Fisher 12-15 3 )
Leco Sulphur Titrator (Fisher 1 2-156 )
Crucibles , Leco (Fisher 12-186-8 )
Covers , Porous , Leco (Fisher 1 2-187-4)
Combustion Accelerator , Granular Tin , Metal , Leco (Fisher 12-173-5 )
Accelerator , Analyzed Iron Chip, Leco (Fisher 12-174-5)
Scoop , Accelerator , Leco (Fisher 1 2 -192-5 )
3 . Reagents
(a) Dissolve 6 g . Potassium Iodide (KI ) in 200 m . distilled water .
(b) 0 . 25% starch - potato . Dissolve starch in 200 ml . distilled
cold water . Bring 800 m . distilled water to boil . Add
200 mI . starch suspension in small portions allowing time to
dissolve , cool and add potassium iodide .
(c ) Dissolve 0 . 444 g . potassium iodate (KI03
) in one liter distilled
water .
(d) Dissolve 15 mI . conc . HCl and 2 g. sodium azide (NaN3
) in one
liter distilled water .
4 . Procedure
(a) Filter total dustfall sample or aliquot through a Gooch crucible
using Reeve-Angel Glass Fiber filter (Fisher 9-873A) .
(b) Place into Leco crucible in the following order :
1 scoop Sn (accelerator ) . filter containing sample , 2 scoops Fe (accellerator , 1 Cu ring (accelerator) .

i .
- 179 -
(c ) Fill Leco titration cell with :
5 ml . starch solution ,
0 . 015 mI . KI03
solution from buret .
Bring volume in cell to mesh by adding HCl/NaN3
solution .
(d ) Set the meter needle arbitrarily , with the blue color in the
titration cel l .
( e ) Place the crucible containing the sample into the Leco furnace .
Set Grid Tap switch to High and put igniter on .
(f) Titrate by hand . Titration is ended when the meter needle is
brought back to its original setting .
(g ) Apply a continuous stream of oxygen during the total time o f
analyzis a t a flow rate of approximately 1 liter/minute ,
through the pipe provided on the sample holder of the furnace .
(h) Set up a calibration curve using sulphur of highest purity and
plot milliters of used KI03
solution versus microgram sulphur .
Place always a blank filter inthe crucible since it contains
sulphur compounds as impuritie s .
Reference : 1 . A . S . T .M . method E30-47
2 . Instruction Manual for Operation o f Leco Sulphur
Determinators Models 517 , 518 , 5 3 2 . Laboratory
Equipment Corporation , Saint Joseph , Michigan .
Form No . l33A .

- 180 -
ATTACHMENT F - 1
CONSTRUCTION AND MAINTENANCE OF DUSTFALL CYLINDERS
In the construction of particulate fallout stations the
Department utilizes open top 48 oz . fruit j uice tins fitted with open
top polyethylene j uice containers . The tin cylinder i s fastened to a
I " diameter , 3 foot long steel pipe and this assembly i s then fastened
to a fence post or other support by means o f steel wire strapping .
The top of the dustfall container should be a least 6 to 8 feet above
ground level and at least 4 feet above any other surface such as a
roof . Once selected , a site should be maintained unle s s conditions ·
occur to cause undue influence on the sample or to create an unsatis
factory condition . During warm weather 500 mls . o f distilled water ,
containing at least 2 ppm by volume o f a 1 % solution of Dowicide ' B '
or quatenary ammonia to inhibit algae growth , i s added to each polye
thylene cylinder . Duri�g cold weather the cylinder i s exposed dry as
almost any aqueous sol.ution will freeze and other solutions may inter
fere with the analysis . A sampling period should be one calendar month
corrected to 30 days . An allowance of plus or minus 2 days i s permitted
in setting out and/or col lecting the polyethylene sampling cylinders .
When servicing the fallout stations the exposed polyetheylene cylinder
i s simply replaced by a freshly prepared polyethylene cylinder . The ex
posed cylinders should be properly covered during transfer to avoid the
possibility of extraneous material pickup during transit . Any extraneous
material that may be present shall be removed by means o f a chemically

- 181 -
inert 20 mesh screen . The presence of small insects may require the
use of a screen smaller than 20 mesh . The oversize material should be
examined to avoid removing material that is properly a portion of the
sample . Inspections of field cylinders should be made during periods
of heavy rainfall to prevent their overflow and they should be replaced
if they are apt to overflow . If bird droppings become a problem , we
suggest the use o f a bird ring around the container to provide a perch
at a distance .

182 -
r.mSTl"ALI. STJl.TION
48 ounce plastic juice ___________ 11": ---. dispenser
. . .. . 48 ounce juice
3/4 inch qal vanized ------"� .. �.:--. _ • .-,:". -::.-' anchor strap
1/2 inch steel pipe ------; .. �I
3/4 inch 'J'�l·!'1'l"ni.?;ed anchor
Post-------____________ ��
Ground Level
ATTACHMENT F - 2
( /
__ v __ I I I , I

- 183 -ATTACHMENT G - 1
AIR MONITORING INSTRUMENTATION DATA
MONTH of _______
19
SULPHUR DIOXIDE :
1 . Make and Model of instrument used :
2 . Minimal Detectable limit and precision o f instrument ____________________ __
hours " 3 . Hours that instrument was operational ------....,; --------
4 . Instrument was calibrated on 19 -------------------
by the _________________________________________ method .
5 . Instrumentation difficulties , if any :
HYDROGEN SULPHIDE :
1 . Make and model of instrument used :
2 . Hours that instrument was operational _____________ hours
3 . - Instrumentation difficulties , if any :
WIND SPEED AND DIRECTION :
1 . Make and model of instrument used :
2 � Hours that instrument was operational ___________________________________ __
Direction hours ------...,; "
-----
Speed _______ hours . " -----
3 . Instrumentation difficulties , if any :

- 184 -
SUMMARY TABLE
LOCATION ; _____________________________________ PERIOD : ________________________ __
__________________________ �mi1es ____________________________ -'p1ant site .
WINDS , Most Frequent Direction Percentage Velocity (mph)
1
2
3
Average wind speed : ____ mph .
HYDROGEN SULPHIDE :
sampler Operating __________ _ hrs . , H2S Detected _____________________ __ brs . ,
Max. 1/2 hr. average ___ ppm on ___ _ 19 -' brs ; wind
Max . 1 hr . average ___ ppm on _____ _ 19 -' bra , wind
Max. 24 hr. average ___ ppm on ____ _ 19 -' brs , wind
MAJOR WIND CORRELATIONS :
__________ ' of readings recorded with _________ winds .
_______ ' of readings recorded with _______ winds .
________ ' of ______ Winds resulted in readings .
________ ' of _______ winds resulted in readings .
SULPHUR DIOXIDE :
sampler Operating hra . ---------
,
S02 Detected brs . -------,
Max . 1/2 hr. average ppm on 19 --' hrs,
Max . 1 hr. average ppm on 19 ---' hra ,
Max. 24 hr . average ppm on 19 --' brs,
MAJOR WIND CORRELATIONS :
_______ ' of readings recorded with _______ w.inds .
_______ ' of readings recorded with ______ ....;winds .
_______ ' of _______ winds resulted in readings .
_______ ' of _______ winds resulted in readings .
wind j -'
i wind j
wind -

PERIOD
LOCATION
N W -
s w . ..... · -,......-
- 185 -
WIND ROSE
N _.--
s __ _
Calm or Light Variable _____ %
Average Wind Speed mph
ATTACHMENT G - 3
__ N t
--" S E
Average Wind Speed mph is shown at the Outer Circle .
E "

- 186 -
ATTAC�ENT G - 4
SULPHUR DIOXIDE IN PPM
LOCATION : ___________ PERIOD ______ 19 TO ________ 19
PEAK CONCENTRATIONS EXCEEDING 0 . 10 ppm and AVERAGE CONCENTRATIONS EXCEEDING 0 . 05 ppm FOR 1 5 MINUTES
OAY DATE
MO
1 5 1
SAMPLE RANGE PPM
. 000
. 000 - . 029
. 030 - . 05 9
. 060 - . 099
. 1 00 - . 169
. 17 0 - . 199
. 200 - . 499
. 500 - . 999
1 . 0 +
YR .
72
TIME INTERVAL FROM TO
1740 1743
DURATION MINUTES
3 ( example )
TOTAL TIME OF RECORD
1 361
102
0
Example 1
0
0
0
a
PEAK
0 . 100
FREQUENCY OF OCCURRENCE
92 . 96
6 . 97
0 . 00
0 . 07
0 . 00
0 . 00
0 . 00
0 . 00
AVE .
0 . 05 0
WIND VEL . DIR.
6 sw
CUM FREQUENCY OF OCCURRENCE
92 . 96
99. 93
9 9 . 93
1 00 . 00
100 . 00
100 . 00
100. 00
100 . 00

- 187 -
ATTAC�ENT G - 5
HYDROGEN SULPHIDE IN PPM
. LOCATION : ______________ PERIOD _______ .19 TO _____ ...,. 19
VALUES LISTED ARE THOSE GREATE� THAN 0 . 003
DAY
15
DATE MO . YR .
7 73
T IME INTERVAL FROM TO
1 2 :)0 1230
example
CONe . PPM
0 . 020
WIND VEL. DIR .
6 SW

Date 1
1 2
3
4
5
6
7 8
9
10 11 12 13
14
15
16
17
18
19
20
21
2 2
2 3
24
25
26
27
28
29
30 31
Mean Cone .
PLANT LOCATION __________ _
1/2 HOUR AVERAGE S02 CONCENTRATIONS (PPM)
. .
AHACHMENT G - 6
MONTH OF 19 __ _
..
DAILY 2 3 4 5 6 7 8 9 10 11 12 13 14 15 16 17 18 19 20 21 22 23 24 AVERAGE
...... 00 00 I

- 189 -
THE INDUSTRY -GOVERNMENT SOUR GAS
ENVIRONMENTAL COMMITTEE
by
J. G . Gainer, Gulf Oil Canada Limited , Calgary
Abstract
This committee provides a forum for candid discussion of
criteria and guidelines for certain environmental impacts of sour gas
plants . It is chaired by the assistant deputy minister o f the Alberta
Department of the Environment and includes representatives of that
department and of the Energy Resources Conservation Board . There are
8 representatives of the industry ; resource people are occasionally
invited .
Obj ectives include :
1 . minimize S02 emissions .
2 . gain public acceptance o f the industry.
3 . meet ambient air quality standards .
4 . review design flexibility and technical feasibility.
5 . review the economics and the total resource budget .
(Editor)

- 190 -
BRIEF OUTLINE OF THE WHITECOURT AREA ENVIRONMENTAL STUDY GROUP
by
E . M. Baraniuk, Amoco Canada Petroleum Company Limited , Calgary
Abstract
The Whitecourt area includes 12 sour gas processing plants ,
together emitting 2200 long tons of Sulfur per day, or 1/3 of the total
for Alberta. Increasing concern for environmental impacts led the
plant operators to pool resources in a cooperative study group . Sur
veillance and research are contracted to a consulting firm with fifty
percent funding from government . The principle questions investigated
are cross-influences among the plants , cumulative effects on the area
as a whole , and possible pre-conditioning to other environmental stresses .
(Editor)

- 191 -
FUTURE FINANCING OF SULFUR GAS RESEARCH
by
S . B . Smith, Research Secretariat , Alberta Department of Environment ,
Edmonton
Abstract
Sulfur gas research in Alberta is heavily funded through
direct grants by the Research Secretariat of the Alberta Department
of the Environment . Other proj ects are funded by the Alberta
Environmental Research Trust , which is administered partly through
the Research Secretariat .
The general purposes of the Research Secretariat are to
promote investigations of man-induced change in environmental
systems , through funding and coordination. It does no in-house
research.
(Editor)

- 192 -
SUMMARY OF CLOSING DISCUSSION
Following some technical discussion among small groups o f participants , a general discussion led to consensus on the follawing points .
1 . Useful contacts had been initiated " among agencies .
2 . Individuals with closely related projects were glad of the opportunity to exchange views and results .
3 . Individuals with very different projects , but related to the same problem area , were glad to meet , l isten to and discuss with each other .
4 . Participants welcomed the offices of the Alberta Department of Environment , Research Secretariat , in funding research and in building towards a clearing house for environmental research projects .
5 . The meeting noted the kind offer of Professor Gordon Hodgson to host a further meeting in approximately one year ' s time , or as required ; and requested Dr . Stu Smith to act on it according to his perception of the needs of researchers .
6 . Dr . Frank Webb informed participants o f a forthcoming National Research Council publication with the following proposed chapter headings .
1) Total Canadian sulfur balance
2) Effects of sulfur on plants in Canada
3) Effects of sulfur on soils in Canada
4) Sulfur in plants and soils in Alberta
5 ) Effects of sulfur on water and fish
6) Effects of sulfur on human health
7 ) Effects of sulfur on animals
8) Effects of sulfur on building materials
9 ) Meteorological considerations
10) Criteria digest

Dr. Ka1id Aziz
Dr . J . Baker
Mr . E . M. Baraniuk
Dr. Charles Bird
Mr . R. A. B1aue1
Mr . V.E . Bohme
Mr . F.E . Burbidge
Mr . G. W. Cameron
Mr . J.W. Case
Mr . Gerry Gainer
Dr . Paul Gorham
- 193 -
PARTICIPANTS ' NAMES & ADDRESSES
Faculty of Engineering Department of Chemical Engineering University of Calgary Calgary , Alberta
Canadian Forestry Service Northern Forest Research Centre , 5320-12 2 S t . Edmonton, Alberta T6H 3S5
Chairman, Whitecourt Environmental S tudy Group Amoco Canada Petroleum Company Limited Benta11 Building 444 - 7th Avenue , S . W. Calgary , Alberta
Department of Biology University of Calgary Calgary , Alberta
Canadian Forestry Service Northern Forest Research Centre , 5320-122 S t . Edmonton, Alberta T6H 3 S5
Energy Resources Conservation Board 603 - 6th Avenue , S .W . Calgary , Alberta
Acting Of£icer-in-Charge Arctic Weather Central Canada Atmospheric Environment Service Box 9860 Edmonton, Alberta
General Manager Independent Petroleum Assoc . of Canada Room 436 , 700 - 6th Avenue , S .W. Calgary , l�berta T2P OT8
Department of , Biology University of Calgary Calgary , Alberta
c/o Gulf Oil Canada Ltd . 707 - 7th Avenue, S .W. Calg�ry , Alberta
Chairman , Depart�ent of Botany University of Alberta Edmonton, Alberta

Dr. Drake Hocking
Prof . Gordon Hodgson
Dr. J . B . Hyne
Mr . Julian Kinisky
Dr . Roger Klennn
Prof . Roy Krouse
Mr . Jerry Lack
Dr . Alan Legge
Dr . A.A. Loman
Mr . J .A. Love
Mr. G. H. Maduram
Dr. M. F. Mohtadi
- 194 -
Canadian Forestry Service Northern Forest Research Centre , 5320-122 S t . Edmonton , Alberta T6H 3 S5
Director Environmental Sciences Centre University o f Calgary Calgary , Alberta
Dean, Faculty of Arts and Science Department of Chemistry University of Calgary Calgary , Alberta
Environment Conservation Authority 8th Floor , 9912 - 107 Street Edmonton, Alberta " ....
. �r
Research Council of Alberta 11315 - 87 Avenue Edmonton, Alberta
Department of Physics University of Calgary Calgary , Alberta
Pollution Control Division Alberta Department of the Environment 10040 - 104 Street Edmonton, Alberta
Environmental Sciences Centre University of Calgary Calgary , Alberta
Research Scientist E . R. A. Sciences Ltd . P . O. Box 3444 , Station B Calgary , Alberta
McKinnon, Allan & Associates 631 - 42nd Ave . , S . E . Calgary , Alberta
Alberta Forest Service Land Use Branch Natural Resources Building Edmonton, Alberta .
Faculty of Engineering Department of Chemical Engineering University of Calgary Calgary , Alberta

Mr . James Na1bach
Dr . M. Nyborg
Mr. Michael Raymont
Mr . Joe Lukacs , Mr . R . P . Rankine
and Dr . Douglas Leahey
Dr . W. J . Rennie
Dr . Richard Rowe
Dr . H . S . Sandhu
Dr . S . B . Smith
Dr . D .H . Vitt
Observers :
Dr. W. G. Bowen
Dr . D . R. Muir
- 195 -
Chairman, Athabasca Tar Sands Environmental Study Group
c/o Syncrude Canada Ltd . 807 Baker Centre Edmonton, Alberta
Department of Soil Science University of Alberta Edmonton, A1ber�a
Department of Chemistry University of Calgary Calgary , Alberta
Western Research & Development Ltd. 9 32 , 700 - 6th Ave . S .W. Calgary , Alberta T2P OT8
Department of Chemistry University of Calgary Calgary , Alberta
Department of Chemical Engineering University of Calgary Calgary , Alberta
Department of Chemistry University of Alberta Edmonton, Alberta
Research Secretariat Alberta Department of the Environment Edmonton , Alberta
Department of Botany University of Alberta Edmonton, Alberta
Assistant Deputy Minister Department of Mines , Resources and Environmental
Management Government of Manitoba Winnipeg, Manitoba
Sulphur Development Institute , Canada 830 Bow Valley Square , 202 - 6th Ave . , S .W. Calgary , Alberta

Mr. R. R. Sentis
Mr. D . R. Shaw
Mr . Hennie Veldhuizen and
Mr. Asit Hazra
Dr. F .E . Webb
- 196 -
Director Air Pollution Control Branch Department of Environment Government of Saskatchewan Regina , Saskatchewan
Chief Chemist Energy Resources Conservation Board Department of Mines and Minerals University of Alberta Edmonton, Alberta
Environmental Protection Service , Environment Canada 10025 - Jasper Avenue Edmonton, Alberta
Senior Staff Officer Canadian Forestry Service Ottawa , Ontario