proceedings of the 2013 international aarst symposium
TRANSCRIPT

PROCEEDINGS OF THE 2013 INTERNATIONAL AARST SYMPOSIUM
September 22-25, 2013
Springfield, IL
Contents herein are copyrighted by AARST©2013
Peter Hendrick, Executive Director [email protected]
Shawn Price, President [email protected]
Editorial Board James F. Burkhart, PhD, Editor [email protected]
William Brodhead [email protected]
Andreus George [email protected] Gary Hodgden [email protected]
Phil Jenkins [email protected]
Leo Moorman [email protected]
Dan Steck [email protected] Dave Wilson [email protected]

Proceedings
2013 American Association of Radon Scientists and Technologists International Symposium
Springfield, IL, September 22-25, 2013
Table of Contents
TESTING FOUNDATION TYPES DURING RADON SCREENING AND ITS IMPLICATIONS FOR CLIENT SAFETY AND MITIGATION Wallace O. Dorsey Jr., Radon-Ease Inc. ADVANCED CALIBRATION EQUATIONS FOR E-PERM® ELECTRET ION CHAMBERS Paul Kotrappa, Alexandra Stieff and Frederick Stieff POTENTIAL RADON RELEASE DURING FRACKING IN COLORADO James Burkhart, Thomas Huber, and George Bolling APPLYING DYNAMIC CONTROLS AND REMOTE MONITORING TO RADON MITIGATION SYSTEMS TO ADVANCE ENERGY CONSERVATION AND THE STABILIZATION OF INDOOR RADON CONCENTRATIONS Thomas E. Hatton and Daniel J. Nuzzetti MEASUREMENT OF THORON AND ITS PROGENY IN TRADITIONAL AND MODERN EARTHEN BUILDINGS IN GERMANY: METHODOLOGY AND RESULTS Oliver Meisenberg, Stefanie Gierl and Jochen Tschiersch IMPACT OF THE NEW BSS IN THE SPANISH RADON PROGRAM Luis S. Quindos Poncela, Carlos Sainz Fernandez, Jose-Luis Gutierrez Villanueva and Ismael Fuente Merino SUPER MOON 2012 SHEDS LIGHT ON RADON GAS MIGRATION: A Case Study of Environmental Influences On A Residential Radon Test Mark H. Whitehead RADON RISK COMMUNICATION STRATEGIES: A REGIONAL STORY Winnie Cheng

TESTING FOUNDATION TYPES DURING RADON SCREENING AND ITS IMPLICATIONS FOR CLIENT SAFETY AND MITIGATION
Wallace O. Dorsey Jr., Radon-Ease Inc.
Richmond, VA USA
Email [email protected]
Abstract
Many homes have multiple methods of attachment to the earth; e.g., crawl space, slab and sometimes multiples of each. Testing the living space above each of the areas is similar to testing a different home. When testing each area independently, one finds varying radon levels in each area, often substantially so. Sometimes the most elevated readings are in areas other than the basement, such as the living space above the crawl space. Here are described and quantified those differences and the importance of discovering those differences in the initial screening process, potentially protecting clients’ health and reducing liability from future lawsuits.
Introduction
Here, using several examples of tested, and subsequently mitigated, single-family, detached homes, are demonstrated the need to test each area of a building that has different or multiple means of contact with the earth during the radon screening process. Testing was conducted using continuous radon monitors (CRMs). The buildings and homes covered a broad region topographically and geologically across Central Virginia. The geology ranged, from heavy, dense clay soils, to sandy soils and areas of heavily decayed rock and rocky outcroppings. Various construction techniques, e.g., crawl spaces, conditioned crawl spaces, concrete slabs and basements, are reviewed.
This discussion indicates the need to reevaluate the EPA’s guidance to test only the lowest lived- in level of a structure during the screening process and furthermore indicates the need to consider instituting the guidance that all ground-contact areas of a structure should be tested during the initial screening process in order to better protect the inhabitants from exposure to radon. Additionally it demonstrates the need by both commercial and residential lenders to have their own testing protocols modified to match the ANSI/AARST Testing and Mitigation Protocols during Phase 1 Environmental Site Assessments and routine lender-driven residential radon testing due to the random nature of radon. Radon is not something that was installed into a structure by man and therefore cannot be accurately assessed by doing minimal random assessments as is done for lead, asbestos and other similarly introduced man-made contaminants.
1

Methods of deployment
CRM devices were placed typically one per different method of the structure’s attachment to the
earth. If multiple slab pours, separated by footers and/or fire walls, or additional crawl spaces were observed that resulted from additions to a home or other structure, then an additional CRM device was placed in each of these areas. This leads to a much better understanding of the potential for elevated radon levels throughout a structure than does the EPA’s guidance of one
device, or one pair of devices, placed in the lowest lived-in level of the home, in many cases illuminating extraordinarily elevated radon levels in areas that wouldn’t have been discovered using that guidance.
2

Example # 1
Real estate transaction. CRM test. 1930s single-family detached residence with multiple slabs, basement and multiple concrete floored crawl spaces of commercial grade construction. Four CRMs were used. Initial tests showed readings that varied from 2 pCi/L in a slab-on-grade sun room, 13 pCi/L in the basement, 6 pCi/L in a formal living room that was slab-on-grade to 18 pCi/L in a multifunction family/dining/kitchen area that was the family’s gathering center for home work/video games/TV and computer usage. On all visitations to the home the family was congregated in that area on the sofas and chairs dispersed throughout the area. The multifunction area was over a crawl space that had a 4-inch concrete slab poured in it and also had the highest radon levels discovered in the home at 18 pCi/L. Mitigation was performed in the basement and the crawl spaces and reduced the basement levels to 3 pCi/L, the slab-on-grade formal living room to 2 pCi/L and the multifunction area to 5.5 pCi/L. Subsequent testing yielded similar results. Further mitigation was conducted in the multifunction area over the crawl space which then reduced the radon levels to less than 1 pCi/L in all living areas.
Top View
Front View
Multifunction Area over crawl space with poured concrete floor
18 pCi/L
Kitchen
Basement
13 pCi/L
Crawl space/ Formal living room
6 pCi/L
Crawl Space Den
Multifunction area over crawl space with poured concrete floor
18 pCi/L
Crawl space/ Formal living room
6 pCi/L
Grade Level
Slab on Grade Sun/Family Room
2 pCi/L
Sun/Family Room
Slab on Grade
2 pCi/L
3

Example 2
Test requested by homeowner. CRM Test. Three monitors deployed. 1960s single-family detached residence with a basement and two slabs over a crawl space. The basement results were <1 pCi/L, and an office that was a room with a slab over a crawl space was also <1 pCi/L. The sun/family room was the family gathering area, nicely furnished and outfitted with HVAC, television and computer station. This room had test results of 11 pCi/L. The homeowner indicated the family spent the bulk of their indoor waking hours in the space doing homework, watching TV and computer gaming. Post-mitigation results were less than 1 pCi/L in the sun room as well as the rest of the home.
Top View
Front View
Sun/Family Room
Slab over Crawl Space
11 pCi/L
Basement Den/Family Room
< 1 pCi/L
Office
Slab over Crawl Space
< 1 pCi/L
Sun/Family Room
Slab over Crawl Space
11 pCi/L
Grade Level Basement Den/Family Room
<1 pCi/L
Office
Slab over Crawl Space
<1 pCi/L
4

Example 3
Real estate transaction. CRM test. Two monitors deployed. 1970s single-family detached home with crawl space, with a sun room that had a concrete slab over a crawl space. The family room over the crawl space yielded less than 1 pCi/L, sun/family room 7 pCi/L. The sun/family room was a nicely furnished, conditioned space with all of the crawl space vents open. It was once again the family’s focal point for gatherings. Post-mitigation results yielded less than 1 pCi/L in both tested areas.
Top View
End View
Crawl Space Home
< 1 pCi/L
Sun/Family Room
Slab over Crawl Space
7 pCi/L
Crawl Space Home
< 1 pCi/L
Grade Level
Sun/Fam Rm
Slab over Crawl Space
7 pCi/L
5

Example 4
Real estate transaction. CRM test. Four monitors deployed. 1940s single-family residence with three interconnected basements and a sun/family room with a crawl space. The home already had two radon mitigation systems in place on opposite ends of the basement treating the two “new”
basement additions; however, leaving the original core basement untreated, as was the sun/family room over the crawl space. The original home had one basement, subsequently another basement addition was added, then another at the opposite end of the home. The crawl space was added off of the back of the home as was a family/sun room. This was a focal point for family gatherings due to its extraordinary river views. The initial radon test yielded 2 pCi/L in a mitigated portion of the new basement, 1 pCi/L in a master bedroom that was over a new basement, 5.9 pCi/L in a den that was located in the original portion of the basement and 6 pCi/L in the sun/family room off of the back of the home over a crawl space with the foundation vents open. Subsequent mitigation was done in the original basement as well as the crawl space by tying one of the “new basement” mitigation systems to the old portion of the basement den as well as the crawl space. Post-mitigation testing showed results of < 1 pCi/L in all areas of the home.
Top View
End View
Grade Level
Mitigated “new basement”
2 pCi/L
(1 pCi/L in MBR above)
Nonmitigated original basement
Den
5+ pCi/L
Mitigated “new basement”
Family room/Audio room
2 pCi/L
3 interconnected basements
Middle Basement
5+ pCi/L
Sun/Family Room
“The Rivah Room”
6 pCi/L
6

Example 5
Test requested by homeowner. CRM test. Three monitors deployed. 1950s single-family residence comprised of a basement with a slab and a master bedroom addition over a crawl space. The basement was a utility room and teen hangout. The slab on grade was a garage converted into a very nice family room. The Crawl Space addition was a master bedroom and the “office” of the Realtor/Homeowner. The basement tested at >2 pCi/L. The slab-on-grade family room was also >2 pCi/L. The master bed room/office over the crawl space was >10 pCi/L.
Top View
Front View
Grade Level
MBR over Crawl Space
10+ pCi/L
Basement/Teenage Den
2 pCi/L
Family Room. Slab on Grade
2 pCi/L
MBR over
Crawl Space
10 pCi/L
Basement/ Teenage Den
2 pCi/L
Family Room Slab on Grade
2 pCi/L
7

Example 6
Real estate transaction. CRM Test. Two monitors deployed. 1950s single-family detached basement home with a slab over a crawl space that comprised a 5-year-old girl’s bedroom and the master bedroom. The basement test result was 5 pCi/L. The little girl’s slab-on-grade bedroom measured 157 pCi/L. This stunning difference in measurements prompted a second CRM test with duplicate monitors placed in each location. The subsequent testing yielded very similar results; 5 pCi/L in the basement and 161 pCi/L in the little girl’s bedroom. Post-mitigation results were <1 pCi/L in both areas. Had the EPA’s guidance been followed, the child would have been sleeping in a room with >150 pCi/L of radon.
Top View
End View
Grade Level
Basement Apartment
5 pCi/L
MBR and 5-year old’s Bedroom
Slab over Crawl Space
150+ pCi/L
Basement Apartment
5 pCi/L
MBR and 5-year-old’s Bedroom
Slab over Crawl Space
150+ pCi/L
8

CONCLUSIONS
In all but one of the examples given, had the EPA’s guidance of testing the lowest lived-in level been followed the most elevated radon concentrations would have been missed. In all of the examples given, the highest radon levels found were in the most frequently and consistently occupied spaces, not the basement or lowest lived-in levels. In the example that fell within the EPA’s guidance of testing the lowest lived-in level the basement would have been mitigated leaving the families principal gathering still harboring radon levels >4 pCi/L.
With the exception of the Example 6, these data came from one quarter year of radon testing. This does not include the homes that had to be mitigated in multiple areas, with multiple areas of contact with the earth, that were all above the 4-pCi/L action level, and all needed to be mitigated. In how many homes have we collectively tested the lowest living level only, or only one area, when the home had many foundations or foundation types? How many families have we left in harm’s way due to this misguided guidance?
9
ADVANCED CALIBRATION EQUATIONS FOR E-PERM® ELECTRET ION CHAMBERS
Paul Kotrappa, Alexandra Stieff and Frederick Stieff (1)
Rad Elec Inc 5716-A Industry Lane Frederick, MD 21704 [email protected]
Abstract
The E-PERM® Electret Ion Chambers (EICs) have been widely used for research in indoor and outdoor radon measurements. Calibration factors are not constants because of the continuously decreasing nature of electret voltages during the measurement. Calibration factors are fitted to an equation that relates the calibration factors to the initial and final voltages. The calibration equations currently in use restrict the use of electrets to the initial readings of 750-250 volts. Recent research indicated that it is possible to derive the calibration equations applicable for wider ranges. A detailed procedure is described for calibrating SST EICs and deriving an appropriate equation, applicable over the range of 750 volts to 70 volts. Furthermore, the newly derived equation fits the experimental data with better precision, compared to the currently used equations.
(1) The authors are the developers of E-PERM® electret ion chambers , and have commercial interest, for which these advanced calibration equations are further developed.
10

Introduction
A detailed publication (Kotrappa, 1990) on the topic of calibration of EICs describes the theory and functioning of the current versions of EICs. An EIC consists of a chamber with filtered inlets that has been loaded with an electret. As radon gas enters the chamber the radon and the decay products formed inside the chamber emit alpha radiation, which in turn generates ions in the air. Negative ions are collected on the positively charged surface of the electret. An EIC functions as an integrating ionization chamber, wherein the electret serves not only as the source of an electrostatic field, but also as the quantitative sensor. The drop in surface voltage of the electret over a known period of time is a measure of the time integrated ionization during that interval. Such data can be converted readily into radon concentration in air. The conversion factors depend upon the thickness of the electret, the volume of the chamber and the exposure period. Typically, the chamber volumes range from 53 ml (L), 210ml (S) and 960 ml (H). The electret thicknesses are 0.156 cm (ST) and 0.0127 cm (LT). The design parameters are chosen depending upon the required sensitivity, dynamic range, and measurement periods. The most widely used EIC is the SST (S chamber with ST electret) type (210 ml chamber volume and 0.156 cm thick electret). It is generally used for a 2 to 7 day measurement. However, it can be used for a longer time when the radon concentration is relatively low or for shorter periods if the radon concentration is relatively higher. The current work deals with the calibration procedures for this type of EIC. However, the procedure is equally applicable to EICs with any other combination of electret and chamber size.
Calibration procedure
Because of the continuously decreasing nature of the electret voltages during a measurement, the calibration factors are not constants and depend upon the initial and final voltages of electrets. Calibration factors are fitted to an equation that relates the calibration factors to the initial and final voltages. The calibration procedure used in this work is similar to that described in an earlier paper (Kotrappa, 1990). The availability of a very well characterized radon test chamber (Kotrappa, 1990) improved the quality of the measurements. Uniformity of radon concentration over the entire testing zone inside the chamber was checked to be within 5% of the average concentration. The test chamber was continuously monitored by a set of calibrated continuous radon monitors and a set of passive monitors. Nine sets of five EICs were prepared for radon measurement. The first set had an initial reading of approximately 750 volts and the successive electrets were with the initial volts of 700, 650, 550, 450, 350, 250, 150, and 70 respectively. All the units were turned to the “on” position and placed inside the radon test chamber at the same time. This was the starting time of the exposure. In approximately three days, all 45 EICs were taken out of the radon test chamber and returned to the “off” position. The average radon concentration (pCi/L) and exposure period were recorded. The electrets of each of the EICs were measured using an appropriate electret reader. These readings were used in conjunction with the initial readings and other parameters to calculate calibration factors using equation 1. Table 1 gives the data obtained during the calibration run. Column 6 is the midpoint voltage (MPV) between the corresponding initial and final
11

voltages. Calibration factors (CF) are calculated for each EIC in a subset using equation 1. An average CF is calculated for each subset and an average midpoint voltage (MPV) is calculated for each subset. This leads to a set of nine calibration factors corresponding to a set of nine MPVs.
BGCFT
FVIVRnC
)()(
)( Equation 1
Where:
RnC is the average radon concentration in the radon test chamber (15.8 pCi/L)
T is the exposure period in days (2.96 days)
IV and FV are the initial and final voltages respectively
CF is the calibration factor in volts per (pCi/L-days)
BG is 0.59 pCi/L. This is obtained by multiplying the gamma radiation level (6.8 µR/h)
by 0.087. The constant 0.087 is the radon concentration (pCi/L) equivalent for 1 µR/h.
Fitting an appropriate equation to the experimental data
Research indicated that a linear regression fit between the experimentally measured calibration factors and the natural logarithm of MPV gave the best fit, with an excellent correlation coefficient of 0.9910. The derived equation is given by equation 2. CF = 0.1318+0.2906 x LN (MPV) Equation 2
Where:
CF is the calibration factor in volts per (pCi/L days)
LN is the natural logarithm function
MPV is the midpoint voltage
The constants 0.1318 and 0.2906 are the derived constants from the calibration data (see Appendix A). Table 2 gives the summary data. Column 1 gives the MPV values, Column 2 is the measured CF, Column 3 gives the derived CF using the newly derived equation (equation 2) for CF, and Column 4 gives the percent deviation of the derived CF relative to the measured CF. Table 3 gives the data using currently used calibration equations, also referred to as the old equations. This is given to compare the improvement, if any, by using the new calibration equations. Column 1 gives the MPV values, Column 2 is the measured CF, Column 3 gives the derived CF using currently used (old) equations for CF, and Column 3 gives the % deviation relative to measured CF. Figure 1 is a graphical presentation of the comparison between the old and new calibration equation. This illustrates the advantages of the new calibration equation. Old (currently used) calibration
12

equations are valid only for MPV of greater than 200 volts, to provide a relative percent error of less than 5%. This is the reason for recommending the use of current (old) equations for electrets of greater than 200 volts, and electrets of less than 200 volts need to be replaced. The new calibration equations are more precise for the entire range with no such restrictions.
Discussions and conclusions
Table 1 gives the calibration data of different electrets with different starting voltages. These are grouped into nine sets of similar starting voltages. The last column gives the standard deviation within each set. The standard deviations are in the range of 3 to 5%, indicating consistent results expected for the radon test chamber used. Linear regression analysis is done between the experimental calibration factors and the natural logarithm of the MPV. The data used for linear regression analysis is in Table 1A (appendix A). A standard Microsoft Office program is used to generate the results.. Column 3 of Table 2 gives the calculated CF using the fitted equation 2. Column 4 gives the percent deviation of the fitted results relative to the experimental results. These range from 0.2 to 3 percent, indicating that equation 2 gives accurate calibration factors of less than 3% for the entire range of the MPV used in this study. Table 3 gives similar data when the old calibration equations are used on the same data sets. Column 1 gives the MPV values, Column 2 is the measured CF, Column 3 gives the derived CF using currently used (old) equations for CF, and Column 4 gives the percent deviation relative to measured CF. It is of interest to compare results in Table 2 and Table 3. The old equation fails to give acceptable CF values for MPV of less than 250 volts. But old equations, which are still being used, provide acceptable CF values for MPV of more than 250 volts. This is the reason that the recommendation accompanying the old equation says that electrets should be replaced when they drop below 200 volts. Such limitations do not apply when the new equation is used. One gets very good accuracy even at a MPV of 70 volts. It is interesting to compare the calibration procedure used in the earlier study ( Kotrappa, 1990) to the present study. Only 5 sets were used and the linear regression fit was between the average calibration factors and the average of MPV. The fitting was between the MPV of 218 to 643 volts. The reason for using a restricted range was that the linear regression was not fitting well outside this range. Such equations were applicable for midpoint voltages down to 200 volts, limiting the useful range of electrets from 750 to 250 volts. EICs are currently being used with this restriction in place. Additional research indicated that more rigorous equations can be derived to extend the useful range of EICs. The researched procedure was to perform a linear regression fit between the CF and the natural logarithm of the MPV. In the present work, nine groups were used with MPV ranging from 732 to 70 volts. A better characterized radon test chamber is used, compared to the test chamber used in the previous study. The results in the current work are a marked improvement and the useful range of electrets is extendable from 750 volts to 100 volts. Figure 1 also confirms an excellent agreement between experimental and fitted calibration factors. The method used in this study can be used for similar studies for other electret ion chambers.
13

References
1. Kotrappa, P., Dempsey, J.C., Ramsey, R.W. and Stieff, L.R. A practical E-PERM™ (electret passive environmental radon monitor) for indoor 222 Rn
measurements. Health Physics 58, 461-467, 1990. 2. Kotrappa, P and Stieff, F. One cubic meter NIST traceable radon test chamber.
Radiation Protection Dosimetry 128, 500-502 (2008)
14

Table 1 Calibration data for SST E-PERM® EIC Initial Final Voltage Midpoint Calibration Average STDEV Average % STDEV
Serial Volts Volts Drop Voltage Factor Midpoint of Average Calibration of AverageNo. No. (IV) (FV) MPV (CF) Voltage MPV Factor CF1 SGB227 780 684 96 732 1.9786012 SGB343 780 678 102 729 2.1022633 SGB437 783 684 99 733.5 2.0404324 SGB513 780 684 96 732 1.9786015 SFX703 779 685 94 732 1.93738 731.7 1.643168 2.0074554 0.064521
6 SGB673 748 650 98 699 2.0198227 SGB483 747 645 102 696 2.1022638 SGB687 747 645 102 696 2.1022639 SGB546 748 652 96 700 1.97860110 SGB530 749 644 105 696.5 2.164095 697.5 1.870829 2.0734087 0.073738
11 SGB645 696 598 98 647 2.01982212 SGB623 695 600 95 647.5 1.9579913 SGB539 694 593 101 643.5 2.08165314 SGB646 702 606 96 654 1.97860115 SGB506 701 605 96 653 1.978601 649 4.401704 2.0033333 0.049207
16 SGB493 595 503 92 549 1.89615917 SGB662 601 503 98 552 2.01982218 SGB689 590 495 95 542.5 1.9579919 SGB455 598 506 92 552 1.89615920 SGB542 601 506 95 553.5 1.95799 549.8 4.396021 1.9456241 0.051732
21 SGB466 497 402 95 449.5 1.9579922 SGB635 497 399 98 448 2.01982223 SFD044 498 402 96 450 1.97860124 SGB526 498 399 99 448.5 2.04043225 SGB680 501 412 89 456.5 1.834328 450.5 3.446012 1.9662345 0.080618
26 SGB443 398 306 92 352 1.89615927 SGB439 393 308 85 350.5 1.75188628 SGB630 402 315 87 358.5 1.79310729 SGB629 398 309 89 353.5 1.83432830 SGB461 404 316 88 360 1.813717 354.9 4.144273 1.8178395 0.053349
31 SGB657 302 219 83 260.5 1.71066532 SGB571 299 211 88 255 1.81371733 SGB498 301 222 79 261.5 1.62822434 SGB618 301 216 85 258.5 1.75188635 SGB681 304 217 87 260.5 1.793107 259.2 2.588436 1.7395198 0.073738
36 SGB486 202 120 82 161 1.69005537 SGB471 203 127 76 165 1.56639238 SGB584 203 123 80 163 1.64883439 SGB478 204 129 75 166.5 1.54578240 SGB591 202 123 79 162.5 1.628224 163.6 2.162175 1.6158573 0.059378
41 SGB699 104 37 67 70.5 1.38089842 SGB507 103 34 69 68.5 1.42211943 SGB536 102 38 64 70 1.31906744 SGB501 102 38 64 70 1.31906745 SGB671 105 38 67 71.5 1.380898 70.1 1.083974 1.3644101 0.044682
RNC: 15.8Time: 2.96BG: 6.8
15

Figure (2): Graphic presentation of Table 2
Table 2. Percent deviation of CF relative to
measured CF using new equation
MPV Measured
CF Fitted CF
% Dev(relative
to measured)
731.7 2.0075 2.0484 2.0 697.5 2.0734 2.0345 1.9 649 2.0033 2.0136 0.5
549.8 1.9456 1.9654 1.0 450.5 1.9662 1.9075 3.0 354.9 1.8178 1.8382 1.1 259.2 1.7395 1.7468 0.4 163.6 1.6159 1.6131 0.2 70.1 1.3644 1.3668 0.2
Natural Logarithmic Fitted CF (Squares) and
Experimental CF (Diamonds)
0
0.5
1
1.5
2
2.5
0 200 400 600 800
Midpoint Voltage in Volts
Ca
lib
rati
on
Fa
cto
rs
16
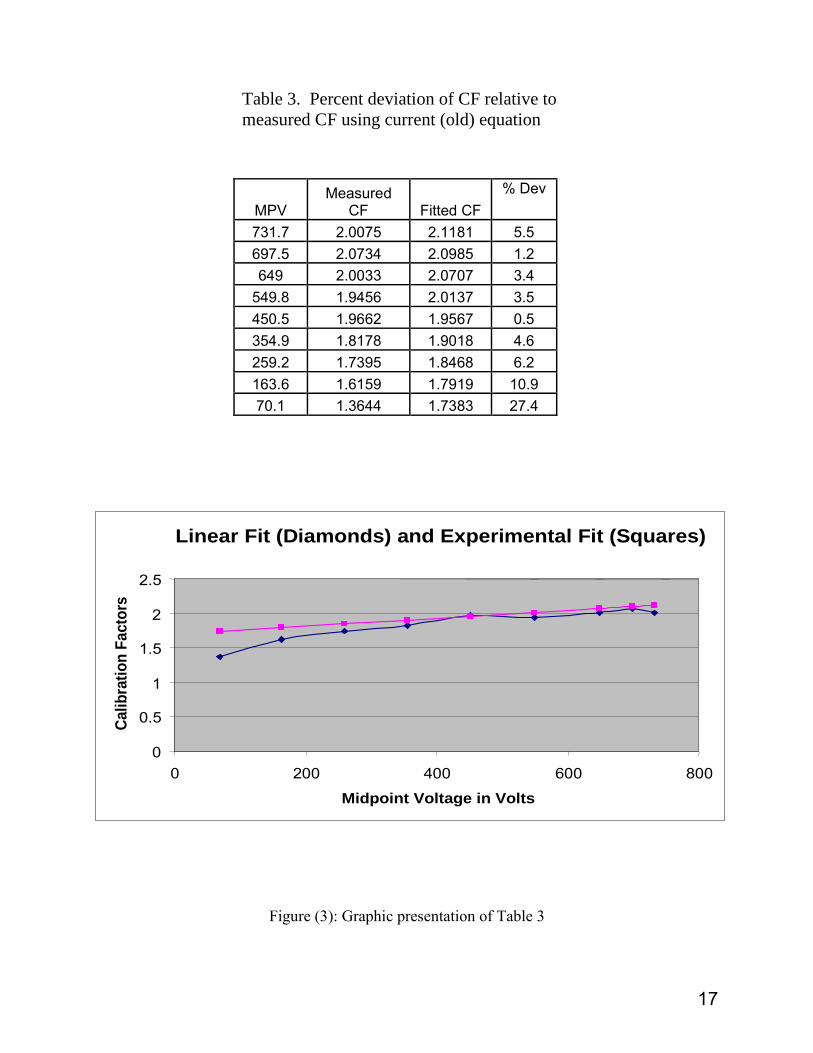
Figure (3): Graphic presentation of Table 3
Linear Fit (Diamonds) and Experimental Fit (Squares)
0
0.5
1
1.5
2
2.5
0 200 400 600 800
Midpoint Voltage in Volts
Cali
bra
tio
n F
acto
rs
Table 3. Percent deviation of CF relative to
measured CF using current (old) equation
MPV Measured
CF Fitted CF % Dev
731.7 2.0075 2.1181 5.5 697.5 2.0734 2.0985 1.2 649 2.0033 2.0707 3.4
549.8 1.9456 2.0137 3.5 450.5 1.9662 1.9567 0.5 354.9 1.8178 1.9018 4.6 259.2 1.7395 1.8468 6.2 163.6 1.6159 1.7919 10.9 70.1 1.3644 1.7383 27.4
17

Figure (4): Graphic presentation of Table 4
Table 4. Percent deviation of CF relative to measured
CF using current (old) equation and new equation
MPVMeasured
CF
% DevNew
Equation
% DevOld
Equation731.7 2.0075 2.0 5.5697.5 2.0 734 1.9 1.2
649 2.0033 0.5 3.4549.8 1.9456 1.0 3.5450.5 1.9662 3.0 0.5354.9 1.8178 1.1 4.6259.2 1.7395 0.4 6.2163.6 1.6159 0.2 10.970.1 1.3644 0.2 27.4
Relative Percent Error for the Old (Squares)
and New (Diamonds) Equations
0
5
10
15
20
25
30
0 200 400 600 800
Midpoint Voltage in Volts
Rela
tive P
erc
en
t E
rro
r
18

Appendix A
Linear regression fit between the calibration factor and the natural logarithm of the midpoint voltage (MPV): Fitted Equation: CF=0.1318+0.2906 x LN(MPV) Table A 1 Table A 2
MPV LN MPV CF MPV CF Fitted CF731.7 6.5954 2.0075 731.7 2.0075 2.0482697.5 6.5475 2.0734 697.5 2.0734 2.0343649 6.4754 2.0033 649 2.0033 2.0134
549.8 6.3096 1.9456 549.8 1.9456 1.9652450.5 6.1104 1.9662 450.5 1.9662 1.9073354.9 5.8718 1.8178 354.9 1.8178 1.8380259.2 5.5576 1.7395 259.2 1.7395 1.7467163.6 5.0974 1.6159 163.6 1.6159 1.613070.1 4.2499 1.3644 70.1 1.3644 1.3667
Linear Regression Analysis
SUMMARY OUTPUT
Regression Statistics
0.99100.98200.97940.0330
9
ANOVAdf SS MS F Significance F
Regression 1 0.4156 0.4156 381.8868 0.0000Residual 7 0.0076 0.0011Total 8 0.4232
Standard Error t Stat P-value Lower 95% Upper 95% Lower 95.0% Upper 95.0%
Intercept 0.1318 0.0880 1.4985 0.1777 -0.0762 0.3398 -0.0762 0.3398X Variable 0.2906 0.0149 19.5419 0.0000 0.2554 0.3258 0.2554 0.3258
Data for Regression Analysis Data for Graph
Coefficients
Multiple RR Square
ObservationsStandard ErrorAdjusted R Square
19

POTENTIAL RADON RELEASE DURING FRACKING IN COLORADO
James Burkhart1, Thomas Huber2, and George Bolling2 (1) Department of Physics, University of Colorado-Colorado Springs, (2) Department of
Geography and Environmental Studies, University of Colorado-Colorado Springs [email protected]
Abstract
Hydraulic fracturing or 'fracking' has become the industry standard for oil and gas production in the United States. The process entails fracturing large sections of rock with high pressure to release oil and gas reserves and to produce conduits for these fluids to flow more easily to the surface. Along with the intended natural gas, water, or any other fluids or other substances that might be trapped with the gas in the tight formation shales and sandstones that are fracked, come to the surface. There is some evidence that radium-226, radon-222 and other toxic substances have been detected at well heads of fracking operations (McMahon, 2013 and Tait et al., 2013). The foothills and plains along the Front Range in Colorado have become an active area for gas and oil production. Most of this activity takes place in the upper Cretaceous limestone/shale Niobrara formation and the underlying Codell sandstone that generally lie between 2,000 and 3,000 meters below the surface. The fracked rock releases radon that was trapped by the tight shale formation which then is able to flow along the lateral sections of the fracked zone and be pumped up the well bore to the surface. Radon is then released to the atmosphere at the fracking site in levels which may be of some health concern to nearby workers or residents. Actual radon-222 measurements made about 200 feet (60 m) from one well pad (with five well heads) prior to, during, and after fracking showed levels around 3 pCi/L, or 111 Bq/m3. A second test series at several well three-phase separation/storage facilities and a recently completed well pad, also in northeast Colorado, indicated outdoor radon levels around 4.5 pCi/L, or 166.5 Bq/m3. We believe additional monitoring needs to be done to better characterize the radon levels released during the fracking process and at the many separation/storage facilities in the rather large geographical area.
Introduction
Recent advances in oil and gas development have dramatically increased the production of these resources, especially in the United States. Not unexpectedly, these increases in production have also come with increasing controversy. One of the major points of contention between gas and oil production advocates and those opposed is the type of chemicals used in the horizontal drilling and high pressure hydraulic fracturing or ‘fracking’ that artificially fractures rock to release oil and gas reserves. Most of the chemicals are considered proprietary by the individual companies and, therefore, are not known to the public or even regulatory agencies. The second significant concern is the constituents of the materials brought to the surface along with the gas (methane usually) and the oil. It is highly likely that other volatile organic compounds (VOCs), radium-226, radon-222, and other potential toxins are also released by the fracking process. This paper will focus primarily on the radon-222 (1) which is released to the air surrounding the well site during the flow-back period, when the fracking water returns to the surface, as the radon
20

containing water outgasses once the water is at atmospheric pressure and (2) the radon-222 in the ambient air once the well is completed and is in the production stage. The latter release is presumed to be caused by leakage of the methane/radon-222 from the associated piping and separation tanks/storage tanks at the well site.
Background Colorado is one of the states that have a large stake in assessing any concerns associated with fracking because of the rapid and expansive increase in oil and gas development in both the western and eastern regions of the state. Development of oil and gas fields in both areas has been increasing, and the concerns surrounding the impacts of this massive expansion are more vocal. The call for additional regulatory oversight of the industry and its practices is starting to have an impact. For example, Collett and Ham (2012) are preparing a large, multi-year study of oil and gas well development in Garfield County in far western Colorado. Colborn, et al, (2012) have looked at non-methane hydrocarbons (NMHCs) released before, during, and after drilling and fracking. The aforementioned works do not deal with releases of radon-222 from the fracking water or, later, into the air from the separation/storage facilities, however. There are studies and publications that have dealt with radon-222, including a work by Tait et al. (2013) that looks at radon released in Australia from coal seam gas production. There, outdoor radon was measured for 24 hour periods inside and outside the Kenya/Talinga gas fields in southern Queensland with a correlation found between the well number density and the radon-222 concentrations, although open coal seams could not be dismissed as a confounding factor and the radon levels were quite modest (below 1 pCi/L, (37 Bq/m3). In this country, Resnikoff (2012) has published an analysis of radon carried with the natural gas into apartments in New York City from the Marcellus shale development in New York State. His findings, however, have been the target of industry criticism, by Spectrum Energy(1), in particular. The United States Geological Survey (USGS) released a report in 2012 measuring radon in methane in Upper Devonian sandstones and the Middle Devonian Marcellus Shale in Pennsylvania (2012) and reported readings with a median of 37 pCi/L (1369 Bq/m3). Jenkins (2013), measuring radon from the same deposits, found average levels around 31 to 32 pCi/L in the raw and finished gas products, using scintillation cells which were filled from samples shipped to him overnight in Tedlar bags. McMahan (2013) reports on radiation alarms at a landfill in Pennsylvania that went off because of fracking cuttings carried by a truck that was subsequently refused entry. These cuttings had contained high levels of radium-226 (a precursor to radon-222). Little research on toxic releases has been done or even planned for in the extensive oil and gas fields of eastern Colorado. This particular study was devised to start to fill that information gap. It was designed to test radon levels at an active fracking operation and was conducted at a fracking site for five wells in the Denver Basin just north of Greeley, Colorado, a mile outside the town of Eaton, Colorado. The Denver Basin consists of thousands of wells that tap both the Upper Cretaceous Niobrara formation and the underlying Codell sandstone member of the (1) “A Case Study of Radon Levels and risks in Marcellus Shale Natural Gas”, Spectrum Energy, 5400 Westheimer
Court, Houston, TX 77056-5310.
21

Carlile shale formation (Higley, 2007; Pagano, 2006) (Figure (1)). The wells in this study are specifically tapping the Codell at a depth from 2,073 to 2,256 meters (Hively, 1986). The Codell is a very tight sandstone that contains extensive gas reserves. A tight formation is one where the rock is extraordinarily impermeable and hard. Any oil or gas is locked into microscopic pores in the rock. They can only be released through the fracturing that occurs with high pressure fracking. Fracking not only fractures the rock to release the gas from the confined pores but also creates conduits for the gas to migrate to the horizontal pipes and then to the surface. Any additional substance that is held in the rock along with any petroleum products is also released during the fracking process including radon gas. Both the Niobrara and Codell are found throughout the large Denver geological basin that underlies an extensive area from south of Colorado Springs north into southeastern Wyoming and northwestern Nebraska. It stretches eastward from the base of the Front Range nearly to the Colorado-Kansas border. In its shallower formations, the basin contains significant groundwater resources that are tapped for irrigation of cropland and municipal water supplies. The basin, especially in Weld County, has been the location of significant oil and gas exploration and development for decades. Fracking and re-stimulation of older well has reinvigorated the oil and gas industry’s interest in the area.
Figure (1): The Denver Basin in which fracking is concentrated and this study took place. Map is in the public domain.
Hydraulic Fracture Stimulation The first step in the hydraulic fracture stimulation process is to perforate the zone of interest after a correlation is made from the log program run during the drilling phase or at the conclusion of the drilling. The production zones are identified by log character and geologic shows seen in the cuttings during the drilling process. An initial break down of the zone is done with limited treatment fluids to identify the facture pressure of the formation. The break down process helps with the frack design and identifies the pressures that can be expected during the pumping of the job. It will also match the horsepower needed to pump the desired fluid and sand combination into the formation.
Fracking Site
22
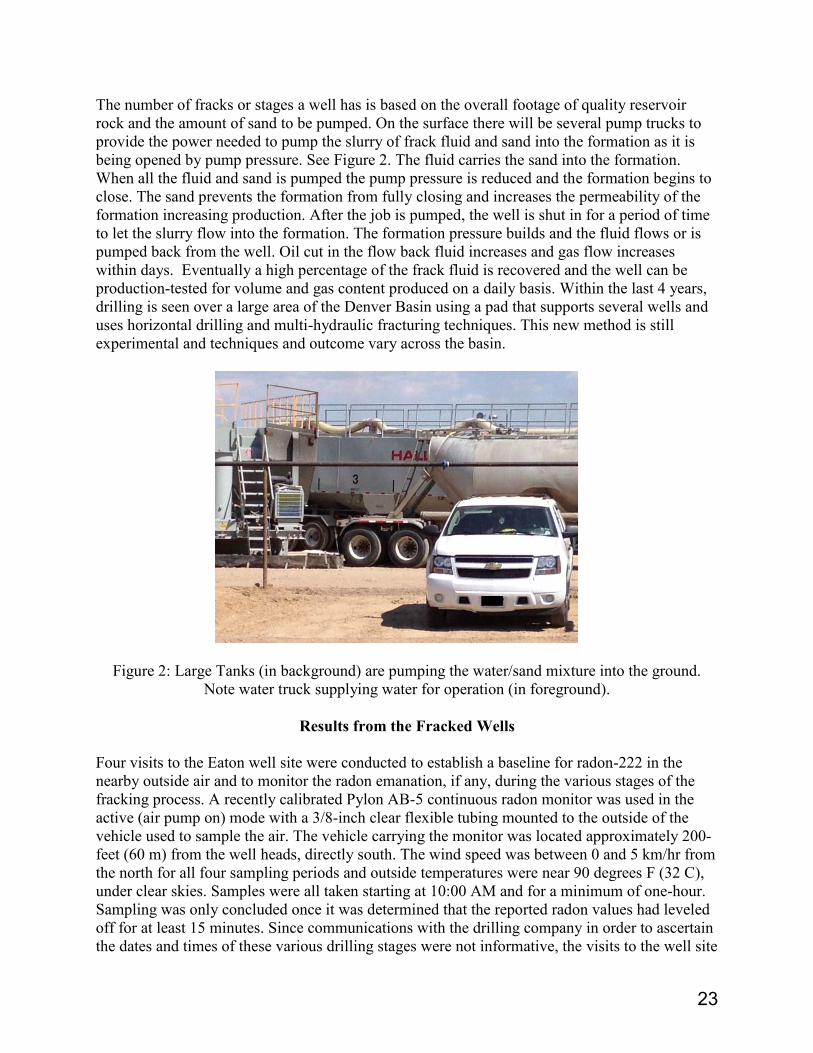
The number of fracks or stages a well has is based on the overall footage of quality reservoir rock and the amount of sand to be pumped. On the surface there will be several pump trucks to provide the power needed to pump the slurry of frack fluid and sand into the formation as it is being opened by pump pressure. See Figure 2. The fluid carries the sand into the formation. When all the fluid and sand is pumped the pump pressure is reduced and the formation begins to close. The sand prevents the formation from fully closing and increases the permeability of the formation increasing production. After the job is pumped, the well is shut in for a period of time to let the slurry flow into the formation. The formation pressure builds and the fluid flows or is pumped back from the well. Oil cut in the flow back fluid increases and gas flow increases within days. Eventually a high percentage of the frack fluid is recovered and the well can be production-tested for volume and gas content produced on a daily basis. Within the last 4 years, drilling is seen over a large area of the Denver Basin using a pad that supports several wells and uses horizontal drilling and multi-hydraulic fracturing techniques. This new method is still experimental and techniques and outcome vary across the basin.
Figure 2: Large Tanks (in background) are pumping the water/sand mixture into the ground. Note water truck supplying water for operation (in foreground).
Results from the Fracked Wells
Four visits to the Eaton well site were conducted to establish a baseline for radon-222 in the nearby outside air and to monitor the radon emanation, if any, during the various stages of the fracking process. A recently calibrated Pylon AB-5 continuous radon monitor was used in the active (air pump on) mode with a 3/8-inch clear flexible tubing mounted to the outside of the vehicle used to sample the air. The vehicle carrying the monitor was located approximately 200-feet (60 m) from the well heads, directly south. The wind speed was between 0 and 5 km/hr from the north for all four sampling periods and outside temperatures were near 90 degrees F (32 C), under clear skies. Samples were all taken starting at 10:00 AM and for a minimum of one-hour. Sampling was only concluded once it was determined that the reported radon values had leveled off for at least 15 minutes. Since communications with the drilling company in order to ascertain the dates and times of these various drilling stages were not informative, the visits to the well site
23

were timed by observations made by the authors from a near-by road, not leased to the drilling company. Drilling completed with wells capped: The first measurement was made when the authors discovered the site by following trucks designed for fracking. Since the drilling rig had been dismantled and the five wells capped, this first radon measurement is used as a baseline for comparing with subsequent tests. The one-hour result was 1.5 pCi/l (55.5 Bq/m3) Wells being fracked: The second visit coincided with the actual fracking process ongoing. A slight increase in the radon-222 was measured with a value of 3.0 pCi/L (111 Bq/m3) Wells capped while under pressure: The third visit found the fracking process completed and the fracking water being held underground by the wells being capped. A measurement of 3.0 pCi/L was obtained. Flow-back: A fourth, and final measurement was conducted during the flow-back period. During this time, the water which was previously pumped into the ground returned to the surface. Temporary piping and valves were installed that fed the water from the well head to near-by portable tanks. The whole process was closed to the atmosphere except for a small vent to the atmosphere at the top of the portable tank which is opened while the tank is being filled. Because of this open vent, it was anticipated that the radon released to the atmosphere at this final stage of the fracking process would be noticeably increased over the previous three visits. However, this was not the case. The radon concentration was still around 3.0 pCi/L (111 Bq/m3).
Result from Separation/Storage Facility and Sealed Well Heads As a separate effort, several Separation/Storage facilities from wells that were already in production near Brighton, Colorado, were also measured as well as a relatively small well pad with 5 completed and sealed well heads located nearby. See Figure (3), Figure (4) and Figure 5, below. Access to these facilities was enabled by their location, as they were only a few feet from near-by public roads. These facilities were chosen by the authors based on this ease of access plus their proximity to a near-by highway. Measurements were taken while the vehicle was
Figure (3): A typical three-phase separator station. Here, the oil, gas and water are separated.
24

Figure (4): A typical drilling pad with 5 finished wells and sealed well heads. The highest
outdoor radon was measured (4.5 pCi/L) at this site.
Figure 5: A 400-gallon tank battery in which oil is stored. The smaller tank holds the separated water. The separated gas has already been sent through the pipeline.
25

parked approximately 10 feet (3 m) from the separation tanks although the measurements were not of sufficient duration to allow the Pylon to come into equilibrium, being typically about 10 minutes in duration. The readings were consistently at 4.0 pCi/L, about 150 Bq/m3, and as high as 4.5 pCi/L (166 Bq/m3) at a nearby drilling pad with 5 sealed well heads. We believe that there is sufficient intentional, and accidental, leakage from these facilities to explain this higher than expected outdoor radon concentration, although this hypothesis has not been tested rigorously.
Conclusion Preliminary measurements at a fracking site and at a few separation/storage facilities in northeast Colorado seem to indicate that radon-222 is indeed released during the fracking process and, perhaps more importantly, during storage and separation of oil, gas and water of completed wells. It is believed that radon-222 released into the atmosphere during oil and gas production has not been well studied and deserves a closer look. Levels of 3.0 pCi/L (111Bq/m3) during the weeks-long fracking process and levels of around 4.5 pCi/L (166 Bq/m3) near the separation/ storage stations, although not alarming, are at 10 times above the normal outdoor level (EPA-1992) and would seem to indicate that outdoor radon is being adversely influenced by the gas/oil production process. This quick study leaves unanswered whether oil field workers or nearby residents are exposed to levels of radon gas which may be of concern. But it does suggest that more work needs to be done in characterizing the radon concentration at many fracking sites and the separation/storage facilities as well as in calculating the long-term exposure times of the workers in order to determine their total annual exposure. Also, if further work is done, it is intended that the radon-levels of the outdoor air surrounding near-by homes also be evaluated.
26

References All photos are by the authors. T, Schult K, and Kwiatkowski C. 2012. An Exploratory Study of Air Quality Near Natural Gas Operations, Human and Ecological Risk Assessment: An International Journal. Collett, Jeffery L. and Ham, Jay, 2012. Characterizing Air Emissions from Natural Gas Drilling and Well Completion Operations in Garfield, County, Colorado. A proposal to the US EPA, pp 1-12. EPA 400-R-92-011, Technical Support document for the 1992 Citizen’s Guide to Radon,
May,1992, Appendix A, page A2. Higley, Debra K., 2007. Oil and Gas Exploration and Development along the Front Range in the Denver Basin of Colorado, Nebraska, and Wyoming. In Petroleum Systems and Assessment of Undiscovered Oil and Gas in the Denver basin Province, Colorado, Kansas, Nebraska, South Dakota, and Wyoming -- USGS Province 39. USGS Digital Data Series DDS-69-P, Chapter 2. Hively, Roger E., 1986. Geological Aspects of the Codell Sandstone, Weld and Larimer Counties, Colorado. SPE Formation Evaluation, 1 (6), pp 623-627. Jenkins, Phillip, 2013, Analyzing Samples of Natural Gas for Radon, Annual Meeting of the Air Monitor Users Group, Las Vegas, Nevada, Palace Station Hotel, May 2, 2013. McMahan, Jeff. 2013. Fracking Truck Sets Off Radiation Alarm at Landfill, Forbes.com. http://www.forbes.com/sites/jeffmcmahon/2013/04/24/fracking-truck-sets-off-radiation-alarm-at-landfill/. Pagano, Theodore A., 2006. Rock properties, Deliverability Mechanism Influence Codell Restimulation. Oil & Gas Journal, http://www.ogj.com/articles/print/volume-104/issue-26/drilling-production/rock-properties-deliverability-mechanism-influence-codell-restimulation.html. Resnikoff, Marvin, 2012. Radon in Natural gas from Marcellus Shale. Executive summary, Radioactive Waste Management Associates, pp 1-14. Rowan T.L. and Kraemer T.F., 2012. Radon-222 Content of Natural Gas Samples from Upper and Middle Devonian Sandstone and Shale Reservoirs in Pennsylvania: Preliminary Data, U.S. Geological Survey, Reston, Virginia, Open-File Report Series 2012–1159. Tait, Douglas R., Santos, Isaac R., Maher, Damien T., Cyronak, Tyler J., and Davis, Rachael J., 2013. Enrichment of Radon and Carbon Dioxide in the Open Atmosphere of an Australian
Coal Seam Gas Field. Environmental Science & Technology, 47, pp. 3099-3104.
27

APPLYING DYNAMIC CONTROLS AND REMOTE MONITORING TO RADON MITIGATION SYSTEMS TO ADVANCE ENERGY
CONSERVATION AND THE STABILIZATION OF INDOOR RADON CONCENTRATIONS
Thomas E. Hatton1 Daniel J. Nuzzetti2
Clean Vapor, LLC, 32 Lambert Road, P.O. Box 688, Blairstown, New Jersey 07825
Abstract
This paper describes the application of dynamic motor controls and remote monitoring systems that have been designed to achieve maximum operational efficiency to stabilize indoor radon concentrations and demonstrate long term performance of radon mitigation systems. The current generation of radon systems is designed with the intent of lowering indoor radon concentrations to below 4.0 pCi/l (150 Bq/m3) or less in accordance with the USEPA standard for corrective action. To achieve these levels, systems are designed to operate at full power year round which contributes to energy inefficiencies. In most cases, very little is known about the long term performance of the system and the impacts of season variables that effect pressure differentials and ultimately radon concentrations. This paper demonstrates how the implementation of reactive circuitry and remote monitoring and management systems can achieve specified sub slab pressure differentials, regulate indoor radon concentrations, and improve energy conservation. Dynamic Controls and the associated remote electronic management system technology is a substantial improvement over the current technology in the areas of monitoring, system performance, reducing energy consumption and verifying the intended health benefits of the system. Dynamically managed remote monitoring and system controls can provide assurance that radon mitigation systems are functioning to create a healthier living environment while providing advanced warning of potential motor failures, reducing the frequency of onsite inspections, and lowering operational costs. Dynamic Controls and Remote Monitoring are delivering the next generation of radon mitigation while advancing green engineering and sustainability in the radon mitigation industry. ____________________ 1 This author is a developer of, and has a commercial interest in, the dynamic controls and remote monitoring described in this paper. 2 This author does not have a commercial interest in the devices described in this paper. The technology described herein may be subject to one or more U.S. Patent Applications. Please contact Thomas E. Hatton of Clean Vapor, LLC or Vapor Dynamics, LLC for further information regarding the above technology.
28

Introduction
Designing an effective and energy efficient radon mitigation system starts in the planning stage with a firm understanding of all the variables that are contributing to the problem.1 Although there are many goals that are usually integrated into the design of a mitigation system such as aesthetics, ease of maintenance, cost to the client, etc., the primary focus should be on protecting human health followed by long term sustainability.
Since radon mitigation systems are designed to operate indefinitely, efficiency performance, maintenance and monitoring need to be key components of the design. This paper presents a method of dynamically controlling radon mitigation systems. Although significant energy savings are most appreciable in non-residential buildings, the enhanced energy efficiency, sustainability remote management and monitoring functions have benefits for all buildings.
Mitigation Design Principles
Migration of radon into buildings most often occurs because air pressure inside of a building is lower than the pressure in the soil beneath the building. These lower indoor pressures draw radon gas into the building through pathways such as floor drains, sumps, cracks in the slab, open concrete block tops, and utility penetrations. Basic radon technology functions by applying vacuum in the soil or air plenum beneath a building. This technology, first introduced in the 1980’s, has demonstrated to be the most reliable and cost effective.
Developing an effective radon mitigation plan depends on understanding and quantifying the relationship between three key factors that contribute to radon entry: (1) the source strength of radon beneath the building, (2) the pressure differentials that draw radon from the soil into the building; and (3) the pathways that allow radon into the building.
After the mechanical components of the building that influence pressure are understood and the potential radon entry points have been catalogued, the next step is to understand exactly what will be required to create the desired pressure differential beneath the slab. Since most of the energy and costs required to mitigate the problem will be allocated as a result of the data collected during this phase of the investigation, it is critical to understand exactly how much vacuum is required and where it needs to be applied to achieve the pressure differential goals. Achieving system effectiveness occurs when the objective of the design is to reduce indoor radon concentrations to below the EPA standard for corrective action of 4.0 pCi/l. This usually equates to designing a system that can maintain a pressure differential with a minimum cold weather performance standard of -0.004" water column (w.c.) equivalent to 1 Pascal of sub-slab vacuum.2
The pathways of radon gas entry need to be sealed. These are usually fairly obvious. The next step is to determine what is required to depressurize the slab. Pressure field testing of the soil beneath the slab will determine vacuum field extensions; this is accomplished by drilling suction test holes in the slab, auguring out some soil and applying vacuum to simulate future vacuum fields. The physical characteristics of the sub-slab material should be noted and recorded. Applying different levels of vacuum to the test suction hole will determine the relationship between the vacuum applied and the pressure field extension needed for designing an effective soil depressurization system. The vacuum data from the pressure field testing and the measured
29

volume of system exhaust are then extrapolated to project an expected radius of influence and airflow yield from the soil. Once this has been completed, several critical decisions need to be made with respect to the number and locations of suction points as well as the types and capacity of suction blowers to be used. There are centrifugal, small high speed brushless radial and 1-5 horse power (HP) regenerative and radial blowers to choose from. Each blower type has different performance characteristics and a best fit for the application.
All blowers have a common characteristic where vacuum is inversely proportional to airflow. Centrifugal blowers typically have low vacuum, high airflow and are used where the fill beneath a slab is highly permeable such as crushed stone or when depressurizing a crawlspace. Small high speed brushless radial blowers can be used on lower permeable soils that generally yield less than 120 cubic feet per minute (cfm). Regenerative blowers can develop relatively high vacuum levels, up to 80 inches water column, and can be used where there is extremely low permeability and low airflow yields. Radial blowers, depending on the horsepower of the motor and width and diameter of the radial wheel, can sustain a wide range of vacuum and airflow. Because of the increased efficiency of radial blowers over multiple smaller blowers, they are usually well suited for mitigating large commercial buildings. The long, slightly arched performance curve of the radial blower enables multiple suction points, in some cases up to twenty, to be joined into a single blower system without a sharp decline in static vacuum. See graph below for details on the operation of the various blower types discussed. The success in terms of its operational life and the allocation of financial resources required to run and maintain the system depends heavily on correctly and accurately interpreting the diagnostic data and selecting the blower best suited to achieve the vacuum field objectives. The radon mitigation system should be designed to function and meet predefined pressure differentials and maintain indoor radon concentrations that are below 4.0 pCi/l under a worst case weather and pressure loading scenarios. In some cases, where there is finished living space or there are sensitive receptors such as a hospital or a day care, 2.0 pCi/l should be the goal.
0
10
20
30
40
50
60
0 100 200 300 400 500
Vac
uu
m (
''w.c
.)
Airflow (cfm)
Figure 1: Blower Comparison Graph Regenerative
GBR HO 40 (Brushless Radial)
Cincinnati HP-8D19 (Radial)
GBR SOE 16 (Brushless Radial)
AMG Force (Centrifugal)
GBR 89-HA (Brushless Radial)
Notes: 1. Graph lines end at motor amperage service factor ceiling. 2. Cincinnati line extends beyond the range of this graph.
30

Designing for Energy Efficiency
Up to this point, the large building radon mitigation design focus has been to create sufficient vacuum beneath the slab to facilitate achieving the pressure differential and a post mitigation indoor radon concentration that is less than 4.0 pCi/l. The result of this has been robust systems that have been effective in reducing radon concentrations but inefficient in terms of energy consumption. Very little focus has been applied to power conservation and long term sustainability of radon mitigation systems. Integrating dynamic controls into a radon mitigation design will ensure that the goals of protecting human health and conserving energy for long-term sustainability are achieved. There are two main categories of variables that influence the ongoing performance of a mitigation system. They are the sub-slab soil mechanics and a multiplicity of environmental variables that contribute varying pressures inside of buildings. Even though using Pressure Field Extension (PFE) modeling is the best way to project the radius of influence from a suction point and must be the starting point in the design phase; changes that occur once soil has been removed from the suction point and the moisture content of the soil beneath the slab has been reduced can alter the performance of a system to decrease the overall energy efficiency.
There are multiple variables that influence sub slab vacuum field extension and soil gas airflow yields throughout the year. Radon mitigation systems are designed to continuously operate to accommodate the worst case scenarios that exist during the heating season. If energy efficiency and sustainability are goals of radon mitigation systems, then systems should have the ability to dynamically respond to changes from influencing factors. Integrating dynamic controls with system design will enable the system to self adjust and change in response to influencing factors while maintaining a specific pressure field objective. The result could be that radon mitigation systems would not have to operate at continuous peak performance. Systems may actually only need to operate at fifty or sixty or less percent of peak performance to achieve performance goals during normal load conditions. This would provide significant energy savings and extend longevity to the operation of the blowers. Designing energy efficient systems requires accurate pressure field extension data, efficient design, and dynamic controls.
Green Energy and Sustainability Considerations
Since it has been demonstrated that using precision instruments during the diagnostic portion of the building investigation will yield data that will produce an efficient design, why not integrate the same level of instrumentation in the continuous operation of the system? EPA defines Green remediation as “considering all the environmental effects of a remedy implementation and incorporating options to maximize the net environmental benefit …” 3. When designing systems, long term energy considerations need to be integrated into the design process. Greater design efficiency reduces operational costs and extends the time that an active venting program can be sustained for a fixed capital expenditure. Managing the application of sub-slab vacuum to counterbalance the convective forces that draw radon into buildings will increase the efficiency of applied vacuum and reduce the energy required by the blower.
There are three main components that need to be considered when attempting to lower the operational energy costs of a radon mitigation system. They are: the cost of operating the blower(s) that will maintain the negative pressure field beneath the slab, the cost of the heated,
31

cooled, and conditioned air that is being drawn out of the buildings, and the cost of replacing the blowers themselves.4 Blowers operating at higher RPM and loads have a shorter life span than blowers that operate at lower RPM and lower loads. When a motor runs at partial capacity it does less work, runs cooler, and lasts longer, thus lowering operations and maintenance costs.
Previous studies have indicated that one of the greatest costs associated with operating a soil depressurization system is the loss of conditioned building air that is drawn down into the sub slab though slab openings such as floor wall joints, electrical conduits, slab cracks and other openings. 4 When mitigating an existing building, many of these slab openings are not readily available for sealing. In some cases, replacing conditioned air that is drawn into mitigation systems can be a greater operational expense than the electrical cost to operate the blowers. The cost of replacing conditioned air can become the largest variable in reducing ongoing energy costs. It has been demonstrated that installing a tightly sealed vapor barrier system during new construction and optimizing the blower size can save up to $1,000.00 annually in heating, cooling and electric costs per 10,000 square feet of floor space 4 (using 2009 energy costs). The loss of conditioned air through slab openings inaccessible for sealing can be significant because existing buildings are typically constructed over low permeable indigenous fill. As a result, these buildings require fifteen or more times vacuum than newly constructed buildings with integrated crushed stone or aerated floor venting systems. Controlling the level of vacuum that is applied to the sub slab and the resulting loss of conditioned air is critical to the overall energy optimization of a mitigation system.
Efficiency of Blower Types and Problems Associated with Uncontrolled Radial Blower Systems on Large Buildings
In 2009, an effort was started to examine the power efficiencies of centrifugal, high speed brushless small Direct Current (D.C.) radial blowers and multi-horsepower large radial blowers installed by Clean Vapor, LLC. Conclusions were reached that even though radial blowers required larger horsepower motors, greater efficiency was achieved because only a minor reduction in vacuum occurred when airflow was substantially increased by adding more suction points to the system. The higher voltage and lower amperage 3 phase power used to drive the larger radial blowers also contributed to the electrical efficiency.4 Clean Vapor also noticed higher airflow yields over a period of a few months as soil moisture content was being reduced. This was a new phenomenon that had not occurred with the smaller brushless or centrifugal blowers since relatively small increases in airflow produce sharp declines in static vacuum that can be applied to extend the pressure field in those types of blowers. An additional problem developed in unregulated systems where the riser pipe valves were left partially or completely open in that the increased airflow yields were causing the motor to overwork and exceed the electrical service factor. Motors were running hot and increased airflow was causing multiple point suction systems to become unbalanced. The first response was to manually dampen gate valves and reduce airflow to return motor performance to a range within the service factor. This created another unexpected problem; noise. Dampening gate valves created a nonlinear harmonic slide whistle effect with varying ranges of pitch and amplitude. This is not a problem in warehouse settings, where white noise is prevalent, but it became a serious problem when suction points were in office walls. Significant time was spent with micromanometers and pitot tubes achieving the best balance between pressure field extension and tolerable noise.
32

The next step in the evolution of trying to achieve greater efficiency and control was the introduction of frequency inverters more commonly known as variable speed drives. This enabled us to manually control the motor speed. This solved the service factor and noise problems and added a greater degree of power consumption efficiency to the systems.
Even though integrating variable speed drives was a large step forward, it still does not close the gap on a variety of system and energy management issues. The problems associated with manually balancing motor controls to adjust pressure field extension need to be solved. Manually balancing these systems requires mobilizing personnel, gaining building access and usually off hours work for experienced individuals.
Because radon mitigation systems are designed to operate for the entire lifespan of the building, the need to automate mitigation systems to achieve system control and power efficiency for long term sustainability is apparent. In 2010, Vapor Dynamics, LLC started developing prototype circuitry to control and manage the effectiveness and efficiency of radon and vapor intrusion mitigation systems. Achieving a constant defined sub-slab pressure differential is the largest variable that influences power consumption. The second is controlling the loss of conditioned air. Applying only the level of vacuum that is required to reduce radon concentrations to below 4.0 pCi/l is the most efficient mechanism to manage the loss of conditioned air and energy required to operate a soil depressurization system.
Power Conservation
In the past, typical large radon mitigation systems have been designed using fractional HP, single phase, 115 volt fans. Efficiency has been increased by increasing the number of suction points on a single system and using larger multi-horsepower radial and regenerative blowers. The 3 phase power associated with these blowers provides an approximate 33 percent energy savings over single phase. The use of this power also allows smaller gauge wire size to be routed long distances between the electrical source and the blowers.5 To further conserve power, frequency inverters have been included so that vacuum applied to the sub slab can be controlled by adjusting the speed of the motor. It is common for commercial buildings and strip malls with exhaust blowers to be under a 0.25" w.c. internal negative pressure load. Development and prototype bench testing of pressure sensitive Dynamic Controls started in 2010. Several modifications to improve control stability had to be applied during the development process.
33

VariableFrequencyMotor Drive
Zone VacuumSensor
Mass Air FlowSensor
Website withOffsite Control
and Alerts/Alarms
Control terminalwww / Internet
Interface
Other Zones Sensors & Controls
To other Zone Vacuum Pipes
Zone Vacuum Pipe
airflow
Exhaust airflow
Blower
Building Roof
Building Concrete Floor Slab
Sub Slab/Floor Soil Environment
Ambient Pressure Sensor
Ambient TemperatureSensor
Backup Settings
Local Monitoring and Alarms
Gate Valve Control
Sub slab control reference point
Outer extension of vacuum field
Figure 2: Dynamic Controls with Integrated Monitoring
Patent Pending
Vapor Dynamics, LLC
Continuous Radon Monitor
Figure 2 illustrates the basic concept of automated Dynamic Controls with integrated remote monitoring and management.
The motor speed of the blower is most commonly controlled to stabilize sub-slab pressure differentials and maintain a pre-programmed level of sub-slab vacuum as indicated by the sub- slab zone sensor. However, in crawlspaces and aerated floor depressurization systems, blowers can be controlled to achieve pre-determined air exchange rates using pitot tubes and/or mass airflow sensors that remotely transmit data to the dynamic controls terminal. Additionally, at sites with Methane and VOC (Volatile Organic Compounds) systems, dynamic controls can be set to maintain pre-determined contaminate concentrations in the rises or sub-slab.
34

Case Study
Over the past year, Clean Vapor has installed remote monitoring and dynamic controls at multiple vapor intrusion sites. In order to demonstrate the efficiency and functionality of the controls and monitoring on a radon mitigation system, Clean Vapor selected its Blairstown, New Jersey office which is located in the rural county of Warren, New Jersey. Blairstown has been designated by the NJDEP as a Tier 1 Radon Community6, meaning that buildings in these community have the highest potential for elevated indoor radon.
The office is approximately 2,400 square feet and is a slab on grade structure connected to a larger manufacturing building. Our office was selected because we had monitored radon concentrations for a year and established baseline data prior to installing the dynamically controlled system. It also gave us the opportunity to physically inspect the control components and backup radon monitors as needed. The unmitigated baseline radon levels for the office in the prior year fluctuated between 5.2 and 7.8 pCi/l in the non-heating season and 7.4 and 9.7 pCi/l during the heating season. Even though the mitigation goal could have been achieved through a constant speed lower wattage blower, a GBR76-SOE16 small brushless radial blower was selected because the circuitry is designed to accommodate remote control commands to vary the speed of the motor. Below is a graph displaying airflow, vacuum and power consumption of the selected blower.
0
50
100
150
200
250
300
350
400
0
2
4
6
8
10
12
14
16
18
0 20 40 60 80 100 120 140 160
Wat
tage
Stat
ic P
ress
ure
( ''
w.c
)
Flow Rate (cfm)
Figure 3: OBAR GBR 76 SOE-16
Static Vac. Power Consumption
35

The dynamically controlled radon blower and remote monitoring were installed in 2012. The Sun Nuclear 1027 Radon Monitor was modified to wirelessly transmit radon concentrations to be recorded and viewed through the remote monitoring terminal.
The subset of data selected for this paper and the logging of radon data began on January 28, 2013 and continued through July 21, 2013. The following data analysis is an attempt to understand the relationship between required sub slab vacuum, power consumption, and external weather variables: temperature, barometric pressure and wind speed (collected from the nearest NOAA weather station) to mitigate and stabilize low radon concentrations.
The initial control sub slab vacuum reference set point was set at -0.0048" w.c. This set point remained fixed between January 27, 2013 and May 1, 2013. During this test time period, there were temperature variations of 77°F , wind speed variations of 36 mph and barometric pressures that ranged between 29.03"Hg and 30.65"Hg. During this period, the sub-slab vacuum level was maintained within ± 0.001 inches of water column of the control set point by dynamically controlling the vacuum applied to the sub slab. During the test period, one could hear the motor rpm respond to wind or open doors in the building. Figure (4) demonstrates how the system uses integrated “pulse” circuitry and a control algorithm to maintain a predetermined sub slab vacuum
set point.
Figure (4): The Dynamic Controls system provides precise performance verification, data management and stabilization of prescribed sub slab vacuum levels.
Figure 4: Sub Slab Vacuum vs. Time
36

Figure (5) illustrates the required increase in applied vacuum to maintain a desired sub slab vacuum set point as temperature decreases.
As expected, the blower power consumption varied proportionally with the static vacuum applied. These graphs illustrate that colder temperatures require an increased applied vacuum and power to maintain the predefined sub slab set point of 0.0048 " w.c.
0
1
2
3
4
5
6
0 20 40 60 80 100
Ap
plid
Vac
uu
m (
'' w
c)
Temperature (F)
Figure 5: Applied Vacuum vs. Outdoor Temperature
To maintain 0.0048'' wc sub slab vac.
0
1
2
3
4
5
6
0 20 40 60 80 100
Blo
we
r C
urr
en
t (A
mp
s)
Temperature (F)
Figure 6: Power Consumption vs.
OutdoorTemperature To maintain 0.0048'' wc sub slab vac.
37

The same data set was used in Figure (7) to graph the effects of changes in barometric pressure. The general trend line indicates that lower barometric pressures require greater power and applied vacuum to maintain constant sub slab pressure differentials.
Wind speeds varied from 0 mph to 36 mph during the test period. Control data was analyzed in millisecond intervals. The varying of the base motor speed in response to wind gusts and open doors could be heard and was graphically observable on the remote control terminal. The data sets were summarized and stored in hourly intervals and an attempt was made to isolate the effect of wind by selecting data sets from the median temperature of 43° F. The analysis of this data set indicates an increase in applied vacuum is required to maintain a predefined sub slab pressure differential as a response to an increase in wind speed. Additionally, other temperature data sets were selected to determine if a similar response would occur at other temperature ranges. This effect is graphically illustrated in Figure (8). It is theorized that this relationship can be more effectively demonstrated by shortening the data periods to about five minutes.
29.0
29.5
30.0
30.5
31.0
0 1 2 3 4 5
Bar
om
etr
ic P
ress
ure
(H
g)
Applied Vacuum ('' wc)
Figure 7: Barometric Pressure vs. Applied Vacuum
0
1
2
3
4
5
0 5 10 15 20 25 30 35
Ap
plie
d V
acu
um
(''w
c)
Wind Speed (mph)
Figure 8: Wind Speed Vs. Applied Vacuum to Maintain a Set Point at
Various Ambient Temps 36 F
43 F
49 F
52 F
80-87 F
Linear (36 F)
Linear (43 F)
Linear (49 F)
Linear (52 F)
Linear (80-87 F)
38

The average daily concentration during the initial January to May monitoring period was 0.7 pCi/l with the measured maximum daily average being 1.5 and the minimum daily average being 0.2 pCi/l.
Figure (9) shows the radon concentrations during the course of the experiment. The red line represents the national standard of 4.0 pCi/l.
Continuous control of sub slab vacuum yielded radon concentrations that remained consistent within a narrow band of variation even though there were large variations in temperature, wind speed and barometric pressure.
In addition to remotely monitoring and dynamically controlling the radon mitigation system, performance metrics can be adjusted either manually while on site or through the remote system log in. This includes changing blower speeds, altering sub slab vacuum set points, and changing notification alert settings. During the case study, the sub slab vacuum set point was changed remotely through the remote login to measure the effects on radon concentrations that may result from altering the level of vacuum applied to the sub slab over the initial level of -0.0048 "w.c. On May 2, 2013 the sub slab vacuum set point was changed to -0.0080 "w.c.
The Vapor Dynamics, Vapor Guardian™ 5500, has the ability to monitor up to 55 inputs and dynamically control up to 10 blowers. Only a small portion of the Vapor Guardian’s full suite of features were used in our case study building. The flexibility offers contractors the ability to install one panel in large commercial buildings, strip malls, schools and multi-family residential buildings while controlling and managing the data collected from multiple performance parameters at complex sites.
0
2
4
6
8
10
0 20 40 60 80 100 120 140 160
Rad
on
Co
nce
ntr
atio
n (
PiC
/L)
Days
Figure 9: Daily Radon Concentrations January 27 - July 21
39

Although varying sub slab vacuum levels from -0.0048 to -0.0080 "w.c. did not have a measurable effect on radon concentrations, the power consumption associated with raising sub- slab vacuum increased at an exponential rate. The graph below displays the relationship between a sub slab vacuum set point and the power required to maintain such a set point. Also shown on the graph are vertical lines representing the minimum mandated sub slab vacuum levels required for Vapor Intrusion Mitigation by New Jersey’s Vapor Intrusion and Technical Guidance (VITG) 20127. (green) and Radon Reduction Techniques for Existing Detached Houses, EPA 1993b8 (red).
As previously mentioned, the sub-slab vacuum remained constant throughout extreme temperature variations. However, the static vacuum generated by the blower required to maintain these predefined levels varied. During the heating season, the blower needed to produce higher levels of static vacuum in order to overcome the natural increases in interior-exterior pressure differentials induced by colder weather and the associated stack effect. This results in a radon system that consumes more power and is more expensive to operate in the colder months than in the warmer months. This also advanced the conclusion that there would be significant energy and cost savings yielded by applying only the minimum required sub-slab vacuum levels to maintain the desired radon concentrations.
The required static vacuum to maintain a predetermined sub-slab vacuum level was reduced in the warmer months. In order to illustrate the cost savings associated with reducing static vacuum levels, controls were installed on a larger scale system which features the same GBR76-SOE16 blower and eight suction points. This system depressurizes a 3,500 square foot engineering building. The results below show that a 94% energy reduction is achievable when running a system in the summer months at the minimum required sub slab vacuum level as opposed to the full static vacuum that was required to generate the same sub slab pressure field during the initial startup and winter months.
0
200
400
600
800
1000
0
5
10
15
20
25
30
35
0 0.005 0.01 0.015 0.02 0.025 0.03 0.035 0.04 0.045
Po
wer
Co
nsu
mp
tio
n (
Wat
ts)
Syst
em S
tati
c V
ac (
''w.c
.)
Sub Slab Control Reference Point Vac. ('' w.c.)
Figure 10: Power Consumption vs. Control Reference Point Vacuum
Total System Static Vac.
Power Consumption
40

Sub Slab Control Reference Point
('' w.c.)
Average Sub Slab PFE Vac. ('' w.c.)
Total System
Static Vac. ('' w.c.)
Total System Airflow
(cfm)
Watts Kw-H Annual Cost (USD)
Percentage Savings
-0.0665 -0.3491 -14.9 46 224 1962.24 $ 337.51 -
-0.0500 -0.4390 -8.6 31 96 840.96 $ 144.65 57%
-0.0160 -0.2116 -3.5 15 21.6 189.216 $ 32.55 90%
-0.0080 -0.046 -1.9 10 13.2 115.632 $ 19.89 94%
Performance Monitoring
Since radon mitigation systems are design to operate indefinitely, each system should be delivered to the client with a solid Operations, Maintenance and Monitoring (OM&M) plan as part of the post mitigation deliverables package. The same group of sensors and circuitry that are controlling performance commands can be integrated to supply information to monitoring systems that enables the consultant and owner to monitor a wide variety of performance parameters including, sub-slab vacuum fields, total system vacuum and airflow, radon concentrations, power consumption, and the cost savings realized by dynamic controls. Monitoring motor performance characteristics can provide system managers with advanced warning of potential motor failures thus protecting building occupants from unnecessary exposure to radon. The days of time consuming building access issues and technicians traveling to sites with a clipboard only to find out that a critical system component is malfunctioning may soon be a problem of the past. Whether it is an existing building that has been retrofitted with a radon mitigation system or a new building that is constructed in an area where there is high potential for the building to be impacted by radon, property managers can now have continuous documented assurance that all radon system components are functioning correctly and building occupants are protected from health risks associated with elevated radon concentrations.
The value of reduced liability associated with an assurance of continued sub-slab vacuum and lowered indoor radon concentrations cannot be overlooked. Consultants and owners now have the ability to continually view the radon system’s performance metrics and have evidence of
uninterrupted operation if the need to document such proof were to ever to arise.
Additionally, the ability to monitor system power consumption opens up new opportunities for tenant reimbursement. The scenario frequently arises, especially in strip malls with multiple tenants, where the owner is forced to install an additional panel for the radon mitigation system’s
electrical service in order to prevent increasing power consumption on a single tenant’s electric
meter. Another common situation is the need to run electrical wire and conduit hundreds of feet in order to service system components from a single “house” panel. With the ability to
accurately track power consumption of individual systems, blower(s) can now be powered to the most convenient electric panel(s) on the site and the tenant can be reimbursed for exact electric costs of running the system(s).
Table: 1
41

Mitigation and Green Energy Policy Considerations
Although well intentioned and presumably published to promote more effective radon mitigation systems; requiring a minimum negative pressure beneath the slab of 8-10 pascals (0.0321 0.0401 inches of water) as published in EPA 1993b “Radon Reduction Techniques for Existing Detached Houses8 and the vacuum field performance standards of 0.025 to 0.035 inches water column (6 to 9 Pascals(PA)) as published in ASTM E2121-12, Standard Practice For Installing Radon Mitigation Systems In Existing Low-Rise Residential Buildings9, should be reevaluated and new lower pressure values adopted. These new pressure differential standards should be backed up by solid data acquired from continuous monitoring of the system performance metrics and after developing a firm understanding of the relationship between maintained sub slab vacuum levels, required power and stabilized indoor radon concentrations. New Jersey’s
minimum pressure differential standard 0.004” w.c. as published in the January 2012 VITG7 would be a good starting point since it has demonstrated to be sufficient vacuum to mitigate vapor intrusion. This would promote the conservative application of engineering controls in terms of blower power consumption and reduce the frequency of suction points in large buildings.
Applying these high residential pressure differential standards to commercial buildings can result in thousands excess of pounds of CO2 and hundreds of excess pounds of SO2 being exhausted into the atmosphere if coal is the source of electricity. Increasing the continuous minimum sub- slab vacuum field requirement at the outer extension of the negative pressure field beyond -0.004 w.c. has not demonstrated to have significant benefits in terms of further reducing attenuation rates and lowering the presence of soil borne contaminants such as radon in indoor air. Pressure differential standards that were intended for residential homes should never be casually reassigned as criteria to determine the success of large building mitigation systems as the additional power required is costly and counter to EPA’s Green Energy Goals.
Conclusion
Integrating dynamic controls with radon mitigation system design represents a departure from earlier technology where radon mitigation motors were designed to continuously operate at near peak performance in order to maintain sub slab pressure differentials required for meeting radon concentration standards under worst case load conditions that are induced by severe weather or mechanical depressurization. There is a non-linear relationship between change in sub-slab pressure differentials and the electrical power required to achieve the proscribed pressure field benchmarks. An order of magnitude increase in sub slab pressure differentials, measured in inches of water column, can result in more than twenty times the power consumption and annual operational costs.
Through the use of dynamic controls, radon mitigation systems will have the ability to automatically self adjust vacuum levels to ensure radon levels do not exceed the standard of 4.0 pCi/l or a specified preferred concentration. Maintaining acceptable radon levels during the heating season can represent significant power consumption and cost which creates waste during the non heating season. Integrating dynamic controls with optimally designed systems can continuously maintain a match between a specified performance standard and the minimum energy required to meet that performance standard. The electrical information that controls the
42

speed of the motor as well as other system critical information can be integrated into a remote monitoring system where the consultant can remotely monitor and even alter the operational parameters further increasing efficiency. The data management and performance notification function provides an instantaneous electronic summary of all system functions when a single system component is functioning outside of a predetermined range. Quarterly Operations and Management reports are automatically provided to meet the OM&M Plan requirements thus easing the inefficiencies of field inspections. Dynamic controls enable radon mitigation systems to achieve year round standardized pressure field differentials that in turn yield significant cost savings, energy conservation and future system sustainability.
Acknowledgments
Paul Kearney, Kristin Hatton, Clean Vapor, LLC Tom Leonard, Michael Salcone, David Everett, Vapor Dynamics, LLC John Kitchura, Jr., Esq., Proskauer Rose, LLP
43

References
1. Naval Facilities Engineering Command, NAVFAC, 2011, Vapor Intrusion Mitigation in Existing Buildings Fact Sheet.
2. Sundquist, Jon A. Ph.D., Wertz, William E. PhD, Boyd, John H., September 2007, AWMA Symposium, Providence, RI. Sub Slab Depressurization System Performance Evaluation.
3. United States Environmental Protection Agency, March 2008, Brownfields Technology Primer: Vapor Intrusion Considerations for Redevelopment, EPA 542-R-08-001. 4. Hatton, Thomas E., October 2010, AARST International Radon Symposium, Columbus, OH, Designing Efficient Sub Slab Venting And Vapor Barrier Systems For Schools And Large Buildings.
5. Brodhead, William P., Hatton, Thomas E., September 2010, AWMA Symposium, Chicago, IL. High Vacuum, High Airflow Blower Testing and Design for Soil Vapor Intrusion Mitigation in Commercial Buildings.
6. New Jersey Radon Hazard Subcode, 1989 N.J.A.C. 5:27- 10 Appendix 10-A, New Jersey Municipalities in Tier 1 7. New Jersey Department Of Environmental Protection Site Remediation Program, January 2012, Vapor Intrusion Technical Guidance. 8. United States Environmental Protection Agency, March 1993b. Radon Reduction Techniques for Existing Detached Houses. EPA/625/R-93/011 9. ASTM E2121-12, 2012 Standard Practice for Installing Radon Mitigation Systems In Existing Low-Rise Residential Buildings.
44

MEASUREMENT OF THORON AND ITS PROGENY IN TRADITIONAL AND MODERN EARTHEN BUILDINGS IN
GERMANY: METHODOLOGY AND RESULTS
Oliver Meisenberg, Stefanie Gierl and Jochen Tschiersch
Helmholtz Zentrum München German Research Center for Environmental Health
Institute of Radiation Protection Ingolstädter Landstr. 1, 85764 Neuherberg, Germany
1 Abstract
In the past, the radon isotope 220Rn (thoron) was often paid little attention in the context of radiation protection at home. Measurements in buildings on the Central-Chinese Loess Plateau have shown, however, that in dwellings built from unfired earthen material, thoron and its progenies can significantly contribute to the inhalation dose of the dwellers. In Germany, such buildings mainly comprise traditional half-timbered houses and modern ecological low-energy houses with clay boards and plaster. Measurements of thoron in several such houses show concentrations of up to 150 Bq/m (at 20 cm distance from the wall). Radon and thoron progenies were measured with a newly constructed device which makes use of aerosol precipitation in an electric field upon solid-state nuclear track detectors. Thoron progeny concentrations were in the range from 100 to 1000 nJ/m resulting in a dose contribution of up to about 4 mSv per year.
Introduction The radioactive noble gas radon is a well-known health risk in the indoor environment. Exposure to radon and its progeny can cause significant dose to the lungs and other tissue. Historically, most studies have focused on the exposure from the decay chain of the isotope 222Rn (radon), with little attention paid to the isotope 220Rn (thoron) (e.g. Stranden, 1980; Steinhäusler, 1996). The rationale being that its short half-life (55.6 seconds) is insufficient for it to diffuse from soil or rock under the building and into the indoor environment. However, this assumption is not true if the thoron emanates from building material or in cases where it can concentrate under a structure with a tight foundation. . For example, increased thoron concentrations have recently been found in residences made of unfired mineral building material as adobe and mud bricks (Sreenath Reddy, 2004), or which are dug directly into the soil as on the Central-Chinese Loess Plateau (Wiegand, 2000; Shang, 2008). In these cases, thoron contributes up to 50% of the inhalation dose (Shang, 2005). It is therefore safe to conclude, that other homes built with similar materials may also have similar thoron concentrations and merit more detailed investigation. The use of unfired mineral building materials is common throughout most parts of the world. For example, in Germany, traditional buildings are mostly half-timbered houses, erected with a timbered frame construction. The panels between the timbers are filled directly with mud or with boards of straw or wood and then covered with mud. Modern earthen architecture is also
(1)This study was supported by the German Federal Ministry for the Environment, Nature Conservation and Nuclear Safety (BMU) under Contract 02NUK015B. Its contents are solely the responsibility of the authors.
45

popular in ecological and health-conscious habitation. In this style of construction mud render or panels on conventionally built walls are most common. In both traditional and modern construction only the walls and in some cases the ceiling are decorated with mud with the floor being excluded. Currently about two million buildings in Germany contain earthen building material (Schreckenbach, 2004). Therefore, surveillance of the occurrence of thoron in houses built of such material is warranted. Like radon, the inhaled radiation dose received by thoron is not caused by the parent, but by the subsequent decay of it decay products. However, unlike radon where a single measurement is usually adequate, to accurately measure the inhalation dose of thoron, many measurements need to be taken at different locations. The reasons for this are: – The spatial distribution of the thoron concentration is highly inhomogeneous with high
thoron concentrations close to earthen walls, floor, and ceiling. However, the decay products are distributed homogeneously throughout the house.
– Thoron emanation from the building materials might also vary within different rooms of a house because of differences in the building material properties. Also, the concentration of the decay products are influenced by the indoor transport within the whole house–the equilibrium factor of thoron is also influenced by indoor atmospheric parameters such as ventilation more strongly than that of radon.
For a dose assessment from a single-point thoron measurement, a homogeneous exhalation rate and a specific spatial distribution of thoron must be assumed. Even if thoron measurements at a variety of positions in a room or a house are performed, the equilibrium factors between the progenies and the gas must be known. Therefore for dose assessments, direct measurements of the thoron progenies might be preferred to measurements of the gas. Because of their longer half-lives, thoron progenies cause an inhalation dose of about 14 times greater than that of radon progenies at the same concentration in Bq/m (Porstendörfer, 1994). Although progeny measurements are frequently reported using working level (WL), comparing levels of radon and thoron can be difficult because of the inhomogeneous distribution of thoron and the different equilibrium factors. A more accurate representation of the energy released in air is measured by using the potential alpha energy concentrations (PAEC). Briefly the PAEC is the sum of alpha energies emitted by the progenies contained in unit volume until decay to a stable nuclide reported in µJ/m Results from measurements of thoron and its progenies with active and passive measurement devices in 17 traditional and modern houses with earthen building material are presented.
Methods Passive measurements of thoron progenies For passive thoron progenies measurements a newly developed measurement device was applied (Figure 1). These unattended, battery-operated progeny measurement devices (UBPMs) make use of the precipitation of aerosol particles onto a CR39 solid-state nuclear track detectors as sampling substrates within an electric field. The substrates are kept at a potential of + 7 kV compared to a hemispheric wire-mesh covering the substrates, which is on the ground potential. The UBPMs are an enhancement of a device first described by Bi et al. (2011). These devices were calibrated against working level monitors inside the HMGU thoron experimental house (Tschiersch and Meisenberg, 2010). Further details about the UBPMs can be found in Gierl et al. (2013).
46

Figure 1: Photo of one of the passive UBPM thoron progeny measurements devices used in
this study. Passive radon and thoron measurements CR39 solid-state nuclear track detectors (SSNTD) were used for passive, integrating measurements of radon and thoron in indoor air: A 1 cm CR39 plastic polymer platelet is placed at the bottom of a 3.6 cm tall plastic box. For measurements of both radon and thoron, the screw cap of the box contains several holes, which are covered with a membrane filter and conductive foam through which the gases but not their progenies can enter the box. The boxes screw caps, which are used for measurements of radon only, are solid; the gas enters the box through the cap thread. For measurements of thoron concentration one device or one set of devices for radon and thoron are used together with at least one device for radon only. The measurement devices are calibrated against a RAD7 active radon and thoron measurement device (Durridge Inc.) in a 1 m calibration chamber. The quality of the measurement results is assured by frequent participation in laboratory intercomparison measurements (e.g. Janik et al. 2010). Measurements were performed at different distances from a clay wall depending on the number of devices which could be deployed (at distance of 20 cm only or at 10 and 50 cm). All other detectors were placed at least 50 cm from any other wall, floor, and ceiling. The plastic boxes containing the CR39 detectors were placed in cardboard holders which were fixed at the wall or in wooden stands (Figure (2)) or were placed on a desktop. In several measurements, additional passive detectors were placed at different positions 20 cm from the wall, but not in a direct line between any other detectors and the wall. In addition, detectors were also deployed in the middle of the rooms.
47

Figure (2): Placement of a combined radon and thoron and a thoron-only passive measurement device at a distance of 20 cm from a clay paneled and rendered wall.
Results
Concentrations of radon, thoron and thoron progeny were measured for one to two months in Figure (3): Information about houses in which measurements were performed. Clay render refers to a conventional construction on which clay render was applied. The other types of earthen architecture might also feature clay render on the respective underlying clay structure.
No. Architecture Usage
Measurement of
radon/thoron (distance in cm)
progenies
1 half-timbered residential 20 x 2 clay render residential 20 x 3 half-timbered residential 20 x 4 half-timbered town hall 20 x 5 half-timbered residential 20 x 6 clay render residential 20 x 7 half-timbered residential
(unoccupied) 10/50 x
8 clay render residential 20 x 9 clay render rescue
station 20 x
10 clay panels residential 10/50 – 11 clay panels residential 10/50 – 12 clay panels residential 10/50 – 13 clay panels residential 10/50 – 14 clay panels office 10/50 – 15 clay panels residential 10/50 – 16 mixed: adobe,
render, panels residential 10/50 –
17 adobe office 10/50 –
48

late winter 2013 within 17 houses in which unfired mineral material were extensively used (Figure (3)). Other than this criteria, the houses were selected randomly, i.e. they were not chosen according to risk factors such as a known high thorium content in the building material. The houses in the study comprised of traditional half-timbered residential and administrative buildings (Figure (4)), one traditional house with clay render and several modern houses with earthen building material such as adobes, clay render, and clay panels.
Figure (4): Photo of a traditional half-timbered (House no. 7). Such houses are common in most parts of Germany. Buildings with similar architecture can be found throughout northern
Europe. Concentrations of radon and thoron progeny Figure (5) presents the average concentrations of 212Pb in the houses in which UBPMs were applied during their exposure time. The concentrations ranged from 2 to 10 Bq/m . Applying published inhalation dose coefficients for 212Pb (Bi et al., 2010) and assuming an exposure to the dwellers of 10 hours/day (occupancy factor of 40%) with an unattached fraction of 5% (Meisenberg and Tschiersch, 2011) these concentrations result in an annual inhalation doses of up to 4 mSv from 212Pb alone.
49

0
2
4
6
8
10
12
1 2 3 4 5 6 7 8 9
house no.
con
cen
trati
on
[B
q/m
³]
Figure (5): Average concentration of 212Pb measured with the UBPM over one to two months in late winter 2013. The measurement uncertainty (k = 1) is mainly caused by the uncertainty
contribution of the calibration factor with an additional contribution from the number of measured CR39 tracks.
Radon and thoron concentrations Thoron concentrations at a distance of 20 cm ranged from below the detection limit to 90 Bq/m (Figure (6)). The low thoron concentrations in the houses 1 and 4–6 cannot be correlated with the progeny concentrations. However in houses no. 1 and 6, relatively high progeny concentrations were found. Three explanations are possible: Firstly, the thoron concentration profile could decrease more rapidly with increasing distance so that no thoron reaches the measurement device at 20 cm from the wall. Secondly, the progeny concentration could be caused by thoron exhalation from other parts of the room or the building in which clay was used. Thirdly, the equilibrium factor between thoron and its progenies could be particularly high e.g. because of weak ventilation with the outdoor air.
50
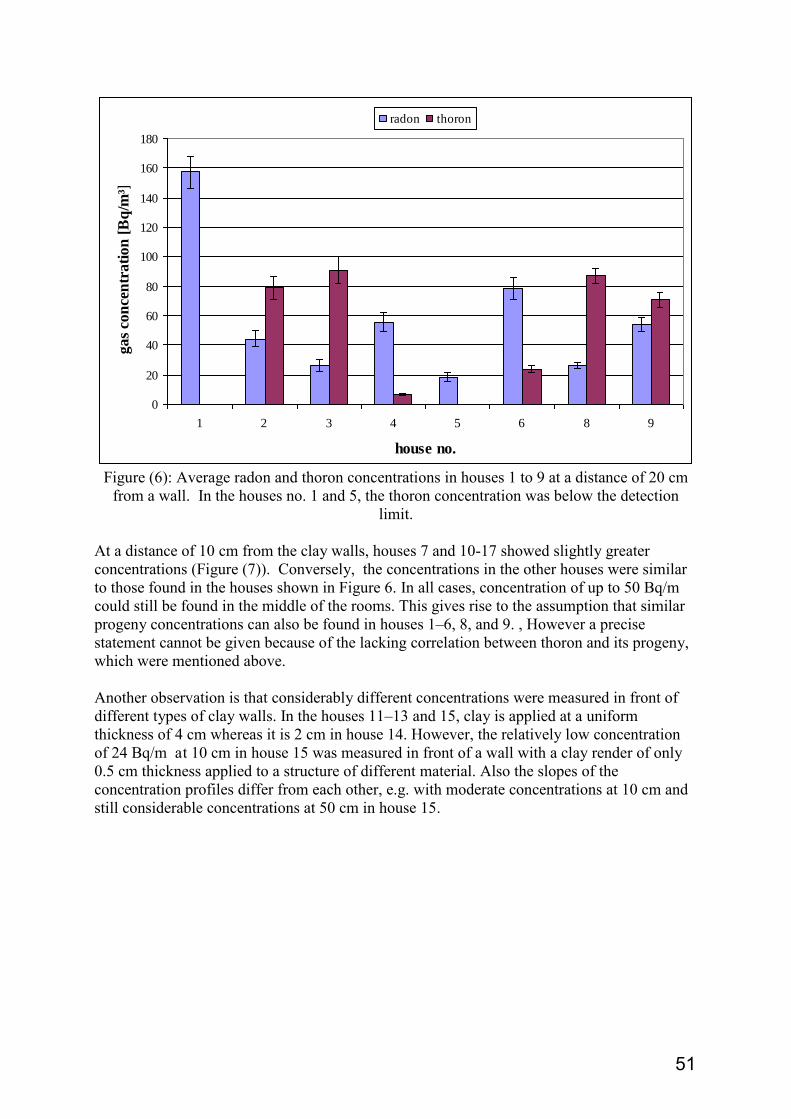
0
20
40
60
80
100
120
140
160
180
1 2 3 4 5 6 8 9
house no.
gas
con
cen
trati
on
[B
q/m
³]radon thoron
Figure (6): Average radon and thoron concentrations in houses 1 to 9 at a distance of 20 cm
from a wall. In the houses no. 1 and 5, the thoron concentration was below the detection limit.
At a distance of 10 cm from the clay walls, houses 7 and 10-17 showed slightly greater concentrations (Figure (7)). Conversely, the concentrations in the other houses were similar to those found in the houses shown in Figure 6. In all cases, concentration of up to 50 Bq/m could still be found in the middle of the rooms. This gives rise to the assumption that similar progeny concentrations can also be found in houses 1–6, 8, and 9. , However a precise statement cannot be given because of the lacking correlation between thoron and its progeny, which were mentioned above. Another observation is that considerably different concentrations were measured in front of different types of clay walls. In the houses 11–13 and 15, clay is applied at a uniform thickness of 4 cm whereas it is 2 cm in house 14. However, the relatively low concentration of 24 Bq/m at 10 cm in house 15 was measured in front of a wall with a clay render of only 0.5 cm thickness applied to a structure of different material. Also the slopes of the concentration profiles differ from each other, e.g. with moderate concentrations at 10 cm and still considerable concentrations at 50 cm in house 15.
51

0
30
60
90
120
150
180
210
0 10 20 30 40 50 60
distance from wall [cm]
con
cen
trati
on
[B
q/m
³] .
7 10 11 12 13 14 15 16 17
radon
Figure (7): Minimum, average and maximum concentrations of thoron at distances of 10 and 50 cm from different walls and the concentration of radon in the ground floor in Bq/m in different rooms of the houses 7 and 11–17. For better clarity, the thoron concentrations are
arranged around the 10 and 50 cm marks.
Conclusions The measurements of thoron progenies under normal conditions show that increased concentrations with annual inhalation doses of a few mSv occur frequently in houses in which mud and clay is extensively used as a building material. The measurements of thoron gas in such houses suggest similar results. Thus, thoron should be considered as an issue for radiation protection in houses with earthen architecture. The comparison of thoron and its progeny measurements confirm that a deduction of inhalation doses from gas measurements alone is generally not possible. In particular, the measurement of thoron at different distances indicates that there is no representative distance which can be used for a single-point thoron measurement, from which an average concentration can be deduced. However, it is suitable for a first assessment, if thoron is present at a high concentration. The steep decrease of the thoron concentration from the wall to the middle of the room makes the need for measurement devices suitable for non-uniform concentrations necessary. In the design of such devices, especially for thoron passive measurement devices, a realistic thoron profile rather than a homogeneous concentration should be taken into account. These devices should also be calibrated and intercompared with these nonhomogeneous profiles in mind.
52

References Bi L., Li W. B., Tschiersch J., and Li J. L., Age and sex dependent inhalation doses to members of the public from indoor thoron progeny. Journal of Radiological Protection 30, 639 (2010). Bi L., Tschiersch J., Meisenberg O., Wielunski M., Li J.L., and Shang B., Development of a new thoron progeny detector based on SSNTD and the collection by an electric field. Radiat. Prot. Dosim. 145, 288 (2011). Gierl S., Meisenberg O., Wielunski M., Tschiersch J., An unattended device for high-voltage sampling and passive measurement of radon and thoron progeny. Review of Scientific Instruments; 2013 (submitted for publication). Meisenberg O., Tschiersch J., Thoron in indoor air: modeling for a better exposure estimate. Indoor Air 21, 240 (2011). Porstendörfer J., Properties and behaviour of radon and thoron and their decay products in the air., Journal of Aerosol Science 25, 219 (1994). Schreckenbach H., Building with Earth – Consumer information. German Association for Building with Earth, Weimar, 2004. Shang B., Chen B., Gao Y., Cui H., and Li Z., Thoron levels in traditional Chinese residential dwellings. Radiation and Environmental Biophysics 44, 193 (2005). Shang B., Tschiersch J., Cui H., and Xia Y., Radon survey in dwellings of Gansu, China: the influence of thoron and an attempt for correction. Radiation and Environmental Biophysics 47, 367 (2008). Sreenath Reddy M., Yadagiri Reddy P., Rama Reddy K., Eappen K.P., Ramachandran T.V., and Mayya Y.S., Thoron levels in the dwellings or Hyderabad city, Andhra Pradesh, India. Journal of Environmental Radioactivity 73, 21–28 (2004). Stranden E., Thoron and radon daughters in different atmospheres. Health Physics 38, 777 (1980). Steinhäusler F., Environmental 220Rn: a review. Environment International 22, S1111 (1996). Tschiersch J. and Meisenberg O., The HMGU thoron experimental house: a new tool for exposure assessment. Radiation Protection Dosimetry 141, 395 (2010). Wiegand J., Feige S., Quingling X., Schreiber U., Wieditz K., Wittmann C., and Xiarong L. Radon and thoron in cave dwellings (Yan’an, China). Health Physics 78, 438 (2000).
53

IMPACT OF THE NEW BSS IN THE SPANISH RADON PROGRAM
Luis S. Quindos Poncela, Carlos Sainz Fernandez, Jose-Luis Gutierrez Villanueva, Ismael Fuente Merino
RADON Group, Faculty of Medicine, University of Cantabria, Avda Cardenal Herrera Oria s/n, 39011 Santander (Spain)
E-mail: [email protected]
Abstract
The new Basic Safety Standards (BSS) are under discussion at the European Council in order to issue a council directive. The Directive includes the exposure of members of the public to indoor radon. The Annex XVI of the document summarizes the list of items to be covered in the national action plan to manage risks from radon exposures.
In the case of Spain, the need for a Radon Program includes the existence of laboratories with radon measurement expertise. Therefore our group, in collaboration with ENUSA S.A. (Spanish National Uranium Company), has created the Laboratory on Natural Radiation (LNR). These facilities are located at an old uranium mine where radon concentrations are subjected to daily variations due to changes in environmental conditions.
We present the main results of several intercomparison exercises carried out at this laboratory. The results involve active and passive detectors covering a wide range of radon exposures.
Introduction
The new Basic Safety Standards (BSS, 2013) for protection against the dangers arising from exposure to ionizing radiation are under discussion at the level of European Council with the objective of issuing a proposed directive. The subject matter of the proposed directive is to establish a Community framework under the basic safety standards for the protection of human health. In particular, the Directive applies to the management of existing exposure situations, including the exposure of members of the public to indoor radon, external exposure from building materials and cases of lasting exposure resulting from the after-effects of an emergency or a past activity. The Annex XVI of the document summarizes the list of items to be covered in the national action plan to manage long-term risks from radon exposures: The list includes:
(1) Strategy for conducting surveys of indoor radon concentrations or soil gas concentrations for the purpose of estimating the distribution of indoor radon concentrations, and the management of measurement data and for the establishment of other relevant parameters (such as soil and rock types, permeability and radium-226 content of rock or soil).
(2) Methodology, data and criteria used for the delineation of areas or for the definition of other parameters that can be used as specific indicators of situations with potentially high exposure to radon.
54

(3) Based upon the risk assessment and other factors (e.g. duration of occupancy) identify types of workplaces and buildings with public access, such as schools, underground workplaces, and those in certain areas, where measurements would be required,
(4) The basis for the establishment of a reference action level for dwellings and workplaces. If applicable, the basis for the establishment of different reference levels for different uses of buildings (dwellings, buildings with public access, workplaces) as well as for existing and for new buildings.
(5) Assignment of responsibilities (governmental and non-governmental), including coordination mechanisms and available resources for implementation of the action plan.
(6) Strategy for reducing radon exposure in dwellings and for giving priority to addressing the situations identified under point 2.
(6a) Strategies for facilitating post construction remedial action.
(7) Strategy, including methods and tools, for preventing radon ingress into new buildings, including the identification of building materials with significant radon emanation.
(8) Schedules for reviews of the action plan.
(9) Strategy for radon and smoking risk communication to increase public awareness and inform local decision makers, employers and employees.
(10) Guidance on methods and tools for radon measurements and remedial measures. Criteria for the accreditation of measurement and remediation services shall also be considered.
(11) Where appropriate, provisions of financial support for radon surveys and for remedial measures, in particular for private dwellings with very high radon concentrations.
(12) Long-term goals in terms of reducing lung cancer risk attributable to radon exposure (for smokers and non-smokers).
(13) Where appropriate, consideration of other related issues and corresponding programmes such as programmes on energy saving and indoor air quality.
This European Directive will apply to all member states including those with radon programs in different stages of development. In the case of Spain, the need for a Radon Program covering the requests from the new BSS includes the creation of laboratories with expertise on radon measurement. Therefore our group, in collaboration with ENUSA S.A. (Spanish National Uranium Company), has created the Laboratory on Natural Radiation (LNR located at an old uranium mine in Saelices el Chico (Salamanca, Spain). At this moment, an on-going project is improving the resolution of the Spanish radon map by means of radon measurements in 10 km2 squares in the whole country. Figure 1 shows the map available at this moment.
55

Figure (1): Radon map of Spain. The squares are 10km2 and they have been classified into four zones according to the geometric mean of radon values
In order to be ready for the moment when the new European Directive will come into force, our group is preparing a European project to deal with the harmonization of the different criteria already in use in Europe. They include different radon reference levels, action limits, different criteria to decide if using radon concentration or dose due to radon in the levels etc.. The main objective is to harmonize these standards to apply the requirements of the Annex XVI in all member countries.
Description of the Laboratory on Natural Radiation (LNR)
This laboratory is located at a site (old uranium mine) where sources of natural radioactivity are readably available. This allows for the testing of instruments and detectors under temperature and atmospheric pressure conditions typically found in homes and work places. The site, shut down in 2004, has been undergoing restoration. The building selected for the laboratory (Figure 2) was formerly used for the treatment of uranium mineral and had to be converted to a natural radiation calibration facility. This task was performed by the Radon Group, in collaboration with ENUSA. At the site, Radon concentrations and external gamma radiation are subjected to daily variations due to changes in environmental conditions. Thus, the laboratory of natural radiation is the perfect place for the performance of experiments devoted to the analysis of environmental radioactivity as well as a location for testing instruments specialized on the measurement of natural radiation. In May 2011, the lab conducted its first intercomparison exercise under field conditions (Figure (2)).
56

Figure (2): View of the Laboratory on Natural Radiation located at the facilities of an old uranium mine (Saelices el Chico, Spain)
The building is a 2-story house with four rooms on the ground floor. Two of the rooms play the role of radon chambers and one of them has an artificial ventilation system installed. The biggest room on the ground floor (working area) has area available for up to 30 working spaces. Room 4 is employed for the measurement of radon in water. Figure (3) shows the radon in water standard used for performing the experiments. The barrel is totally filled with water with soil containing high uranium concentrations lying at the bottom. The radon is dissolved uniformly in the water reaching a concentration of approximately 450 Bq l-1.
Figure (3): Radon in water standard sample located on the ground floor of LNR
57

The upper floor of the building is composed of a conference room, and a third radon chamber where the concentrations are low (100 – 200 Bq m-3). In addition, this room also has installed an artificial ventilation system to reduce the radon levels.
Intercomparison exercise on external gamma dose rate
Outside the main building there are two sites assigned for the determination of external gamma dose as shown in Figure (4). The two sites have values of absorbed doses between 110 and 1800 nGy h-1.
The first intercomparison on natural radioactivity under field conditions was held in the old uranium mine of ENUSA in the municipality of Saelices el Chico (Salamanca, Spain) from 23 to 27 of May 2011 (Gutierrez-Villanueva et al., 2012). The meeting was organised by the Radon group of University of Cantabria (Spain). The main objective of this event was to test different instruments and detectors for the measurement of radon gas and external gamma radiation (dose rate) in real conditions at a location where the levels of natural radiation were quite high.
Figure (4): Site located outside the main building of LNR with a known gamma dose rate values
A total number of 11 laboratories participated in the exercise. They reported the results in terms of the mean value obtained individually at different points of the test site. The ambient conditions such as temperature were monitored during the exercise. Therefore it was demonstrated the effect of this parameter when determining the external gamma dose rate by means of kerma values. Figure (5) and Figure (6) shows the results for the sites with a reference value of 110 ± 2 nGy h-1 and 1870 ± 50 nGy h-1.
58

Figure (5) Results of external gamma dose rate in a reference site 110 nGy h-1
The results of this were recently published (Gutierrez-Villanueva et al., 2013). They indicate that the measurements of most of the laboratories agree within 25 % at the two sites tested. If the effect of temperature in some of the detectors used in the intercomparison were taken into account, the results could be improved. For example one improvement could be reached by correcting the photon energy response to the calibration technique.
In addition, an evaluation of the results provided by all laboratories using the evaluation criteria provided by IAEA in its intercomparisons (IAEA, 2011) revealed that only 25 % of the labs passed the test.. Hence, the calibration of radiation detectors in a laboratory, although a necessary condition, is never enough to attain good results in real world measurements.
59

Figure (6): Results of the test in the reference point with high levels of external gamma dose
Conclusions
The Laboratory of Natural Radiation located at Saelices el Chico (Spain) is a natural radioactivity facility available for the entire research community. This unique laboratory provides the opportunity to verify the behaviour of external gamma radiation and radon gas measurement equipment at different temperature, humidity and barometric pressure under actual field conditions. To have such a service is very important in order to fulfil the requirements from the new European Basic Safety Standards that will come into effect in the next few months.
60

References
1. Basic safety standards for protection against the dangers arising from exposure to ionising radiation. Council Directive 2013.
2. Jose Luis Gutierrez-Villanueva, Carlos Sainz Fernandez, Ismael Fuente Merino, Luis Quindos Lopez, Jorge Quindos Lopez, Alicia Fernandez Villar, Sara Eva Casal Ordas, David Lopez Abascal, Diego Arteche Laso, Enrique Fernandez Lopez, Luis Santiago Quindos Poncela. International intercomparison Exercise on natural radiation under field conditions. PUbliCan, Ediciones de la Universidad de Cantabria. ISBN 978-84-86116-64-4, 2012
3. J.L. Gutierrez-Villanueva, C. Sainz, I. Fuente, J.C. Sáez-Vergara, E. Correa, L.S. Quindos. Poncela. Intercomparison exercise on external gamma dose rate under field conditions at the laboratory of natural radiation (Saelices el Chico, Spain). Radiation Protection Dosimetry 155 (4), 459-466, August 2013
4. Worldwide Open Proficiency Test: Determination of Natural and Artificial Radionuclides in Moss-Soil and Water IAEA-CU-2009-03, 2011.
61

SUPER MOON 2012 SHEDS LIGHT ON RADON GAS MIGRATION A Case Study of Environmental Influences On A Residential Radon Test
By Mark H. Whitehead
Pro Foundation Technologies, Inc. [email protected]
Abstract
This is a case study of environmental influences on a 96 hour residential radon test near Kansas City, Missouri. The test period (May 14-18, 2012) was during dry mild weather, lacking typical spring time atmospheric turbulence. The media coverage of the “Super Moon” which occurred
earlier in May prompted comparison of environmental influences. This case involves one dwelling, typical of many mid-American single family homes. The absence of major weather turbulence during the test period provided a good opportunity to compare temperature, barometric pressure, and wind. To evaluate the influence of the moon, 97 radon measurements were plotted with the Galveston Bay tide chart, which falls on the same longitude, about 600 miles south of the test site. The plotted data shows significant synchronicity between radon readings and tidal fluctuations. The timing of the tides closely matched the timing and magnitude of changing radon levels.
Study Summary
A building study in the Central Plains of the United States demonstrates what others have found to be a strong relationship between environmental radon gas fluctuations and the moon. Time plots of a Kansas City area radon test, superimposed with Galveston tide charts from a web based fishing site show a noticeable parallel. Mild weather and temperatures during May provided a good opportunity to evaluate radon levels with minimal interference from atmospheric turbulence. Fluctuating radon levels over a 96 hour sampling period, closely matched fluctuating tide changes. Though the tide chart was for a point about 600 miles south of the test location, the high and low radon readings closely matched the timing of the high and low tides, and proportionally matched the magnitude of the tide changes. This radon test site was in a walk-out basement, about 950 feet above sea level, on a 10-acre tract of land described by the county soil survey as silt loam.
Background Radon is the heaviest of the naturally occurring gases found on earth. It is a colorless, odorless, radioactive decay product of uranium. Medical research has identified radon as the second leading cause of lung cancer.1 Real estate transactions occasionally include radon testing at the
62

buyer’s request, during the property inspection period. For Missouri and Kansas, the standard
test period is four days, or 96 hours. Current EPA guidelines recommend radon mitigation if standardized tests show levels at or above 4 pCi/L.2 The subject of this study is a 96 hour residential radon test in Clay County, Missouri beginning on May 14, 2012 and completing on May 18, 2012. This test period was during dry, mild weather conditions, with no rain or extreme weather changes. Weather information was provided by the Weather Underground website, www.wunderground.com, (see Figure 1.) Publicity of the May 2012 “Super Moon” encouraged consideration of lunar position in the analysis. This was done by superimposing the radon time plot onto a tide chart for Galveston Texas, near the same longitude of the rural Missouri test site. Tide information was provided by the website www.gofishingforum.com (see Figure 2.) The test site was a single family brick and wood framed ranch style residence (about 2000 SF) built on a lot of about 10 acres surrounded by undeveloped land. The ranch style dwelling had a partially finished basement of about 1000 SF in size. The house was occupied by senior adults with no children during the test week. The owners indicated negligible ventilation changes, and no entry into the test area. The motion sensor on the test instrument flagged one motion event at the beginning of the test period. The test instrument used was a Sun Nuclear Model 1028 Continuous Radon Monitor, placed in the center of the finished basement area, on a table about 36 inches above the floor. The recorded plot generated by the instrument was downloaded to a computer and copied to a Visio drawing with the weather and tide information. See Figure (1). This figure superimposes the radon sampling plot over each of the five weather parameters reported by Weather Underground Private Station MAU327 (about 5 miles NNW of the test site) for the week of 5/13/2012. (See www.wunderground.com)
Temperature Effects
Figure ( 1A) shows an outdoor sinusoidal temperature plot. As temperature rises in the building attic, one would expect air to be drawn in through cracks around and under the house. The air conditioned indoor temperature was estimated to be constant. The dwelling isa well built brick and wood frame home with tight windows and doors, so outdoor temperature may have a smaller impact on this structure. Figure (1A) implies that radon levels are rising and falling independent of the outdoor temperature changes.
Barometric Pressure Effects
Figure (1B) shows the general trend of barometric pressure during the test period is decreasing with slight undulations. Though second order pressure fluctuations may have influence on the changing radon levels, this plot shows major changes in opposition to the expected barometric effects, such as a major rise in radon levels early Wednesday, at the same time barometric pressure is rising.
63

64

Wind Speed Effects
Figure (1C) shows average wind speed and gust velocity. The tight windows and doors may have minimized the influence of wind effects during this test, and the low wind speed helped reduce air exchanges from wind. Some radon fluctuations may be influenced by wind gusts. Overall, the radon levels appear independent of the moderate winds during this test period.
Wind Direction
Figure (1D) plots the wind direction during the test week. The direction is random, and does not appear to have a strong influence on the radon levels.
Rainfall Effects
Figure (1E) charts the Rainfall Rate and duration. There was no recorded rain during the test week. Extended dry conditions opened visible cracks in the surrounding soil. This significantly increased gas permeability of the soil surface, and likely increased the vertical depth of soil contributing to gas migration.
Local Soil Properties Site specific soil testing was not performed. The Web Soil Survey was reviewed to consider commentary from county soil survey information. The Web Soil Survey (WSS) identified local soil as Sharpsburg silt loam on the south side of the dwelling (front yard), transitioning to Lagonda silty clay loam on the north side (back yard sloping 5-9% to the north, away from the walk out basement. Lacking site specific analysis, the visible conditions were consistent with the WSS description, so the properties below were assumed to generally describe the shallow surface soil. See Chart (1). .
Physical
Properties %Sand %Silt %Clay Permeability
(micro m / sec) Linear
Extensibility (%)
0-17” 2-2-3 50-72-87 18-26-27 4.00-14.00 3.0-5.9 17-55” 1-2-6 40-63-72 27-35-42 0.40-1.40 3.0-5.9 55-60” 2-2-7 40-59-72 25-39-39 0.40-1.40 6.0-8.9
Chart (1): Sharpsburg silt loam chart table (Map unit symbol 10120) provided by the Web Soil
Survey, Physical Soil Properties Report www.websoilsurvey.nrcs.usda.gov The shrink/swell potential, rated above as Linear Extensibility, does imply that dry conditions could result in significant soil shrinkage, and increased gas permeability.
65

Assuming the silt loam soil continued with properties similar to the table above, it is likely that gas permeability of the fine grained soil decreased with depth. Past foundation repairs at this site included the installation of six hydraulically driven micro-piers. These piers were driven to refusal at about 20 feet below the foundation. Each pier is composed of 3 inch diameter hollow steel pipe segments, with nested slip joints every three feet. A potential gas migration pathway is created by this type of repair.
Tidal Effects
The variations in the radon levels closely match variations in the Galveston tide chart. The timing of the high and low tide events closely match the maximum and minimum radon level readings. With weather interference minimized during this test period, the synchronicity of the radon levels and tide levels is highlighted. See Figure (2)
ig
66

Conclusions
Though the test duration is too brief to be conclusive, the radon level changes show a strong match with the tide chart. Though tidal pumping may have an influence, the instantaneous radon changes indicate the likely source of the gas is very close to the surface. Soil gas migration in the shallow soil would move much easier than through deeper, less permeable material. It is likely that the gas level fluctuations in this study result from the lunar/solar gravity influence on radon in the permeable shallow soil. It appears that the intermediate low tides between the lunar and solar high tides on Tuesday and Thursday mornings correspond to intermediate radon level changes. Tidal and gravitational radon influence have been documented in a British study (see Crockett, et al. 3) and an Israeli Study (see Steinitz , et al.4) Weather, soil, and construction variables complicate the predictability of radon levels in any given location. A separate Missouri house study by the writer, found ice and snow in February, increased radon levels 400% compared to September readings during mild weather. The mild weather conditions of this study minimized many of the environmental influences common to residential radon tests. This highlighted radon’s sensitivity to gravity. Tide chart analysis is well beyond the scope of residential radon testing efforts. Weather interference, local geology, and site differences can obscure the gravitational fluctuations shown in this brief study. But for the scientist and engineer that seeks to measure and understand the forces at work in this world, it should not be missed, that the same powerful forces that move the tides, move the heaviest naturally occurring gas on this planet.
67

Notes
1 American Cancer Society, <http://www.cancer.org/Cancer/LungCancer-Non-SmallCell/DetailedGuide/non-small-cell-lung-cancer-risk-factors>.
2 Consumer’s Guide To Radon Reduction, How to fix your home; EPA 402/K-10/005,
September 2010, <www.epa.gov/radon>.
3Crockett, R. G. M., G. K. Gillmore, P. S. Phillips, A. R. Denman, and C. J. Groves-Kirkby (2006), Tidal synchronicity of built-environment radon levels in the UK, Geophys. Res. Lett., 33, L05308, doi:10.1029/2005GL024950.
4J Environ Radioact. 2011 Aug;102(8):749-65. doi: 10.1016/j.jenvrad.2011.04.002. Epub 2011 May 7. Possible effect of solar tides on radon signals. Steinitz G, Piatibratova O, Kotlarsky P. Source: Geological Survey of Israel, Malkhei Israel, Jerusalem. [email protected]
68

RADON RISK COMMUNICATION STRATEGIES: A REGIONAL STORY
Winnie Cheng, Regional Radiation Specialist, Health Canada, BC Region Master of Environmental Toxicology, C-NRPP Measurement & Mitigation Certified
Abstract Risk communication on the health effects of radon encounters many challenges and requires a variety of risk communication strategies and approaches depending on the audience. The concern over radon exposure and its health effects may vary according to people’s level of knowledge and receptivity. Homeowners in radon-prone areas are usually more informed and have greater concern over those who are in non-radon prone areas and are more likely to be willing to measure the radon level in their homes. Those living in areas that are less likely to have high radon levels are often found to be resistant to testing. In British Columbia (BC), as well as many other parts of the country, there have been homes lying outside of the radon-prone areas with radon levels above the Canadian Guideline, which is the reason Health Canada recommends that all homes should be tested. Over the last five years, the Environment Health Program (EHP) of Health Canada in B.C. region has been using a variety of different approaches in their radon risk communications through social media, workshops, webinars, public forums, poster contests, radon distribution maps, public inquiries, tradeshows and conference events and partnership with different jurisdictions and non-government organizations. The valuable lessons learned from these approaches are discussed in this paper.
Introduction Risk communication is a shared interest of policy makers and stakeholders. Many agree that communicating risk to the public is a complicated undertaking and it poses formidable challenges.1 One of the key communication challenges with radon has to do with public apathy.2 Contrary to technological hazards such as radioactive contamination or toxic wastes, public perception on radon risk represents an optimistic bias.3 Another communication challenge stems from the fact that radon occurs naturally, thus there is no “villain” to blame and there are not
1 Isaac M. Lipkus and J. G. Hollands. “The Visual Communication of Risk,” Journal of the National Cancer Institute
Monographs No. 25, 1999, p. 149; F. Reed Johnson and Ann Fisher, Conventional Wisdom on Risk Communication and Evidence from a Field Experiment, Risk Analysis, Vol. 9, No. 2, 1999, p. 213. 2 P. Sandman. Available at: http://www.psandman.com/articles/explain1.htm, accessed June 25, 2013.
3 N. D. Weinstein, M. L. Klotz, and P. M. Sandman, “Optimistic biases in public perceptions of the risk from radon,”
Am. J. Public Health, 1988 July, 78(7), p. 799.
69

many obvious radon “victims”.4 In fact, any harmful health effects of radon often do not show up for a long time. Radon exposure occurs primarily in a person’s home, and thus it is an individual’s responsibility
to test and mitigate for radon. The nature of this situation rules out conventional regulatory approaches that are used in managing pollution sources.5 For this reason, regulatory bodies turn to information programs as a way of risk communicating and encouraging voluntary reductions in risk.6 The perception of radon as a “low-risk problem” is attributable to multiple factors including the absence of federal regulations, competing environmental concerns presented daily in the media, concerns about home values and public apathy.7 The Environment Health Program (EHP) of Health Canada in the British Columbia (BC) Region has been using a diverse approach in their communication of radon risks, which includes responses to public inquiries, tradeshows and conference events, social media, workshops, webinars, public forums, poster contests and radon distribution maps. Radon risk communication efforts through the EHP has benefitted from partnerships with different jurisdictions and non-governmental organization, who aid in adding strength and credibility to the message. This paper presents the lessons learned from radon testing in federal buildings, as well as education and awareness (E&A) activities for the public in the BC region. In particular, it presents knowledge of the public’s misconceptions of radon risk and the strategies that are used to “demystify” them.
Strategies to Demystifying the Radon Myth Myth 1: Radon should remain low on the scale of concern for the public. Radon does not seem to cause any visible health effects. There are no obvious “dead bodies” and lung cancer caused by
radon exposure, if it occurs, will not be for many years. Such human perceptions present considerable challenges to the design of an effective risk communication strategy in overcoming public apathy towards radon. Based on Health Canada’s latest survey, indoor radon exposure causes the deaths of approximately 3,200 Canadians every year – 16 per cent of all lung cancer deaths.8 Thus, it
4 Ann Fisher and F. Reed Johnson. “Radon Risk Communication Research: Practical Lessons,” J. Air Waste Manage.
Assoc., 1990, 40:5, 738-739. 5 W. H. Desvousges, V.K. Smith, and H.H. Rink III. “Communicating Radon Risk Effectively: Radon Testing in
Maryland,” EPA-230-03-89-048, Washington, B.C., U.S. Environmental Protection Agency, 1989, p. 177. 6 F. Reed Johnson and Ann Fisher. “Conventional Wisdom on Risk Communication and Evidence from a Field
Experiment,” Risk Analysis, Vol. 9, No. 2, 1999, p. 209. 7 Dominic Golding, Sheldon Krimsky, and Alonzo Plough. “Evaluating Risk Communication: Narrative vs. Technical
Presentations of Information about Radon,” Risk Analysis, Vol. 12 (no. 1), 1992, p. 34. 8 Health Canada’s Ministerial Message released in November 2012: “Lung Cancer Awareness Month.” Available at:
http://www.hc-sc.gc.ca/ahc-asc/minist/messages/_2012/2012_11_01-eng.php, accessed June 26, 2013.
70

makes radon the second cause of lung cancer after smoking.9 Radon is the largest source of natural radiation exposure,10 as it represents over 30% of the radiation people are exposed to in a lifetime.11 In addition, one in three people who have had long-term exposure to elevated radon levels and tobacco smoke will be diagnosed with lung cancer.12 Overall, the number of radon-related deaths in Canada from lung cancer is about 25 percent higher than the number of traffic-related deaths, and greatly exceeds the number of deaths due to accidental poisoning and homicides.13 According to the Canadian Cancer Statistics 2013 report released by the Canadian Cancer Society, the Public Health Agency and Statistics Canada, BC has 139 cancer deaths per 100,000 populations (9,700 deaths in the total population), with the leading cause of cancer death being lung cancer.14 Thus, with respect to Myth #1, the use of statistical or quantitative information in risk communications is needed to raise public concern over radon exposure and its health risks. Myth 2: The perception of indoor radon exposures as natural, therefore, people should have no or little control. This statement is not correct. While sources of radon are ultimately geological, yet natural, high indoor radon exposures may not be. Indoor radon levels can be artificial if they are the consequence of human activities such as building design, construction and usage.15 In addition, indoor radon concentrations can be easily measured and if found to be high can be reduced, therefore people do have control if they choose to take preventative action. Elevated levels of radon can be attributable to human activities, particularly when a building has been upgraded with energy efficient measures, therefore making it “air-tight.” In one example, the owners of a 110 year old house in Peachland of BC (a radon rich area), conducted a six month radon test in various areas of their home .16 When the log house was “sealed” for energy
conservation and refitted with double glazed windows, the radon levels were found to increase substantially. In certain areas of the house, levels of the radioactive gas were as high as 2,035 Bq/m3 (55 picocuries/L). Both the main floor and upper floor were measured to be above 1,000 9 Health Canada. “Cross-Canada Survey of Radon Concentrations in Homes - Final Report.” Available at:
http://www.hc-sc.gc.ca/ewh-semt/radiation/radon/survey-sondage-eng.php, accessed June 26, 2013. 10
Canadian Nuclear Safety Commission, “Natural Background Radiation”. Available at: http://www.nuclearsafety.gc.ca/eng/readingroom/factsheets/background-radiation.cfm, accessed June 26, 2013. 11
Canadian Nuclear Safety Commission, “Radon and Health,” INFO 0813, ISBN 978-1-100- 17765-6. Available at: http://www.stratecoinc.com/data/pdf/2011/CNSC_RadonandHealth_Feb2011.pdf, accessed June 26, 2013. 12
Health Canada: “Radon Is It In Your Home?” Available at: http://www.hc-sc.gc.ca/ewh-semt/pubs/radiation/radon_brochure/index-eng.php, accessed June 26, 2013. 13
Statistics Canada, “Mortality, Summary List of Causes – 2009.” Available at: http://www.statcan.gc.ca/pub/84f0209x/2009000/t001-eng.pdf, accessed June 26, 2013. 14
Canadian Cancer Society. “Canadian Cancer Statistics publication.” Available at http://www.cancer.ca/en/cancer-information/cancer-101/canadian-cancer-statistics-publication/?region=on, accessed June 26, 2013. 15
Radon Prevention and Mediation (RADPAR). “Report: Radon Risk Communications Strategies,” RADPAR WP 5 Deliverable D12, September 2011, p. 4. 16
Paterson, Wade. “Peachland couple warns of high radon levels in Okanagan homes,” Kelowna Capital News. Available at: http://www.kelownacapnews.com/news/175626021.html, accessed June 26, 2013.
71

Bq/m3 in the winter months. The owners subsequently contracted a radon mitigation specialist to reduce the radon levels in the house. Elevated radon ingress can be due to the structure of the building, as well as the operational activities that take place within it. This was the situation at a fish hatchery, in a non-radon rich area in BC. Various buildings at the site that met Health Canada’s testing criteria of occupancy (>4 hours per day) were tested. All buildings tested at the site were found to be below Health Canada’s Guideline level, except the offices right below a water aeration tower, which had radon levels at approximately 1,100 Bq/m3. The office building with a water aeration tower has a rather unique structure, in that the aeration tower was constructed on top of the administration office that was found to have high levels of radon. It was noted that well water from two aquifers was supplied to the aeration tower. The water was then allowed to fall from a height through a series of segmented columns. The purpose of this was to dissipate undesirable gases (such as nitrogen) and add oxygen to the water prior to being used for hatchery purpose. According to the “Radon in British Columbia Work Places,” a report of Work Safe BC (RS2006-DG09), “Land-based fish hatcheries normally use large quantities of water that has come from an underground source. Hatcheries having the aeration tower contained within the building envelope are particularly prone to having the highest radon levels.”
17 It has been reported that radon levels in groundwater can generate up to 40 times more radon in indoor air at a commercial fish hatchery.18 Human habits associated with the use of a room can also contribute to elevated levels of indoor radon. For example, in a public building located in a radon-rich area in BC, the offices on the main floor (on slab) were tested for radon. While some offices tested were below the guideline level, three offices tested on the same floor were above the guideline. Thus, the geological location, the structure of the building and the ventilation system could not account for the discrepancies in the results. The only conceivable difference was that the occupants of the three offices had the habit of closing their office doors during and after work, whereas the doors of the offices that tested low were left open all the time. The habit of keeping the office doors closed by the occupants influenced the amount of air flow, thus creating differences in the radon levels tested. The aforementioned scenarios reveal how building structures and human activities may contribute to high levels of radon. They enhance our knowledge base through experience, and serve as narrative or qualitative information for risk communication. To demystify Myth #2 in risk communication, it is paramount to underscore that while sources of radon are naturally occurring, high indoor radon exposures can be due to human activities. Thus, the concentration
17
Ray Copes. “Radon in British Columbia Work Places,” RS2006-DG09, Work Safe BC, p. 15. 18
Michael Kitto, Charles Kunz, Craig McNulty, Michael Kuhland and Scott Covert, “Radon Mitigation of Groundwater at a Commercial Fish Hatchery,” 1995 International Radon Symposium, V – 1.1.
72

of radon may vary widely from house to house, building to building, and may be contingent upon the human “factor.” When radon is stated as being naturally occurring, the human component that influences exposure to radon should also be mentioned. More importantly the human component that can prevent the risk from radon exposure should be emphasized; it is easy and inexpensive to test and if levels are high they can be reduced at a reasonable price. Myth 3: Testing is expensive and the house value will be affected after mitigation. The public has a general perception that radon problems may involve economic costs. For example, homeowners will have to buy and use a radon monitor and possibly pay for expensive mitigation. Radon communications intended to motivate testing may not be successful in situations where the homeowner lacks the resources to remediate any problems that they find.19 Additionally, concerns over property values may also discourage people from testing, or from sharing or disclosing the results of their tests. Desvousges et al. (1989) found that nearly half of homeowners surveyed thought that their home would be worth a lot less even if a radon problem was fixed.20
To address concerns surrounding Myth #3, risk communication must underscore the fact that testing is not expensive and that radon reduction is reasonably priced, comparable to other home maintenance costs such as replacing a furnace or air conditioner. Obtaining a reliable radon protection plan may be a viable option to reduce the cost of mitigation. Effective risk communications must achieve an informed decision that radon risks can be addressed less expensively than many other health risks.21 It is important to emphasize that all homes have radon, a person’s house is not bad or contaminated if it has radon. Homeowners need to know
how much to decide if the level is too high and needs to be fixed.
Myth 4: Radon distribution maps are reliable sources for measurement and mitigation related decision making for individual homeowners. Radon maps can be developed based on indoor radon measurements, geology, aerial activity, soil permeability and foundation type. While maps can increase understanding, simplify complex concepts quickly, and enable easy comparisons, they are only as good as their intended purpose. Graphical displays and visual communication of risk through a radon map can offer unique benefits for improving overall communications to stakeholders and the public.22 However, they may also lead to a false sense of complacency and reluctance to initiate testing. Radon distribution maps are not intended to be used for determining whether a home in a given zone should be tested for radon, but rather to help regulators target their resources.
19
O. Svenson and B. Fischoff. “Levels of Environmental Decisions,” Journal of Environmental Psychology, 5 (1985): 55-67. Referenced by Ann Bostrom, Cynthia J. Atman, Baruch Fischoff, and M. Granger Morgan. “Evaluating Risk Communications: Completing and Correcting Mental Models of Hazardous Processes, Part II,” Risk Analysis, Vol. 14, No. 5, 1994, p. 796. 20
W. H. Desvousges, V.K. Smith, and H.H. Rink III. “Communicating Radon Risk Effectively: Radon Testing in Maryland,” EPA-230-03-89-048, Washington, B.C., U.S. Environmental Protection Agency, 1989, p. 175. 21
Ibid., p. 177. 22 Lipkus et al. “The Visual Communication of Risk,” p. 149.
73

According to Health Canada’s 2009-2011 Cross Canada Radon Survey and Federal Building testing program in BC, homes and buildings with elevated levels of radon were found in thirteen out of sixteen health regions throughout the province.23 As mentioned previously, radon ingress results from both natural causes and human activities. Therefore, with respect to Myth #4, an important risk communication message is that all homes have some level of radon and therefore need to be tested regardless of geographic location. Myth 5: A radon risk communication strategy will be equally applicable or effective in all regions. The actual communication strategy chosen in a region will depend on a number of factors such as the extent of the radon problem in that region, the present state of public knowledge of radon, the available budget, the existence of a national radon reference level, and national and provincial building codes. In general, people respond better to risk information that is both quantitative and qualitative, than through either one alone. Quantitatively, people need to know the guideline level, the duration of time for mitigation action and the statistics on radon health effects. Qualitatively, people are inspired by real life stories of those who have been impacted by radon / have contracted lung cancer from radon and by success stories of bringing radon levels down through mitigation. Thus, effective risk communication needs to involve the use of both qualitative and quantitative information.24 A very popular, visual tool that EHP has used in communicating radon risk is the Radon Model House developed by Health Canada for use in all regions. The model house demonstrates the various entry routes of radon into a home and mitigation measures that can be employed, such as active sub-slab depressurization units. The characteristics of homeowners also come into play regarding their concerns over health. Older people are less willing to acquire health risk information, whereas people with existing health concerns are more willing to acquire health risk information.25 Educating young people could be one approach for helping to disseminate health risk information to other age groups.26 With the support from Health Canada, BC’s Interior Health Authority conducted an annual poster contest targeting junior secondary students in radon-rich areas to raise awareness on radon. In addition, through contracting a non-profit organization, EHP was able to use popular social media tools (such as Twitter, Facebook, Youtube, etc.) to reach out to a wider audience. Socioeconomic and ethnic diversity components also influence the risk communication process. For example, the demographics in BC indicate a diverse ethnic population. Cultural and ethnic
23
Health Canada: “Cross-Canada Survey of Radon Concentrations in Homes - Final Report.” Available at: http://www.hc-sc.gc.ca/ewh-semt/radiation/radon/survey-sondage-eng.php,, accessed June 26, 2013. 24
V. Kerry Smith, William H. Desvousges and Ann Fisher. “Communicating Radon Risk Effectively: A Mid-course Evaluation,” EPA-230-07-87-029, U.S. Environmental Protection Agency, July 1987, p. 5. 25
F. Reed Johnson and Ann Fisher. “Conventional Wisdom on Risk Communication and Evidence from a Field Experiment,” Risk Analysis, Vol. 9, No. 2, 1999, p. 211. 26
RADPAR, p. 30.
74

background may affect people’s perception about radon risk. Some people may be relatively less receptive to radon risk messages, and thus the process of risk communication cannot be isolated from the broader social and cultural context. This variability poses challenges in terms of managing environmental risks across a culturally heterogeneous society. To engage with different ethnic communities, EHP has exhibited a radon booth at various ethnic community health fairs. Vaughan (1995) underscores the importance of understanding the different patterns of responding to risk situations, and how the communication process evolves within varying socio-cultural environments.27 It is well recognized that risk communication may enhance public knowledge and encourage informed consent without resulting in changes in behaviour.28 Johnson (1988) contends it is a rather naïve assumption that information programs will motivate people voluntarily and rationally to reduce risks.29 Thus with respect to Myth #5, due to the various factors that influence responses to radon risk communication, it cannot be expected that one radon risk communication strategy will be equally applicable or effective in all regions. As Doyle et al. states, solving the radon problem will require a mix of risk communication, incentives and regulation.30
Myth 6: Risk communication is a lone task. Health Canada in BC Region is privileged to benefit from partnerships with other federal department(s) and local health authorities to share expert knowledge, and support education and awareness (E&A) on radon (that is through radon public forums). Given the often apathetic response to the health risk from radon exposure it is very valuable to partner with other relevant stakeholders (other levels of government, health professionals, non-governmental organizations and building and construction industry for example) to strengthen the credibility of the message and increase the reach and impact. Some of Health Canada’s roles include the Canadian Guideline for radon, producing radon guides and fact sheets, coordinating the federal building testing program, and assisting radon initiatives by local health authorities. The Province of BC (the Building and Safety Standards Branch of the Ministry of Energy, Mines and Natural Gas) administers the BC Building Code to prevent radon ingress, and funds Education and Awareness initiatives. Local Health Authorities in radon-rich areas actively promote E&A in their areas, and provide expertise to coordinate testing in public schools and daycare centres.
27
Elaine Vaughan. “The Significance of Socioeconomic and Ethnic Diversity for the Risk Communication Process,” Risk Analysis, Vol. 15 No. 2, 1995, pp. 178-179. 28
Dominic Golding, Sheldon Krimsky, and Alonzo Plough. “Evaluating Risk Communication: Narrative vs. Technical Presentations of Information about Radon,” Risk Analysis, Vol. 12 (no. 1), 1992, p. 28. 29
F. Reed Johnson, Ann Fisher, V. Kerry Smith and William H. Desvousges. “Informed Choices or Regulated Risk: Lessons from a Study in Radon Risk Communication,” May 1988, p. 12. 30
Golding et al. “Evaluating Risk Communication: Narrative vs. Technical Presentations of Information about Radon,” p. 34.
75

EHP is also a member of the provincial Radon Inter-Government Information and Liaison Group that comprises staff from the BC Centre of Disease Control (BCCDC), BC Ministry of Health, Canadian Mortgage and Housing Corporation (CMHC), BC Lung Association (BCLA), Northern Health Authority (NHA), Interior Health Authority (IHA) and Provincial Health Services Authority. This group provides a forum for sharing information on radon issues, and promoting ideas for increasing awareness and testing. Additionally, an annual Radon Workshop is held in Vancouver as a result of collaborative efforts of EHP, BCCDC and the BC Lung Association; targeting health professionals, academia, industry stakeholders (building contractors, home inspectors, etc.) and students. The goal of the workshops has been for participants to understand the current state of knowledge on strategies to reduce residential radon exposure, including challenges and current knowledge gaps. Part of the workshop has been available online to increase the opportunity for people across Canada to participate. Additionally, EHP engages with stakeholders in the building industry such as home inspectors, building contractors and realtors to make radon related presentations, provide information on the National Building Code to prevent radon ingress, and to raise awareness of the Canadian-National Radon Proficiency Program which certifies radon professionals.31 Thus, with respect to Myth #6, Health Canada educates and raises awareness on radon measurement and mitigation by partnering with non-governmental and non-profit organizations.
Conclusion A good risk communication strategy should create the basis for behavioural change and provide clear actions for people to take.32 Due to the nature of the radon problem, six key myths have been identified and demystified for effective risk communications:
1. Radon is truly a serious health threat; lung cancer development and death can be reduced by controlling an individual’s radon exposure.
2. Indoor radon exposures are both natural and artificial. Human activities can bring about an increase or decrease of exposure (i.e. through mitigation). The latter message points to the fact that radon risks can be managed.
3. Testing is easy; mitigation is effective and there are ways to address mitigation costs. 4. A radon distribution map is only as good as its intended purpose — for regulators to
target their resources. The only way to know if there is a radon problem is to test, as radon concentrations can vary from home to home.
5. An effective risk communication strategy calls for a consideration of the demographic and socioeconomic context of the public, and the use of both quantitative and qualitative communication approaches.
31
The Canadian National Radon Proficiency Program (C-NRPP). Available at: http://www.nrpp.info/cnrpp.shtml, accessed June 25, 2013. 32
RADPAR, p. 8.
76

6. Risk communication is a joint effort at the local and national levels. Federal departments, the province, local health authorities and non-profit organization need to collaborate to share knowledge, expertise, resources and ideas that will encourage testing and mitigation.
77

Reference
Bostrom, Ann, Cynthia J. Atman, Baruch Frishhoff, and M. Granger Morgan. 1994. “Evaluating
Risk Communications: Completing and Correcting Mental Models of Hazardous Processes, Part II.” Risk Analysis. Vol. 14 (No. 5): 789-798.
Copes, Ray. 2009. “Radon in British Columbia Work Places.” RS2006-DG09, Work Safe BC.
Desvousges, W. H., V.K. Smith, and H.H. Rink III. 1989. “Communicating Radon Risk Effectively: Radon Testing in Maryland.” EPA-230-03-89-048, Washington, B.C., U.S. Environmental Protection Agency.
Fisher, Ann and F. Reed Johnson. 1990. Radon Risk Communication Research: Practical
Lessons. J. Air Waste Manage Association. 40 (5): 738-739. Golding, Dominic, Sheldon Krimsky, and Alonzo Plough. 1992. “Evaluating Risk
Communication: Narrative vs. Technical Presentations of Information about Radon.” Risk Analysis. Vol. 12 (No. 1): 27-35.
Johnson, F. Reed, Ann Fisher, V. Kerry Smith and William H. Desvousges. 2010. “Informed
Choices or Regulated Risk?: Lessons from a Study in Radon Risk Communication.”
Environment: Science and Policy for Sustainable Development. Vol. 30 (4): 12-35. Johnson, F. Reed and Ann Fisher. “Conventional Wisdom on Risk Communication and Evidence
from a Field Experiment.” Risk Analysis. Vol. 9 (No. 2): 209-213. Michael Kitto, Charles Kunz, Craig McNulty, Michael Kuhland, Scott Covert. 1995. “Radon
Mitigation of Groundwater at a Commercial Fish Hatchery.” 1995 International Radon Symposium, V – 1.1.
Lipkus, Isaac M. and J. G. Hollands. 1999. The Visual Communication of Risk. Journal of the
National Cancer Institute Monographs. No. 25: 149-163. Radon Prevention and Remediation (RADPAR). 2011. Report: Radon Risk Communications
Strategies. RADPAR WP 5 Deliverable D12. Smith, V. Kerry, William H. Desvousges and Ann Fisher. 1987. “Communicating Radon Risk
Effectively: A Mid-course Evaluation.” EPA-230-07-87-029, U.S. Environmental Protection Agency.
78

Svenson, O. and B. Fischoff. 1985. “Levels of Environmental Decisions,” Journal of Environmental Psychology. 5: 55-67.
V. Kerry Smith and William H. Desvousges. 1990. Risk Communication and the Value of
Information: Radon as a Case Study. The Review of Economics and Statistics. Vol. 72 (No. 1): 137-142.
Vaughan, Elaine. 1995. “The Significance of Socioeconomic and Ethnic Diversity for the Risk
Communication Process.” Risk Analysis. Vol. 15 (No. 2): 178-179. Weinstein, N. D., M. L. Klotz and P. M. Sandman. 1988. “Optimistic biases in public
perceptions of the risk from radon.” Am. J. Public Health. 78(7): 796–800. Web Reference Canadian Cancer Society. “Canadian Cancer Statistics publication.” Available at:
http://www.cancer.ca/en/cancer-information/cancer-101/canadian-cancer-statistics-publication/?region=on. Accessed June 26, 2013.
Canadian Nuclear Safety Commission, “Natural Background Radiation”. Available at:
http://www.nuclearsafety.gc.ca/eng/readingroom/factsheets/background-radiation.cfm. Accessed June 26, 2013.
Canadian National Radon Proficiency Program (C-NRPP). Available at
http://www.nrpp.info/cnrpp.shtml. Accessed June 26, 2013. Canadian Nuclear Safety Commission, “Radon and Health,” INFO 0813, ISBN 978-1-100-
17765-6. Available at: http://www.stratecoinc.com/data/pdf/2011/CNSC_RadonandHealth_Feb2011.pdf. Accessed June 26, 2013.
Health Canada. Ministerial Message released in November 2012: “Lung Cancer Awareness Month.” Available at: http://www.hc-sc.gc.ca/ahc-asc/minist/messages/_2012/2012_11_01-eng.php. Accessed June 26, 2013.
____________. Cross-Canada Survey of Radon Concentrations in Homes - Final Report.
Available at: http://www.hc-sc.gc.ca/ewh-semt/radiation/radon/survey-sondage-eng.php Accessed June 26, 2013.
____________. Radon: Is it in your home. Available at: http://www.hc-sc.gc.ca/ewh-
semt/pubs/radiation/radon_brochure/index-eng.php. Accessed June 25, 2013. Lundgren, E. Regina. Risk Communication: A Handbook for Communicating Environmental,
Safety, and Health Risks. Available at: http://books.google.ca/books?hl=en&lr=&id=93HqxkI7Na4C&oi=fnd&pg=PT12&dq=Ra
79

don+risk+communication&ots=TyS88GRc96&sig=TqMwL9LA2jRL02GFs1TXkQnjomQ. Accessed June 25, 2013.
Paterson, Wade. “Peachland couple warns of high radon levels in Okanagan homes.” Kelowna Capital News. Available at: http://www.kelownacapnews.com/news/175626021.html. Accessed: June 26, 2013.
Sandman, M. Peter. Responding to Community Outrage: Strategies for Effective Communication. American Industrial Hygiene Association. Available at: http://books.google.ca/books?hl=en&lr=&id=M9-bQsx8TnMC&oi=fnd&pg=PA1&dq=Radon+risk+communication&ots=UZaMwZQWcJ&sig=uLQeJ8YzeTXCUekrj-HuJOeNM1E#v=onepage&q=Radon%20risk%20communication&f=false. Accessed June 25, 2013.
Sandman, M. Peter. “Explaining Environmental Risk.” TSCA Assistance Office, Office of Toxic Substances, U.S. Environmental Protection Agency, November 1986 (booklet). Available at: http://www.psandman.com/articles/explain1.htm, Accessed June 25, 2013.
Statistics Canada. Deaths, by Cause. Available at: http://www5.statcan.gc.ca/cansim/pick-choisir?lang=eng&p2=33&id=1020540. Accessed June 26, 2013.
Statistics Canada. “Mortality, Summary List of Causes – 2009.” Available at: http://www.statcan.gc.ca/pub/84f0209x/2009000/t001-eng.pdf, accessed June 26, 2013.
80