proceedings of the 2019 international science conference
TRANSCRIPT

Proceedings of the 2019 International Science Conference Innovation and Advancement in Nanoscience and Nanotechnology, Federal University Oye-Ekiti (www.fuoye.edu.ng), 2019.
1

Proceedings of the 2019 International Science Conference Innovation and Advancement in Nanoscience and Nanotechnology, Federal University Oye-Ekiti (www.fuoye.edu.ng), 2019.
1
2019 FUOYE INTERNATIONAL SCIENCE CONFERENCE
CONFERENCE PROCEEDINGS
THEME:
INNOVATION AND ADVANCEMENT IN NANOSCIENCE AND NANOTECHNOLOGY
08-10 JULY, 2019
Copyright 2019 by Federal University Oye Ekiti
All right reserved.
Federal University Oye-Ekiti
Km 3, Are-Afao Road , Oye Ekiti,
371010, Ekiti State, Nigeria
www.fuoye.edu.ng

Proceedings of the 2019 International Science Conference Innovation and Advancement in Nanoscience and Nanotechnology, Federal University Oye-Ekiti (www.fuoye.edu.ng), 2019.
2
Copyright and reprint permissions: Abstracting is permitted with credit to the source. Other copying, reprint or reproduction request should be addressed to Federal University Oye Ekiti, Ekiti State, Nigeria.
ISBN: 2616-1419 The papers in this book comprise the proceedings of the 2019 International Science Conference, held at the Faculty
of Science Auditorium, Federal University Oye-Ekiti, Ekiti State, Nigeria, on 08-10 July, 2019. They reflect the
authors’ opinions and, in the interests of timely dissemination, are published as presented and without change. All
papers are peer-reviewed.
2019 FUOYE International Science Conference Proceeding Editors
Dr Olushola S. Ayanda
Nanoscience Research Unit, Department of Industrial Chemistry,
Federal University Oye Ekiti, Oye Ekiti
Dr O.O. Oketayo
Department of Physics, Federal University Oye Ekiti, Oye Ekiti
Editorial Board Members
Prof O.S. Lawal
Department of Industrial Chemistry & Dean, Faculty of Science
Federal University, Oye Ekiti
Prof F.A. Adekola
Department of Chemistry, University of Ilorin
Dr H.I. Okoh
Department of Animal and Environmental Biology,
Federal University Oye Ekiti
Dr A.B. Eluwole
Department of Geophysics, Federal University Oye Ekiti
Dr O. Adeyi
Department of Chemical Engineering,
Landmark University, Omu-aran

Proceedings of the 2019 International Science Conference Innovation and Advancement in Nanoscience and Nanotechnology, Federal University Oye-Ekiti (www.fuoye.edu.ng), 2019.
3
Table of Contents
A Mini-Review on the Application of Alumina NanoParticles for Water Treatment 4-8
Eletta A.A. Omodele, Adeniyi G. Adewale*, Magaji M. Mikaila, Ighalo O. Joshua
Nanotechnology in Water Treatment- Review 9-13
Omolola H. Aremu*, Olushola S. Ayanda, Olusola M. Fasoranti, Cecilia O. Akintayo
Geochemical and Petrological Evaluation of the Paleogene Strata Exposed at Ibese Quarry,
Dahomey Basin, Southwestern, Nigeria 14-18
T.A. Bolaji*, R.A. Akinpelu
Kinetics of Heavy Metals Desorption from Soil Remediated with Hardwood Biochar and
Flame of the Forest (Delonix Regia) Pods 19-23
B.M. Babalola*, E.G. Olumayede, S.O. Afolabi
Incidence of Nasal and Hand carriage of Staphylococcus aureus among food handlers in
Lagos, Southwest Nigeria 24-28
T.O. Egwuatu*, O.M. Ukhureigbe, S. Iyayi
Levels and Risk Assessment of Heavy Metals in Vegetables from Hospital Waste
Dumpsite using Energy Dispersive X-Ray Fluorescence Spectrometry 29-33
Oketayo Oyebamiji Oyedele*, Ikpe Uchechukwu Oluwasegun
Near Field Communication (NFC) Based Lecture Attendance Management System on
Android Mobile Platform 34-38
Comfort Y. Daramola*, Olaiya Folorunsho, Bosede A. Ayogu, Lawrence Adewole
Cross-sectional Prevalence of Gastrointestinal Helminth Parasites in Two Cattle Holding
Farms in Ekiti State, Nigeria 39-42
H.O. Mogaji*, A.A. Bamigboye
Determination of Lipid Profile in Inflammation-Induced Wistar Rats Administered Ficus sur
Flavonoid-Rich Extract 43-47
S.A. Emaleku*, I.G. Adanlawo, M.T. Gbadegesin, E.A. Adeola, O.D. Omueti, G.O. Emaleku,
A.F. Adeyemi, A.D. Ogunbodede
Understanding Walls of Gene Regulatory Networks from Focal Points of Adjacent Regulatory Domains 48-53
Ngwu Benitho A.*, Mmaduakor C.O., Ajewole R.O., Iorkua M.
Rule-Based Expert System for Classification of Hospitality Industry 54-59
Akinpelu S.A.*, Olabode O., Daramola C. Y., Ogunleye G.O., Adeoti E.A.
Review on the Impact of Nanotechnology in M-Learning Devices 60-63
Bamidele V. Aremu*, Olufemi V. Adeoluwa, Omolola H. Aremu
Foliar Anatomy of the Genus Pterocarpus Jacq. (Papilionaceae) in Nigeria 64-69
Chukwuma Deborah Moradeke*, Ayodele Abiodun Emmanuel
Molecular Interaction of GC-MS Products of Trichosanthes cucumerina and Solanium lycopersicum
with Selected Enzymes in Drosophila melanogaster 70-74
Adeniran O.Y.*
Flownet Construction and its Hydrogeological Implications: A Case Study of Parts of Ilorin
Crystalline Rocks, Southwestern Nigeria 75-79
Olatunji J.A.*, Omonona O.V., Odediran O.A., Akinrinmade A.O., Olasehinde D.A.
Trees and Shrubs of Oba Hills Forest Reserve, Osun State, Nigeria 80-84
Emmanuel C. Chukwuma, Opeyemi A. Agbo-Adediran, Deborah M. Chukwuma*
Ameliorative Effect of Aqueous Extract of Chromoleana odorata Leaves on Alloxan-induced Diabetic Rats 85-89
Bamisaye F.A.*, Ajuwon O.R., Ajani E.O., Sulyman A.O.

Proceedings of the 2019 International Science Conference Innovation and Advancement in Nanoscience and Nanotechnology, Federal University Oye-Ekiti (www.fuoye.edu.ng), 2019.
4
Conference Proceedings
A Mini-Review on the Application of Alumina Nanoparticles for Water Treatment
Eletta A.A. Omodele, Adeniyi G. Adewale*, Magaji M. Mikaila, Ighalo O. Joshua
Chemical Engineering Department, Faculty of Engineering and Technology, University of Ilorin, Ilorin, P. M. B. 1515, Nigeria
Abstract
γ-Alumina possesses numerous industrial applications. In this mini-review, the use of alumina as precursors for the development of
nanoparticles for water treatment was examined. A cursory examination of alumina as it appears in nature revealed its availability
over the country. Alumina nanoparticles were synthesised in a variety of ways which includes precipitation and co-precipitation, sol-
gel method, solution combustion and microwave synthesis. Most experimental investigations on alumina nanoparticles as adsorbent
utilised batch experiments. From the review of experiments, it was discovered that alumina nanoparticles adsorption is mostly
monolayer in nature and according to pseudo-second order kinetics. Though the adsorption capacities are widely varying, the removal
efficiencies showed that the particles are very good adsorbents for the pollutants reported in studies.
Keywords: Alumina, wastewater, nanoparticles, pollutant, adsorption
1 Introduction
The pollution of water bodies by industrial effluents is of major environmental concern in developing countries in general and Nigeria
in particular [1] and it has been on the rise due to continual industrialization [2]. These effluents contain heavy metals, dyes,
pharmaceutically active compounds and a plethora of other inorganic pollutants [3] which are toxic to man and the environment.
Conventional methods of water treatment includes adsorption and biosorption [4], chemical precipitation, chemical oxidation or
reduction, ion exchange, filtration, electrochemical treatment, reverse osmosis, membrane technologies, and evaporation recovery [5,
6]. Some of these technologies have several disadvantages. They include high operational and maintenance cost, high energy
requirement and generation of toxic sludge [7].
Nanotechnology is an emerging technology in recent years that exploits the potential of nanosized organic or inorganic particles in the
removal of pollutants from aqueous medium. Nanoparticles are particles between 1 and 100 nm in size. Nano particles have several
key advantages that make them of importance for removing pollutants from aqueous medium. (i) larger surface area than the bulk
material, (ii) ability to be functionalised (by adding other chemical groups) to enhance performance [8]. Nanoparticles can be
developed for carbonaceous materials, polymer-based substances, silicon dioxide, iron oxides, magnesium oxides, alumina and others
[9]. γ-Alumina is a widely used metal oxides with numerous industrial applications. It can be used in plastic composites [10], as
catalyst or catalyst support [11], as adsorbent [12] and as precursors for the development of nanoparticles. This paper is a mini-review
of the use of alumina as precursors for the development of nanoparticles. The specific application of interest is in the removal of
pollutants from aqueous solutions.
2 Alumina
Aluminium oxide (commonly called alumina) is the most commonly occurring oxide of aluminium and is represented by the chemical
formula Al2O3. Aluminium is the most abundant metallic element and the third most abundant in the earth’s crust after oxygen and
silicon [13]. Alumina in its natural form is corundum but can be made from bauxite which is rich in hydrated aluminium oxides.

Proceedings of the 2019 International Science Conference Innovation and Advancement in Nanoscience and Nanotechnology, Federal University Oye-Ekiti (www.fuoye.edu.ng), 2019.
5
Fig. 1. Images of alumina (a), corundum (b) and bauxite (c).
Aluminium can also occur as silicates such as feldspar, muscovite mica, kaolin, fuller’s cart, etc. [13]. Valeton [14] had earlier pin-
pointed bauxite deposits in different parts of Africa and Nigeria inclusive. Ademola [13] revealed that there are significant quantities
of alumina and bauxite in the east alongside other alumina silicates in Akwa-Ibom, Benue and other parts of North central Nigeria.
There are significant amounts of bauxite in the Mambilla plateau in Northeastern Nigeria [15, 16] and in Orin-Ekiti in Southwestern
Nigeria [17]. With these, we can confidently say that obtaining bauxite in Nigeria will not be a problem as studies have proven
without any doubt. By consequence, alumina and aluminium compounds are cheaply available in Nigeria. In most laboratory
experiments, aluminium compounds generally are used for aluminium nanoparticle synthesis. Some of such compounds are
aluminium nitrate (Al(NO3)3.9H2O), aluminium chloride (AlCl3.6H2O) and aluminium sulphate (Al2SO4.16H2O).
3 Preparation of Alumina Nano-Adsorbent
Alumina nanoparticles have been synthesised in a variety of ways and these includes precipitation and co-precipitation, sol-gel
method, solution combustion and microwave synthesis. Banerjee et al. [18] developed γ-Al2O3 by controlled precipitation of
aluminium nitrate with sodium carbonate. The process was done at a pH of 7.5-8.5 and temperature of 700C. The obtained precipitate
was kept for ageing at 800C for 2 hours before filtration, oven drying (2 h) and calcined in a furnace (6000C, 3 h). The study obtained
an 89% yield of 60-70 nm particles size. Dehghani et al. [19] also used a similar process as described above but with different
calcination parameters (5500C, 5 h). The product was then further precipitated with perfluoro-octanoic acid to obtain nano-perfluoro-
octyl alumina particles. They obtained nanoparticles sizes of 2.5 to 3 nm.
Table 1. Summary of alumina nanoparticles preparation
Method Starting materials Diameter
(nm)
Surface area
(m2/g)
Ref
Precipitation Aluminium nitrate (Al(NO3)3.9H2O), Sodium carbonate
(Na2CO3)
60-70 76 [18]
Sol-gel Aluminium chloride (AlCl3.6H2O), liquid Ammonia (NH3) 30-35 128 [20]
Solution combustion
Synthesis
Aluminium nitrate (Al(NO3)3.9H2O), Glycine (C2H5O2N) - - [21]
Co-precipitation Aluminium nitrate (Al(NO3)3.9H2O), Sodium carbonate
(Na2CO3)
2.5-3 265.7 [19]
Sol-gel Aluminium sulphate (Al2SO4.16H2O), cetyl tri-methyl
ammonium bromide (N(CH3)3Br), Ammonium hydroxide
(NH4OH)
3-12 58.49 [22],
[23]
Microwave synthesis Aluminium nitrate (Al(NO3)3.9H2O), Ammonium hydroxide
(NH4OH), tri-methyl ammonium bromide (N(CH3)3Br), glacial
acetic acid (CH3COOH)
- 300-375 [12]
Sol-gel Aluminium chloride (AlCl3.6H2O), liquid Ammonia (NH3), Iron
chloride (FeCl3.6H2O)
230 86.08 [24]
Sol-gel Not stated 15-20 78.79 [25]
Banerjee et al. [20] synthesised the alumina nanoparticles via sol-gel precipitation. Aluminium chloride was dissolved in ethanol
whilst the precipitating agent liquid ammonia was added dropwise until a gelatinous white precipitate of aluminium oxide was
observed. The resultant solution was oven dried (900C, 6 h), calcined (6000C, 3 h), milled and sieved. The study obtained a 91% yield
a) b) c)
Proceedings of the 2019 International Science Conference Innovation and Advancement in Nanoscience and Nanotechnology, Federal University Oye-Ekiti (www.fuoye.edu.ng), 2019.
6
of 30-350 nm particles size. Bhargavi et al. [21] utilised a solution combustion technique for their synthesis. The mixture of
aluminium nitrate and glycine solution was placed in a muffle furnace (˂450C). There were no further details of yield and particle size
obtained. Table 1 gives a summary of the processes and reagents used and some for alumina nanoparticles and the basic characteristics
of the product obtained.
4 Application in Water Treatment
Most studies evaluated the application of nanoparticles in water treatment via batch experiments. Experiments are performed in glass-
stoppered Erlenmeyer flasks in most cases. A known volume of polluted aqueous solution is introduced into the flask. A weighed
amount of adsorbent is added to the water to form a solution of known concentration or dosage. The pH of the solution can be adjusted
by small volumes of strong acids and bases and then measured with a pH meter. Agitation can be achieved by an incubator shaker or
centrifuge. Agitation speed and temperature can be set on the device. The experiment is terminated at a known time and then taken for
analysis.
Banerjee et al. [18] utilised γ-Al2O3 nanoparticles for the scavenging of methylene blue from aqueous solutions. They obtained a
maximum removal efficiency of 77% with film diffusion being the major controlling mechanism. Banerjee et al. [20] studied the
adsorptive removal of orange G dye using alumina nanoparticles. It was observed that up to 98% of the pollutant could be removed
and the process was according to pseudo-second order kinetics. Langmuir isotherm was the equilibrium model of best fit. Bhargavi et
al. [21] studied the sorption of Zn(II) and colour black G. Though the nanoparticles had a higher capacity for Zn(II) than colour black
G, a lesser removal efficiency was observed. This was probably due to the researchers utilising a starting pollutant concentration for
Zn(II) 5 times higher than that of colour black G. For both pollutants, the process was based on pseudo-first order kinetics and
Langmuir equilibrium isotherm. Dubey et al. [22] studied the removal of chromium from aqueous solutions using nano-alumina as a
nano adsorbent. Their study was more focused on the comparison of different statistical and modelling techniques.
Dubey et al. [23] utilised response surface methodology in the optimisation of nickel adsorption by γ-Al2O3 nanoparticles. Virtually
100% of the pollutants was successfully removed. The process was based on pseudo-second order kinetics and Langmuir equilibrium
isotherm. Prathna et al. [24] studied the sorption of fluoride, trivalent arsenic and pentavalent arsenic onto magnetic nano-alumina
particles. The adsorption followed pseudo-second order kinetics and Langmuir equilibrium isotherm. Maximum removal efficiencies
for fluoride, trivalent arsenic and pentavalent arsenic were 82%, 70% and 99%, respectively. Srivastava et al. [25] examined the
sorption of nickel onto alumina nanoparticles. They observed a removal efficiency of 99% at optimum conditions. Yang et al. [26]
studied the mass transfer and performance of fluoride removal by magnetic alumina aerogel. A moderately high adsorption capacity of
the 32.1 mg/g was observed at an optimum pH of 5. Alumina nanoparticles have also been used to adsorb other pollutants such as
methyl tert-butyl ether (MTBE) [19], petroleum sulphur and aromatics [12], oil emulsions [27, 28] with excellent results being
obtained.
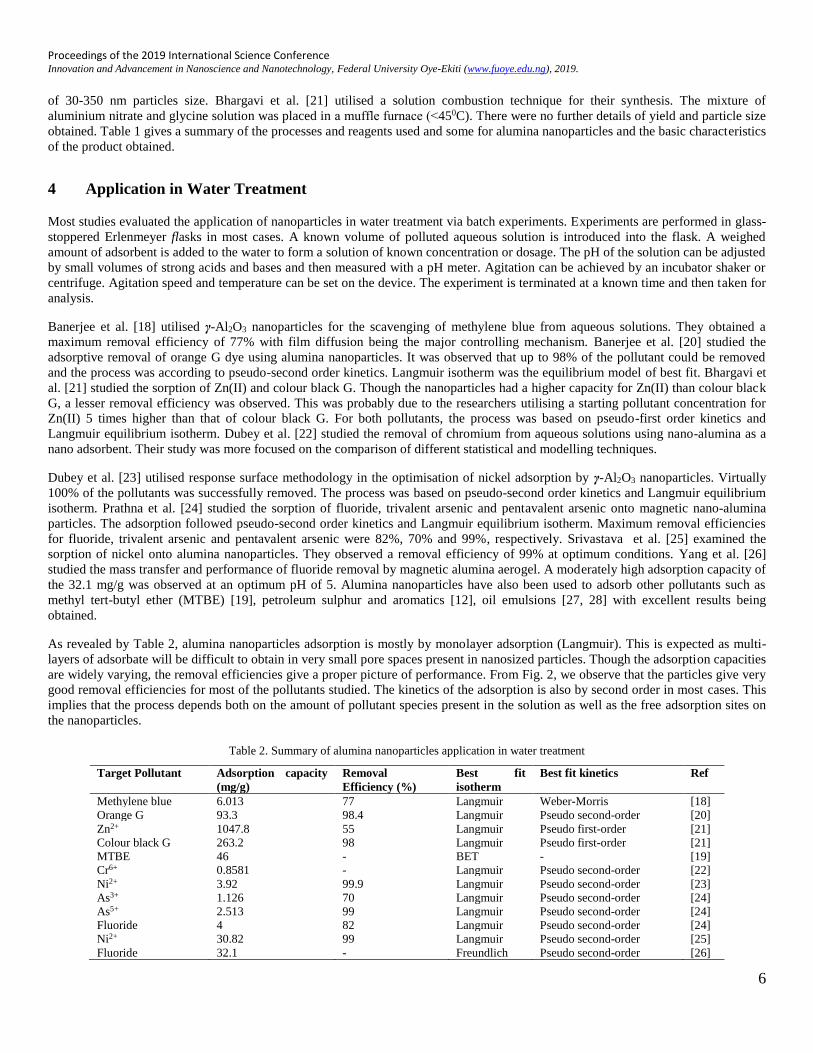
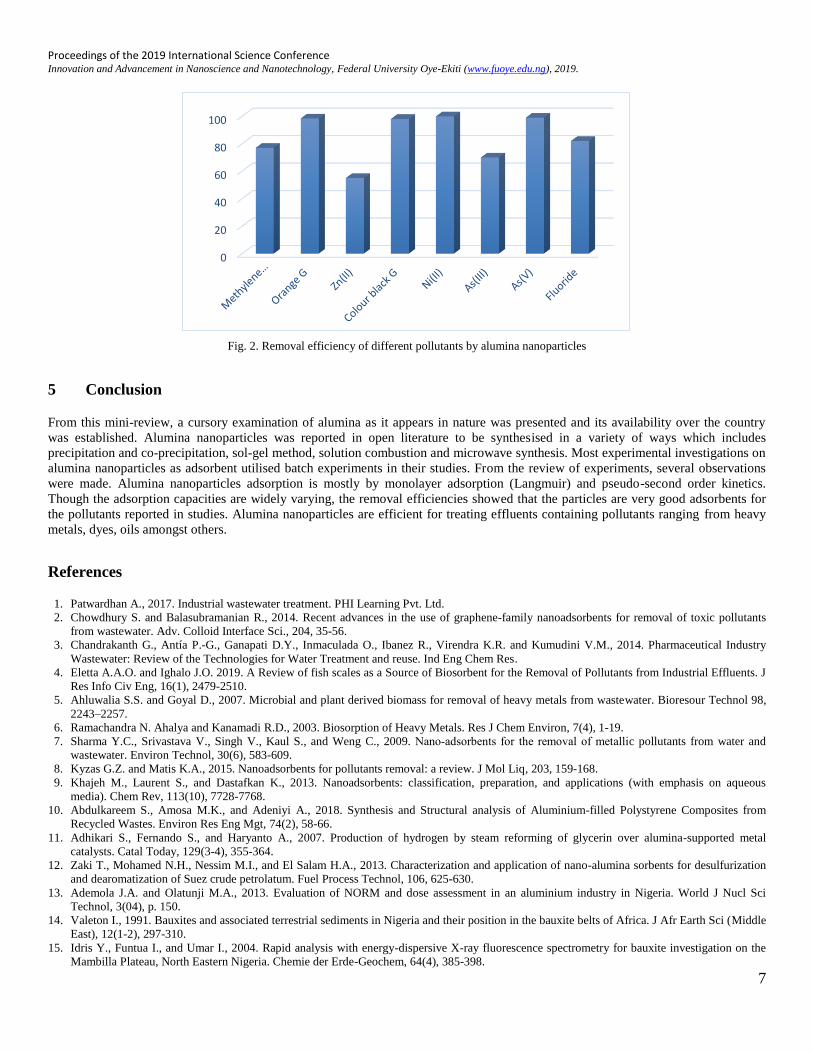
As revealed by Table 2, alumina nanoparticles adsorption is mostly by monolayer adsorption (Langmuir). This is expected as multi-
layers of adsorbate will be difficult to obtain in very small pore spaces present in nanosized particles. Though the adsorption capacities
are widely varying, the removal efficiencies give a proper picture of performance. From Fig. 2, we observe that the particles give very
good removal efficiencies for most of the pollutants studied. The kinetics of the adsorption is also by second order in most cases. This
implies that the process depends both on the amount of pollutant species present in the solution as well as the free adsorption sites on
the nanoparticles.
Table 2. Summary of alumina nanoparticles application in water treatment
Target Pollutant Adsorption capacity
(mg/g)
Removal
Efficiency (%)
Best fit
isotherm
Best fit kinetics Ref
Methylene blue 6.013 77 Langmuir Weber-Morris [18]
Orange G 93.3 98.4 Langmuir Pseudo second-order [20]
Zn2+ 1047.8 55 Langmuir Pseudo first-order [21]
Colour black G 263.2 98 Langmuir Pseudo first-order [21]
MTBE 46 - BET - [19]
Cr6+ 0.8581 - Langmuir Pseudo second-order [22]
Ni2+ 3.92 99.9 Langmuir Pseudo second-order [23]
As3+ 1.126 70 Langmuir Pseudo second-order [24]
As5+ 2.513 99 Langmuir Pseudo second-order [24]
Fluoride 4 82 Langmuir Pseudo second-order [24]
Ni2+ 30.82 99 Langmuir Pseudo second-order [25]
Fluoride 32.1 - Freundlich Pseudo second-order [26]
Proceedings of the 2019 International Science Conference Innovation and Advancement in Nanoscience and Nanotechnology, Federal University Oye-Ekiti (www.fuoye.edu.ng), 2019.
7
Fig. 2. Removal efficiency of different pollutants by alumina nanoparticles
5 Conclusion
From this mini-review, a cursory examination of alumina as it appears in nature was presented and its availability over the country
was established. Alumina nanoparticles was reported in open literature to be synthesised in a variety of ways which includes
precipitation and co-precipitation, sol-gel method, solution combustion and microwave synthesis. Most experimental investigations on
alumina nanoparticles as adsorbent utilised batch experiments in their studies. From the review of experiments, several observations
were made. Alumina nanoparticles adsorption is mostly by monolayer adsorption (Langmuir) and pseudo-second order kinetics.
Though the adsorption capacities are widely varying, the removal efficiencies showed that the particles are very good adsorbents for
the pollutants reported in studies. Alumina nanoparticles are efficient for treating effluents containing pollutants ranging from heavy
metals, dyes, oils amongst others.
References
1. Patwardhan A., 2017. Industrial wastewater treatment. PHI Learning Pvt. Ltd.
2. Chowdhury S. and Balasubramanian R., 2014. Recent advances in the use of graphene-family nanoadsorbents for removal of toxic pollutants
from wastewater. Adv. Colloid Interface Sci., 204, 35-56.
3. Chandrakanth G., Antía P.-G., Ganapati D.Y., Inmaculada O., Ibanez R., Virendra K.R. and Kumudini V.M., 2014. Pharmaceutical Industry
Wastewater: Review of the Technologies for Water Treatment and reuse. Ind Eng Chem Res.
4. Eletta A.A.O. and Ighalo J.O. 2019. A Review of fish scales as a Source of Biosorbent for the Removal of Pollutants from Industrial Effluents. J
Res Info Civ Eng, 16(1), 2479-2510.
5. Ahluwalia S.S. and Goyal D., 2007. Microbial and plant derived biomass for removal of heavy metals from wastewater. Bioresour Technol 98,
2243–2257.
6. Ramachandra N. Ahalya and Kanamadi R.D., 2003. Biosorption of Heavy Metals. Res J Chem Environ, 7(4), 1-19.
7. Sharma Y.C., Srivastava V., Singh V., Kaul S., and Weng C., 2009. Nano‐adsorbents for the removal of metallic pollutants from water and
wastewater. Environ Technol, 30(6), 583-609.
8. Kyzas G.Z. and Matis K.A., 2015. Nanoadsorbents for pollutants removal: a review. J Mol Liq, 203, 159-168.
9. Khajeh M., Laurent S., and Dastafkan K., 2013. Nanoadsorbents: classification, preparation, and applications (with emphasis on aqueous
media). Chem Rev, 113(10), 7728-7768.
10. Abdulkareem S., Amosa M.K., and Adeniyi A., 2018. Synthesis and Structural analysis of Aluminium-filled Polystyrene Composites from
Recycled Wastes. Environ Res Eng Mgt, 74(2), 58-66.
11. Adhikari S., Fernando S., and Haryanto A., 2007. Production of hydrogen by steam reforming of glycerin over alumina-supported metal
catalysts. Catal Today, 129(3-4), 355-364.
12. Zaki T., Mohamed N.H., Nessim M.I., and El Salam H.A., 2013. Characterization and application of nano-alumina sorbents for desulfurization
and dearomatization of Suez crude petrolatum. Fuel Process Technol, 106, 625-630.
13. Ademola J.A. and Olatunji M.A., 2013. Evaluation of NORM and dose assessment in an aluminium industry in Nigeria. World J Nucl Sci
Technol, 3(04), p. 150.
14. Valeton I., 1991. Bauxites and associated terrestrial sediments in Nigeria and their position in the bauxite belts of Africa. J Afr Earth Sci (Middle
East), 12(1-2), 297-310.
15. Idris Y., Funtua I., and Umar I., 2004. Rapid analysis with energy-dispersive X-ray fluorescence spectrometry for bauxite investigation on the
Mambilla Plateau, North Eastern Nigeria. Chemie der Erde-Geochem, 64(4), 385-398.
0
20
40
60
80
100

Proceedings of the 2019 International Science Conference Innovation and Advancement in Nanoscience and Nanotechnology, Federal University Oye-Ekiti (www.fuoye.edu.ng), 2019.
8
16. Schwarz T., 1997. Distribution and genesis of bauxite on the Mambilla Plateau. SE Nigeria. Appl Geochem, 12(2), 119-131.
17. Ademilua O.L., Ajayi O.Z., Ogunniyi S.O., and Talabi A.O., 2013. Preliminary geophysical evaluation of orin bauxite deposit Southwestern
Nigeria. J Emerging Trends Eng Appl Sci, 4(3), 432-437.
18. Banerjee S., Gautam R.K., Jaiswal A., Chattopadhyaya M.C., and Sharma Y.C., 2015. Rapid scavenging of methylene blue dye from a liquid
phase by adsorption on alumina nanoparticles. RSC Adv, 5(19), 14425-14440.
19. Dehghani A., Ebadi A., Shafiei S., and Aghaeinejad-Meybodi A., 2016. Synthesis, characterization, and application of nano-perfluorooctyl
alumina for adsorption of methyl tertiary-butyl ether (MTBE) from aqueous medium. Desalin Water Treat, 57(25), 11807-11819.
20. Banerjee S., Dubey S., Gautam R.K., Chattopadhyaya M., and Sharma Y.C., 2017. Adsorption characteristics of alumina nanoparticles for the
removal of hazardous dye, Orange G from aqueous solutions. Arabian J Chem.
21. Bhargavi R.J., Maheshwari U., and Gupta S., 2015. Synthesis and use of alumina nanoparticles as an adsorbent for the removal of Zn (II) and
CBG dye from wastewater. Int J Ind Chem, 6(1), 31-41.
22. Dubey S., Gusain D., and Sharma Y.C., 2016. Kinetic and isotherm parameter determination for the removal of chromium from aqueous
solutions by nanoalumina, a nanoadsorbent. J Mol Liq, 219, 1-8.
23. Dubey S., Sharma G.C., and Sharma Y.C., 2019. Optimization of Reclamation of Ni (II)-Rich Solutions by γ-Alumina Nanoparticles. J Hazard
Toxic Radioact Waste, 23(3), 04019005.
24. Prathna T., Sitompul D.N., Sharma S.K., and Kennedy M., 2018. Synthesis, characterization and performance of iron oxide/alumina-based
nanoadsorbents for simultaneous arsenic and fluoride removal. Desalin Water Treat, 104, 121-134.
25. Srivastava V., Weng C., Singh V., and Sharma Y., 2011. Adsorption of nickel ions from aqueous solutions by nano alumina: kinetic, mass
transfer, and equilibrium studies. J Chem Eng Data, 56(4), 1414-1422.
26. Yang W., Dou X., Li Y., Mohan D., Pittman C.U., and Ok Y.S., 2016. Performance and mass transfer of aqueous fluoride removal by a
magnetic alumina aerogel. RSC Adv, 6(114), 112988-112999.
27. Franco C.A., Cortés F.B., and Nassar N.N., 2014. Adsorptive removal of oil spill from oil-in-fresh water emulsions by hydrophobic alumina
nanoparticles functionalized with petroleum vacuum residue. J Colloid Interface Sci, 425, 168-177.
28. Franco C.A., Nassar N.N., and Cortés F.B., Removal of oil from oil-in-saltwater emulsions by adsorption onto nano-alumina functionalized with
petroleum vacuum residue. J Colloid Interface Sci, 433, 58-67.

Proceedings of the 2019 International Science Conference Innovation and Advancement in Nanoscience and Nanotechnology, Federal University Oye-Ekiti (www.fuoye.edu.ng), 2019.
9
Nanotechnology in Water Treatment - Review
Omolola H. Aremu*, Olushola S. Ayanda, Olusola M. Fasoranti, Cecilia O. Akintayo
Nanoscience Research Unit, Department of Industrial Chemistry, Federal University Oye Ekiti, P.M.B 373, Oye Ekiti, Nigeria [email protected], [email protected]
Abstract
Treatment of wastewater has raised a great concern as it has been a rising setback nowadays. Wastewater from pharmaceutical
industries, agriculture and textile industries are continually polluting the environment as wastewater are being discharged without
proper remediation techniques. This usually affects the inhabitants and ecosystem at large. As conventional treatment of wastewater
cannot eradicate all the pollutants in water, nanotechnology has gained ground in providing novel nanomaterials to remove
contaminants in wastewater to have environment free of pollutants. One of the special characteristic of nanomaterials is the particle
size on a nanoscale which can penetrate on a large surface material. This review paper includes the nanotechnological processes of
wastewater treatment, innovations and future insight in nanotechnology for water treatment.
Keywords: Nanotechnology, conventional treatment, nanoadsorbents, nanomaterials, nanocatalyst
1 Introduction
Water is an essential natural substance in life as life cannot exist without consistent and secured water. There is therefore a remarkable
sum of demand in shielding the sources of water accessible in the environment as this determines the life quality. It is the most
valuable constituent on earth and it covers over 75% of the earth crust. It is consumed by animals, humans and plants and can be used
for various purposes such as domestic use, religious functions, commercial use, industrial use, electricity generation, recreation and
agricultural use. For water to be fit for use, it must be in a pure state i.e. it must be odourless, colorless, tasteless and free of
contaminants. There is no doubt that most of what is been done requires the use of water and improper disposal leads to pollution of
the environment without necessary treatment technique. According to World Health Organization (WHO), 16% of the world’s
population is denied of hygienic water and this is as a result of overcrowded people, unavailability of good water resources, pollution
(air, water and land), deficiency of water recycling plants, indiscriminate location of industries in residential areas etc. [1]. Numerous
organic materials, pathogens, toxic materials are often released into water during production processes and these often contaminate the
environment [2]. The wastewater becomes hazardous to the health of plants, animals, water bodies and the ecosystem at large. To have
an environment free of pollutants, wastewater must be treated so as to enhance a healthy living for those whose source of livelihood
depends on water.
1.1 Water Treatment
Treatment of water can be done in various ways depending on the type of pollutants that needs to be removed. Water can be treated
conventionally and this involves four stages which are preliminary stage, primary stage, secondary stage and tertiary stage (Fig. 1).
Fig. 1. Schematic diagram of a conventional water treatment [3]

Proceedings of the 2019 International Science Conference Innovation and Advancement in Nanoscience and Nanotechnology, Federal University Oye-Ekiti (www.fuoye.edu.ng), 2019.
10
1.1.1 Preliminary Stage
The preliminary treatment involves the removal of coarse solid materials and other large materials in wastewater with the use of grit
chambers and bar screens. The water is passed through the bar screen to remove big solid objects such as clothes, plastics, papers,
bottles and wood. The water is later passed through the grit chamber to remove smaller heavy objects that cannot be retained by the
bar screen such as sand. The objects removed can later be disposed into the environment as landfills.
1.1.2 Primary Stage
The primary stage is a physical operation in conventional treatment of water and it involves the removal of settleable organic and
inorganic solids by sedimentation, this is usually done for some hours to allow solid particles to settle at the bottom of the tank while
non settleable materials float to the top for removal.
1.1.3 Secondary Stage
This is also known as biological treatment and it involves the removal of biodegradable dissolved and colloidal organic matter by
biofilters and activated sludge. The major basis for biological treatment of water is the introduction of microorganisms, especially
bacteria. The partly treated water from the primary stage flows into the aeration tank (aerobic) where oxygen consumes the organic
matter remnant and changes them into water, carbon dioxide and biomass. The water can also be treated without air (anaerobic) to
digest organic pollutants. The end products are methane and biomass.
1.1.4 Tertiary Stage
This stage entails the use of chemicals such as chlorine, alum, ozone, sodium bisulphate or ultraviolet irradiation to disinfect water
before recycling. Substances such as phosphorous and nitrogen, inorganic compounds, bacteria, parasites, pathogens and viruses are
all removed in this stage. This can later be disposed into the rivers or streams. Conventional treatment of water often results to partial
removal of pollutants and there is therefore a necessity to build up a novel technology that can eradicate contaminants from water
without secondary pollutants to meet the conditions of pure and hygienic water.
2 Reviews on Water Treatment
A lot of work has been done on the treatment of wastewater to ensure consistent accessibility to clean water in the environment. There
is no doubt that water is often scarce during dry season and so the demand for water is always high. Abraham et al. [4] worked on the
use of activated charcoal for the treatment of wastewater from bathrooms, kitchen sinks and laundry to remove contaminants and
impurities as a means of recycling used water for clean-up and additional purposes. The authors reported that the water achieved by
treatment with activated charcoal is pure, free from contaminants, tasteless and odorless. Activated charcoal is always readily
available and it is less expensive; this makes it a good adsorbent as it has high porosity to penetrate on a large surface area for
pollutants to be adsorbed. The report on the physicochemical parameters of treated refinery wastewater after the removal of
naphthenic acids and aromatic naphthenic acids by Wang et al. [5] shows that 16% of naphthenic acids and 24% of aromatic
naphthenic acids were removed. Ang et al. [6] reported that the use of chlorine in conventional treatment plants to get rid of bacteria
and viruses brings about the development of disinfection by-product which has a harmful effect on the health of human. Conventional
treatments often result to partial removal of pollutants; therefore, nanotechnology is seen as a viable method of water purification.
2.1 Applications of Nanotechnology in Water Treatment
Nanotechnology is a division of science that deals with the process of reforming, applying materials and breaking down of substances
by an atom or molecule to create novel and distinctive substances in a scale of less than 100 nm [7]. For the past years,
nanotechnology has been an up- and coming area of research as it is applied in wastewater treatment, textiles, explosives, car bumpers,
propellants, window glasses, sun glasses, cosmetics, coatings, sport goods and paints. It offers a leaping opportunity to expand
generations to come in restructuring the availability of water to be more sustainable. The outstanding utilization of nanoparticles such
as ZnO and TiO2 for water treatment has reduced the amount of pollutants in water. Nanotechnology is aggressively trailed to improve
the ability of the previous treatment processes and build up novel processes. It is understood that nanotechnology is able to make a
remarkable impact in ensuring availability of clean water in undeveloped countries because it is effective and cost effective [8]. The
attractiveness of nanomaterials for water purification is dependent on some unique properties such as small size, high surface area,
high photocatalytic activity, low-cost, high antimicrobial activity for disinfection and biofouling, etc. The nanotechnological processes
of water treatment include nanofiltration, nanoadsorbents, nanocatalysts and nanomaterials.

Proceedings of the 2019 International Science Conference Innovation and Advancement in Nanoscience and Nanotechnology, Federal University Oye-Ekiti (www.fuoye.edu.ng), 2019.
11
2.1.1 Nanofiltration
It is certain that the varieties of contaminants seen in water can be removed via membrane filtration and this can serve as an important
way of ensuring high level of water decontamination. This membrane filtration is very enormous because it is an important tool for
removing selected dissolved organic compounds and variety of pathogens present in water; this is as a result of its efficiency. It is a
membrane that is extremely pressured for water treatment procedures in removing pollutants from wastewater. It is essential to know
that centrifugal pumps are used in nanofiltration for easy movement of wastewater at an efficient pressure around the nanomembrane.
The membranes are of three types namely, organic/inorganic, ceramic and biological membranes [9]. Various membranes are
configured in each of the unit inside the nanofiltration machine. Each length of the unit in the nanofiltration machine varies between
0.9 m to 5.5 m while the diameter ranges from 100 to 300 mm [10]. Fig. 2 and Table 1 shows the arrangement of units (vertical and
horizontal) and the efficient removal of contaminants in wastewater via nanofiltration process, respectively.
Fig. 2. Horizontal and vertical arrangement of modules
Sources: Pentair X-flow, Membrane filtration pure and simple. http://advancedfiltration.pentair.com/en/products/horizontal-deadend,
05.11.2018.Pentair X-flow, Membrane filtration pure and simple http://xflow.pentair.com/en/products/aquaflex, 05.11.2018.
Table 1. Efficiency of nanofiltration in the removal of pollutants [10]
Pollutants Removal Efficiency
Total dissolved solids 40 – 60 (%)
Total organic carbon 90 – 98 (%)
Colour 90 – 96 (%)
Hardness 80 – 85 (%)
NaCl 10 – 50 (%)
Sodium-sulphate 80 – 95 (%)
Calcium-chloride 10 – 50 (%)
Magnesium-sulphate 80 – 95 (%)
Nitrates 80 – 85 (%)
Fluorides 10 – 50 (%)
Arsenic < 40 (%)
Atrazine 85 – 90 (%)
Proteins 3 – 5
Bacteria 3 – 6
Protozoa > 6
Viruses 3-5
2.1.2 Nanoadsorbents
Nanoadsorbents show a noteworthy development for the remediation of wastewater as it is less expensive against conventional
adsorbents due to its high précised surface area, short particle penetrating space and visible pore sizes [11]. The high adsorption ability
of nanoadsorbent majorly depends on the high specific précised surface area. In other words, the energetic adsorption sites produced is
as a result of the increase surface energy and the nano size attributed to nanoadsorbent. The exposure of the adsorption sites leads to
retrieval of contaminants found around the surface of various nanomaterials. These functions of nanoadsorbent have made it to be
voluntarily incorporated into other treatment procedures such as filters and sludge reactors. The utilization of nanoadsorbent in water
treatment procedure will be of assistance to developing and underdeveloped countries where the reuse of water and other recycling
procedures are expensive to maintain. It can guide against the increase in the discharge of wastewater into the environment and unsafe
chemical mixtures. Furthermore, nanoadsorbents can serve as an alternative for other treatment reagents that is manufactured with
huge amount of raw materials which invariably consume more energy during production or as substitutes to treatment techniques that

Proceedings of the 2019 International Science Conference Innovation and Advancement in Nanoscience and Nanotechnology, Federal University Oye-Ekiti (www.fuoye.edu.ng), 2019.
12
often result to environmental pollution. When pollution occur, plants, animals (aquatic or terrestrial) as well as the ecosystem is
greatly affected [12].
2.1.3 Nanocatalysts
Metal nanoparticles and metal oxide nanoparticles are known to be practicable catalysts because they have a high catalytic power via
which the molecules seen in contaminants undergoes oxidation during oxidation processes to generate harmless materials that can be
changed to eco-friendly substances. These metallic and metallic oxide nanoparticles are well-known to have a small size that enables
the particle to break in effortlessly on a large surface area and this invariably allow them to be exceedingly reactive in nature.
Moreover, the usage of nanoparticles as catalyst during a chemical or photochemical reaction aids the demolition of pollutants that
exist in wastewater. The possession of catalytic ability of metal and metallic oxide nanoparticles allows them to be used as an effective
treatment of wastewater by the exploitation of nanocatalysts [13].
2.1.4 Nanomaterials
To keep an eye on the quality of water is very exigent due to low concentrations of micro contaminants found in wastewater. There is
a need for an effective incorporation of nanomaterials that has a high photocatalytic activity, no secondary pollutants, non-toxic,
biologically safe, stable under harsh environment and cost effective. Excellent nanomaterials such as zinc oxide, titanium dioxide and
silver nanoparticles have the capacity to endure microbial commotion in water. They are mild oxidants and inert when introduced in
water as disinfectants to produce non-destructive substances. Nevertheless, wastewater treatment involving the use of nanomaterials
has its deficiency in that it will require a lot of nanomaterials for effective removal of large quantity of wastewater which is not
economically safe [14].
3 Innovations in Nanotechnology for Water Treatment
Nanotechnology has improved the treatment of wastewater through various nanotechnological processes of wastewater, unlike the use
of conventional treatment of wastewater that result in partial removal of pollutants and also involves the addition of chemicals. The
attributes of nanotechnology in wastewater treatment are the small size found on a nanoscale, novel smart filters for different
contaminant removal and the photocatalytic ability of the nanomaterials. The small size allows for easier penetration on a large surface
of materials. Nanotechnology does not require the use of chemical, nanomaterials can be synthesized effortlessly, and the treatment
procedure is fast when compared with other treatment processes for wastewater treatment. With the help of nanotechnology, the
combination of ultrasound [15] and ultraviolet radiation in the presence of nanoparticles such as nZnO, nanoFe, and nTiO2 often result
to higher degradation of pollutant in wastewater treatment due to the formation of increased cavitation bubbles and hydroxyl radicals.
3.1 Future Insight
It is expected to have good and clean water in the environment for life sustenance. Nanotechnology has explored various fields such as
science, engineering, education, medicine, agriculture, food technology, etc. It is vital to note that nanotechnology will soon be easily
accessible both in urban as well as rural areas as nanoscience and nanotechnology researchers are seriously developing and
implementing novel materials that are cost effective and available to treat drinking water and wastewater.
4 Conclusion
This review paper highlights the nanotechnological processes involved in wastewater treatment as an effective low-cost and readily
available technique. Human population has grown extensively, and this has posed a challenge in protecting water resources. The
ignorance and nonchalant attitude of people has resulted in water pollution which is as a result of improper disposal of wastewater
without necessary remediation techniques and has contributed to environmental hazard. In other to sustain life, water must be
consumed in a hygienic state. Therefore, with the help of nanotechnology, high percentage of pollutants can be removed from water
and wastewater and this is attributed to the small size of nanomaterials on nano scale which aids easy penetration on large surfaces of
materials. The use of nanotechnology is presently being recognized as an efficient and eco-friendly technology in wastewater
treatment because it is cost effective, less tedious and has no secondary pollutant.
References
1. World Health Organization, 2004. Meeting the MDG drinking water and sanitation target: A mid-term assessment of progress, WHO, Geneva.

Proceedings of the 2019 International Science Conference Innovation and Advancement in Nanoscience and Nanotechnology, Federal University Oye-Ekiti (www.fuoye.edu.ng), 2019.
13
2. Turkar S.S., Bharti D.B. and Gaikwad G.S., 2011. Various methods involved in waste water treatment to control water pollution. J Chem Pharm
Res, 3, pp. 58.
3. Rakesh S.A., Santosh K.S., Shweta S. and Megha S., 2016. Wastewater Treatment by Effluent Treatment Plants. SSRG Int J Civil Eng, 3, 29-35.
4. Abraham F.A., Thenmozhi R., Sivakumar M., Sivakumar K., Sasikumar G., and Thamaraimuthuayyanraj S., 2018. Wastewater treatment unit
using activated charcoal. Int Res J Eng Technol, 5, 312 – 315.
5. Wang B., Yi W., Yingxin G., Guomao Z., Min Y., Song W. and Jianying H., 2015. Occurrences and behaviors of Naphthenic Acids in a
petroleum refinery wastewater treatment plant. Environ Sci Technol, 49, 5796-5804.
6. Ang W.L., Mohammad A.W., Hila N., and Leo C.P., 2015. A review on the applicability of integrated/hybrid membrane processes in water
treatment and desalination plants. Desalination, 363, 2-18.
7. Kavitha K.S., Syed B., Rakshith D., Kavitha H.U., Yashwantha Rao H.C., Harini B.P. and Satish S., 2013. Plants as green source towards
synthesis of nanoparticles. Int Res J Biol Sci, 2(6), 66-76.
8. Gupta K., Bhattacharya S., Chattopadhyay D.J., Mukhopadhyay A., Biswas H., Dutta J., Roy N.R. and Ghosh U.C., 2011. Ceria associated
manganese oxide nanoparticles: Synthesis, characterization and arsenic (V) sorption behavior. J Chem Eng, 172, 219-229.
9. Pendergast M.T.M. and Hoek E.M.V., 2011. A review of water treatment membrane nanotechnologies. Journal: Energy Environ Sci, 6(4), 1946-
1971.
10. Tchobanoglous G., Stensel H.D., Tsuchihashi R. and Burton F., 2014. Wastewater engineering: Treatment and resource recovery, Fourth edition,
New York, McGraw-Hill, Vol. 4, pp. 1-24.
11. Amin M.T., Alazba A.A. and Manzoor U., 2014. A review of removal of pollutants from water/wastewater using different types of
nanomaterials. Adv Mater Sci Eng, 1(5), 125-146.
12. Bhattacharya S., Saha I., Mukhopadhyay A., Chattopadhyay D., Ghosh U.C. and Chatterjee D., 2013. Role of nanotechnology in water treatment
and purification: Potential applications and implications. Int J Chem Sci Technol, 3(3), 59-64.
13. Nowack B., 2008. Pollution prevention n treatment using Nanotechnology”. In Environmental Aspects. Edited by Harald Krug, Volume 2
WILEY-VCH Verlag GmbH & Co. KGaA, Weinheim, pp. 1-12.
14. Nora S., and Mamadou S.D., 2005. Nanomaterials and water purification: opportunities and challenges. J Nanopart Res, 7, 331-342.
15. Ayanda O.S., Nelana S.M., Naidoo E.B., 2018. Ultrasonic Degradation of aqueous Phenolsulfonphthalein (PSP) in the presence of nano-
Fe/H2O2. Ultrason Sonochem, 47, 29-35.

Proceedings of the 2019 International Science Conference Innovation and Advancement in Nanoscience and Nanotechnology, Federal University Oye-Ekiti (www.fuoye.edu.ng), 2019.
14
Geochemical and Petrological Evaluation of the Paleogene Strata Exposed at Ibese
Quarry, Dahomey Basin, Southwestern, Nigeria
T.A. Bolaji*, R.A. Akinpelu
Department of Geology, Federal University Oye-Ekiti, Nigeria [email protected]
Abstract
Paleogene strata freshly exposed by quarry activities at the Dangote Cement, Ibese were mapped, studied, logged and sampled. The
twelve samples, which were recovered from the Northern (NM) and Southwestern (SWM) sections, include limestone, shale,
ferruginized sandstone and a glauconitic rock, within the Akinbo and Ewekoro formations, respectively. These samples were
examined to determine the geochemical characteristics of the sediments, mineralogical composition and provide petrographic
interpretation in order to understand the associated diagenetic processes and depositional conditions. A combination of analytical
techniques including: geochemical analysis for major elements, X-Ray Diffraction (XRD), and thin section were used in this study.
Results showed that high Ca and low Mg content characterized the limestones. CaO content ranged from 4.13 – 94.67 wt.% (Av.
65.85 wt.%), followed by SiO2 with values ranging from 1.38 – 59.78 wt.% (Av. 30.58 wt.%). Loss on Ignition (LOI) values ranged
from 5.13 – 12.20%. The high Ca/Mg ratio defines a high calcite purity, which is significant in cement production. Calcite (56.69 –
57.96%) dominates the mineralogy followed by quartz, dolomite and kaolinite. Three microfacies identified from petrographic
observations are unsorted biosparite (packstone), sparse biomicrite (wackestone), and fossiliferous micrite (mudstone). Various
diagenetic processes such as cementation, neomorphism, micritization, compaction, dissolution and dolomitization have affected the
limestones. The presence of fossils such as sponges and molluscs in the limestones suggest they are typically deposited in a shallow
marine environment, (probably upper deltaic) or brackish water (probably lower deltaic (marginal-marine)) environment. The studied
limestones are suitable for cement production based on their elemental composition.
Keywords: Paleogene, limestone, microfacies, Ibese, Dahomey basin
1 Introduction
Paleogene rocks of the Akinbo and Ewekoro formations exposed by quarry activities at Ibese area of the Dahomey basin are
composed of clastic materials and carbonates. These formations are dominantly limestone and carbonaceous fissile shale, along with
mudstones, ferruginized sandstone and notable presence of a glauconitic bed, which marks the base of the Akinbo formation. The
studied sections have variable thickness, 12–23 m, depending on the excavation program at the quarry site. Although limestone is the
most economically viable resource within these units, this study evaluates the rocks freshly encountered within the Ibese quarry,
operated by Dangote Industries Limited. Previous studies on the structural setting, general geology and hydrocarbon potential of
Eastern Dahomey basin have been summarized by Adegoke et al. [1], Jones and Hockey [7], Reyment [13] among several others.
Studies such as Fayose and Azeez [5], Ogbe [9], Okosun [10], Olatinsu et al. [11] focus largely on stratigraphy, paleontology,
petrology and geochemistry of the limestone of Dahomey. Although some of these authors considered aspects of geochemistry and
petrography using well core samples, studies on quarry samples has received less attention with little or no information on the aspects
of diagenesis of these limestones.
Dahomey Basin comprises of island coastal and offshore basins, which extends from southeastern Ghana through Togo and Benin
Republic to Southwestern Nigeria. It is separated from the Niger Delta Basin by the Okitipupa ridge [9, 12] at the eastern flank. The
Nigerian sector of the basin extends from the boundary between Benin Republic and Nigeria to the Benin hinge line, consisting of an
arcuate belt roughly parallel to the coastline (Fig. 1) [3, 14]. The Dahomey Basin has been described as an extensive wedge of
Cretaceous to Recent sediments, which lies unconformably on the basement [14]. It is a marginal sag or pull-apart basin which
developed in the Mesozoic as a result of the drifting of the African and south American plate [14]. The stratigraphy of Dahomey Basin
is divided into three chronostratigraphic packages: pre-lower Cretaceous folded sediments, Cretaceous folded sediments and Tertiary
sediments [3]. The oldest dated sediments onshore are the Cretaceous sediments, which rest unconformably on the crystalline
Basement Complex. Further offshore, the Cretaceous sediments thicken and rest unconformably on the pre-lower Cretaceous
sediments. In the Nigerian sector of the basin, the Cretaceous sequence referred to as Abeokuta Group is sub-divided into three
formations: Ise, Afowo and Araromi formations [12]. Ise formation (Neocomian-Albian) is the oldest lithic fill and is unconformably
disposed on the Basement Complex. It comprises of conglomerate and grit at the base, overlain by coarse-grained loose sand
interbedded with kaolinitic clays [12]. Afowo formation is the middle layer of the Cretaceous sequence. It is composed of transitional

Proceedings of the 2019 International Science Conference Innovation and Advancement in Nanoscience and Nanotechnology, Federal University Oye-Ekiti (www.fuoye.edu.ng), 2019.
15
sand and sandstone with variable but thick interbedded marine shales, siltstone and claystones. The sandy facies are tar bearing, while
the shales are organic-rich. The formation has been dated Turonian – Maastrichtian. Araromi formation (Maastrichtian – Paleocene) is
the uppermost unit and is made up of fine to medium-grained sandstone at the base, overlain by shale and siltstone with interbeds of
limestone, marl and lignite.
Fig. 1. The geological map of Eastern Dahomey Basin showing the study area
The Tertiary sediments overlying the Abeokuta group conformably consist of the Ewekoro, Akinbo, Oshosun, Ilaro and Benin
formations. Ewekoro formation is made up of thick fossiliferous limestone while Akinbo and Oshosun formations are made up of
flaggy grey and black shales, glauconitic bands and phosphatic beds, which define the boundary between the Ewekoro and Akinbo
formation. The Ewekoro formation is Paleocene in age and associated with shallow marine environment due to abundance of coralline
algae, gastropods, pelecypods, echinoid fragments and other skeletal debris [8]. The Akinbo formation overlies Ewekoro formation
and it consists of shale, flaggy glauconitic rock bed, and gritty sand to pure grey shale and with little clay [9]. Limestone lenses from
Ewekoro formation grades literally into the Akinbo shale towards the base. The base is marked by the presence of a glauconitic unit.
The age of the formation is Paleocene to Eocene. The Oshosun formation overlies the Akinbo, which is a sequence of mostly pale
greenish grey laminated phosphatic marls, light grey white-purple clay with interbeds of sandstones [10]. It also consists of claystone
underlain by argillaceous limestone of phosphatic and glauconitic materials in the lower part of the formation and were deposited
during Eocene [2]. The sedimentation of the Oshosun formation was followed by a regression phase, which deposited the sandstone
unit of Ilaro formation. The sequence represents mainly coarse sandy estuarine deltaic and continental beds, which show rapid lateral
facies change. The coastal plain sands are the youngest sedimentary unit in the eastern Dahomey Basin. It conceivably unconformably
overlay the Ilaro formation but lack convincing evidence [7]. It consists of soft, poorly sorted clayey sand and pebbly sands deposited
during Oligocene to Recent. Ilaro and Benin formations are predominantly coarse, sandy, estuarine, deltaic and continental beds,
which are difficult to identify in the field.
The objectives of this work are to determine the geochemical characteristics of the sediments and integrating the major element
geochemistry with the mineralogical composition and petrographic observations in order to understand associated diagenetic processes
to which the rocks have been subjected and infer the depositional conditions.
2 Materials and Methods
Field mapping was carried out within the Dangote cement quarry located at Ibese. Rocks were examined in their natural locations in-
situ, geologically relevant observations of rock features were made and field relationships established. Twelve (12) fresh samples were
collected from the studied section. Laboratory studies include geochemical analysis, carried out on pulverized and pelletized samples
using ED-XRF Spectrometer (EDX3600B Model). LOI was determined by igniting samples for 2 hours at 10000C. Mineralogical
analysis was performed using a Shimadzu XDS 2400H diffractometer with Cu anode, λCU = 1.5406 [A°], on uncompressed powders in
order to collect the maximum of the diffraction lines and a better identification of the phases. The prepared sample was placed in a
Lucite holder on the goinometer of the instrument, which was configured with a graphite monochromator. The diffraction beam

Proceedings of the 2019 International Science Conference Innovation and Advancement in Nanoscience and Nanotechnology, Federal University Oye-Ekiti (www.fuoye.edu.ng), 2019.
16
monochromator operated at 40 KVA and a current of 30 mA with the 2θ values varying from 20 to 600 with step size of 0.020 for 120
minutes to create x–ray patterns with enough intensity to produce lines to identify minerals at the 2θ angles. Scanning rate was 0.75
degree per minute. Minerals were identified using the JCPDFWIN software of the Joint Committee on Powder Diffraction Standard
(JCPDS). Thin sections were also prepared for petrographic observations by standard methods.
3 Results and Discussion
3.1 Geochemistry and Mineralogy
Chemical composition (major oxides) of the samples is summarized in Table 1, including loss on ignition (LOI) values. CaO and SiO2
were the dominant oxides, with the exception of SWM-03 where Fe2O3 is present in significant amounts (26.26 wt.%). CaO
concentration ranges from 4.13 – 94.67 wt. %, with an average of 65.85%, while SiO2 values range from 1.38 - 59.78 wt.% with an
average of 30.58%. The average percentages of the chemical composition of the major elements in the samples is as follows: SO3
(6.61%), Al2O3 (4.62%), Fe2O3 (4.38%), P2O5 (1.05%), MgO (0.72%), K2O (0.59%), TiO2 (0.03%) and MnO (0.01%). CaO
concentration is typically below 50% in SWM-02, 03, 04 and 05 because they are non-carbonates, while the concentration of SiO2 is
generally greater than 20% in these samples. This is consistent with the geology of the Akinbo formation [9]. The high Ca/Mg ratio
observed defines high calcite purity, which is significant in the cement production. LOI values range from 5.13 - 12.20% with an
average of 8.18%.
Table 1: Major elemental geochemistry of the samples
ELEMENT/
OXIDE
NM-
02
NM-
03
NM-
04
NM-
05
NM-
06
SWM-
02
SWM-
03
SWM-
04
SWM-
05
SWM-
06
SWM-
07
SWM-
08 Min. Max. Av.
St.
Dev.
MgO 0.00 0.00 0.09 0.00 0.00 0.99 2.66 0.00 3.23 0.21 0.82 0.65 0.00 2.66 0.72 1.10
Al2O3 1.13 1.40 2.90 4.88 4.55 13.61 9.39 9.37 4.12 1.24 1.13 1.71 1.13 13.61 4.62 4.09
SiO2 1.38 1.94 5.10 10.09 9.12 59.78 36.74 31.66 19.89 1.79 1.47 2.36 1.38 59.78 15.11 18.61
P2O5 0.72 0.75 0.68 0.58 0.64 0.51 2.13 0.66 3.82 0.70 0.79 0.64 0.66 2.13 1.05 0.97
SO3 1.19 1.19 1.01 0.49 1.28 11.48 4.87 40.41 9.34 2.30 3.38 2.42 0.49 40.41 6.61 11.20
K2O 0.00 0.00 0.00 0.00 0.00 1.13 1.54 0.69 3.72 0.00 0.00 0.00 0.00 1.54 0.59 1.12
CaO 94.67 93.63 89.07 76.02 82.59 4.13 14.21 11.92 48.82 92.81 91.40 90.95 4.13 94.67 65.85 35.94
TiO2 0.00 0.00 0.00 0.00 0.00 0.19 0.10 0.01 0.00 0.00 0.00 0.00 0.00 0.19 0.03 0.06
MnO 0.00 0.00 0.00 0.00 0.00 0.00 0.06 0.01 0.02 0.00 0.00 0.00 0.00 0.06 0.01 0.02
Fe2O3 0.34 0.47 0.48 5.76 1.09 6.57 26.26 4.09 6.14 0.35 0.48 0.55 0.35 26.26 4.38 7.34
LOI 6.85 7.69 7.63 5.13 9.26 10.20 12.20 10.10 8.62 7.14 7.14 6.25 5.13 12.20 8.18 1.97
Total 106.28 107.07 106.96 102.95 108.53 108.59 110.16 108.92 107.72 106.54 106.61 105.53 13.27 241.31 107.16 1.86
LOI = Loss on ignition
Results of x-ray diffraction (XRD) analysis revealed that the selected limestone samples are composed of calcite as the dominant
constituent, while dolomite occur as a minor constituent. Kaolinite is the dominant clay fraction (<2µ) present, while quartz is the only
non-carbonate and non-clay mineral recorded. Sharp x-ray peaks of kaolinite indicate its high crystallinity.
3.2 Petrography
The petrological studies of the thin sections were used to evaluate the carbonate microfacies, which consists of the allochems, micrite,
sparry cement and ferruginized fragments. On the average, allochems constitute about 33.75% of the rock fabric followed by micrite
(23.25%). The average composition of sparry cement is 25.25% and ferruginous fragments of about 22.75%. The results of the
petrological classification of the limestones is presented in Table 2. Three microfacies identified based on Folk [6] and Dunham [4]
classification schemes are: unsorted biosparite (packstone), sparse biomicrite (wackestone) and fossiliferous micrite (mudstone). 50%
of the studied limestones show that they are mainly biosparites (packstones), with the allochems generally elongate and poorly sorted
in thin section. The allochems consists mainly of fossils and pellets. Intraclasts are abundant in the limestones. Some of the limestones
contain detrital quartz grains (NM-04). The fossils (macroscopically speaking) consist mainly of gastropods and bivalves shell
fragments, some of which have been recrystallized to calcite. The fossils contain some nucleus of calcitic replacement or
recrystallization of aragonitic shells, which is known as neomorphism (NM-05). The calcitic replacement as well as the absence of

Proceedings of the 2019 International Science Conference Innovation and Advancement in Nanoscience and Nanotechnology, Federal University Oye-Ekiti (www.fuoye.edu.ng), 2019.
17
micrite suggests some considerable amount of solution in the limestones. Some of the gastropods and bivalves shells have been
recrystallized to calcite. Foliated structures were also observed in some of the thin sections.
Table 2. Petrographic classification of the studied limestones
Sample Location Composition of Limestone
(wt.%)
Composition of
allochems (wt.%)
Folk (1974)
Classification
Scheme
Dunham (1962)
Classification
Scheme Label Description
All
och
ems
Mic
rite
Sp
arr
y c
emen
t
Fer
rug
iniz
ed
fra
gm
ent
Intr
acl
ast
s
Oo
lite
s
Fo
ssil
s
Pel
lets
NM-02 Limestone 70 20 10 30 30 0 27 43 Sparse Biomicrite Wackestone
NM-03 Limestone 33 3 50 24 40 2 40 28 Unsorted Biosparite Packstone
NM-04 Limestone 30 50 5 15 50 5 30 15 Sparse Biomicrite Wackestone
NM-05 Limestone 20 10 50 20 20 10 20 50 Unsorted Biosparite Packstone
NM-06 Limestone 2 80 2 16 0 0 5 95 Fossiliferous micrite Mudstone
SWM-06 Limestone 65 20 5 10 50 10 20 20 Packed Biomicrite Wackestone
SWM-07 Limestone 10 0 60 30 20 30 10 40 Unsorted Biosparite Packstone
SWM-08 Limestone 40 3 20 37 30 20 30 20 Unsorted Biosparite Packstone
Table 3. Petrographic classification of non-carbonate samples
Label Description Quartz Microcline Plagioclase Biotite Hornblende Muscovite Opaque
SWM-03 Ferrugnized Sandstone 27.7 22.2 32.5 10.0 3.6 3.2 0.8
SWM-05 Glauconitic unit 1.1 - - - 96.3 2.1 0.5
The framework of the glauconitic layer (SWM-05) shows predominance of hornblende (Table 3) while feldspar and quartz are
dominant components of the sandstone (SWM-03). Attempts to impregnate and lap the shale samples were futile, hence, they were not
captured in the petrography.
4 Conclusion
Globally, limestone is one of the industrial minerals quarried for cement production and a huge reserve is available in the study area.
Chemical analysis of the studied limestones revealed a very low magnesium content and significantly high calcium content. The
average CaO composition ranges between 4.13 and 94.67 wt. %. Mineralogically, calcite is the predominant constituent and its of the
low-magnesian type. This low Mg is marked by the presence of advanced phyla such as sponges and molluscs in the limestones, rather
than simpler organisms like algae. Based on this premise, and the alumina (Al2O3)–MgO relationship, a shallow marine environment
of deposition is suggested. The presence of such fossils suggest that deposition would have taken place in a shallow marine
environment, (probably upper deltaic) or brackish water (probably lower deltaic (marginal-marine)) environment. The presence of
detrital input notwithstanding, the limestones are classified as pure, based on Todd scheme and this is further complimented by
significantly high Ca/Mg ratio. Three microfacies identified from petrographic observations include: unsorted biosparite (packstone),
sparse biomicrite (wackestone), and fossiliferous micrite (mudstone). The rocks have been subjected to extensive diagenetic processes,
the most important of which are cementation, neomorphism, micritization, compaction, dissolution and dolomitization have affected
the limestones. Petrographic studies of Ibese limestone deposit have shown that the rock is highly fossiliferous with the identified
fossils indicating deposition in an open shelf environment. Moreover, the limestone deposit was equally observed to be principally
mud supported which is indicative of rocks deposited in quiet water and a low energy environment. From the aforementioned textural
characteristics, Ibese limestone deposits can be classified as mainly packstone and wackestone.

Proceedings of the 2019 International Science Conference Innovation and Advancement in Nanoscience and Nanotechnology, Federal University Oye-Ekiti (www.fuoye.edu.ng), 2019.
18
References
1. Adegoke O.S., Dessauvagie T.F., Kogbe C.A., and Ogbe F.G.A., 1971. The type section, Ewekoro Formation (Paleocene) of Southwestern
Nigeria. Biostratigraphy and microfacies proceeding, 14 African Micropal. Colloquim, Abidjan, 27-39.
2. Agagu O.A., 1985. A Geological Guide Bituminous Sediments in South Western Nigeria. Unpublished Report, Department of Geology
University of Ibadan.
3. Billman H.G., 1992. Offshore stratigraphy and paleontology of Dahomey Embayment, West Africa. NAPE Bull., 7 (21), 121 – 130.
4. Dunham R.J., 1962. Classification of Carbonate Rocks according to Depositional Texture. In: Ham, W.E., Ed., Classification of Carbonate
Rock, American Association of Petroleum Geologists Memoir, 108-201.
5. Fayose E.A. and Azeez L.O., 1972. Micropaleontological Investigation of Ewekoro Formation, Southwestern Nigeria. Micropaleontology, 18,
69-332.
6. Folk R.L., 1974. Petrography of Sedimentary Rocks. Hemphill Publishing Company, Austin, Texas, pp. 182.
7. Jones M.A., and Hockey R.O., 1964. The Geology of Part of South Western Nigeria. Nigeria Geological Survey Bulletin, 31, 1-101.
8. Maduekwe H.Y., Obasi R.A., Fakolade O.R., and Bassey C.E., 2015. Provenance, Tectonic setting and Source-Area Weathering of the Coastal
Plain Sediments, South West, Nigeria. Scientific Research Journal, 3(2), 20 – 31.
9. Ogbe F.A., 1972. Stratigraphy of Strata Exposed in the Ewekoro Quarry Southwestern Nigeria. African Geology, 305-322.
10. Okosun E.A., 1998. Review of the Early Tertiary Stratigraphy of Southwestern Nigeria. Journal of Mining and Geology, 34 (1), 27-35.
11. Olatinsu O.B., Olorode D.O., Clennell B., Esteban L., and Josh M., 2017. Lithotype characterizations by Nuclear Magnetic Resonance (NMR):
A case study on limestone and associated rocks from the eastern Dahomey Basin, Nigeria. Journal of African Earth Sciences, 129, 701-712.
12. Omatsola M.E., and Adegoke O.S., 1981. Tectonic Evolution and Cretaceous Stratigraphy of the Dahomey Basin. Journal of Mining Geology,
18, 130-137.
13. Reyment R.A., 1965. Aspect of the Geology of Nigeria: Ibadan University Press, pp. 145.
14. Whiteman A.J., 1982. Nigeria, Its Petroleum Geology, Resources and Potential. Graham and Trottan London, 3949.

Proceedings of the 2019 International Science Conference Innovation and Advancement in Nanoscience and Nanotechnology, Federal University Oye-Ekiti (www.fuoye.edu.ng), 2019.
19
Kinetics of Heavy Metals Desorption from Soil Remediated with Hardwood Biochar and
Flame of the Forest (Delonix Regia) Pods
B. M. Babalola*, E.G. Olumayede, S.O. Afolabi
Department of Industrial Chemistry Federal University Oye-Ekiti, Ekiti State, Nigeria [email protected]
Abstract
In this study, the efficacy of two treatments (Delonix regia pod powder and hard wood biochar) for the remediation of tropical soils
contaminated with heavy metal ions (Pb2+, Cu2+ and Cd2+) were examined. The objective was to study the stabilization of the treated
soils by assessing the available metal ions concentration and the index of resupply (R value). The effect of each treatment on metal
availability and metal ions desorption kinetics was assessed using DGT-induced fluxes in soils model (DIFS). Soil dynamics
predicted from values of the labile partition coefficient (Kd), response time to depletion (Tc) and rates of exchange or desorption (k-1)
of metal ions between soil solid and solution phases were also obtained using the DIFS model. The derived value for the labile
partition coefficient, Kd, (Pb2+, Cu2+ and Cd2+) showed that metal ions that can be resupplied to soil solution from the soil solid phase
was highest in biochar-treated soils. The depletion time (Tc) and desorption rate constant, k-1, values also revealed that the biochar
treated soils would be depleted faster than the Delonix regia treated soils. Thus, results from this work has shown that dynamics of
metals in soils should be considered after treatment of contaminated soils.
Keywords: Hardwood-biochar, Delonix regia, metal ions, DGT-induced fluxes in soils (DIFS), labile pool size
1 Introduction
Soils serve as the major reservoir for heavy metals released into the environment as a result of human activities [1], their total
concentration persist in soils for a very long time after they are introduced because they cannot be degraded by microorganisms; but
available methods that give information on the dynamics and mobility of heavy metals resident in soils are limited. To be able to
account for the dynamics of the soil/solute system, the diffusive gradients in thin films technique (DGT) was proposed [2]. The DGT
can be used as a powerful tool for assessing bioavailability of metals in soils, taking into account metal concentration in soil solution
and the solid phase and at the same time providing useful information on the kinetics of release from the solid phase to solution [3].
DGT induced fluxes in soils (DIFS), a dynamic model of the DGT–medium system, can be used to describe quantitatively the
exchange of chemicals between solid phase and solution when the soil is perturbed by a DGT device, allowing the acquisition of
kinetic parameters for the exchange process [4, 5].
The aim of this work is to obtain the exchange kinetics of metal ions (R values, from the solid phase to soil solution, and coefficient of
distribution of the labile pool, Kd values) in soil contaminated with lead, copper and cadmium, after its remediation with commercially
available hardwood biochar and Delonix regia material. The kinetics of resupply by response time, Tc and rate of desorption, k-1 were
assessed using the DIFS model.
2 Materials and Methods
2.1 Materials
Metal solutions of Cu2+, Cd2+ and Pb2+ prepared from salts of copper chloride dihydrate, (CuCl2.2H2O), cadmium nitrate (Cd(HNO3)2)
and lead nitrate, (Pb(NO3)2) obtained from Merck, Germany were used to spike the tropical soils used as samples for the remediation
study. Hardwood biochar purchased from Bodfari environmental UK and Delonix regia pods harvested from Ekiti State University
Ado Ekiti, Ekiti State, Nigeria were added as amendment to the contaminated soils to immobilize the heavy metals ions.
2.2 Methods
Preparation of Chelex binding gels, diffusive gels, the DGT devices and the whole experimental set up were carried out as described
by Houben etal., 2013 and Zhang and Davison 1999 [6, 7]. All experimental apparatuses and DGT plastic moulds were acid washed in

Proceedings of the 2019 International Science Conference Innovation and Advancement in Nanoscience and Nanotechnology, Federal University Oye-Ekiti (www.fuoye.edu.ng), 2019.
20
10% nitric acid overnight and rinse properly with ultra-pure water before use. Triplicate samples of the contaminated soils obtained
from the Western part of Nigeria (Ife, Ilesha and Ijero Ekiti) were treated with hardwood biochar and Delonix regia.
3 Results and Discussion
3.1 The Index of Resupply
The ratio of DGT-measured analyte concentrations (CDGT) to the independently measured soil solution concentration (Csoln) referred to
as R value (Equation 1) is an indication of the ability of the solid phase to resupply the analyte to soil solution. The closer the value of
the resupply index, R to unity, the rapid the resupply of the metal from the solid phase to solution, it is thus used as a measure of the
depletion of soil solution concentration at the DGT-medium interface [7, 8]. Table 1 represented the obtained average R values for the
study.
𝑅 =𝐶𝐷𝐺𝑇
𝐶𝑠𝑜𝑙𝑛 1
Across all the soils, the average resupply of lead from the solid phase to soil solution is highest in the control soil of most samples
(except in Ijero Ekiti). The control samples were able to resupply each of the metal ions studied moderately back to soil solution. The
resupply of copper indicate that the buffering capacity of the biochar treated soils for the copper is high and copper in the solid phase
could be resupplied to the solution faster in biochar-treated soils than those with Delonix regia treatment where the soil buffering
capacity is poor. Cd soil solution concentrations were below the detection limit in the biochar treated soils and so its resupply in these
soils could not be estimated. From the resupply of cadmium it can be concluded that the index of metal resupply is generally higher in
all biochar treated soils.
3.2 Labile Pool Size of Kd Values
The distribution coefficient Kd is an indication of the labile pool size of the metal ions that can be available for DGT measurement; it
is represented in Equation 2 as a ratio used to express the relation between the concentration of the labile metal associated with the
solid phase to the concentration in soil solution [5, 9, 10].
𝐾𝑑 =𝐶𝑠𝑜𝑙𝑖𝑑 𝑝ℎ𝑎𝑠𝑒
𝐶𝑠𝑜𝑖𝑙 𝑠𝑜𝑙𝑢𝑡𝑖𝑜𝑛 2
where the Csolid phase is the concentration of each metal obtained by extraction with 0.01M CaCl2 and the Csoil solution is the concentration
of the metal ions in soil solution obtained by centrifugation. When Kd value is high, it means that the metal species has been retained
by the solid phase through adsorption. Whereas when it is low, it implies that high amount of the metal species are partitioning into
soil solution.
The Kd values for Cu, Cd and Pb in this study showed that biochar treated soils have the highest Kd values in all the soil types
irrespective of metals ions. The Kd values obtained from biochar treated soils for each metal ion was more than the Kd in the Delonix
regia treated soils. The Kd values were as follows: Pb in biochar-treated soils was at least 700 times more than in Delonix regia treated
soils; Cu was at least 2400 times more; while Cd was at least 200 times more in the biochar treated soils. This means that a large
proportion of metals ions in the biochar treated soils are in the soil solid phase and can be redistributed to soil solution. Across all soils
samples, Kd values for lead was the highest while cadmium had the lowest value.
Comparison of R measurements from DGT deployments for different times with the DIFS modelled R values allows the estimation of
parameters such as the soil response time to depletion (Tc), which is the time needed for the disequilibria of labile metals induced by
DGT to revert to 63% of the equilibrium value [11].
The response time Tc can be expressed as the inverse of the dissociation rate constants as shown in Equation 3 [5].
𝑇𝑐 =1
𝑘1+𝑘−1 3
The relationship between R, Kd and Tc can be quantified by the DIFS model if the input parameters of particle concentration (Pc), soil
porosity (Φ), and the diffusion coefficients of the metals ions in the soil (Ds) shown in Equations 4 to 6 are supplied [12].

Proceedings of the 2019 International Science Conference Innovation and Advancement in Nanoscience and Nanotechnology, Federal University Oye-Ekiti (www.fuoye.edu.ng), 2019.
21
𝑃𝑐 =𝑚
𝑉 4
𝛷 =𝑑𝑝
(𝑃𝑐+𝑑𝑝) 5
𝐷𝑠 = 𝐷𝑜(1 − 𝑙𝑛(𝛷2))⁄ 6
with m being the total mass of soil particles; V is the porewater volume in a given volume of total soil; Do is the diffusion coefficient
in water and dp is the density of the soil.
The dissociation rate constant k-1 is estimated by using the Equation 7 [5].
𝑘−1 = 1((1 + 𝐾𝑑𝑃𝑐)𝑇𝑐)⁄ 7
3.3 Response Time and Resupply Rate Constant
Result obtained for the response time to depletion for the system, Tc, is shown in Table 2, from this Table, biochar treated samples of
(Ilesha and Ife) have the highest values; it is observed that soil with high and moderate cation exchange capacity, CEC, (Ilesha and
Ife) have highest response times with biochar treatment. The average Tc for copper and cadmium in biochar treated soil were the
lowest (copper has Tc of 200 s while cadmium has 0.001 s on Ijero soil). From these results, the rate at which biochar treated soil is
able to resupply the metals bound to its solid phase is very fast compared with Tc in Delonix regia treated soil samples. Although
biochar treated soils have large coefficient of distribution for each of the metals ions, but it also has the fastest resupply, thus, from the
kinetic point of view, remediation of heavy metal contaminated soils with biochar will not be considered as effective as Delonix regia
treated soils over the time frame used in this study. Ilesha soil has the next slower response time probably because it has higher CEC
value than other soils; it means it has higher sorption or ability to hold metal to itself than soils with lower CEC. Ife and Ijero soils
have the fastest response time depending on the metal ions considered, this could be as a result of the low or moderate CEC, low pH,
and poor organic matter content in these soils; these properties must have contributed to the fast response time in these soils. Low
CEC and low clay content reduces the sorptive ability of soil for metals ions (Ijero and Ife soils).
3.4 The Desorption Rate Constant
The desorption or resupply rate constant k-1 was calculated from Tc, Pc and Kd using Equation 7. The values obtained for all studied
soils samples (before and after remediation with 2% biochar and 2% Delonix regia) are shown in Table 3. Generally, the highest
values of Tc produce minimum values of k-1. Desorption rate constant for lead in the Ijero remediated soils showed that biochar treated
soils have the least values except in Ijero soil. Soil with highest k-1 is quick to release metal bound to it and the one with lowest k-1
signifies the stronger the material retains the metal, and therefore a slower desorption will occur. In the case of cadmium, Delonix
regia had highest value on Ife soil while Ilesha have highest k-1 for Cd in biochar treated soils. Generally, desorption rate constants for
lead and copper before remediation were higher than those calculated but for cadmium, the desorption rate constant was in most soils
the lowest before remediation was carried out. Lead k-1 was higher in biochar treated soils than in D. regia treated soils in all soil
samples used in this study indicating that the desorption of lead from biochar treated soils is slower than in the D. regia treated soils;
making biochar treatment more effective than D. regia material for lead removal. The Pb k-1 obtained for D. regia treatment appeared
to the highest.
Table 1. Average R values for soil with and without hardwood biochar and Delonix regia treatment
Cu (R) Value Cd (R) value Pb (R) value
Soil Control Biochar Delonix regia Control Biochar Delonix regia Control Biochar Delonix regia
Ijero 0.12 0.69 0.21 0.10 BDL 0.12 0.11 0.63 0.25
Ilesha 0.63 0.58 0.54 0.42 BDL 0.52 0.40 0.16 0.31
Ife 0.34 0.81 0.52 0.18 BDL 0.23 0.45 0.13 1.44

Proceedings of the 2019 International Science Conference Innovation and Advancement in Nanoscience and Nanotechnology, Federal University Oye-Ekiti (www.fuoye.edu.ng), 2019.
22
Table 2. Response time, Tc, (s) values obtained for Cu, Cd and Pb in selected soils with and without hardwood biochar and Delonix regia treatment
Key: Bio: Biochar treated sample, De: Delonix regia pod powder treated sample, BDL: Below instrument’s detection limit
Table 3. Dissociation rate constant, k-1 estimated for Pb, Cu and Cd on control and soil samples remediated with 2% (w/w) Biochar and 2% (w/w)
Delonix regia
4 Conclusion
This work focused on the assessment of the remediation treatment of contaminated soils by biochar and D. regia using the DGT
technique and kinetic modelling by DIFS. The results showed that each of the treatments have remarkable reducing effects on the
available concentration of the studied metals in contaminated soils. The labile pool size (Kd) of metals (Pb, Cu and Cd) that can be
resupplied to soil solution from the soil solid phase is in this order: Bio-treated soils > Delonix regia treated soils > Control soil
samples. The response time (Tc) values followed the order: Control samples > Delonix regia treated soil > biochar treated soils. This
depict that the resupply of available metal concentration back into the soil solution will be fastest in the biochar treated soils. In
majority of the soils, the trend in magnitude obtained for the Tc values are the same obtained for the desorption rate constant, k-1, a
further confirmation that the control soils release available metal to soil solution much slower than the treated soils. The values
obtained for k-1 showed that biochar treatment is effective for lead removal, both treatment types (biochar and Delonix regia) are
effective for copper while none of the two treatments used in this work is effective for the removal of cadmium.
References
1. Wuana R.A., and Okieimen F.E., 2011. Heavy metals in contaminated soils: a review of sources, chemistry, risks and best available strategies
for remediation. International Scholarly Research Network Ecology, pp. 1.
2. Davlson W., and Zhang H., 1994. In situspeciation measurements of trace components in natural waters using thin-film gels. Nature, 367, 546-
548.
3. Gu X., Liu Z., Wang X., Luo J., Zhang H., Davison W., Ma L.Q. and Xue Y., 2017. Coupling biological assays with diffusive gradients in thin-
films technique to study the biological responses of Eisenia fetida to cadmium in soil. J Hazard Mater, 339, 340-346.
Ijero Ife Ilesha
Day 5
Cu Cd Pb Cu Cd Pb Cu Cd Pb
Control 1.38*104 0.40 2.36*104 701.9 1.52 345 210 6.24*102 4318
2% Bio 63 BDL 286.8 30.03 BDL 5401 133.1 BDL 2037
2% De 1476 1.45*103 701.5 124.1 230.6 0.02 628.1 470.3 626.2
Day 21
Control 6330 0.001 5046 289.4 326.6 184.8 450.4 1.32*102 285.3
2% Bio 199.9 BDL 589.7 589.5 BDL 3.34*104 BDL BDL 9505
2% De 3182 3649 1.69*103 149.6 2.67 0.03 111.7 0.043 2212
Day 42
Control 6023 4176 4220 651.2 158.2 291.3 BDL BDL 283.3
2% Bio BDL BDL 86.07 31.3 BDL 6978 BDL DBL 4930
2% De 1965 2885 9.98*102 283.1 0.02 BDL BDL 52.84 1043
Metal/soil Pb Cu Cd
k-1 value in Ijero soil
Control 1.7e-07 3.40e-06 5.33e+01
Biochar 1.63e-07 1.85e01 2.74e-02
Delonix regia 2.85e-06 3.37e-06 4.37e-05
k-1 value in Ilesha
Control 6.29e-08 2.81e-01 8.55e-03
Biochar 3.54e-09 2.16e-01 9.27e-01
Delonix regia 2.27e-08 1.44e-01 1.76e-02
k-1 value in Ife soil
Control 3.35e-06 1.44e-05 1.64e-02
Biochar 4.63e-09 1.23e-06 2.77e-02
Delonix regia 2.41e+00 8.83e-06 9.51e-01

Proceedings of the 2019 International Science Conference Innovation and Advancement in Nanoscience and Nanotechnology, Federal University Oye-Ekiti (www.fuoye.edu.ng), 2019.
23
4. Sochaczewski L., Tych W., Davison B., and Zhang H., 2007. 2D DGT induced fluxes in sediments and soils (2D DIFS), Environ. Modell Softw,
22, 14–23.
5. Harper M.P., Davison W. and Tych W., 2000. DIFS—a modelling and simulation tool for DGT induced trace metal remobilisation in sediments
and soils. Environ Model Softw, 15, 55-66.
6. Houben D., Evrard L. and Sonnet P., 2013. Mobility, bioavailability and pH-dependent leaching of cadmium, zinc and lead in a contaminated
soil amended with biochar. Chemosphere, 92(11), 1450-1457.
7. Zhang H. and Davison W., 1999. Diffusional characteristics of hydrogels used in DGT and DET techniques. Anal Chim Acta, 398, 329-340.
8. Ernstberger H., Davison W., Zhang H., Tye A. and Young S., 2002. Measurement and dynamic modeling of trace metal mobilization in soils
using DGT and DIFS. Environ Sci Technol, 36, 349-354.
9. Lehto N.J., Davison W., Tych W. and Zhang H., 2008. Quantitative assessment of soil parameter (K D and T C) estimation using DGT
measurements and the 2D DIFS model. Chemosphere, 71, 795-801.
10. Di Bonito M., Breward N., Crout N., Smith B. and Young S., 2008. Overview of selected soil pore water extraction methods for the
determination of potentially toxic elements in contaminated soils: operational and technical aspects. Environ Geochem. Site characterization,
data analysis and case histories. Nottingham: Elsevier, 213-249.
11. Guan D.X., Zheng J.L., Zhang H., Davison W. and Ma L.Q., 2017. A diffusion gradient in thin-films technique for the assessment of bisphenol
desorption from soild. J Hazard Mater, 331, 321-328.
12. Harper M.P., Davison W., Zhang H. and Tych W., 1998. Kinetics of metal exchange between solids and solutions in sediments and soils
interpreted from DGT measured fluxes. Geochim Cosmochim Acta., 62, 2757-2770.

Proceedings of the 2019 International Science Conference Innovation and Advancement in Nanoscience and Nanotechnology, Federal University Oye-Ekiti (www.fuoye.edu.ng), 2019.
24
Incidence of Nasal and Hand Carriage of Staphylococcus aureus among Food Handlers in
Lagos, Southwest Nigeria
T.O. Egwuatu1,*, O.M. Ukhureigbe2, S. Iyayi1
1Department of Microbiology, University of Lagos, Akoka, Lagos State, Nigeria 2Department of Microbiology, Federal University, Oye Ekiti, Ekiti State, Nigeria
Abstract
The study was carried out to determine the incidence of nasal and hand carriers of Methicillin Resistant Staphylococcus aureus
(MRSA) among food handlers. A total of 120 samples were obtained from food handlers in six restaurants in Surulere, Lagos
metropolis. A total of 96 Staphylococcus aureus representing 59 (61.5%) nasal and 37 (38.5%) hand were isolated and confirmed
biochemically. Out of 96 S. aureus obtained, 7 were MRSA which comprised of 2 (2.1) from Home food, 1 (1.1%) from African
cuisine, 1 (1.1%) from Lerovar, 3 (3.1%) from local joints and none from upper-crust and ideal restaurants. Antibiotic susceptibility
test was done using Kirby-Bauer disc diffusion technique with zone of inhibition evaluated. The result showed that 28.1% were
resistant to ceftazidime, cefuroxime (25.0%), gentamicin (25.0%), ceftriaxone (17.0%), erythromycin (17.0%), oxacillin (18.8%),
ofloxacin (12.5%), augmentin (8.3%), vancomycin (8.3%), oxacillin (6.3%) and cefoxitin (7.2%). Nasal region had the highest level
of resistance of antimicrobial. Age, gender and hygiene practice were major factors in distribution of Staphylococcus aureus. Out of
the 98% of the food handlers that did not practice good hygiene management, 95% of them did not put on apron, 100% of them did
not cover their nose while cooking, 100% of the females did not cover their hair, 45% of the male kept Afro, 30% of the female and
15% of the male had injury at one part of their body without proper covering. This study revealed that there was an incidence of
MRSA/other antibiotics resistant Staphylococcus aureus in the community.
Keywords: Dnase agar, Kirby-Bauer disc, susceptibility, Staphylococcus aureus
1 Introduction
Food-borne infection is a major international health problem worldwide with consequent economic reduction [1]. Recognizing this,
the World Health Organization (WHO) developed its global strategy for food safety. Food borne diseases result from ingestion of
bacteria, toxins and cells produced by micro-organisms present in food. In the developing world, Food-borne infection leads to death
of many children and resulting diarrheal disease can have long term effects on children’s growth as well as on their physical and
cognitive development [2]. The consumption of contaminated or unsafe foods may result in illness, also referred to as food -borne
disease. In the industrialized world, food-borne infection causes considerable illness, heavily affecting healthcare systems [3]. The
intensity of the signs and symptoms may vary with the amount of contaminated food ingested and susceptibility of the individuals to
the toxin. Food poisoning outbreaks result in huge financial losses to restaurants, in addition to the loss of reputation and confidence
among the public. Such disease remains a major public health problem globally, but particularly in developing countries due to
difficulties in securing optimal hygienic food handling practices. Staphylococcal food-borne diseases are estimated to cause 6-81
million illnesses and up to 9000 deaths, and accounts for 14-20% of outbreaks involving contaminated food [4]. Most of the
Staphylococcal infections are associated with the way food preparation and services are handled, as food handler’s proximity to food
brings about food contamination from the surrounding. An estimated 70% of cases of diarrheal disease are associated with the
consumption of contaminated food [5]. The pathogenicity of S. aureus is due to the toxins’ adherence to host cell proteins antibiotic
resistance.
The role of food handlers in the spread of S. aureus in Nigeria is well documented by several authors showing the level of
staphylococcal contamination and the prevalence of the disease thereafter. Some had worked on the effect of antibiotic on this
organism notable in the Federal capital, Abuja, but only few works are available on the antibiotic pattern in Lagos State. Lagos
represents good sample space to study the distribution of staphylococcal infection as it is densely populated with people from all
spheres from the country. Moreover, the indiscriminate use of antibiotic is high in Lagos State compared to other states in Nigeria
which is a basic health problem [6]. The global antibiotics resistance level of staphylococcus has increased and the amount being
spread by food handlers is alarming. This study will therefore determine the level of the spread of S. aureus, and determine the
antibiotic susceptibility profile. The source and point of contamination of the isolated organisms will as well be determined.

Proceedings of the 2019 International Science Conference Innovation and Advancement in Nanoscience and Nanotechnology, Federal University Oye-Ekiti (www.fuoye.edu.ng), 2019.
25
2 Materials and Methods
2.1 Collection of Samples
A total of 120 samples obtained from 60 food handlers’ (made up of 60 nasals and 60 hands from 60 food handlers) working in s ix
restaurants in Surulere, Lagos were obtained by swabbing the sterile swab sticks in between the fingers, after been moistened in sterile
saline (0.9% NaCl) solution.
2.2 Isolation of Microorganisms and Characterization of Isolates
The samples were inoculated on solidified mannitol salt sugar (which is highly selective because of its high sodium chloride that
inhibits the growth of most microorganisms except halophilic vibrio), and incubated at 370C for 24 h, after which the plates were
observed for green-yellow coloration.
2.3 Catalase Test
A drop of three percent (v/v) hydrogen peroxide was placed on a clean grease -free glass slide and a sterile loop was used to place a
small fraction of the organism on the hydrogen peroxide, after which it was emulsified. The production of glass bubbles indicated a
positive reaction.
2.4 Bound Coagulase
Coagulase test was used to identify S. aureus which produced the enzyme coagulase. A drop of distilled water was placed on a clean
slide; the test-colony from nutrient agar was picked with sterile loop and emulsified with the distilled water, after which a loop full
EDTA anti-coagulated plasma was gently mixed with the suspension.
2.5 Free Coagulase
Isolates of 24 h culture were inoculated in a 2 mL prepared sterile tryptone soya broth (Oxoid, UK) in a test-tube, mixed thoroughly,
after which equal volumes of plasma were dispensed into the constituent of the tubes and then incubated at 370C. Coagulation was
checked at intervals of 1 h, 4 h and the preparations were later discarded after 24 h.
2.6 DNase Test
The isolates were confirmed by sub-culturing on DNase agar medium, and incubating for 24 h at 570C. The colonies were tested for
DNase production by flooding the plates with 1 M HCl solution with precipitation of unhydrolyzed DNA. A positive reaction of
DNase showed a distinct clear zone surrounding growth while no clearing indicted negative reaction.
2.7 Storage of Isolates
All confirmed isolates of S. aureus were stored in nutrient agar slants.
2.8 Methicillin resistance Staphylococcus aureus (MRSA) test
Methicillin resistance was determined by the OPxacillin disk diffusion test. Methicillin resistance test was carried out by inoculation
of the isolates on Mueller Hinton agar supplemented with 4% NaCl. The 5 ug Oxacillin discs (Oxoid, USA) were aseptically placed
on the surface of the inoculated plates and incubated aerobically at 350C for 24 h. The zones of inhibition were measured and
compared with Microbiology Performance Standards for Antimicrobial Susceptibility Guidelines.
2.9 Antibiotics Susceptibility Test
Susceptibility to antibiotics was tested by the disc diffusion using the following antibiotics; augmentin (30 ug/disc), gentamicin (10
ug/disc), ofloxacin (5 ug/disc), erythromycin (25 ug/Disc), oxacillin (12.5 ug/disc), ceftazidime (30 ug/disc), ceftriaxone (30 ug/disc)
and cefuroxime (30 ug/disc). Isolates were first cultured in Mueller Hinton agar (Oxoid) prepared with 5% human blood according to

Proceedings of the 2019 International Science Conference Innovation and Advancement in Nanoscience and Nanotechnology, Federal University Oye-Ekiti (www.fuoye.edu.ng), 2019.
26
the manufacturer’s specification. The pure isolates from the blood agar were then subsequently sub-cultured into Mueller Hinton agar;
the antibiotics disc were placed at the center and incubated at 370C for 24 h, after which the zones of inhibition were measured in
millimeters.
2.10 Statistical Analysis
Chi-square test was applied at 95% confidence interval to determine potential risk factors associated with Staphylococcal hand and
nasal carriage. The level of significance was set at α=0.05 using two tailed method.
2.11 Interpretation of Result
The diameter of the zone of inhibition was measured to the nearest millimeter. Isolates were classified as susceptible, intermediate or
resistant according to the guidelines of Clinical Laboratory Standards Institute, while multi-resistance was defined as resistance to at
least three classes of antibiotics.
3 Results and Discussion
In this study, a total of 60 people working in restaurants and local eateries were examined to determine the carriage of methicillin
resistance Staphylococcus aureus. The male: female ratio in the study was even, with mean age of 25. Ninety-six out of the 120 (80%)
samples were positive for S. aureus based on Gram reaction, microscopy and biochemical reactions. The isolates were Gram-positive
and appeared cocci in shape under the microscope, catalase positive with the evolution of bubbles when treated with hydrogen
peroxide. Isolates were as well coagulase positive to both slide and tube coagulase reaction, with the formation of clot in the tube after
incubation for 1 h and 4 h. All the samples positive to Gram reaction, catalase and coagulase tests were confirmed as S. aureus when
incubated in Dnase agar for 24 h with the formation of clear zone around the colonies after flooding the plates with 1 M HCl solution.
Of the total 96 isolates of S. aureus obtained from the food handlers, the highest number of isolate - 87.5% (14/16) was observed in
samples obtained from African cuisine, followed by side way vendors 85.7% (36/42). Others included home food with isolation rate of
83.3% (20/24), Ideal 67.7% (8/12), Lerovar 71.4% (10/14), and then least - Upper crust 6.7% (8/12) (Table 1). The overall
performance of MRSA among the study population was 7.29% (7/96) which were obtained from home food restaurants 2(2.1%),
1(1.0%) from African cuisine, 1(1.0%) from Lerovar restaurants and then 3(3.1%) from side way vendor restaurants (Table 1 and 5).
Table 1. Incidence of Staphylococcus aureus among the study subjects
Samples source
(Restaurants)
No. examined No. of positive
Staphylococcus aureus
Percentage isolation (%) Percentage of MRSA
(%)
Home food 24 20 83.33 2(2.08)
Ideal 12 8 66.67 0(0)
African cuisine 16 14 87.50 1(1.04)
Lerovar 14 10 71.43 1(1.04)
Upper crust 12 8 66.67 0(0)
Roadside vendors 42 36 85.71 3(3.13)
Total 129 96 7(7.29)
Key: MRSA represents Methicillin resistant Staphylococcus aureus
The age and sex distribution of S. aureus as seen in Table 2 showed that out of 96 isolates, 50 (52:1) were isolated from male and
46(47:7) from female. Among the males, the incidence rates were 12(12.5%), 17(17.7%), 13(13.5%), 6(6.3%), 2(2.1%), 0(0%) for
ages 11-20, 21-30, 31-40, 41-50, 51-60 and >60, respectively; while that of the females were 7(7.3%), 9(9.4%), 11(11.5%), 8(8.3%),
3(3.1%), 0(0%) for ages 11-20, 21-30, 31-40, 41-50, 51-60 and >60, respectively (Table 2). However, the relationship between female
and male was not statistically significant (x2=1.340; p>0.5 and x2=2.894; p>0.1, respectively).
There was statistical association between the different sites of samples obtained and isolation of S. aureus from the food handlers
(x2=11.030, p<0.01). Isolation of S. aureus with respect to site of sample collection showed a high percentage for nasal samples than
from hand as 19(38.0%) were isolated from the hands of males and 31(62.0%) from their nasal regions, while 18(39.1%) were isolated
from females’ hands and 28(60.9%) from their nasal regions as shown in Table 3.
A total of 96 S. aureus isolates were tested against antimicrobial agents. Majority of the isolates were susceptible to ceftazidime
71.9% (69/96), cefuroxime 75.0% (72/96), gentamicin 75.0% (72/96), ceftriaxone 81.2% (79/96), erythromycin 81.2% (79/96),

Proceedings of the 2019 International Science Conference Innovation and Advancement in Nanoscience and Nanotechnology, Federal University Oye-Ekiti (www.fuoye.edu.ng), 2019.
27
cloxacillin 81.2% (78/96), ofloxacin 87.5% (84/96) and augmentin 91.7% (88/96). The isolates were highly susceptible to cefuroxime
92.7% (89/96) and gentamicin 91.7% (88/96).
Table 1 deduces that the highest number of isolate was recovered from samples obtained from African cuisine, while the lowest was
recovered from sample obtained from Ideal/Upper crust. Table 2 shows that among the males, the highest incidence rate of
Staphylococcus aureus infection was, 17(17.7%), while that of the females was 11(11.5%). Table 3 indicates that with respect to
gender, isolation of S. aureus was higher in males compared to females. Table 4 shows that among the home food handlers, all
females (100%) were infected by this organism, while 87.5% of the males were infected.
Table 2. Age and sex distribution of food handlers with Staphylococcus aureus
Age group(Years) No. of positive sample
Male(%) Female(%) No of positive sample (%)
11-20 12(12.5) 7(7.29) 19(19.79)
21-30 17(17.71) 9(9.38) 26(27.08)
31-40 13(13.54) 11(11.46) 24(25)
41-50 6(6.25) 8(8.33) 14(14.58)
51-60 2(2.08) 8(8.33) 11(11.46)
>60 0(0) 3(3.13) 3(3.13)
Total 50(52.08) 46(47.72) 96(100)
Table 3. Distribution of S. aureus in the nose and hand of the study subjects
Male Female
Hand Nasal Hand Nasal Total
5 9 5 3 22
2 2 3 3 10
2 2 2 4 10
2 4 1 3 10
1 3 2 2 8
7 11 5 13 36
19(38%) 31(62%) 18(39.13%) 28(60.87%) 96
Table 4: Distribution of Staphylococcus aureus among subject gender from the different restaurants
Sample source (Restaurant) No. examined No. of male No. of female Positive male (%) Positive female (%)
Home food 12 8 4 7(87.5) 4(100)
Ideal 6 2 5 2(100) 3(60)
African cuisine 8 3 5 2(66.7) 3(60)
Lerovar 7 5 2 3(60) 2(100)
Uppercrust 6 3 3 2(66.7) 2(60)
Roasdside Vendors 21 9 11 8(88.9) 9(81.8)
Total 60 30 30 25(83.33) 23(76.67)
This study revealed a high incidence of S. aureus among 60 food handlers sampled from Surulere area of Lagos state. The rate of
isolation 96(80%) of S. aureus in this study corresponds with a particular report [6], where S. aureus recorded an incidence of 71.4%
among food handlers in a University Community in Southern part of Nigeria. However, this is in contrast with the report of another
study [7] with a reported incidence rate of 20.5% among food handlers working at Gondar University, Northwest Ethiopia. The
variation in incidence of S. aureus in these studies was attributed to the activities and hygiene management of the food handlers: 57
out of 60 (95%) did not put on aprons, 54(90%) did not have their regular bath, 48(80%) kept long finger nails, 54(90%) picked their
nose, 39(65%) of the males kept afro hair while 39(15%) of them had cut on the fingers that were not covered. Moreover 18(30%) of
the females had uncovered or undressed cut on their fingers. There was a total (100%) observation of non-compliance to hand
washing, wearing of hand glove or moth mask before food preparation.
It was observed that the males 25 (83.3%) harboured S. aureus more than females 23 (76.7%) but this was not statistically significant
(x2=1.340; p>0.5 and x2=2.894; p>0.1, respectively). In a report Pertanika [8], there was also no significant relationship between the
male and female food handlers (x2=0.261; p=0.609) despite the fact that 25% of female food handlers harboured S. aureus when
compared to 18.8% of the male food handlers. The incidence of S. aureus was prominent in ages 21-30 years with 26 positive isolates
followed by 31-40 years with 24 isolates. The isolation of S. aureus was observed in 60 years and above with 3 positive isolates. This

Proceedings of the 2019 International Science Conference Innovation and Advancement in Nanoscience and Nanotechnology, Federal University Oye-Ekiti (www.fuoye.edu.ng), 2019.
28
observation was similar to the work of a particular scientist [9]. The low occurrence of S. aureus among the aged can be attributed to
restricted activities as they were involved in the supervision of the younger ones and it was observed that 90% of them practiced good
hygiene of frequent hand washing and general cleanliness. Nasal carriage (59) in this study was higher than hand carriage (37) and this
was statistically significant (x2=11.03, p<0.01). The contamination of the food handlers with S. aureus could probably be as a result of
hygienic non-compliance of food handlers. It was observed that ninety percent (90%) of the food handlers engaged in picking of their
noses while on duty. In a report by Cepoglu et al., [10] a higher incidence of S. aureus was also from the nasal region (43.6%) when
compared to the hand region (36.8%) of the food handlers.
In this study, isolates showed low antibiotic resistance to augmentin (8.3%), ofloxacin (12.5%), vancomycin (8.3%) which was in
agreement with the report by Onanuga and Temedie, [11] in which the resistances were recorded as follows: augmentin (5.0%),
ofloxacin (10.0%), and vancomycin (7.5%). Vancomycin, a drug reserved for the treatment of MRSA infection, which in the past S.
aureus exhibited 100% susceptibility to; but in this study S. aureus isolates in healthy individual were seen to have 8.3% resistance. A
high antibiotics resistance of S. aureus to gentamicin (25.0%), ceftazidime (28.0%) and cefuroxime (25.0%) were also observed in this
study, which was in contrast to the work by Onanuga and Temedie, [11] who reported no gentamicin resistant S. aureus but observed
low occurrence of ceftazidime (5.0%) and cefuroxime (2.5%) resistance among their S. aureus isolates. The high resistance to
cefuroxime (25.0%) in this study is of public concern because the antibiotic is expensive and not easily available to the common man;
however, further work need to be carried out to substantiate this observation. Out of the 96 positive isolates, 7 (7.3%) were MRSA of
which 5 (71.4%) were obtained from the nasal region and 2 (28.6%) from the hand region. However, the rate of resistance in this
study was in consonance with a particular study in which 9.8% of S. aureus were resistant to cefoxitin.
4 Conclusion
A resistance of 7.3% observed in MRSA in the nasal and hand region of food handlers screened in this study portends potential danger
to the public, if the organism eventually gets into the hospital environment due to the high infection potentials of the organism.
References
1. Borges L.J., Campos M.H., Andre M.D. and Serafini A.B., 2011. Microbiological quantity and phenotypic characterization of microorganism
isolated from enteral feeding, food handlers and environment of two public Brazilian hospitals. J Food Safety, 31, 1125-1131.
2. Arvola T., Ruuska T., Keranen J., Hyoty H.S. and Isolauri E., 2006. Rectal bleeding in infancy: clinical, allergological, and microbiological
examination. J Pediatr, 117(4), 760-768.
3. Okonko I.O., Ikpoh I.S., Nkang A.O., Udeze,A.O., Babalola T.A. and Fajobi E.A., 2010. Assessment of bacteriological quality of fresh meats
sold in Calabar metropolis, Nigeria. EJEAF Che 9(1), 89-100.
4. Mead P.S., Slutsker L., Dietz V., McCaig L.F., Griffin P.M. and Tauxe R.V., 1999. Food-related illness and death in the Unites States. Emerg
Infect Dis, 5, 607-625.
5. Ifeadike C.O., Ironkwe O.C., Adogu P.O.U., Nnebue C.C., Emelumadu F.O., Nwabueze S.A. and Ubajaka C.F., 2012. Prevalence and pattern of
bacteria and intestinal parasites among food handlers in the Federal Capital Territory of Nigeria. Niger Med J, 53, 166-171.
6. Chigbu C.O. and Ezeronye O.U., 2003. Antibiotic resistant Staphylococcus aureus in Abia State of Nigeria. J Bacteriology 2(10), 374-378.
7. Mulat D., Moges T. and Fekeke M., 2012. Survey of nasal carriage of Staphylococcus aureus and intestinal parasite among food handlers
working at Gondar University Northwest, Ethopia. BMC Public Health, 12(1), pp. 837.
8. Pertanika J., 2012. Staphylococcus aureus in hand and nares of food handlers in Kuala, Malaysia. J Trop Agric Sci, 35(4), 855-862.
9. Ketamkua C. and Tekalign A., 2013. Emergence of a community associated methicillin-resistant Staphylococcus aureus strain with a unique
resistance profile in Southwest Nigeria. J Clin Microbiol, 97(9), 2975-2981.
10. Cepolgu O.D, Oyediran E.I.O., Adeyemo A.T. and Oyeleke O.T., 2010. Prevalence and antibiotic resistance pattern of methicillin resistance
Staphylococcus aureus among in-patients at a tertiary health facility in ido-Ekiti, Nigeria. J Lab Med, 4, 21-30.
11. Onanuga A. and Temedie C., 2011. Nasal carriage of multi-drug resistant Staphylococcus aureus in healthy inhabitants of Amassonma in Niger
Delta region of Nigeria. Afr Health Sci, 11(2), 176-181.
Proceedings of the 2019 International Science Conference Innovation and Advancement in Nanoscience and Nanotechnology, Federal University Oye-Ekiti (www.fuoye.edu.ng), 2019.
29
Levels and Risk Assessment of Heavy Metals in Vegetables from Hospital Waste Dumpsite
using Energy Dispersive X-Ray Fluorescence Spectrometry
Oketayo Oyebamiji Oyedele*, Ikpe Uchechukwu Oluwasegun
Department of Physics, Federal University Oye-Ekiti, Ekiti State, Nigeria [email protected]
Abstract
In this study, the levels of nineteen heavy metals (As, Br, Ca, Cr, Cu, Fe, Ga, K, Mn, Ni, Rb, Sc Se, Sr, Ti, V, Y, Zn and Zr) in twelve
vegetable samples (Talinum triangulae and Amaranthus hybridus) from the hospital waste section of Ado-Ekiti waste dumpsite were
determined using Energy Dispersive X-Ray Fluorescence Spectrometry. Identical samples were also collected and analyzed as
control. The results indicated that the observed heavy metals were within the range 1.196 - 4426.799 and 0.236 -3614.888 mg/kg in
the site and control, respectively. Significant difference (p <0.05) also exists between the levels (tvalues = 0.01-0.42) of Cr, Mn, Fe, As,
Se and Y in the sites and control. The samples from the site were slightly enriched in As, Br, Cu, Cr, Ga, Mn and V (Enrichment
Factors (EF) = 1.00-3.2). The relatively higher levels of Mn, Zn, Cr, Ni and As in the samples from the site compared with
WHO/FEPA permissible limits was an indication of contamination. Hence, the consumption of these vegetables could be detrimental
to health.
Keywords: Levels and risk assessment, heavy metals, vegetables, hospital wastes, EDXRF
1 Introduction
Over the years, Nigeria to be precise has been lagging behind when it comes to waste management [1]. Hospital waste dumpsites
have been known to be a major source for the production of naturally occurring radioactive materials (NORM) and have been in
existence for years without having knowledge of the threats posed to the public [2]. Medical waste that is burned with regular trash in
incinerators or burned in the open poses a hazard as the smoke creates mercury. Dioxins and other toxic substances that go into the air
we breathe. Medical waste thrown in the regular trash ends up in landfills where scavengers may be exposed to diseases caused by
medical waste. Metal ions have been found to interact with cell components such as DNA and nuclear proteins, causing DNA damage
and conformational changes that may lead to cell cycle modulation, carcinogenesis or apoptosis [3]. Several studies have
demonstrated that reactive oxygen species (ROS) production and oxidative stress play a key role in the toxicity and carcinogenicity of
metals such as cadmium, chromium and lead [4]. It has also been reported that heavy metals have negative effects on the human
system such as the cell, endoplasmic reticulum, nuclei, membrane and some enzymes that are involved in the metabolism, damage
repair and detoxification [5].
This study therefore aimed at determining the baseline concentration of heavy metals in vegetables from a major hospital waste
dumpsite and assesses the hazard or risk to the residents within the area of study.
2 Materials and Methods
Twelve (12) samples were collected from the hospital waste section of Ado-Ekiti waste dumpsite (located at Ilokun Ado-Ekiti). Two
(2) vegetables (Amaranthus hybridus - African spinach and Taliium triangulae - water leaf) at various distances from the source were
collected from the site. Identical samples were also collected as control. Samples were properly rinsed with distilled water to remove
the sand and dust and stalk of the plants were carefully removed using nylon gloves and rinsed properly, freeze dried, labeled
accordingly and kept separately. The same procedure was used for the control. Sample was first pulverized into fine powder. About
300 mg of the pulverized samples were each measured via a Sartorius micro-weighing balance. The measured sample was
mechanically turned into a 13 mm target via the Carver model pelletizing machine before irradiating the samples in the external target
chamber of the XRF system. The irradiation was done with an X-Ray Fluorescence Spectrometer (equipped with a silver (Ag) anode)
at a voltage of 25 kV and current of 50 µA for 1200 counts or 20 minutes. The equipment model is PX 2CR Power Supply and
Amplifier for XR-100CR Si-pin Detector. Characteristic X-ray of the sample was detected by the solid state Si-pin detector system
and spectrum acquisition was done using an Amptek model multi-channel analyzer while elemental analysis was done using the thick
target mode of the International Atomic Energy Agency (IAEA) Quantitative Analysis of X-ray Iterative Least (Q-Axil) square
software. Determination of all the heavy metals in the vegetable samples was done using Energy Dispersive X-Ray Fluoresence

Proceedings of the 2019 International Science Conference Innovation and Advancement in Nanoscience and Nanotechnology, Federal University Oye-Ekiti (www.fuoye.edu.ng), 2019.
30
(EDXRF) Spectroscopy at the Centre for Energy and Research Development Obafemi Awolowo University Ile-Ife, Nigeria. This
analytical technique is non-destructive, fast, sensitive, and multi-elemental.
The enrichment factor (EF) for each of the elements was determined by using crustal values and Fe as the reference element (Equation
1). Thus, Equation 1 indicates how enriched the samples are in heavy metals.
𝐸𝐹 =
𝑋
𝐶𝑜𝑛𝑐 𝑜𝑓 𝐹𝑒(𝑠𝑎𝑚𝑝𝑙𝑒)𝑌
𝐶𝑜𝑛𝑐 𝑜𝑓 𝐹𝑒(𝑟𝑒𝑓𝑒𝑟𝑒𝑛𝑐𝑒)
1
where X is the concentration of the element in the sample, and Y is the concentration of the element in the reference. The reference
used in this research is the non-contaminating site (i.e. the control).
2.1 Quality Control and Statistical Analysis
Certified/ reference material (NIST 1515) was digested and analyzed for some heavy metals to ascertain the precision and accuracy of
the results obtained in this study. Strong correlation calculation (r = 0.99) was obtained between the certified and experimental values.
This ascertained the precision and reliability of the results obtained in this study. Significant differences were determined between the
levels of these heavy metals in the site and control at p < 0.05 using t-test (SPSS 17)
3 Results and Discussion
The levels of heavy metals in vegetable samples from the site and control were presented in Table 1 while Table 2 shows the
comparison of the results obtained in this study with WHO limits [6] and the control. Table 3 depicts the enrichment factors of heavy
metals in the vegetable samples from the site.
Table 1. Descriptive statistics of heavy metals in the samples
Elements Talinum triangulare (mg/kg) Control (mg/kg) Amaranthus hybridus (mg/kg) Control (mg/kg)
K 7.061 ± 0.350 2.650 ± 0.133 2.819 ± 0.175 2.627 ± 0.165
Ca 4426.799 ± 211.745 3614.888 ± 140.974 1.251 ± 0.055 1.285 ± 0.049
Sc 349.506 ± 78.715 255.125 ± 20.390 812.859 ± 216.355 999.558 ± 200.153
Ti 21.832 ± 3.515 6.936 ± 3.435 49.075 ± 5.864 47.972 ± 3.512
V 13.628 ± 2.224 5.253 ± 5.864 21.544 ± 6.377 16.353 ± 4.544
Cr 12.000 ± 3.515 3.443 ± 1.330 11.766 ± 3.515 13.661 ± 0.556
Mn 106.766 ± 9.008 40.074 ± 1.482 57.546 ± 6.555 26.320 ± 5.529
Fe 123.356 ± 8.109 111.801 ± 2.802 374.431 ± 21.128 223.602 ± 29.283
Ni 18.275 ± 3.515 17.589 ± 0.888 31.749 ± 3.754 23.371 ± 4.558
Cu 22.347 ± 4.075 32.841 ± 1.182 20.661 ± 3.329 25.814 ± 4.488
Zn 79.003 ± 4.770 81.752 ± 1.532 88.371 ± 6.920 69.168 ± 10.987
Ga 10.089 ±5.864 3.969 ± 0.343 14.980 ±5.864 3.171 ±5.612
As 11.217 ±0.004 3.585 ±1.345 13.721 ±5.777 3.683 ±7.210
Se 11.966 ±1.347 5.504 ±0.344 17.513 ± 4.653 5.298 ± 1.309
Br 15.064 ±1.347 6.872 ± 1.347 15.940 ± 4.554 11.619 ± 1.419
Rb 19.667 ± 5.820 19.002 ± 1.619 27.078 ± 5.228 25.368 ± 1.848
Sr 16.333 ±5.864 7.333 ± 1.684 28.889 ± 5.864 34.222 ± 1.928
Y 17.154 ± 1.045 6.481 ±5.864 18.668 ±1.488 7.011 ±0.878
Zr 17.714 ± 2.334 5.450 ± 0.567 21.108 ±3.445 5.905 ±2.112

Proceedings of the 2019 International Science Conference Innovation and Advancement in Nanoscience and Nanotechnology, Federal University Oye-Ekiti (www.fuoye.edu.ng), 2019.
31
Table 2: Comparison of the levels (mg/kg) of heavy metals in the vegetables with WHO limits
Elements Talinum triangulare
(site)
Talinum triangulare
(Control)
Amaranthus hybridus
(site)
Amaranthus hybridus
(Control)
WHO (2011) limits
Ca 4426.799 3614.888 1.251 1.285 1000
Sc 349.506 255.125 812.859 999.558 1000
Fe 123.356 111.801 374.431 223.602 420
Mn 106.766 40.074 57.546 26.320 6.64
Zn 79.003 81.752 88.371 69.168 60
Cu 22.347 32.841 20.661 25.814 40
Ti 21.832 6.936 49.075 47.972 1000
V 13.628 5.253 21.544 16.353 1000
Cr 12.000 3.443 - 13.661 2.3
Ni 18.275 17.589 31.749 23.371 10
Ga 10.089 3.969 14.980 3.171 -
As 11.217 3.585 13.721 3.683 1.4
Se 11.966 5.504 17.513 5.298 -
Br 15.064 6.872 15.940 11.619 -
Rb 19.667 19.002 27.078 25.368 -
Sr 16.333 7.333 28.889 34.222 -
Y 17.154 6.481 18.668 7.011 -
Zr 17.714 5.450 21.108 5.905 -
Table 3. Enrichment factors of the heavy metals in the samples
Element Enrichment Factor (TT) Enrichment Factor (AH)
Ca 1.11 0.58
Sc 1.24 0.49
Fe 1.00 1.00
Mn 2.41 1.30
Zn 0.88 0.76
Cu 1.10 0.48
Rb 0.93 0.64
K 2.41 0.64
Ti 0.30 0.59
V 2.34 0.79
Cr 3.20 0.51
Ni 0.94 0.81
Ga 2.30 2.82
As 2.83 2.22
Br 2.00 1.24
Key: TT = Taliium triangulare (water leaf), AH = Amaranthus hybridus (African spinach); E<1 (not enriched), 1-10 (slightly enriched), 10+
(enriched)
The results indicated that the concentrations of Ca, Sc, Fe, Rb, K, Ti, V, Cr, Ni, Ga, As, Se, Br, Sr, Y, Zr and Mn on the site were
within 1.196-4426.799 mg/kg. Figs. 1 and 2 are the pictorial representations of the levels of the observed heavy metals in the site
considered and the control. These results were found to be relatively higher than the control for heavy metals Cr, Mn, Fe, As, Se and
Y (t = 0.01-0.42) as shown in Figs. 1 and 2. Generally in the site, the mean concentration of Ca was higher in Talinum triangulare
indicating the variability in the rate of absorption of these heavy metals by the two vegetables. This implies that the heavy metal could
be easily absorbed by Talinum triangulare than amaranthus hybridus. The same trend was also observed for Mn in those samples. In
most cases, the concentrations of these metals decreases with respect to distances (m) from the site. However, the results obtained for
Br, Cr, Cu, Ni and Zn in this work were higher but lower for Fe and Fe compared with a similar study by Muhammad et al. [7].
The mean concentration (mg/kg) of Mn, Zn, Cr, Ni and As in Talinum triangulare and Amaranthus hybridus were higher than the
maximum permissible limits set by WHO (Table 2). This was an indication that the vegetables at this site were contaminated. Their
consumption could be detrimental to health. Although, Manganese is very essential for photosynthesis but its continuous consumption
could result into bio-accumulation in the body system. Generally and also relative to the control, the results obtained from t-test
indicated that significant difference exists (t<0.05) in the concentrations of these heavy metals. This variation was also an evidence of
contamination by the hospital waste dumpsite. These vegetable samples from the site were slightly enriched in Mn, Cu, K, V, As, Br,
Ca, Se (EF = 1.00-3.20) but not enriched in Zn, Rb, Ti and Ni.

Proceedings of the 2019 International Science Conference Innovation and Advancement in Nanoscience and Nanotechnology, Federal University Oye-Ekiti (www.fuoye.edu.ng), 2019.
32
Fig. 1. Levels of heavy metals in the samples and control (mg/kg)
Fig. 2. Levels of heavy metals in the samples and control (mg/kg)
4 Conclusion
The levels of nineteen heavy metals (Ca, Sc, Fe, Rb, K, Ti, V, Cr, Ni, Ga, As, Se, Br, Sr, Y, Zr, Mn, Zn and Cu) in vegetable samples
have been determined using Energy Dispersive X-Ray Fluorescence spectrometry (EDXRF). The results obtained gave the baseline
levels of these metals in vegetable samples from the hospital waste dumpsites. Using t-test, the result showed that significant
differences exists between the levels of these heavy metals in the site and control (p < 0.05, t = 0.01-0.42). The two different vegetable
samples were also found to be slightly enriched in Mn, Zn, Cr, Ni and As (EF = 1.00-3.20). The relatively higher levels of heavy
metals (compared with control and WHO) observed in this study was an indication of pollution/contamination of these edible plant
samples at the dumpsites.
References
1. Nwachukwu Nkechi Chuks, Orji Frank Anayo and Ugbog Ositadinma Chinyere, 2013. Health Care Waste Management – Public Health:
Benefits, and the Need for Effective Environmental Regulatory Surveillance in Federal Republic of Nigeria, In: Current Topics in Public Health,
Intech, http://dx-doi.org/105772/53196, 150-178.
2. Uwadiegwu B.O., 2013. Strategies for effective urban solid waste management in Nigeria. European Scientific Journal, 9 (8), 296-298.
3. Tchounwou P.B., Ishaque A., Schneider J., 2001. Cytotoxicity and transcriptional activation of stress genes in human liver carcinoma cells
(HepG2) exposed to cadmium chloride. Molecular Cellular Biochemistry, 222, 21-28.
4. Vousta, D., Grimanis A., Samara C., 1996. Environmental Pollution, 94, 325-335.
5. Wang S., Shi X., 2001. Molecular mechanisms of metal toxicity and carcinogenesis. Molecular Cellular Biochemistry, 222, 3-9.

Proceedings of the 2019 International Science Conference Innovation and Advancement in Nanoscience and Nanotechnology, Federal University Oye-Ekiti (www.fuoye.edu.ng), 2019.
33
6. WHO, 2011. Evaluation of certain contaminants in food (Seventy-Second Report of the Joint FAO/WHO Expert Committee on Food Additives).
WHO Technical Report Series, No. 959.
7. Muhammad F., Anwar F. and Rashid U, 2008. Appraisal of Heavy Metal Contents in Different Vegetables Grown in the Vicinity of an
Industrial Area. Pak J Bot, 40, 2099-2106.

Proceedings of the 2019 International Science Conference Innovation and Advancement in Nanoscience and Nanotechnology, Federal University Oye-Ekiti (www.fuoye.edu.ng), 2019.
34
Near Field Communication (NFC) Based Lecture Attendance Management System on
Android Mobile Platform
Comfort Y. Daramola*, Olaiya Folorunsho, Bosede A. Ayogu, Lawrence Adewole
Department of Computer Science, Federal University Oye-Ekiti, Ekiti State, Nigeria [email protected]
Abstract
Automatic identification system (AIS) has been employed by several organizations for keeping track of the attendance record of their
employees. In higher institutions in Nigeria, the usage of AIS has not been fully adopted despite the tremendous benefits of using this
system for recording attendance. The manual method of calling names and marking attendance list in the universities consume quality
time and distract students whenever lectures are going on. Also, impersonation on the part of the student; a situation whereby students
sign attendance for their friends, which is not helping students to build their integrity. The difficulty experienced during manual
method could be addressed by adopting technology like Near Field Communication (NFC)-based attendance management system.
Using this technology, there would be significant reduction in the paper work and manual data input that may lead to data
inconsistency and loss. This work, therefore, provides an efficient way of capturing students attendance during lectures that will be
less prone to both human manipulations and error-free using NFC on android mobile platform.
Keywords: Near Field Communication (NFC), attendance, management system, mobile platform
1 Introduction
In present-day institution, attendance registration is posing a great challenge in academic setting as a result of hurdles surrounding the
process adopted. Attendance is an integral part of students’ academic record; in most institution students are required to meet-up with
some percentage attendance to be eligible to write examination or used as part of continuous assessment in each of their respective
courses. However, the traditional method of passing an attendance paper or calling names is tedious, error prone, time consuming and
inefficient as some students may double-dip or attendance paper misplaced. These challenges in recent time has imposed a need for
an improved and more efficient process of attendance registration. Since user authentication and verification is the major aspect of an
attendance system, improved technology is required. Few of the technologies that can be in place for simplification and improvement
of attendance system are Radio Frequency Identification (RFID), Biometric, and Near Field Communication (NFC) [1].
In the recent decade, attention has been drawn to the usage of RFID and NFC contactless technologies for the communication and
exchange of data with their contactless identification associated with these device [2]. These two devices made use of active reading
devices to gather data stored on passive, wireless tags which could be attached to objects. RFID is best known for the tagging of
consumer products and its use in contactless smartcards for identification, ticketing or mobile payment. Although both RFID and NFC
use the same contactless identification, NFC is mobile devices compliance [3].
Nowadays, the number of mobile phones that come with NFC functionality has continue to increase, there is tendency for adoption of
NFC technology mobile contactless interaction. NFC works on short/close operating distance between the devices and (passive) tags
of about 3 to 5 cm. To establish communication between any mobile phone and tag, either the tag is touched with the reading device
or closely holding them together. Adopting the technology of either NFC or RFID in managing student attendance in higher
institutions in Nigeria will of no thought eradicate the wastage of quality time, errors and manipulations associated with traditional
attendance collection.
The NFC is variant of an RFID, both are based on contactless identification technology. NFC has a relatively short-range radio
communication while RFID has a longer range. Despite that both NFC and RFID can identify objects at a range, the NFC is more
secure to RFID due to its shorter range, whereas the RFID has a greater potential for unauthorized tag readings, known as
eavesdropping. NFC’s short-range reading capacity lowers its potential for eavesdropping, even if the tags are not sufficiently secured
[4]. There are currently several terminal devices for RFID (e.g., PDAs and laptops) that have been integrated with an RFID reader.
However, RFID does not yet occupy enough space in the smartphone area compared to NFC, and having an NFC reader and tag in a
smartphone gives it benefits in terms of availability and usability.

Proceedings of the 2019 International Science Conference Innovation and Advancement in Nanoscience and Nanotechnology, Federal University Oye-Ekiti (www.fuoye.edu.ng), 2019.
35
2 Review of Related Works
For the purpose of managing and improving attendance, researchers have come up with different perspective on the enhancement of
the system. Jain et al. [5] developed a desktop application recording student attendance, whenever the application is launched, it
displays the list of students that registered for a particular course. To mark students that were present, both the check box close to the
student’ name and register button is clicked. Zhang et al. [6] developed web-based attendance management system that used card
technology for identifying students and taking attendance. Their system was developed using Oracle and VisualStudio.Net. Basheer
and Raghu [7] developed attendance system that is authenticated using fingerprint. To record student attendance, the student placed
his or her finger on the device’s sensor. Geng et al. [8] developed RFID reader using components such as transceiver chip,
microcontroller, LCD, serial communication IC, power supply module, USB interface, and power supply module. Whenever the staff
card is brought in contact with the reader, data is sent to PC manager application which will authenticate the data and extract
information like staff ID and access time into the database. Lim et al. [3] work was similar to Geng et al. [9], when a student touches
the reader, it sends the data to the microcontroller for comparison with the ID stored in the microcontroller’s memory; if ID exists, the
name, ID and attendance will be presented on the LCD then transfer the data to PC via RS323 port. Kassim et al. [10] also developed
attendance system based on RFID, the terminal of RFID reads and stores into the online server’s database the student ID, date and
time.
In university setting, contactless identification technology like NFC can be utilized to record and manage attendance easily. Benyo et
al. [11] developed NFC based student attendance monitoring system for the Budapest University of Technology and Economics
(BME). The system assisted the university to take the percentage of student’s attendance for the purpose of allowing student that meet
up with allowable attendance to write exam. In order to avoid impersonation by the student, biometric identification was introduced
and incorporated to the system. The students register their attendance from a terminal that has NFC and fingerprint reader using only
card that stores student ID and fingerprint. The terminals store the attendance data and it periodically send the data during the day to a
back-office system. The terminals as well as back-office store timetable and identification policy. The back-office generates the report
from the data received from the terminals. The terminal is capable of storing attendance data for a complete semester. Patela and Jainb
[12] developed a mobile phone attendance system for small office employees. The employee will touch the NFC-enabled mobile
device with their card, and then the employee data (ID, Photo, Time in/Time out, and Date) will be sent to the backend system.
3 System Architecture
The system used an NFC enabled android smartphone and an NFC Tag (optional). NFC, is a form of contactless communication
between devices like smartphones or tablets. Contactless communication allows a user to wave the smartphone over an NFC
compatible device to send information without needing to touch the devices together or go through multiple steps setting up a
connection. Evolved from RFID technology, an NFC chip operates as one part of a wireless link. Once it is activated by another chip,
small amounts of data between the two devices can be transferred when held a few centimeters from each other.
Lecture
Schedule
data
Stored Lecture
Schedule Data
Time Table
Display
NFC Readings
Collected From
Student NFC
Enabled Device
(Smart Phones)
Database
Server
Processing of NFC
Reading into
Attendance Data
Stored
Attendance
Data
Staff
Interface to
Attendance
Data Fig. 1. Data flow diagram
The technology behind NFC allows a device, known as a reader, interrogator, or active device, to create a radio frequency current that
communicates with another NFC compatible device or a small NFC tag holding the information the reader wants. Passive devices,
such as the NFC tag in smart posters, store information and communicate with the reader but do not actively read other devices. Peer-
to-peer communication through two active devices is also a possibility with NFC. This allows both devices to send and receive

Proceedings of the 2019 International Science Conference Innovation and Advancement in Nanoscience and Nanotechnology, Federal University Oye-Ekiti (www.fuoye.edu.ng), 2019.
36
information. The system implemented is based on series of distributed terminals the managing lecture schedule, store lecture schedule,
time table display, database server, generate report, view student and NFC reading collected from student NFC enabled device as
shown in Fig. 1.
3.1 Application Description
This system can be implemented for the Server and other modules via the following hardware requirement:
2.0 GHz Intel Pentium and above. Minimum of 500GB of available disk space.
4 GB available RAM. Input devices (Keyboard and Mouse).
Minimum of 500GB of available disk space. A USB port for USB cords and flash drive.
Input devices (Keyboard and Mouse). An NFC enabled android device.
A USB port for USB cords and flash drive. A USB cable for software debugging.
2.0 GHz Intel Pentium and above. Android smartphone (API 14 and above).
4 GB available RAM. NFC Tag (Optional).
3.2 Software Requirements
The software required for the system are Android Studio, Dreamweaver and WAMP Server. For the programming aspect, JavaScript,
XML, PHP and SQL were utilized
4 Software Interface
4.1 Admin Section
The function of the admin is to create entries for the students and the lecturers. The admin provides in the system the login credentials.
Fig. 2a provides the option to which the student or the lecturer can sign in. The surname of the course lecturer is inputted for each
course as shown in Fig. 2b.
Fig. 2a. Login in page Fig. 2b. Course lecturer’s name
4.2 Student’s Registration and Login Page
This allows the student to register on the application by entering the requested information. If the student already has a user account,
they can click on the text ‘Already have an account? Login’ to take them to the login page. Fig. 3a show the registration page for
student details. The student login page allows the student to get verified to use the application. To gain access to the application
functions, a student must have done their registration on the application. Fig. 3b show the student’s login page

Proceedings of the 2019 International Science Conference Innovation and Advancement in Nanoscience and Nanotechnology, Federal University Oye-Ekiti (www.fuoye.edu.ng), 2019.
37
Fig.3a. Student registration page Fig. 3b. Student login page
4.3 Lecturer’s Registration and Login Page
This allows the lecturer to register on the application by entering the requested information, one of which is the ‘Admin Identification’
that must be given to the lecturer by the backend administrator so as to verify that the person registering is actually a lecturer. If the
lecturer already has a user account, they can click on the text ‘Already have an account? Login’ to take them to the login page as
shown in Fig. 4a.
Fig. 4a. Lecturer’s registration page Fig. 4b. Course Registration Page
4.4 Student Course Registration Page
The course registration page allows the students to register for their courses by clicking on the check button at the corresponding
course of the appropriate student courses and then click on ‘Register Courses’ button to register the ticked courses to the back-end.
Fig. 4b shows course registration page.
4.5 Student Attendance Report
This shows the student attendance report based on the number of lectures they attend and their equivalent percentages. Which allows
the student to either take the Exam or not, according to the University Examination Regulation. Student attendance page is shown on
Fig. 5a.
4.6 Lecturer’s Lecture Schedule
The lecture schedule aspect of the application allows the lecturer to schedule lecture, by picking the course from the list of courses in
the spinner and to either turn on lecture or turn it off so that students can either view the lecture as ongoing lecture or it never show up
as ongoing lecture. The Lecturer is also allowed to set time and date for the lecture. On clicking the button, the data in the fields are
transported to the backend to be saved as shown on Fig. 5b.

Proceedings of the 2019 International Science Conference Innovation and Advancement in Nanoscience and Nanotechnology, Federal University Oye-Ekiti (www.fuoye.edu.ng), 2019.
38
Fig. 5a. Student Attendance Report Fig. 5b. Lecture Schedule
5 Conclusion
The system has been implemented for use in recording attendance for students of Federal University Oye Ekiti, Nigeria for all their
lectures in both first and second semesters. The work took advantage of the auto identification specifically using NFC to capture
student attendance for lecturers without having the student write their name, matric number and signing against it anymore and
attendance report and other student information can be accessed anytime anywhere without stress. The ability to write computer
programs and the availability of network has contributed greatly to the success of this work. This system is of immerse benefits to the
department as it is a better student attendance management, reduce administrative work, and improve student attendance ratio.
References
1. Ayu A.A. and Ahmad B.I., 2014. Touch In: An NFC supported attendance system in a university environment. International Journal of
Information and Education Technology, 4(5), 448-452.
2. Want R., 2006. An Introduction to RFID Technology. IEEE Pervasive Computing, 5(1), 25-30.
3. Lim T.S., Sim S.C. and Mansor M.M., 2009. RFID based attendance system, IEEE Symposium on Industrial Electronics & Applications (ISIEA
2009), 2, 778-782.
4. Iglesias R., Parra J., Cruces C. and Segura N.G., 2009. Experiencing NFC based touch for home healthcare. In Proceedings of the 2nd
International Conference on Pervasive Technologies Related to Assistive Environments, Corfu. In PETRA 2009.
5. Jain S.K., Joshi U. and Sharma B.K., 2008. Attendance Management System, Masters Project Report, Rajasthan Technical University, Kota.
6. Zhang Z.-G., Gong P., Cao L.J., and Chen Y.L., 2007. Information technologies and applications in education. 1st IEEE International
Symposium on Digital Object Identifier, 606–609.
7. Basheer M.K.P. and Raghu C.V., 2012. Fingerprint attendance system for classroom needs. In Proceedings India Conference (INDICON),
Annual IEEE, 433-438.
8. Geng S.H., Li G.M. and Liu W., 2012. Design and implement of attendance management system based on contactless smart IC card. In
Proceedings International Conference on Computer Science and Electronics Engineering (ICCSEE), 3, 290-294, 23-25.
9. Kassim M., Mazlan H., Zaini N. and Salleh M. K., 2012. Web-based student attendance system using RFID technology, In Proceedings IEEE
Control and System Graduate Research Colloquium (ICSGRC 2012), 213-218.
10. Benyo B., Sodor B., Doktor T. and Fordos G., 2012. University life in contactless way - NFC use cases in academic environment. In Proceeding
IEEE 16th International Conference on Intelligent Engineering Systems (INES), 511-514.
11. Patela S.B. and Jainb N.K. 2013. Near field communication (NFC) based mobile phone attendance system for employees. International Journal
of Engineering Research & Technology, 2(3), 52-58.
Proceedings of the 2019 International Science Conference Innovation and Advancement in Nanoscience and Nanotechnology, Federal University Oye-Ekiti (www.fuoye.edu.ng), 2019.
39
Cross-sectional Prevalence of Gastrointestinal Helminth Parasites in Two Cattle Holding
Farms in Ekiti State, Nigeria
H.O. Mogaji*, A.A. Bamigboye
Parasitology and Epidemiology Unit, Department of Animal and Environmental Biology, Federal University Oye-Ekiti, Nigeria [email protected]
Abstract
This study investigated the prevalence of gastrointestinal helminth infections in two cattle holding farms in Ekiti State, Nigeria.
Faecal samples were collected directly from the rectum of cattle in Ayegbaju and Ikole holding farms. Samples were processed using
ether concentration method and further examined under the microscope for helminths ova or larva. Demographic data on the gender,
age and breed of the examined cattle were also obtained. Data were analyzed using SPSS 20.0 software for descriptive and chi square
statistic. Confidence interval was set at 95%. Findings showed an overall prevalence of 88.0% for gastrointestinal helminth infection
in both farms, with species’ prevalence of 54.2% recorded for Ascaris spp., 52.0% for hookworm and 6.0% for Trichuris spp. By
location, there were no significant differences in the number of infected cattle across the holding farms (p > 0.05). However,
significant differences exist across the age categories for infection with Trichuris spp. This study has shown that gastrointestinal
helminth infections are endemic in the two holding farms surveyed and the high prevalence recorded may have negative implication
on productivity of the cattle. Therefore, improving farm management system and routine deworming of farm animals is
recommended.
Keywords: Cattle, helminth infections, farms, Ekiti State, Nigeria
1 Introduction
Gastrointestinal helminth infections (GHI) is one of the most prevalent parasitic diseases of cattle in Sub Saharan Africa (SSA) [1].
Infection occurs when cattle ingest parasitic eggs and/or the infective larvae via contaminated pasture, water and/or soil [2]. Usually,
GHI is asymptomatic in cattle with light parasite load. However, heavier infections can be symptomatic with clinical morbidities such
as anemia, malnutrition, malabsorbtion of nutrients, abdominal discomfort, tiredness, loss of appetite, reduced nutritional intake,
reduced physical fitness and impaired physical development [3].
Of the 13.9 million cattle in Nigeria, about 11.5 million are reared under intensive care system and 2.4 million in rural villages where
water, sanitation and hygiene resources are lacking [4, 5]. GHI therefore remains a threat to the health and productivity of cattle [6,7].
Although, there are published reports on the prevalence of GHI among cattle in Nigeria [8, 9]. However, to the best of our knowledge,
there are no published report on the prevalence of GHI among cattle holding farms in Ekiti State, Nigeria. Providing such evidence
would assist in prioritization of appropriate intervention measures to improve health conditions and productivity of cattle.
2 Materials and Methods
2.1 Study Area
Ekiti State is one of the six Southwestern State in Nigeria. The state has 16 Local Government Areas (LGA), with its capital located at
Ado-Ekiti. Generally, the state enjoys a tropical climate with two distinct seasons; rainy season (April – October) and the dry season
(November – March).
2.2 Selection of Sampling Area
A purposeful sampling method was employed in the selection of cattle holding farms. Two local governments areas (LGAs) were
purposefully selected in the Northern region of the state. In each of the LGA’s, the existing cattle holding farm closest to the research
laboratory, at the Federal University Oye-Ekiti was selected; Ayegbaju holding farm in Oye LGA and Ikole holding farm in Ikole
LGA.

Proceedings of the 2019 International Science Conference Innovation and Advancement in Nanoscience and Nanotechnology, Federal University Oye-Ekiti (www.fuoye.edu.ng), 2019.
40
2.3 Collection of Feacal Samples
A total sampling method was employed in recruiting cattle in both farms during collection of samples. Feacal samples were collected
directly from the rectum of study cattle and transferred into properly labelled sterile bottles using disposable gloves. 10 mL of sodium-
acetate-acetic-acid formaldehyde (SAF) solution were added to each sterile bottle to preserve the faecal samples; the bottles were
covered and agitated vigorously to suspend the stool in the solution. The specimens were transported to the laboratory for parasitology
examinations.
2.4 Parasitological Diagnosis of Gastrointestinal Helminths Ova
The stool suspensions were further strained into a centrifuge tube using double gauze of about 13 mm diameter placed in a funnel. The
residue was discarded and the filtrates were centrifuged at 2000 rpm for 1 minute. The supernatant was discarded after centrifuging. 7
mL of normal saline was later added to the sediment, after which 3 mL of ether was finally added to the suspension. A stopper was
placed on the tube, and the mixture was shaken vigorously before centrifuging for another 5 minutes at 2000 rpm. The first three layer
of the suspension observed after centrifuging were discarded, leaving the last layer of the sediment. This sediment was pipetted on a
clean microscope slide and examined for microscopic ova or larvae of STH under a compound microscope.
2.5 Data Analysis
Data obtained from the study were entered into Microsoft excel and analyzed using SPSS 20.0 software. Descriptive statistics such as
frequency and percentages were used to describe demographic variable statistic. Chi square was used to test for significant difference
between variables. Significance level was set at 95%.
3 Results and Discussion
3.1 Demographic Characteristics
Table 1 shows the demographic characteristics of surveyed cattle in Ayegbaju and Ikole holding farm in Ekiti state. A total of 50 cattle
were surveyed; 21(42%) and 29(58%) from Ayegbaju and Ikole LGA, respectively. By sex category, majority of surveyed cattle were
male, 18(85.7%) in Ayegbaju and 18(62.1) in Ikole. However, there was no significant difference between the sexes of the cattle
surveyed at the two locations. By age category, majority of the age 25-48 were sampled; 11(52.4%) and 16(44.8%), respectively in
both Ayegabju and Ikole whereas the age >6 has the lesser population; 1(4.8%) and 0(0.0%) when sampled. However, there was no
significant difference between the ages of cattle surveyed. By breed category, the Bokolo breed has the highest number of cattle
sampled in the population; 11(52.4%) and 29(100%) and 10(47.6%) and 0(0.0%) for the Yakana breed in both Ayegbaju and Ikole,
however there was significant difference between the two breed (p < 0.05).
3.2 Prevalence of Gastrointestinal Helminth Infections (GHI)
An overall prevalence of 88.0% was recorded for any GHI in this study. By species’ categories, a total of 3 species were identified i.e.
Ascaris spp, Trichuris spp and hookworm. By species’ prevalence, Ascaris spp was the most prevalent with 54.2%, followed by
hookworm with 52.0% and Trichuris spp with 6.0%. By location categories, the cattle holding farm in Ayegbaju had more infected
cattle compared to that in Ikole; 57.1% vs 51.7% for Ascaris spp, 30.0% vs 0.0% for Trichuris spp and 52.4% vs 51.7% for hookworm
and 90.5% vs 86.2% for any GHI, respectively (Table 2).
3.3 Prevalence of Gastrointestinal Helminth Infection (GHI) by demographic variables
By sex categories, there were more infected male cattle than females with 16(59.3), 3(100), and 20(76.9) for Ascaris spp, Trichurus
spp and hookworm, respectively. By age categories, cattle within the age range 25-48 months old were more infected; 14(51.9),
2(66.7), 13(50.0) for Ascaris spp, Trichurus spp and hookworm, respectively than other ages examined. However, age was not
significantly associated with prevalence of GHI (P >0.05), except for Trichuris spp. (p < 0.05). By breed, the bokolo breed has
specific prevalence’ of 22(81.5%), 0(0.0%), 20(76.9%) for Ascaris spp, Trichurus spp and hookworm, respectively. The overall
prevalence recorded for this breed was 77.3%. However, for yakana breed, an overall prevalence of 22.7% was recorded for GHI,
while Ascaris spp., Trichurus spp. and hookworm had prevalence estimate of 5(18.5%), 3(100%), 6(23.1%), respectively. There was
also no significant association between GHI and breed status of the examined cattle (p > 0.05).

Proceedings of the 2019 International Science Conference Innovation and Advancement in Nanoscience and Nanotechnology, Federal University Oye-Ekiti (www.fuoye.edu.ng), 2019.
41
Table 1. Demographic characteristics
Variables Ayegbaju (%) Ikole (%) Total (%)
Sex
Male 18(85.7) 18(62.1) 36(72.0)
Female 3(14.3) 11(37.9) 14(28.0)
Total 21(100) 29(100) 50(100)
X², df , pvalue 3.378, 1, 0.06
Age (in months)
<6 1(4.8) 0(0.0) 1(2.0)
7-24 8(38.1) 13(44.8) 21(42.0)
25-48 11(52.4) 16(44.8) 24(48.0)
˃48 1(4.8) 3(10.3) 4(8.0)
Total 21(100) 36(100) 50(100)
X², df, pvalue 2.132,3,0.546
Breed
Bokolo 11(52.4) 29(100) 21(80.0)
Yakana 10(47.6) 0(0.0) 10(20.0)
Total 21(100) 29(100) 30(100)
X², df, pvalue 17.262,1,0.00
Table 2. Prevalence of gastrointestinal helminth infection (GHI)
Ayegbaju Ikole Total
NE (%) NI (%) NE (%) NI (%) NE (%) NI (%)
Ascaris spp 21 12(57.1) 29 15(51.7) 50 27(54.2)
Trichuris spp 21 3(30.0) 29 0(0.0) 50 3(6.0)
Hookworm 21 11(52.4) 29 15(51.7) 50 26(52.0)
Any GHI 21 19(90.5) 29 25(86.2) 50 44(88.0)
*NE: Number Examined; NI: Number Infected
Table 3. Prevalence of gastrointestinal helminth infection (GHI) by demographic variables
Ascaris spp NI(%) Trichuris spp NI(%) Hookworm NI(%) Any GIH NI(%)
Sex
Male 16(59.3) 3(100) 20(76.9) 30(68.2)
Female 11(40.7) 0(0.0) 6(23.1) 14(31.8)
Total 27(100) 3(100) 26(100) 44(100)
x², df, pvalue 4.726,1,0.030 1.241,1,0.265 0.651,1,0.419 2.652,1,0.103
Age (in months)
6 0(0.0) 1(33.3) 1(3.8) 1(2.3)
7-24 11(40.7) 0(0.0) 9(34.6) 17(38.9)
25-48 14(51.9) 2(66.7) 13(50.0) 22(50.0)
>48 2(7.9) 0(0.0) 3(11.5) 4(9.1)
Total 27(100) 3(100) 26(100) 44(100
x², df, pvalue 1.403,3,0.705 17.494,3,0.001 2.519,3,0.472 2.652,1,0.103
Breed
Bokolo 22(81.5) 0(0.0) 20(76.9) 34(77.3)
Yakana 5(18.5) 3(100) 6(23.1) 10(22.7)
Total 27(100) 3(100) 26(100) 44(100)
x², df, pvalue 0.081,1,0.77 12.766,1,0.00 0.321,1,0.571 1.705,1,0.192
The prevalence estimate observed in this study is higher compared to the report of Ogudo et al. [8] and Oluwole et al. [9] in Ogun and
Oyo States, respectively. The dissimilarities in findings may be due to difference in the two ecological zones and associated

Proceedings of the 2019 International Science Conference Innovation and Advancement in Nanoscience and Nanotechnology, Federal University Oye-Ekiti (www.fuoye.edu.ng), 2019.
42
management practices. The high prevalence observed could be attributed to the poor management system in the holding farms, as
cattle were allowed to graze on pastures within and around the farm, which might have been contaminated with infective stages of
these parasites. In this study, majority of the infected cattle were males. This is in agreement with earlier findings by Raza et al. [10]
who indicated that the male cattle are more aggressive when feeding and thus likely to pick up more ova with pasture. Furthermore,
significantly higher prevalence rate was recorded in adult animals. This is in contrast with existing literatures because adult animals
are much less susceptible to most parasites, unless they are in poor living conditions [11]. In Nigeria, despite the enormous
contribution made by the livestock sector to the economic wellbeing of the citizenry, little or no attention has been given to the burden
of GHI among cattle. This study therefore reiterates the importance of regular de-worming activity, health education and
environmental cleanliness in the phase of controlling GHI infections among cattle in holding farms.
4 Conclusion
This study has shown that the two cattle holding farms surveyed in this study are endemic for GHI. There is thus a need for regular de-
worming activity, health education and ensuring environmental cleanliness.
References
1. WHO, 2012. Eliminating soil-transmitted helminthiases as a public health problem in children: Progress Report 2001–2010 and Strategic Plan
2011–2020.
2. Greenland K., Dixon R., Khan S.A., Gunawardena K., Kihara J.H, Smith J.L., Drake L., Makkar P., Rama S., Singh S. and Kumar S., 2015. The
epidemiology of soil-transmitted helminths in Bihar state, India. PLoS Neglected Tropical Diseases, 9(5), e0003790.
3. WHO, 2017. WHO Fact Sheet on Soil Transmitted Helminth Infections. http://www.who.int/soil%20helminthiasis/en/
4. Lawal-Adebowale O.A., 2012. Dynamics of ruminant livestock management in the context of Nigerian. Agricultural System, 4, 61-80.
5. Okoli I.C., Enyinnia N.C., Elijah A.J., Omede A.A. and Unam-Opara C.I., 2012. Animal reproduction management pratices of Fulani patoralist
in the umid rainforest of Imo State Nigeria. Journal of Animal Science Advances, 2(2), 221-225.
6. Dimaner S.O., Höglund J., Spörndly E and Waller P.J., 2000. The impact of internal parasites on the productivity of young cattle organically
reared on semi-natural pastures in Sweden. Veterinary Parasitology, 90(4), 271-284.
7. Johannes C., Johan H., Georg V.S., Pierre D. and Jozef V., 2009. Gastrointestinal nematode infections in adult dairy cattle: Impact on
production, diagnosis and control. Veterinary Parasitology, 164(1), 70-79.
8. Ogudo U., Oluwole A., Mogaji H., Adeniran A., Alabi O. and Ekpo U., 2015. Gastrointestinal helminth infections in a ruminant livestock farm
in Abeokuta, South Western Nigeria. Annual Research & Review in Biology, 8(4), 1-8.
9. Oluwole A., Adeniran A., Mogaji H., Shittu E., Alabi O., Odoemene S., Ekpo U., 2016. Survey of gastrointestinal parasites among nomadic
cattle herds in Eruwa, Oyo State, Southwestern Nigeria. Annual Research & Review in Biology, 10(6), 1-7.
10. Raza M.A., Ayaz M., Murtaza M., Murtaza S., Akhtar M.S., Muhammed N., Ali M. and Bachaya H.A., 2013. Prevalence of GIT helminths in
cattle at the vicinities of Tehsil Jatoi, Punjab. Science International (Lahore), 25(2), 305–309.
11. Keyyu J.D., Kassuku A.A., Kyvsgaard N.C. and Willingham A.L., 2003. Gastrointestinal nematodes in indigenous Zebu cattle under pastoral
and nomadic management systems in the lower plain of the southern highlands of Tanzania. Veterinary Research Communication, 27, 371-380.

Proceedings of the 2019 International Science Conference Innovation and Advancement in Nanoscience and Nanotechnology, Federal University Oye-Ekiti (www.fuoye.edu.ng), 2019.
43
Determination of Lipid Profile in Inflammation-Induced Wistar Rats Administered Ficus
sur Flavonoid-Rich Extract
S.A. Emaleku1,*, I.G. Adanlawo2, M.T. Gbadegesin1, E.A. Adeola1, O.D. Omueti1, G.O. Emaleku1, A.F. Adeyemi1,
A.D. Ogunbodede3
1Department of Biochemistry, Adekunle Ajasin University, Akungba Akoko, Ondo State 2Department of Biochemistry, Ekiti State University, Ado Ekiti, Ekiti State
3Department of Biochemistry, Federal University of Agriculture, Abeokuta, Ogun State [email protected], [email protected]
Abstract
Inflammation has been implicated in the prevalence and occurrence of many diseases including cardiovascular diseases (CVDs).
CVDs are one of the leading causes of mortality in the world and dyslipidemia is a risk factor for CVDs. Presently, there is the use of
statin drugs (HMG-CoA inhibitors) as therapeutic measures in the management of these diseases but their adverse effects have
necessitated the development and use of natural drug products e.g. plants. Therefore, this study aimed at determining the effect of
flavonoid-rich extract of Ficus sur (FEFS) on serum lipid profile of acetic acid-induced inflammation in male Wistar rats. 6%, 3%
and 6% acetic acid at 20 ml/kg, 15 ml/kg and 10 ml/kg respectively were used to orally induce inflammation in animals within one
week. The acetic acid-induced inflammatory animals were divided into six (6) groups of five (5) animals each in addition to the
control animal group (non-inflammatory animals). The test groups were administered 15 mg/kg, 30 mg/kg, 60 mg/kg and 120 mg/kg
of FEFS. Findings indicated that FEFS, most especially at 60 and/or 120 mg/kg non-significantly (p ≤ 0.05) reduced serum
triglycerides, low-density lipoprotein cholesterol (LDL-C) and total cholesterol, but increased high density lipoprotein-cholesterol
(HDL-C) in comparison with other groups. It was therefore concluded that FEFS had heart-healthy benefiting effects since it had
positive effect on lipid profile parameters in the inflammation-induced Wistar rats and would tend to ameliorate lipid profile-
associated disorders/diseases like CVDs.
Keywords: Cardiovascular diseases, dyslipidemia, flavonoid-rich extract, inflammation, lipid profile, statin drugs
1 Introduction
Survival of man from various diseased conditions remains major a challenge globally. Despite the introduction of plethora of
pharmacological drugs and other modalities into the society, cardiovascular diseases (CVDs) are still one of the principal causes of
mobility and mortality in Western society [1]. The disease imposes tremendously heavy socio-economic burdens on man worldwide.
Also, there are varieties of risk factors in literatures that increase the incidence of CVDs, and this includes hyperlipidemia [2].
According to Thomas et al. [3], disorder of lipid metabolism is one of the main determinants of cardiovascular risk. Furthermore, it
has also been reported that inflammation is a fundamental cause of pathogenesis of cardiovascular diseases [4]. It is reported that
inflammation leads to oxidative stress, which in turn causes dysregulation in lipid metabolism. It is thus no longer news that increased
level of low density lipoprotein cholesterol (LDL-C), triglyceride (TG), total cholesterol (TC) and decreased level of high density
lipoprotein cholesterol (HDL-C) are associated with atherosclerosis [5], a form of CVDs. Therefore, any therapeutic strategy that can
reduce LDL-C, TC and TG but increase HDL-C would bring about the needed remedy against this life-threatening disease.
Fortunately, interest in phytomedicines has been rekindled in recent years. The potential side effects associated with lipid-lowering
substances (e.g. statins and fibrates) coupled with great drug dependence has led to the hunt for medicinal plants as alternative therapy
for the treatment of CVDs and its related diseases [6]. This study therefore investigates the effects of Ficus sur flavanoid-rich extract
(FSFE) on serum lipid profile in acetic acid-induced inflammatory rats.
2 Materials and Methods
2.1 Chemical and Reagents
All chemicals and reagents used in the study were of analytical grade and were purchased from Sigma-Aldrich, France and Merck
KGaA Darmstadt, Germany. Randox kits such as Randox cholesterol kit (Product number: 424660), Randox triglyceride kit (Product

Proceedings of the 2019 International Science Conference Innovation and Advancement in Nanoscience and Nanotechnology, Federal University Oye-Ekiti (www.fuoye.edu.ng), 2019.
44
number: 435212) and Randox HDL kit (Product Number: 269477) for lipid profile assay were obtained from Randox Laboratories,
UK.
2.2 Collection and Authentication of Plant Material
Ficus sur leaves were gotten from Iwaro-Oka bush in Akoko area of Ondo State. It was identified and authenticated by a competent
curator at Ekiti State University, Ado Ekiti. The plant specimen was deposited in the University’s Herbarium and assigned Voucher
Number of UHAE2018033.
2.3 Extraction and Solvent-Solvent Partitioning
The extraction and solvent-solvent partitioning technique were done according to Agbo et al. [7] protocol with slight modifications.
Fresh leaves of Ficus sur were washed with water to remove dirt or dust, air dried for three weeks and pulverized into powder using
electric blender. The powder leave (625 g) were macerated with 2 L of methanol at room temperature for 72 h and filtered by
Whatman number 1 filter paper. It was concentrated using rotary evaporator at 45oC. The crude extract was further purified using
partitioning technique with water and n-hexane at 2:1, and then water and ethyl acetate at 1:1 successively. The resulting extracts were
freeze-dried, and the ethyl acetate extract rich in flavonoids was used for animal study.
2.4 Animal Used for the Study
A total number of 50 healthy male Wistar rats, average weight of 108.4 g were purchased from animal house of the Institute of
Advanced Medical Research and Training (IAMRAT), University College Hospital (UCH), Ibadan. The animals were acclimatized
for two weeks and maintained in line with National Institute of Health [8] guide for the care and use of laboratory animals. They were
kept in an iron cage housed in the animal’s house of the Department of Biochemistry, Adekunle Ajasin University, Akungba-Akoko,
Ondo State, and fed standard pellets feed and water ad libitum at room temperature of 22 ± 2oC and 55 ± 5% relative humidity where
equal period (hour) of light and darkness was maintained (i.e. 12 h light/12 h dark).
2.5 Inflammation Induction Process
Modified method of Tannahill et al. [9] was used to induce intestinal inflammation in the animals within a week. The Wistar rats were
first orally administered 20 ml/kg of 6% acetic acid (AA). These dosage and/or concentration were reduced to 15 ml/kg of 3% AA and
administered three days after the first one via the same route. Finally, two days after the second administration, 10 ml/kg of 6% AA
was orally administered for three consecutive days. Administration was done once a day in the morning around 7.30 am within a
week. These inflamed animals were then used for the experiment.
2.6 Experimental Design
A total of thirty (30) inflammation-induced Wistar rats were randomly divided into six groups of five animals each in addition to the
normal control group with the same number of animals (n=5). i) Group I – Normal control (NC) group, orally administered 1 mL
distilled water; ii) Group II - Positive control (PC) group, orally administered 15 mg/kg Celecoxib; iii) Group III - Negative control
(NegC) group, orally administered 1 ml distilled; iv) Group IV – FEFS treatment group, orally administered 15 mg/kg FEFS; v) Group
V - FEFS treatment group, orally administered 30 mg/kg FEFS; vi) Group VI - FEFS treatment group, orally administered 60 mg/kg
FEFS; and vii) Group VII - FEFS treatment group, orally administered 120 mg/kg FEFS. The treatment lasted for two weeks before
experimental animals were sacrificed and blood collected in plain bottles for processing into serum for lipid biochemical assay (lipid
profile).
2.7 Lipid Profile Assay
Lipid profile, which includes estimation of TC, HDL-C, LDL-C, and TG in experimental animals’ serum, was determined by
enzymatic end point method as in randox kits manual’s instructions reported by Emaleku et al. [10].

Proceedings of the 2019 International Science Conference Innovation and Advancement in Nanoscience and Nanotechnology, Federal University Oye-Ekiti (www.fuoye.edu.ng), 2019.
45
2.8 Statistical Analysis
Data collected were subjected to one-way analysis of variance (ANOVA) and differences in means between groups were determined
by Tukey’s Krammer Least significant difference (LSD) test using SPSS version 20. Values are presented as Mean ± standard mean of
error (SEM), and values of p ˂ 0.05 were considered statistically significant.
3 Results and Discussion
Table 1 shows that there is no significance difference (p > 0.05) in body weights of animals between groups at week 0 (i.e.
before treatments) and even at week 2 (i.e. after treatments). Although there was no significant difference (p > 0.05) in
body weights of experimental animals between groups at week 0 (i.e. before treatments) and even at week 2 (i.e. after
treatments), but there was moderate increase (51.40 g) in body weight observed in animals administered 120 mg/kg FEFS,
which is close to 47.40 g increase observed in normal control group. These observations indicate that FEFS did not
stimulate/mediate unnecessary weight gain that can lead to overweight (obesity), a risk factor for CVDs. It could further
be reasoned that FEFS did not impair lipid metabolism nor cause dyslipidemia e.g. hyperlipidemia (as shown in Table 3)
that could adversely increase or raise body weights of animals (i.e. overweight) as a result of accumulated fats.
Conversely, the observed high increase in body weight (66.90 g) of NegC animals is a worrisome sign that could lead to
overweight overtime as a result of imbalance in lipid metabolism of the inflammatory animals. Ridker et al. [11] reported
that inflammation causes dyslipidemia, which is a risk factor for obesity [12]. More also, the high weight gain by NegC
animals could be a sign of possible growth of tumour due to inflammation. According to Coussens and Werb [13], there is
a positive correlation between inflammation and cancer.
Table 1. Effects of flavonoid-rich extract of Ficus sur on weights of experimental animals
Groups/Weeks Week 0 Week 1 Week 2
Weight (g)
NC
PC (15 mg/kg CXB)
NegC
FEFS (15 mg/kg)
FEFS (30 mg/kg)
FEFS (60 mg/kg)
FEFS (120 mg/kg)
111.00±5.70 144.60±3.17 158.40±4.33
114.40±24.14 141.60±14.61 153.00±16.75
110.60±25.67 155.25±9.86 177.50±10.57
114.20±22.94 138.25±15.09 143.75±5.95
112.60±34.56 120.60±16.78 143.33±14.26
116.60±23.47 139.20±14.39 152.80±16.07
108.60±18.76 136.60±9.75 160.00±11.00
Note: Comparison is strictly between groups. No alphabet superscript because there is no statistically significant difference
Key: NC – Negative control; PC – Positive control; CXB – Celecoxib; NegC – Negative control; FEFS – Flavonoid-rich extract of Ficus sur
Table 2. Effects of flavonoid-rich extract of Ficus sur on organs’ weights of animals
Groups/Organs Liver Kidney Heart
Weight (g)
NC
PC (15 mg/kg CXB)
NegC
FEFS (15 mg/kg)
FEFS (30 mg/kg)
FEFS (60 mg/kg)
FEFS (120 mg/kg)
5.80±0.46 1.27±0.08 0.60±0.07
6.08±0.57 1.07±0.10 0.59±0.06
6.50±0.41 1.34±0.08 0.70±0.07
5.66±0.21 1.09±0.07 0.50±0.02
6.05±0.30 1.23±0.11 0.50±0.07
5.66±0.47 1.23±0.06 0.60±0.06
6.09±0.57 1.21±0.14 0.59±0.02
Note: Comparison is strictly between groups. No alphabet superscript because there is no statistically significant difference
Key: NC – Negative control; PC – Positive control; CXB – Celecoxib; NegC – Negative control; FEFS – Flavonoid-rich extract of Ficus sur
Table 2 shows that there is no significant difference (p > 0.05) in the organs’ weights (i.e. liver, kidney and heart) between groups.
Despite the non-significant difference in organs’ weights, it was observed that FEFS-treated animals have lesser organs’ weights than
NegC animals but almost the same weights (i.e. close to) with the normal control animals. This result further suggests the potential of
FEFS to maintain organs’ weights in addition to maintaining body weights of inflammation-induced animals after treatments. It is a
further testimony that there is no likelihood of fat accumulation typical of dyslipidemia (risk factor of CVDs) or tumour growth that
could adversely increase the organs’ weights. Just as observed in body weights, high organs’ weights (liver: 6.50±0.41; kidney:
1.34±0.08; heart: 0.70±0.07) was also observed in NegC animals to reestablish the possibility or tendency of derangement in lipid

Proceedings of the 2019 International Science Conference Innovation and Advancement in Nanoscience and Nanotechnology, Federal University Oye-Ekiti (www.fuoye.edu.ng), 2019.
46
metabolism that resulted in fats accumulation and/or likelihood of tumour growth (cancerous growth) in this untreated inflamed group
as earlier opined.
Table 3. Effects of flavonoid-rich extract of Ficus sur on serum lipid profile parameters
Groups/Parameters CHOL TG HDL-C LDL-C
(mg/dl)
NC
PC (15 mg/kg CXB)
NegC
FEFS (15 mg/kg)
FEFS (30 mg/kg)
FEFS (60 mg/kg)
FEFS (120 mg/kg)
65.72±10.72 102.11±5.54 24.38±4.8 35.95±2.32
71.29±7.25 111.67±17.77 29.96±3.77 34.31±4.27
82.46±6.70 114.44±12.67 25.06±6.01 41.32±5.69
61.88±6.45 103.72±21.17 24.69±7.90 22.00±3.08
56.69±15.73 135.01±37.35 31.76±1.34 19.06±5.95
48.54±9.80 89.31±21.33 37.59±4.63 24.69±3.90
58.71±7.69 129.74±41.36 41.36±7.57 18.87±4.00
Note: Comparison is strictly between groups. No alphabet superscript because there is no statistically significant difference
Key: NC – Negative control; PC – Positive control; CXB – Celecoxib; NegC – Negative control; FEFS – Flavonoid-rich extract of Ficus sur
Table 3 shows that there is no significant difference (p > 0.05) in lipid profile parameters (TC, LDL-C, TG and HDL-C levels)
between groups. However, TC and LDL-C levels of FEFS-treated groups are lesser than that of other groups (i.e. NC, PC and NegC)
but the FEFS-treated animals’ HDL-C levels, especially at 120 mg/kg are higher than that of other groups.
This non-significant decrease in TC, LDL-C and TG (only in FEFS at 60 mg/kg for TG) but increase in HDL-C levels in FEFS-treated
animals shows the plant’s tendency to ameliorate dyslipidemia or hyperlipidemia. Decreased LDL-C levels observed in FEFS-treated
animals imply less transportation of cholesterol to the heart to cause atherosclerosis [14] while the increased HDL-C levels imply
more transportation of cholesterol away from extrahepatic tissues e.g. heart to the liver for excretion [15], which prevents CVDs. The
observed results further suggest that FEFS would have restored and/or maintained balances in lipid metabolism in inflammation-
induced animals treated with FEFS to bring about these desired effects (i.e. reductions in TC, LDL-C and TG, and increase in HDL-C
levels) since higher TC, LDL-C and TG levels but lower HDL-C level were observed in NegC (untreated) group. This hypolipidemic
tendency is a good omen for the heart and could help alleviate the problem of CVDs. According to Ritchie and Connell [16], high fat
accumulation, which has the hallmark of high TC, LDL-C and TG serum levels, is associated with dyslipidemia, a risk factor of
CVDs. Similarly, Franssen and Kastelein [17] reported dyslipidemia to be the major risk factor for CVDs, and could cause increase in
BMI due to fat accumulation. So, the low serum levels of TC, LDL-C and TG and high HDL-C levels in animals administered FEFS
ultimately demonstrate the non-dyslipidemic or anti-hyperlipidemic potential of the plant extract. Finally, these moderate values of
lipid parameters in FEFS-treated animals provide the underlying reason for the moderate body and organs weights observed in these
animals and conversely, the high values of these parameters in NegC animals, which signals dyslipidemic tendency, account for the
high body and organs weights observed in the group.
4 Conclusion
Based on the findings of this study, FEFS could be a potential hypolipidemic agent of natural source that could be used in the
treatment of CVDs and associated diseases since it reduced serum TC, LDL-C and TG but increased HDL-C in administered animals.
References
1. Harchaoui K.E.L., Visser M.E., Kastelein J.J.P., Stroes E.S. and Dallinga-Thie G.M., 2009. Triglycerides and cardiovascular risk. Current
Cardiology Review, 5, 216-222.
2. Kumar L. and Las Das A., 2018. Assessment of serum lipid profile in patients of coronary artery disease: A case-control study. International
Journal of Contemporary Medical Research, 5 (5), 59-62.
3. Thomas A., Gaziano M.D., Asaf B., Shuchi A., Shafika A. and Adrianna M., 2010. Growing epidemic of coronary heart disease in low- and
middle-income countries. Current Problems in Cardiology, 35, 72–115.
4. Jones D.P., True H.D. and Patel J., 2017. Leukocyte trafficking in cardiovascular disease: Insights from experimental models. Mediators of
Inflammation, 974, 61-69.
5. Koley S. and Sur A., 2018. Association of lipid profile parameters with high-sensitive C–reactive protein (hsCRP) in patients with dyslipidemia.
Annals of Medical and Health Science Research, 8, 105-107.
6. Zeni A.L.B., Moreira T.D., Dalmagro A.P., Camargo A., Bini L.A., Simionatto E.L. and Scharf D.R., 2017. Evaluation of phenolic compounds
and lipid-lowering effect of Morus nigra leaves extract. Annals of the Brazilian Academy of Sciences, 1-11.

Proceedings of the 2019 International Science Conference Innovation and Advancement in Nanoscience and Nanotechnology, Federal University Oye-Ekiti (www.fuoye.edu.ng), 2019.
47
7. Agbo M.O., Lai D., Okoye F.B.C., Osadebe O.P. and Proksch P., 2013. Antioxidative polyphenols from Nigerian mistletoe Loranthus
micranthus (Linn.) parasitizing on Hevea brasiliensis. Fitoterapia, 86, 78-83.
8. National Institutes of Health, 2011. Guide for the care and use of laboratory animals. National Research Council (US) Committee for the update
of the guide for the care and use of laboratory animals. National Academy of Sciences. 8th Edition. Washington (DC): National Academies
Press (US).
9. Tannahill C.L., Stevenot S.A., Campbell-Thompson M., Nick H.S. and Valentine J.F., 1995. Induction and immunolocalization of manganese
superoxide dismutase in acute acetic acid-induced colitis in the rat. Gastroenterology, 109, 800–811.
10. Emaleku S.A., Omueti O.D. and Emaleku G.O., 2018. Talinum triangulare: Whole wheat meal fortified with soy flour consumed with Talinum
triangulare (gbure) soup glycemic index and the test human subjects’ lipid profiles. Diabetes & Metabolic Syndrome: Clinical Research &
Reviews, 12, 831-837.
11. Ridker P.M., Everett B.M., Thuren T., MacFadyen J.G., Chang W.H., Ballantyne C., Fonseca F., Nicolau J., Koenig W., Anker S.D., Kastelein
J.J.P., Cornel J.H., Pais P., Pella D., Genest J., Cifkova R. and Lorenzatti A., 2017. Antiinflammatory therapy with Canakinumab for
atherosclerotic disease. New England Journal of Medicine, 377, 1119-1131.
12. Feingold K.R. and Grunfeld C., 2019. The effects of inflammation and infections on lipids and lipoproteins. Endotext (Internet).
www.ncbi.nlm.nih.gov/books/NBK326741/. (Accessed 7th February, 2019).
13. Coussens L.M. and Werbs Z., 2002. Inflammation and Cancer. Nature, 420, 860-867.
14. Yoshida H. and Kisugi R., 2010. Mechanisms of LDL oxidation. Clinica Chimica Acta, 411, 1875 -1882.
15. Navab M., Srinivasa T., Brian R., Van Lenten J. and Alan M.F., 2011. HDL and cardiovascular disease: Atherogenic and atheroprotective
mechanisms. Nature Reviews of Cardiology, 8, 222-232.
16. Ritchie S.A. and Connell J.M., 2007. The link between abdominal obesity, metabolic syndrome and cardiovascular disease. Nutrition,
Metabolism & Cadiovascular Diseases, 17(4), 319-326.
17. Franssen H.M. and Kastelein J.J., 2007. Effect of torcetrapib on carotid atherosclerosis in familial hypercholesterolemia. New England Journal
of Medicine, 356, 1620–30.

Proceedings of the 2019 International Science Conference Innovation and Advancement in Nanoscience and Nanotechnology, Federal University Oye-Ekiti (www.fuoye.edu.ng), 2019.
48
Understanding Walls of Gene Regulatory Networks from Focal Points of Adjacent
Regulatory Domains
Ngwu Benitho A.1,*, Mmaduakor C.O.1, Ajewole R.O.1 , Iorkua M.2
1Department of Mathematics, Federal university Oye-Ekiti, Ekiti State, Nigeria 2Department of Statistics, Benue State Polytechnic, Ugbokolo, Nigeria
Abstract
Walls in gene regulatory networks are determined by the concentration threshold of regulatory elements. Each element in the network
has different threshold levels at which it interacts with different elements in the network. The thresholds divide the state space into
open rectangular boxes. The boundaries of these boxes are known as threshold walls and are responsible for the switch-like properties
exhibited by the regulatory elements in the networks. In this work, we propose a method that simplifies the characterization of walls
using the focal points of adjacent regular domain and by so doing we hope to bridge the gap existing in literature.
Keywords: Cardiovascular diseases, dyslipidemia, flavonoid-rich extract, inflammation, lipid profile, statin drugs
1 Introduction
Gene regulatory networks (GRN) are considered switched system because the elements of the network behave in a switch-like
manner. The switch-like behaviour of these elements is due to their concentration. At different concentration levels, they interact with
one another in a complex and intertwined manner, thereby regulating the activities of one another. These concentration levels are
considered the thresholds of the network and they divide the phase space into open rectangular boxes [1-6]. GRN has been
investigated for periodic solutions, limit cycles, chaos, steady points and qualitative properties. For a study of walls in GRN, Gouze
and Sari [7] investigated some walls (white and black) for sliding motion and stability. Their study was based on the nature of walls
which uses the direction of focal points of adjacent rectangular boxes [2]. Our findings as shall be demonstrated show that defining the
nature of a wall based on mere direction of focal point of adjacent rectangular boxes to the wall is not realistic. One of the reasons why
this may not be correct is because of the fact that biological systems are prone to relapses. This, in other words means that such flow
can be reversed due to either gain or loss in function of the elements close to a threshold wall.
Defining sliding motions on threshold walls requires Filippov’s concatenation approach at the threshold wall. A definition of how to
do this was also given in Gouze and Sari [7] and we shall make use of in our method. Definition of walls based on direction of focal
flow is provided by Filippov’s first order theory. This theory provides computation that may not be easily used by researchers with
weak mathematical background. To make it readily available, we show by practical examples, how to find the nature of a wall
especially transparent ones from the focal point of adjacent regulatory domains.
2 Gene Regulatory Networks
The mathematical expression for gene expression is defined as Equation 1.
( ) ( )( ) ( )( )tzGtzFtxi −= 1
In Equation 1, ( )nxxxX ,,, 21 = is an n-dimensional vector that indicates the concentration of the variables. The functions F
and G are multinomial and depend on ( ) ( )njiii zzzxz ,,,, 21 = which defines the concentration threshold (represented
with here) at which each variable interacts with self (possibly) and others in the network. These threshold functions can be step
function, logoid function or sigmoid function. Threshold function which we shall consider here is the step function which is given as
Equation 2a.
( ) 1, =+ xz if x and ( ) 0, =− xz if x . 2a

Proceedings of the 2019 International Science Conference Innovation and Advancement in Nanoscience and Nanotechnology, Federal University Oye-Ekiti (www.fuoye.edu.ng), 2019.
49
( ) ( ) ,1, xzxz +− −= 2b
Note that step functions are piecewise continuous. An example of logoid and sigmoid functions can be found in Plahte et al [8].
Threshold hyperplanes partition the phase space into n-dimensional open rectangular domains called boxes. Within each of these
boxes, the right-hand side of Equation 1 (or the vector field) is just a first order ordinary differential equation.
( ) ( )txtx iiii −= 3
Consider for instance a network that has just two variables and each variable has just one threshold. The number of boxes here is
2211
00
1 = xxB , 2211
10
2 = xxB , 2211
01
3 = xxB and 2211
11
1 = xxB . It
can be proved that the number of such boxes in an n-dimensional network where each variable has nipi ,,2,1, = thresholds is
( )=
+n
i
ip1
1 [9, 10]. The superscript on the box refers to the state of the variable as defined in Equation 2a. Equation 3 with initial
point and time ( ) 00 xttx == has a solution given by:
( ) ( ) ( )0tt
iiiikxtx
−−−+=
4
The limit of Equation 4 in forward time as →t is i . This limit is what is called the focal point [8]. A box is considered stable if
it contains its focal point but unstable otherwise. Walls are defined in Plahte et al [8] with respect to the relationship between focal
points and threshold wall of interest. This we believe fails for reasons such as relapses as observed before. Here we shall define walls
based on the focal points of adjacent boxes as follows.
3 Types of Threshold Walls in GRN.
Filippov motion on threshold walls can be treated in a similar way as that in boxes [7]. Consider that threshold wall i separates two
walls 1B and 2B . Then a vector field on such wall (which is linear) can be defined as Equation 5 [7] as:
( ) 21 1BBW fff −+= , where
12
1
B
k
B
k
j
kk
B
k
ff
f
−
−=
5
From the form of Equation 5, it is evident that the constant does not exist if the two boxes have the same focal point, which is
when the denominator is zero. In other words, existence of such a constant is essential for a motion to slide on any wall. As a result of
this we propose the following:
Proposition 1. Let i be the threshold wall separating the boxes iB and 1+iB , where = ii xXxB : and
iii xXxB =+ :1. Let the focal points of the boxes be i and 1+i , respectively. It follows from Equation 5 that a wall
is:
(i) black if ii B
k
B
k ff + 1 5a
(ii) transparent if ii B
k
B
k ff =+ 1 5b
(iii) white if ii B
k
B
k ff + 1. 5c
Observe that kf is the kth-component of F in Equation 1 where kx attains a threshold value. Following the definition given by
Plahte et al [8] we can have the following characterization of wall:

Proceedings of the 2019 International Science Conference Innovation and Advancement in Nanoscience and Nanotechnology, Federal University Oye-Ekiti (www.fuoye.edu.ng), 2019.
50
Proposition 2. Let i be the threshold wall separating the boxes iB and 1+iB , and let the focal points of the ith-variable in the
boxes be i and 1+i , respectively. Then we say that a wall is:
(i) black if 1+ ii B and ii B+1 5d
(ii) transparent if 1+= ii in either of the boxes 5e
(iii) white if ii B and 11 ++ ii B . 5f
Remark 1. The proof of these propositions is part of other works submitted for review elsewhere. However, the proof is not difficult
because
i
B
i
f
1= and since i is constant inside each box, it follows from proposition 1.
The nature of these definitions can serve as a practical guide to studying walls and their exit conditions. Proposition 1 has is a bridge
between the reports of Plahte et al. [8] and, Gouze and Sari [7] because it combines the definition of a wall in principle and practice. In
the next section we shall consider the application of this to some examples in literature.
4 Illustrative Examples
We shall consider three examples here. First let us consider the two-dimensional network given in Plahte and Kjoglum [11] as
follows:
1121211 2 xzzzzx −−+= 6a
11212 1 xzzx −−= 6b
The variables in this network have just one threshold each.
Another network with one threshold for each variable is given in Snoussi and Thomas [12] as:
( ) 1132311 xzzzkx −−= 7a
223122 xzzkx −= 7b
( ) 3312133 1 xzzzkx −−+= 7c
The third network we shall study is a modified form of Equations 7a – 7c given as Equations 8a – 8c.
( ) 1132111 1 xzzzkx −+−= 8a
( ) 2212322 1 xzzzkx −++= 8b
( ) 3331233 xzzzkx −+= 8c
We shall begin by identifying the walls in each example before exploring their nature with our proposition. The example network
described by equation (4.1) has four boxes. These are ( )22111 , = xxB , ( )22112 , = xxB ,
( )22113 , = xxB and ( )22114 , = xxB . Each of these boxes can be represented by the state of the variables
in them as ( ) 00
11 0,0 BB = , ( ) 01
22 1,0 BB = , ( ) 10
33 0,1 BB = and ( ) 11
44 1,1 BB = .
This example has two threshold hyperplanes which are 11 =x and 22 =x . Each hyperplane is divided into two walls and each
wall is bounded by two boxes. One of this wall is 1
1w which divides the boxes ( )0,01
1 =B and ( )0,12
1 =B for the domain
11 =x and 22 x . The other wall that divides the boxes ( )1,01
2 =B and ( )1,12
2 =B is 2
1w , which is for the domain

Proceedings of the 2019 International Science Conference Innovation and Advancement in Nanoscience and Nanotechnology, Federal University Oye-Ekiti (www.fuoye.edu.ng), 2019.
51
11 =x and 22 x . Similarly, the threshold hyperplane 22 =x has the following two walls:
( ) ( )1,0,0,0:2
1
1
1
1
2 == BBw and ( ) ( )1,1,0,1:2
1
1
1
2
2 == BBw .
Note: In the box ( )0,11=iB , the state of 1z is 1 and that of 2z is 0. This is how
jkB
if , j = 1 ,2; i = 1, 2, . . . , n and k = 1, 2 , . . .
, p (where p refers to the number of walls that emanate from the threshold hyperplane iix = ).
The wall 1
1w is white because 01
1
1 =B
f , and 12
1
1 =B
f , thus 02
11
1
11 −BB
ff . The wall 2
1w is black since 11
1
1 =B
f and
02
1
1 =B
f , thus 02
11
1
11 −BB
ff . Recall that B
kf is the value of the vector field of Equation 1 corresponding to kx .
On the other hand, the wall 1
2w is transparent because 2
11
1
22 1BB
ff == and as such 02
11
1
11 =−BB
ff . The last wall 2
2w is
black because 11
1
2 =B
f and 02
1
2 =B
f , thus 02
11
1
22 −BB
ff . This result agrees with that of Plahte and Kjoglum [11].
For the example network of Equations (7a, b, and c) there are twelve walls, four for each threshold hyperplane, in the network.
The walls corresponding to the hyperplane 11 =x are the following: ( ) ( )100,000:2
1
1
1
1
1 BBw ; ( ) ( )110,010:2
2
1
2
2
1 BBw ,
( ) ( )101,001:2
3
1
3
3
1 BBw and ( ) ( )111,011:2
3
1
3
4
1 BBw . These walls are all transparent. For instance, 01
1
1 =B
f and
02
1
1 =B
f ; 01
2
1 =B
f and 02
2
1 =B
f ; 01
3
1 =B
f and 02
3
1 =B
f and 11
4
1 =B
f and 12
4
1 =B
f .
The walls belonging to the hyperplane 22 =x walls are ( ) ( )010,000:2
1
1
1
1
2 BBw ; ( ) ( )110,100:2
2
1
2
2
2 BBw ,
( ) ( )011,001:2
3
1
3
3
2 BBw and ( ) ( )111,101:2
4
1
4
4
2 BBw . These walls behave the same way as the walls of 11 =x above and
as such are transparent.
The hyperplane 33 =x , have the following walls: ( ) ( )001,000:2
1
1
1
1
3 BBw ; ( ) ( )101,100:2
2
1
2
2
3 BBw ,
( ) ( )011,010:2
3
1
3
3
3 BBw and ( ) ( )111,110:2
4
1
4
4
3 BBw . These walls are all transparent but unlike the two walls seen above
only 2
3w has 0=f as the rest of the walls has 3kf = .
Equations (8a, b, and c) have the same number of thresholds as that of Equation (7a, b and c). The walls belonging to the hyperplane
11 =x and the boxes adjacent to them are ( ) ( )100,000:2
1
1
1
1
1 BBw ; ( ) ( )110,010:2
2
1
2
2
1 BBw , ( ) ( )101,001:2
3
1
3
3
1 BBw
and ( ) ( )111,101:2
4
1
4
4
2 BBw . It is easily seen that all the walls of this hyperplane 11 =x are black.
For the hyperplane 22 =x , the walls are ( ) ( )010,000:2
1
1
1
1
2 BBw ; ( ) ( )110,100:2
2
1
2
2
2 BBw ; ( ) ( )011,001:2
3
1
3
3
2 BBw
and ( ) ( )111,011:2
4
1
4
4
1 BBw . The walls 1
2w and 3
2w are transparent. The other two walls 1
2w and 3
2w are black.
Finally, the hyperplane 33 =x , have the following walls: ( ) ( )001,000:2
1
1
1
1
3 BBw ; ( ) ( )101,100:2
2
1
2
2
3 BBw ,
( ) ( )011,010:2
3
1
3
3
3 BBw and ( ) ( )111,110:2
4
1
4
4
3 BBw . The walls 1
3w and 3
3w are transparent whereas 2
3w and 4
3w are
white.
An example that illustrates distinctly the advantage of this method over existing ones [7, 13] is the two-dimensional network proposed
by Snoussi and Thomas [12] and investigated for regular and singular stationary points in Gouze and Sari [7]. The diagram of the
walls and their nature is shown in Fig 1.

Proceedings of the 2019 International Science Conference Innovation and Advancement in Nanoscience and Nanotechnology, Federal University Oye-Ekiti (www.fuoye.edu.ng), 2019.
52
Fig. 1. Walls of equation (4.4) and their nature based on focal flow
From the diagram and as reported in Gouze and Sari [7], the wall 5w is transparent because focal points are expected to cross the
wall. However, our method shows that 0422
12
22 =− kff
BB, showing that the wall is white rather than transparent. This is not
the only wall as 12w is not transparent but white since 0121
11
21 =− kff
BB.
5 Results and Discussion
The nature of walls reported in previous literature [7, 8] does not bring out the intrinsic properties and qualities of interactions existing
in GRN. These qualities are hidden in the regulatory interactions of the variables which either activate or repress each other. This
action is not conspicuous going by the earlier definitions of these walls. For instance, ( ) ( ) ( ) ( ) 021 xfxnxfxn TT implies that
the wall is transversal [13] and as reported in Gouze and Sari [7] that “a wall is transparent if trajectories enter one box from the wall
and leave through the other box”. Neither of this tells at a glance if there is a gain or loss across the wall. Part of the goal of this work
is to expose these intrinsic interactions that exist at the threshold walls from the nature of the walls; and as discussed above, the nature
of transparent walls can be inferred easily without any mathematical rigors or exercise. The transparent walls in the examples studied
in the last section clearly tell whether there is a gain or loss in concentration across a transparent wall. For instance, consider the two
transparent walls belonging to the threshold hyperplane 22 =x of Equations 8b. Applying Equation 5b to Equation 8b is
121 kfi
B= and 12 23 kf
iB
= showing an increase across the walls 1
2w and 3
2w , respectively. On the other hand, the walls 1
3w
and 3
3w of Equation 8c have 01
3 =i
Bf and
333 kf
iB
= , respectively showing that the variable’s concentration decreases across
1
3w but increases across3
3w .
Proposition 2 will still yield the same result as proposition 1, only that it uses trajectories of adjacent boxes rather than the production
function ( )Zf . It has one edge over proposition 1 which is that one will not have to seek trajectories in case it is needed. However,
when one is not interested in the trajectories of the boxes but nature of walls just as we did here, proposition 1 is preferable. It is
pertinent to state that the importance of this work is highly appreciated when one wants to study the dynamics of trajectories on a wall,
which is possible since the work of Plahte and Kjoglum [11] shows that trajectories can belong to threshold walls. It will provide an
investigator with the correct nature of the wall first and this in turn will tell which walls to investigate and which to ignore.
6 Conclusion
In conclusion, we have seen that nature of walls should not depend on the direction of trajectory of adjacent boxes but on the result
derived from concatenating the trajectories about the walls. To do this requires some level of mathematical involvement; however, we
have shown by the methods in this work that such mathematical demand can be circumvented. This therefore serves as a bridge for
investigators with weak mathematical background.

Proceedings of the 2019 International Science Conference Innovation and Advancement in Nanoscience and Nanotechnology, Federal University Oye-Ekiti (www.fuoye.edu.ng), 2019.
53
References
1. Plahte E., Mestl T., and Omholt S.W., 1998. A methodological basis for the description and analysis of systems with complex switch-like
interactions. J Math Biol, 36, 321-348.
2. Mestl T., Plahte E. and Omholt S.W., 1995. A mathematical framework for describing and analysing gene regulatory networks. Journal of
Theoretical Biology, 176(2), 291-300.
3. Mestl T., Lemay C. and Glass L., 1996). Chaos in high-dimensional neural and gene networks. Physica D, 98, 33-52.
4. Ropers D., de Jong H., Page M., Schneider D. and Geiselmann J., 2006. Qualitative simulation of the carbon starvation response in Escherichia
coli. BioSystems, 84, 124–152.
5. de Jong H., 2002. Modeling and simulation of genetic regulatory systems: a literature review. J Comput Biol, 9, 67-103.
6. Etienne F., 2005. Geometric properties of a class of piecewise affine biological network models. J Math Biol, doi: 10.1007/s00285-005-0360-4.
7. Gouze J.-L., Sari T., 2001. A Class of Piecewise Linear Differential Equations Arising in Biological Models.RR-4207, INRIA. <inria-
00072415>
8. Plahte E., Mestl T. and Omholt S.W., 1994. Global analysis of steady points for system of differential equations with sigmoid interaction.
Dynamics and Stability of Systems: An International Journal, 9(4), 275-291.
9. Porreca R., Drulhe S., de Jong H. and Ferrari-Trecate G., 2008. Structural identification of Piecewise-Linear models of genetic regulatory
networks. J Comput Biol, 15(10), 1365-80.
10. Grognard F., De Jong H. and Gouzé J.-L., 2007. Piecewise-linear models of genetic regulatory networks: theory and example. Isabelle
Queinnec, Sophie Tarbouriech, Germain Garcia, SilviuIulianNiculescu. Biology and Control Theory: Current Challenges, 357, Springer, pp.137
- 159, Lecture Notes in Control and Information Sciences.
11. Plahte E. and Kjoglum S., 2005. Analysis and generic properties of gene regulatory networks with graded response functions. Physica D 201,
150-176.
12. Snoussi E.H. and Thomas R., 1993. Logical identification of all Steady States: the concept of feedback loop characteristic states. Bulletin of
Mathematical Biology, 55(5), 973-991.
13. Dieci L. and Lopez L., 2009. Sliding motion in Filippov differential systems: theoretical results and a computational approach. SIAM Journal on
Numerical Analysis, 47(3), 2023-2051.

Proceedings of the 2019 International Science Conference Innovation and Advancement in Nanoscience and Nanotechnology, Federal University Oye-Ekiti (www.fuoye.edu.ng), 2019.
54
Rule-Based Expert System for Classification of Hospitality Industry
Akinpelu S.A.1, Olabode O.2, Daramola C.Y.1, Ogunleye G.O. 1, Adeoti E.A.1
1Department of Computer Science, Federal University Oye-Ekiti, Nigeria 2Department of Computer Science, Federal University of Technology Akure, Nigeria
Abstract
The conventional method of classification in hospitality domain is bedeviled with problems such as inaccuracy, low speed of
processing, prejudice and lack of unifying standards. To eradicate these problems, a rule-based expert system capable of imitating
human cognitive reasoning was introduced into hospitality industry. In this paper, hospitality knowledge obtained from experts was
codified into electronic form, in order to automate and preserve knowledge into a central shareable form. Hospitality industry was
characterized with diversity of types of hotel accommodations, a diversity that is constantly increasing at a fast rate, which invariably
renders a conventional approach of classification unsuitable. Thus, an expert system becomes an ideal approach of classification in
hospitality domain.
Keywords: Expert system, knowledge base, artificial intelligence, hospitality industry, inference engine
1 Introduction
The growth of knowledge management in the world has made it crucial to codify knowledge into the work process [1]. Codified
knowledge is knowledge that has been obtained from a domain expert and transferred into electronic form. This transference of
knowledge then helps businesses automate, streamline, and preserve knowledge into a central shareable source. Decisions and training
specifics can then be derived from the knowledge using analysis tools or other domain experts [2]. One way to implement this
knowledge is through the use of rule-based expert systems. A rule based expert system is a program or hardware configuration that
uses a set of preconditions and rules to come up with expert answers to a situation [3]. An "Expert system" is an intelligent computer
program that uses knowledge and inference procedures to solve problems that are difficult enough to require human expertise for their
solution. The knowledge necessary to perform at such a level plus the inference procedures used can be thought of as a model of the
expertise of the best practitioners in the field [4]. Rule base is therefore one of the viable approach of expert system, in which
knowledge from a domain are represented inform of human linguistic terms.
The hospitality industry is one of the leading stakeholders in the tourism sector. With roughly 11% of the world’s total employment or
GDP, tourism often presented as the first global industry, and Europe is by far the first tourist continent [5]. The World Tourism
Organization predicts that by 2020, tourist arrivals around the world will increase by over 200%. An important factor therefore, for the
visitors of a country is the quality of the hotels in that country [6]. The quality of hotel facilities offered during visitors stay at a hotel
directly and significantly affects the Gross National Product (GNP) share of the country dedicated to tourism industry [7]. In the light
of the above, the conceptual work deals with developing an Expert System for classification of hospitality industry so as to provide a
unified standard in the industry [8]. The need to acquaint hotel customer or guest with what to expect in hotel of their choice is a
strong motivation for presenting this paper. More so that hotel classification is a prerequisite for the world’s fastest growing industry
whose customers’ needs and demands change with developmental phase. Hospitality is the act of kindness in welcoming and looking
after the basic needs of customers or strangers, mainly in relation to food, drink and accommodation [9]. Hotel ratings are often used
to classify hotels according to their quality. From the initial purpose of informing travelers on basic facilities that can be expected, the
objectives of hotel classification have expanded into a focus on the hotel experience. Today the terms 'grading', 'rating', and
'classification' are used to generally refer to the same concept, that is to categorize hotels [10].
Researchers in hospitality domain have tried to describe the hospitality industry in different ways. Some tried to summarize the scope
of the industry and its characteristics of involving both tangible and intangible features in the service delivery process. Others
attempted to describe the industry by exploring the stakeholders involved, mutual benefits generated and the industry’s impacts to the
society and economy [11]. Balfe et al [12] proposed an expert system approach to hospitality company diagnosis using Linkert scale
and Crystal shell. The operating environment of hospitality industry was described as an increasing difficult business environment in
which to survive, they must constantly review all aspects of their business, ensure that each unit is operating at an optimum level in
order to achieve satisfactory profitability, but could not state how the industry could be rated or classified so as to ensure a unified
standard in the industry. The WTO [13] pointed out the benefits of hotel classification to travel agency, tour operators, hotel industry,
government and consumers in facilitating travel agents’ tasks of hotel selection. The research also measures the perceived influences

Proceedings of the 2019 International Science Conference Innovation and Advancement in Nanoscience and Nanotechnology, Federal University Oye-Ekiti (www.fuoye.edu.ng), 2019.
55
of the hotel classification system on the hotel industry in general as well as hotel properties, through the use of a self-administered
questionnaire. It was discovered that the standard of classification among hospitality industry cannot be based on questionnaire alone
because of level of diversity. Yeamdao [14], opined that an inseparable level interdependence exists between hotel classification and
quality of service. Thus, hotel classifications systems were said to have offered benefits to various sectors, especially the tourism
sector. Although the level of interdependence of service quality is essential in hotel classification. It cannot alone form the basis of
classification, but rather a robust system that can emulate human cognitive reasons in classifying hospitality industry. Ángel et al. [15]
proposed a semantic-based expert system to provide recommendation in tourism domain. The system only make recommendation to
tourist based personal interest. Also, the method of data collection for customer feeling about recommendation for the system was too
narrow in scope. Amir et al. [16] proposed a model through which factors affecting hotel classification were identified and a domestic
model for classifying hotels in Iran was presented. But the model was not implemented with any real life system in other to ascertain
its functionality. In all, none could yield a unified standard of classification of hospitality industry without human intervention, hence
the necessity of expert system for classification in hospitality domain.
2 Architecture of the Expert System
The proposed system is a rule-based expert which is implemented using Java Expert System Shell (JESS), as shown in Fig. 1. The
system makes use of forward chaining for the inference engine and uses the RETE algorithm to search the knowledge base. The
system has a graphical user interface where the user is presented the option to answer in yes or no. The set of questions are prepared
according to various hotel facilities to which a hotel unit may be categorized.
Fig. 1. Architecture of the expert system for hotel classification
Now, according to the feedback given by the user, the RETE algorithm (pattern matcher) searches the knowledge base for possible
pattern matches. If there is a rule in the knowledge base which matches the hotel facilities, the system shows the possible classification
(hotel star) in the recommendation window.
2.1 Knowledge Acquisition
The knowledge base can be considered as the heart of the Expert system as all the required facts for building the rules are contained
resides in it. The first step in building an expert system is the elicitation of the necessary knowledge about the domain from the human
expert by the knowledge engineer. With the knowledge acquisition facility, application experts can add knowledge about their domain
of expertise. Taking this knowledge as source, Expert System rules can be formed [18]. The primary source of knowledge acquisition
Domain Expert Knowledge
Acquisition
Subsystem
Explanation
Subsystem
Inference Engine
Rule Interpreter
Work Space
Problem
Description
Problem
Status
User Friendly Interface
Knowledge Engineer
Knowledge Base
Facts
Inference
Rules
User

Proceedings of the 2019 International Science Conference Innovation and Advancement in Nanoscience and Nanotechnology, Federal University Oye-Ekiti (www.fuoye.edu.ng), 2019.
56
for the Expert System for inferencing the domain knowledge of Hospitality Industry was consultation with expert in hospitality
domain such as hotel managers, hotel customers’, Hotelier Association, and Ministry of Tourism in Ekiti State, Nigeria.
2.2 Knowledge Representation
The knowledge base was represented in the form of production rules using an expert system tool called Java Expert System Shell
(JESS). JESS is called an expert system tool because it is a complete environment for developing expert systems which includes
features such as an integrated editor and a debugging tool. The word shell is reserved for that portion of JESS which performs
inferences or reasoning. The JESS shell provides the basic elements of an expert system [19]. JESS matches facts in the fact base to
rules in the rule base (Fig. 2). Here the user of the system will first be presented with a list of questions which the user has to answer in
yes or no. With the help of the questions the available facilities of hotels are acquired. Then by using the RETE algorithm, which is a
pattern matching algorithm, the knowledge base is searched for matching the features of the hotel with those already present in the
knowledge base. The RETE algorithm is usually implemented as a directed acyclic graph which is used to match rules to facts. Let us
suppose a hotel is to be classified as One Star, the rules for one star is thus:
Fig. 2. Knowledge representation
2.3 Inference engine
Inference engine (IE) is concerned with carrying out the relevant inductions and deductions on the knowledge base. It is the adoption
of appropriate line of reasoning, leading to the solution of a given problem or the formulation of a body of consultative advice on a
given demographic phenomenon [20]. A rule based expert system using forward chaining usually consists of if-then rules, a bunch of
facts and an interpreter controlling the application of rules, given facts. A single If-Then rule (Fig. 3) assumes the form ‘if X is A then
Y is B’; if part of the rule ‘X is A’ is called antecedent and then part of the rule ‘Y is B’ is called consequent.
Fig. 3. Forward chaining inference
3 Methodology
The expert system for classification of hospitality industry was implemented using forward chaining approach to reach the conclusion.
In order to execute a rule-based expert system using this method, a rule merely need to be fired and the corresponding action be
triggered. Suppose, a hotel has facilities ranges from daily room cleaning, table and chair, reception service, extended breakfast, daily
room cleaning, to deposit possible. The expert system starts with the assumption that the hotel is One Star. On being queried about
other available facilities, if the user answers yes, the expert system will discard the assumption and then the expert system proceed
further on its queries to ascertain other facilities that are available. After all the inputs from the user, the expert system will use the

Proceedings of the 2019 International Science Conference Innovation and Advancement in Nanoscience and Nanotechnology, Federal University Oye-Ekiti (www.fuoye.edu.ng), 2019.
57
RETE algorithm to search the knowledge base for matching the pattern of the facilities. If the pattern matches with One Star, the rule
for One Star will be fired and the system will display the corresponding hotel classification as indicated in following section.
4 Result and Discussion
The proposed expert system for classification of hospitality industry has its inference engine implemented with JESS. There is room
for updating the expert system with new knowledge and new rules without changing the whole configuration and adding only the
specific rules. A java Swing was used for the graphical interface as shown in Figs. 4, 5 and 6.
Fig. 4. Hotel registration
The registration module is critical to the expert system as it establish the fact that an industry operator is well registered and licensed
by the regulating body. The importance of hotel registration cannot be overemphasized as it pivotal to classification on which this
paper is based. Once the registration is completed, the system proceeds to actual classification.
Fig. 5. Catalogue of expert system query for classification
After which, the system engages the user in some question through which conclusion is drawn as to which classification a hotel falls
into. The questions revolve around physical and service quality that exists in a hotel which forms the basis for classification.
This interface is the actual module that classifies a hotel base on the physical facilities and services that exist in the hotel as presented
in Fig. 6. The user selects various facilities and services that are available in the hotel from a drop-down menu. Internally, the expert
system through its inference engine classifies available facilities as “yes/no”. Then, the exact rule that matches the hotel features from
the knowledge base is fired, which eventually will lead to a hotel being classifies as One star (*), two star (**), three star (***), four
star (****) and five star (*****) as the case may be as shown in Fig. 6. As indicated above, the key purpose that necessitates this

Proceedings of the 2019 International Science Conference Innovation and Advancement in Nanoscience and Nanotechnology, Federal University Oye-Ekiti (www.fuoye.edu.ng), 2019.
58
classification as presented in this paper is to remove the aged long problem of the fact that guests are not given value for money and
are being ripped off by hospitality industries operators.
Fig. 6. Hotel classification
5 Evaluation of the Expert System
In order to assure the functionality of the proposed system, expert users’ rating observed from some experts were used to determine
the degree of confidence (DoC) of the classification made by the expert system. In information retrieval context, standard measures,
like mean accuracy (MA) and efficiency have been used to determine the performance of several systems. In this study, DoC is taken
as a measure to establish the confidentiality of the system. This is achieved by performing relational-join operation on the result of the
proposed system and the ratings by experts after demonstration. The DoC of a ranking is determined using Equation 1.
DoCi = #𝐹𝑎𝑙𝑠𝑒 𝑃𝑜𝑠𝑖𝑡𝑖𝑣𝑒𝑠
#𝑇𝑟𝑢𝑒 𝑃𝑜𝑠𝑖𝑡𝑖𝑣𝑒𝑠 * 100 1
where #True Positive is the number of hotel classification by the system and an expert agrees with, and #False Positive is the number
of hotel classification by the system but an expert does not agree with. The data obtained from experts after assessment through a
score sheet is presented in Table 1, and the DoC of first user ui is computed as thus:
DoCi = 52
56 * 100 = 92.85% 2
Errori = 100−DoCi
100 3
Table 1. Data showing domain expert rating
Id 001 002 003 004 005 006 007 008 009 010
#True +Ve 55 56 57 55 53 57 54 55 56 58
#False +Ve 52 49 51 53 44 48 43 54 44 50
DoC (%) 94.55 87.50 89.47 96.30 83.01 84.21 79.63 98.18 78.57 86.21
Errori 0.05 0.13 0.11 0.04 0.17 0.16 0.21 0.02 0.21 0.14
1 - Errori 0.95 0.87 0.89 0.96 0.83 0.84 0.79 0.98 0.79 0.86
Therefore, the MA is calculated as:
MA = ∑ (1−𝐸𝑟𝑟𝑜𝑟𝑖)
𝑛𝑖=1
𝑛 4
MA = 8.76
10 = 0.876
Efficiency = MA*100 5
Efficiency = 0.876*100 = 87.6%
Therefore, it can be inferred from the computation that the proposed system is 87.60% efficient in providing accurate classification of
hotels.

Proceedings of the 2019 International Science Conference Innovation and Advancement in Nanoscience and Nanotechnology, Federal University Oye-Ekiti (www.fuoye.edu.ng), 2019.
59
6 Conclusion
In this paper, a rule-based expert system for classifying and rating of hospitality industry was developed purposefully to ensure proper
standardization in terms of facilities, services, pricing and healthy competition in the industry. The result has shown that any form of
self-acclaim status without requisite facilities and services by an industry operator can be abolished. Hotel guests are better informed
of what to expect in a hotel of their choice. The system codified experts’ knowledge in hospitality domain and used pattern matcher
algorithm to reach its conclusion. The system was tested, and it perform as expected.
References
1. Cernik J., 2009. Framework for an expert system generator, Master thesis presented to graduate faculty, University of Akron.
2. Abraham A., 2005. Rule based Expert System: Handbook of measuring system design.Peter H, syndenhan and Richard thorn, eds. John Willey
& Sons Ltd., Oklahoma State University, USA.
3. Jaja K., 2009. Issues in grading and classification of Nigeria’s hospitality sector, The Economy Newspapers.
4. Russell S. and Norvig P., 2002. Artificial Intelligence: A Modern Approach, Prentice Hall, Second Edition.
5. World Tourism Organization (WTO) & International Hotel and Restaurant Association (IH&RA), 2004. The Joint WTO & IH&RA Study on
Hotel Classification.
6. Amir M., Ghadami R. and Sarafizadeh D., 2012. Designing a domestic model for classification and grading hotels in Iran. International Journal
of Business and Social Science, 3(8), 306-310.
7. Rajdeep B. and Suagta S., 2012. Rule based expert system for diagnosis neuromuscular disorder, retrieved from
https://arxiv.org/ftp/arxiv/papers/1207/1207.2104.pdf on 10th April, 2018.
8. Benny C. and Murray M., 2013. Introduction to hospitality. Tourism and Hospitalities Studies, Hong Kong Polytechnic University.
9. Henses W., 2010. Guest review criteria on tripadvisor compared to conventional hotel rating systems to assess hotel quality, Stenden University,
SA.
10. Yeamdao N., 2007. The relationship of the hotel rating system and service quality. Ph.D Thesis, Submitted to the Faculty of the Graduate
College of the Oklahoma State University.
11. Olabode O. and Olabode B., 2008. Projection manager: A knowledge based cohort component model for population projection in Nigeria.
Journal of Information Technology Impact, 8(1), 11-24.
12. Balfe A., O'Connor P. and McDonnell C., 1994. An expert system-based approach to hospitality company. HITA Conference. Dallas, Texas.
13. Ángel G., López-Cuadrado J., Ricardo C., González-Carrasco I. and Belén R., 2011. Sem-Fit: A semantic based expert system to provide
recommendations in the tourism domain. Journal of Expert Systems with Applications, 38(10), 13310-13319.
14. Bullinaria A., 2005a. IAI: Production systems, http://www.cs.bham.ac.uk/~jxb/IAI/w7.pdf, accessed on 29th March, 2018.
15. Chakraborty R., 2010. Expert System: AI course lecture 35-36. www.myreaders.info/html/artificial_intelligence.html, accessed on 7th
September, 2018.
16. Bullinaria A., 2005b. IAI: Expert systems, http://www.cs.bham.ac.uk/~jxb/IAI/w9.pdf, accessed on 29th March, 2019.
17. Orthodox T. and Krishna G., 2015. Hotel grading, service quality, satisfaction and loyalty – Proposing a theoretical model and relationship,
African Journal of Hospitality, Tourism and Leisure Vol. 4 (Special edition), ISSN: 2223- 814X.
18. Hunt V., 1986. Artificial Intelligence & Expert Systems Sourcebook. Springer US.
19. Morris J., 2005. Introduction to Java Expert System Shell, Seminar “AI Tools” Winter semester, Universit at des Saarlandes 2006/2007.
20. Mostafa A., Ahmad A., Mohammed M. and Obaid O., 2012. Implemeting an expert diagnostic assistance system for car failure and malfunction.
Intl Journal Comp Sci, 9(2), 116-125.

Proceedings of the 2019 International Science Conference Innovation and Advancement in Nanoscience and Nanotechnology, Federal University Oye-Ekiti (www.fuoye.edu.ng), 2019.
60
Review on the Impact of Nanotechnology in M-Learning Devices
Bamidele V. Aremu1,*, Olufemi V. Adeoluwa1, Omolola H. Aremu2
1Department of Vocational and Technical Education, Ekiti State University, Ado-Ekiti, P.M.B 5363, Ado-Ekiti, Ekiti State, Nigeria 2Nanoscience Research Unit, Department of Industrial Chemistry, Federal University Oye-Ekiti, P.M.B 373, Oye-Ekiti, Nigeria
Abstract
M – learning is a form of learning that supports both classroom and distance learning experiences. The educational institutions in
Nigeria have not been able to admit all the candidates that are available for learning in Nigeria due to limitation in space and other
resources. This has been negatively affecting those candidates emotionally and psychological even the country at large as the working
population is less than dependent population. m – learning makes learning activities to be easily accessed. Nanotechnology has been
able to come up with components of m-learning devices in nanoscale (1-100 nm) which are smaller but have great potentials in
performance than the non–nanoscale components. This paper reviews the impacts of carbon nanotubes on production of chips,
transistors and the rechargeable batteries that form part of the components of m – learning devices.
Keywords: Nanotechnology, mobile learning, mobile devices, teaching aids
1 Introduction
Globalization had made the world to be interested in the search for devices that can link the world together. The linking search led to
the development of mobile devices which are now the easiest and faster channels of connecting the societies within the world. It is
obvious that mobile devices have been experiencing increase and continuous transformation even as they become an integral part of
human livelihood because novel models of the technologies that are faster, portable, presentable and affordable are been produced.
Cellular phones, smart phones, tablets, computers and personal digital assistants (PDAs) are some of the available mobile devices [1].
Learning is another part of human livelihood that is often performed in the classroom with teaching aids. Teaching aids are materials
needed to support learning and it can be grouped into visual (e.g. placard, pictures, projectors, telex, film strip,), audio (e.g. radio, tape
recorder, public address system) and audio-visual (e.g. television, video-sound strip, and some mobile devices) teaching aids. Mobile
devices are good materials that bring flexibility and interactivity during learning experience [2], when these mobile devices are
incorporated into the act of learning, the learning process is tagged mobile learning (m - learning).
Nanotechnology that is known for its ability to manufacture devices in a scale ranging from 1 to 100 nanometers is considered to be
useful in factually all the fields of study and that is why this review is on the impact of nanotechnology on the field of education.
2 Overview of Nanotechnology in M - devices and M - learning
Jeroh [3] was of the opinion that nanotechnology has immensely enhanced the competence of mobile phones and computers (mobile
devices) by increasing their speed and efficiency. It is further stated that nanotechnology has the potential needed to manufacture
computer chips, energy batteries and sensors that are appreciably smaller, faster, powerful and cheaper [4]. However, Brown and
Mbati [5] opined that mobile learning (m-learning) involves the use mobile devices in teaching and learning experiences. One will
then, admit that the relevancy of mobile devices in education is to realize a better and flexible channel of learning and assimilation.
More so, this channel of learning entails that mobile devices be intelligently incorporated into the learning activities of the Nigerian
educational system as well as the daily living of individual citizens in order to make learning to be easily accessed.
There is no doubt that nanotechnology has been growing since its inception and it has been relevant in many professional fields; such
as sciences, engineering, pharmacy, medicine and surgery etc. Parts of the various impact of nanotechnology in this contemporary
world as revealed by Jeroh [3] are:
• The reduction of the size of chips as well as the enlargement of its memory.
• The administration of pharmaceuticals to a precise part of the body with a level of accuracy that brings in the most efficient
kind of treatment.
• The production of tennis balls through carbon nanotubes in order to help them gain more elasticity.
• The improvisation of knee cap as well as the knee implants itself during the knee replacement surgery.

Proceedings of the 2019 International Science Conference Innovation and Advancement in Nanoscience and Nanotechnology, Federal University Oye-Ekiti (www.fuoye.edu.ng), 2019.
61
• Presently, vehicle manufacturers employ nanotechnology in manufacturing vehicles parts such as car bumpers, windscreens
etc.
3 Application of Nanotechnology to M-learning devices
Nanotechnology uses nanomaterials in the production of mobile technologies; especially, those ones that possess high intelligent
qualities which make them function in teaching and learning communication; it is certain that this contemporary world of technology
is working hard to ensure that mobile devices are gradually transforming in state so as to function more and be relevant in all human
societies. The various functions of m - learning devices as aided by nanotechnology has made the input and output activities of the
mobile devices to be friendly to their users in learning environment. More so, the cleverness of m - learning devices and their
functions in educational activities creates a new platform that aids intelligent activities such as educational games, tutorials and subject
tests. Furthermore, the application of nanotechnology to the production of m - learning devices brings in such an opportunity that
makes m - learning device users to partake in learning even outside the walls of the classroom. The speed and accuracy level of the
mobile devices incorporated into teaching - learning platform is to help with connectivity; this is why nanotechnology is used in the
production of smaller gadgets with high speed limit and large storage capacity [6].
It is observed that nanotechnology can be useful in the production of m -learning devices through the involvement of any of these;
carbon nanotube, vacuum tube, microscopic microphones and liquid lenses [7]. This review paper will reveal the impacts of carbon
nanotubes in the production of mobile learning devices.
3.1 Carbon Nanotubes
Carbon nanotubes are one of the nanomaterials that belong to the Fullerenes family. The fullerenes nanomaterials are known to have
the composition of carbon either in the hollow- sphere, ellipsoid or tube shapes. Consequently, the fullerenes in spherical shapes are
profoundly referred to as fullerenes (C60) or Bucky balls. They are considered useful in electronics and other applications [8].
However, the fullerenes in tube form are generally known as carbon nanotubes, and they are seen as mainly the prominent
nanomaterials used in nanotechnology. Carbon nanotubes are tiny elongated carbon tubes of carbon, which were made popular in
1991 when it was found in an insoluble material of arc-burned graphite rods. The cylindrical shape carbon nanotubes composed of
only carbon atoms that make hexagonal lattice on the sheet of its cylinder. This nanotechnological material possesses some unique
distinctiveness because of their form and size [9].
Carbon nanotubes have a very wide collection of electronic, thermal, and structural qualities that transform base on their different
diameter, lengths, and coils. It is also noted that carbon nanotubes exist in two forms, namely single wall carbon nanotubes and multi-
wall carbon nanotubes. Single-wall nanotubes consist of a single graphite layer while multi-wall nanotubes consist of multiple
concentric layers [10]. Fig. 1 shows the diagram of the two forms of carbon nanotubes. The arrangement of the carbon molecules of
carbon nanotubes in the tube determines either the carbon nanotube will be a strong conductor or a semi-conductor. It has been
established that the arrangement that made carbon nanotubes to be metallic, also account for why carbon nanotubes acquire electrical
conductive capacity that is 1000 times higher than the electrical conductive capacity of copper. In order to reduce high electrical
conductivity level of carbon nanotubes, polymers are wrapped with it [11].
3.1.1 Application of Carbon Nanotubes in the Production of Chips for M-learning Devices
The process of manufacturing of micro-chips entails metallic components that work as the channel for the interconnectivity between
the transistors placed on the micro cards. It is noted that the metallic substance that was initially imprinted on chips was aluminum and
this was later changed to copper; meanwhile, the need for higher performance chips combined with more tightly packed transistors
require interconnects less than 40 nanometers wide later surfaced and copper could not stand the capacity needed for such chips as it
relate to high conductivity as well as small dimensions. This is what led to the initiative of using carbon nanotubes to serve as a
substitute for conducting substance of copper [13].
Since, the introduction of carbon nanotubes as the connecting channel between the transistors of micro-chips, it has been serving its
purposes and have been a viable nanomaterial for the production of electronic micro-chips. In fact, the result of a research conducted
revealed that carbon nanotubes functions at 1Ghz on a chip of size of 1/100th square inch that has 11000 transistors. It is also noted
that carbon nanotubes make the production of micro-chips to be easier since it does not require special lining on the circuit of the
micro-chip [14]. In addition, a high density nonvolatile random access memory chip has been created using carbon nanotubes which
serve as active memory elements as well as semiconductors [15].

Proceedings of the 2019 International Science Conference Innovation and Advancement in Nanoscience and Nanotechnology, Federal University Oye-Ekiti (www.fuoye.edu.ng), 2019.
62
3.1.2 Application of Carbon Nanotubes in the Production of Transistors for M-learning Devices
Transistors are vital components of the circuit board of any electronic device. They mainly perform the underlying work of any
electronics because the circuits of the devices function through the connected transistors. It has been raised that carbon nanotube can
also be used in the production of transistors by making a single carbon nanotube molecule into semi-conductive substance. A single
walled nanotube can act as transistors when carbon nanotubes are constructed to act as such. Endo et al. [16] revealed that this can be
done by locating a molecule inside a carbon nanotube in order to influence the flow of electron of the electrical current that passes
through it with the resultant effect of creating a molecular gate; this controls the flow of the electrical current within the carbon
nanotube. According to them, such gate will be very small compared to a silicon chip and will operate under room temperature.
Fig. 1. Diagram of single wall (a) and double wall (b) carbon nanotubes [12]
3.1.3 Application of Carbon Nanotubes in the Production of Batteries for M-learning Devices
One of the features that made m - learning devices to be users friendly is the possession of rechargeable batteries. It has been
identified that carbon nanotubes have qualities that make them to function as anode materials that are relevant in the production
lithium-ion (Li-ion) battery systems [16]. It is further stressed that carbon nanotubes can be used to produce electrodes that are very
thin with great conductivity potentials. Gröning [10] wrote that the predominant part of commercially produced carbon nanotubes is
used for the manufacturing of porous conductive electrodes for Li-ion batteries that can serve any m - learning devices better.
3.2 Future Insights
Nanotechnology is well known to have impacts in almost all professional fields; the workings of nanotechnologists have sparked up
revolution in the field of engineering, science, medicine, agriculture, food processing, telecommunications and education. The
education industry will be drastically improved in the nearest future as nanotechnology will invents small, sophisticated and
economical educational gadgets that are more flexible, more portable, and easy to use for educational purposes both in rural and urban
areas. The future impacts of nanotechnology will be to produce nanoscale materials that have more memory, more sustaining battery
power, more computing strength, easy sensing and easy usage by both students and teachers in order to offer effective and efficient
learning even outside the classroom.
4 Conclusion
This paper has shown the application of nanotechnology in the production of mobile electronic devices that is useful, effective,
inexpensive and accessible for teaching and learning experiences. The quest for learning is on the increase in the present-day Nigerian
and this has already created the challenge of overpopulation in Nigeria educational institutions. In fact, some who desire to learn could
not gain entrance into school to learn and they end up creating menace to society. Consequently, nanotechnology can help in the
production of m - learning devices that are smart and active for learning, in order to accommodate learning outside the school
premises.
a) b)

Proceedings of the 2019 International Science Conference Innovation and Advancement in Nanoscience and Nanotechnology, Federal University Oye-Ekiti (www.fuoye.edu.ng), 2019.
63
References
1. Liu M., Scordino R., Geurtz R., Navarrete C., Ko Y. and Lim M., 2014. A look at research on mobile learning in k-12 education from 2007 to
the present. Journal of Research on Technology in Education, 46(4), 325-372.
2. Crompton H., 2013. A historical overview of mobile learning: Toward learner-centered learning in Z L Berge & L Y Muilenburg (Eds.),
Handbook of mobile learning, Florence, KY Routledge, Italy, 3-14.
3. Jeroh M.D. (2017). The impact of nanotechnology on mobile phones and computers. J. Nano. Adv. Mat. (5)1, 17-22.
4. Ali Ahmed E.S. and Sohal H.S., 2017. Nanotechnology in communication engineering: issues, applications, and future possibilities. World
Science News, 66, 134-148.
5. Brown T.H. and Mbati L.S., 2015. Mobile learning: moving past the myths and embracing the opportunities. International Review of Research
in Open and Distributed Learning, 16(2) 115-135.
6. Akyildiz F., Pierobon M., Balasubramaniam S. and Koucheryavy Y., 2015. The internet of bio-nanothings. IEEE communications magazine -
communications standards supplement.
7. Jamthe D.V. and Bhande S.A., 2017. Nanotechnology in 5g wireless communication network: an approach. International Research Journal of
Engineering and Technology, 4 (6), 58-61.
8. Flamant G., Robert J.F., Marty S., Gineste J.M., Giral J., Rivoire B. and Laplaze D., 2004. Solar reactor scaling up the fullerene synthesis case
study. Energy, 29, 801- 809.
9. Lam C.W., James J.T., McCluskey R., Arepalli S. and Hunter R.L., 2006. A review of carbon nanotube toxicity and assessment of potential
occupational and environmental health risks. Crit Rev Toxicol, 36, 189-217.
10. Gröning P., 2005. Nanotechnology: an approach to mimic natural architectures and concepts. Adv Eng Mater, 7 (5), 279-291.
11. Whatmore R.W., 2006. Nanotechnology – what is it? Should we be worried? Occupational Medicine – Oxford 56 (5), 295-299.
12. Purohita R., Purohitb K., Rana S., Rana R.S. and Patel V., 2014. Carbon nanotubes and their growth methods. Procedia Materials Science, 6,
716-728.
13. Corso D., Crup I., Ammendola G., Lombardo S. and Gerardi C., 2003. Programming options for nanocrystal MOS memories. J Mater Sci Eng,
23, 687-689.
14. Stanford University, 2008. A 1 GHz integrated circuit with carbon nanotube interconnects and silicon transistors:
http://nano.stanford.edu/publication.php?id=135 (Accessed on 21st April, 2019).
15. Nantero, 2006. Press release: Nantero announces routine use of nanotubes in production CMOS fabs. Carbon nanotube electronics era has
begun: http://www.nantero.com/pdf/Press_Release_11_06%20.pdf (Accessed on 3rd May, 2019).
16. Endo M., Hayashi T., Kim Y.A. and Muramatsu H., 2006. Development and application of carbon nanotubes. Japanese J Appl Phys, 45 (6A),
4883-4892.

Proceedings of the 2019 International Science Conference Innovation and Advancement in Nanoscience and Nanotechnology, Federal University Oye-Ekiti (www.fuoye.edu.ng), 2019.
64
Foliar Anatomy of the Genus Pterocarpus Jacq. (Papilionaceae) in Nigeria
Chukwuma Deborah Moradeke1,*, Ayodele Abiodun Emmanuel2
1Department of Plant Science and Biotechnology, Federal University Oye-Ekiti, Oye-Ekiti, Nigeria 2Department of Botany, University of Ibadan, Ibadan, Oyo State, Nigeria
Abstract
Comparative foliar anatomical study of six species of the genus Pterocarpus was carried out with a view to elucidating their
taxonomic significance in their proper identification. Fresh leaves of the six indigenous species - Pterocarpus osun, P. erinaceus, P.
mildbraedii, P. soyauxii, P. lucens and P. santalinoides were obtained from different geographical locations in Nigeria. Stripes of
epidermal layers were obtained from the adaxial and abaxial surfaces of the leaves and viewed under a light microscope. Quantitative
and qualitative characteristics such as, epidermal cell shape, epidermal length and width, cell wall thickness, number and type of
stomata, stomata length and width amongst others were carefully studied. Findings showed that epidermal cell shapes were polygonal
and irregular in all except P. soyauxii and P. mildbraedii where they were predominantly irregular. Stomata were generally
anomocytic and observed on abaxial surfaces alone except in P. mildbraedii where it was present on both surfaces, that is, P.
mildbraedii is amphistomatic. Grandular trichomes were observed on the abaxial surfaces of P. osun, P. soyauxii and P. lucens. The
number of stomata vary with as much as 114 per mm2 (P. lucens) and fewer trichomes, just about 1 - 19 per mm2. The length of the
cells ranges between 14.3 µm (P. santalinoides) and 67.9 µm (P. erinaceus). The dendrogram generated from the observed characters
divides the genus into three groups - P. osun, P. soyauxii and P. lucens (group 1), P. erinaceus and P. santalinoides (group 2), and P.
mildbraedii (group 3) as a distinct species from the others.
Keywords: Foliar, adaxial, abaxial, trichomes, dendogram
1 Introduction
The genus Pterocarpus Jacq. is pantropical comprising trees and belongs to the family Papilionaceae or Fabaceae, subfamily
Faboideae, and monophyletic clade Pterocarpus within the tribe Dalbergieae [1]. The word “Pterocarpus” is derived from two Greek
words: “pteron” (wing) and “karpos” (fruit) [2] which refers to the unusual shape of the seed pods of members of this group.
According to Lavin et al. [3], root nodules of the members of this tribe are distinctive and therefore referred to as an
"aeschynomenoid" or "dalbergioid" nodule. Pterocarpus legumes were circumscribed as a pantropical group of Papilionaceae or
Fabaceae based on molecular and morphological data [4]. They grow in a variety of habitat, including moist and dry tropical forests,
savannas, costal dunes and rocky outcrops and contain a number of woody life forms such as shrubs, tree and climbing lianas as noted
by De Carvalho [5]. Among flowering plants, the Fabaceae (Leguminosae) is the third largest family with over 19,300 species found
in the world’s vegetation types. In Nigeria, it is the largest family comprising 143 genera and 529 species [6]. Vatanparast et al. [7]
reported the exceptionally high economic and ecological importance of dalbergioid legumes because they are sources of food, fodder,
woods, fuels, medicines and their ability to enrich soils. A valuable timber known as paduak (or paduok) is produced by most species
of Pterocarpus [2] and these timbers are prized for their hardiness, firmness in use and in decorations. Their woods contain water- or
alcohol-soluble substances that can be used as dyes [5]. However, there is dearth of information on the taxonomic characters of
members of this genus occurring in Nigeria except for a few work done on some of their economic properties. Avwioro et al. [8]
discussed the staining ability of P. osun on tissue sections, while Ajiboye et al. [9] reported its free radical scavenging property. In
2011, Abubakar et al. [10] described the antifungal potential of P. erinaceus. Ndukwe and Ikpeama [11] examined the phytochemical
and proximate constituents of the leaves of P. soyauxii and P. santalinoides amongst others.
A total of 35 species of Pterocarpus are currently accepted with six of these existing in West Africa and all six indigenous to Nigeria
[6, 12, 13]. These include Pterocarpus erinaceus Poir., Pterocarpus lucens Lepr. ex Guill. et Perr., Pterocarpus milbraedii Harms,
Pterocarpus osun Craib, Pterocarpus santalinoides L’Her. ex DC. and Pterocarpus soyauxii Taub. These species have not been
adequately studied for their taxonomic characters; hence, the present study identifies, scrutinizes and evaluates the epidermal layers of
these underutilized legumes in an attempt to clarify the similarities, differences and distinctiveness from each other.

Proceedings of the 2019 International Science Conference Innovation and Advancement in Nanoscience and Nanotechnology, Federal University Oye-Ekiti (www.fuoye.edu.ng), 2019.
65
2 Materials and Methods
2.1 Chemicals and Reagents
All chemicals and reagents used in the study were obtained from the Department of Plant Science and Biotechnology, Federal
University Oye-Ekiti, Ekiti and these include concentrated nitric acid (100% HNO3), concentrated ethanol (100% C2H5OH), safranin
O, glycerol, and distilled water.
2.2 Collection of samples
Fresh leaves of each species were collected from different locations and vegetative zones across Nigeria. Pterocarpus mildbraedii and
P. soyauxii were collected from Umauhia (Abia State), P. erinaceus and P. santalinoides from Olokemeji (Ogun State), P. osun from
the Aboretum of Forestry Research Institute of Nigeria, Ibadan (Oyo State) while P. lucens was from Mokwa (Niger State). All
collected samples were carefully identified at the Forest Herbarium Ibadan [14].
2.3 Epidermal preparations
All leaves of individual species were separately revived in boiling water for 30 minutes, with average heat intensity. Thereafter, about
2-5 cm2 of three pieces each of the specimens from the standard median portion were cut and soaked in separate Petri dishes
containing concentrated solution of nitric acid, and then placed under the sun for about 2-3 hr to allow tissue disintegration. The
samples were transferred unto a clean Petri dish and carefully rinsed in distilled water, before the epidermises were separated using a
pair of camel brush which had been moistened in water. Debris and skeleton of veins were brushed off carefully from the epidermal
layers. The separated tissues/epidermises (adaxial and abaxial layers) were then transferred to different Petri dishes containing
distilled water, with each labeled appropriately and again rinsed. Unused tissue sections were transferred to vials (specimen bottles)
containing 50% ethanol, indicating the adaxial tissues and abaxial tissues separately for all plant leaves [15, 16].
2.4 Mounting of tissues
Abaxial and adaxial tissues were stained with safranin O for about 2-3 minutes, and rinsed in continuous changes of distilled water to
remove excess stain. Afterwards, they were carefully mounted in 15% glycerol unto clean microscopic glass slides, covered with
cover slips and the edges ringed with nail vanish to prevent dehydration. All microscopic slides were appropriately labeled for each
species, and studied under Olympus light microscopes at different magnifications. Observations were taken from 20 different fields of
view, while photo-micrographic images were taken with an attached camera mounted on the light microscope [16, 17].
2.5 Data Analysis
A dendrogram was generated using Minitab 17.0 to further reveal the level of relatedness among the species studied, based on the
foliar micro-characters identified.
3 Results and Discussion
The qualitative result shows that there are similarities among the six species of Pterocarpus studied (Table 1). It was also observed
that P. erinaceus, P. santalinoides and P. lucens possess thin-walled, irregular straight walls on both the adaxial and abaxial surfaces;
P. mildbraedii has thin-walled, irregular straight walls only on the adaxial surface; P. osun and P. soyauxii possess thin-walled
irregular wavy walls on both adaxial and abaxial surfaces while P. mildbraedii possesses thin-walled wavy walls on the abaxial
surface. All six species possess anomocytic stomata (i.e. the surrounding epidermal cells have no special arrangement, they are all
similar and there are no subsidiary cells, so all the cells are normal epidermal cells without any modification) and are hypostomatic
(they possess stomata on the abaxial surface only) except P. mildbraedii (Table 1 and Plate 2).
Some of the species studied possess grandular trichome on abaxial surfaces, while some lack trichome completely (Plate 1). Metcalfe
& Chalk [18] reported that trichomes have been used widely for taxonomic purposes. It has been used in the classification of genera
and even some certain families. Trichome plays a vital role in plant defense, protection of parts and help in retention of moisture on
the plant body. The result of the qualitative anatomical attributes of species considered in this study does not show much variation
among the species.

Proceedings of the 2019 International Science Conference Innovation and Advancement in Nanoscience and Nanotechnology, Federal University Oye-Ekiti (www.fuoye.edu.ng), 2019.
66
Table 1. Qualitative characteristics of foliar epidermal surfaces of Pterocarpus species
Species Surface Stomata type Shape of epidermal cell
P. erinaceus Abaxial Anomocytic Thin-walled, irregular straight walls
Adaxial Absent Thin-walled, irregular straight walls
P. lucens Abaxial Anomocytic Thin-walled, irregular straight walls
Adaxial Absent Thin-walled, irregular straight walls
P. mildbraedii Abaxial Anomocytic Thin-walled,irregular wavy walls
Adaxial Anomocytic Thin-walled, irregular straight walls
P. osun Abaxial Anomocytic Thin-walled, irregular wavy, walls
Adaxial Absent Thin-walled, irregular wavy, walls
P. santalinoides Abaxial Anomocytic Thin-walled, irregular straight walls
Adaxial Absent Thin-walled, irregular straight walls
P. soyauxii Abaxial Anomocytic Thin-walled, irregular wavy, walls
Adaxial Absent Thin-walled, irregular wavy, walls
Table 2. Quantitative characteristics of foliar epidermal surfaces of Pterocarpus species
Species Surface
Cell
length
(µm)
Cell width
(µm)
Cell wall
thickness
(µm)
No. of
stomata/m
m2
Stomata
length
(µm)
Stomata
width
(µm)
No. of
trichome/
mm2
Trichome
length (µm)
P. erinaceus
Abaxial 24.7-67.9
35.0±3.9
9.3-17.7
13.1±0.8
1.6-3.3
2.4±0.2
38-59
46.5±1.8
13.1-17.2
15.2±0.4
5.6-10.6
7.1±0.5
4-8
5.5±0.4
63.1-113.4
86.1±4.7
Adaxial 18.5-33.7
28.2±1.5
12.0-23.4
17.2±0.9
1.4-3.9
2.8±0.2 - - - - -
P. lucens
Abaxial 17.7-30.3
24.4±1.3
6.1-10.3
9.4±0.8
1.3-3.8
2.2±0.2
71-114
92.1±4.4
10.0-14.9
12.2±0.4
8.6-10.2
9.6±0.2
11-19
13.9±0.9
42.7-124.1
74.0±8.5
Adaxial 22.5-34.6
28.5±1.3
12.9-19.9
15.3±0.7
1.2-1.7
1.5±0.1 - - - - -
P. mildbraedii
Abaxial 32.2-61.9
51.9 ±2.5
19.3-39.4
28.9±2.1
0.4-1.4
1.0±0.1
0-2
1.2±0.2
27.3-33.5
30.1±0.6
14.3-19.2
16.9±0.4 - -
Adaxial 38.0-62.0
47.6±2.3
18.2-41.6
26.5±2.0
1.3-2.8
1.9±0.2
5-11
8.7±0.6
25.9-36.5
31.2±1.0
14.4-23.5
18.9±0.8 - -
P. osun
Abaxial 17.6-34.0
27.3±1.7
8.9-16.7
13.3±0.9
0.9-3.2
1.9±0.3
25-37
32.5±1.2
15.2-19.2
17.0±0.4
7.3-11.1
9.6±0.4
1-4
2.0±0.3
116.1-183-9
145.0±7.6
Adaxial 22.6-42.1
33.2±2.0
13.9-27.0
18.7±1.2
1.1-2.9
2.0±0.2 - - - - -
P. santalinoides
Abaxial 14.3-35.5
26.9±2.1
10.4-16.6
13.3±0.7
0.8-2.0
1.4±0.1
35-56
43.1±1.8
16.5-21.7
18.1±0.5
7.2-12.2
8.7±0.3
1-2
1.2±0.1
42.3-88.2
68.7±7.2
Adaxial 25.3-44.5
36.5±1.9
19.1-26.1
21.3±0.7
0.9-3.2
1.7±0.3 - - - - -
P. soyauxii
Abaxial 19.5-39.6
25.8±2.4
9.9-21.4
15.2±1.1
1.1-2.7
1.8±0.2
35-50
42.2±1.7
14.9-20.7
17.9±0.8
9.8-12.4
11.1±0.3
1-2
1.3±0.2
51.6-250.9
128.7±20.6
Adaxial 25.6-39.3
31.0±1.4
12.7-23.9
18.6±1.1
1.6-3.3
2.5±0.2 - - - - -
Key: measurements presented as: min – max above, mean ± standard error beneath
However, results of the quantitative characteristics such as the cell length, cell width, cell wall thickness, number of stomata, stomata
length, stomata width, number of trichome and trichome length (Table 2) show that there are differences among the species studied.
On the abaxial surface, P. erinaceus has the longest epidermal cell (67.7 µm) but P. mildbraedii has the highest mean value (51.9 µm).
However, on the adaxial surface, P. mildbraedii has the longest cell (62.0 µm) as well as the highest mean value (47.6 µm). The
species with the thickest cell wall are P. lucens (3.8 µm on the abaxial surface) and P. erinaceus (3.9 µm on the adaxial surface).

Proceedings of the 2019 International Science Conference Innovation and Advancement in Nanoscience and Nanotechnology, Federal University Oye-Ekiti (www.fuoye.edu.ng), 2019.
67
Fig. 1. Dendrogram of species based on complete linkage and Euclidean distance
Plate 1. Photomicrographs of Abaxial surfaces of Pterocarpus species studied x40. A - P. erinaceus ; B - P. lucens ; C - P. mildbraedii ; D - P. osun :
E - P. santalinoides ; F - P. souyauxii
P. mildbraediiP. soyauxiiP. osunP. lucensP. santalinoidesP. erinaceus
0.00
33.33
66.67
100.00
Species
Similarity

Proceedings of the 2019 International Science Conference Innovation and Advancement in Nanoscience and Nanotechnology, Federal University Oye-Ekiti (www.fuoye.edu.ng), 2019.
68
Plate 2. Photomicrographs of Adaxial surfaces of Pterocarpus species studied x40. A - P. erinaceus ; B - P. lucens ; C - P. mildbraedii ; D - P. osun :
E - P. santalinoides ; F - P. souyauxii
The highest number of trichomes was observed on the abaxial surface of P. lucens, which was between 11 and 19, while P.
mildbraedii was completely void of trichome. Further illustrations shown in Figure 1 revealed that P. osun and P. soyauxii appears to
be the close species based on the micro-characters observed in this study. This is closely followed by P. erinaceaus and P.
santalinoides but these two species also share some affinity with P. lucens. Nevertheless, P. mildbraedii appears to be an outlier as it
occupies an extreme position on the dendrogram.
According to Adedeji and Jewoola [19], foliar anatomy is one of the most noteworthy taxonomic characters which have been used
extensively in taxonomic studies of families and genera. Rejdali moh [20] noted that any taxonomic monographs produced without
including the microscopic features of the epidermis may be regarded as incomplete. Leaf epidermal characters are of great taxonomic
importance [15, 21], and this had earlier been reviewed by some workers [22, 23]. In the course of this study, the use of light
microscope has made it possible to evaluate foliar features such as shape of epidermal cells, stomata and trichome types.
4 Conclusion
This study has shown that the genus Pterocarpus exhibits some interesting micro-characteristics that could be useful in species
identification especially in fragmentary conditions. All the qualitative foliar characters observed on both adaxial and abaxial leaf
surfaces of the species studied showed significant similarities. The species are hypostomatic except P. mildbraedii. The fact that these
epidermal attributes show significant similarities among the six species is an indication that all the traits are good taxonomic
indicators. Findings have shown that the examined species are likely to share common ancestors, which corroborates the fact that the
genus is a monophyletic clade.

Proceedings of the 2019 International Science Conference Innovation and Advancement in Nanoscience and Nanotechnology, Federal University Oye-Ekiti (www.fuoye.edu.ng), 2019.
69
References
1. Cardoso D., Pennington R.T., de Queiroz L.P., Boatwright J.S., Van Wyk B-E, Wojciechowskie M.F. and Lavin M., 2013. Reconstructing the
deep-branching relationships of the papilionoid legumes. S Afr J Bot, 89, 58-75.
2. Thomson, Lex A.J., 2006. Species profiles for Pacific island agroforestry, ver. 2.1 www.traditionaltree.org
3. Lavin M., Pennington R.T., Klitgaard B.B., Sprent J.I., de Lima H.C. and Gasson P.E., 2001. The dalbergioid legumes (Fabaceae): delimitation
of a pantropical monophyletic clade. Am J Bot, 88 (3), 503-533.
4. Lavin M., Thulin M., Labat J. and Pennington R., 2000. Africa, the odd man out: molecular biogeography of dalbergioid legumes (Fabaceae)
suggests otherwise. Sys Bot, 25, 449-467.
5. De Carvalho A.M., 1997. A synopsis of the genus Dalbergia (Fabaceae: Dalbergieae) in Brazil. Brit, 49, 87-109.
6. Ayodele A.E. and Yang Y., 2012. Diversity and distribution of vascular plants in Nigeria. Qingdao Publishing House, Qingdao, China. pp.350.
7. Vatanparast M., Klitgaard B.B., Adema Frits A.C.B. and Pennington R.T., 2013. First molecular phylogeny of the pantropical genus Dalbergia:
Implications for infrageneric circumscription and biogeography. S Afr J Bot, 89, 143-149.
8. Avwioro O.G., Aloamaka P.C., Ojianya N.U., Oduola T. and Ekpo E.O., 2005. Extracts of Pterocarpus osun as a histological stain for collagen
fibres. Afr J Biotech, 4 (5), 460-462.
9. Abubakar K., Halilu M.E., Jimoh A.O. and Hudu A.S., 2011. Preliminary phytochemical and antifungal screening of the aqeous extract of leaves
of Pterocarpus erinaceous. Research Journal of Pharmacology, 5 (3), 40-42.
10. Ajiboye T.O., Salau A.K., Yakubu M.T., Oladiji A.T., Akanji M.A. and Okogun J.I., 2010. Acetaminophen perturbed redox homeostasis in
Wistar rat liver: protective role of aqueous Pterocarpus osun leaf extract. Drug and Chemical Toxicology, 33(1), 77-87.
11. Ndukwe O.K. and Ikpeama A., 2013. Comparative evalutation of the phytochemical and proximate constituents of OHA (Pterocarpus soyansii)
and Nturukpa (Pterocarpus santalinoides) leaves. International Journal of Academic Research in Progressive Education and Development 2(3),
22-31.
12. Keay R.W.J., 1989. Trees of Nigeria. A revised version of Nigerian trees (1960, 1964) by R.W.J. Keay, C.F.A. Onochie and D.P. Stanfield.
Clarendon Press, Oxford, United Kingdom. pp. 476.
13. Soladoye M.O. and Lewis G.P., 2003. A checklist of Nigerian Legumes. Center for Environmental Research and Development (CENRAD),
Ibadan. pp. 141.
14. Holmgren P.K., Keuken W. and Schofield E.K., 1990. Index Harbariorum Part I. The Herbaria of the World. 8th ed. Reg. Veg., New York.
15. Adedeji O. and Illoh H.C., 2004. Comparative foliar anatomy of ten species in the genus Hibiscus Linn. in Nigeria. New Botanist, 31, 147-180.
16. Chukwuma D.M. and Ayodele A.E., 2016. Taxonomic studies of the genus Tephrosia Pers. (Papilionaceae) in Nigeria. Pl Sci Today, 3(1), 9-18.
17. Chukwuma E.C., Soyewo L.T., Okanlawon T.F. and Ugbogu O.A., 2017. Foliar and petiole anatomy of Pterygota (Sterculioideae; Malvaceae)
species and their distribution in Nigeria. Anales de Biología, 39, 103-109.
18. Metcalfe C. R. and Chalk L., 1979. Anatomy of the dicotyledons. Vol. 2, Oxford U.K.
19. Adedeji O. and Jewoola O.A., 2008. Importance of Leaf Epidermal Characters in the Asteraceae Family. Not Bot Hort Agrobot, 36 (2), 7-16.
20. Rejdali moh F.L.S., 1991. Leaf micromorphology and taxonomy of North African species of Sideritis L. (Lamiaceae). Bot J Linn. Soc, 107, 67-
77.
21. Jayeola A.A., Thorpe J. R. and Adenegan J.A., 2001. Macromorphological and micromorphological studies of the West African Rhizophora L.
Feddes Repertorium 112, 349-356.
22. Wilkinson H.P., 1979. The plant surface (mainly leaf). In Metcalfe, C.R. and Chalk, L. (eds.) Anatomy of the dicotyledons, Oxford: Clarendon
Press. pp. 97-165.
23. Stace C.A., 1989. Plant taxonomy and biosystematics, London: Edward Arnold Publishers, pp. 264.

Proceedings of the 2019 International Science Conference Innovation and Advancement in Nanoscience and Nanotechnology, Federal University Oye-Ekiti (www.fuoye.edu.ng), 2019.
70
Molecular Interaction of GC-MS Products of Trichosanthes cucumerina and Solanium
lycopersicum with Selected Enzymes in Drosophila melanogaster
Adeniran O.Y.*
Department of Biochemistry, Adekunle Ajasin University, Akungba Akoko, Ondo State, Nigeria [email protected]
Abstract
Medicinal plants have historically proven their values as a source of molecules with therapeutic potential. These natural products
possess enormous structural and chemical diversity that may have adverse effect on the body tissues. This study therefore sought to
examine the molecular interactions between the phytochemical compounds present in Snake tomato (Trichosanthes cucumerina),
Hausa and Yoruba strains of tomatoes (Solanum lycopersicon esculentum spp.) and some selected enzymes in Drosophila
melanogaster. Antioxidant enzymes (superoxide dismutase (SOD), catalase (CAT)), glycerol-3-phosphate dehydrogenase and
insulin-like receptor which represent a complex class of proteins (receptors) were modelled into 3 dimensional structures using the
automated homology modeling by computational method. S. lycopersicum and T. cucumerina were subjected to GC/MS analyses that
generate compounds (ligands) with varying glide score. The ligands prepared were docked into the receptors. Cytidine, phenylglyoxal
and nonanoic acid were found to exhibit great pharmacological potential based on the insilico study as attested to by the binding
affinity which predicts the strength of the molecular interaction of the ligand-protein complex and significantly satisfied the Lipinski's
rule of five as to their drug-likeness with less side effect. Hence, they are presented to the scientific community for further
investigational confirmation.
Keywords: Phytochemicals, tomato, GC-MS, molecular docking, Drosophila melanogaster
1 Introduction
Nutrition plays a role in the prevention of diabetes and chronic diseases related to oxidative stress such as cancer, cardiovascular,
neurodegenerative, or inflammatory diseases [1]. Epidemiological studies have shown that regular consumption of plant-foods, which
are natural sources of dietary antioxidants, is associated with reduced risk of such diseases [2]. From various researches, it has been
proposed that the antioxidant potential of foods and diets may arise from additive and synergistic actions of the different anti-oxidant
phytochemicals present in the food matrix [3]. Tomato (Solanum lycopersicum) is one of the most consumed vegetables in the world.
In recent decades, its consumption has been associated with the prevention of several diseases mainly due to its content of
antioxidants, including carotenes (lycopene as well as β-carotene), ascorbic acid, tocopherol, and phenolic compounds [4]. Snake
tomato (Trichosanthes cucumerina) is an underutilized plant in Asia and Africa, which has gained popularity for its low cost of
cultivation, rapid growth, health promotion, and as suitable replacement for Lycopersicum esculentum in many countries of Africa [5,
6]. The fruit fly, Drosophila melanogaster is chosen as an experimental model in biological research as it shares many genes that are
orthologous to humans [7].
Molecular docking, an in silico technique enables the extraordinary structural diversity of natural products to be harnessed in an
efficient manner. It aids in virtual screening for the identification of bioactive molecules from natural product databases. To the best of
my understanding, there is no readily available information in the literatures on the possible interactions of the compounds in these
fruits with biological proteins/enzymes. This study is designed to reveal such interactions and possible therapeutics agent(s) among
these compounds.
2 Materials and Methods
2.1 Protein Preparation for Docking
The crystallized form of the protein was taken from the Protein Data Bank (PDB) repository, co-crystallized with homo-sapiens
(http://www.rcsb.org/). The complete sequence of the protein was gotten from Pubmed fasta file, and modelled in 3-Dimensional
structure using the automated homology modelling known as Swiss model [8]. The 3D-modelled structure was downloaded and
extracted as separate file for docking. Water and ligand coordinate were deleted; the active site of the protein was identified using

Proceedings of the 2019 International Science Conference Innovation and Advancement in Nanoscience and Nanotechnology, Federal University Oye-Ekiti (www.fuoye.edu.ng), 2019.
71
Pymol Autodock vina [9] to visualize the interaction of the co-crystallized ligand when docked into the protein’s active site to get the
binding affinity.
2.2 Creating Ligands Library
The GC-MS products of Trichosanthes cucumerina roots and Lycopersicum esculentum fruits were downloaded [10]. A library of
these compounds was prepared by Marvinsketch. The 2D structure of the ligands were retrieved from the NCBI PubChem database
and saved in a folder. The folder was catenated in the 3D pdb format.
2.3 Molecular Docking of Ligands
Molecular docking methods are commonly used for predicting binding modes to proteins and energies of ligands [11]. Active sites
were generated for binding of ligands and receptor using BSP-SLIM on line (job i.d Q440, Q443). Using the Autodock vina [12]
compiled under Ubuntu 14.04 LTS, the ligands were docked into the orthoseric site to get the respective binding affinity. The binding
affinity predicts the strength of the molecular interaction of the ligand-protein complex.
2.4 Docking Receptor-Ligand Complex Structure
The binding results were validated using the ChEMBL Database. The fasta file gotten from Pubmed was blasted on
www.ebi.ac.uk/chembl/ and the search result with chembl ID of 210 was downloaded in the txt format, using the EC50 chembl
activity type. The smile format of the compounds was converted to sdf using Data warrior software and saved as 2D. These 2D
structures were converted to pdb and pdbqt using babel and lig prep command lines, respectively to generate the 3D structures of the
compounds.
3 Result and Discussion
Tomatoes are of great economic importance because of their use not only as food but as a major source of therapeutic active
compounds used in the treatment of the various diseases of man and animal. Tomato possess a wide range of biological and
pharmacological activities such as anti-cancer, anti-inflammatory, diuretic, oxytocic, laxative, antispasmodic, anti-hypertensive, anti-
diabetic, anti-microbial [13] and anti-asthmatic properties [14]. Molecular docking of the phytochemical extracts of Trichosanthes
cucumerina and Solanium lycopersicum into four different enzymes (Catalase, Insulin-like-receptor, Sod and G3PDH) showed the
prescence of some very active compounds. Table 1and 2 show relative docking scores of the phytochemicals compared to the normal
substrate/ligands. Among these compounds, cytidine had lower docking score and hence higher affinity which has potential of
modulating the target enzymes [15].
Table 1. Docked results of Trichosanthes cucumerina and Solanium lycopersicum phytochemicals to modelled structure of catalase
Compound Name Docking score (Kcal/mol)
Standard
Phytol acetate
-5.532
-7.723
Henecosanoic acid methyl ester -7.077
Cytidine -6.707
Hepto acetate -6.686
1-Naphthalene acetic acid -6.454
Phenylglyoxal -6.409
Lavandulyl acetate -5.692
1,1-Dimethyl-3-dueteriopropyl thioether -5.514
Heptacosanol -5.054
Azulene -4.793
3-Buten-1-01,2-phenyl -4.735
2,3-Heptanodione -4.446
2-phenyl ester -4.429
Isopropylbenzene -4.423
Hept-enyl-2-acetate -4.339
Ethylcyclohexane -4.034
2-Methyl-4,6-octadiyn-3-one -3.789

Proceedings of the 2019 International Science Conference Innovation and Advancement in Nanoscience and Nanotechnology, Federal University Oye-Ekiti (www.fuoye.edu.ng), 2019.
72
Table 2. Docked results of Trichosanthes cucumerina and Solanium lycopersicum phytochemicals to modelled structure of Insulin-like receptor
Compound Name Docking score (Kcal/mol)
Standard
Cytidine
-4.3201
-5.205
Phenylglyoxal -2.958
3-Buten-1-01,2-phenyl -2.656
1,1-Dimethyl-3-dueteriopropyl thioether -2.287
2-phenyl ester -2.233
Lavandulyl acetate -1.977
Isopropylbenzene -1.948
2,3-Heptanodione -1.873
Ethylcyclohexane -1.855
Neopentyl alcohol -1.541
3-Hexen-2-one -1.422
3-Buten-1-01,2-phenyl -1.298
Isooctane -1.232
Hept-enyl-2-acetate -1.23
3-Methylheptane -0.503
Azulene -0.436
1-Naphthalene acetic acid -0.166
2-Methyl-4,6-octadiyn-3-one -0.044
Table 3. Pharmacological properties of Trichosanthes cucumerina and Solanium lycopersicum phytochemicals
M.W: Molecular Weight of compounds; DonorHB: Hydrogen Bond donor; AcceptHB: Hydrogen Bond acceptor; QPlogPo/w: octanol/water partition
coefficient; HOA: Human Oral Absorption. 1, 2, or 3 for low, medium, or high; QPlogBB: Prediction of blood-brain barrier penetration (Normal
range between -3.0 to 1.2); QPlogKsha: Prediction of binding to human serum albumin (Normal range between -1.5 to 1.5); ROF: Rule of Five
Violation.
Compound Names
mol
MW DHB AAcceptHB P QPlogPo/w QPlogBB QPlogKhsa HOA ROF
1-Naphthalene acetic acid 186.21 1 2 2.644 -0.339 -0.245 3 0
1,1-Dimethyl-3-dueteriopropyl
thioether 180.307 0 0.5 3.535 0.385 0.366 3 0
2-Methyl-4,6-octadiyn-3-one 134.177 0 2 2.155 0.024 -0.199 3 0
2-phenyl ester 164.204 0 2 2.475 -0.237 -0.088 3 0
2,3-Heptanodione 128.171 0 4 0.494 -0.415 -0.949 3 0
3-Buten-1-01,2-phenyl 148.204 1 1.7 2.614 -0.064 -0.223 3 0
3-Hexen-2-one 98.144 0 2 1.285 0.013 -0.572 3 0
3-Methylheptane 114.23 0 0 4.727 0.964 0.205 3 0
9-Octadeconioc acid 282.465 1 2 5.847 -0.9 0.606 3 1
Azulene 128.173 0 0 3.315 0.426 0.14 3 0
Cytidine 243.219 5 10.8 -2.063 -1.999 -0.895 2 0
Ethylcyclohexane 112.214 0 0 4.074 0.891 0.165 3 0
Henecosanoic acid methyl ester 340.588 0 2 7.759 -1.368 1.664 1 1
Hept-enyl-2-acetate 156.224 0 2 2.601 -0.323 -0.036 3 0
Heptacosanol 396.739 1 1.7 9.47 -1.79 2.117 1 1
Hexyl propionate 158.24 0 2 2.746 -0.354 -0.025 3 0
Isooctane 114.23 0 0 4.181 0.908 0.208 3 0
Isopropylbenzene 120.194 0 0 3.308 0.526 0.168 3 0
Lavandulyl acetate 196.289 0 2 3.348 -0.251 0.273 3 0
Methyl 15-methylhexadecanoate 284.481 0 2 6.103 -0.992 1.14 1 1
Methyl tridecanoate 228.374 0 2 4.616 -0.703 0.592 3 0
Neopentyl alcohol 104.149 2 3.4 -0.117 -0.328 -0.802 3 0
Neophytadine 278.52 0 0 9.453 1.486 1.688 1 1
Nonanoic acid 158.24 1 2 2.642 -0.815 -0.324 3 0
Octadenioc acid methyl ester 298.508 0 2 6.602 -1.152 1.278 1 1
Pentadecanal 226.401 0 2 4.678 -1.018 0.589 3 0
Phenylglyoxal 134.134 0 4 0.165 -0.482 -1.05 3 0
Phytol acetate 338.573 0 2 7.299 -1.076 1.681 1 1
Tridecanal 198.348 0 2 3.841 -0.868 0.309 3 0

Proceedings of the 2019 International Science Conference Innovation and Advancement in Nanoscience and Nanotechnology, Federal University Oye-Ekiti (www.fuoye.edu.ng), 2019.
73
Fig. 1. Binding pose of cytidine with modelled structure of Insulin-like receptor
Lipinski's rule of five also known as the Pfizer's rule of five or simply the rule of five (RO5) is a rule of thumb to evaluate drug-
likeness or determine if a chemical compound with a certain pharmacological or biological activity has chemical properties and
physical properties that would make it a likely orally active drug in humans [16]. Based on the observation that most orally
administered drugs are relatively small and moderately lipophilic molecules, the rule describes molecular properties important for
drugs pharmacokinetics in the human body, including their absorption, distribution, metabolism, and excretion. Lipinski's rule states
that, in general, an orally active drug has no more than one violation of the following criteria: (a) No more than 5 hydrogen bond
donors (the total number of nitrogen – hydrogen and oxygen–hydrogen bonds); (b) No more than 10 hydrogen bond acceptors (all
nitrogen or oxygen atoms); (c) A molecular mass less than 500 daltons; (d) An octanol-water partition coefficient log P not greater
than 5.
Table 3 reveals the pharmacological properties of these compounds. Based on this set of rules and the molecular interaction with the
active site of the protein (Fig. 1), the following sets of compounds listed in Table 4 are the best set of compounds to evaluate for when
determining for drug-likeness or when determining if a chemical compound with a certain pharmacological or biological activity has
chemical properties and physical properties that would make it a likely orally active drug in humans. This conforms to similar research
by Metibomu et al. [17].
Table 4 Compounds with desirable pharmacological properties
Compound Name mol MW DonorHB AcceptHB QPlogPo/w QPlogBB QPlogKhsa HOA
Cytidine 243.219 5 10.8 -2.063 -1.999 -0.895 2
Nonanoic Acid 158.240 1 2 2.642 -0.815 -0324 3
Phenylglyoxal 134.134 0 0 0.165 -0.482 -1.05 3

Proceedings of the 2019 International Science Conference Innovation and Advancement in Nanoscience and Nanotechnology, Federal University Oye-Ekiti (www.fuoye.edu.ng), 2019.
74
4 Conclusion
These compounds can be suggested as a potent drug with less or no side effect. It is therefore proposed that T. cucumerina and S.
lycopersicum possess valuable nutraceutical properties that man must take advantage of.
References
1. Mursu J., Virtanen J.K., Tuomainen T.P., Nurmi T., Voutilainen S., 2014. Intake of fruit, berries, and vegetables and risk of type 2 diabetes in
Finnish men: The kuopio ischaemic heart disease risk factor study. Am J Clin Nutr, 9, 328–333.
2. Agbor G.A., Moumbegna P., Oluwasola E.O., Nwosu L.U., Njoku R.C., Kanu S., Emekabasi E.I., Akin F., Obasi A.P. and Abudei F.A.,.
2011. Antioxidant capacity of some plant foods and beverages consumed in the Eastern region of Nigeria. Afr J Tradit Complement Altern Med,
8(4), 362–369.
3. Wang L., Liu S., Manson J.E., Gaziano J.M., Buring J.E., Sesso H.D., 2012. The consumption of lycopene and tomato-based food products is
not associated with the risk of type 2 diabetes in women. Journal of Nutrition, 136, 620-625.
4. Panigrahy S.K., Bhatt R., and Kumar A., 2016. Reactive oxygen species: Sources, consequences and targeted therapy in type 2 diabetes. Journal
of Drug Targeting, 25, 1-9.
5. Adebooye O.C., Oloyede F.M., and Onagoruwa O.O., 2016. Fruit characteristics and nutrient composition of landrace morphotypes of snake
tomato. J Veg Sci, 11, 5-16.
6. Velioglu Y.S., Mazza G. and Oomah B. D., 1998. Antioxidant activity and total phenolics in selected fruits, vegetables and grain products. J
Agri Food Chem 46, 4113-4117.
7. Sandhya S., Vinod K., Chandra S., Aradhana R. and Vamshi S., 2010. An updated review on Trichosanthes cucumerina L. International Journal
of Pharmaceutical Sciences Review and Research, 1, 56-58.
8. Pandey U.B., Nichols C.D., 2011. Human disease models in Drosophila melanogaster and the role of the fly in therapeutic drug discovery.
Pharmacol Rev, 63(2), 411-36.
9. Bordoli L., Kiefer F., Arnold K., Benkert P., Battey J., Schede T., 2009. Protein structure homology using SWISS-MODEL workspace. National
Protocol 4(1), 1-13.
10. Ambethkar A. and Ananthalakshmi S., 2014. GC-MS analysis on the methanolic extract of Trichosanthes anguina L. root. Int J Pharm Life Sci,
5(3), 3389-3393.
11. Bikadi Z., Hazai E., 2009. Application of the PM6 semi-empirical method to modeling proteins enhances docking accuracy of AutoDock. J
Cheminf, 1, 1-15.
12. Trott O., Olson J.A., 2010. AutoDock Vina: improving the speed and accuracy of docking with a new scoring function, efficient optimization
and multithreading. Journal of Computational Chemistry, 31(2), 455-461.
13. Ammal M.R. and Bai V.S. 2013. GC-MS determination of bioactive constituents of Heliotropium indicum leaf. Journal of Medicinal Plants
Studies, 1(6), 30-33.
14. Ushasri S., Ranjith K.J., Sudha Bhargavi C.H., Spoorthi L. and Pushpa Sai A., 2013. Antiasthmatic herbal Drugs-A Compilation. International
Journal of Pharmaceutical and Chemical Sciences, 2(1), 383-392.
15. Adeniran O.Y. and Onigbinde A.O., 2018. Molecular docking study of secondary products of oxidized soy bean oil on selected tissue enzymes.
NISEB Journal, 18(2), 105-117
16. Lipinski C.A., Lombardo F., Dominy B.W and Feeney P. J. 2001. Experimental and computational approaches to estimate solubility and
permeability in drug discovery and development settings. Advanceed Drug Delivery Reviews, 46, 3-26.
17. Metibemu D.S. Adeniran O.Y., Akinsiku E.O., Akinloye O.A., Ugbaja R.N., Akamo A.J., Metibemu A.O., Olusola A.O. and Omotuyi I.O.,
2019. Homo Sapien Bcr-Abl-Interacting Scaffolds from Bryophyllum pinnatum and Cantharanthus roseus: Computational Studies NISEB
Journal, 19, 47-54.
.

Proceedings of the 2019 International Science Conference Innovation and Advancement in Nanoscience and Nanotechnology, Federal University Oye-Ekiti (www.fuoye.edu.ng), 2019.
75
Flownet Construction and its Hydrogeological Implications: A Case Study of Parts of
Ilorin Crystalline Rocks, Southwestern Nigeria
Olatunji J.A.1,3,*, Omonona O.V.2, Odediran O.A.1, Akinrinmade A.O.3, Olasehinde D.A.4
1Department of Minerals and Petroleum Resources Engineering Technology, Kwara State Polytechnic, Ilorin 2Department of Physics/Geology/Geophysics, Alex Ekwueme Federal University, Ndufu Alike Ebonyi
3Department of Geology and Mineral Science, Kwara State University Malete 4Department of Agricultural and Biosystems Engineering, Landmark University, Omu-Aran, Kwara State, Nigeria
Abstract
Water is considered an inevitable resource on which human life depends. Groundwater plays important roles in sustaining and
supporting human continuous existence. This study examined hydrogeological implications of flownet construction and analysis on
groundwater exploration. It is to ensure the delineation of appropriate locations that can be considered for further and more extensive
groundwater exploratory activities. This research has become necessary in view of the dwindling surface water sources and the wide
spread occurrences of borehole failure, both of which can be attributed to phenomena of climate change and the ever-increasing
exorbitant cost of dam construction and ancillary services. The area of study is underlain by crystalline rocks which consist of
migmatite - gneiss, banded gneiss, granite gneiss, augen gneiss, quartzites and granites. Static water levels, total depths and
coordinates of hand dug wells were measured using deep meter, GPS, and tape, respectively. Flownet is constructed by plotting flow
lines against equipotential lines orthogonally. Analysis and interpretation of flownet shows that the western part of the study area
which covers areas such as Olorunsogo, Agbooba and Gbagba have very wide divergent equipotential lines which imply easy
groundwater movement. The southeastern part which include places such as Oko-Erin, Baba-Ode, Gaa-Akanbi and northeastern parts
such as Fate, Tanke reflect convergent equipotential lines, an indication of difficulty (less permeable zones) in the water movement
within the media. The greater the distance between contours, the slower the flow. The primary technique of constructing the
groundwater flownet is considered basic since it is cheap and fast as a reconnaissance tool. Other exploratory activities are considered
after flownet construction. Generally, from hydrogeological point of view, the study area has been divided into divergent and
convergent areas using inferences from flownet construction and analysis.
Keywords: Flownet, equipotential lines, flowlines, convergent, divergent
1 Introduction
The evaluation of groundwater potential in the crystalline basement complex has been problematic due to the complex nature of rocks
and tectonic activities that have affected them [1, 2]. This study has become necessary in view of the dwindling surface water sources
in the face of climate change and economic recession militating against the construction and maintenance of surface water sources
through dams and weirs. The use of flownet analysis for aquifer identification was first proposed by Stallman [3]. Equipotentials are
the loci of points of equal potential (or head), and flow lines (or stream lines) correspond to directions of groundwater flow [4-6].
Constructing flownet map is a well-accepted practice in investigation of groundwater flow directions [7, 8]. Water table surface is a
representation of the surface of saturated zone, below which all the geological formation voids are fully filled with water [9]. The
position of the water table is as a result of natural processes controlling the rate at which water enters and leaves the saturated zone. If
the rate at which water enters the saturated zone (recharge) exceeds the rate of water leaving (discharge) the aquifer, the water table
rises and vice versa. The water table surface is not static, nor flat, but reflects the climatic, vegetative and geomorphic conditions. The
groundwater water table could be subdued replica of the land surface [10].
Rice et al. [11] employed graphical inverse method as a hydrogeological tool that can be used for site characterization and flow system
conceptualization, understanding and defining the subsurface geologic structures and flow system controls.

Proceedings of the 2019 International Science Conference Innovation and Advancement in Nanoscience and Nanotechnology, Federal University Oye-Ekiti (www.fuoye.edu.ng), 2019.
76
2 Materials and Methods
2.1 Study Location
The study location is parts of Ilorin metropolis (Fig. 1). The area is bounded by longitudes 4028’0’’E and 4038’0’’E and latitudes
8027’0’’N and 8034’15’’N. The area covered is about 242.79 km2. Weather condition in the region is of two broad types (i.e. rain
season and dry season). The rain season commences around March and ends in October with annual average rainfall of 1,200 mm,
while dry season begins in November and ends in March. The humidity ranges between 60 % and 89% and mean annual temperature
is between 270C and 30°C. The area is well drained by various streams and their tributaries. The tributaries show dendritic drainage
pattern. The main rivers are Asa and Agba Rivers, while minor rivers include Oyun and Aluko Rivers. The terrain is undulating and
dissected by rivers and streams. The highest altitude is about 1200 m above sea level corresponding to the top of Sobi Hill
(migmatite), while along major streams the altitude is about 250 m above sea level. The vegetation cover is basically Guinea savannah
with ruminant tropical forest [12].
Fig. 1. Map of Nigeria showing Ilorin, Kwara State Nigeria
2.2 Geology and Hydrogeology of Ilorin
The study area falls in the basement complex of Southwestern part of Nigeria, which is of Precambrian to lower Paleozoic in age [13,
14]. This Precambrian crystalline basement complex consists of gneisses and migmatities; metasediments i.e schists, quartzites and
metavolcanics; Pan-African (older) granite and late-stage minor pegmatitic and aplitic intrusives [15]. According to Olasheinde [16],
Ilorin is situated on the undifferentiated Precambrian Basement Complex rocks of granitic and metamorphic origin. These rocks
represent the deeper, fractured aquifer which is partly overlain by a shallow, porous aquifer within the lateritic soil cover [17]. The
rock units form part of the regional Southwestern highlands of Nigeria running NW-SE parallel to the River Niger [18, 17]. The
subsurface comprises the weathered, slightly weathered and fresh (fractured or unfractured) crystalline basement rocks. The oldest
rocks in the area comprise gneiss complex whose principal member is biotite-hornblende gneiss with intercalated amphibolites. This
underlies over half of the city. Other rock types are the older granite mainly porphiritic granite, gneiss and granite-gneiss and quartz
schist. Ilorin is underlain by crystalline rocks mainly gneisses and migmatite with pegmatite veins. Rock types within the study areas
include; migmatite- gneiss, banded gneiss, granite gneiss, augen gneiss, and quatzites granites as shown in Fig. 2 [19, 20].
2.3 Field Work
The coordinates and elevations of hand dug wells were measured with the aid of Garmin Global Positioning System (GPS). The static
water levels of the wells were also measured, and this helps to calculate the corrected water level in the subsurface. A total of 900
wells were covered to give information on the groundwater flow dynamics of the study area. Well positions and their respective
elevation relative to the main sea level were determined using (GPS). These helped in determining the hydraulic water head in wells
and thus groundwater head elevation contour which gave information on the groundwater flow direction.

Proceedings of the 2019 International Science Conference Innovation and Advancement in Nanoscience and Nanotechnology, Federal University Oye-Ekiti (www.fuoye.edu.ng), 2019.
77
Fig. 2. Geological map of Ilorin modified after NGSA 2007
3 Results and Discussion
3.1 Analysis and Evaluation of the Flownet
Well data collected from Ilorin metropolis were used to construct flownet for the study area. Fig. 3 shows the groundwater flow
direction of parts of Ilorin the study area. Under certain conditions such as homogeneous, isotropic and orthogonal system, the set of
equipotential lines and flow lines so exposed constitutes a flownet. From Fig. 3, it was observed that the western part of the study area
which covers area such as Olorunsogo, Agbooba and Gbagba has very high divergent equipotential lines which imply easy
groundwater movement while the southeastern and northeastern part reflect convergent equipotential lines, an indication of difficulty
in the water movement within the aquifer. This in turns implies less permeable zone. The greater the distance between contours, the
slower the flow. This supports the assertion by Sen [5]. Similarly, the southern part of the study area also shows closed equipotential
lines an indication of recharge (domes) or recharge zones (depression). This area is considered to be a depression otherwise a
catchment area where water collects and further exploratory activities can be concentrated [21-24].
Fig. 3. Flownet contour map analysis and evaluation
Fig. 3 shows the flownet constructed for study area and its hydrogeological implications. This helps in identification of divergent and
convergent areas within a location. Divergent areas have widely spaced equipotential lines while convergent areas have closely
spaced equipotential lines. The western part and the north southern parts of the study area which covers areas such as Olorunsogo,
Gbagba, Ogidi, Baba-ode and Opo-Malu have very high divergent equipotential lines which imply easy groundwater movement. The
greater the distance between contours, the slower the flow. Such areas are considered to be highly permeable, have better
accumulation and discharge rate and can be explored for further groundwater exploratory activities. Similarly, NE-SE parts of the
study area reflect a closely spaced equipotential lines otherwise refers to as convergent area, an indication of difficulty (less permeable
zones) in the water movement within the aquifer [5, 23]. Locations such as Tanke, Fate, Basin, Sango, part of Gaa-Akanbi, Kuntu,
Eko-Erin areas are considered to be within the convergent areas (Table 1).

Proceedings of the 2019 International Science Conference Innovation and Advancement in Nanoscience and Nanotechnology, Federal University Oye-Ekiti (www.fuoye.edu.ng), 2019.
78
Table 1. Flownet classification within the study area
Divergent areas Convergent Areas
Ogidi Fate
Akerebiata Agbabiaka
Baba –ode Oke-odo
Adewole Basin
Gbagba Gaa-akanbi
Okelele Tanke
Opo- malu Oke andi
Oko-erin Sango
Olorunsogo
4 Conclusion
The study examines the use of flownet construction analysis in aquifer identification and its hydrogeological implications in
groundwater exploration aimed at delineate an appropriate location that can be considered for further groundwater exploratory
activities. Static water levels, total depth, coordinates of hand dug well were measured using deep meter, GPS and tape, respectively.
From the data collected, analysis and interpretation of flownet shows that the western part of the study area which covers areas such as
Olorunsogo, Agbooba and Gbagba has very wide divergent equipotential lines which imply easy groundwater movement. The
southeastern part which include places such as Oko-Erin, Baba-Ode, Gaa-Akanbi and northeastern parts such as Fate, Tanke reflect
convergent equipotential lines, an indication of difficulty (less permeable zones) in the water movement within the media. The greater
the distance between contours, the slower the flow. The primary technique of constructing the groundwater flownet is considered basic
since it is cheap and fast as a reconnaissance tool. Other exploratory activities are considered after flownet construction. Generally,
from hydrogeological point of view, the study area has been divided into divergent and convergent areas using inferences from
flownet construction and analysis.
References
1. Olasehinde P.I., 2010. An integrated geological and geophysical exploration techniques for groundwater in the basement complex of West
Central part of Nigeria. Water Resources Journal of Nigerian Association Hydrogeologists, 10(1), 46-49.
2. Olasehinde P.I. and Bayewu O.O., 2011. Evaluation of electrical resistivity anisotropy in geological mapping: A case study of Odo Ara, West
Central Nigeria. African Journal of Environmental Science and Technology 5(7), 553-566.
3. Stallman, R.W. 1956 Numerical analysis of regional water levels to define aquifer hydrology. Transaction of the American Geophysical Union,
37(4), 451-460.
4. Ferris J.G, Knowles D.B., Brown R.H. and Stallman R.W., 1962. Groundwater hydraulics- theory of aquifer test. US Geological Survey Water
Supply Paper 1536E. pp 139-144.
5. Sen Z., 2015. Practical and applied hydrogeology. ITU Hydraulics Lab. Maslak, Istanbul, Turkey. First edition, pp. 47-100.
6. Auduson E.A., 2018. Concise applied geophysics: a practical approach. Delizon Publishers Limited. First Edition, pp. 241-246.
7. Braga A.C., Filho W.M. and Dourado J.C., 2006. Resistivity (DC) method applied to aquifer protection studies. Revista Brasileira deGeof´ısica,
24(4),573-581.
8. Driscoll, 1986. Groundwater and wells. Johnson Screens, St Paul FD (ed).
9. Heath R.C., 1988. Hydrogeologic settings of regions. In: Back W, Rosenshein J.S, Seaber P.R (eds) Hydrogeology. Geological Society of
America, Boulder.
10. Domenico P.A. and Schwartz F.W., 1990. Physical and chemical hydrogeology. Wiley, New York.
11. Rice W.A. and Gore lick S.M., 1985. Geologic inference from “flow net” transmissivity determination: Three case studies. Water Resources
Bulletin of the American Water Resources Association, 21(6), 919-930.
12. Abolarin A.T. and Ibrahim S., 2015. Evaluation of groundwater occurrences in the Precambrian Basement Complex of Ilorin metropolis,
Southwestern Nigeria. RMZ – M &G, 62, 117-132.
13. Rahaman M.A., 1976. Review of the basement geology of South-Western Nigeria. Geology of Nigeria (C.A. Kogbe, ed): Elizabethan Publishing
Co. Lagos.
14. Oluyide P.O., 1979. Report on the Igbeti Marble, Oyo State of Nigeria. Report GSN, 1569, (Unpublished).
15. Oluyide P.O, Nwajide C.S., and Oni A.O., 1998. The Geology of the Ilorin Area. Bulletin No. 42 of Geological Survey of Nigeria, Published by
Federal Government of Nigeria.
16. Olasehinde P.I., Virbka P. and Esan A., 1998. Preliminary results of hydrogeochemical investigations in Ilorin area, Southwestern Nigeria-
quality of hydrochemical analysis. Water Resources Journal of Nigerian Association of Hydrogeologist, 11, 55-61.
17. Annor A.E. and Olasehinde P.I. 1996. Vegetational niche as a remote sensor for subsurface aquifer: A geological-geophysical study in Jere area,
Central Nigeria. Water Resources Journal of Nigerian Association of Hydrogeologist, 7, 26-30.
18. Offodile M.E., 1987. An approach to groundwater study and development in Nigeria. Published by Mecon Services Ltd, Jos, Nigeria.

Proceedings of the 2019 International Science Conference Innovation and Advancement in Nanoscience and Nanotechnology, Federal University Oye-Ekiti (www.fuoye.edu.ng), 2019.
79
19. Olasehinde P.I., and Taiwo K.A., 2000. A correlation of schlumberger array geoelectric log with borehole lithologic log in South Western part of
Nigeria Basement Complex Terrain. Water Resources Journal of Nigerian Association Hydrogeologists,11, 55-61.
20. Nigerian Mining and Geosciences Society, 2018. Unlocking the investment opportunities in Kwara State through solid minerals development.
Workshop on Solid Minerals of Kwara State, Organized by Kwara State NMGS Chapter. Book of programme and proceedings, 2-20.
21. Afework D., 2011. Groundwater potential evaluation and flow dynamics of Hormat-Golina River Catchment, Kobo Valley, Northern Ethiopia,
Addis Ababa University.
22. Fetter C.W., 1994. Applied hydrogeology, 3rd ed. Macmillan College Publishing, Inc., New York, 616.
23. Fetter C.W., 2001. Applied hydrology. Prentice-Hall, inc. Upper Saddle River, New Jersey.
24. Genet M.M., 2017. Groundwater flow direction, recharge and discharge zones identification in lower Gidabo Catchment, Rift Valley Basin,
Ethiopia. Journal of Environment and Earth Science, 7(2), 32-39.

Proceedings of the 2019 International Science Conference Innovation and Advancement in Nanoscience and Nanotechnology, Federal University Oye-Ekiti (www.fuoye.edu.ng), 2019.
80
Trees and Shrubs of Oba Hills Forest Reserve, Osun State, Nigeria
Emmanuel C. Chukwuma1, Opeyemi A. Agbo-Adediran2, Deborah M. Chukwuma3,*
1Forest Herbarium Ibadan (FHI), Forestry Research Institute of Nigeria, Jericho Hill, Ibadan, Oyo State, Nigeria 2Department of Forestry Technology, Federal College of Forestry, Jericho Hill, Ibadan, Oyo State, Nigeria
3Department of Plant Science and Biotechnology, Federal University Oye-Ekiti, Ekiti State, Nigeria [email protected]
Abstract
Species composition and diversity were assessed in Oba hills forest reserve located in Osun State, Nigeria, in an attempt to update
existing records of the country’s flora diversity, following standard procedures. A preliminary survey of the ecosystem recorded 294
individual stands of 57 angiosperm species in 27 families, comprising trees and shrubs, with an average height and DBH of 41.2 m
and 9.3 cm, respectively. The trees dominated the list with 51 species while the shrubs had 6 species. The families Papilionaceae,
Mimosaceae and Combretaceae were the most represented, with 5 species (8.7%) each, while Euphorbiaceae was next with 4 species
(7.0%). Furthermore, Verbenaceae, Hymenocardiaceae, Combretaceae and Caesalpiniaceae were the dominant families of the total
enumeration, and comprised 56 (19%), 28 (9.5%), 26 (8.8%) and 25 individuals (8.5%), respectively. Nevertheless, the avalanche of
Verbenaceae species predominantly represented by Gmelina arborea and Tectona grandis is also an indication that the ecosystem has
over the years been encroached with human activities, which has in turn reduced the size and species richness of the forest. It thus
suggests that the study area needs serious attention if its genetic resources are to be restored and protected in a bid to avoid total loss
of valuable species therein.
Keywords: Nigeria, species diversity, flora, conservation
1 Introduction
The Nigerian rain forests have experienced irreparable destruction resulting from urbanization and general farming activities. Today,
many of the previously known forested areas have become derived savanna areas largely due to grazing and logging activities and this
scenario has been witnessed in Southwestern Nigeria. It is noteworthy that floristic studies are essential for the provision of
information in species diversity and richness and even ecosystem changes which occurs overtime. Floristic studies can also be useful
for the management of our forest areas [1, 2]. As noted by Olapade and Bakare [3], the existence of plant species in any habitat is
important to man and other components of the ecosystem as all plants are valuable for one purpose or the other. It is almost impossible
to live without plants, especially as we continue to rely on them for food, improved rural livelihood, household constructions,
employment generation and income supplements. Isichie [4] noted that if Nigeria plant resources are properly harnessed, they would
ensure food security. Nevertheless, a large number of these species are faced with threat of extinction as pressure on them increases.
Such threat also means a threat to the survival of man, especially the rural poor.
The present study thus aimed at identifying the trees and shrubs of Oba hills forest reserve, a threatened vegetation in Osun State,
Nigeria in an attempt to document the remaining angiosperm records that could serve as baseline information for future regeneration
activities and management of the area.
2 Materials and Methods
2.1 Study Site
Oba hills forest reserve is located in Osun State, Southwestern Nigeria and lies on Latitude 7°47’N and Longitude 4°5’E (Fig. 1). It
covers a 52 km2 hilly terrain with deep gorges and about 12% of the site had been converted to teak plantation [5]. The site is currently
composed of savanna and forest species.

Proceedings of the 2019 International Science Conference Innovation and Advancement in Nanoscience and Nanotechnology, Federal University Oye-Ekiti (www.fuoye.edu.ng), 2019.
81
2.2 Species Enumeration
The survey involved repeated visits to the study area for the collection of existing trees and shrubs. The species were identified on the
field using taxonomic keys provided in Hutchinson et al. [6-8] and Keay [9], while others were taken to the Forest Herbarium Ibadan
[10] for proper identification. The families and habits are also reported.
Fig. 1. Location map of study area
3 Results and Discussion
A total of 56 different species comprising trees and shrubs, belonging to 27 families were identified (Table 1). In all, 254 individual
stands of these species were recorded, with Verbenaceae, Hymenocardiaceae, Combretaceae and Caesalpiniaceae being the dominant
families, and comprised 56 (19%), 28 (9.5%), 26 (8.8%) and 25 individuals (8.5%), respectively.
Table 1. Identified trees and shrubs of Oba hills reserve
Species Family Habit
Afzelia africana Caesalpiniaceae Tree
Albizia adianthifolia Mimosaceae Tree
Albizia ferruginea Mimosaceae Tree
Albizia zygia Mimosaceae Tree
Alchornea cordifolia Euphorbiaceae Shrub
Annona senegalensis Annonaceae Shrub
Anogeissus leiocarpus Combretaceae Tree
Anthocleista djalonensis Loganiaceae Tree
Anthocleista vogelii Loganiaceae Tree
Blighia sapida Sapindaceae Tree
Bombax buonopozense Bombacaceae Tree
Bridelia ferruginea Euphorbiaceae Tree
Ceiba pentandra Bombacaceae Tree
Cleistopholis patens Annonaceae Tree
Cochlospermum planchoni Cochlopsermaceae Tree
Cola gigantea Sterculiaceae Tree
Combretum platypterum Combretaceae Shrub
Crossopteryx febrifuga Rubiaceae Tree
Daniellia oliveri Caesalpiniaceae Tree
Elaeis guineensis Palmae Tree
Ficus exasperata Moraceae Tree
Ficus sur Moraceae Tree
Gardenia aqualla Rubiaceae Shrub
Gmelina arborea Verbenaceae Tree
Harungana madagascariensis Clusiaceae Shrub

Proceedings of the 2019 International Science Conference Innovation and Advancement in Nanoscience and Nanotechnology, Federal University Oye-Ekiti (www.fuoye.edu.ng), 2019.
82
Holarrhena floribunda Apocynaceae Tree
Hymenocardia acida Hymenocardiaceae Shrub
Kigelia africana Bignoniaceae Tree
Lannea sp. Anacardiaceae Tree
Lonchocarpus sericeus Papilionaceae Tree
Lophira lanceolata Ochnaceae Tree
Malacantha alnifolia Sapotaceae Tree
Margaritaria discoidea Euphorbiaceae Tree
Milicia excelsa Moraceae Tree
Millettia thonningii Papilionaceae Tree
Nauclea latifolia Rubiaceae Shrub
Newbouldia laevis Bignoniaceae Tree
Parinari polyandra Chrysobalanaceae Tree
Parkia biglobosa Mimosaceae Tree
Pericopsis laxiflora Papilionaceae Tree
Piliostigma thonningii Caesalpiniaceae Tree
Prosopis africana Mimosaceae Tree
Pterocarpus erinaceus Papilionaceae Tree
Securidaca longepedunculata Polygalaceae Shrub
Securinega virosa Euphorbiaceae Shrub
Spondias mombin Anacardiaceae Tree
Strychnos spinosa Loganiaceae Shrub
Syzygium guineense Myrtaceae Tree
Tectona grandis Verbenaceae Tree
Terminalia avicennioides Combretaceae Tree
Terminalia macroptera Combretaceae Tree
Terminalia sp. Combretaceae Tree
Vitellaria paradoxa Sapotaceae Tree
Vitex doniana Verbenaceae Tree
Ximenia americana Olacaceae Shrub
Zanthozylum zanthoxyloides Rutaceae Tree
Table 2. Species distribution across plant families
Family No. of species % occurrence
Anacardiaceae 2 3.6
Annonaceae 2 3.6
Apocynaceae 1 1.8
Bignoniaceae 2 3.6
Bombacaceae 2 3.6
*Caesalpiniaceae 3 5.4
Chrysobalanaceae 1 1.8
Clusiaceae 1 1.8
Cochlopsermaceae 1 1.8
Combretaceae 5 8.9
Euphorbiaceae 4 7.1
Hymenocardiaceae 1 1.8
Loganiaceae 3 5.4
*Mimosaceae 5 8.9
Moraceae 3 5.4
Myrtaceae 1 1.8
Ochnaceae 1 1.8
Olacaceae 1 1.8
Palmae 1 1.8
*Papilionaceae 4 7.1
Polygalaceae 1 1.8
Rubiaceae 3 5.4
Rutaceae 1 1.8
Sapindaceae 1 1.8
Sapotaceae 2 3.6
Sterculiaceae 1 1.8
Verbenaceae 3 5.4
Total 56 100.0

Proceedings of the 2019 International Science Conference Innovation and Advancement in Nanoscience and Nanotechnology, Federal University Oye-Ekiti (www.fuoye.edu.ng), 2019.
83
The legumes (Caesalpiniaceae, Mimosaceae and Papilionaceae) collectively contributed the highest number of species diversity with a
total of 12 species (21%) of the total enumeration. Others include Combretaceae and Euphorbiaceae with 5 and 4 species each,
Loganiaceae, Moraceae, Rubiaceae and Verbenaceae with 3 species each. Five families had 2 species represented while the remaining
thirteen (13) families were represented with only 1 species each, thus, indicating their importance in ecosystem balancing (Table 2). It
was also evident that the trees were more abundant than the shrubs as shown in Fig. 2.
Fig. 2. Species composition across plant habits
Further observations during our study showed that the site area has been largely cultivated with Gmelina arborea and Tectona
grandis, and this corroborates with previous reports by Greengrass [11] who noted that almost all of the reserve had been converted to
plantations and farms, with only two gullies remaining forest-covered. The abundance of trees also reflects the original composition of
the forest, which had over the years become a derived savanna vegetation resulting from human activities noted above such as
farming, logging, animal grazing, etc. The continued exploitation of the species especially for fuelwood, is brought about by an
increase in the prices of alternative sources of energy, and this is in line with the report of Food and Agriculture Organization (FAO)
[12] which pointed out clearly that wood fuel plays significant roles in the day to day lives of rural people. It was also noted that
Daniellia oliveri, Lophira lanceolata, Pericopsis laxiflora and Terminalia avicennioides are some of the preferred species for
fuelwood by the community dwellers. This is similar to the observations of Jimoh et al. [13]. In general, it is considered that
immediate economic benefits exceed those for conservation, as clearly put by Ferraro and Kiss [14]. While the continued dependence
on plant for survival is inevitable, we advocate for the establishment of sustainable management strategies to salvage our rich but
endangered ecosystems. Our position therefore, is not different from that of Soladoye et al. [15], who earlier suggested the provision
of basic socio-economic amenities such as electricity, schools, good roads, portable water, and hospitals as incentives that could
ensure successful conservation of an area.
4 Conclusion
The present study has revealed 56 species comprising trees and shrubs belonging to 27 angiosperm families. It has also shown the
importance of biodiversity assessment and monitoring, and has no doubt added to the existing records of similar study in Southwestern
Nigeria. With the continued degradation of the study area, we suggest quick intervention by the authorities and implementation of
forest/conservation laws to avoid an eventual disappearance of species.
References
1. Addo-Fordjour P., Obeng S., Anning A.K. and Addo M.G., 2009. Floristic composition, structure and natural regeneration in a semi-deciduous
forest following anthropogenic disturbances and plant invasion. Int J Biodiv Conserv, 1(2), 021-037.
2. Pappoe A.N.M., Armah F.A., Quaye E.C., Kwakyeand P.K. and Buxton G.N.T., 2010. Composition and stand structure of a tropical moist semi-
deciduous forest in Ghana. Int Res J Plant Sci, 1(4), 095-106.
3. Olapade O.E. and Bakare O.A., 1992. Medicinal plants in Ibadan under threat of genetic erosion; Our Forest, Environment and Heritage;
Challenges for Our People, Akinsanmi FA (ed). Proceedings of 22nd Annual Conference of Forestry Association of Nigeria Held in Kano, Kano
State, Nigeria, pp. 55-58.
4. Isichei A.O., 2005. The role of plant resources in Nigeria’s economic recovery agenda. Nigeria Journal of Botany, 18, 1-22.
80%
20%
Trees Shrubs

Proceedings of the 2019 International Science Conference Innovation and Advancement in Nanoscience and Nanotechnology, Federal University Oye-Ekiti (www.fuoye.edu.ng), 2019.
84
5. Kormos R., 2003. IUCN/SSC Primate Specialist Group (2003). West African chimpanzees: status survey and conservation action plan. IUCN.
pp. 127.
6. Hutchinson J., Dalziel J.M. and Keay R.W.J., 1954. Flora of West Tropical Africa. Vol. 1(1), 2nd ed. pp 1–295. Crown Agents for Oversea
Governments and Administrations, London.
7. Hutchinson J., Dalziel J.M. and Keay R.W.J., 1958. Flora of West Tropical Africa. Vol. 1(2), 2nd ed. pp. 297–828. Crown Agents for Oversea
Governments and Administrations, London.
8. Hutchinson J., Dalziel J.M., Keay R.W.J. and Hepper F.N., 1963. Flora of West tropical Africa. Volume II. pp. 544. Crown Agents for Oversea
Governments and Administrations, London.
9. Keay R.W.J., 1989. Trees of Nigeria. Oxford Science Publication, New York, pp. 476.
10. Holmgren P.K., Keuken W. and Schofield E.K., 1990. Index harbariorum Part I. The Herbaria of the World. 8th ed. Reg. Veg., New York.
11. Greengrass E.J., 2009. Chimpanzees are close to extinction in Southwest Nigeria. Primate Conservation, 24, 77-83.
12. FAO. (2007). State of the world forest, Rome. pp 5-98.
13. Jimoh S.O., Adebisi L.A.A. and Ikyaagba E.T., 2009. Biodiversity and ethnobotanical potentials of plant species of University of Agriculture
Makurdi Wildlife Park and Ikwe Games Reserve, Benue State, Nigeria. Int J Biol Chem Sci 3(6), 1375-1385.
14. Ferraro P.J. and Kiss A., 2002. Direct payments to conserve biodiversity. Science, 298, 1718-1719.
15. Soladoye M.O., Asafa B.A., Sonibare M.A., Ibhanesebhor G.A. and Chukwuma E.C., 2011. Angiosperm flora of Kamuku National Park: A
northern guinea savanna protected area in Nigeria. European Journal of Scientific Research, 58(3), 326-340.
Proceedings of the 2019 International Science Conference Innovation and Advancement in Nanoscience and Nanotechnology, Federal University Oye-Ekiti (www.fuoye.edu.ng), 2019.
85
Ameliorative Effect of Aqueous Extract of Chromoleana odorata Leaves on Alloxan-
induced Diabetic Rats
Bamisaye F.A.1,*, Ajuwon O.R.1, Ajani E.O.2, Sulyman A.O.2
Department of Biochemistry, Faculty of Science, Federal University Oye-Ekiti, P.M.B.373, Oye-Are Road, Oye-Ekiti, Ekiti State, Nigeria
Department of Biochemistry, School of Basic Medical Sciences, College of Pure and Applied Sciences, Kwara State University, Malete, Nigeria [email protected],[email protected]
Abstract
This work sought to investigate the antidiabetic effect of aqueous extract of Chromoleana odorata leaves by monitoring the daily
changes in blood glucose level of alloxan-induced diabetic rats. Qualitative phytochemical screening of the extract was also
investigated. Thirty-five (35) rats were grouped into five (A-E) containing seven rats each. Group A were given 1 ml of distilled
water twice daily. Groups B to E were alloxan-induced diabetic rats. Group B was also given 1 ml of distilled water twice daily.
Groups C and D were treated with 100 mg and 200 mg/kg body weight of the leaves aqueous extract, respectively while group E
were treated with 5 unit/Kg body weight of insulin twice daily. The treatment lasted for 14 consecutive days. The bioactive
substances present in the extract include saponins, alkaloids, cardenolides, triterpenes and flavonoids, while anthraquinone,
phlobatannins, tannins, phenolics and steroids were not detected. One or more of these secondary metabolites present in this aqueous
extract may be responsible for the amelioration of alloxan-induced diabetes in rats since there was a decrease in blood glucose level
in these rats treated with 100 mg and 200 mg per Kg body weight of the extract. Furthermore, the aqueous extract of C. odorata
leaves showed high reduction potential of blood glucose level than insulin in alloxan-induced diabetic rats in this study. Collectively,
the results suggest that the aqueous extract of C. odorata leaves elicits antidiabetic effect at 100 mg better than either 200 mg/Kg or 5
unit of insulin /Kg body weight in alloxan-induced diabetic rats.
Keywords: Aqueous extract, Chromoleana odorata, alloxan, diabetes, antidiabetic activity, albino rats
1 Introduction
One of the most prominent public health threats in modern societies of today is diabetes mellitus; and its prevalence is rapidly
increasing [1]. The cause of diabetes mellitus may be due to a variety of different metabolic disorders. These include the inability to
produce or use insulin, which then result to elevation of plasma glucose (blood sugar) levels [2]. This abnormally high level of glucose
in the blood is called hyperglycaemia. Diabetes is of two types: a disease in which the pancreas produces insufficient amounts of
insulin (type 1), or the body’s cells fail to respond appropriately to insulin (type 2). Diabetes leads to the production of increasing
amounts of acidic compounds in the blood called ketone bodies. These acidic compounds interfere with respiration of cells thereby
leading to less energy production [3]. This leads to glucose to build up in the blood. When this excess blood glucose passes through
the organs (the kidneys) that remove blood impurities, they cannot absorb all of the excess glucose. This excess glucose will spill into
the urine, accompanied by water and electrolyte ions, which are required by cells to regulate the electric charge and flow of water
molecules across the cell membrane. These cascades of reactions cause frequent urination to get rid of the additional water drawn into
the urine leading to excessive thirst in order to trigger replacement of lost water [4]. Complications of diabetes ranging from heart
disease, kidney failure, and other conditions lead to deaths. Prolonged high blood glucose level leads to changes in shape of lenses of
the eyes, resulting in vision changes collectively known as neuropathy [5].
There are many therapeutic attempts against diabetes, but unfortunately, there is still no cure for it; the disease has only been managed.
There is therefore, an urgent need to double the herbal therapeutic efforts aimed at finding solutions and selecting remedies for
diabetes mellitus. In pursuit of this goal, several medicinal plants are being investigated for their antidiabetic efficacies. Of the several
indigenous plants used in the local treatment of diabetes mellitus include the extracts of Sarsaparilla [6], Beta vulgaris [7],
Aloebarbadensis [8, 9] and Morinda lucida [10]. Chromolaena odorata, popularly known as Christmas Bush (also commonly called
Siam weed and Common floss flower), is a species of flowering shrub that belongs to the kingdom of Plantae; Order: Astereles;
Family: Astereceae; Genus: Chromoleana; Species: C. Odorata [11]. This flowering plant has been introduced to tropical Asia, West
Africa and parts of Australia [11] as a medicinal and ornamental plant. It is an herbaceous perennial plant that forms dense tangled
bushes 1.5-2.0 m in height [12] with small seeds (3-5 mm long, 1 mm wide, and weigh about 2.5 mg /seed) [13]. It has been suggested
as carcinogenic because it contains pyrrolidizine alkaloids [14], which are produced by the plants as a defense mechanism against
insect infestation and herbivores [15]. Indonesia has used C. odorata as folkloric traditional medicine where its leaves aqueous extract
are applied locally to treat skin wounds, burns, hemorrhages, hemorrhoids, indigestion, skin diseases, edema, fracture and infection

Proceedings of the 2019 International Science Conference Innovation and Advancement in Nanoscience and Nanotechnology, Federal University Oye-Ekiti (www.fuoye.edu.ng), 2019.
86
[16]. However, in the present findings, aqueous extract of C. odorata leaves was used to monitor the changes of the blood glucose
levels in alloxan-induced diabetic rats.
2 Materials and Methods
2.1 Chemicals and Reagents
Chromoleana odorata leaves were obtained at the premises of Kwara State University, Malete, Nigeria. The albino rats used in the
study were obtained from the Animal House of Biochemistry Department, College of Pure and Applied Sciences, Kwara State
University, Malete, Ilorin. Alloxan was obtained from Sigma St, Louis, MO, USA. All other chemicals and reagents were of analytical
grade.
2.2 Preparation of Aqueous Extract
Fresh leaves of C. odorata (180 g) were blended with a blender and soaked in 2 litres of distilled water for 24 hours. It was filtered
with white clean muslin cloth and the suction pump used to reduce the volume of filtrate. Thereafter, the filtrate was evaporated to
obtain brown oily substance (14.2 g). The filtrate was kept at 4oC for further use.
2.3 Phytochemical Screening
The methods described by Odebiyi and Sofowora [17] and Sofowora [18] were used for the qualitative phytochemical screening of
aqueous extract of C. odorata leaves.
2.4 Animal Protocol
Thirty-five (35) albino rats weighing between 140 and 150 g were divided into 5 groups (A – E) containing 7 rats each. Group A
served as a negative control and received 1 ml of distilled water twice daily. Groups B, C, D, and E were induced with diabetes with a
single intraperitoneal injection of 1 ml of alloxan per kg body weight of rats [19], which was prepared by freshly dissolving in citrate
buffer (0.1 m, pH 4.5) [20]. After seven days of alloxan induction, diabetes was confirmed in these rats with fasting blood sugar
concentration equal or greater than 200 mg/dL. Group B was also treated with 1 ml of distilled water while groups C and D were
treated with 100 mg and 200 mg/kg body weight of aqueous extract of C. odorata, respectively and group E received 5 unit/kg body
weight of insulin twice daily. The animals were maintained on growers feed and water ad libtum. The experiment lasted for 14 days
and the change in blood glucose level was read daily with glucometer throughout this period.
All the animals that were used received humane care according to the guide, care and Use of Laboratory Animals prepared by the
Nigeria Academy of Science. Ethic regulations have been followed in accordance with Nigeria and institutional guidelines for the
protection of animal welfare during experiments.
2.5 Statistical Analysis
Data were expressed as means ± S.D. of seven determinations. The statistical tools used were one-way analysis of variance (ANOVA)
and Duncan Multiple Range Test. Differences were considered statistically significant at p < 0.05 [21].
3 Results and Discussion
Qualitative phytochemical screening revealed the presence of saponins, alkaloids, cardenolides, flavonoids and triterpenes while
anthraquinones, phlobatanins, steroids, phenolics and tannins were not detected in the aqueous extract of C. odorata leaves (Table 1).
The doses of aqueous extract of C. odorata leaves and insulin used in this study ameliorate the glucose levels of alloxan-induced
diabetic rats. Group E had their blood glucose levels dropped below 200 mg/dl on the 8 th day of treatment. Groups D and C had their
blood glucose levels dropped below 200 mg/dl on the 9th and 10th day, respectively. Furthermore, group E had the highest drop in
blood glucose level at the end of the experimental period. Also, the 100 mg/Kg body weight aqueous extract has better ameliorative
effect than the 200 mg/Kg body weight of aqueous extract at the end of the experiment (Table 2).

Proceedings of the 2019 International Science Conference Innovation and Advancement in Nanoscience and Nanotechnology, Federal University Oye-Ekiti (www.fuoye.edu.ng), 2019.
87
Table 1. Qualitative phytochemical screening of the aqueous extract of Chromoleana odorata leaves
Phytochemicals Status
Saponins +
Alkaloids +
Cardenolides +
Anthraquinones -
Phlobatanins -
Triterpenes +
Flavonoids +
Steroids -
Phenolics -
Tannins -
Key: (+) = present, (-) = absent
Table 2. Hypoglycemic potential of aqueous extract of C. odorata leaves (mg/dl)
Days Group A Group B Group C Group D Group E
1 90.03 ± 2.22 366±65.64a 320.2±47.06a 321.6±56.81a 242.0±17.32a
2 95.66 ± 0.45 366.0±65.20a 325.6±42.46a 317.0±55.41a 240.2±17.89a
3 98.08 ± 1.05 359.4±62.74a 304.6±41.09a 304.0±54.64a 235.8±18.54a
4 108.01 ± 0.09 361.4±64.51a 289.0±37.93a 296.8±53.79a 229.6±17.24a
5 112.06 ± 0.14 359.6±63.57a 281.0±37.69a 285.8±52.90a 222.8±14.39a
6 99.21 ± 1.47 357.0±62.55a 267.0±38.70ab 270.6±51.35ab 207.0±9.58b
7 89.66 ± 2.06 353.0±61.81a 260.2±37.91ab 243.4±40.21ab 200.0±9.95b
8 104.32 ± 0.87 350.2±61.33a 234.6±26.83b 202.4±25.24b 189.4±8.45b
9 102.54 ± 0.99 343.6±59.38a 204.4±22.08b 185.8±28.28b 169.6±15.46b
10 86.88 ± 3.01 339.6±57.12a 183.2±18.69b 166.4±24.04b 174.6±6.87b
11 72.01 ± 2.88 328.8±51.71a 123.4±10.70b 154.4±13.16b 136.6±8.89b
12 75.00 ± 0.33 336.6±56.45a 104.4±5.70b 110.2±1.66b 103.2±4.62b
13 76.01 ± 0.96 332.6±55.33a 90.6±3.33b 102.0±1.14b 84.2±3.75b
14 72.00 ± 3.01 330.0±55.38a 88.0±2.83b 95.8±2.15b 80.2±1.83b
Results are means ±Standard Errors of Means of seven determinations; Values with different superscripts on the same row are significantly (p<0.05)
different
At the end of the experiment, all animal groups gained weights except group B, which showed loss of body weight. Furthermore, the
extract-treated groups C and D gained more weights (22.98 and 19.27 g, respectively) compared with the standard drug-treated (13.97
g) group E. However, negative group A witness the highest weight gain (25.94 g) compared with all other experimental groups (Table
3).
Table 3. Body weights of alloxan-induced diabetic rats treated with aqueous extract of Chromoleana odorata leaves (g)
Groups Initial body weight Final body weight Weight gained/loss
A 133.52±5.69a 150.90 ±14.25b + 25.94a
B 140.02± 10.08a 130.40±5.99b - 13.71e
C 112.24±34.85a 155.76±14.31b + 22.98b
D 115.06±25.39a 144.74±14.98b + 19.27c
E 146.28±2.82a 152.18±10.89b + 13.97d
Values with different superscripts on the same row are significantly (p<0.05) different
Diabetes has no cure yet, but can be managed by exercise, diet and pharmaceutical drugs. However, these drugs are either too
expensive or may have undesirable side effects or contraindications on the users [22, 23]. Herb remedies have been known from
history to be used to manage diabetes, which is one of the fastest growing degenerative diseases in the world today [24]. Due to the
above probably, researchers are encouraged by the World Health Organisation (WHO) Committee on Diabetes Mellitus to investigate
the hypoglycemic actions from plants which were originally used in traditional medicine especially in countries, such as Nigeria,
where access to conventional treatment of diabetes is not pronounced [25]. It has been established that medicinal plants possess herbal
therapeutic effects [23]. Some of these plants have been predicted as anti-diabetic agents when locally administered. Our present
investigation showed a correlation between the previous reports which observed that, alloxan can induce hyperglycemia in normal
healthy rats [22]. The present finding also revealed that the continuous treatment of alloxan-induced diabetic rats with aqueous extract
of C. odorata leaves resulted into a significant reduction/decrease in blood glucose concentrations. The possible underlying
mechanism responsible for this observed hypoglycemic action of aqueous extract of C. odorata leaves may be likened to the

Proceedings of the 2019 International Science Conference Innovation and Advancement in Nanoscience and Nanotechnology, Federal University Oye-Ekiti (www.fuoye.edu.ng), 2019.
88
potentiality of the insulin. This may be by increasing the pancreatic secretion of insulin from the cells of the islet of Langerhans by
ameliorating the damage done by alloxan on the cells or it is released from the bound insulin by the extract [23, 26].
Some research works have shown that saponins and flavonoids possess hypoglycemic, hypotensive, anti-inflammatory and other
pharmacological properties in diabetic-induced animals [27-29]. Therefore, the presence of these phytochemicals in the aqueous
extract of C. odorata leaves may be responsible for its hypoglycemic effect. One of the possible mechanisms of this extract may be
that one or both of these phytochemicals, saponins and flavonoids help to repair the damaged Islet of Langerhans cells.
The alloxan-induced diabetic rats treated with the extract of 100 and 200 mg/kg gained absolute body weight better than insulin-
treated rats. This may be attributed to the fact that hepatic tissues were able to metabolise excess glucose generated by alloxan and
supply enough energy to various epithelial tissues which resulted into increased growth in aqueous extract treated-rats better than
those insulin-treated rats. However, this metabolism of excess glucose generated may be C. odorata leaves aqueous extract
concentration dependent. This is noticed in more body weight gained in rats treated with 100 mg/Kg body weight (group C) compared
to higher concentration of 200 mg/Kg body weight of the extract (group D).
Glucose levels in blood can be measured by metabolic processes in key tissues (liver, kidney and adipose). These tissues are regulated
by hormones such as insulin, glucagon and diabetogenic hormones [30]. The present study showed similar significant reduction in the
glucose level of these diabetic rats treated with the extract and insulin. This thus indicates tendency towards fine hormonal control
following extract treatment as these diabetogenic hormonal interaction play a fine role in glucose control.
4 Conclusion
Leaves of Chromoleana odorata, a folkloric medicinal plant has hypoglycemic properties. These hypoglycemic properties may be due
to the medicinal properties of one or some of the phytochemical substances that were detected in the leaves aqueous extract of the
plant. Therefore, aqueous extract of C. odorata leaves may be a better option in nearest feature for the treatment of diabetes mellitus
since it has ameliorative activity on blood glucose level, and the rats treated with it have more weight gain compared with the standard
drug, insulin used in this research. However, this work merits further research to ascertain, isolate and quantify the bioactive
compound(s) responsible for its anti-diabetic activities.
References
1. Steven S., Elizabeth D. and Agabegi M.D., 2008. Step-up to medicine (Step-Up Series). Hagerstwon, MD: Lippincott Williams & Wilkins.
2. Ripsin C.M., Kang H. and Urban R.J., 2009. Management of blood glucose in type 2 diabetes mellitus. Am Fam Physician, 79(1), 29-36.
3. Cooke D.W. and Plotnick L., 2008. Type 1 diabetes mellitus in pediatrics. Pediatr Rev, 29(11), 374-384.
4. King H., 2004. Global prevalence of diabetes: Estimates for 2000 and projections for 2030. Diabetes Care, 27(5), 1047-1053.
5. Williamson D.F., Narayan K.M., Boyle J.P., Thompson T.J. and Sorensen S.W., 2003. Lifetime risk for diabetes mellitus in the United States.
Journal of American Medical Association, 290(14), 1884–1890.
6. Augusti K.T. and Mathew P.T., 1973. Effect of long term feeding of the aqueous extracts of Sarsparilla and garlic (Allium sativum Linn.) on
normal rats. Indian J Exp Biol., 11, 239-241.
7. Yoshikawa M., Murakami T., Kadoya M., Matsuda H., Muraoka O., Yamahara J. and Murakami N., 1996. Medicinal foodstuff. III. Sugar beet.
Hypoglycemic oleanolic acid oligoglycosides, betavulgarosides I, II, III, and IV, from the root of Beta vulgaris L. (Chenopodiaceae). Chem
Pharm Bull (Tokyo), 44(6), 1212-1217.
8. Al-Awadi F.M. and Gumaa K.A., 1987. Studies on the activity of individual plants of an antidiabetic plant mixture. Acta Diabetologica Latina,
24, 37-41.
9. Grover J.K., Vats V., Rathi S.S. and Dawar R., 2001. Traditional Indian anti-diabetic plants attenuate renal hypertrophy, urine volume and
albuminuria in streptozotocin induced diabetic mice. J Ethnopharmacol, 76(3), 233-238.
10. Bamisaye F.A., Odutuga A.A., Minari J.B., Dairo J.O., Oluba O.M. and Babatola L.J., 2013. Evaluation of hypoglycemic and toxicological
effects of leaf extracts of morindalucidain hyperglycemic albino rats. International Research Journal of Biochemistry and Bioinformatics, 3(2),
37-43.
11. Schmidt, G.J. and Schilling EE., 2000. Phylogeny and biogeography of Eupatorium (Asteraceae:Eupatorieae) based on nuclear ITS sequence.
Am J Bot. (Botanical Society of America), 87(5), 716-726.
12. Cruttwell McFadyen R.E.,1996. The ecology of Chromolaena odorata in the neotropics. Proceedings of the 2nd International Workshop on
Biological Control of Chromolaenaodorata. Bogor 4-8, (Muniappan.R; Ferrar.P., Special Publication, 44,1-9.
13. Vanderwoude C., Scanlan J.C., Davis B. and Funkhouser S., 2005. Plan for national delimiting survey for Siam weed. Natural Resources and
Mines Land Protection Services: Queensland Government, 224-300.
14. Yang Y.C., Xia Q., Chou M.C., Cui Y.Y. and Lin G., 2002. Pyrrolizidine alkaloids-tumorigenic components in Chinese herbal medicines and
dietary supplements. J Food Drug Anal, 10(4), 198-211.

Proceedings of the 2019 International Science Conference Innovation and Advancement in Nanoscience and Nanotechnology, Federal University Oye-Ekiti (www.fuoye.edu.ng), 2019.
89
15. Raimundo R.L.G., Fonseca R.L., Schachetti-Pereira R., Peterson A.T. and Lewinsohn T.M., 2007. Native and exotic distributions of Siam weed
(Chromolaena odorata) modeled using the genetic algorithm for rule-set production. Weed Sci, 55 (1), 41-48.
16. Struhsaker T.T., Struhsaker P.J. and Siex K.S., 2005. Conserving African’s rain forest: problems in protecting areas and possible solutions. Biol
Conserv, 123(1), 45-54.
17. Odebiyi A. and Sofowora A.E., 1978. Phytochemical and vitamin content of indigenous spices of South Eastern Nigeria. J Sustain Agric
Environ, 6, 30-34.
18. Sofowora L.A., 1993. Medicinal plants and traditional medicine in Africa. Spectrum Books Ltd, Ibaban, Harborne. pp. 55-71.
19. Cetto S.M., Vrushabendra B., Gopkumar M., Dhanapal P., Chandrashekara R., 2000. Leaf extracts in alloxan induced diabetics Rats: Iran J
Pharm Therap, 4 (1), 38-39.
20. Ozsoy M.L., Rodrignes B., Yuen V.G. and McNeil J.H., 2000. Treatment and pharmacological interventions in Alloxan diabetes. Experimental
models of diabetes, (McNeil J.H, Ed), pp. 195-216.
21. Mahajan B.K., 1997. Significance of difference in means. In: Methods in biostatistics for medical and research workers, 6th edition. New Delhi.
JAYPEE Brothers Medical Publishers, pp. 130-155.
22. Adewole S.O. and Ojewole J.A., 2006. Effect of insulin on pancreatic β-cells of Streptozotocin-treated diabetic rats. Experimental observations
on immuno-histochemical and morphological changes. Pharmacol, 1, 120-134.
23. Odutuga A.A., Dairo J.O., Minari J.B. and Bamisaye F.A., 2010. Anti-diabetic effect of Morindalucida stem bark extracts on alloxan-induced
diabetic rats. Res J Pharmacol., 4(3), 78-82.
24. Akhtar M.S. and Ali M.R., 1984. Study of antidiabetic effect of a compound medicinal plant prescription in normal and diabetic rabbits. J Pak
Med Assoc, 34, 239-244.
25. World Health Organisation (WHO), 1980.Second report of the WHO expert committee on diabetes mellitus. World Health Organisation
Technical Report Series, pp. 646.
26. Pari L. and Amarnath S., 2004. Antidiabetic activity of Boerheaviadiffusa L.: Effect on hepatic enzymes in experimental diabetes. J
Ethnopharmacol, 91, 109-113.
27. Akah P.A. and Okafor C.I., 1992. Blood sugar lowering effect of Vernoniaamygdalina Del, in an experimental rabbit model. Phytother Res, 6,
171-173.
28. Ojewole J.A.O., 2004. Evaluation of analgesic, anti-inflammatory and anti-diabetic properties of Sclerocaryabirrea (A Rich) Hochst stem- bark
aqueous extract in mice and rats. Phytother Res, 18, 601-618.
29. Ojewole J.A., 2005. Antinociceptive, anti-inflammatory and antidiabetic effects of Bryophyllumpinnatum (Crassulaceae) leaf aqueous extract. J
Ethnopharmacol, 99, 13-19.
30. Hill AF., 1952. Economic botany. A textbook of useful plants and plant products. 2nd edn. McGraw-Hill Book Company Inc, New York. pp54-
67.