process evaluation and causal mediation analysis using...
TRANSCRIPT

Process evaluation and causal mediation analysis using Mplus
Dr Richard Emsley
mediation analysis using Mplus
Dr Richard EmsleyBiostatistics, Health Sciences – Methodology, School of Community Based Medicine,The University of Manchester Manchester UKThe University of Manchester, Manchester, UK
www.medicine.manchester.ac.uk/staff/RichardEmsley [email protected]
Third UK Mplus Users MeetingLondon School of Hygiene and Tropical MedicineLondon School of Hygiene and Tropical Medicine
Thursday 24th May 2012
Acknowledgements
G h D d H h Li M h t• Graham Dunn and Hanhua Liu, Manchester• Andrew Pickles, IoP KCL• Ian White, MRC BSU,• Tim Croudace, York• Tyler VanderWeele, Harvard School of Public Health
• Estimation of causal effects of complex interventions in longitudinal studies with intermediate variables (2009-2012)
Richard Emsley (MRC Fellow), Graham Dunn.y ( ),
• Designs and analysis for the evaluation and validation of social and psychological markers in randomised trials of complex interventions in mental health (2010-12)mental health (2010-12)
Graham Dunn (PI), Richard Emsley, Linda Davies, Jonathan Green, Andrew Pickles, Chris Roberts, Ian White & Frank Windmeijer with Hanhua Liu.

Contents
1 Di i f di ti d t ti ti l di ti l i1. Discussion of mediation and statistical mediation analysis
2. Causal mediation parametersp
3. Process evaluation (using Mplus)
4. Causal mediation analysis (using Mplus)
5. Conclusions
Mediation analysis and causal inference…
“Mediation analysis is a form of causal analysis…all too often persons y p
conducting mediational analysis either do not realize that they are either do not realize that they are conducting causal analyses or they fail to justify the assumptions that fail to justify the assumptions that
they have made in their casual model.”
D id K (2008) R fl ti M di ti O i ti l David Kenny (2008), Reflections on Mediation, Organizational Research Methods.
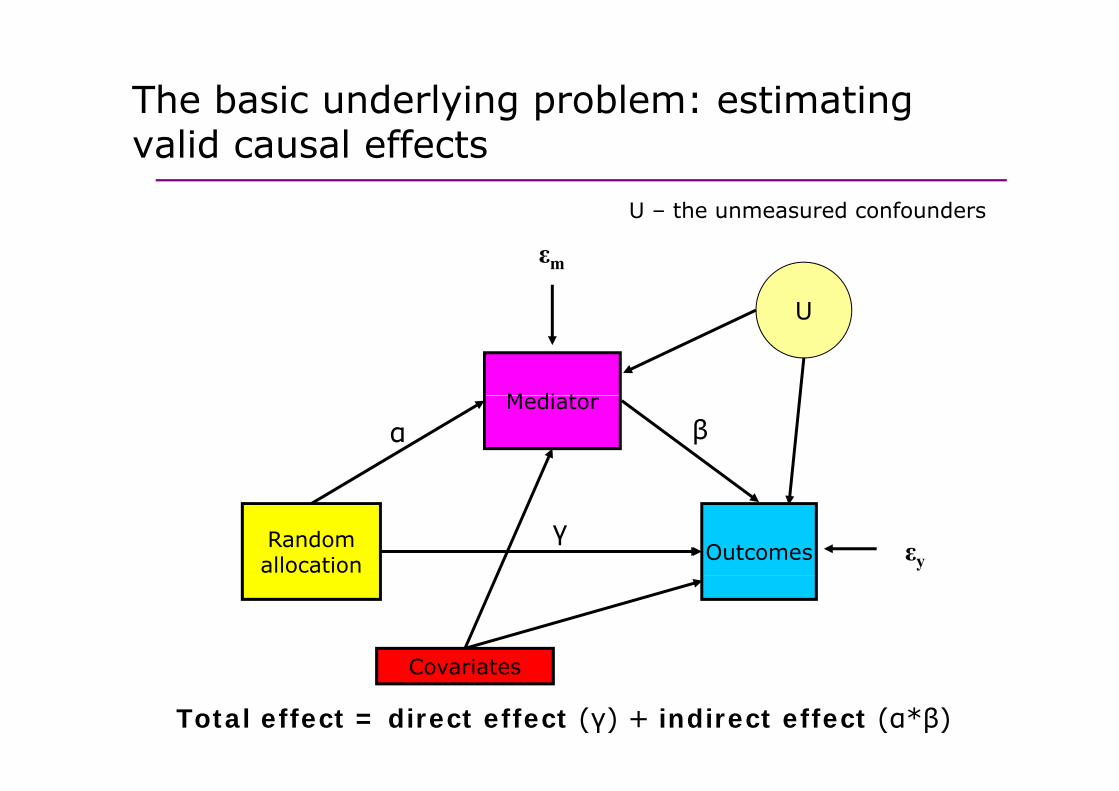
The basic underlying problem: estimating valid causal effects
U – the unmeasured confounders
εm
U
U the unmeasured confounders
M di t
U
Mediatorα β
Randomallocation Outcomes εy
γ
CovariatesCovariates
Total effect = direct effect (γ) + indirect effect (α*β)
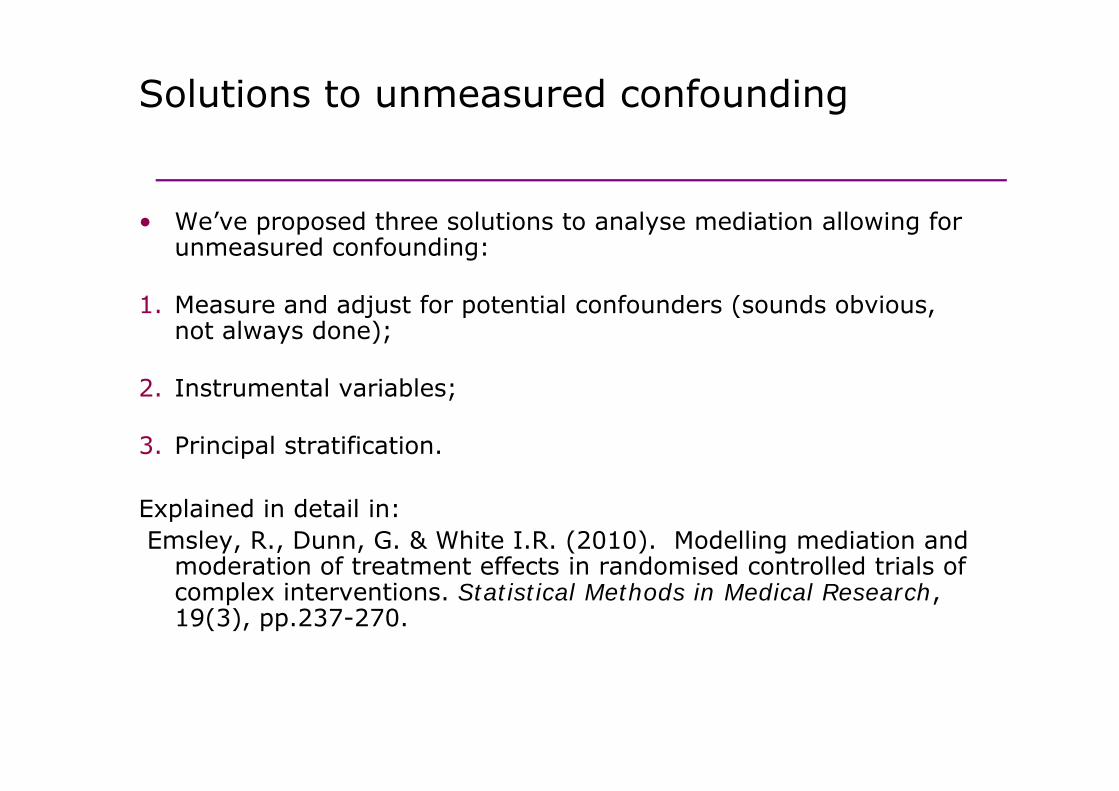
Solutions to unmeasured confounding
W ’ d th l ti t l di ti ll i f • We’ve proposed three solutions to analyse mediation allowing for unmeasured confounding:
1 Measure and adjust for potential confounders (sounds obvious 1. Measure and adjust for potential confounders (sounds obvious, not always done);
2. Instrumental variables;2. Instrumental variables;
3. Principal stratification.
Explained in detail in:Emsley, R., Dunn, G. & White I.R. (2010). Modelling mediation and
moderation of treatment effects in randomised controlled trials of complex interventions. Statistical Methods in Medical Research, 19(3), pp.237-270.
True and Incidental mediators
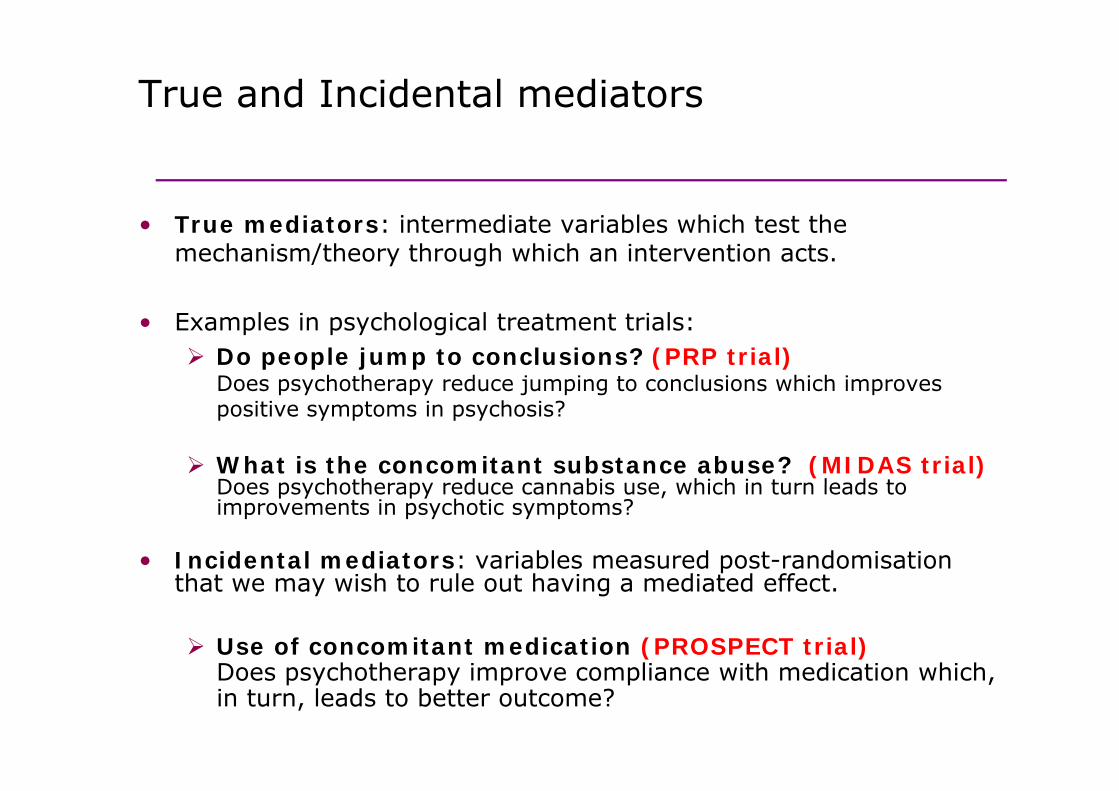
T di t i t di t i bl hi h t t th • True mediators: intermediate variables which test the mechanism/theory through which an intervention acts.
• Examples in psychological treatment trials:Do people jump to conclusions? (PRP trial)Does psychotherapy reduce jumping to conclusions which improves positive symptoms in psychosis?
What is the concomitant substance abuse? (MIDAS trial)Does psychotherapy reduce cannabis use which in turn leads to Does psychotherapy reduce cannabis use, which in turn leads to improvements in psychotic symptoms?
• Incidental mediators: variables measured post-randomisation th t i h t l t h i di t d ff tthat we may wish to rule out having a mediated effect.
Use of concomitant medication (PROSPECT trial)D h th i li ith di ti hi h Does psychotherapy improve compliance with medication which, in turn, leads to better outcome?
True and Incidental mediators
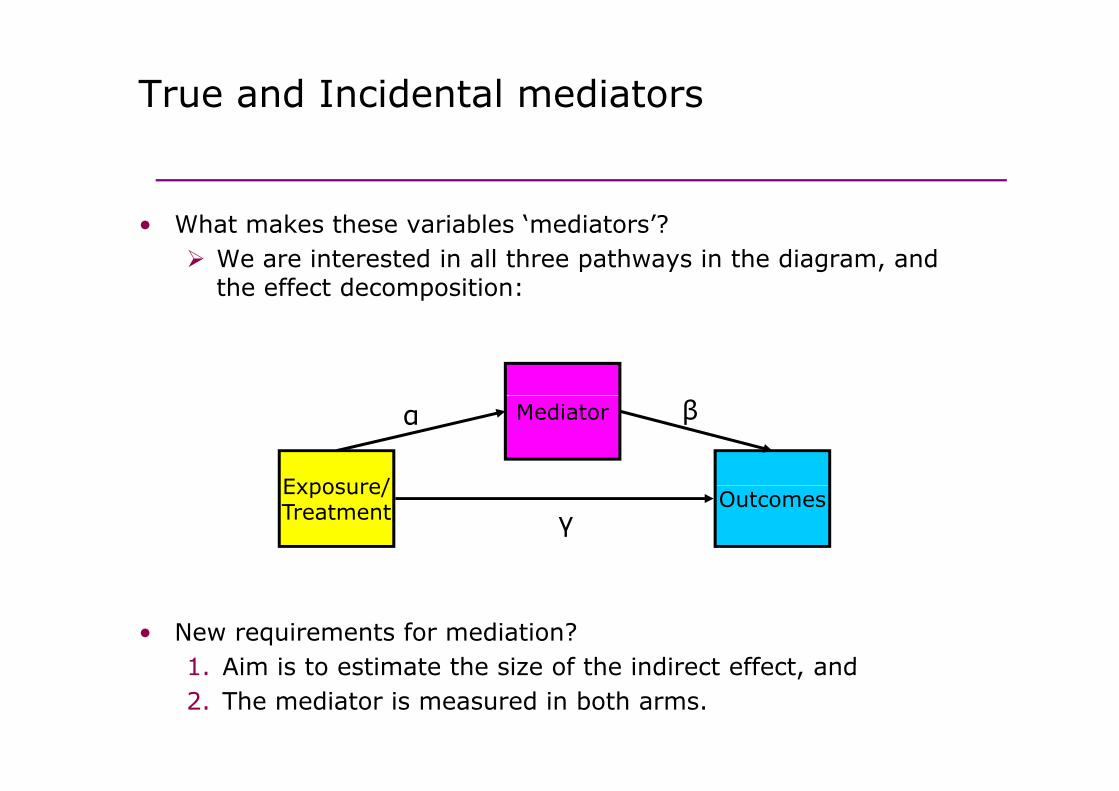
Wh t k th i bl ‘ di t ’?• What makes these variables ‘mediators’?We are interested in all three pathways in the diagram, and the effect decomposition:
Exposure/
Mediatorα β
Exposure/Treatment Outcomes
γ
• New requirements for mediation?1 Aim is to estimate the size of the indirect effect and1. Aim is to estimate the size of the indirect effect, and2. The mediator is measured in both arms.

Statistical mediation analysis
L lit t t ti ti l di ti • Large literature on statistical mediation analysis, summarised by the recent monograph by David MacKinnon (2008).
• Further work by Kris Preacher and Andrew Hayes, developing SPSS macros for multiple mediators, moderated mediation/mediated moderation, longitudinal mediation models.
• Extensive use of structural equation modelling including Mplus examples.g g p p
• All (usually) based on the same implicit assumptionsassumptions.
Characteristics of therapy: mediators or t d i ti ff t difi ?post-randomisation effect modifiers?
• Aspects involved in process of therapy that might explain differential treatment effects/effect heterogeneity.
Compliance with allocated treatmentDoes the participant turn up for any therapy?How many sessions does she attend?How many sessions does she attend?
Quality of the therapeutic relationshipWhat is the strength of the therapeutic alliance?What is the strength of the therapeutic alliance?
Fidelity of therapyHow close is the therapy to that described in the treatment
l? i i i b h i l i i fmanual? Is it a cognitive-behavioural intervention, for example, or merely emotional support?
Characteristics of therapy: mediators or t d i ti ff t difi ?
Wh d I th ’t t i id t l di t ?
post-randomisation effect modifiers?
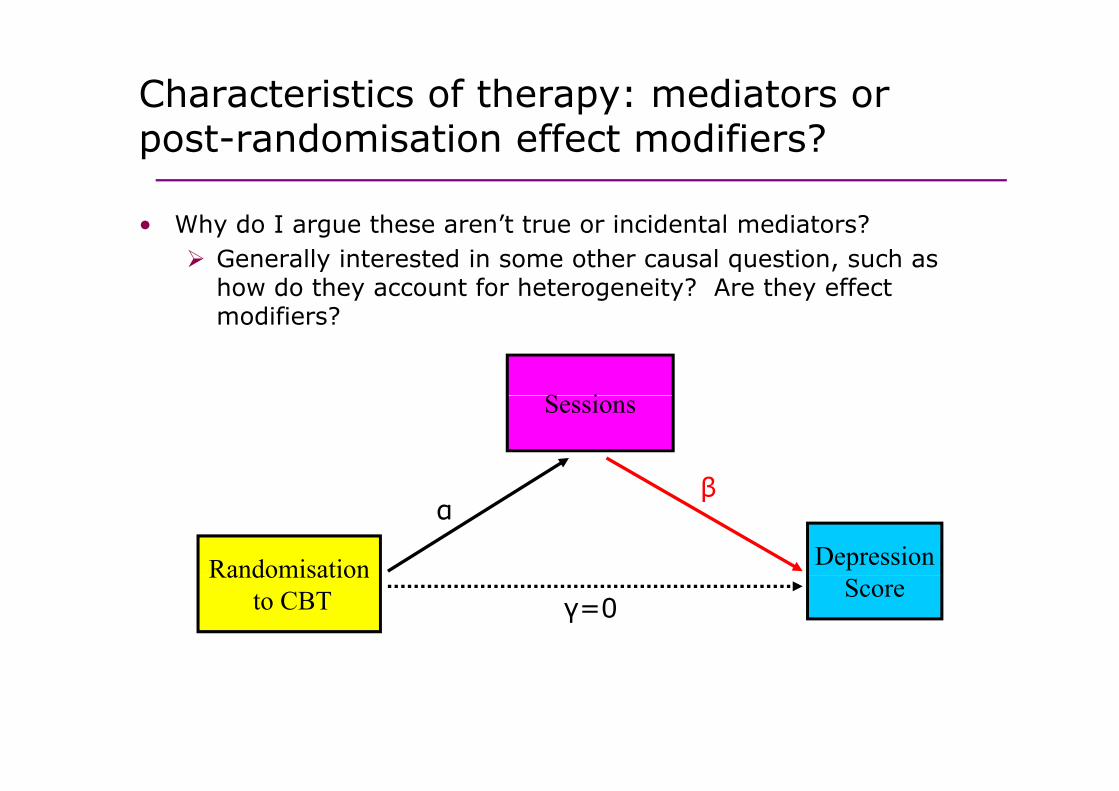
• Why do I argue these aren’t true or incidental mediators? Generally interested in some other causal question, such as how do they account for heterogeneity? Are they effect modifiers?
S i
β
Sessions
αβ
Randomisation Depression
γ=0Randomisation
to CBT Score

Characteristics of therapy: latent variables?
Fid lit f th• Fidelity of therapy
• Components of therapyp py
• Quality of therapeutic relationship
• Therapeutic dose
It is plausible that these may only be measured in the therapy armof a randomised trial.
For example, if the control arm has some form of treatment as usual which doesn’t contain an active ‘therapy’ on which they can be measuredmeasured.
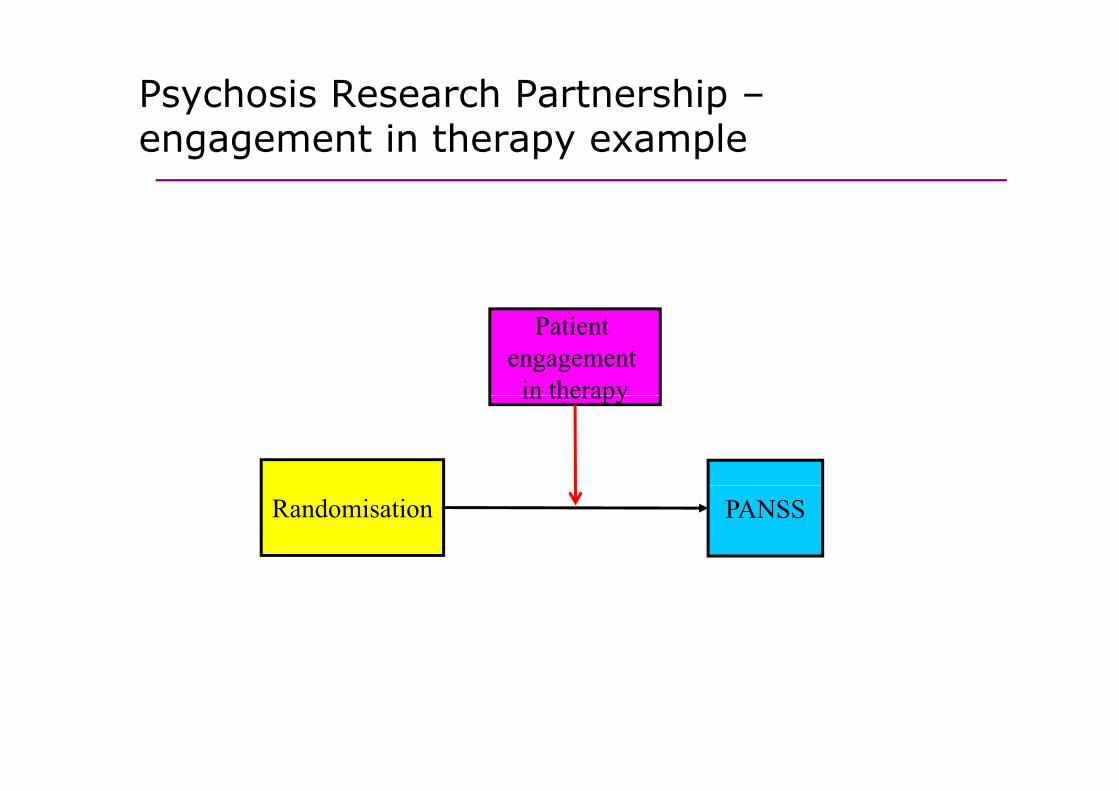
Psychosis Research Partnership –t i th lengagement in therapy example
Patient engagement
in therapyin therapy
Randomisation PANSS
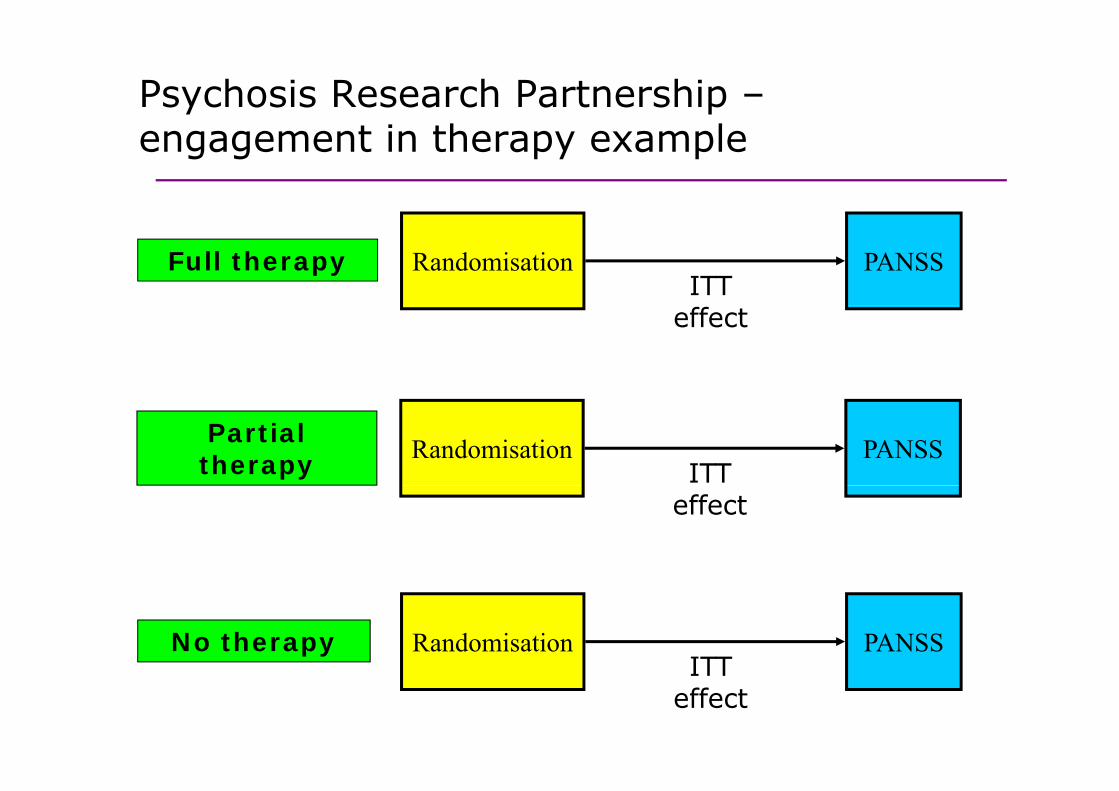
Psychosis Research Partnership –t i th lengagement in therapy example
ITT Full therapy Randomisation PANSS
effect
ITT Partial therapy Randomisation PANSS
effect
No therapyITT
Randomisation PANSSITT
effect
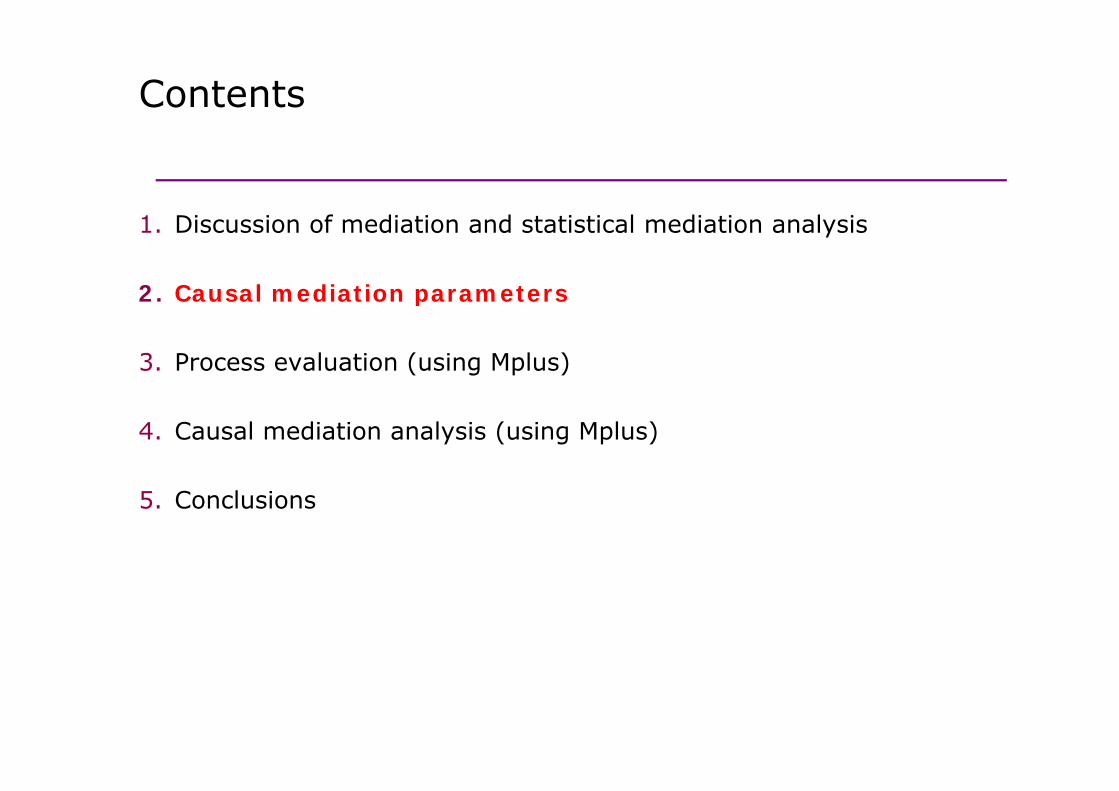
Contents
1 Di i f di ti d t ti ti l di ti l i1. Discussion of mediation and statistical mediation analysis
2. Causal mediation parametersp
3. Process evaluation (using Mplus)
4. Causal mediation analysis (using Mplus)
5. Conclusions
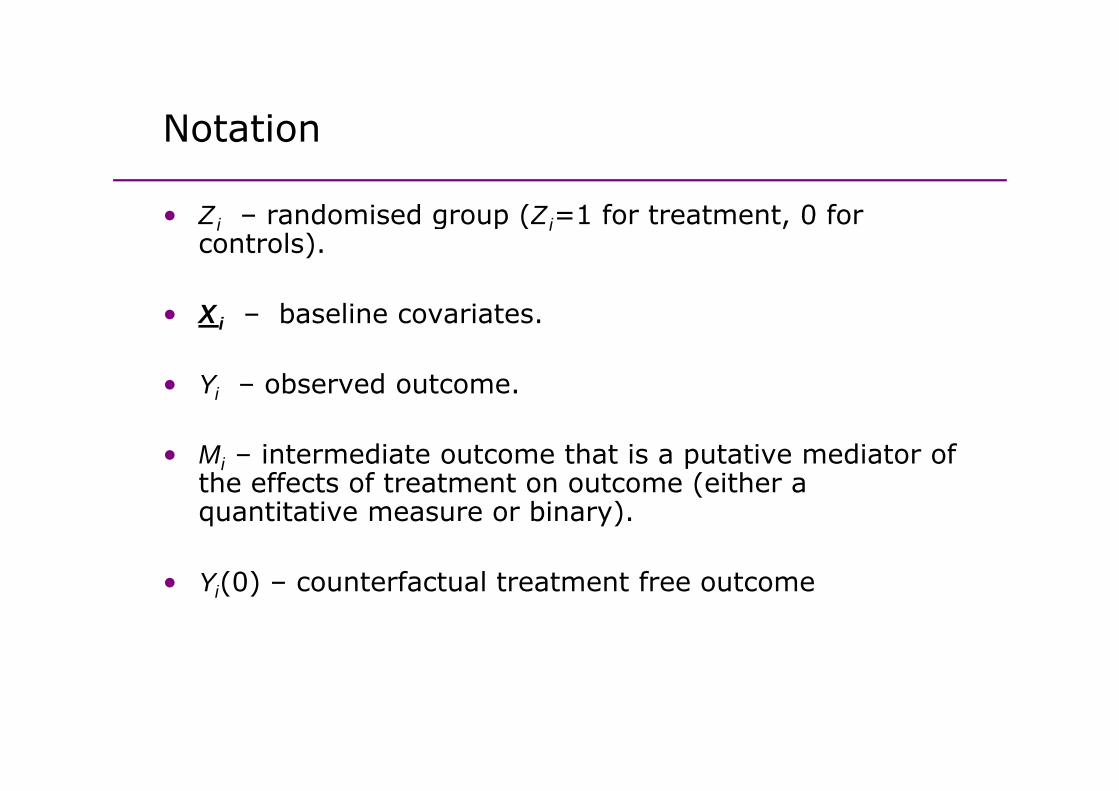
NotationNotation
• Z – randomised group (Z =1 for treatment 0 for • Zi – randomised group (Zi=1 for treatment, 0 for controls).
X b li i t• Xi – baseline covariates.
• Yi – observed outcome.i
• Mi – intermediate outcome that is a putative mediator of the effects of treatment on outcome (either a the effects of treatment on outcome (either a quantitative measure or binary).
Y (0) t f t l t t t f t• Yi(0) – counterfactual treatment free outcome

Notation and counterfactualsNotation and counterfactuals
We define the following counterfactual outcomes:We define the following counterfactual outcomes:
Mi(z) – mediator with treatment Z=z.
Yi(z,m) – outcome with treatment Z=z and level of mediator M=m.
Y (0) Y (0 M (0)) t if Z 0 ith di t M (0) Yi(0) = Yi(0,Mi(0)) – outcome if Z=0 with mediator Mi(0).
Yi(1) = Yi(1,Mi(1)) – outcome if Z=1 with mediator Mi(1).
In the control arm, Yi = Yi(0) and Mi = Mi(0), so Mi(0) and Yi(0) are observed and Mi(1) and Yi(1) are unobserved.
Similarly, in the treatment arm, Mi(0) and Yi(0) are unobserved and Mi = Mi(1) and Yi =Yi(1) are observed.

Causal mediation definitions: direct and indirect effects
• (Pure) natural direct effect: Y (1 M (0)) Y (0 M (0))• (Pure) natural direct effect: Yi(1,Mi(0))–Yi(0,Mi(0))The direct effect of random allocation given M(0), the ‘natural’ level of the mediator
• (Total) natural indirect effect: Yi(1,Mi(1))–Yi(1,Mi(0))The effect of the change in mediator if randomised to receive gtreatment (i.e. Z=1).
• Controlled direct effect: Yi(1 m)-Yi(0 m)• Controlled direct effect: Yi(1,m) Yi(0,m)Direct effect of randomisation on outcome at mediator level m.
T l Eff N l di ff N l i di ff• Total Effect = Natural direct effect + Natural indirect effect
(Pearl 2001;Robins & Greenland 1992).
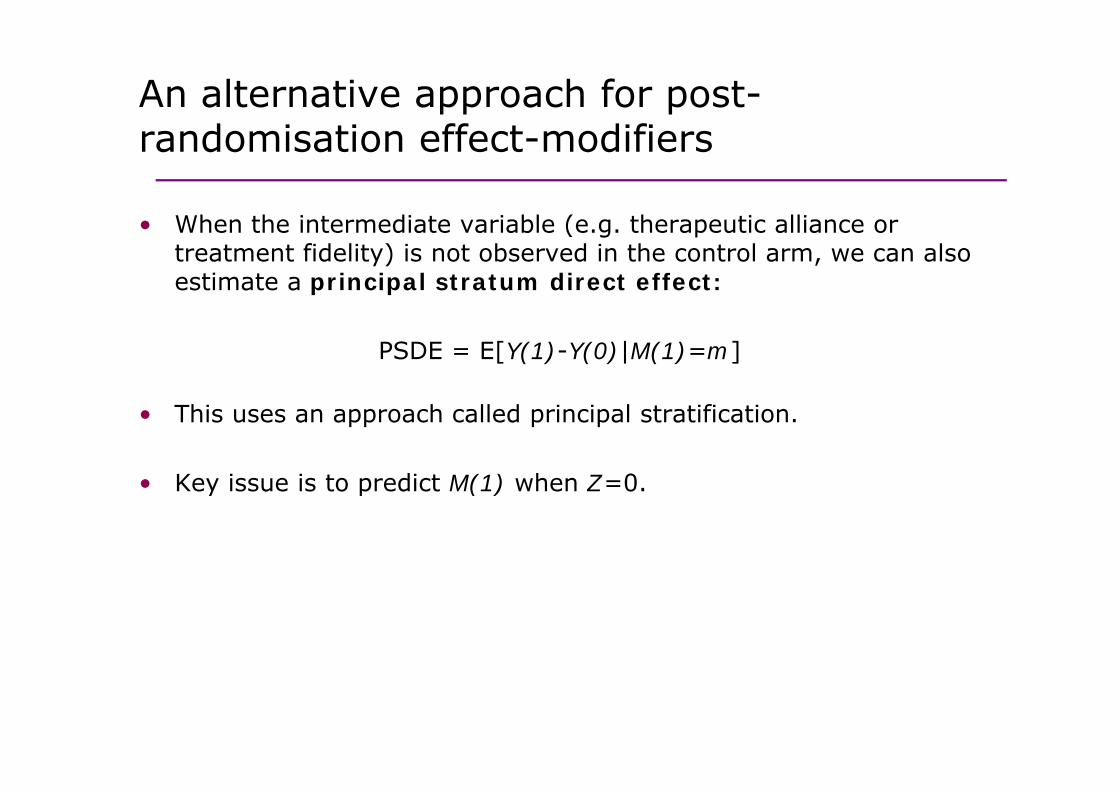
An alternative approach for post-d i ti ff t difirandomisation effect-modifiers
Wh th i t di t i bl ( th ti lli • When the intermediate variable (e.g. therapeutic alliance or treatment fidelity) is not observed in the control arm, we can also estimate a principal stratum direct effect:
PSDE = E[Y(1)-Y(0)|M(1)=m]
• This uses an approach called principal stratification.
• Key issue is to predict M(1) when Z=0• Key issue is to predict M(1) when Z=0.
Contents
1 Discussion of mediation and statistical mediation
Contents
1. Discussion of mediation and statistical mediation analysis
2. Causal mediation parameters
3 P l ti ( i M l )3. Process evaluation (using Mplus)
4. Causal mediation analysis (using Mplus)4. Causal mediation analysis (using Mplus)
5. Conclusions
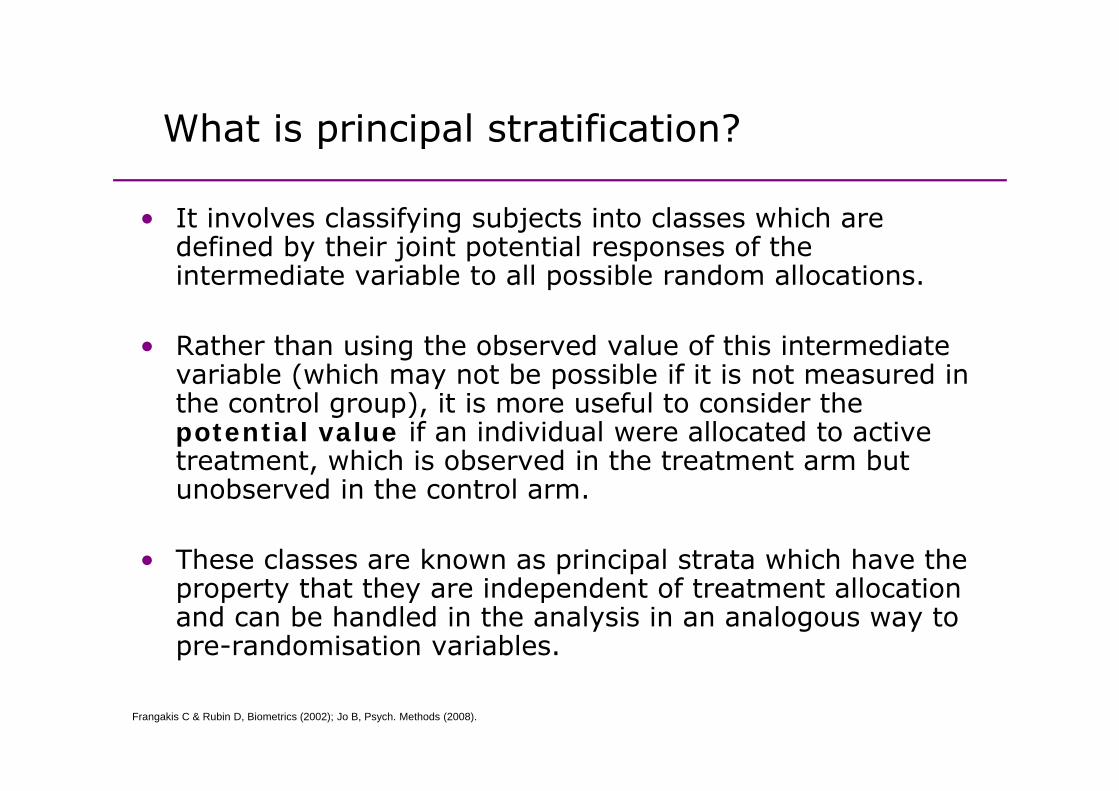
What is principal stratification?What is principal stratification?
• It involves classifying subjects into classes which are • It involves classifying subjects into classes which are defined by their joint potential responses of the intermediate variable to all possible random allocations.
• Rather than using the observed value of this intermediate variable (which may not be possible if it is not measured in th t l ) it i f l t id th the control group), it is more useful to consider the potential value if an individual were allocated to active treatment, which is observed in the treatment arm but unobserved in the control armunobserved in the control arm.
• These classes are known as principal strata which have the property that they are independent of treatment allocation and can be handled in the analysis in an analogous way to pre-randomisation variables.
Frangakis C & Rubin D, Biometrics (2002); Jo B, Psych. Methods (2008).
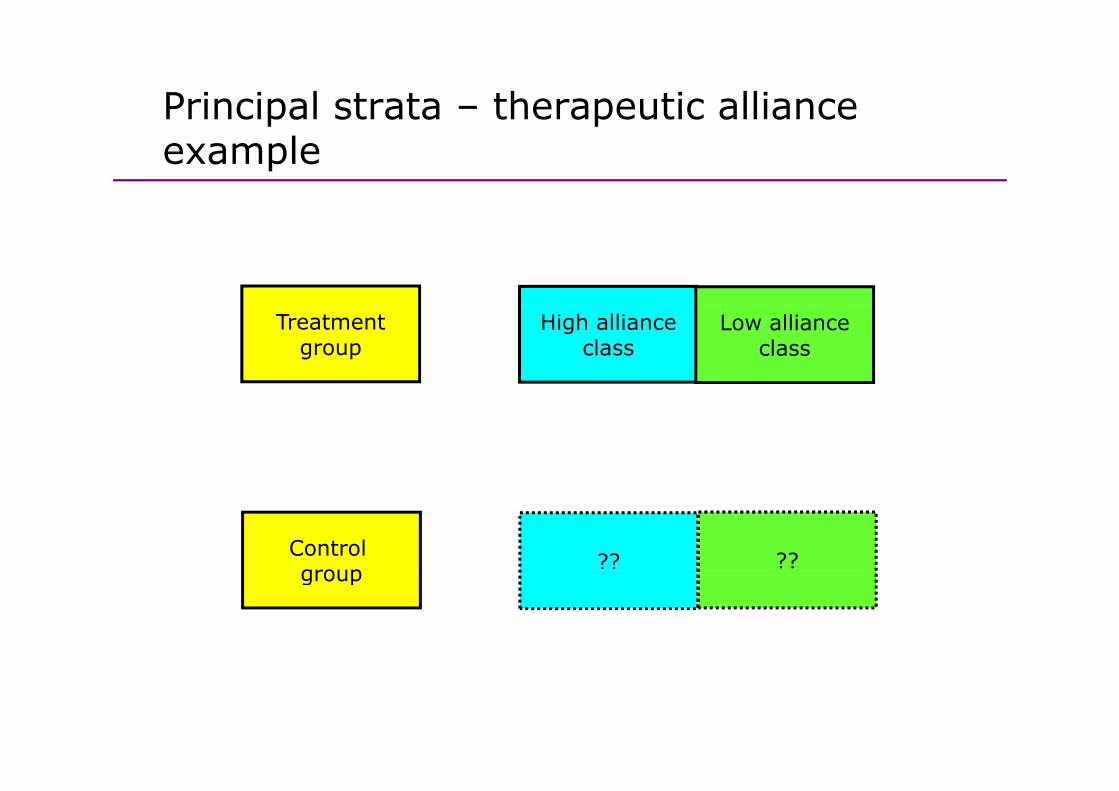
Principal strata – therapeutic alliance p pexample
Treatmentgroup
High allianceclass
Low allianceclass
Control group ?? ??group

Principal strata – therapeutic alliance p pexample
Treatmentgroup
High allianceclass
Low allianceclass
ITT effects
Control group
High allianceclass
Low allianceclassgroup class class
Principal strata model identificationPrincipal strata – model identification
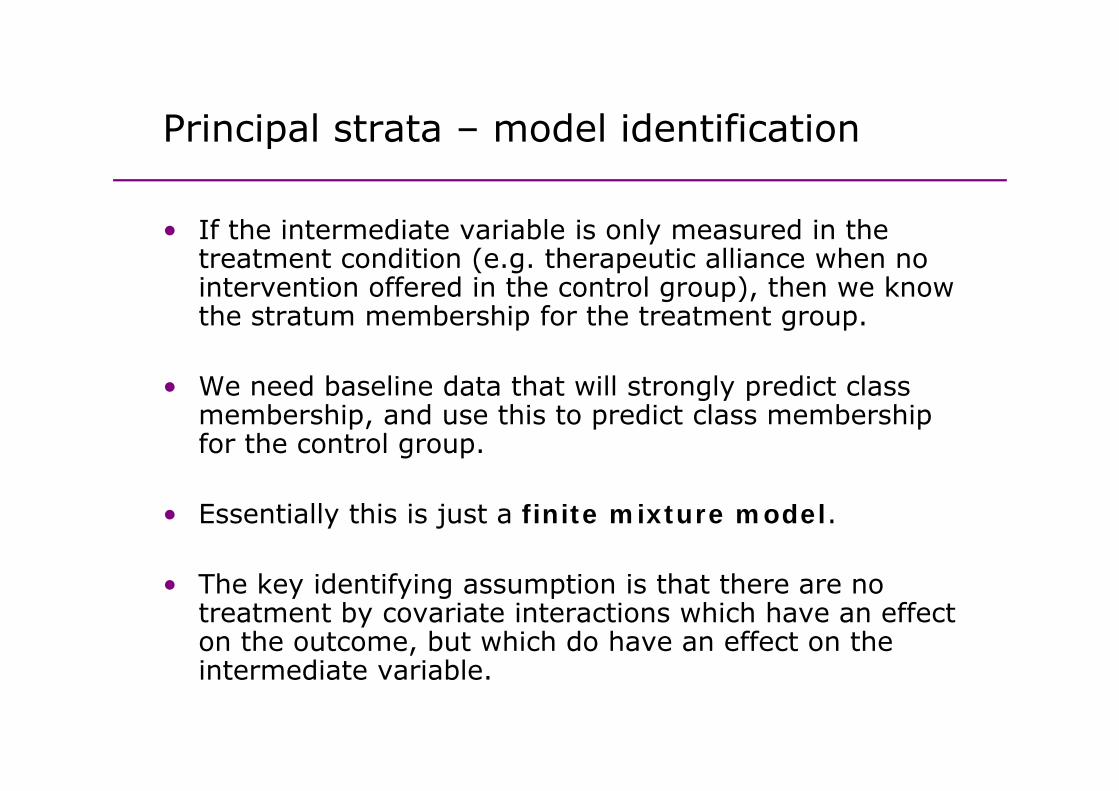
• If the intermediate variable is only measured in the treatment condition (e.g. therapeutic alliance when no intervention offered in the control group), then we know h b h f hthe stratum membership for the treatment group.
• We need baseline data that will strongly predict class e eed base e data t at st o g y p ed ct c assmembership, and use this to predict class membership for the control group.
• Essentially this is just a finite mixture model.
Th k id tif i ti i th t th • The key identifying assumption is that there are no treatment by covariate interactions which have an effect on the outcome, but which do have an effect on the inte mediate a iableintermediate variable.
Example: SoCRATES summaryExample: SoCRATES summary
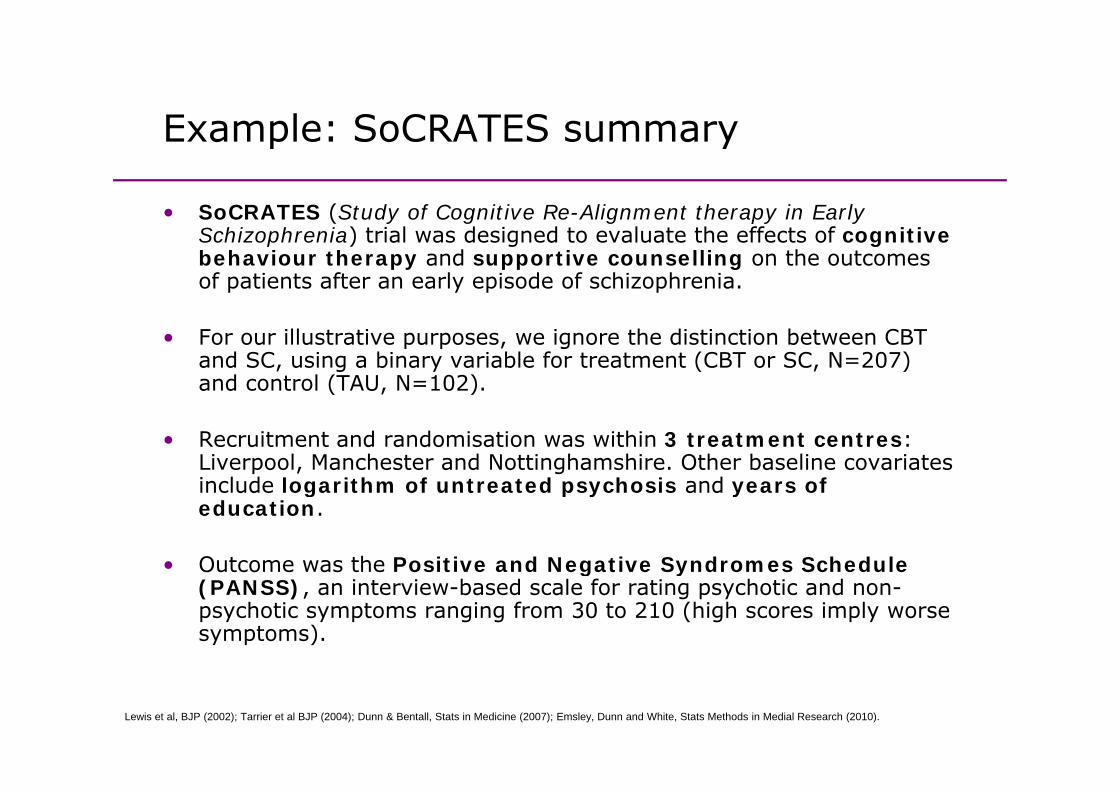
• SoCRATES (Study of Cognitive Re-Alignment therapy in Early • SoCRATES (Study of Cognitive Re Alignment therapy in Early Schizophrenia) trial was designed to evaluate the effects of cognitive behaviour therapy and supportive counselling on the outcomes of patients after an early episode of schizophrenia.
• For our illustrative purposes, we ignore the distinction between CBT and SC, using a binary variable for treatment (CBT or SC, N=207) and control (TAU, N=102).
• Recruitment and randomisation was within 3 treatment centres: Liverpool, Manchester and Nottinghamshire. Other baseline covariates include logarithm of untreated psychosis and years of include logarithm of untreated psychosis and years of education.
• Outcome was the Positive and Negative Syndromes Schedule g y(PANSS), an interview-based scale for rating psychotic and non-psychotic symptoms ranging from 30 to 210 (high scores imply worse symptoms).
Lewis et al, BJP (2002); Tarrier et al BJP (2004); Dunn & Bentall, Stats in Medicine (2007); Emsley, Dunn and White, Stats Methods in Medial Research (2010).

Example: therapeutic alliance in SoCRATESExample: therapeutic alliance in SoCRATES
• Therapeutic alliance was measured at the 4th session of • Therapeutic alliance was measured at the 4th session of therapy, early in the time-course of the intervention, but not too early to assess the development of the
l ti hi b t th i t d ti t W relationship between therapist and patient. We use a patient rating of alliance based on the CALPAS scale.
• Total CALPAS scores (ranging from 0, indicating low alliance, to 7, indicating high alliance) were used in some of the analyses reported previously but here we some of the analyses reported previously, but here we also use a binary alliance variable (1 if CALPAS score ≥5, otherwise 0).
• Not measured in the control group.
Lewis et al, BJP (2002); Tarrier et al BJP (2004); Dunn & Bentall, Stats in Medicine (2007); Emsley, Dunn and White, Stats Methods in Medial Research (2010).
Example: missing data in SoCRATESExample: missing data in SoCRATES
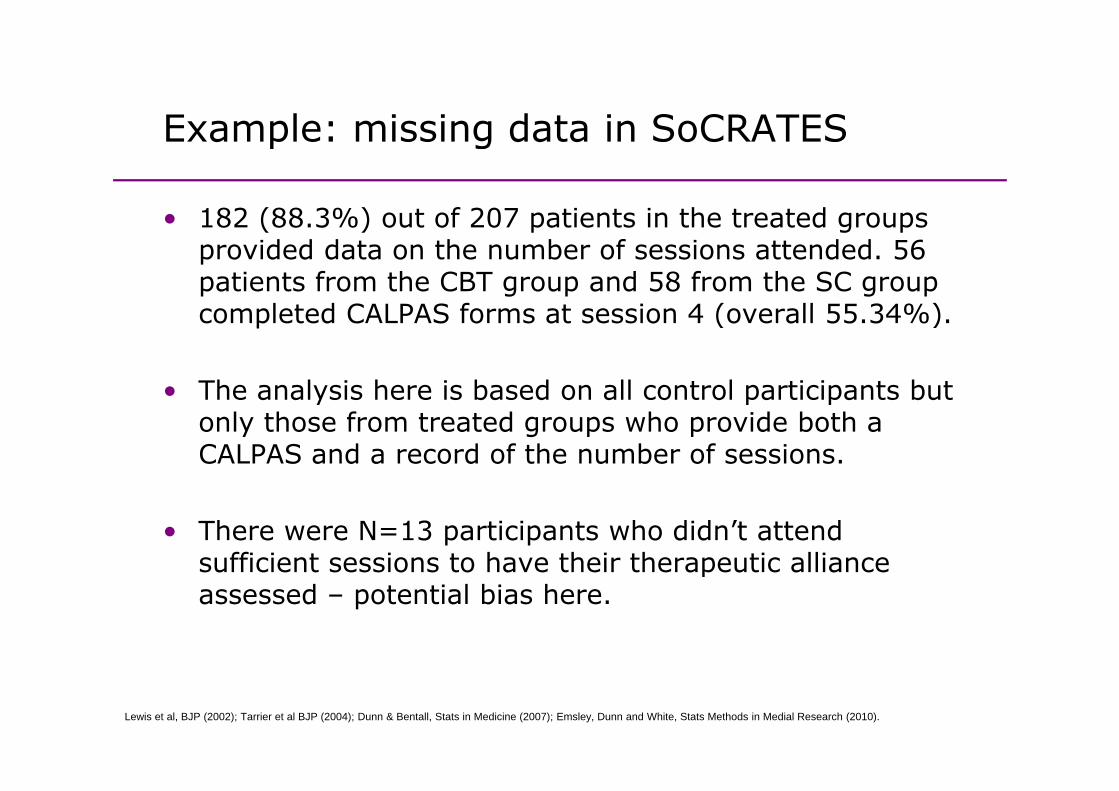
• 182 (88 3%) out of 207 patients in the treated groups • 182 (88.3%) out of 207 patients in the treated groups provided data on the number of sessions attended. 56 patients from the CBT group and 58 from the SC group
l t d CALPAS f t i 4 ( ll 55 34%)completed CALPAS forms at session 4 (overall 55.34%).
• The analysis here is based on all control participants but • The analysis here is based on all control participants but only those from treated groups who provide both a CALPAS and a record of the number of sessions.
• There were N=13 participants who didn’t attend sufficient sessions to have their therapeutic alliance passessed – potential bias here.
Lewis et al, BJP (2002); Tarrier et al BJP (2004); Dunn & Bentall, Stats in Medicine (2007); Emsley, Dunn and White, Stats Methods in Medial Research (2010).

Principal stratification in SoCRATESPrincipal stratification in SoCRATES
• We can postulate the existence of two principal strata:• We can postulate the existence of two principal strata:
High alliance participants – those observed to have a h h ll h h h h hhigh alliance in the therapy group together with those in the control group who would have had a high alliance had they been allocated to receive therapy.
Low alliance participants – those observed to have a low alliance in the therapy group together with those in low alliance in the therapy group together with those in the control group who would have had a low alliance had they been allocated to receive therapy.
Lewis et al, BJP (2002); Tarrier et al BJP (2004); Dunn & Bentall, Stats in Medicine (2007); Emsley, Dunn and White, Stats Methods in Medial Research (2010).
Mplus input: SoCRATES allianceMplus input: SoCRATES alliance
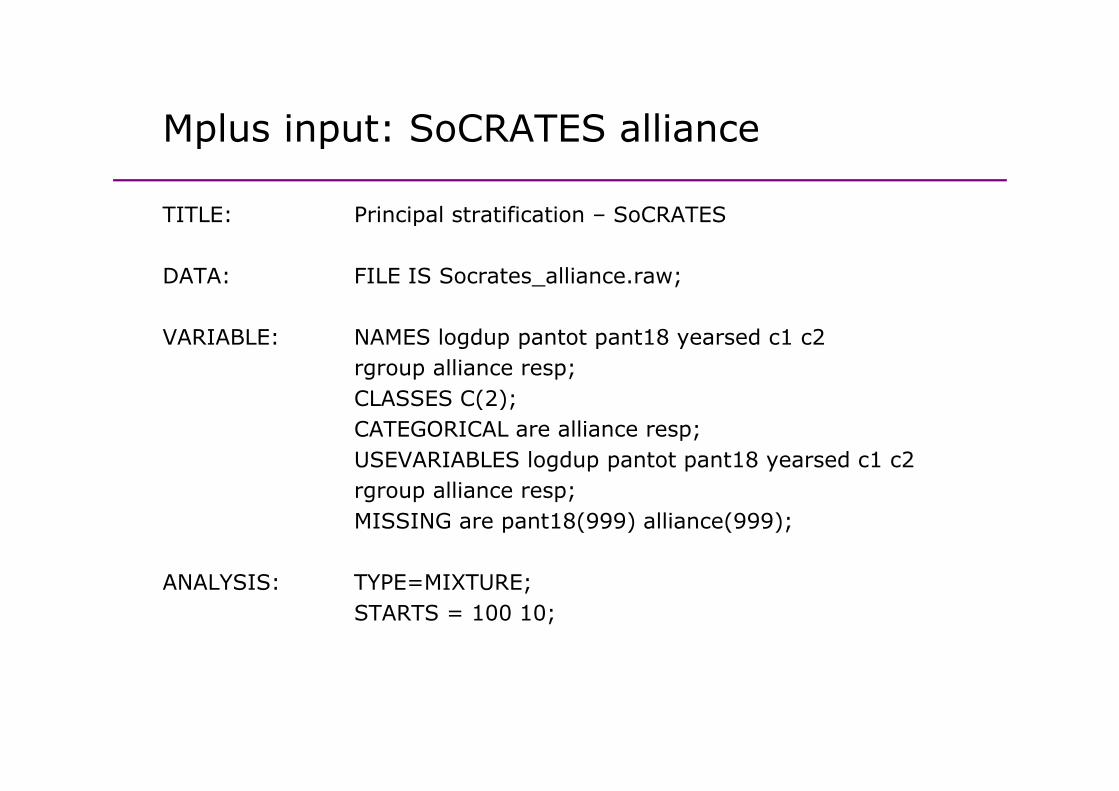
TITLE: Principal stratification – SoCRATESTITLE: Principal stratification – SoCRATES
DATA: FILE IS Socrates_alliance.raw;
VARIABLE: NAMES logdup pantot pant18 yearsed c1 c2rgroup alliance resp;CLASSES C(2);CLASSES C(2);CATEGORICAL are alliance resp;USEVARIABLES logdup pantot pant18 yearsed c1 c2
lli rgroup alliance resp;MISSING are pant18(999) alliance(999);
ANALYSIS TYPE MIXTUREANALYSIS: TYPE=MIXTURE;STARTS = 100 10;
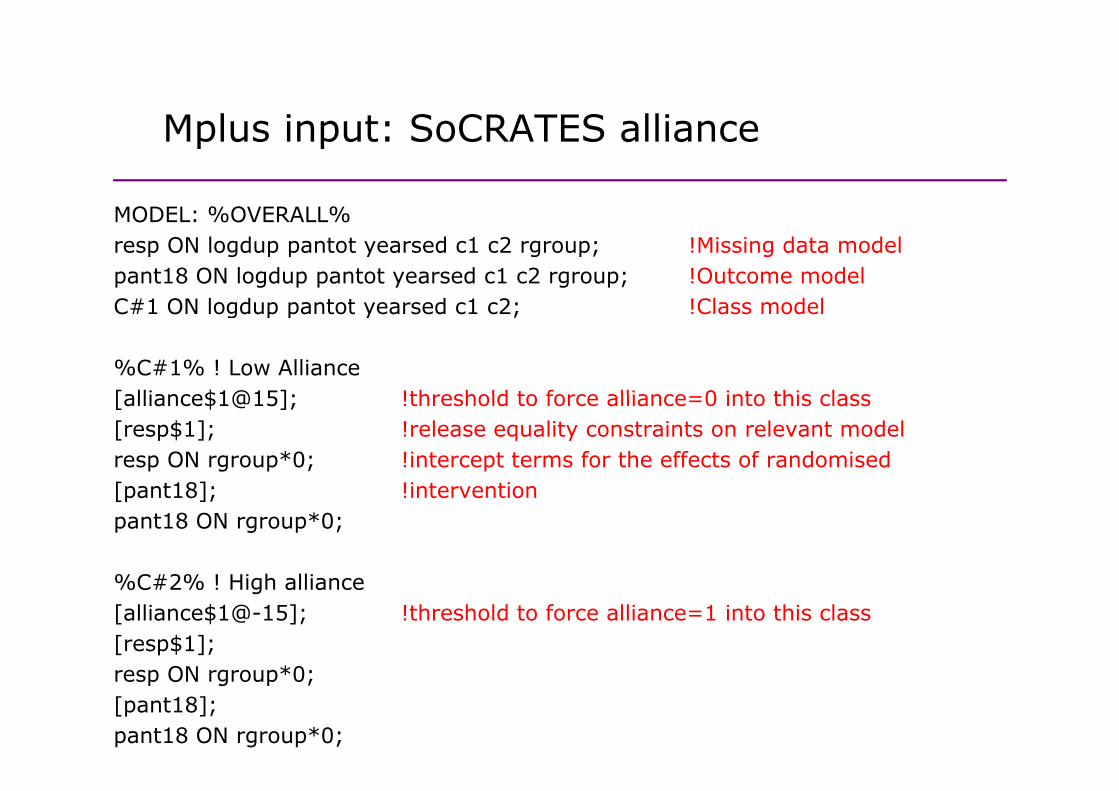
Mplus input: SoCRATES allianceMplus input: SoCRATES alliance
MODEL: %OVERALL%MODEL: %OVERALL%resp ON logdup pantot yearsed c1 c2 rgroup; !Missing data modelpant18 ON logdup pantot yearsed c1 c2 rgroup; !Outcome modelC#1 ON logdup pantot yearsed c1 c2; !Class modelC#1 ON logdup pantot yearsed c1 c2; !Class model
%C#1% ! Low Alliance[alliance$1@15]; !threshold to force alliance 0 into this class[alliance$1@15]; !threshold to force alliance=0 into this class[resp$1]; !release equality constraints on relevant modelresp ON rgroup*0; !intercept terms for the effects of randomised[ t18] !i t ti[pant18]; !interventionpant18 ON rgroup*0;
%C#2% ! Hi h lli%C#2% ! High alliance[alliance$1@-15]; !threshold to force alliance=1 into this class[resp$1];resp ON rgroup*0;[pant18];pant18 ON rgroup*0;
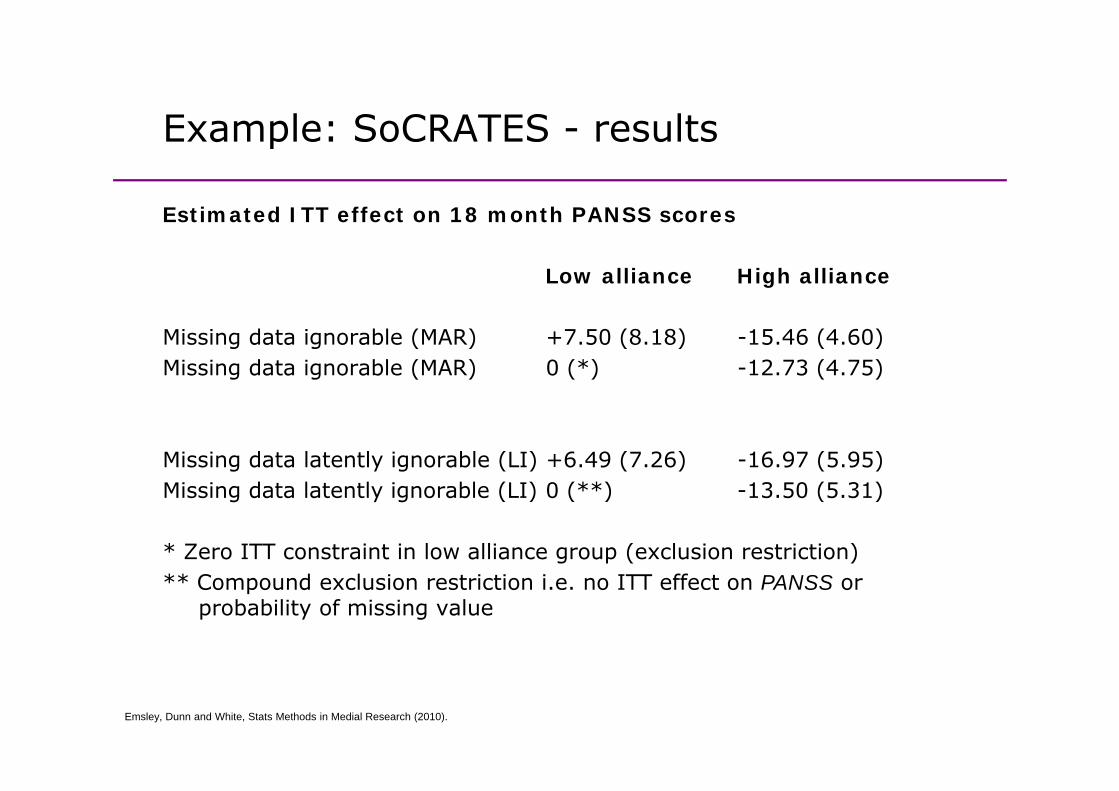
Example: SoCRATES resultsExample: SoCRATES - results
Estimated ITT effect on 18 month PANSS scoresEstimated ITT effect on 18 month PANSS scores
Low alliance High alliance
Missing data ignorable (MAR) +7.50 (8.18) -15.46 (4.60)Missing data ignorable (MAR) 0 (*) -12.73 (4.75)
Missing data latently ignorable (LI) +6.49 (7.26) -16.97 (5.95)Mi i d t l t tl i bl (LI) 0 (**) 13 50 (5 31)Missing data latently ignorable (LI) 0 (**) -13.50 (5.31)
* Zero ITT constraint in low alliance group (exclusion restriction)** C d l i t i ti i ITT ff t PANSS ** Compound exclusion restriction i.e. no ITT effect on PANSS or
probability of missing value
Emsley, Dunn and White, Stats Methods in Medial Research (2010).
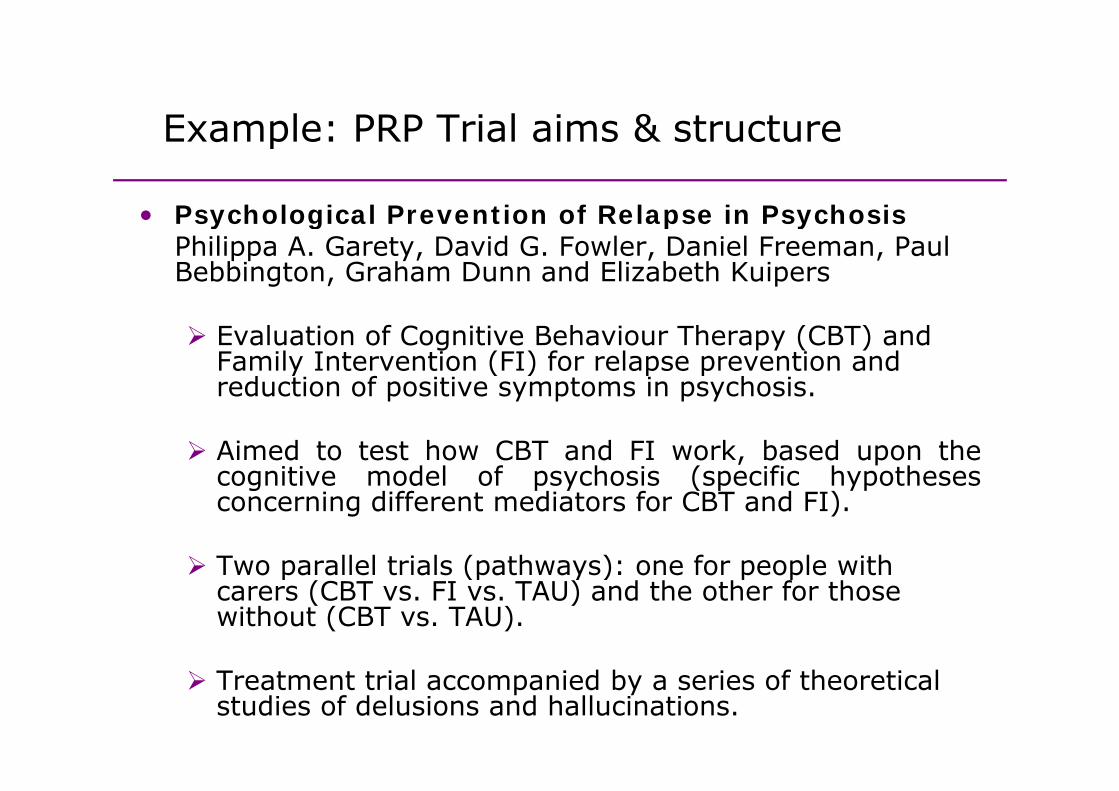
Example: PRP Trial aims & structureExample: PRP Trial aims & structure
• Psychological Prevention of Relapse in Psychosis• Psychological Prevention of Relapse in PsychosisPhilippa A. Garety, David G. Fowler, Daniel Freeman, Paul Bebbington, Graham Dunn and Elizabeth Kuipers
Evaluation of Cognitive Behaviour Therapy (CBT) and Family Intervention (FI) for relapse prevention and reduction of positive symptoms in psychosis.reduction of positive symptoms in psychosis.
Aimed to test how CBT and FI work, based upon thecognitive model of psychosis (specific hypothesescognitive model of psychosis (specific hypothesesconcerning different mediators for CBT and FI).
Two parallel trials (pathways): one for people with o pa a e t a s (pat ays) o e o peop e tcarers (CBT vs. FI vs. TAU) and the other for those without (CBT vs. TAU).
Treatment trial accompanied by a series of theoretical studies of delusions and hallucinations.
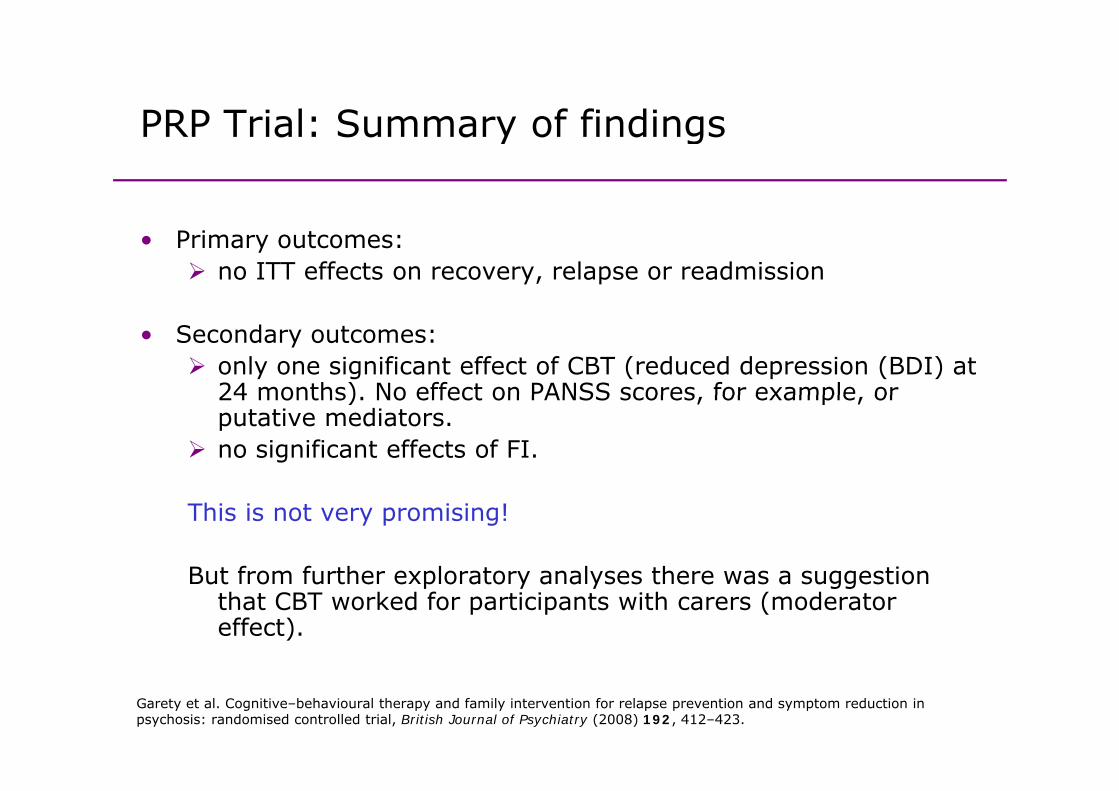
PRP Trial: Summary of findings PRP Trial: Summary of findings
• Primary outcomes:no ITT effects on recovery, relapse or readmission
• Secondary outcomes:only one significant effect of CBT (reduced depression (BDI) at 24 months) No effect on PANSS scores for example or 24 months). No effect on PANSS scores, for example, or putative mediators. no significant effects of FI.
This is not very promising!
But from further exploratory analyses there was a suggestion But from further exploratory analyses there was a suggestion that CBT worked for participants with carers (moderator effect).
Garety et al. Cognitive–behavioural therapy and family intervention for relapse prevention and symptom reduction in psychosis: randomised controlled trial, British Journal of Psychiatry (2008) 192, 412–423.

PRP Trial: Was treatment as intended?PRP Trial: Was treatment as intended?
• We consider patient engagement in therapy procedures as a potential treatment-effect moderator (for this we now drop the FI arm).
• Determined by careful examination of recordings of therapy sessions using the Cognitive Therapy for Psychosis Adherence Scale (CTPAS) and Cognitive Therapy Scales(CTS)(CTS).
• CTPAS/CTS classification:No dose (21)No dose (21)Medium dose (39)Full dose (42)
• Dose not defined (missing) in TAU arm.
• A few dose assessments missing in CBT arm• A few dose assessments missing in CBT arm.
Dunn et al. (2012). The effective elements of CBT for psychosis. Psychological Medicine (In Press).
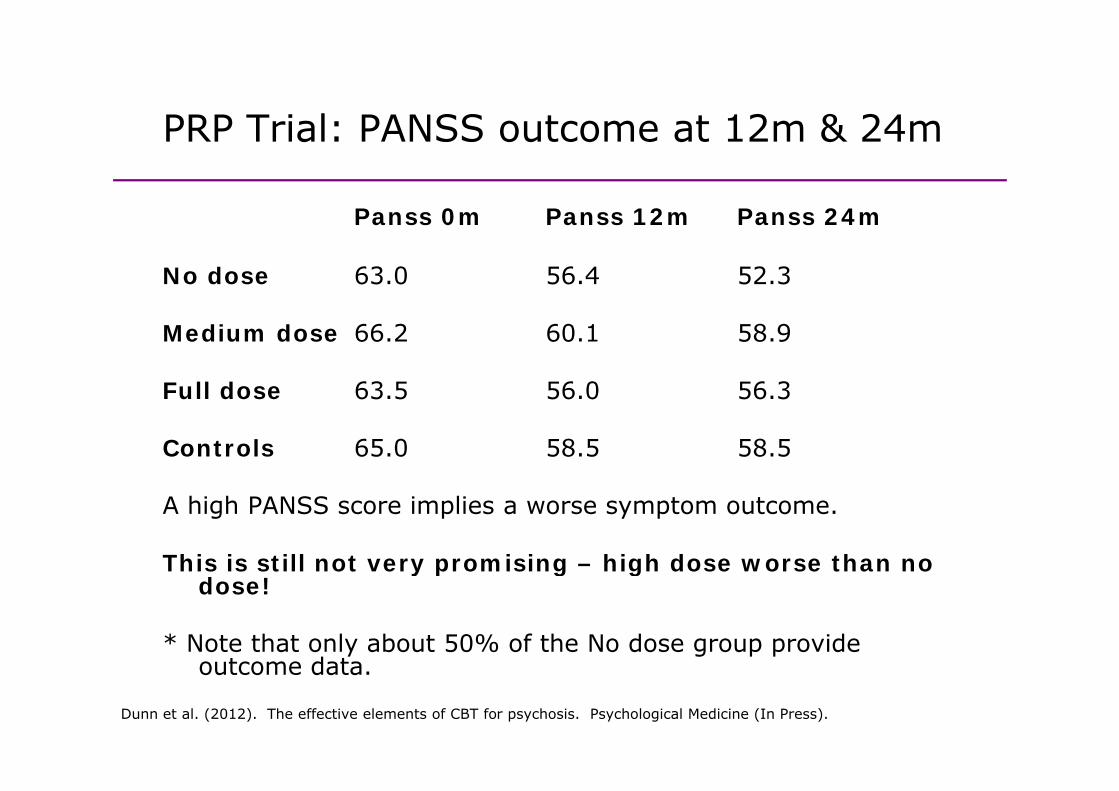
PRP Trial: PANSS outcome at 12m & 24mPRP Trial: PANSS outcome at 12m & 24m
Panss 0m Panss 12m Panss 24mPanss 0m Panss 12m Panss 24m
No dose 63.0 56.4 52.3
Medium dose 66.2 60.1 58.9
Full dose 63 5 56 0 56 3Full dose 63.5 56.0 56.3
Controls 65.0 58.5 58.5
A high PANSS score implies a worse symptom outcome.
This is still not very promising – high dose worse than no y p g gdose!
* Note that only about 50% of the No dose group provide outcome dataoutcome data.
Dunn et al. (2012). The effective elements of CBT for psychosis. Psychological Medicine (In Press).

PRP Trial: Principal stratificationPRP Trial: Principal stratification
Defined as before in terms of potential response to randomisationDefined as before in terms of potential response to randomisation
• Statum 1: a group of participants who receive little or no therapywhatever their treatment allocation.
• Stratum 2: a group of participants who would receive no therapy if allocated to the control condition but a medium dose of CBT if allocated to the treatment group.
• Stratum 3: a group who would receive no therapy if allocated to the control condition but a full dose of CBT if allocated to the treatment group.
• Membership of one of these three classes (the Principal Strata) is directly observable in the CBT arm but remains latent (hidden) under TAU.
• Principal stratum membership is independent of treatment allocation.
• Potentially we can stratify by stratum membership and evaluate the ITT • Potentially, we can stratify by stratum membership and evaluate the ITT effects of treatment allocation within these strata.
Dunn et al. (2012). The effective elements of CBT for psychosis. Psychological Medicine (In Press).
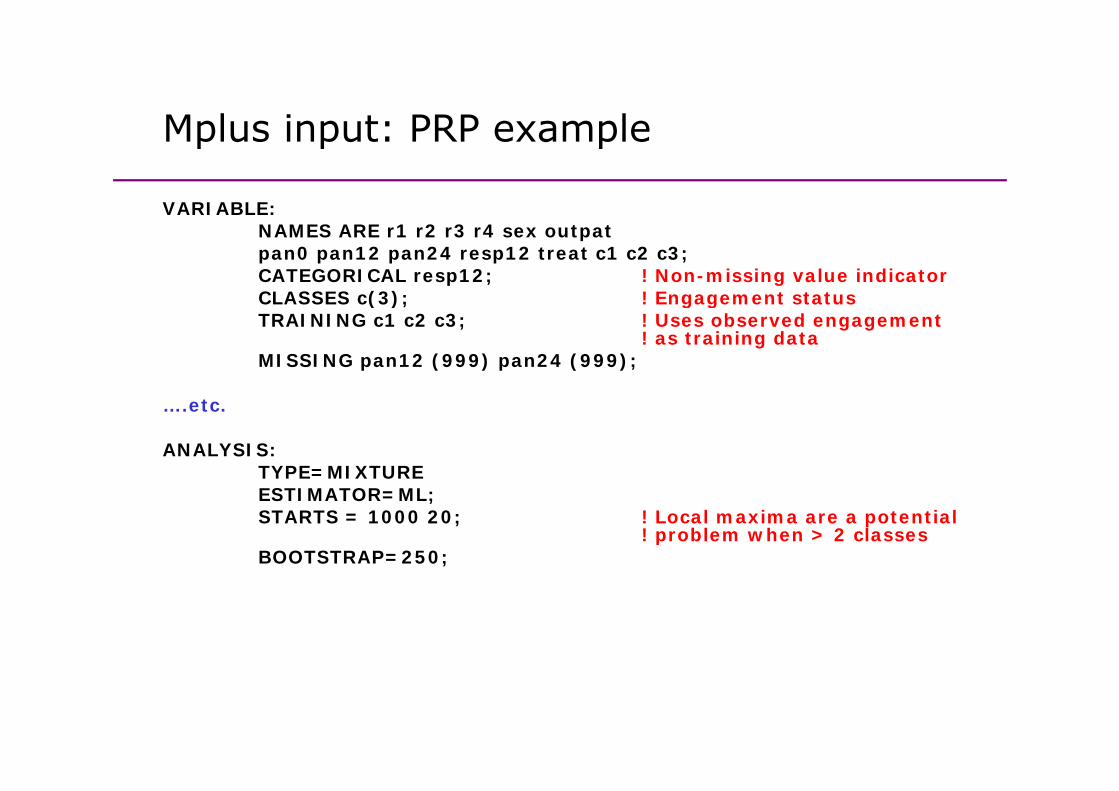
Mplus input: PRP exampleMplus input: PRP example
VARIABLE:NAMES ARE r1 r2 r3 r4 sex outpatpan0 pan12 pan24 resp12 treat c1 c2 c3;CATEGORICAL resp12; ! Non-missing value indicatorCLASSES c(3); ! Engagement status( ); g gTRAINING c1 c2 c3; ! Uses observed engagement
! as training dataMISSING pan12 (999) pan24 (999);
….etc.
ANALYSIS: TYPE=MIXTUREESTIMATOR=ML;STARTS = 1000 20; ! Local maxima are a potential
! problem when > 2 classesBOOTSTRAP=250;
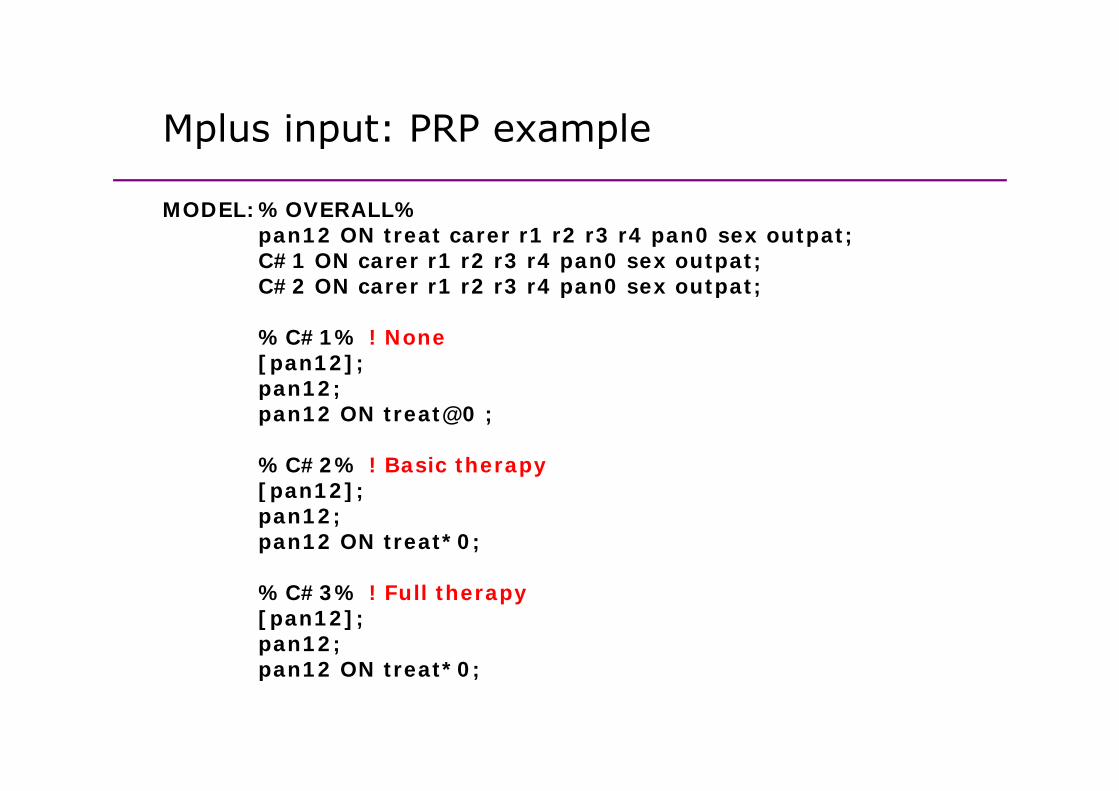
Mplus input: PRP exampleMplus input: PRP example
MODEL:%OVERALL%MODEL:%OVERALL%pan12 ON treat carer r1 r2 r3 r4 pan0 sex outpat;C#1 ON carer r1 r2 r3 r4 pan0 sex outpat;C#2 ON carer r1 r2 r3 r4 pan0 sex outpat;
%C#1% ! None[pan12];pan12;pan12;pan12 ON treat@0 ;
%C#2% ! Basic therapy[ 12][pan12];pan12;pan12 ON treat*0;
%C#3% ! Full therapy[pan12];pan12;pan12 ON treat*0;pan12 ON treat*0;
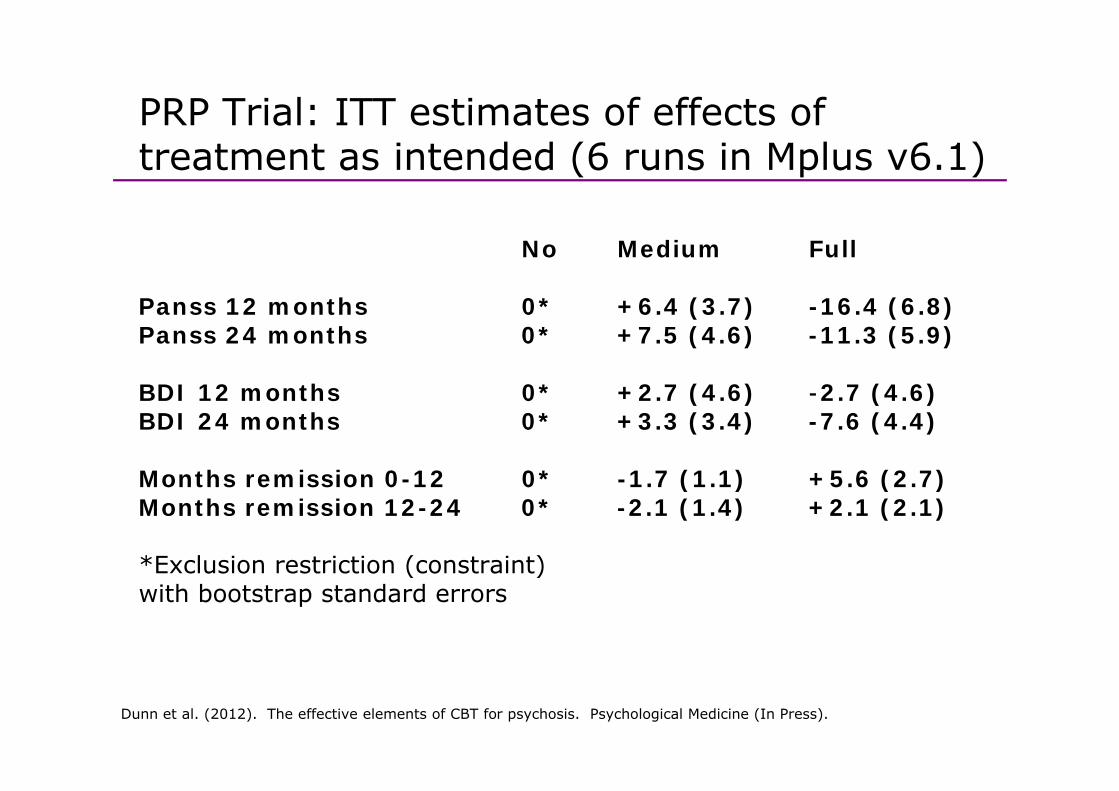
PRP Trial: ITT estimates of effects of treatment as intended (6 runs in Mplus v6.1)
No Medium Full
Panss 12 months 0* +6 4 (3 7) -16 4 (6 8)Panss 12 months 0* +6.4 (3.7) -16.4 (6.8)Panss 24 months 0* +7.5 (4.6) -11.3 (5.9)
BDI 12 months 0* +2 7 (4 6) -2 7 (4 6)BDI 12 months 0 +2.7 (4.6) 2.7 (4.6)BDI 24 months 0* +3.3 (3.4) -7.6 (4.4)
Months remission 0-12 0* -1.7 (1.1) +5.6 (2.7)Months remission 0 12 0 1.7 (1.1) +5.6 (2.7)Months remission 12-24 0* -2.1 (1.4) +2.1 (2.1)
*Exclusion restriction (constraint)( )with bootstrap standard errors
Dunn et al. (2012). The effective elements of CBT for psychosis. Psychological Medicine (In Press).
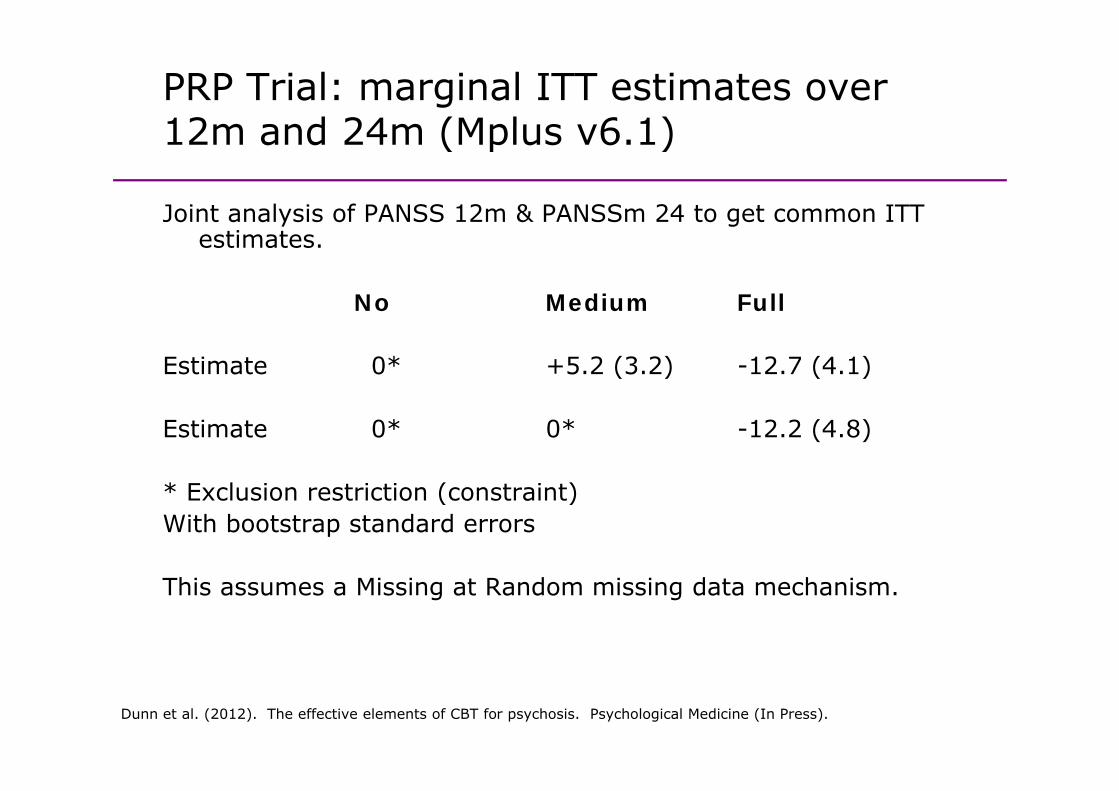
PRP Trial: marginal ITT estimates over 12m and 24m (Mplus v6 1)12m and 24m (Mplus v6.1)
Joint analysis of PANSS 12m & PANSSm 24 to get common ITT Joint analysis of PANSS 12m & PANSSm 24 to get common ITT estimates.
No Medium FullNo Medium Full
Estimate 0* +5.2 (3.2) -12.7 (4.1)
Estimate 0* 0* -12.2 (4.8)
* E l i t i ti ( t i t)* Exclusion restriction (constraint)With bootstrap standard errors
This assumes a Missing at Random missing data mechanism.
Dunn et al. (2012). The effective elements of CBT for psychosis. Psychological Medicine (In Press).
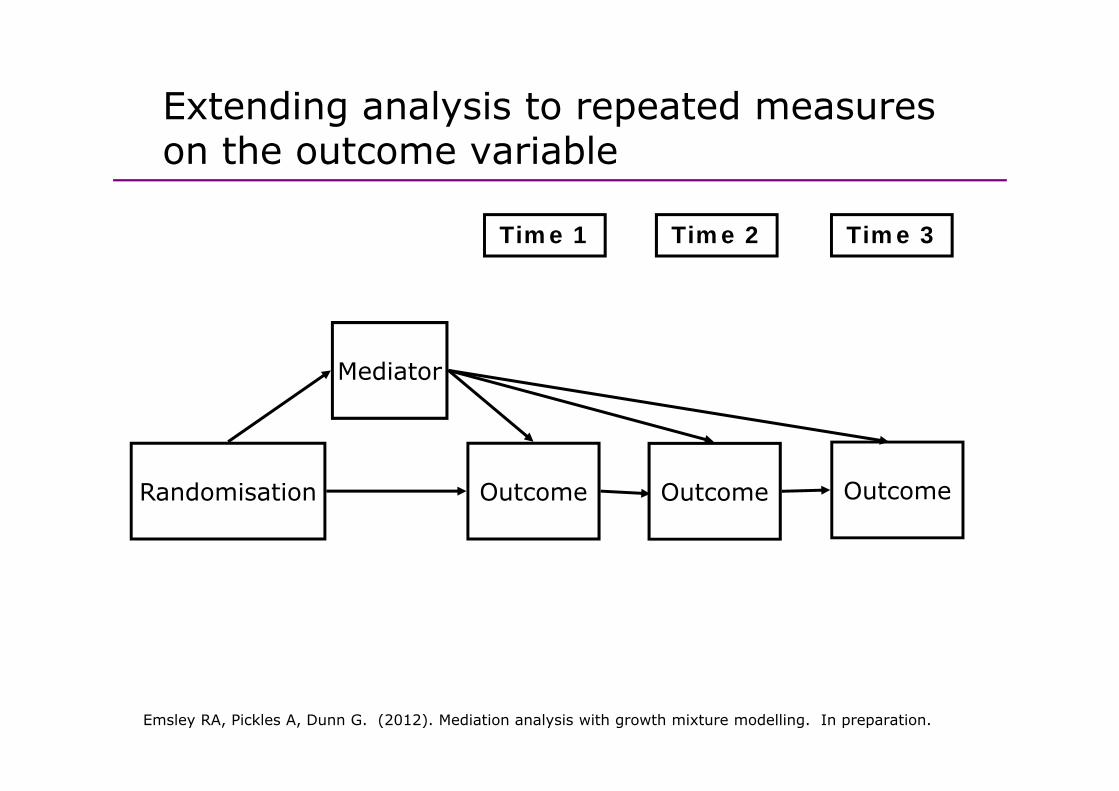
Extending analysis to repeated measures g y pon the outcome variable
Time 1 Time 2 Time 3
Mediator
R d i ti O t O t O tRandomisation Outcome Outcome Outcome
Emsley RA, Pickles A, Dunn G. (2012). Mediation analysis with growth mixture modelling. In preparation.
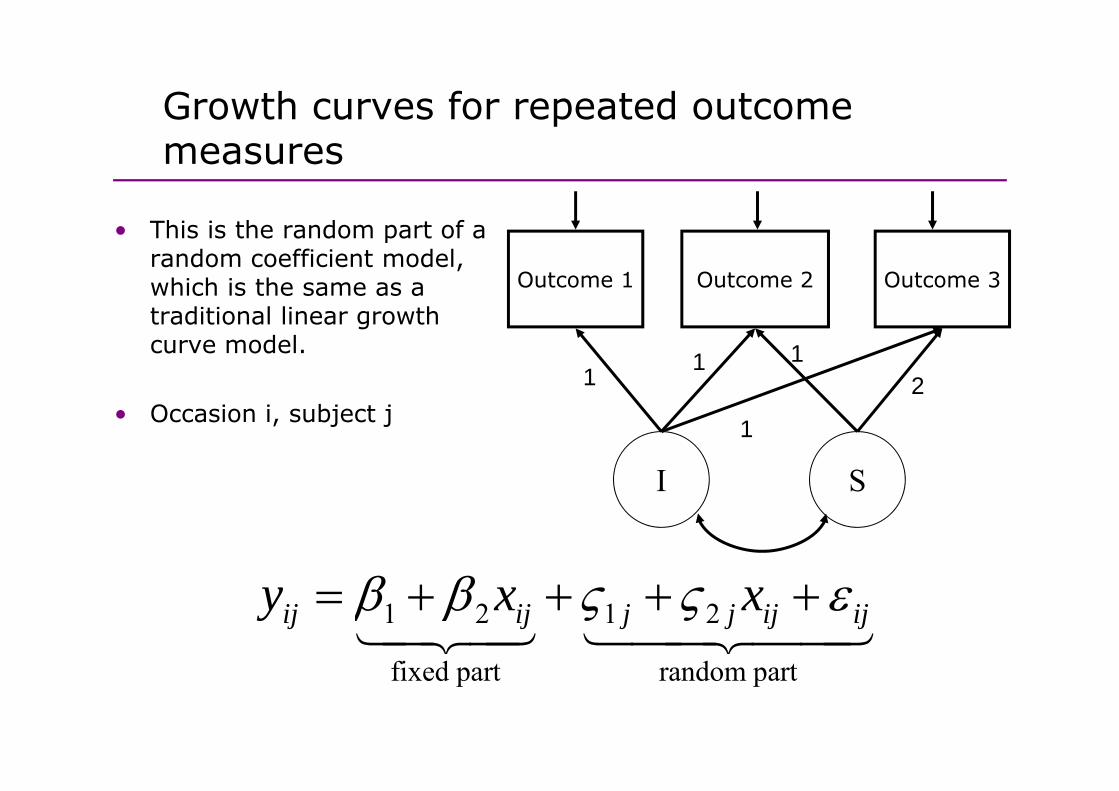
Growth curves for repeated outcome pmeasures
• This is the random part of a random coefficient model, which is the same as a Outcome 1 Outcome 2 Outcome 3
traditional linear growth curve model.
1 1 12
• Occasion i, subject j
I S
1
I S
1 2 1 2
fi d t d t
ij ij j j ij ijy x xβ β ς ς ε= + + + +14243 1442443
fixed part random part

Example: SoCRATES trial againExample: SoCRATES trial again
• Instead of simply analysing the 18 month outcomes, we use the fact that the PANSS was administered
at baseline (time score 0)6 weeks (1.94591)3 h (2 5649493)3 months (2.5649493)9 months (3.6109178)18 months (4.3694477)( )
• In the analyses we log transformed the timescale measured in weeks and exploring each trajectory suggests a in weeks, and exploring each trajectory suggests a quadratic trajectory slope. We use Mplus v6.12.
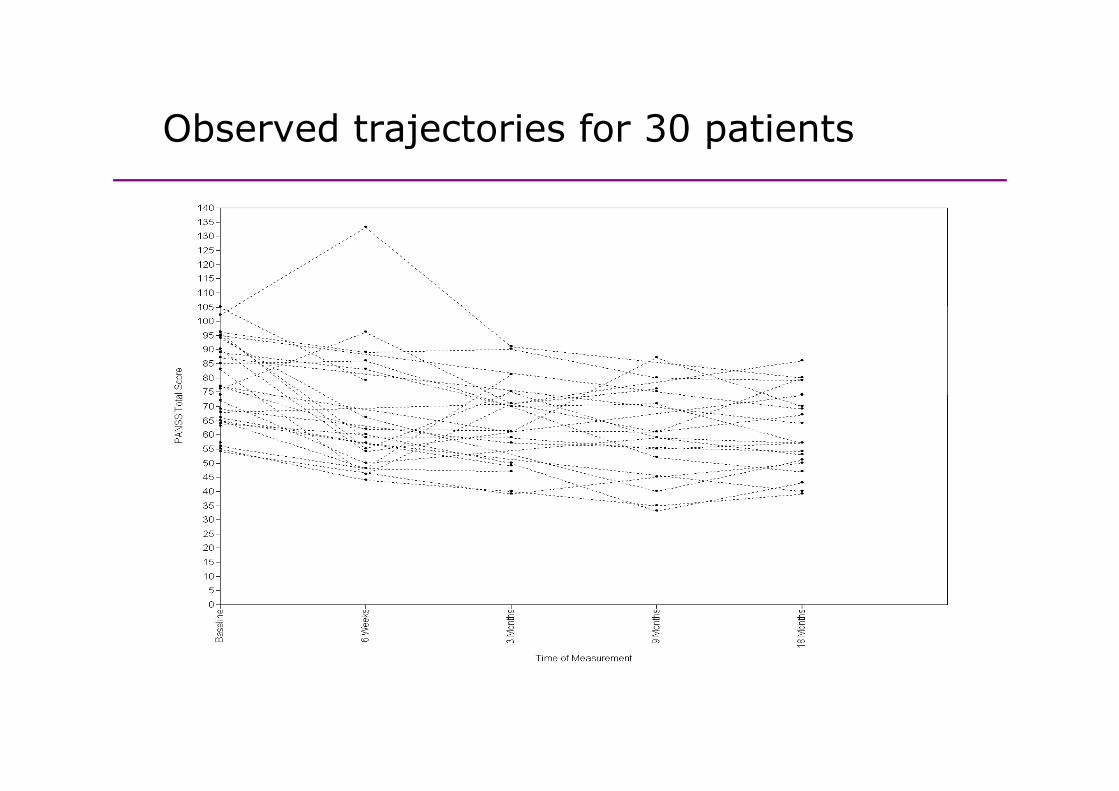
Observed trajectories for 30 patientsObserved trajectories for 30 patients
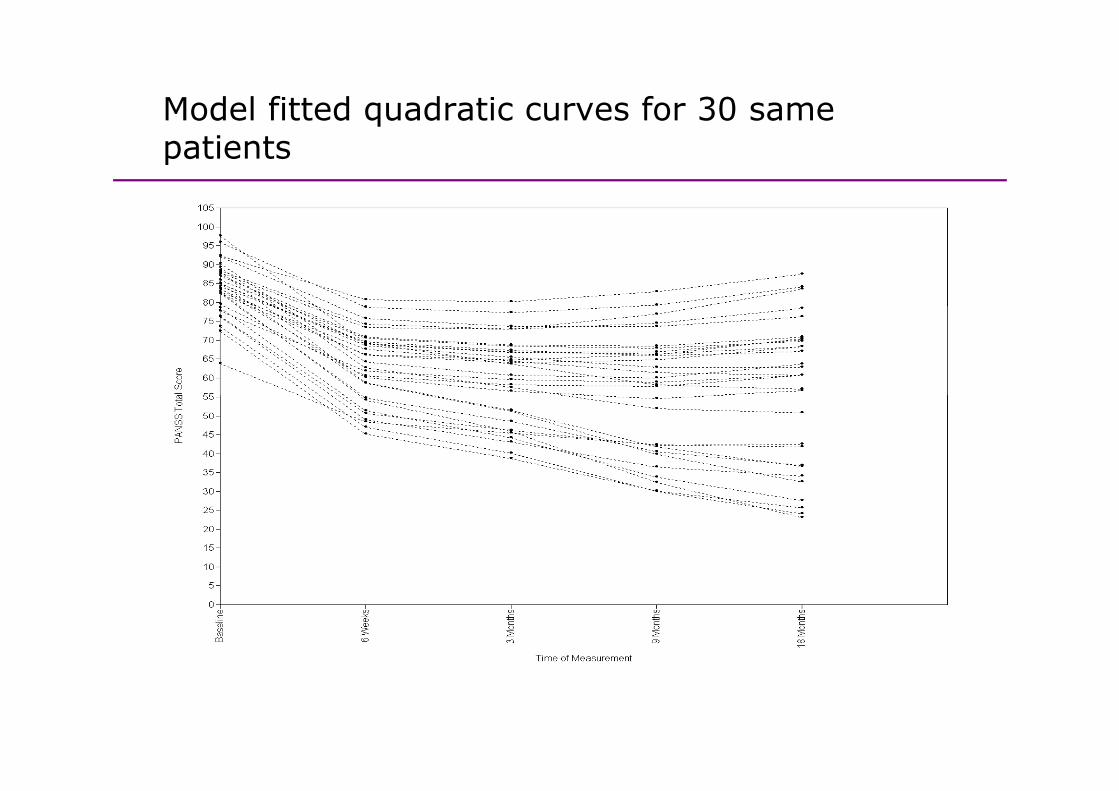
Model fitted quadratic curves for 30 same qpatients
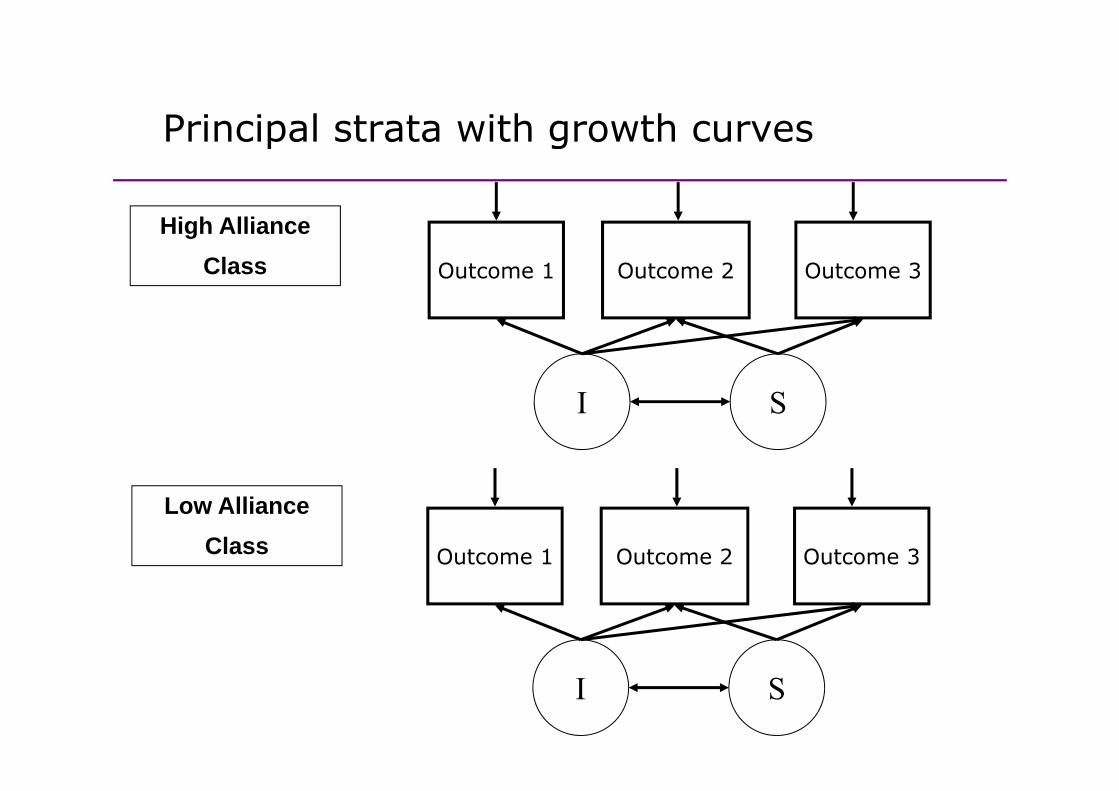
Principal strata with growth curvesPrincipal strata with growth curves
High AllianceClass Outcome 1 Outcome 2 Outcome 3
I SI S
Low AllianceClass Outcome 1 Outcome 2 Outcome 3
I S

Mixture modellingMixture modelling
• Mixture modeling refers to modeling with categorical latent • Mixture modeling refers to modeling with categorical latent variables that represent subpopulations where population membership is not known but is inferred from the data – such as principal strataas principal strata.
• The simplest longitudinal mixture model is latent class growth analysis (LCGA) In LCGA the mixture corresponds growth analysis (LCGA). In LCGA, the mixture corresponds to different latent trajectory classes. No variation across individuals is allowed within classes.
• Another longitudinal mixture model is the growth mixture model (GMM). In GMM, within class variation of individuals is ll d f h l j l Th i hi l allowed for the latent trajectory classes. The within-class
variation is represented by random effects, that is, continuous latent variables, as in regular growth modeling.
Muthen and Muthen (2008). MPlus User’s Guide
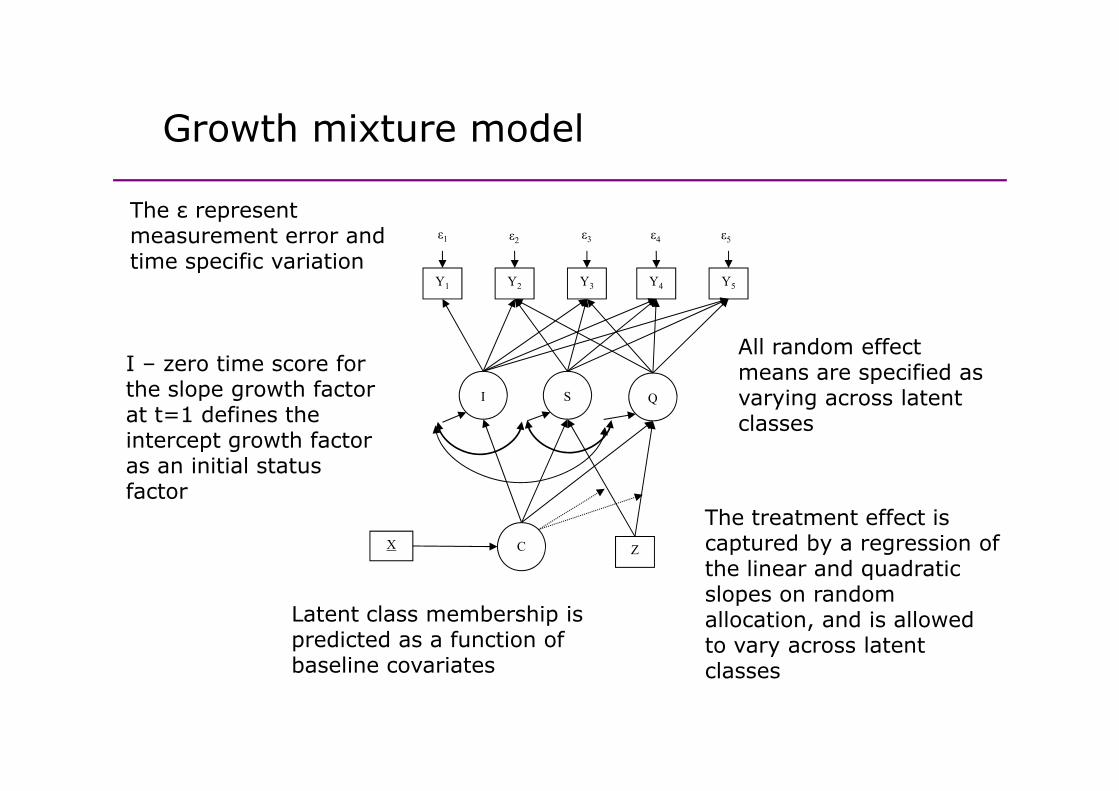
Growth mixture modelGrowth mixture model
The ε represent
Y1 Y2 Y3 Y4 Y5
ε1 ε2 ε3 ε4 ε5
The ε represent measurement error and time specific variation
I S Q
All random effect means are specified as varying across latent
I – zero time score for the slope growth factor I S Q varying across latent
classesthe slope growth factor at t=1 defines the intercept growth factor as an initial status f t
C ZX
The treatment effect is captured by a regression of the linear and quadratic
factor
the linear and quadratic slopes on random allocation, and is allowed to vary across latent l
Latent class membership is predicted as a function of baseline covariates classesbaseline covariates
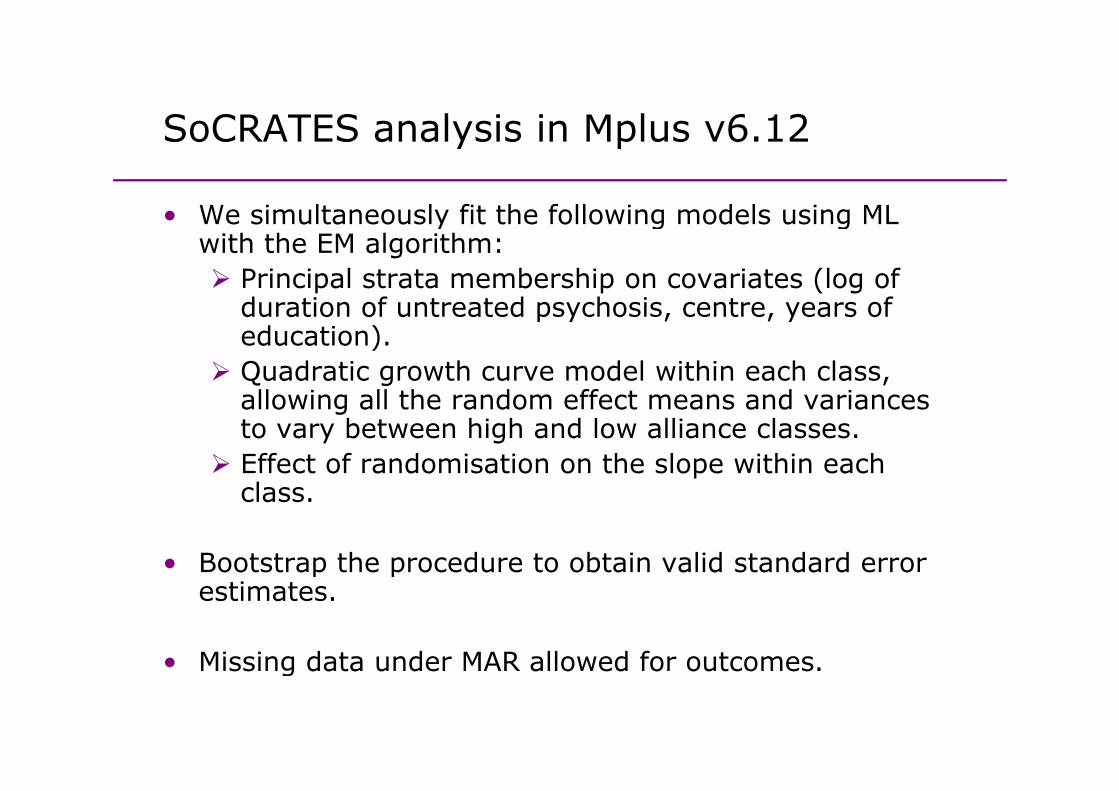
SoCRATES analysis in Mplus v6 12SoCRATES analysis in Mplus v6.12
• We simultaneously fit the following models using ML • We simultaneously fit the following models using ML with the EM algorithm:
Principal strata membership on covariates (log of duration of untreated psychosis centre years of duration of untreated psychosis, centre, years of education).Quadratic growth curve model within each class, allowing all the random effect means and variances allowing all the random effect means and variances to vary between high and low alliance classes.Effect of randomisation on the slope within each lclass.
• Bootstrap the procedure to obtain valid standard error p pestimates.
• Missing data under MAR allowed for outcomes• Missing data under MAR allowed for outcomes.
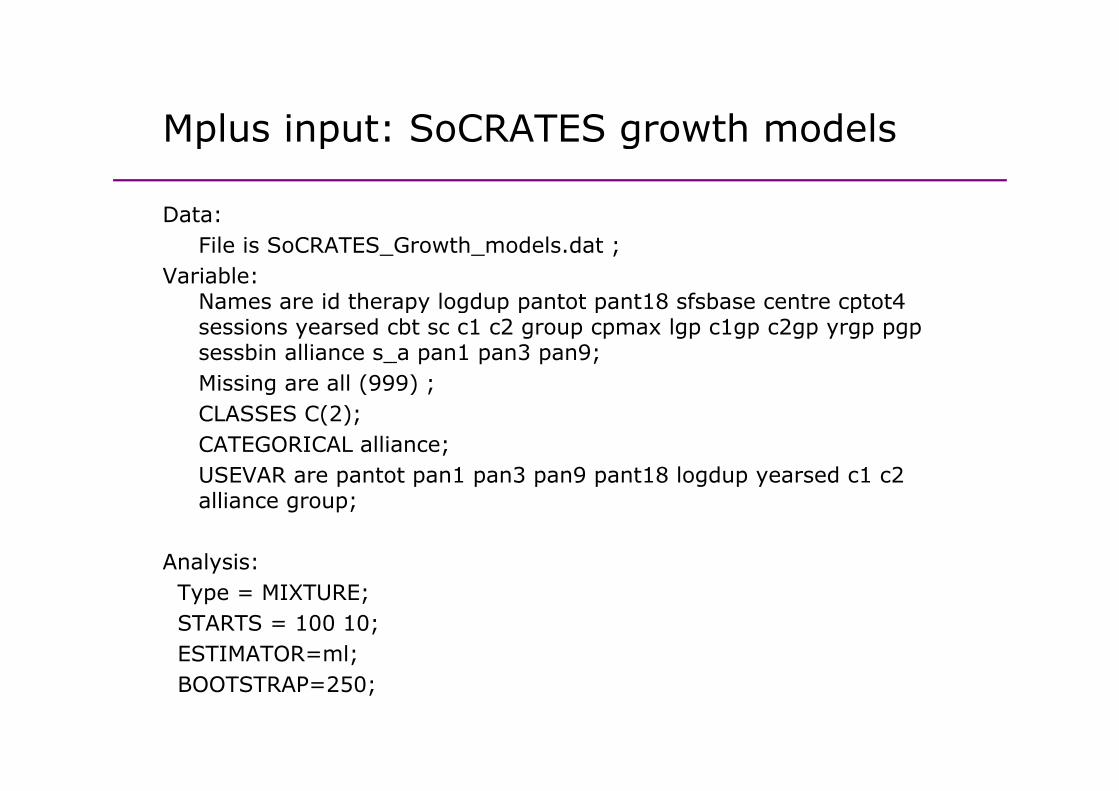
Mplus input: SoCRATES growth modelsMplus input: SoCRATES growth models
Data:Data:File is SoCRATES_Growth_models.dat ;
Variable:Names are id therapy logdup pantot pant18 sfsbase centre cptot4 Names are id therapy logdup pantot pant18 sfsbase centre cptot4 sessions yearsed cbt sc c1 c2 group cpmax lgp c1gp c2gp yrgp pgpsessbin alliance s_a pan1 pan3 pan9;Missing are all (999) ;CLASSES C(2); CATEGORICAL alliance; USEVAR are pantot pan1 pan3 pan9 pant18 logdup yearsed c1 c2 p p p p p g p yalliance group;
Analysis: Type = MIXTURE;STARTS = 100 10;ESTIMATOR=ml;;BOOTSTRAP=250;
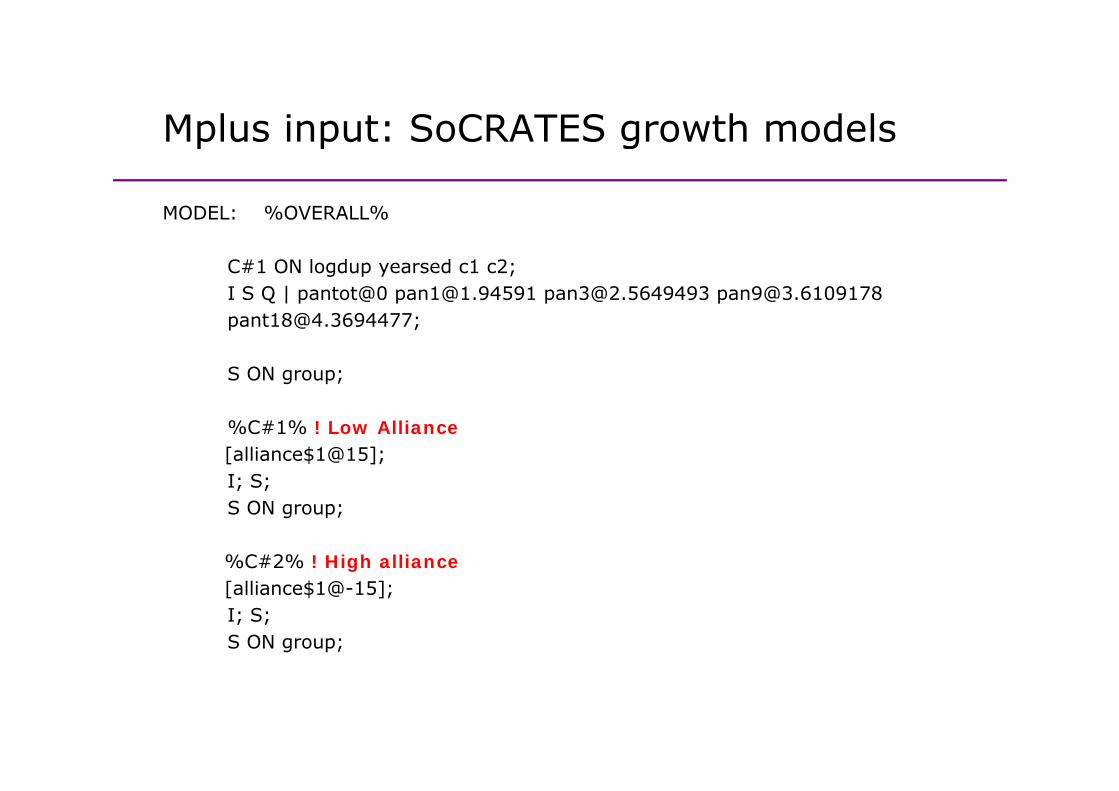
Mplus input: SoCRATES growth modelsMplus input: SoCRATES growth models
MODEL: %OVERALL%MODEL: %OVERALL%
C#1 ON logdup yearsed c1 c2; I S Q | pantot@0 [email protected] [email protected] [email protected] [email protected];
S ON group;
%C#1% ! Low Alliance [alliance$1@15];I; S; I; S; S ON group;
%C#2% ! High alliance [alliance$1@-15];I; S;S ON group;
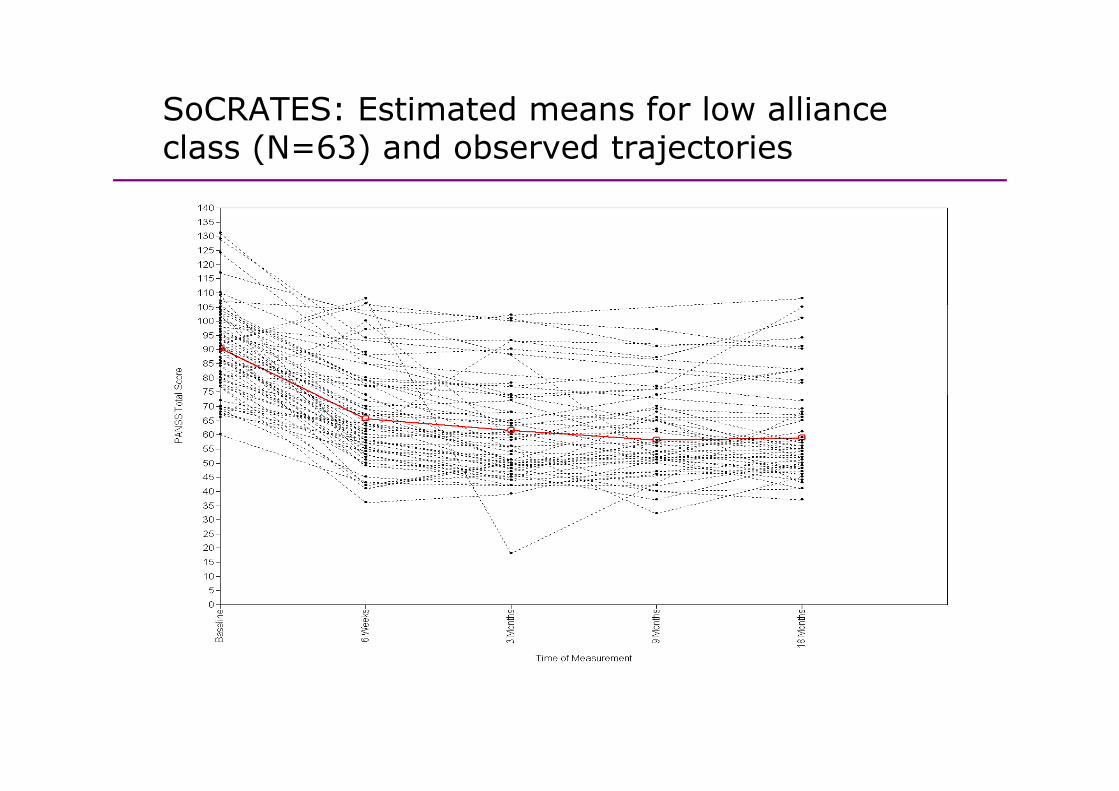
SoCRATES: Estimated means for low alliance class (N=63) and observed trajectories

SoCRATES analysis in Mplus v6 12SoCRATES analysis in Mplus v6.12
Latent Class 1 – Low Alliance Group (N=63)Latent Class 1 Low Alliance Group (N 63)
Effect of Randomisation on SLOPE
Coeff=+1.808 SE=1.644 T=1.100 P-value=0.271
Random Effect Means/Intercepts
Coeff SE T P-valueCoeff SE T P valueINTER 90.444 3.441 26.281 0.000SLOPE -17.118 2.697 -6.346 0.000QUADRATIC 2 269 0 460 4 928 0 000QUADRATIC 2.269 0.460 4.928 0.000
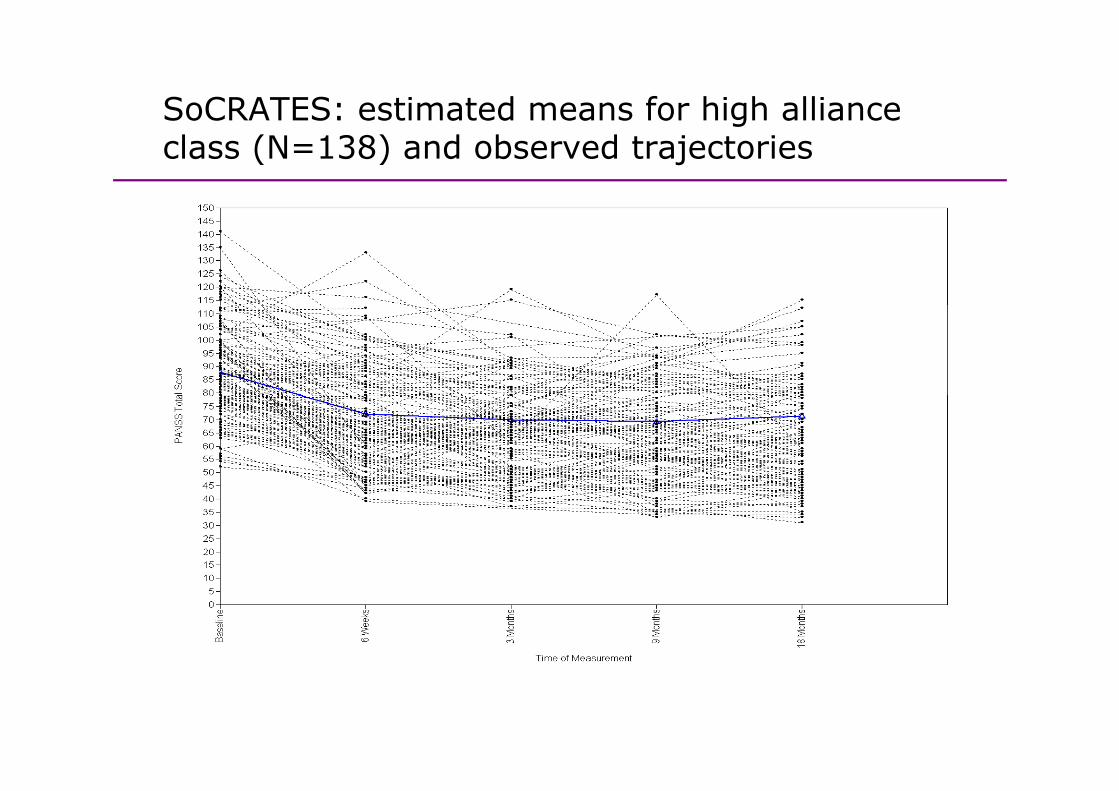
SoCRATES: estimated means for high alliance gclass (N=138) and observed trajectories
SoCRATES analysis in Mplus v6 12SoCRATES analysis in Mplus v6.12
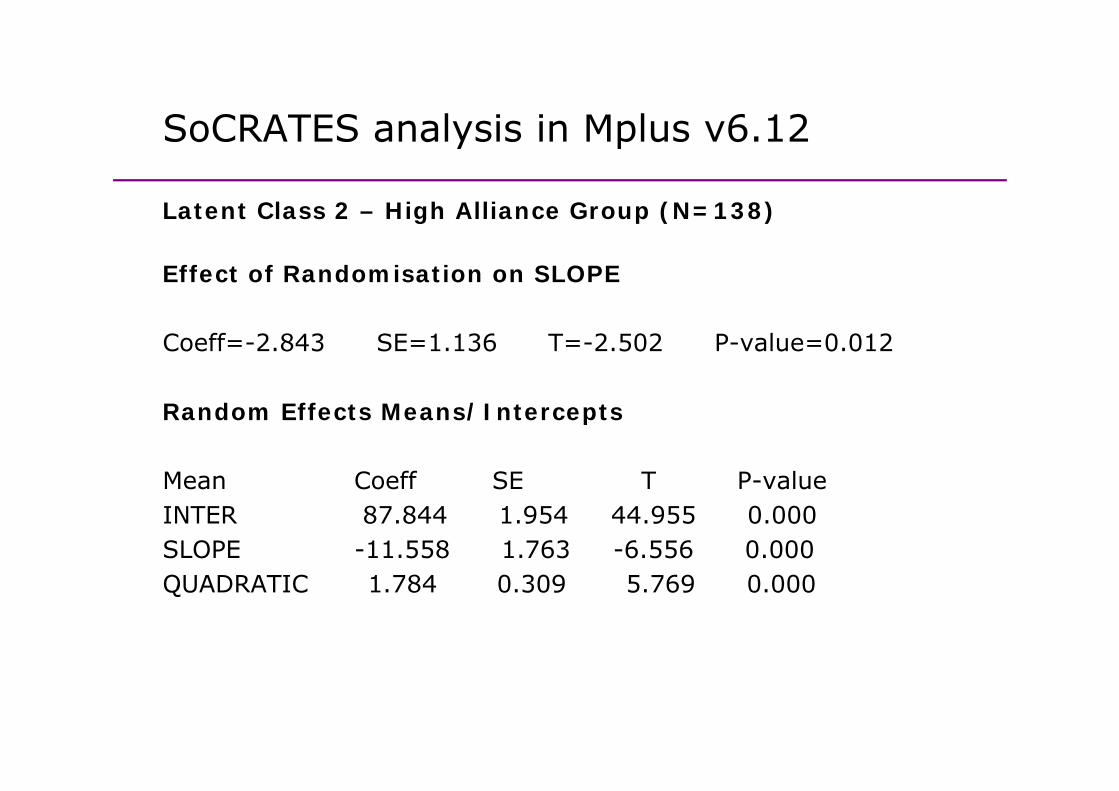
Latent Class 2 – High Alliance Group (N=138)Latent Class 2 High Alliance Group (N 138)
Effect of Randomisation on SLOPE
Coeff=-2.843 SE=1.136 T=-2.502 P-value=0.012
Random Effects Means/Intercepts
Mean Coeff SE T P-valueMean Coeff SE T P valueINTER 87.844 1.954 44.955 0.000SLOPE -11.558 1.763 -6.556 0.000QUADRATIC 1 784 0 309 5 769 0 000QUADRATIC 1.784 0.309 5.769 0.000

Sample and estimated means by classSample and estimated means by class
Contents
1 Discussion of mediation and statistical mediation
Contents
1. Discussion of mediation and statistical mediation analysis
2. Causal mediation parameters
3 P l ti ( i M l )3. Process evaluation (using Mplus)
4. Causal mediation analysis (using Mplus)4. Causal mediation analysis (using Mplus)
5. Conclusions
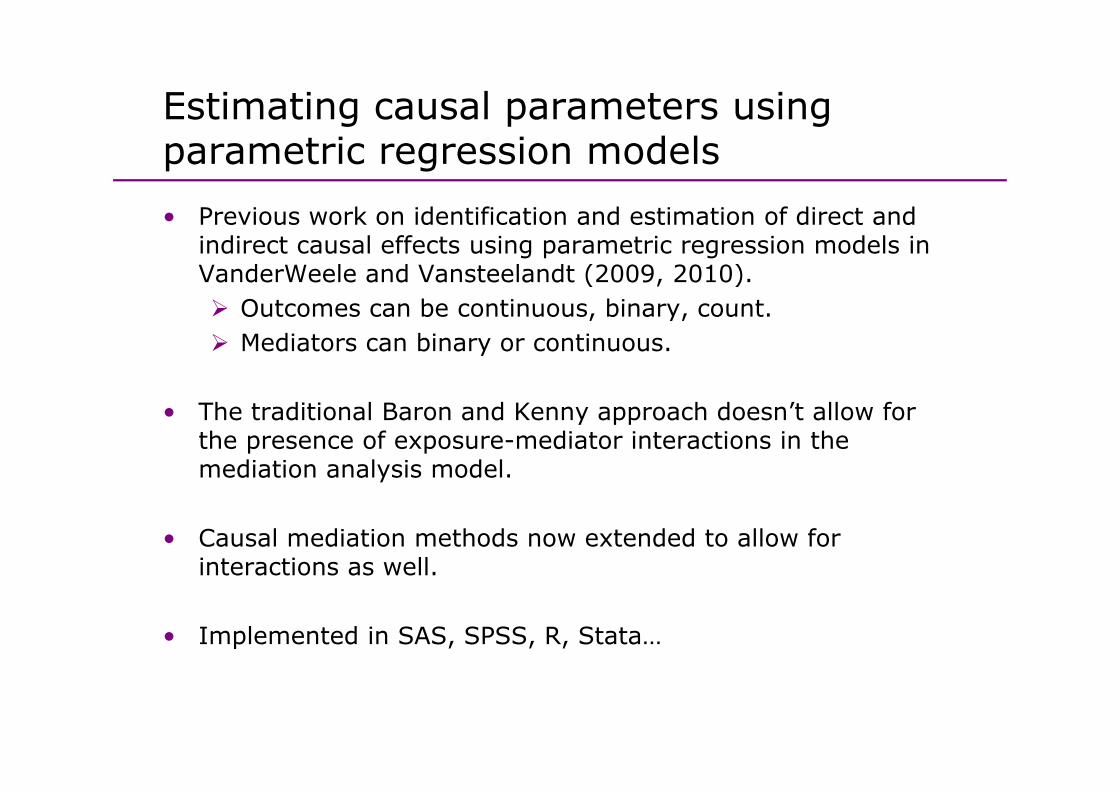
Estimating causal parameters using g p gparametric regression models• Previous work on identification and estimation of direct and • Previous work on identification and estimation of direct and
indirect causal effects using parametric regression models in VanderWeele and Vansteelandt (2009, 2010).
Outcomes can be continuous binary countOutcomes can be continuous, binary, count.Mediators can binary or continuous.
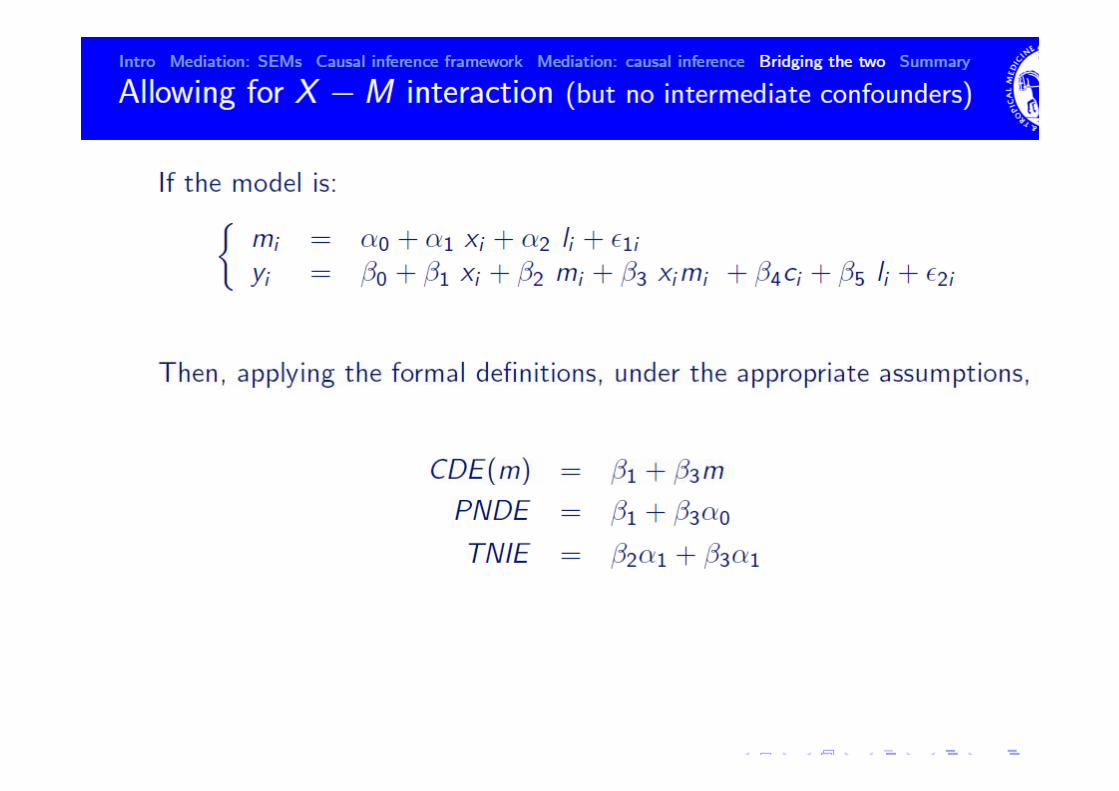
• The traditional Baron and Kenny approach doesn’t allow for the presence of exposure-mediator interactions in the mediation analysis model.
• Causal mediation methods now extended to allow for interactions as well.interactions as well.
• Implemented in SAS, SPSS, R, Stata…
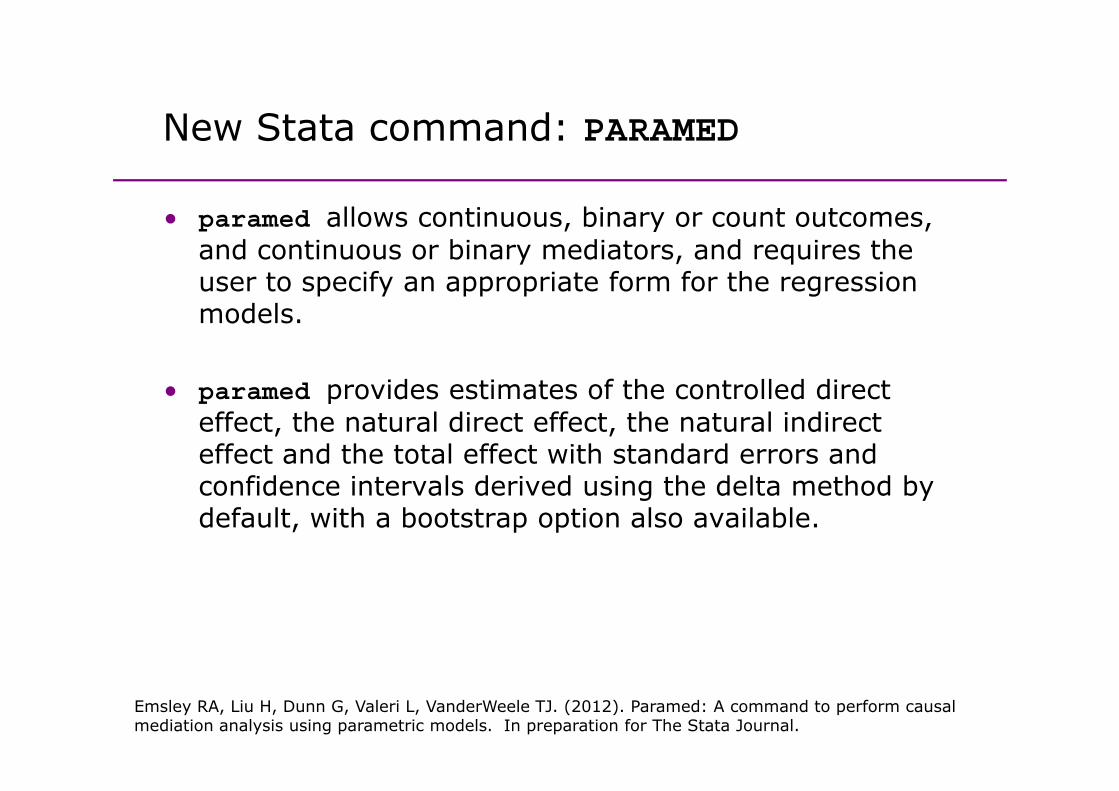
New Stata command: PARAMEDNew Stata command: PARAMED
• paramed allows continuous binary or count outcomes • paramed allows continuous, binary or count outcomes, and continuous or binary mediators, and requires the user to specify an appropriate form for the regression
d lmodels.
• paramed provides estimates of the controlled direct • paramed provides estimates of the controlled direct effect, the natural direct effect, the natural indirect effect and the total effect with standard errors and confidence intervals derived using the delta method by confidence intervals derived using the delta method by default, with a bootstrap option also available.
Emsley RA, Liu H, Dunn G, Valeri L, VanderWeele TJ. (2012). Paramed: A command to perform causal mediation analysis using parametric models. In preparation for The Stata Journal.
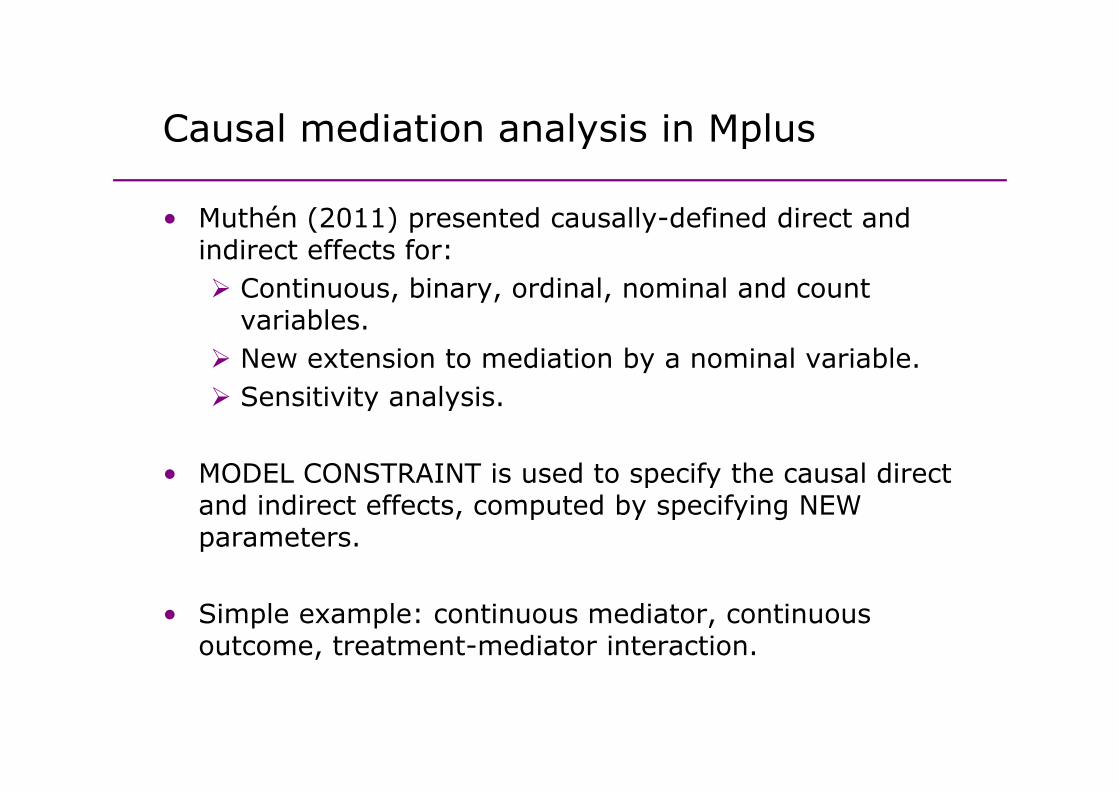
Causal mediation analysis in MplusCausal mediation analysis in Mplus
• Muthén (2011) presented causally defined direct and • Muthén (2011) presented causally-defined direct and indirect effects for:
Continuous, binary, ordinal, nominal and count variables.New extension to mediation by a nominal variable.Sensitivity analysisSensitivity analysis.
• MODEL CONSTRAINT is used to specify the causal direct p yand indirect effects, computed by specifying NEW parameters.
• Simple example: continuous mediator, continuous outcome, treatment-mediator interaction.

Mplus input: Monte Carlo simulation of p py m x xmmodel:model:
[y*1] (beta0); !intercepty on x*.4 (beta2);y on xm* 2 (beta3);y on xm*.2 (beta3);y on m*.5 (beta1);[m*2] (gamma0); !interceptm on x* 5 (gamma1);m on x*.5 (gamma1);y*.5; !residual variancem*1; !residual variance
model constraint:new(tie*.35 pie*.25 de*.8);ti b t 1* 1 b t 3* 1tie=beta1*gamma1+beta3*gamma1;pie=beta1*gamma1;de=beta2+beta3*gamma0;
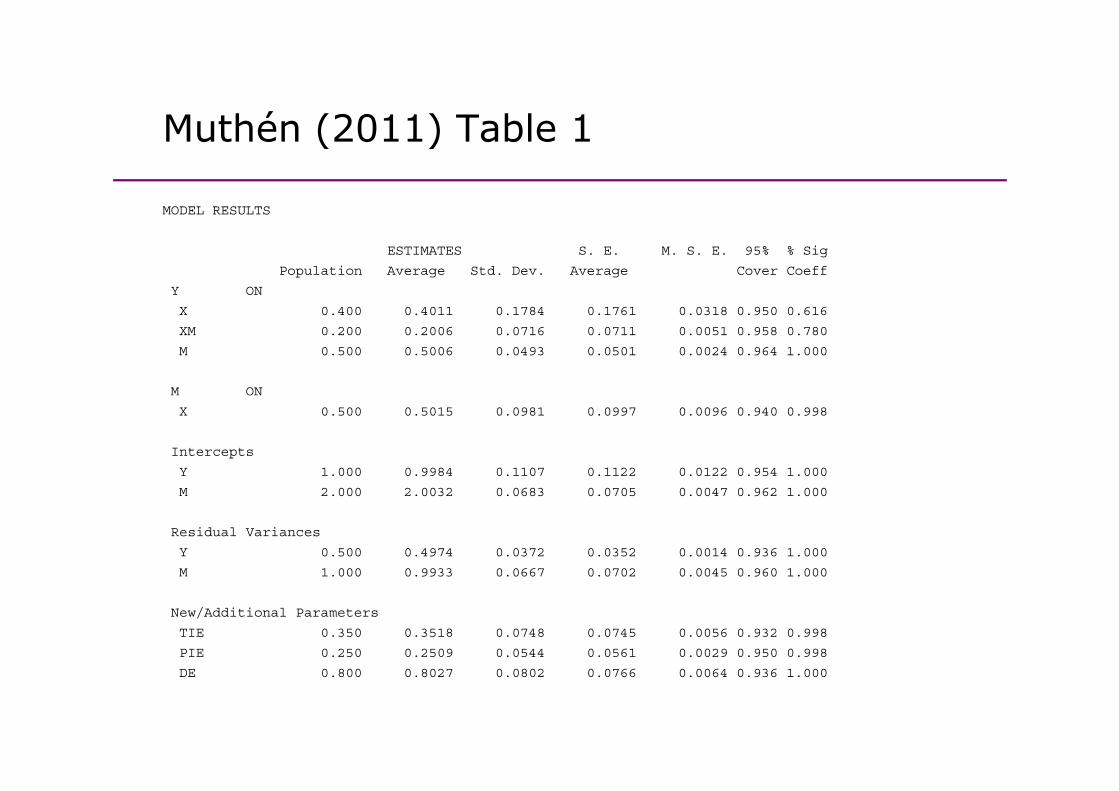
Muthén (2011) Table 1Muthén (2011) Table 1
MODEL RESULTS
ESTIMATES S. E. M. S. E. 95% % Sig
Population Average Std. Dev. Average Cover Coeff
Y ON
X 0.400 0.4011 0.1784 0.1761 0.0318 0.950 0.616
XM 0.200 0.2006 0.0716 0.0711 0.0051 0.958 0.780
M 0.500 0.5006 0.0493 0.0501 0.0024 0.964 1.000
M ON
X 0.500 0.5015 0.0981 0.0997 0.0096 0.940 0.998
Intercepts
Y 1.000 0.9984 0.1107 0.1122 0.0122 0.954 1.000
M 2.000 2.0032 0.0683 0.0705 0.0047 0.962 1.000
Residual Variances
Y 0.500 0.4974 0.0372 0.0352 0.0014 0.936 1.000
M 1.000 0.9933 0.0667 0.0702 0.0045 0.960 1.000M 1.000 0.9933 0.0667 0.0702 0.0045 0.960 1.000
New/Additional Parameters
TIE 0.350 0.3518 0.0748 0.0745 0.0056 0.932 0.998
PIE 0.250 0.2509 0.0544 0.0561 0.0029 0.950 0.998
DE 0.800 0.8027 0.0802 0.0766 0.0064 0.936 1.000
Contents
1 Discussion of mediation and statistical mediation
Contents
1. Discussion of mediation and statistical mediation analysis
2. Causal mediation parameters
3 P l ti ( i M l )3. Process evaluation (using Mplus)
4. Causal mediation analysis (using Mplus)4. Causal mediation analysis (using Mplus)
5. Conclusions
Some conclusions
• Statistical mediation (B&K) has three main problems:
Some conclusions
• Statistical mediation (B&K) has three main problems:1. Unmeasured confounding2. No interactions between exposure and mediator on p
outcome3. Doesn’t include non-linear models
• Causal mediation analysis has arisen from the causal inference literature, and addressed these problems., p
• Available in other software, and now also in Mplus th k t M thé (2011)thanks to Muthén (2011):
Can be applied to new settings (nominal mediators)But overall slightly cumbersome?But overall slightly cumbersome?

Some conclusions (2)Some conclusions (2)
• Principal stratification can be used to analyse process • Principal stratification can be used to analyse process variables, with singly observed and repeated measures of outcomes. Can extend to multiple classes/strata.
• Real strength of Mplus is the longitudinal modelling features and potential for combining this with features, and potential for combining this with mediation analysis in a mixture framework.
• Not currently explored elsewhere; Extending definition of PNDE and TNIE etc. to longitudinal data?longitudinal data?

Selected referencesSelected references
• Emsley RA & Dunn G (2012) Evaluation of potential mediators in randomized • Emsley RA & Dunn G. (2012) Evaluation of potential mediators in randomized trials of complex interventions (psychotherapies). In: Causal Inference: Statistical perspectives and applications. Eds: Berzuini C, Dawid P & Bernardinelli, L. Wiley.
• Emsley RA, Liu H, Dunn G, Valeri L, VanderWeele TJ. (2012). PARAMED: A command to perform causal mediation analysis using parametric models. In preparation for The Stata Journal.
• Emsley RA, Dunn G & White IR. (2010). Modelling mediation and moderation of treatment effects in randomised controlled trials of complex interventions. Statistical Methods in Medical Research, 19(3), 237-270., ( ),
• Muthen B. (2011). Applications of Causally Defined Direct and Indirect Effects in Mediation Analysis using SEM in Mplus.

Research Programme: Efficacy and Mechanisms EvaluationFunded by MRC Methodology Research Programmey gy g
• Design and methods of explanatory (causal) analysis for randomised trials of complex interventions in mental health (2006-2009)
Graham Dunn (PI) Richard Emsley Linda Davies Jonathan Green Andrew Graham Dunn (PI), Richard Emsley, Linda Davies, Jonathan Green, Andrew Pickles, Chris Roberts, Ian White & Frank Windmeijer.
• Estimation of causal effects of complex interventions in longitudinal studies with intermediate variables (2009-2012)
Richard Emsley (MRC Fellow), Graham Dunn.
• Designs and analysis for the evaluation and validation of social and • Designs and analysis for the evaluation and validation of social and psychological markers in randomised trials of complex interventions in mental health (2010-12)
Graham Dunn (PI), Richard Emsley, Linda Davies, Jonathan Green, Andrew Pi kl Ch i R b I Whi & F k Wi d ij i h H h LiPickles, Chris Roberts, Ian White & Frank Windmeijer with Hanhua Liu.
• PhD students: Lucy Goldsmith and Clare Flach (2010 – 2013) Philip Foden (2011-2014)Philip Foden (2011 2014)