process management (1) - wz.uw.edu.pl management 1.pdf · process management (1) ... case study by:...
TRANSCRIPT

© Krzysztof Klincewicz Faculty of Management, University of Warsaw© Krzysztof Klincewicz
Process management (1)International Business Program
Faculty of Management, University of Warsaw
prof. UW dr hab. Krzysztof Klincewicz
TiMO (Department of Organization Theory and Methods)
www.timo.wz.uw.edu.pl
Faculty of Management, University of Warsaw

© Krzysztof Klincewicz Faculty of Management, University of Warsaw© Krzysztof Klincewicz
What do I need this for?

© Krzysztof Klincewicz Faculty of Management, University of Warsaw© Krzysztof Klincewicz
Learning outcomes
Upon the completion of the course, you will be able to:
• identify, map and analyze business processes of a selected organization,
• use analytical frameworks and techniques including value chain, make-or-buy, fishbone diagram, system dynamics, benchmarking, value analysis, business process reengineering,
• present principles, benefits and limitations of process approaches including Reorder Point System, ABC method, MRP, JiT, lean management, TQM, inventory-driven costs, Triple-A supply chain, Six Sigma, ISO 9001, ISO 14001, EMAS,
• model systemic interdependencies in organizations using software Vensim,
• model business processes in organizations using software ARIS Express,
• work in teams on solving practical business problems.

© Krzysztof Klincewicz Faculty of Management, University of Warsaw© Krzysztof Klincewicz
Course assessment
• 60%: individual and team assignments accompanying regular classes
• 40%: written exam
• Assignments have to be handed over on specific dates –no extensions will be granted, missed assignments cannotbe made up for and will influence the final grade
• Some assignments will be done in the classroom (i.e. onlystudents present during a particular class can score pointsfor these assignments)

© Krzysztof Klincewicz Faculty of Management, University of Warsaw© Krzysztof Klincewicz
Literature
• Obligatory readings required for the exam:
– case studies distributed in the classroom
– articles and book chapters in PDF format, available from the course website
– they supplement the classes and knowledge of their contents will be verified in the exam

© Krzysztof Klincewicz Faculty of Management, University of Warsaw© Krzysztof Klincewicz
Business process
• Collection of activities or tasks
• Has inputs and outputs
• Serves a particular goal (delivery of service, product or other value-added for customers, alsointernal customers)
• Is repetitive (as opposed to projects)
• Its improvement helps increase organizationalefficiency and reduce costs

© Krzysztof Klincewicz Faculty of Management, University of Warsaw© Krzysztof Klincewicz
Processes are managed for:
• Effectiveness
– achievement of expected outputs
• Efficiency
– optimization of time and money spent
• Control
– related to quality and predicability
• Compliance
– to avoid liability or comply with formal standards

© Krzysztof Klincewicz Faculty of Management, University of Warsaw© Krzysztof Klincewicz
Key Performance Indicators (KPI)
• Indicators of performance, usually related to processes
– measurable
– important for the organization
– controllable by the organization
– linked to specific business processes

© Krzysztof Klincewicz Faculty of Management, University of Warsaw© Krzysztof Klincewicz
Process complexity and automation potential (Harmon)
Simple proceduralprocesses
More complexprocesses
Very complex processes
• a step-by-step sequence• few rules or decision points• well defined subject matterperformed by „ordinary” employeesmanufacturing line, retail sales, bookeeping
• a complex, branching sequence• many rules or decision points• a less well defined subject matterperformed by knowledge workersrepair of equipment, B2B sales, business planning
• unique sequence• heuristics and „guesses”• undefined, evolving subject matterperformed by expertsnew product development, software design, consulting
…or maybe rather:projects?
© Harmon

© Krzysztof Klincewicz Faculty of Management, University of Warsaw© Krzysztof Klincewicz
Example – Kristen’s cookies
Case study by: Andy Shogan

© Krzysztof Klincewicz Faculty of Management, University of Warsaw© Krzysztof Klincewicz
Basic definitions
• THROUGHPUT TIME FOR AN ACTIVITY. The time it takes to perform an activity.
• THROUGHPUT TIME FOR THE PROCESS. The total amount of time a unit spends in the process from beginning to end, including the time spent being actively work on at the activities of the process as well as any time spent waiting between activities.
© Krzysztof Klincewicz Faculty of Management, University of Warsaw© Krzysztof Klincewicz
Basic definitions
• BOTTLENECK. The activity or resource that limits the capacity of the overall process. The bottleneck is usually the activity with the minimum capacity, but the bottleneck can sometimes be the labor available at a particular activity or set of activities.

© Krzysztof Klincewicz Faculty of Management, University of Warsaw© Krzysztof Klincewicz
Basic definitions
• CAPACITY OF THE PROCESS. The maximum rate of output of the process, measured in units of output per unit of time (e.g., 4 dozen per hour).
• CYCLE TIME OF THE PROCESS. The time that elapses between completion by the process of successive units, assuming the process operates continuously. (For example, if a process has a capacity of 4 dozen per hour, then the cycle time of the process is 15 minutes.)

© Krzysztof Klincewicz Faculty of Management, University of Warsaw© Krzysztof Klincewicz
Basic definitions
• CAPACITY OF AN ACTIVITY. An activity’s maximum rate of output, measured in units of output per unit of time (e.g., 4 dozen per hour).
• CYCLE TIME OF AN ACTIVITY. The time that elapses between the activity’s completion of successive units, assuming the activity operates continuously. (For example, if an activity has a capacity of 4 dozen per hour, then the activity’s cycle time is 15 minutes.)

© Krzysztof Klincewicz Faculty of Management, University of Warsaw© Krzysztof Klincewicz
Basic definitions
• UTILIZATION OF A RESOURCE. The ratio of the time that the resource is actually used to the time that the resource is available to be used.
© Krzysztof Klincewicz Faculty of Management, University of Warsaw© Krzysztof Klincewicz
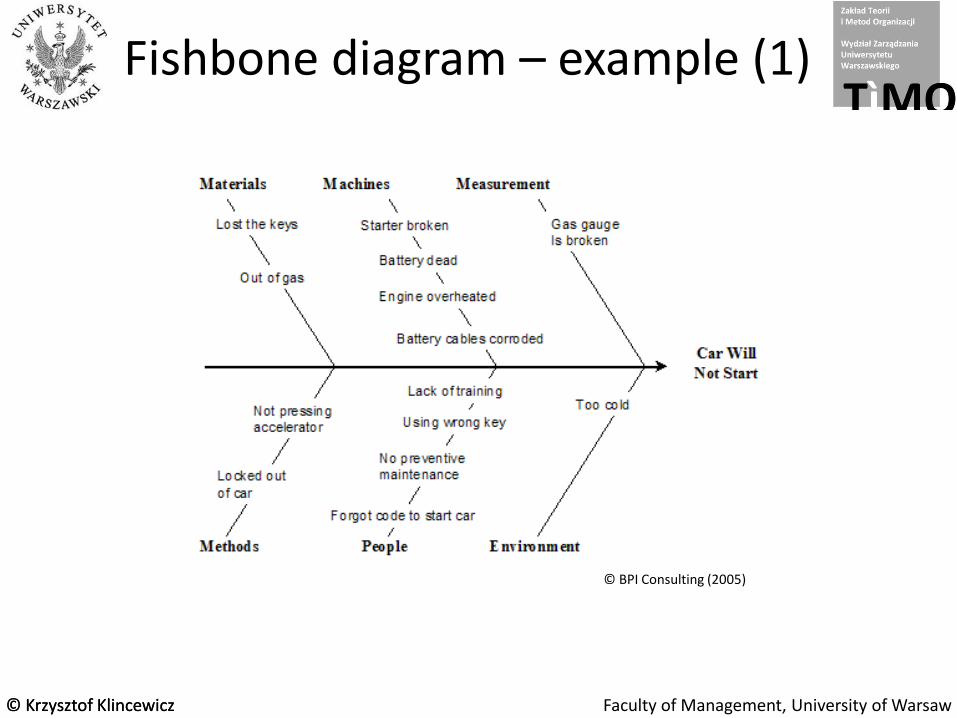
Fishbone diagram – example (1)
© BPI Consulting (2005)
© Krzysztof Klincewicz Faculty of Management, University of Warsaw© Krzysztof Klincewicz
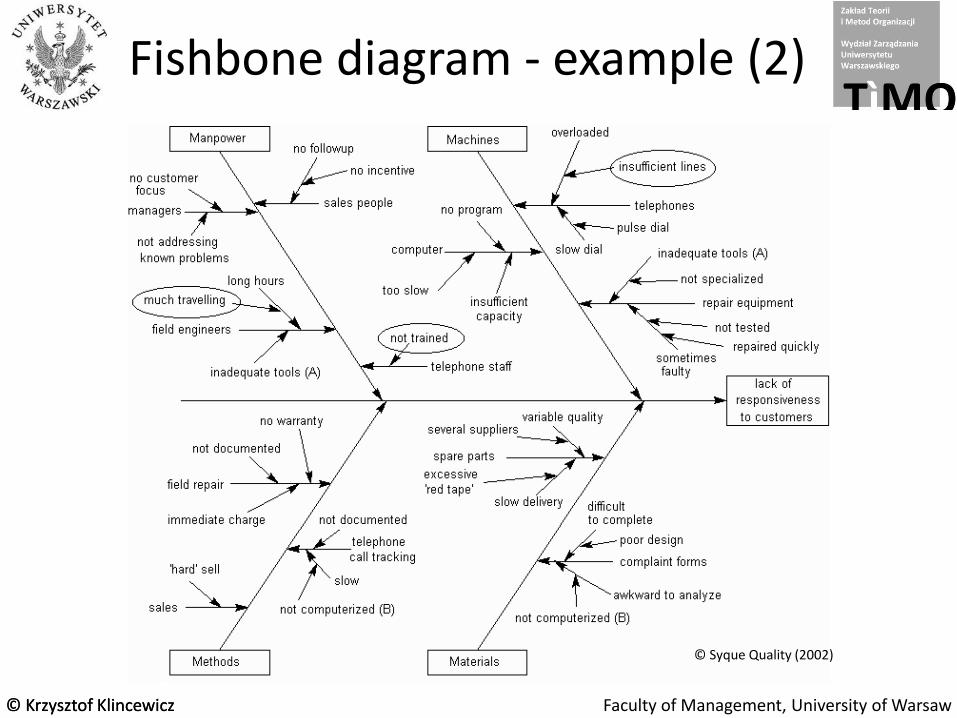
Fishbone diagram - example (2)
© Syque Quality (2002)

© Krzysztof Klincewicz Faculty of Management, University of Warsaw© Krzysztof Klincewicz
Fishbone diagram - example (3)
© Enarsson (1998)

© Krzysztof Klincewicz Faculty of Management, University of Warsaw© Krzysztof Klincewicz
Case study
• Shortening customer telephone waiting times

© Krzysztof Klincewicz Faculty of Management, University of Warsaw© Krzysztof Klincewicz
Case study
• Freemantle restaurant

© Krzysztof Klincewicz Faculty of Management, University of Warsaw© Krzysztof Klincewicz
Case study
• Hongkong Disneyland

© Krzysztof Klincewicz Faculty of Management, University of Warsaw© Krzysztof Klincewicz
Sample process chart
Time: 56.2 min, Distance: 205 meters

© Krzysztof Klincewicz Faculty of Management, University of Warsaw© Krzysztof Klincewicz
Case study
• Emergency room admission
© Krzysztof Klincewicz Faculty of Management, University of Warsaw© Krzysztof Klincewicz
Case study
• Shaving process

© Krzysztof Klincewicz Faculty of Management, University of Warsaw© Krzysztof Klincewicz
Value added analysis
• Identification of tasks, which are not adding valueand are unnecessary
• For every step in a process, asking questions:
1. Does the end customer require this activity? (yes=VA)
2. Can the activity be performed differently? Is itrequired to support value-adding activities? (yes=NVA)
AUTOMATE / OUTSOURCE / REPLACE
3. Can the activity be eliminated without impact on the end customer? (yes=NVAU)
ELIMINATE

© Krzysztof Klincewicz Faculty of Management, University of Warsaw© Krzysztof Klincewicz
Value added analysis - example
Process step VA (value adding) NVA (non-valueadding)
NVAU (non-value addingand unnecessary)
Receive call regarding technical support NVA
Collect information NVA
Register information NVA
Print registered information NVAU
Put the printout into a folder NVAU
Assign request number NVA
Check in database if problem known VA
E-mail information to team leader NVAU
Assign priority NVA
Wait for 1-7 hours NVAU
Resolve request VA
Register updated information NVA
E-mail information to team leader NVAU
© Krzysztof Klincewicz Faculty of Management, University of Warsaw© Krzysztof Klincewicz
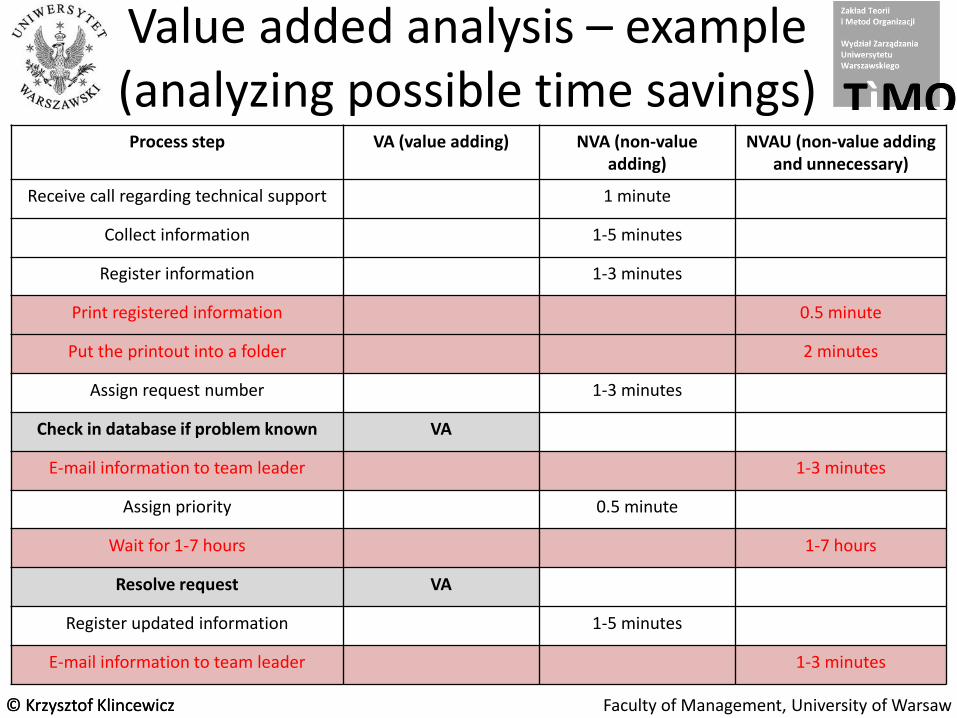
Value added analysis – example(analyzing possible time savings)
Process step VA (value adding) NVA (non-valueadding)
NVAU (non-value addingand unnecessary)
Receive call regarding technical support 1 minute
Collect information 1-5 minutes
Register information 1-3 minutes
Print registered information 0.5 minute
Put the printout into a folder 2 minutes
Assign request number 1-3 minutes
Check in database if problem known VA
E-mail information to team leader 1-3 minutes
Assign priority 0.5 minute
Wait for 1-7 hours 1-7 hours
Resolve request VA
Register updated information 1-5 minutes
E-mail information to team leader 1-3 minutes

© Krzysztof Klincewicz Faculty of Management, University of Warsaw© Krzysztof Klincewicz
Case study
• Registration at IMA Conference

© Krzysztof Klincewicz Faculty of Management, University of Warsaw© Krzysztof Klincewicz
Three major process management traditions (Harmon)
Qualitycontrol
Business management
Information Technology
TaylorFord
Deming
JiTTQM kaizen
lean Six SigmaCMM
Rummler
Porter
Kaplan, Norton
BPRHammer, Champy
ZachmanTOGAF
ERP
workflowEAI BPMS
process modelling Scheer

© Krzysztof Klincewicz Faculty of Management, University of Warsaw© Krzysztof Klincewicz
Quality control tradition (1)
• Focus on individual work
– Frederick Taylor’s „scientific management” and „taylorism”
– analysis and simplification of work
– identification of the best way to perform a task
– establishing appropriate control systems
• Mass manufacturing model
– Henry Ford and „fordism”

© Krzysztof Klincewicz Faculty of Management, University of Warsaw© Krzysztof Klincewicz
Quality control tradition (2)
• Quality movement in Japan
– inspired by Edward Deming
– most widely recognized achievements by Toyota
– approaches: just-in-time, kaizen, Total Quality Management, lean management
• Six Sigma
– established by Motorola
– process management combined with statistical quality control
– focus on continuous process improvement

© Krzysztof Klincewicz Faculty of Management, University of Warsaw© Krzysztof Klincewicz
Quality control tradition (3)
• Capability Maturity Model
– established by Software Engineering Institute, Carnegie Mellon University
– ordered by US Department of Defense
– five „maturity levels” related to an organization’s abilityto manage its own processes
1. Initial
2. Repeatable
3. Defined
4. Managed
5. Optimizing

© Krzysztof Klincewicz Faculty of Management, University of Warsaw© Krzysztof Klincewicz
Capability Maturity Model
(1)
Initial
(2) Repeatable
(3)
Defined
(4) Managed
(5) Optimizing
basic processes repeatedin disciplined ways
organization standardizes the processes and performs them consistently
managers collect data on processes and control them,
processes are predictable
continuous, company-wide process
improvement efforts
chaos, lack of coordination, „putting out fires”
© SEI

© Krzysztof Klincewicz Faculty of Management, University of Warsaw© Krzysztof Klincewicz
Business management tradition
• 1970s - cost cutting projects in response to economic crisis• Geary Rummler
– process redesign as a way of improving performance– focus on managing the activities and processes - comparing
inputs and outputs, assuring the availability of resources, monitoring the process, providing feedback and incentives
• Michael Porter– value chain (originally introduced by McKinsey)– operational effectiveness - performing operations better than
competitors
• Robert S. Kaplan and David P. Norton– Balanced Scorecard– multidimensional measurement of corporate performance and
goal setting

© Krzysztof Klincewicz Faculty of Management, University of Warsaw© Krzysztof Klincewicz
Information Technology tradition
• Automation of work thanks to IT systems
• Michael Hammer, James Champy– Business Process Reengineering
– thinking in terms of corporate-wide processes
– radical redesign of processes , focused on customers
– active use of IT to support process improvement
• John Zachman (IBM)– Zachman Framework
– approach to modeling enterprise with respect to the implementation and maintenance of IT systems
– established perspective referred to as "Enterprise Architecture"
– similar approach: TOGAF (The Open Group Architecture Framework)

© Krzysztof Klincewicz Faculty of Management, University of Warsaw© Krzysztof Klincewicz
Information Technology tools
• Process modelling software– process capture / mapping / modelling, analysis and
optimization
– pioneer: August Scheer and ARIS
• Workflow software– automation of processes
• MRP/MRP2/ERP (Enterprise Resource Planning) systems and transaction systems
• EAI (Enterprise Application Integration) software
• BPMS (Business Process Management Systems)

© Krzysztof Klincewicz Faculty of Management, University of Warsaw© Krzysztof Klincewicz
Case study
• Janson Medical Clinic

© Krzysztof Klincewicz Faculty of Management, University of Warsaw© Krzysztof Klincewicz
Benchmarking
• Competitive benchmarking
– Analysis of processes of a competitor
• Problems
– Access to knowledge about competitor
– You can never be better than the object of benchmarking
– Good ideas may come from outside of the industry
• First known example: Xerox

© Krzysztof Klincewicz Faculty of Management, University of Warsaw© Krzysztof Klincewicz
Benchmarking
• Non-competitor, collaborative benchmarking
– Analysis of „process leaders”, companies with superior performance in specific areas
– Interest in companies from other industries
– Co-operation with the analyzed company
– Focus on specific processes – e.g. logistics
– Identification of best practices

© Krzysztof Klincewicz Faculty of Management, University of Warsaw© Krzysztof Klincewicz
Benchmarking example - Xerox
• Benchmarking of L.L.Bean, Inc., outdoor sportinggoods retailer and mail-order house (1981)
– Identified as a good performer thanks to financialindicators
– Focus on inventory management, warehousing and transport
– Xerox was able to process 117 warehouse orders per man-day, L.L.Bean – 550
– Adopting best practices related to: inventory sortingand placing in the warehouse, staff bonuses, use of automation, IT and barcodes

© Krzysztof Klincewicz Faculty of Management, University of Warsaw© Krzysztof Klincewicz
Case study
• Gifford Hospital Pharmacy

© Krzysztof Klincewicz Faculty of Management, University of Warsaw© Krzysztof Klincewicz
Analysis of business operations
• Value chain model (McKinsey, Michael Porter)
– strategically relevant activities of a firm
– helps understand costs and potential sources of differentiation
– created for an entire firm or a business unit

© Krzysztof Klincewicz Faculty of Management, University of Warsaw© Krzysztof Klincewicz
Value chain (Porter)
• Value - the amount that buyers are willing to pay for what a firm provides them (measured by total revenue)
• Margin - difference between total value and total costs of performing the value activities
• Primary activities - involved in the physical creation of a product, its sale and delivery to buyers and further assistance
• Support activities - support the primary activities by providing inputs, technology, people and administration

© Krzysztof Klincewicz Faculty of Management, University of Warsaw© Krzysztof Klincewicz
Value chain (Porter)
Inboundlogistics
OperationsOutbound
logisticsMarketingand sales
Services
Firm infrastructure
Human resource management
Technology development
Procurement
PR
IMA
RY
AC
TIV
ITIE
SSU
PP
OR
T A
CTI
VIT
IES
© Porter

© Krzysztof Klincewicz Faculty of Management, University of Warsaw© Krzysztof Klincewicz
Terminological confusion?
inbound logistics
outbound logistics
purchasing
procurement
distribution
administration

© Krzysztof Klincewicz Faculty of Management, University of Warsaw© Krzysztof Klincewicz
Value chain and organizationaldepartments (Porter)
Inboundlogistics
OperationsOutbound
logisticsServices
Firm infrastructure
Human resource management
Marketingand sales
Technology development
Procurement
Production Marketing Research & Development Administration Purchasing
© Porter

© Krzysztof Klincewicz Faculty of Management, University of Warsaw© Krzysztof Klincewicz
Value chain used to analyzecosts
• Value activities form the basis for allocation of operating costs and assets
• Concepts of direct and indirect costs
– allocation of worktime (project management)
– allocation of shared activities costs
• Analyzing costs of purchased inputs & cost drivers
• Looking for cost advantages compared to competitors

© Krzysztof Klincewicz Faculty of Management, University of Warsaw© Krzysztof Klincewicz
Costs of purchasing
• What to analyze?– Buying assets or buying operating inputs
– Regular and irregular purchases
– Cost changes for regular purchases
– Identification of specific suppliers and order values
• Opportunities for cost reduction– small regularly purchased inputs - optimization
– irregularly purchased inputs and assets - competitive negotiations, buyer consortia
• Cost reductions may impact quality, erode differentiation, reduce flexibility

© Krzysztof Klincewicz Faculty of Management, University of Warsaw© Krzysztof Klincewicz
Cost drivers (Porter)
1. economies of scale (not only in production, also e.g. in purchasing)
2. learning effects, knowledge spillovers
3. pattern of capacity utilization (e.g. seasonality)
4. linkages (within value chain and within supply chain, including supplier agreements, supplier selection standards)
5. interrelationships (e.g. shared service centres, outsourcing)
5. integration (e.g. vertical integration, insourcing)
6. timing (e.g. first mover advantage or first mover disadvantage, timing of purchase and holding stock)
7. discretionary policies of a firm (e.g. delivery time, service standards, payment terms)
8. location (e.g. offshoring)
9. institutional factors (e.g. government, macroeconomics)
Read more about cost drivers in Porter’s chapter (obligatory readingavailable in PDF format)!

© Krzysztof Klincewicz Faculty of Management, University of Warsaw© Krzysztof Klincewicz
Technologies in value chain(Porter)
Inboundlogistics
Operations
Outboundlogistics
Marketingand sales
Services
Firm infrastructure
Human resource management
Technology development
Procurement
PR
IMA
RY
AC
TIV
ITIE
SSU
PP
OR
T A
CTI
VIT
IES
TransportationMaterial handling
Storage and preservationCommunication
Quality testingInformation processing
Production processMaterials
Machine toolsMaterial handling
PackagingMaintenance
Quality testingDesign
Information processing
TransportationMaterial handling
PackagingCommunication
Information processing
Mass mediaAudio & video recordingDesktop publishing
CommunicationInformation processing
Diagnostic toolsQuality testing
CommunicationInformation processing
Information processing
Planning and budgeting
Office automation
TrainingMotivation
Information processing
Product technologyComputer-aided design
Pilot plants
Information processing
Information processingCommunication
Transportation © Porter
© Krzysztof Klincewicz Faculty of Management, University of Warsaw© Krzysztof Klincewicz
Outsourcing
• Contracting certain activities or entire processes to third-party suppliers
• Major reasons
– cost reduction
– risk management
– more flexibility („hire and fire”)
– lack of knowledge and skills
– lack of capacity or people
– willingness to focus on core business
– willingness to improve quality

© Krzysztof Klincewicz Faculty of Management, University of Warsaw© Krzysztof Klincewicz
Costs as motivation to oursource
In-house costs
• hourly wages of employees
• vacation allowances
• sick leaves
• employee benefits (agreed with labor unions)
• office space cost
• depreciation of equipment (computers, printers)
• technical support for employees
• office expences
• employee training
Outsourcing costs
• contract value
• contract administration costs(including: search and selection of suppliers, qualityassurance)
• transition costs (including severance pays and conversion of assets)
Read more about outsourcing costsin Michel’s article (obligatoryreading available in PDF format)!

© Krzysztof Klincewicz Faculty of Management, University of Warsaw© Krzysztof Klincewicz
Outsourcing problems
• Increase in costs of renewed contracts
• Quality control issues
• Need to define Service Level Agreements
• Limited direct contacts with people performing the activities
• Loss of in-house expertise
• Recently, some companies decide to useinsourcing! Read more about outsourcing and
offshoring problems in Overby’sarticle (obligatory reading availablein PDF format)!

© Krzysztof Klincewicz Faculty of Management, University of Warsaw© Krzysztof Klincewicz
Suitability of outsourcing
buildingsecurity,
managingcompanycanteen,
cleaning jobs
accounting, market
research, mass media advertising
building orproduction
linemaintenance
informationprocessing,
procurement, customerservice
Integration withcore business
Complexity
low high
high
low

© Krzysztof Klincewicz Faculty of Management, University of Warsaw© Krzysztof Klincewicz
Offshoring
• Outsourcing in international environment – services provided by people working in country A for a clientorganization in country B
• Attention: offshoring can also be used within anorganization by relocating processes to foreignbranches (=not outsourcing)
Retail bank in Germany
Customer callcentre in Poland
Employees of the company,providing offshoring
services, work in Poland- not in Germany

© Krzysztof Klincewicz Faculty of Management, University of Warsaw© Krzysztof Klincewicz
Examples of offshoring
• Business Process Offshoring (BPO)
– call centres, accounting/payroll documents processing
• Knowledge Process Offshoring (KPO)
– software development, clinical trials of medicines, legalanalyzes
• Contract manufacturing
– Original Equipment Manufacturers (OEM), ElectronicManufacturing Services (EMS), Original Design Manufacturers (ODM)

© Krzysztof Klincewicz Faculty of Management, University of Warsaw© Krzysztof Klincewicz
Li&Fung (Hong Kong) –managing a virtual organization
© Fung, Fung & Wind

© Krzysztof Klincewicz Faculty of Management, University of Warsaw© Krzysztof Klincewicz
Li&Fung (Hong Kong)
• „tackling the soft $3”
– a product leaves the factory at a price of $1
– it ends up on retail shelves at $4
• major source of costs: not production, but other costs in distribution channels(transaction costs)

© Krzysztof Klincewicz Faculty of Management, University of Warsaw© Krzysztof Klincewicz
Make-or-buy decisions
Product X: MP3 player
Component Y: memory chip
Should you make Y – or buy froman external supplier?

© Krzysztof Klincewicz Faculty of Management, University of Warsaw© Krzysztof Klincewicz
Make-or-buy decisions
• How important is X for my strategy?• What knowledge/technologies are needed to make Y?• Can Y be used in my other products?• Can knowledge/technologies also be used in my other
products?• How many pieces of X do I intend to produce?• How many pieces of Y do I need?• What is the minimum production scale of Y, that
guarantees the returns on investment in own plant?• Can I get better prices from external suppliers?• ...

© Krzysztof Klincewicz Faculty of Management, University of Warsaw© Krzysztof Klincewicz
Transaction costs
• Costs incurred in an economic exchange
– Search and information costs
– Bargaining costs
– Communication costs
– Coordination costs
– Measurement costs (quality control, customer complaints)
• Important for make-or-buy decisions: not only the manufacturing cost!
© Krzysztof Klincewicz Faculty of Management, University of Warsaw© Krzysztof Klincewicz
Agency costs
• Costs, which you would not incur, if you completedthe work by yourself
• Costs, which arise, when you have: suppliers, subcontractors, employees, managers, ...
• Sometimes outsourcing and use of externalsuppliers turns out to be very costly in the end
→ insourcing

© Krzysztof Klincewicz Faculty of Management, University of Warsaw© Krzysztof Klincewicz
Team assignment
• Analyze the selected company using value chain model– either Jeronimo Martins Polska (www.biedronka.pl) or LOT
(www.lot.com) or Asseco (www.asseco.com) or KGHM (www.kghm.pl)– detailed analysis:
• primary and supporting activities• cost drivers• use of technologies in different segments of value chain• use of outsourcing in different segments of value chain
– you might want to look for industry reports and company analyses in EBSCO, ABI/Inform and Factiva databases
• Formal requirements– PDF file sent by e-mail by …– original work (plagiarism = course fail)– prepared by teams (minimum size=3, maximum size=5, you are not
allowed to prepare this assignment individually)
© Krzysztof Klincewicz Faculty of Management, University of Warsaw© Krzysztof Klincewicz
Individual assignment
• Read the article „In this corner! The Contender” aboutJamie Dimon and describe, how the costs of operations at JP Morgan Chase were (or could have been) reduced by (1) exploiting cost drivers and (2) reconfiguring the value chain– you need to read the assigned chapter by Porter in order to
prepare the assignment and you should refer to specialistterminology from the reading and from the class!
– you might also benefit from looking for additional informationabout the bank’s transformation, supplementing the case study
• Formal requirements– PDF file sent by e-mail by…– original work (plagiarism = course fail)– prepared individually (every person needs to prepare an own
essay)

© Krzysztof Klincewicz Faculty of Management, University of Warsaw© Krzysztof Klincewicz
Case study
• Hank Kolb

© Krzysztof Klincewicz Faculty of Management, University of Warsaw© Krzysztof Klincewicz
How to optimize manufacturingoperations?
IT-based methods Japanese approaches
MRP (MaterialRequire-
mentsPlanning)
MRP II (Manufactu-
ring Resource Planning)
ROP (Re-Order Point
System)
ABC method
Value analysis
JiT (Just-in-Time)
Total QualityManagement
Kanban
Lean management
Traditional approaches
„Listen carefully, I shall say it onlyonce!” The above topics are notcovered by obligatory readings!

© Krzysztof Klincewicz Faculty of Management, University of Warsaw© Krzysztof Klincewicz
Re-Order Point System (ROP)
• Components/parts re-ordered once the stocklevels drop beyond certain level
• Economic Order Quantity (EOQ) – optimal numberof units of the part which should be ordered to minimize the total costs of purchasing, storing and delivering the parts

© Krzysztof Klincewicz Faculty of Management, University of Warsaw© Krzysztof Klincewicz
Economic Order Quantity (EOQ)
EOQ = optimal quantity of ordered parts
N = annual needs for parts
O = fixed cost per order
S = annual carrying (storage/holding) cost per unit
• Q does not depend on unit purchase costs!

© Krzysztof Klincewicz Faculty of Management, University of Warsaw© Krzysztof Klincewicz
Economic Order Quantity (EOQ)
Quantity of ordered parts
Tota
l co
sts
EOQ = optimal quantity of ordered partsN = annual needs for parts
O = fixed cost per orderS = annual carrying (storage/holding) cost per unit

© Krzysztof Klincewicz Faculty of Management, University of Warsaw© Krzysztof Klincewicz
Economic Order Quantity (EOQ)
• Annual demand for bicycles is 8,000 units. Eachbicycle requires one pair of wheels. Costs of storinga wheel in the warehouse is $2.50 per year. Placingan order for additional wheels costs $50.0 per order.
• What is the Economic Order Quantity?
EOQ = optimal quantity of ordered partsN = annual needs for parts
O = fixed cost per orderS = annual carrying (storage/holding) cost per unit

© Krzysztof Klincewicz Faculty of Management, University of Warsaw© Krzysztof Klincewicz
Economic Order Quantity (EOQ)
• Simplifications and assumptions
– Cost of ordering does not change
– Annual needs for parts do not change
– Unit purchase prices do not change depending on order size
– Delivery is immediate and does not disrupt operations
• Limited practical benefits of EOQ in real-life scenarios

© Krzysztof Klincewicz Faculty of Management, University of Warsaw© Krzysztof Klincewicz
Case study
• Slayton's Furniture Store

© Krzysztof Klincewicz Faculty of Management, University of Warsaw© Krzysztof Klincewicz
ABC method of inventory control
• Attention: the method has nothing to do with activity-based costing!
• Based on Pareto’s law
• 3 groups of inventory items– A – account for 20% of items and 80% of annual costs
– B – account for 30% of items and 15% of annual costs
– C – account for 50% of items and 5% of annual costs
• Tight control of A, frequent reviews of B, limitedattention paid to C

© Krzysztof Klincewicz Faculty of Management, University of Warsaw© Krzysztof Klincewicz
Inventory control à la ABC –example of Unilever’s e-procurement
© May (2003)* MRO – maintenance, repair and overhaul

© Krzysztof Klincewicz Faculty of Management, University of Warsaw© Krzysztof Klincewicz
Case study
• Ohio Tool Company

© Krzysztof Klincewicz Faculty of Management, University of Warsaw© Krzysztof Klincewicz
Value analysis / valueengineering
• Introduced by General Electric Co. in 1947
• Analyzing product designs in order to improvevalue (reduce costs)
• Formal procedure, involving work of expert teamsand brainstorming as part of a unique project
• Different from Japanese concept of quality circles: regular, repetitive analyses by teams of productionline workers

© Krzysztof Klincewicz Faculty of Management, University of Warsaw© Krzysztof Klincewicz
Optimization of operations
Inboundlogistics
OperationsOutbound
logisticsMarketingand sales
Services
Optimizingmanufacturing
operations
Optimizinginboundlogistics
Optimizingoutboundlogistics
Just-in-TimePurchasing
Just-in-TimeManufacturing
Total QualityManagement
Inventory-DrivenCost Optimization
kanbanlean management
(USA)

© Krzysztof Klincewicz Faculty of Management, University of Warsaw© Krzysztof Klincewicz
Inventory-driven costs (IDCs)
• Computer firm HP optimized IDCs in the 1990s to improveoperations profitability
• Holding cost of inventory in outbound logistics(distribution) – money involved, physical cost of maintaining the inventory
• Component devaluation costs – due to price drops in hightech
• Price protection costs – reimbursements when lowering pricesfor products held by distributors
• Product return costs – excess inventory from distributors orproduct faults
• Obsolescence costs – end-of-life writeoffs for discontinued orexpired products
© Krzysztof Klincewicz Faculty of Management, University of Warsaw© Krzysztof Klincewicz
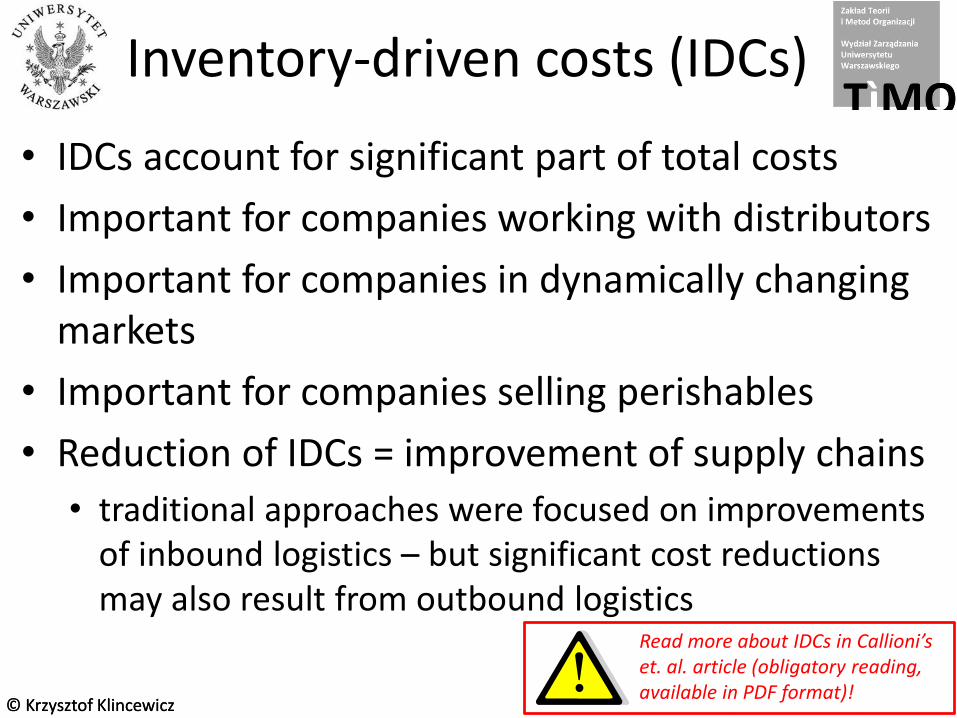
Inventory-driven costs (IDCs)
• IDCs account for significant part of total costs
• Important for companies working with distributors
• Important for companies in dynamically changingmarkets
• Important for companies selling perishables
• Reduction of IDCs = improvement of supply chains
• traditional approaches were focused on improvementsof inbound logistics – but significant cost reductionsmay also result from outbound logistics
Read more about IDCs in Callioni’set. al. article (obligatory reading, available in PDF format)!
© Krzysztof Klincewicz Faculty of Management, University of Warsaw© Krzysztof Klincewicz
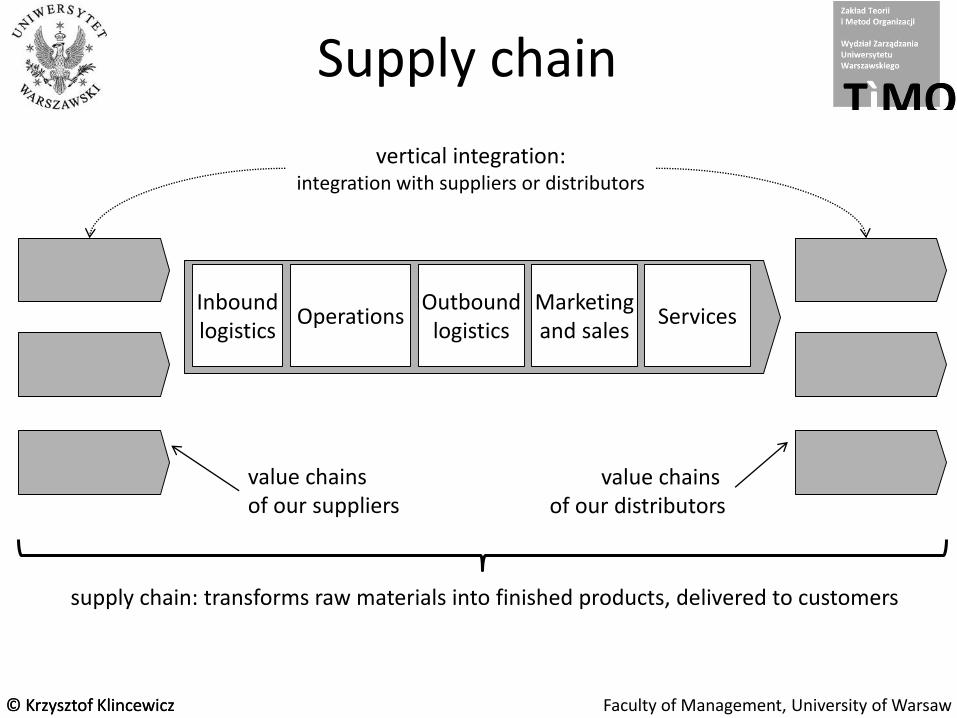
Supply chain
Inboundlogistics
OperationsOutbound
logisticsMarketingand sales
Services
value chainsof our suppliers
value chainsof our distributors
vertical integration:integration with suppliers or distributors
supply chain: transforms raw materials into finished products, delivered to customers

© Krzysztof Klincewicz Faculty of Management, University of Warsaw© Krzysztof Klincewicz
Boeing's global supply chain
© Fung, Fung & Wind (2008)
Boeing 777 - 3 mln parts, over 900 suppliers from 17 countries
© Krzysztof Klincewicz Faculty of Management, University of Warsaw© Krzysztof Klincewicz
Supply chain management (SCM)
• Involves company with its suppliers and distributors (separate business entities, havingdifferent goals, working based on contracts, building a network)
• Transaction cost economics: difference between„networks” and „hierarchies”
• Vertical integration – acquiring a company in one'ssupply chain (part of a network becomes part of organizational hierarchy)
© Krzysztof Klincewicz Faculty of Management, University of Warsaw© Krzysztof Klincewicz
Supply chain management (SCM)
• Selected SCM areas
– planning the co-operation within the chain
– sourcing and procurement strategies and tactics
– distribution strategies and tactics
– physical logistics (including optimization of packaging, transport and warehousing)
• barcodes and RFID (Radio-frequency Identification)
– communication, coordination and collaboration
– integration of IT systems to support information flows
• EDI (Electronic Document Interchange)

© Krzysztof Klincewicz Faculty of Management, University of Warsaw© Krzysztof Klincewicz
Beer distribution game (MIT)
Beerfactory
Distributor Wholesaler Retailer
orders orders orders
products productsproducts
delay delay delay
Read more about beer game in Senge’s chapter (obligatory reading for next class, available in PDF format)!

© Krzysztof Klincewicz Faculty of Management, University of Warsaw© Krzysztof Klincewicz
The bullwhip effect
© Lee, Padmanabhan, Whang (2004)

© Krzysztof Klincewicz Faculty of Management, University of Warsaw© Krzysztof Klincewicz
„Triple-A” supply chain (Lee)
• „Extreme” optimization of supply chain may harmthe business – the chain should rather be:– agile - can react to changes in demand or supply
• good information flows; inventory buffers; dependablepartners; contingency planning
– adaptable - can evolve with markets• constant market monitoring; flexible product designs
– aligned - so that all chain members maximize theirinterests
• close relations; clear role definitions for all members; equitable division of risks, costs and gains of improvementinitiatives
Read more about „triple-A” supplychain in Lee’s article (obligatoryreading, available in PDF format)!

© Krzysztof Klincewicz Faculty of Management, University of Warsaw© Krzysztof Klincewicz
Case study
• West Midland Electric Car Component Company

© Krzysztof Klincewicz Faculty of Management, University of Warsaw© Krzysztof Klincewicz
Material Requirements Planning (MRP)
• Complex, computer-based algorithm
1. Preparation of master production schedule(based on demand forecasts)
2. MRP system calculates demands for individualparts/components
3. MRP system triggers orders for making or buyingindividual parts/components

© Krzysztof Klincewicz Faculty of Management, University of Warsaw© Krzysztof Klincewicz
Problems of MRP
• „Push system” – based on guesswork, requiringforecasts of demand and of time needed to manufracture the needed components
• Errors resulting from low quality of data in IT systems
• Simplistic algorithm – does not take into accountcomplex manufacturing processes, by-products, capacity constraints, demand fluctuations
• MRP II (Manufacturing Resource Planning) systemsadd accounting and financial modules, improvethe MRP algorithm

© Krzysztof Klincewicz Faculty of Management, University of Warsaw© Krzysztof Klincewicz
US and Japanese approaches
US
• EOQ, ABC, value analysis, MRP
• Focus on optimization
• Complex algorithms
• Use of computers
• Statistical techniques
• No concerns for quality
Japan
• JiT, TQM, kanban, lean
• Focus on quality
• Simple rules
• No computers required
• No statistics
• Procedures and culture
US („fordism”) = producing large quantities „just in case”Japan = producing small quantities „just in time”
(Schonberger)

© Krzysztof Klincewicz Faculty of Management, University of Warsaw© Krzysztof Klincewicz
Just-in-time production (JiT) (Schonberger) (1)
1. Cutting lot sizes
– Reducing storage costs by more frequently orderingsmaller lots of components (leads to production setup problems)
2. Cutting setup time
– Changes to machines and procedures to make setup faster and cheaper
3. Cutting purchase order costs
– Simplifying the buying process – integration with suppliers, elimination of bureaucracy

© Krzysztof Klincewicz Faculty of Management, University of Warsaw© Krzysztof Klincewicz
Just-in-time production (JiT) (Schonberger) (2)
4. Introducing quality-oriented culture
5. Increased awareness of quality problems
– Smaller lots help track problems, focus on detail, eliminate waste and need for rework
6. Increased responsibility
– Smaller lots help link work to individuals and groupsand make them responsible
7. Withdrawal of buffer inventory
8. Consequences for indirect costs

© Krzysztof Klincewicz Faculty of Management, University of Warsaw© Krzysztof Klincewicz
Just-in-time production (JiT) (Schonberger) (3)
7. Withdrawal of buffer inventory– Regularity of production eliminates the need for buffer
inventory – but if any production irregularities occur, employees need to identify roots of the problem and eliminate them
8. Consequences for indirect costs– Less bureaucracy, less employees, less storage space, …
• JiT promoted by Toyota’s VP Taiichi Ohno in ~1970, but initiated by other Japanese companies
• Attention: JiT will not necessarily improve quality!

© Krzysztof Klincewicz Faculty of Management, University of Warsaw© Krzysztof Klincewicz
Just-in-time purchasing
• Frequent deliveries of small quantities of parts
• Long-term contracts with suppliers
• Variable delivery quantities – but fixed quantitiesfor the entire period of contract
• Few suppliers, located close to the factory
• Repeated business with the same suppliers
• Suppliers encouraged to continuously improve: reduce costs and innovate
• Suppliers hold inventories and incur storage costsand business risks

© Krzysztof Klincewicz Faculty of Management, University of Warsaw© Krzysztof Klincewicz
Total Quality Management (TQM)
• Prevention of defects – not their detection
• Involvement of production line workers – not quality assurance personnel („control at source”)
• Elimination of:– 無理 [むり/muri] – excess – no need for inventory
– 無駄 [むだ/muda] – waste – no defects, quality of source
– 斑 [むら/mura] – unevenness – regularity in production
• TQM initiated in ~1962 in Japan

© Krzysztof Klincewicz Faculty of Management, University of Warsaw© Krzysztof Klincewicz
Total Quality Management (TQM) (Schonberger) (1)
1. Responsibility and process control
– Makes of a part (production department) responsiblefor its quality, no separate quality department
2. Easy-to-see indicators of quality for every process
– Visual, easy-to-understand quality indicators
3. Insistence on compliance
– Indisputable compliance with corporate, industry orgovernment standards

© Krzysztof Klincewicz Faculty of Management, University of Warsaw© Krzysztof Klincewicz
Total Quality Management (TQM) (Schonberger) (2)
4. Line stop
– Each production line workers may stop the process ifproblems occur – output rate not a priority
5. Correcting one’s own errors
– Everyone needs to rectify his own mistakes – outputrate not a priority
6. 100 percent check
– No defects acceptable, control of every item (or N=2) instead of drawing statistical samples
7. Continuous improvement
© Krzysztof Klincewicz Faculty of Management, University of Warsaw© Krzysztof Klincewicz
TQM tools
• Fishbone diagram (Ishikawa diagram, JapaneseIndustrial Standard Z-8101)
• Quality circles
• Industrial robots (due to the development of mechatronics/robotics)
• CAD (computer aided design)
• CAM (computer aided manufacturing) – productdesigns „translated” into component orders and setups of production lines/robots

© Krzysztof Klincewicz Faculty of Management, University of Warsaw© Krzysztof Klincewicz
Kanban system (1)
• 看板 [かんばん/kanban] – card, signboard, plate, poster
• Every part used in production has its special container, holding a precise quantity of the part
• Each container has 2 cards (kanbans)
– Cards signal the need to produce or deliver more parts• Card 1: for people producing the part
• Card 2: for people using the card
• Containers circulate between people producing and usingthe parts
– Cards are exchanges in the process (container empty/full)
– Parts are made only if there is a card authorizing it

© Krzysztof Klincewicz Faculty of Management, University of Warsaw© Krzysztof Klincewicz
Kanban system (2)
• Careful control of quantities in the container
– Management decision
– Small quantities per container to facilitate control
• By the end of the day – kanbans and containerscounted
– Control of incomplete production orders or unusedresources
– Two groups of people motivated to co-operate on production scheduling

© Krzysztof Klincewicz Faculty of Management, University of Warsaw© Krzysztof Klincewicz
Kanban system (3)
• Kanban system = „pull” (from expressed needs to production, production stops if there are no kanbans, inventory planned for specific days)
• MRP system = „push” (from forecasts and master plan to production, might lead to waste and deficits, inventory planned for specific weeks)
• Traditional kanban and JiT systems used no computers
• First documented use of kanban – Toyota
• Yamaha Motor – combination of kanban and MRP

© Krzysztof Klincewicz Faculty of Management, University of Warsaw© Krzysztof Klincewicz
Lean management
• American interpretation of the Japanesemanufacturing techniques
• Promoted by the James P. Womack, Daniel T. Jones and Daniel Roos in the book „The Machine ThatChanged The World”
• Unclear recommendations, blending manyconcepts – buzzword?

© Krzysztof Klincewicz Faculty of Management, University of Warsaw© Krzysztof Klincewicz
Six Sigma
• Set of quality management techniques/strategies, developed by Motorola in 1986, trademark registered by Motorola
• Fundamentals– Minimizing variability in processes
– Identifying and eliminating the causes of errors
– Use of statistical techniques
– Use of organizational experts (e.g. „black belts”)
• Naming convention– Sigma symbolizes yield of manufacturing process (% of products
without defects)
– 6 sigma (6 x SD) = 99.99966% of manufactured products freefrom defects (3.4 DPMO - defects per million opportunities)

© Krzysztof Klincewicz Faculty of Management, University of Warsaw© Krzysztof Klincewicz
Why Six Sigma?
99% defect-free (3.8 sigma)
• 20,000 lost articles of mail per hour
• Unsafe drinking water for 15 minutesper day
• 5,000 incorrect surgical operationsper day
• 200,000 incorrect drug prescriptionsper year
• No electricity for 7 hours per month
• 11.8 million shares incorrectly tradedon the NYSE every day
• 3 warranty claims for each newautomobile
• 48,000 to 96,000 deaths attributedto hospital errors each year
99.99966% defect-free (6 sigma)
• 7 lost articles of mail per hour• Unsafe drinking water for one
minute every seven months• 1.7 incorrect surgical operations per
week• 68 incorrect drug prescriptions per
year• No electricity for 1 hour per 34 years• 4,021 shares incorrectly traded on
the NYSE every day• 1 warranty claim for every 980 new
automobiles• 17 to 34 deaths attributed to
hospital errors each year
© Gyri, DeCarlo, Williams (2005)

© Krzysztof Klincewicz Faculty of Management, University of Warsaw© Krzysztof Klincewicz
DMAIC improvementmethodology for Six Sigma
Define
Measure
Analyze
Improve
Control
Define the problem, customer needsand projectgoals
Measure the keyaspects of the existing process
Analyze the data, identify cause-effectrelations and root causes
Improvethe current
process
Control the new processto eliminate
deviations
Read more about Six Sigma in assigned chapters (obligatoryreadings, available in PDF format)!

© Krzysztof Klincewicz Faculty of Management, University of Warsaw© Krzysztof Klincewicz
Quality management systems
• ISO 9001 standard & certification
– Formal description of processes
– Every employee knows her work and linkages to otherprocess activities
– Documenting work outcomes
– Carrying out internal and external audits
– Controlling non-conforming products or services
– Taking corrective and preventive actions (CAPA)
• rectifying failures, investigating their causes and improvingoperations to prevent the repeated occurence of failures
• leads to continuous improvement
© Krzysztof Klincewicz Faculty of Management, University of Warsaw© Krzysztof Klincewicz
Quality management systems
• Industry standards, including:– Good Manufacturing Practice (GMP) – pharmaceuticals
– TL 9000 – telecoms
– ISO/TS 16949 – automobile manufacturers
– ISO 13485 – medicals
• Problems– Too much formalization, too much standardization
– Process, not product quality
– Costs of maintaining the certificate
– Formal quality management systems differ from Total Quality Management ideals

© Krzysztof Klincewicz Faculty of Management, University of Warsaw© Krzysztof Klincewicz
Environmental management systems
• ISO 14001 – minimizing adverse effects on environment, complying with relevant laws and continuous improvement
• EMAS (Eco-Management and Audit Scheme) –standard enriching ISO 14001, established by EU
• Numerous standards and laws related to: waste and wastewater management, air quality, carbondioxide emissions, health & safety, …
• Efficient energy use and eco-efficiency helpimprove business processes and attract customers

© Krzysztof Klincewicz Faculty of Management, University of Warsaw© Krzysztof Klincewicz
Case study
• Bonnie Blaine